Brownsville, LA
Brownsville Map
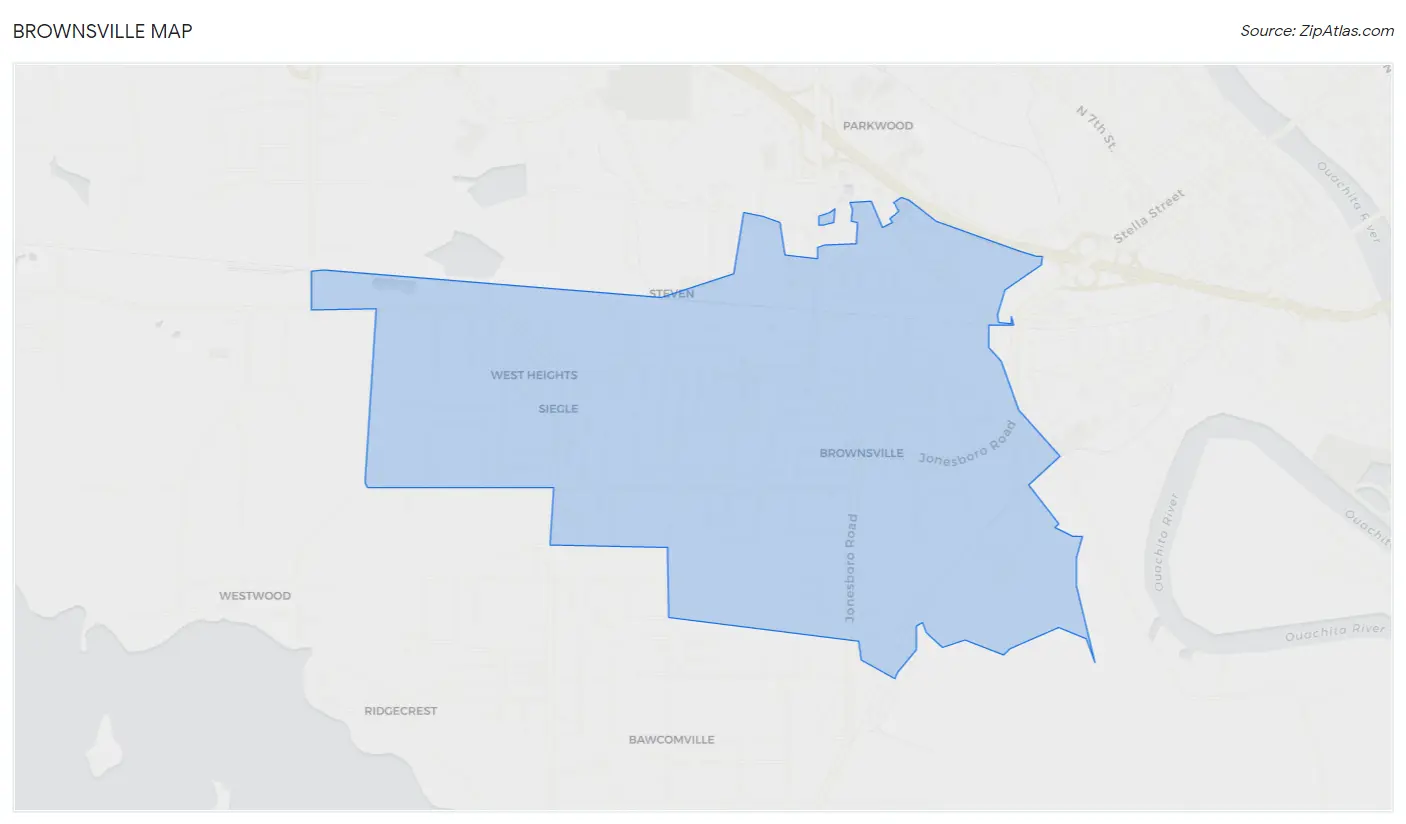
Brownsville Overview
4,198
TOTAL POPULATION
1,842
MALE POPULATION
2,356
FEMALE POPULATION
78.18
MALES / 100 FEMALES
127.90
FEMALES / 100 MALES
42.2
MEDIAN AGE
3.1
AVG FAMILY SIZE
2.3
AVG HOUSEHOLD SIZE
$18,774
PER CAPITA INCOME
$48,415
AVG FAMILY INCOME
$33,819
AVG HOUSEHOLD INCOME
34.6%
WAGE / INCOME GAP [ % ]
65.4¢/ $1
WAGE / INCOME GAP [ $ ]
$15,218
FAMILY INCOME DEFICIT
0.38
INEQUALITY / GINI INDEX
1,894
LABOR FORCE [ PEOPLE ]
59.8%
PERCENT IN LABOR FORCE
10.6%
UNEMPLOYMENT RATE
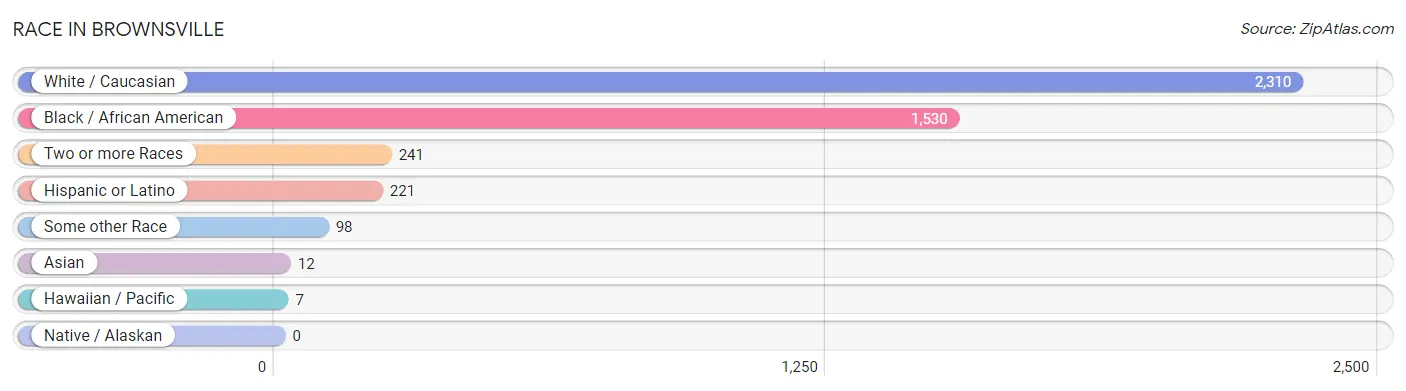
Race in Brownsville
The most populous races in Brownsville are White / Caucasian (2,310 | 55.0%), Black / African American (1,530 | 36.4%), and Two or more Races (241 | 5.7%).
| Race | # Population | % Population |
| Asian | 12 | 0.3% |
| Black / African American | 1,530 | 36.4% |
| Hawaiian / Pacific | 7 | 0.2% |
| Hispanic or Latino | 221 | 5.3% |
| Native / Alaskan | 0 | 0.0% |
| White / Caucasian | 2,310 | 55.0% |
| Two or more Races | 241 | 5.7% |
| Some other Race | 98 | 2.3% |
| Total | 4,198 | 100.0% |
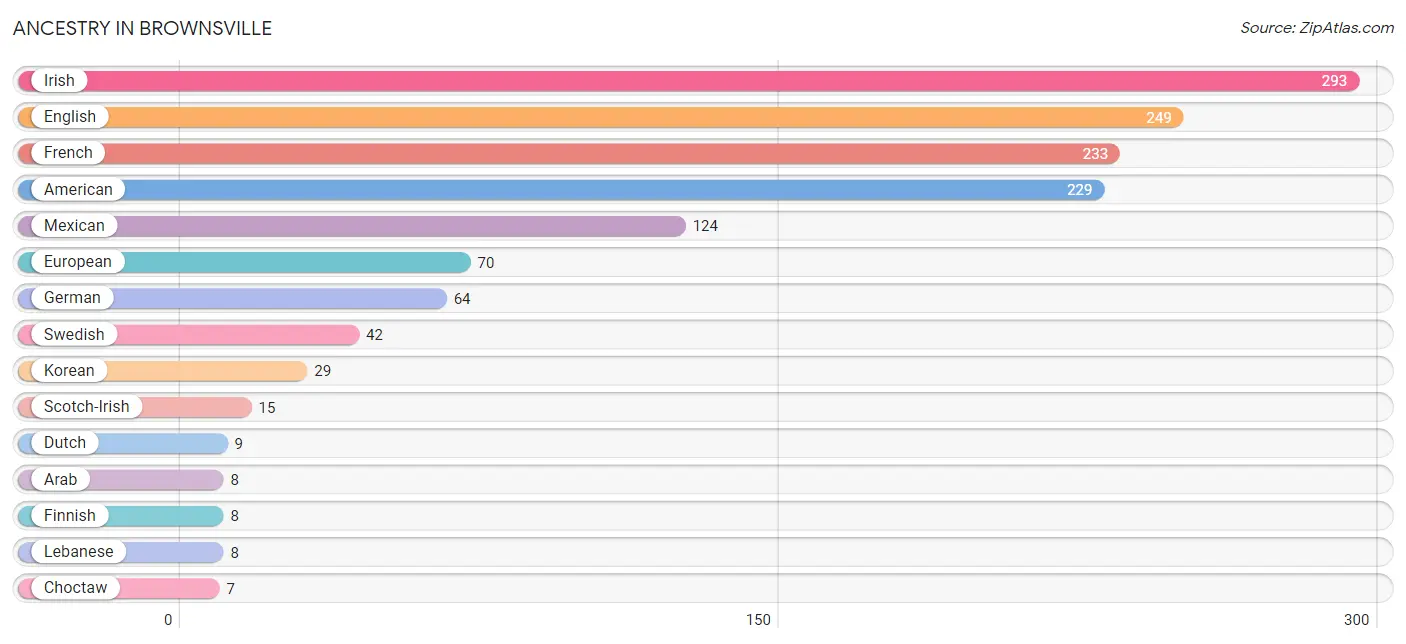
Ancestry in Brownsville
The most populous ancestries reported in Brownsville are Irish (293 | 7.0%), English (249 | 5.9%), French (233 | 5.6%), American (229 | 5.4%), and Mexican (124 | 2.9%), together accounting for 26.9% of all Brownsville residents.
| Ancestry | # Population | % Population |
| American | 229 | 5.4% |
| Arab | 8 | 0.2% |
| Choctaw | 7 | 0.2% |
| Dutch | 9 | 0.2% |
| English | 249 | 5.9% |
| European | 70 | 1.7% |
| Finnish | 8 | 0.2% |
| French | 233 | 5.6% |
| German | 64 | 1.5% |
| Irish | 293 | 7.0% |
| Korean | 29 | 0.7% |
| Lebanese | 8 | 0.2% |
| Mexican | 124 | 2.9% |
| Samoan | 7 | 0.2% |
| Scotch-Irish | 15 | 0.4% |
| Swedish | 42 | 1.0% | View All 16 Rows |
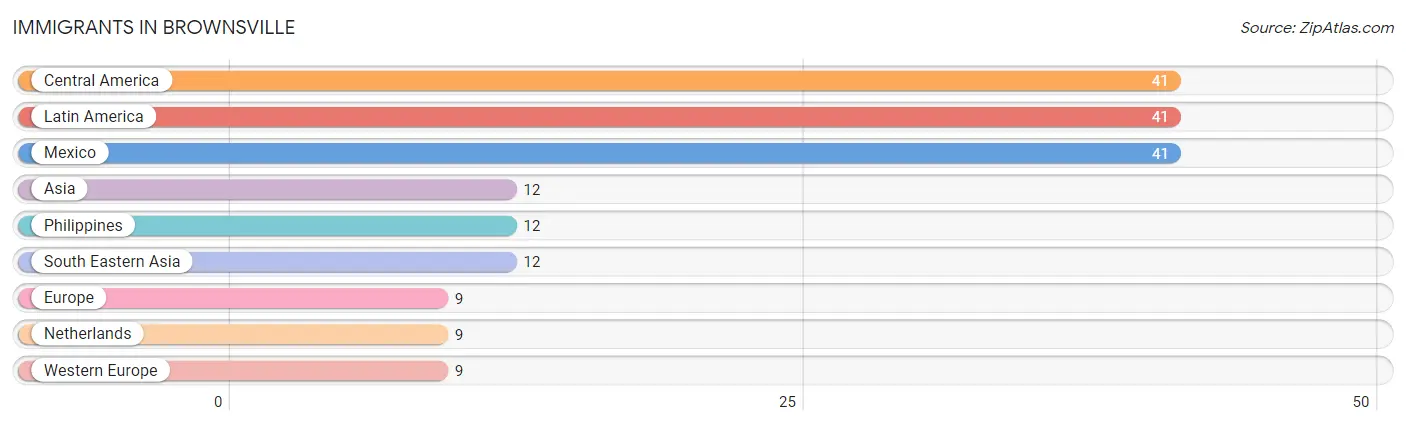
Immigrants in Brownsville
The most numerous immigrant groups reported in Brownsville came from Central America (41 | 1.0%), Latin America (41 | 1.0%), Mexico (41 | 1.0%), Asia (12 | 0.3%), and Philippines (12 | 0.3%), together accounting for 3.5% of all Brownsville residents.
| Immigration Origin | # Population | % Population |
| Asia | 12 | 0.3% |
| Central America | 41 | 1.0% |
| Europe | 9 | 0.2% |
| Latin America | 41 | 1.0% |
| Mexico | 41 | 1.0% |
| Netherlands | 9 | 0.2% |
| Philippines | 12 | 0.3% |
| South Eastern Asia | 12 | 0.3% |
| Western Europe | 9 | 0.2% | View All 9 Rows |
Sex and Age in Brownsville
Sex and Age in Brownsville
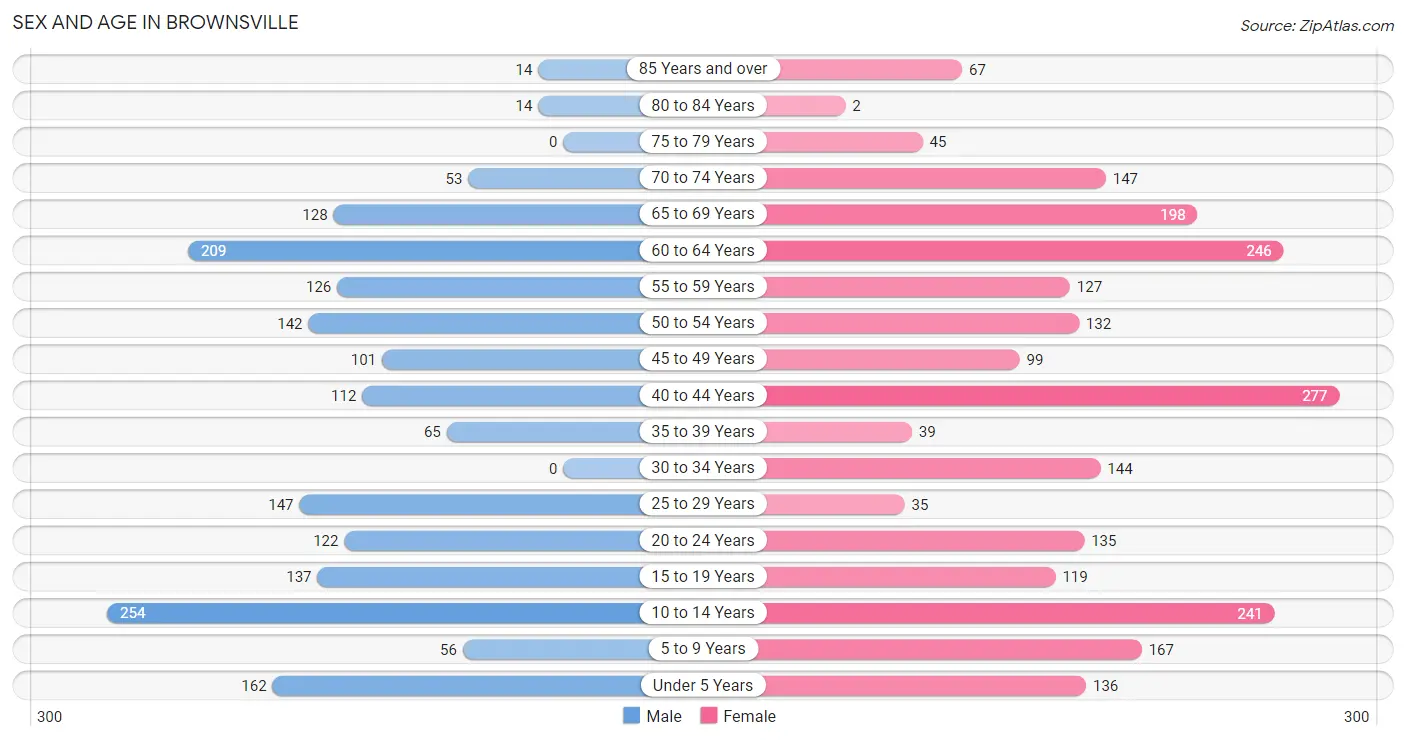
The most populous age groups in Brownsville are 10 to 14 Years (254 | 13.8%) for men and 40 to 44 Years (277 | 11.8%) for women.
| Age Bracket | Male | Female |
| Under 5 Years | 162 (8.8%) | 136 (5.8%) |
| 5 to 9 Years | 56 (3.0%) | 167 (7.1%) |
| 10 to 14 Years | 254 (13.8%) | 241 (10.2%) |
| 15 to 19 Years | 137 (7.4%) | 119 (5.1%) |
| 20 to 24 Years | 122 (6.6%) | 135 (5.7%) |
| 25 to 29 Years | 147 (8.0%) | 35 (1.5%) |
| 30 to 34 Years | 0 (0.0%) | 144 (6.1%) |
| 35 to 39 Years | 65 (3.5%) | 39 (1.7%) |
| 40 to 44 Years | 112 (6.1%) | 277 (11.8%) |
| 45 to 49 Years | 101 (5.5%) | 99 (4.2%) |
| 50 to 54 Years | 142 (7.7%) | 132 (5.6%) |
| 55 to 59 Years | 126 (6.8%) | 127 (5.4%) |
| 60 to 64 Years | 209 (11.4%) | 246 (10.4%) |
| 65 to 69 Years | 128 (7.0%) | 198 (8.4%) |
| 70 to 74 Years | 53 (2.9%) | 147 (6.2%) |
| 75 to 79 Years | 0 (0.0%) | 45 (1.9%) |
| 80 to 84 Years | 14 (0.8%) | 2 (0.1%) |
| 85 Years and over | 14 (0.8%) | 67 (2.8%) |
| Total | 1,842 (100.0%) | 2,356 (100.0%) |
Families and Households in Brownsville
Median Family Size in Brownsville
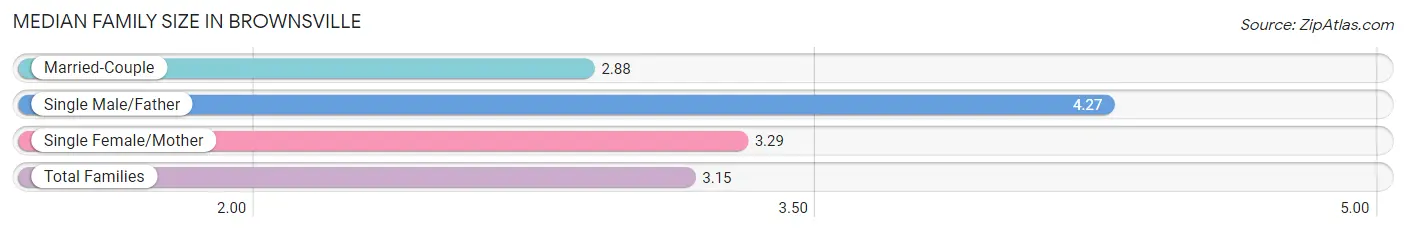
The median family size in Brownsville is 3.15 persons per family, with single male/father families (63 | 6.3%) accounting for the largest median family size of 4.27 persons per family. On the other hand, married-couple families (482 | 48.4%) represent the smallest median family size with 2.88 persons per family.
| Family Type | # Families | Family Size |
| Married-Couple | 482 (48.4%) | 2.88 |
| Single Male/Father | 63 (6.3%) | 4.27 |
| Single Female/Mother | 451 (45.3%) | 3.29 |
| Total Families | 996 (100.0%) | 3.15 |
Median Household Size in Brownsville
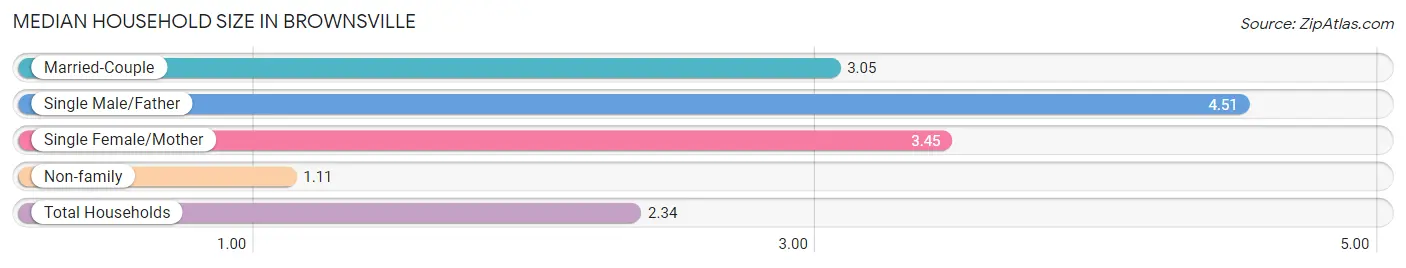
The median household size in Brownsville is 2.34 persons per household, with single male/father households (63 | 3.5%) accounting for the largest median household size of 4.51 persons per household. non-family households (792 | 44.3%) represent the smallest median household size with 1.11 persons per household.
| Household Type | # Households | Household Size |
| Married-Couple | 482 (27.0%) | 3.05 |
| Single Male/Father | 63 (3.5%) | 4.51 |
| Single Female/Mother | 451 (25.2%) | 3.45 |
| Non-family | 792 (44.3%) | 1.11 |
| Total Households | 1,788 (100.0%) | 2.34 |
Household Size by Marriage Status in Brownsville
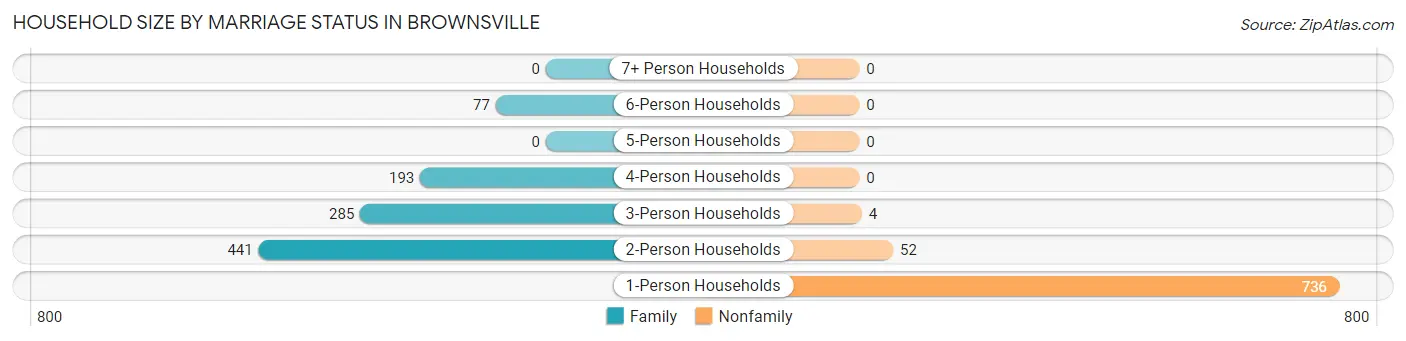
Out of a total of 1,788 households in Brownsville, 996 (55.7%) are family households, while 792 (44.3%) are nonfamily households. The most numerous type of family households are 2-person households, comprising 441, and the most common type of nonfamily households are 1-person households, comprising 736.
| Household Size | Family Households | Nonfamily Households |
| 1-Person Households | - | 736 (41.2%) |
| 2-Person Households | 441 (24.7%) | 52 (2.9%) |
| 3-Person Households | 285 (15.9%) | 4 (0.2%) |
| 4-Person Households | 193 (10.8%) | 0 (0.0%) |
| 5-Person Households | 0 (0.0%) | 0 (0.0%) |
| 6-Person Households | 77 (4.3%) | 0 (0.0%) |
| 7+ Person Households | 0 (0.0%) | 0 (0.0%) |
| Total | 996 (55.7%) | 792 (44.3%) |
Female Fertility in Brownsville
Fertility by Age in Brownsville
Average fertility rate in Brownsville is 26.0 births per 1,000 women. Women in the age bracket of 15 to 19 years have the highest fertility rate with 193.0 births per 1,000 women. Women in the age bracket of 15 to 19 years acount for 100.0% of all women with births.
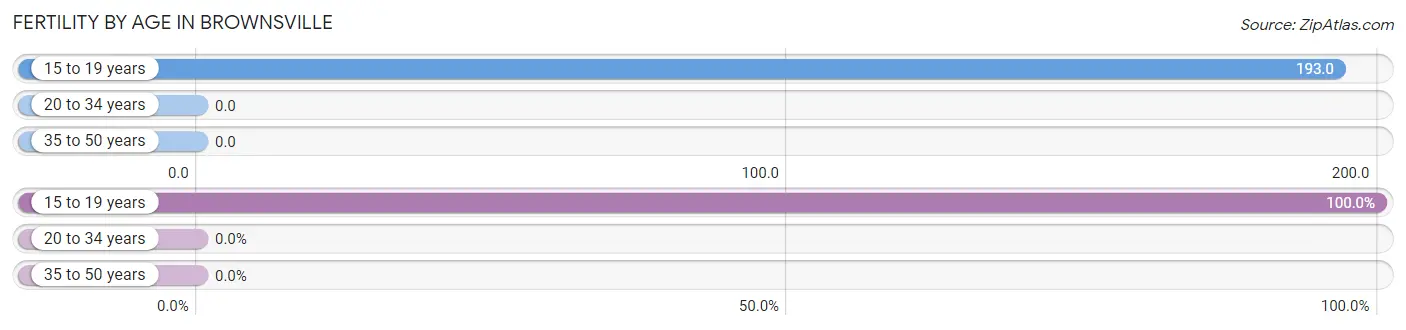
| Age Bracket | Women with Births | Births / 1,000 Women |
| 15 to 19 years | 23 (100.0%) | 193.0 |
| 20 to 34 years | 0 (0.0%) | 0.0 |
| 35 to 50 years | 0 (0.0%) | 0.0 |
| Total | 23 (100.0%) | 26.0 |
Fertility by Age by Marriage Status in Brownsville
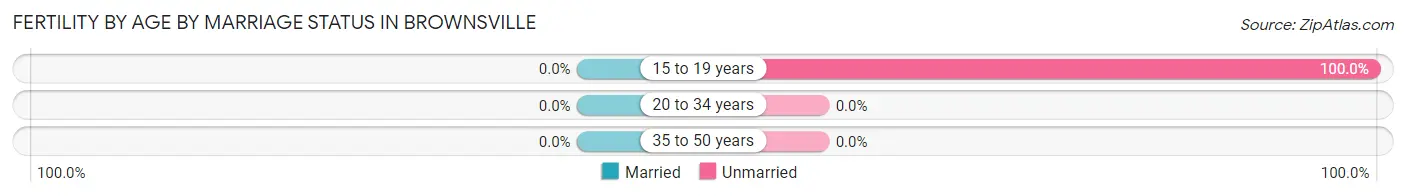
| Age Bracket | Married | Unmarried |
| 15 to 19 years | 0 (0.0%) | 23 (100.0%) |
| 20 to 34 years | 0 (0.0%) | 0 (0.0%) |
| 35 to 50 years | 0 (0.0%) | 0 (0.0%) |
| Total | 0 (0.0%) | 23 (100.0%) |
Fertility by Education in Brownsville
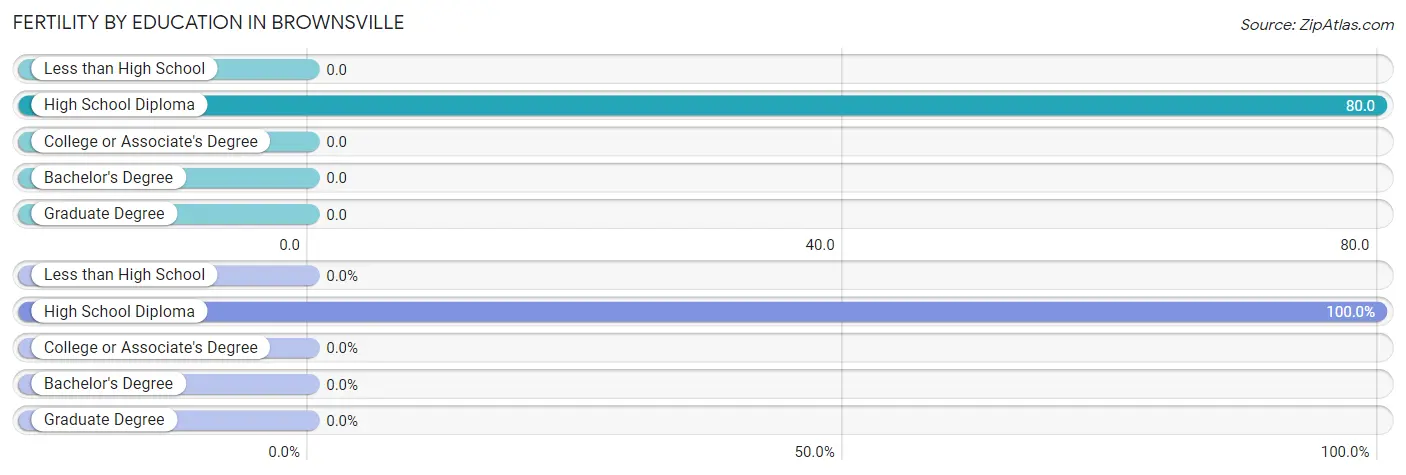
| Educational Attainment | Women with Births | Births / 1,000 Women |
| Less than High School | 0 (0.0%) | 0.0 |
| High School Diploma | 23 (100.0%) | 80.0 |
| College or Associate's Degree | 0 (0.0%) | 0.0 |
| Bachelor's Degree | 0 (0.0%) | 0.0 |
| Graduate Degree | 0 (0.0%) | 0.0 |
| Total | 23 (100.0%) | 26.0 |
Fertility by Education by Marriage Status in Brownsville
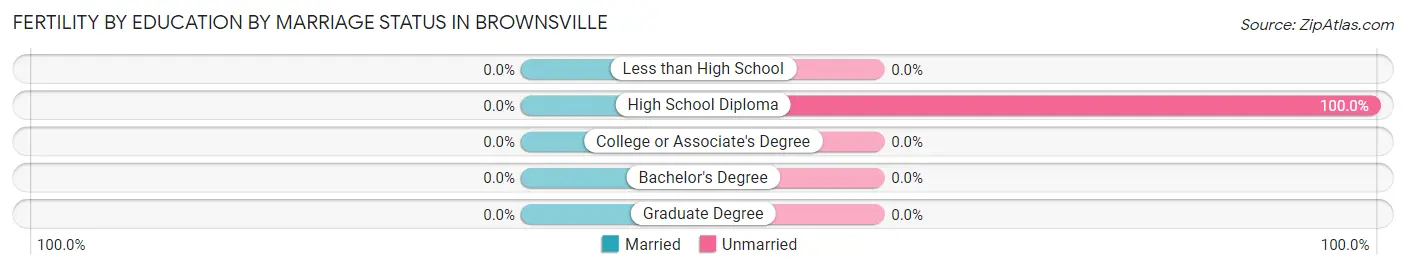
| Educational Attainment | Married | Unmarried |
| Less than High School | 0 (0.0%) | 0 (0.0%) |
| High School Diploma | 0 (0.0%) | 23 (100.0%) |
| College or Associate's Degree | 0 (0.0%) | 0 (0.0%) |
| Bachelor's Degree | 0 (0.0%) | 0 (0.0%) |
| Graduate Degree | 0 (0.0%) | 0 (0.0%) |
| Total | 0 (0.0%) | 23 (100.0%) |
Income in Brownsville
Income Overview in Brownsville
Per Capita Income in Brownsville is $18,774, while median incomes of families and households are $48,415 and $33,819 respectively.
| Characteristic | Number | Measure |
| Per Capita Income | 4,198 | $18,774 |
| Median Family Income | 996 | $48,415 |
| Mean Family Income | 996 | $46,931 |
| Median Household Income | 1,788 | $33,819 |
| Mean Household Income | 1,788 | $41,581 |
| Income Deficit | 996 | $15,218 |
| Wage / Income Gap (%) | 4,198 | 34.58% |
| Wage / Income Gap ($) | 4,198 | 65.42¢ per $1 |
| Gini / Inequality Index | 4,198 | 0.38 |
Earnings by Sex in Brownsville
Average Earnings in Brownsville are $27,383, $40,592 for men and $26,556 for women, a difference of 34.6%.
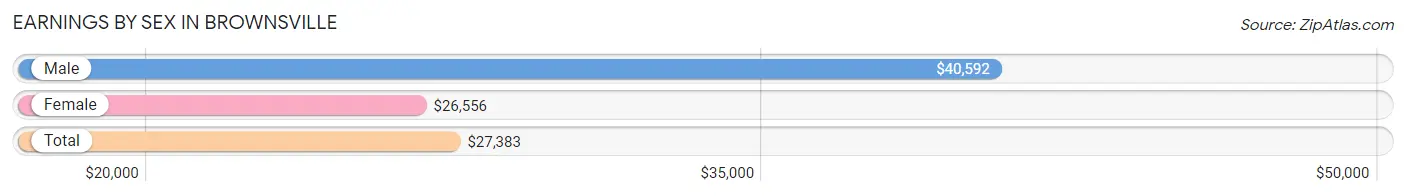
| Sex | Number | Average Earnings |
| Male | 783 (45.4%) | $40,592 |
| Female | 941 (54.6%) | $26,556 |
| Total | 1,724 (100.0%) | $27,383 |
Earnings by Sex by Income Bracket in Brownsville
The most common earnings brackets in Brownsville are $45,000 to $49,999 for men (83 | 10.6%) and $25,000 to $29,999 for women (184 | 19.6%).
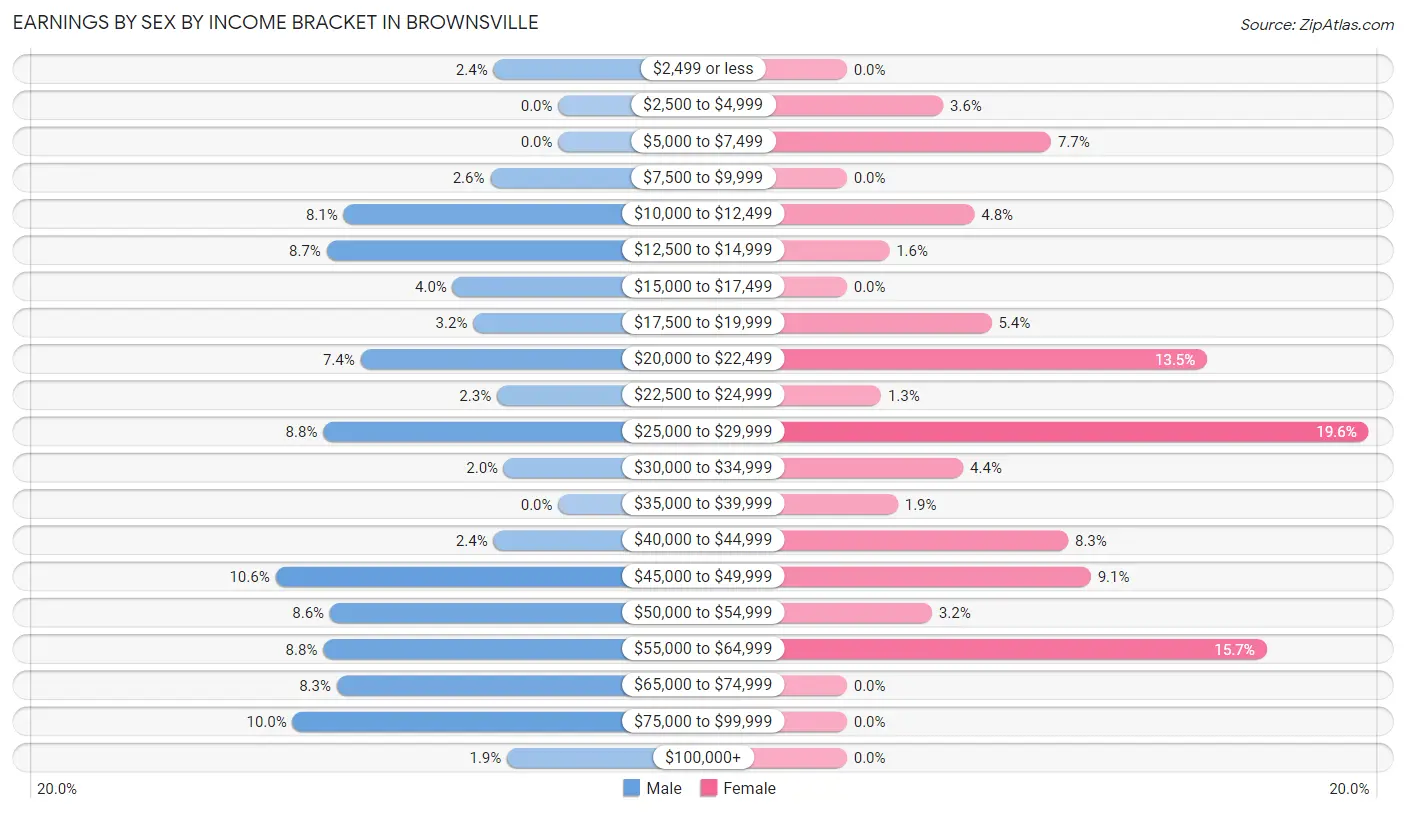
| Income | Male | Female |
| $2,499 or less | 19 (2.4%) | 0 (0.0%) |
| $2,500 to $4,999 | 0 (0.0%) | 34 (3.6%) |
| $5,000 to $7,499 | 0 (0.0%) | 72 (7.6%) |
| $7,500 to $9,999 | 20 (2.5%) | 0 (0.0%) |
| $10,000 to $12,499 | 63 (8.1%) | 45 (4.8%) |
| $12,500 to $14,999 | 68 (8.7%) | 15 (1.6%) |
| $15,000 to $17,499 | 31 (4.0%) | 0 (0.0%) |
| $17,500 to $19,999 | 25 (3.2%) | 51 (5.4%) |
| $20,000 to $22,499 | 58 (7.4%) | 127 (13.5%) |
| $22,500 to $24,999 | 18 (2.3%) | 12 (1.3%) |
| $25,000 to $29,999 | 69 (8.8%) | 184 (19.6%) |
| $30,000 to $34,999 | 16 (2.0%) | 41 (4.4%) |
| $35,000 to $39,999 | 0 (0.0%) | 18 (1.9%) |
| $40,000 to $44,999 | 19 (2.4%) | 78 (8.3%) |
| $45,000 to $49,999 | 83 (10.6%) | 86 (9.1%) |
| $50,000 to $54,999 | 67 (8.6%) | 30 (3.2%) |
| $55,000 to $64,999 | 69 (8.8%) | 148 (15.7%) |
| $65,000 to $74,999 | 65 (8.3%) | 0 (0.0%) |
| $75,000 to $99,999 | 78 (10.0%) | 0 (0.0%) |
| $100,000+ | 15 (1.9%) | 0 (0.0%) |
| Total | 783 (100.0%) | 941 (100.0%) |
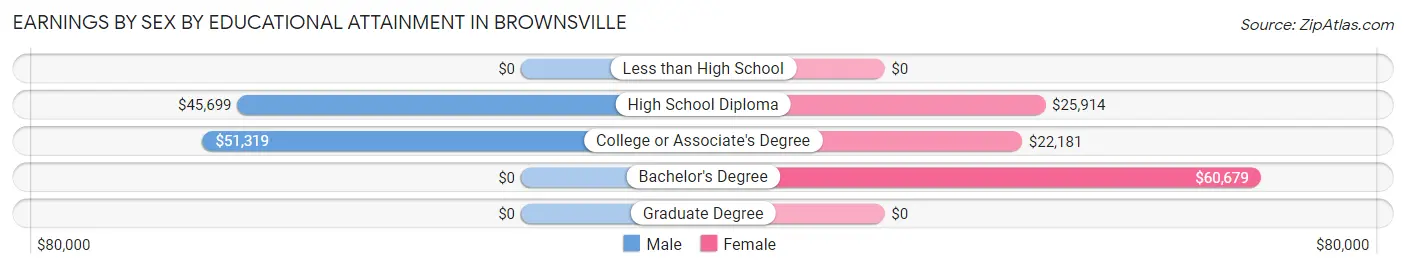
Earnings by Sex by Educational Attainment in Brownsville
Average earnings in Brownsville are $45,964 for men and $26,722 for women, a difference of 41.9%. Men with an educational attainment of college or associate's degree enjoy the highest average annual earnings of $51,319, while those with high school diploma education earn the least with $45,699. Women with an educational attainment of bachelor's degree earn the most with the average annual earnings of $60,679, while those with college or associate's degree education have the smallest earnings of $22,181.
| Educational Attainment | Male Income | Female Income |
| Less than High School | - | - |
| High School Diploma | $45,699 | $25,914 |
| College or Associate's Degree | $51,319 | $22,181 |
| Bachelor's Degree | - | - |
| Graduate Degree | - | - |
| Total | $45,964 | $26,722 |
Family Income in Brownsville
Family Income Brackets in Brownsville
According to the Brownsville family income data, there are 348 families falling into the $50,000 to $74,999 income range, which is the most common income bracket and makes up 34.9% of all families.
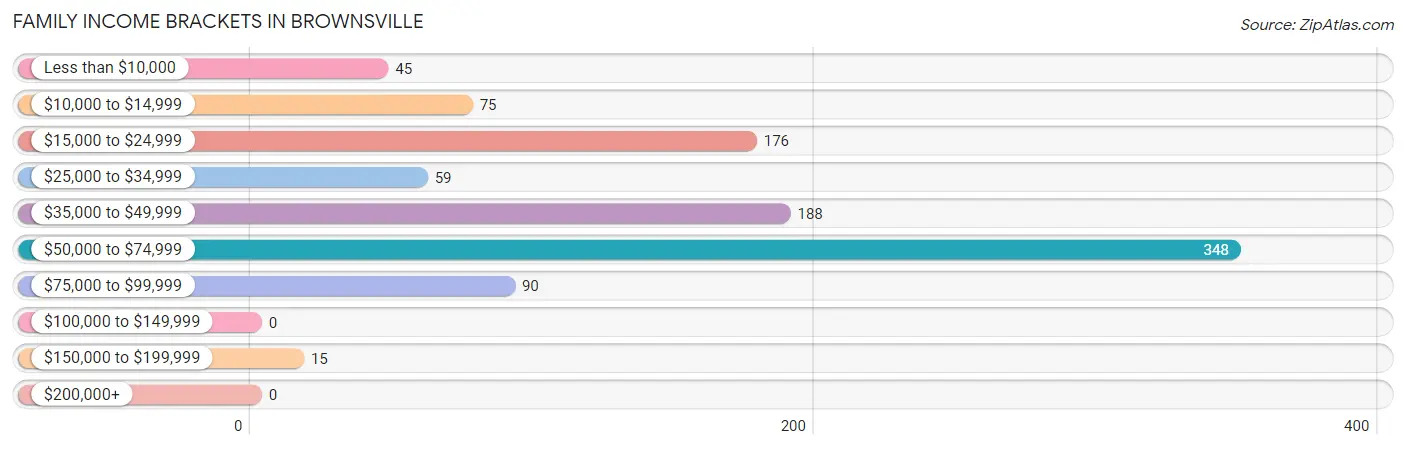
| Income Bracket | # Families | % Families |
| Less than $10,000 | 45 | 4.5% |
| $10,000 to $14,999 | 75 | 7.5% |
| $15,000 to $24,999 | 176 | 17.7% |
| $25,000 to $34,999 | 59 | 5.9% |
| $35,000 to $49,999 | 188 | 18.9% |
| $50,000 to $74,999 | 348 | 34.9% |
| $75,000 to $99,999 | 90 | 9.0% |
| $100,000 to $149,999 | 0 | 0.0% |
| $150,000 to $199,999 | 15 | 1.5% |
| $200,000+ | 0 | 0.0% |
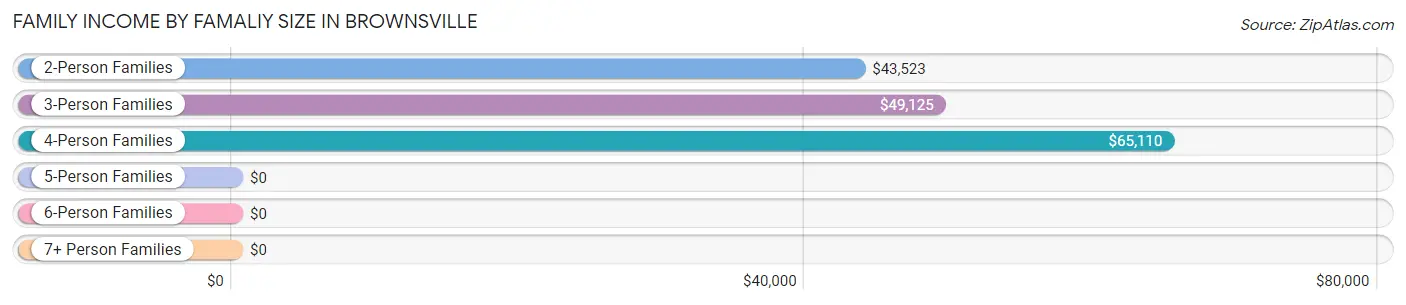
Family Income by Famaliy Size in Brownsville
4-person families (130 | 13.1%) account for the highest median family income in Brownsville with $65,110 per family, while 2-person families (523 | 52.5%) have the highest median income of $21,762 per family member.
| Income Bracket | # Families | Median Income |
| 2-Person Families | 523 (52.5%) | $43,523 |
| 3-Person Families | 266 (26.7%) | $49,125 |
| 4-Person Families | 130 (13.1%) | $65,110 |
| 5-Person Families | 0 (0.0%) | $0 |
| 6-Person Families | 77 (7.7%) | $0 |
| 7+ Person Families | 0 (0.0%) | $0 |
| Total | 996 (100.0%) | $48,415 |
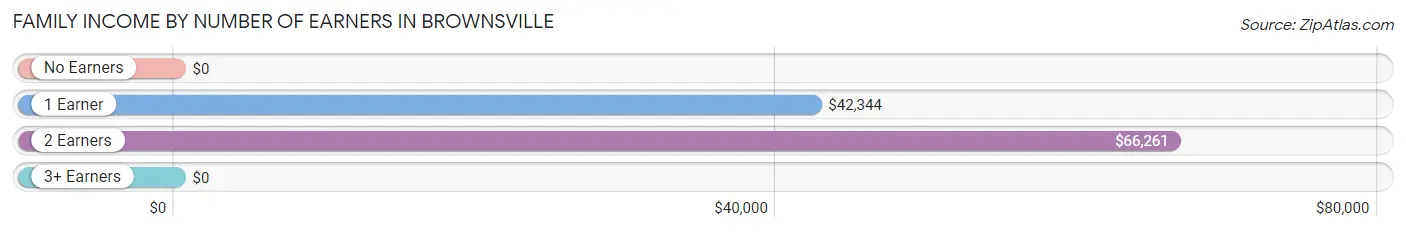
Family Income by Number of Earners in Brownsville
| Number of Earners | # Families | Median Income |
| No Earners | 171 (17.2%) | $0 |
| 1 Earner | 513 (51.5%) | $42,344 |
| 2 Earners | 312 (31.3%) | $66,261 |
| 3+ Earners | 0 (0.0%) | $0 |
| Total | 996 (100.0%) | $48,415 |
Household Income in Brownsville
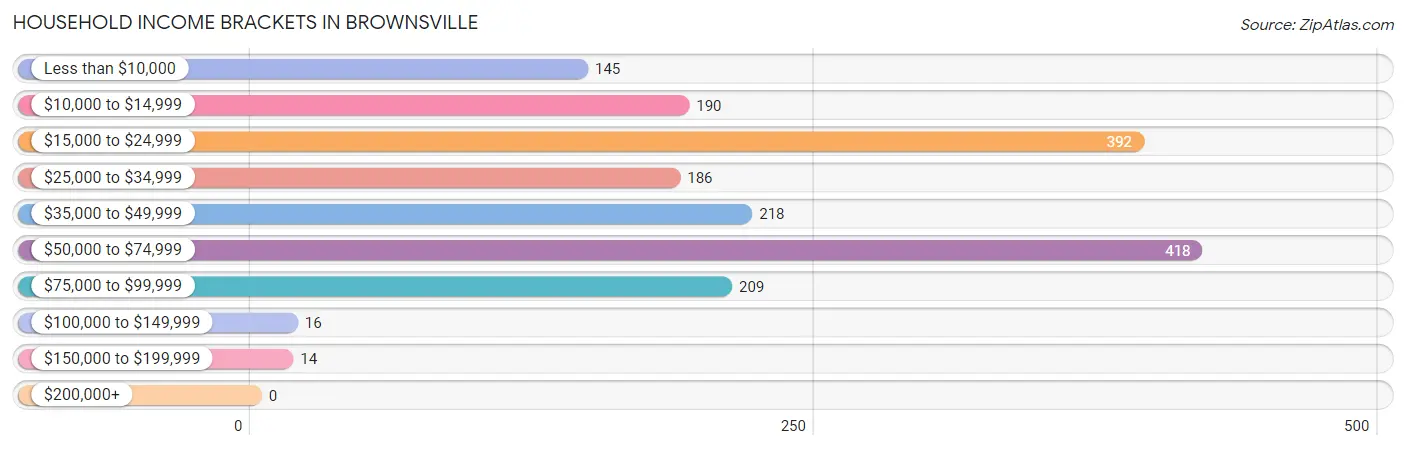
Household Income Brackets in Brownsville
With 418 households falling in the category, the $50,000 to $74,999 income range is the most frequent in Brownsville, accounting for 23.4% of all households.
| Income Bracket | # Households | % Households |
| Less than $10,000 | 145 | 8.1% |
| $10,000 to $14,999 | 190 | 10.6% |
| $15,000 to $24,999 | 392 | 21.9% |
| $25,000 to $34,999 | 186 | 10.4% |
| $35,000 to $49,999 | 218 | 12.2% |
| $50,000 to $74,999 | 418 | 23.4% |
| $75,000 to $99,999 | 209 | 11.7% |
| $100,000 to $149,999 | 16 | 0.9% |
| $150,000 to $199,999 | 14 | 0.8% |
| $200,000+ | 0 | 0.0% |
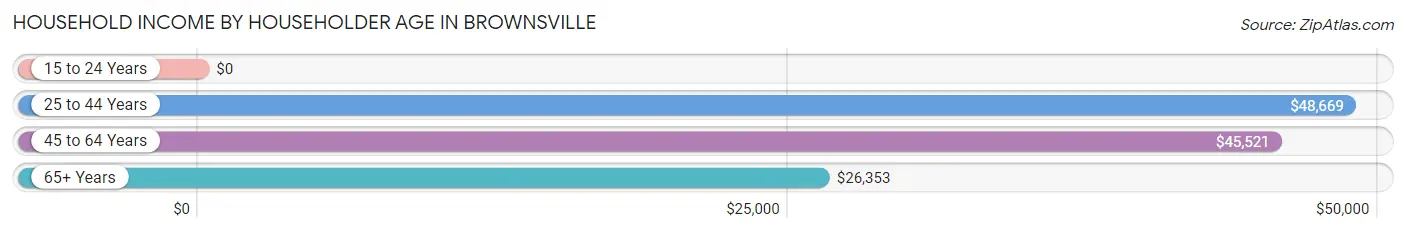
Household Income by Householder Age in Brownsville
The median household income in Brownsville is $33,819, with the highest median household income of $48,669 found in the 25 to 44 years age bracket for the primary householder. A total of 360 households (20.1%) fall into this category. Meanwhile, the 15 to 24 years age bracket for the primary householder has the lowest median household income of $0, with 78 households (4.4%) in this group.
| Income Bracket | # Households | Median Income |
| 15 to 24 Years | 78 (4.4%) | $0 |
| 25 to 44 Years | 360 (20.1%) | $48,669 |
| 45 to 64 Years | 834 (46.6%) | $45,521 |
| 65+ Years | 516 (28.9%) | $26,353 |
| Total | 1,788 (100.0%) | $33,819 |
Poverty in Brownsville
Income Below Poverty by Sex and Age in Brownsville
With 23.1% poverty level for males and 29.9% for females among the residents of Brownsville, 18 to 24 year old males and under 5 year old females are the most vulnerable to poverty, with 144 males (63.2%) and 136 females (100.0%) in their respective age groups living below the poverty level.
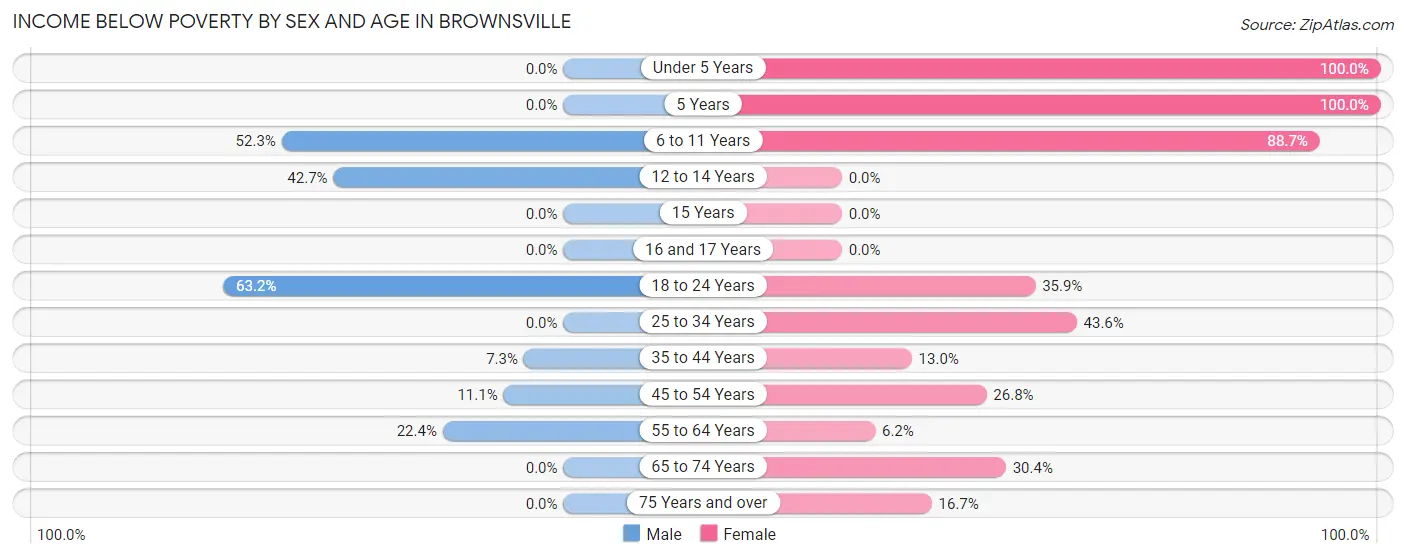
| Age Bracket | Male | Female |
| Under 5 Years | 0 (0.0%) | 136 (100.0%) |
| 5 Years | 0 (0.0%) | 21 (100.0%) |
| 6 to 11 Years | 80 (52.3%) | 149 (88.7%) |
| 12 to 14 Years | 67 (42.7%) | 0 (0.0%) |
| 15 Years | 0 (0.0%) | 0 (0.0%) |
| 16 and 17 Years | 0 (0.0%) | 0 (0.0%) |
| 18 to 24 Years | 144 (63.2%) | 70 (35.9%) |
| 25 to 34 Years | 0 (0.0%) | 78 (43.6%) |
| 35 to 44 Years | 13 (7.3%) | 41 (13.0%) |
| 45 to 54 Years | 27 (11.1%) | 62 (26.8%) |
| 55 to 64 Years | 75 (22.4%) | 23 (6.2%) |
| 65 to 74 Years | 0 (0.0%) | 105 (30.4%) |
| 75 Years and over | 0 (0.0%) | 19 (16.7%) |
| Total | 406 (23.1%) | 704 (29.9%) |
Income Above Poverty by Sex and Age in Brownsville
According to the poverty statistics in Brownsville, males aged under 5 years and females aged 12 to 14 years are the age groups that are most secure financially, with 100.0% of males and 100.0% of females in these age groups living above the poverty line.
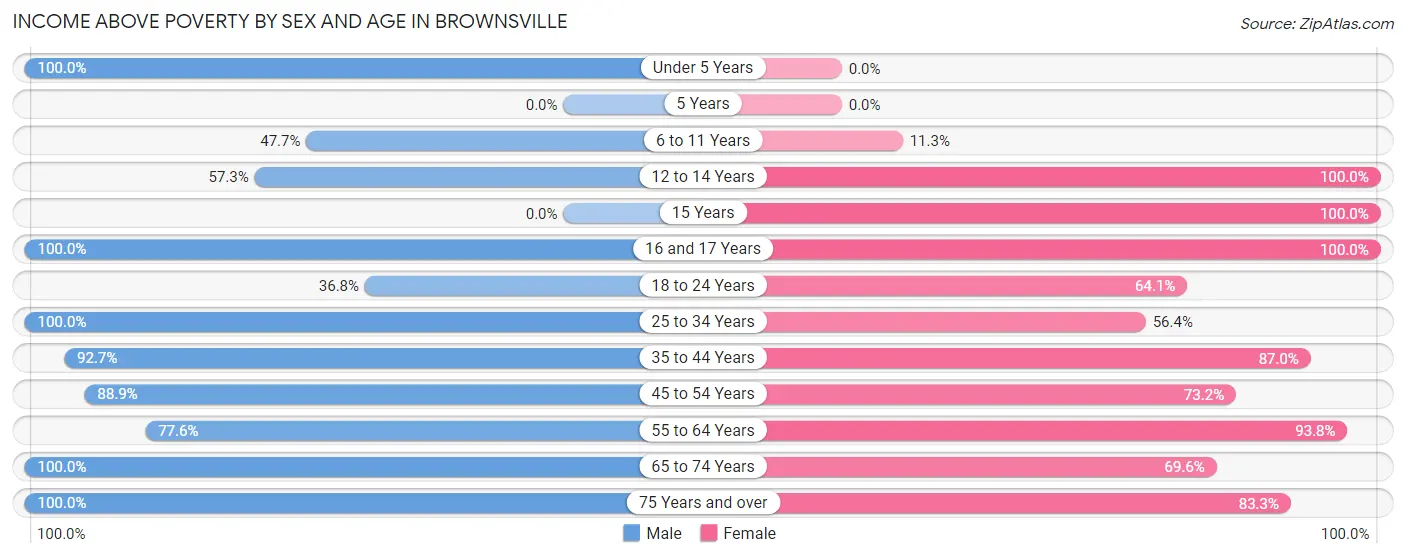
| Age Bracket | Male | Female |
| Under 5 Years | 78 (100.0%) | 0 (0.0%) |
| 5 Years | 0 (0.0%) | 0 (0.0%) |
| 6 to 11 Years | 73 (47.7%) | 19 (11.3%) |
| 12 to 14 Years | 90 (57.3%) | 219 (100.0%) |
| 15 Years | 0 (0.0%) | 14 (100.0%) |
| 16 and 17 Years | 31 (100.0%) | 45 (100.0%) |
| 18 to 24 Years | 84 (36.8%) | 125 (64.1%) |
| 25 to 34 Years | 147 (100.0%) | 101 (56.4%) |
| 35 to 44 Years | 164 (92.7%) | 275 (87.0%) |
| 45 to 54 Years | 216 (88.9%) | 169 (73.2%) |
| 55 to 64 Years | 260 (77.6%) | 350 (93.8%) |
| 65 to 74 Years | 181 (100.0%) | 240 (69.6%) |
| 75 Years and over | 28 (100.0%) | 95 (83.3%) |
| Total | 1,352 (76.9%) | 1,652 (70.1%) |
Income Below Poverty Among Married-Couple Families in Brownsville
The poverty statistics for married-couple families in Brownsville show that 7.5% or 36 of the total 482 families live below the poverty line. Families with 1 or 2 children have the highest poverty rate of 9.9%, comprising of 18 families. On the other hand, families with 3 or 4 children have the lowest poverty rate of 0.0%, which includes 0 families.
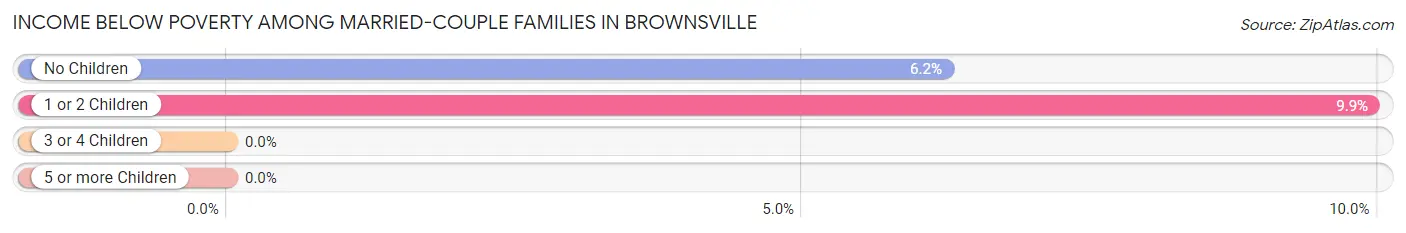
| Children | Above Poverty | Below Poverty |
| No Children | 271 (93.8%) | 18 (6.2%) |
| 1 or 2 Children | 163 (90.1%) | 18 (9.9%) |
| 3 or 4 Children | 12 (100.0%) | 0 (0.0%) |
| 5 or more Children | 0 (0.0%) | 0 (0.0%) |
| Total | 446 (92.5%) | 36 (7.5%) |
Income Below Poverty Among Single-Parent Households in Brownsville
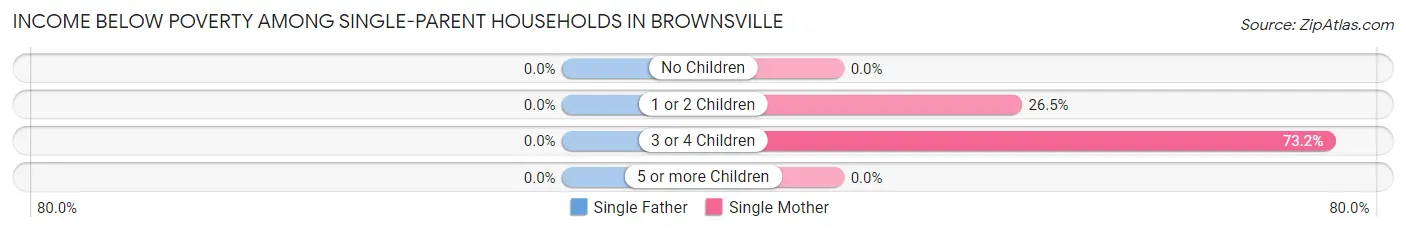
| Children | Single Father | Single Mother |
| No Children | 0 (0.0%) | 0 (0.0%) |
| 1 or 2 Children | 0 (0.0%) | 49 (26.5%) |
| 3 or 4 Children | 0 (0.0%) | 82 (73.2%) |
| 5 or more Children | 0 (0.0%) | 0 (0.0%) |
| Total | 0 (0.0%) | 131 (29.0%) |
Income Below Poverty Among Married-Couple vs Single-Parent Households in Brownsville
The poverty data for Brownsville shows that 36 of the married-couple family households (7.5%) and 131 of the single-parent households (25.5%) are living below the poverty level. Within the married-couple family households, those with 1 or 2 children have the highest poverty rate, with 18 households (9.9%) falling below the poverty line. Among the single-parent households, those with 3 or 4 children have the highest poverty rate, with 82 household (73.2%) living below poverty.
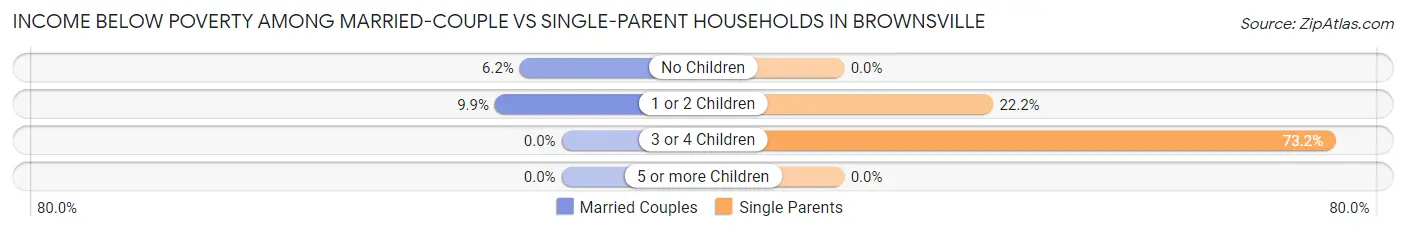
| Children | Married-Couple Families | Single-Parent Households |
| No Children | 18 (6.2%) | 0 (0.0%) |
| 1 or 2 Children | 18 (9.9%) | 49 (22.2%) |
| 3 or 4 Children | 0 (0.0%) | 82 (73.2%) |
| 5 or more Children | 0 (0.0%) | 0 (0.0%) |
| Total | 36 (7.5%) | 131 (25.5%) |
Employment Characteristics in Brownsville
Employment by Class of Employer in Brownsville
Among the 1,694 employed individuals in Brownsville, private company employees (1,121 | 66.2%), local government employees (204 | 12.0%), and self-employed (not incorporated) (148 | 8.7%) make up the most common classes of employment.
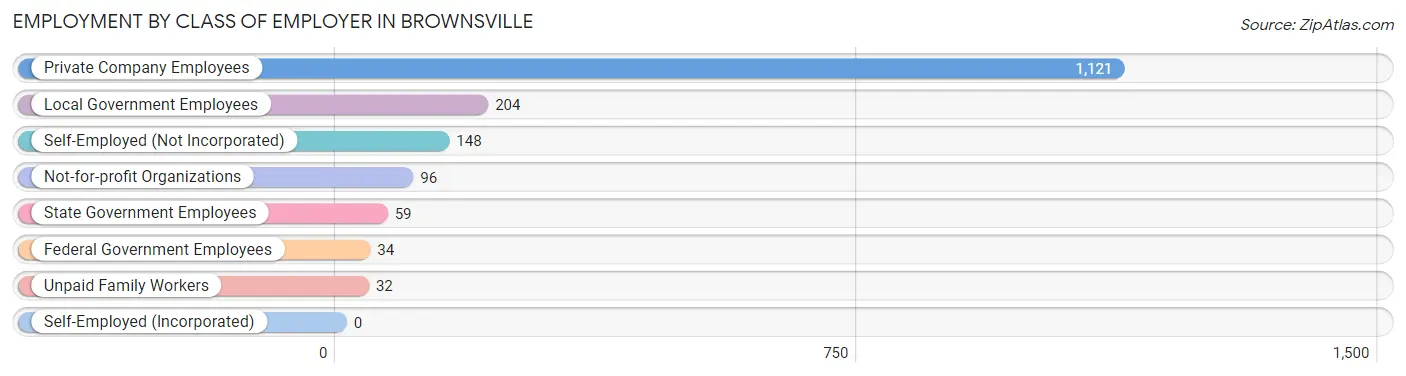
| Employer Class | # Employees | % Employees |
| Private Company Employees | 1,121 | 66.2% |
| Self-Employed (Incorporated) | 0 | 0.0% |
| Self-Employed (Not Incorporated) | 148 | 8.7% |
| Not-for-profit Organizations | 96 | 5.7% |
| Local Government Employees | 204 | 12.0% |
| State Government Employees | 59 | 3.5% |
| Federal Government Employees | 34 | 2.0% |
| Unpaid Family Workers | 32 | 1.9% |
| Total | 1,694 | 100.0% |
Employment Status by Age in Brownsville
According to the labor force statistics for Brownsville, out of the total population over 16 years of age (3,168), 59.8% or 1,894 individuals are in the labor force, with 10.6% or 201 of them unemployed. The age group with the highest labor force participation rate is 35 to 44 years, with 84.8% or 418 individuals in the labor force. Within the labor force, the 30 to 34 years age range has the highest percentage of unemployed individuals, with 75.6% or 65 of them being unemployed.
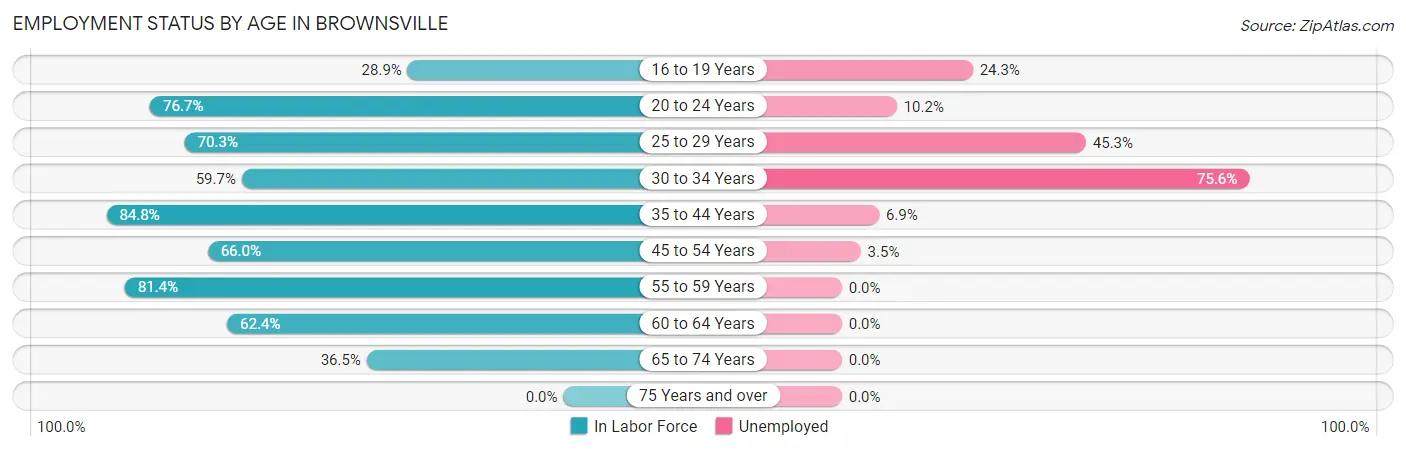
| Age Bracket | In Labor Force | Unemployed |
| 16 to 19 Years | 70 (28.9%) | 17 (24.3%) |
| 20 to 24 Years | 197 (76.7%) | 20 (10.2%) |
| 25 to 29 Years | 128 (70.3%) | 58 (45.3%) |
| 30 to 34 Years | 86 (59.7%) | 65 (75.6%) |
| 35 to 44 Years | 418 (84.8%) | 29 (6.9%) |
| 45 to 54 Years | 313 (66.0%) | 11 (3.5%) |
| 55 to 59 Years | 206 (81.4%) | 0 (0.0%) |
| 60 to 64 Years | 284 (62.4%) | 0 (0.0%) |
| 65 to 74 Years | 192 (36.5%) | 0 (0.0%) |
| 75 Years and over | 0 (0.0%) | 0 (0.0%) |
| Total | 1,894 (59.8%) | 201 (10.6%) |
Employment Status by Educational Attainment in Brownsville
According to labor force statistics for Brownsville, 71.7% of individuals (1,435) out of the total population between 25 and 64 years of age (2,001) are in the labor force, with 11.4% or 164 of them being unemployed. The group with the highest labor force participation rate are those with the educational attainment of less than high school, with 82.2% or 263 individuals in the labor force. Within the labor force, individuals with college / associate degree education have the highest percentage of unemployment, with 17.4% or 78 of them being unemployed.
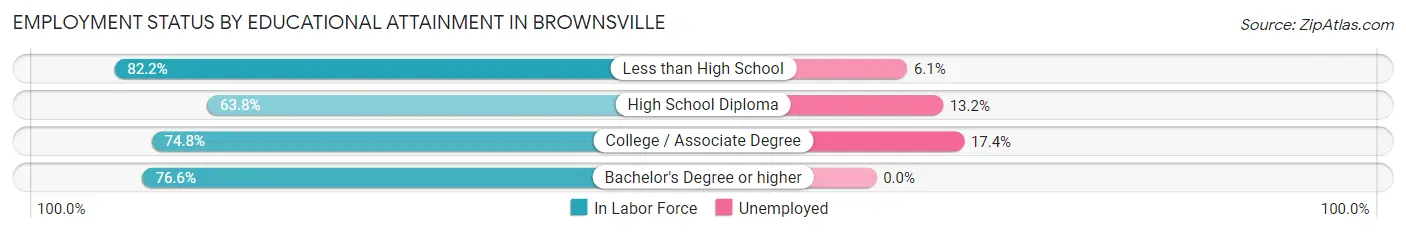
| Educational Attainment | In Labor Force | Unemployed |
| Less than High School | 263 (82.2%) | 20 (6.1%) |
| High School Diploma | 521 (63.8%) | 108 (13.2%) |
| College / Associate Degree | 448 (74.8%) | 104 (17.4%) |
| Bachelor's Degree or higher | 203 (76.6%) | 0 (0.0%) |
| Total | 1,435 (71.7%) | 228 (11.4%) |
Employment Occupations by Sex in Brownsville
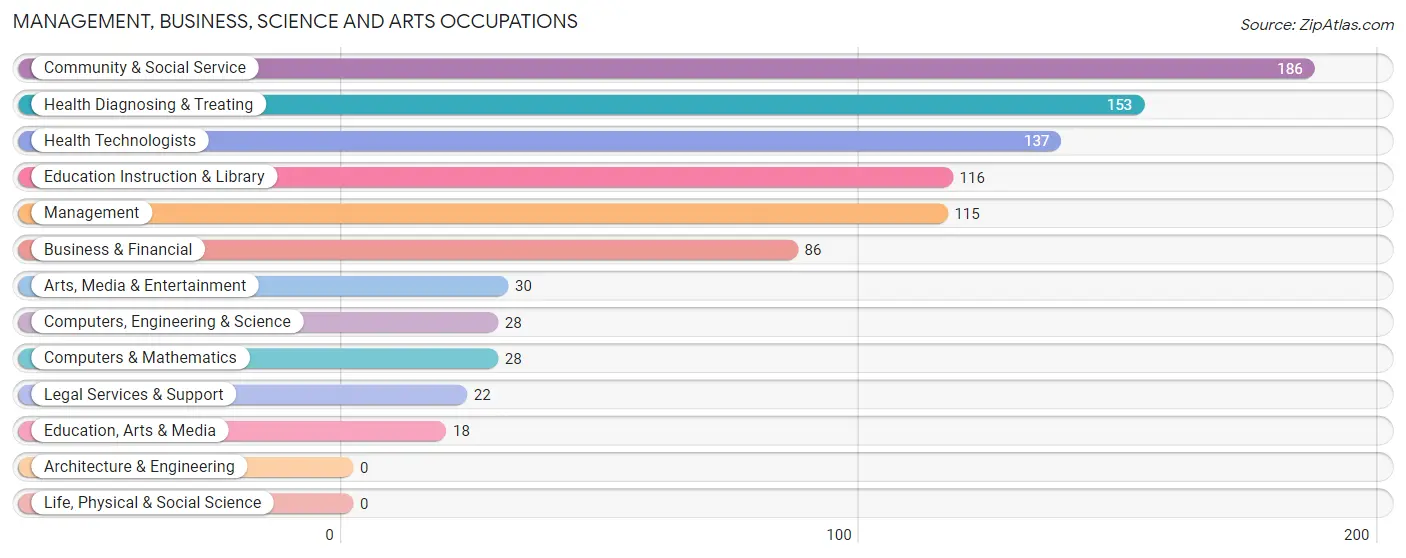
Management, Business, Science and Arts Occupations
The most common Management, Business, Science and Arts occupations in Brownsville are Community & Social Service (186 | 11.0%), Health Diagnosing & Treating (153 | 9.0%), Health Technologists (137 | 8.1%), Education Instruction & Library (116 | 6.9%), and Management (115 | 6.8%).
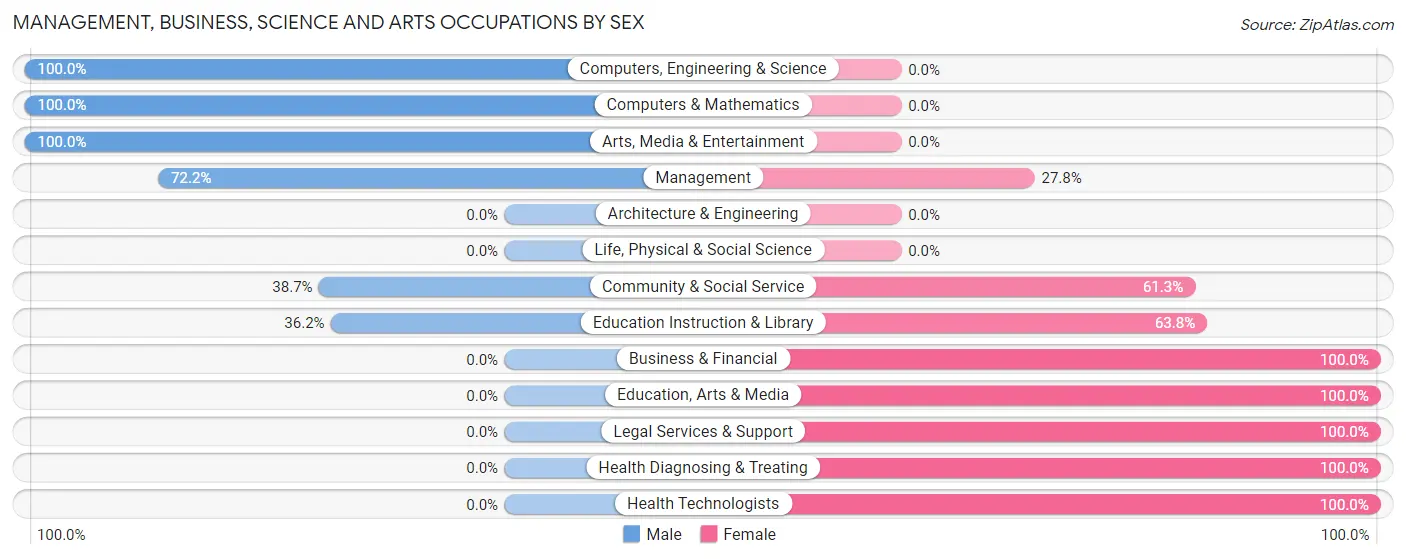
Management, Business, Science and Arts Occupations by Sex
Within the Management, Business, Science and Arts occupations in Brownsville, the most male-oriented occupations are Computers, Engineering & Science (100.0%), Computers & Mathematics (100.0%), and Arts, Media & Entertainment (100.0%), while the most female-oriented occupations are Business & Financial (100.0%), Education, Arts & Media (100.0%), and Legal Services & Support (100.0%).
| Occupation | Male | Female |
| Management | 83 (72.2%) | 32 (27.8%) |
| Business & Financial | 0 (0.0%) | 86 (100.0%) |
| Computers, Engineering & Science | 28 (100.0%) | 0 (0.0%) |
| Computers & Mathematics | 28 (100.0%) | 0 (0.0%) |
| Architecture & Engineering | 0 (0.0%) | 0 (0.0%) |
| Life, Physical & Social Science | 0 (0.0%) | 0 (0.0%) |
| Community & Social Service | 72 (38.7%) | 114 (61.3%) |
| Education, Arts & Media | 0 (0.0%) | 18 (100.0%) |
| Legal Services & Support | 0 (0.0%) | 22 (100.0%) |
| Education Instruction & Library | 42 (36.2%) | 74 (63.8%) |
| Arts, Media & Entertainment | 30 (100.0%) | 0 (0.0%) |
| Health Diagnosing & Treating | 0 (0.0%) | 153 (100.0%) |
| Health Technologists | 0 (0.0%) | 137 (100.0%) |
| Total (Category) | 183 (32.2%) | 385 (67.8%) |
| Total (Overall) | 772 (45.6%) | 922 (54.4%) |
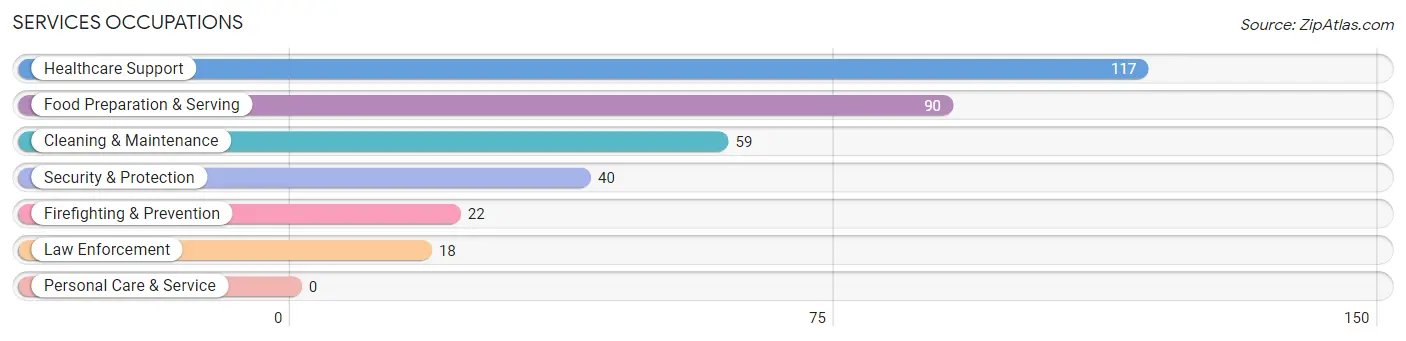
Services Occupations
The most common Services occupations in Brownsville are Healthcare Support (117 | 6.9%), Food Preparation & Serving (90 | 5.3%), Cleaning & Maintenance (59 | 3.5%), Security & Protection (40 | 2.4%), and Firefighting & Prevention (22 | 1.3%).
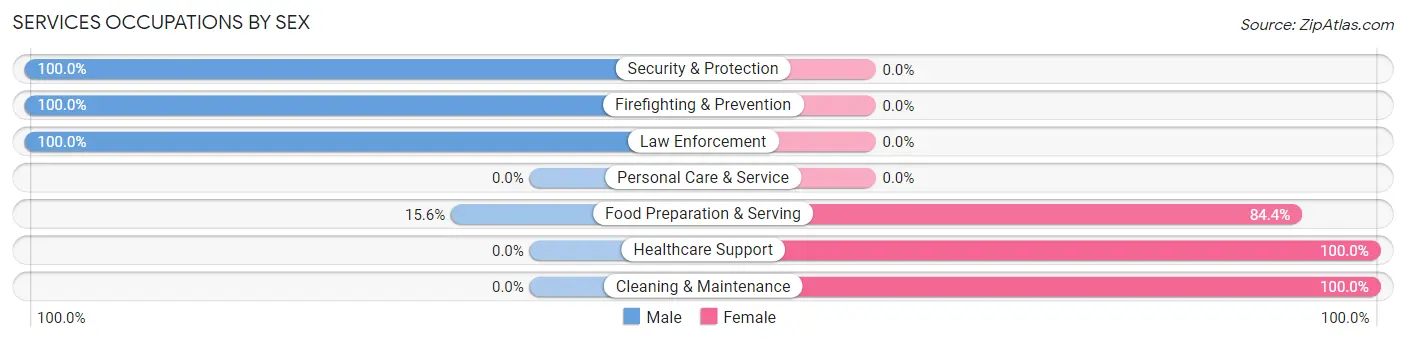
Services Occupations by Sex
Within the Services occupations in Brownsville, the most male-oriented occupations are Security & Protection (100.0%), Firefighting & Prevention (100.0%), and Law Enforcement (100.0%), while the most female-oriented occupations are Healthcare Support (100.0%), Cleaning & Maintenance (100.0%), and Food Preparation & Serving (84.4%).
| Occupation | Male | Female |
| Healthcare Support | 0 (0.0%) | 117 (100.0%) |
| Security & Protection | 40 (100.0%) | 0 (0.0%) |
| Firefighting & Prevention | 22 (100.0%) | 0 (0.0%) |
| Law Enforcement | 18 (100.0%) | 0 (0.0%) |
| Food Preparation & Serving | 14 (15.6%) | 76 (84.4%) |
| Cleaning & Maintenance | 0 (0.0%) | 59 (100.0%) |
| Personal Care & Service | 0 (0.0%) | 0 (0.0%) |
| Total (Category) | 54 (17.6%) | 252 (82.4%) |
| Total (Overall) | 772 (45.6%) | 922 (54.4%) |
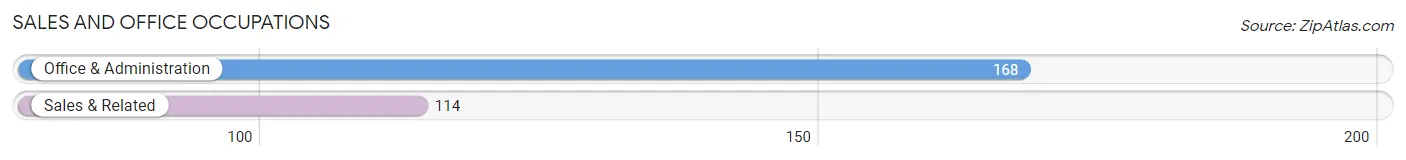
Sales and Office Occupations
The most common Sales and Office occupations in Brownsville are Office & Administration (168 | 9.9%), and Sales & Related (114 | 6.7%).
Sales and Office Occupations by Sex
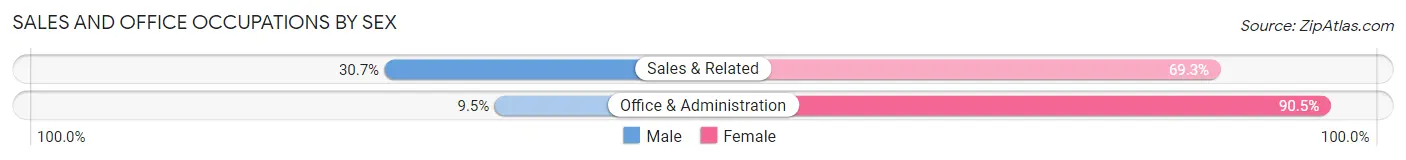
| Occupation | Male | Female |
| Sales & Related | 35 (30.7%) | 79 (69.3%) |
| Office & Administration | 16 (9.5%) | 152 (90.5%) |
| Total (Category) | 51 (18.1%) | 231 (81.9%) |
| Total (Overall) | 772 (45.6%) | 922 (54.4%) |
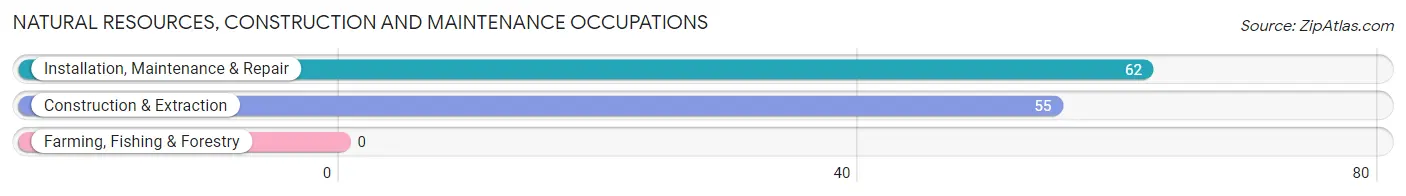
Natural Resources, Construction and Maintenance Occupations
The most common Natural Resources, Construction and Maintenance occupations in Brownsville are Installation, Maintenance & Repair (62 | 3.7%), and Construction & Extraction (55 | 3.3%).
Natural Resources, Construction and Maintenance Occupations by Sex
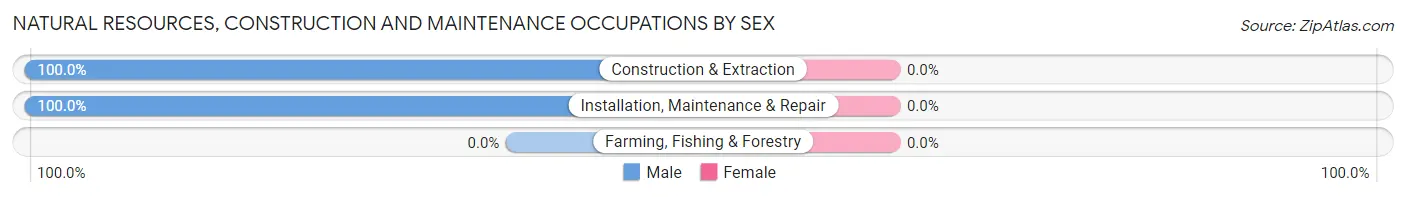
| Occupation | Male | Female |
| Farming, Fishing & Forestry | 0 (0.0%) | 0 (0.0%) |
| Construction & Extraction | 55 (100.0%) | 0 (0.0%) |
| Installation, Maintenance & Repair | 62 (100.0%) | 0 (0.0%) |
| Total (Category) | 117 (100.0%) | 0 (0.0%) |
| Total (Overall) | 772 (45.6%) | 922 (54.4%) |
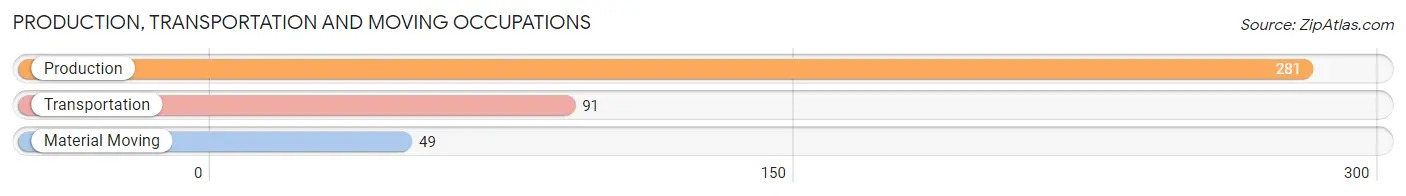
Production, Transportation and Moving Occupations
The most common Production, Transportation and Moving occupations in Brownsville are Production (281 | 16.6%), Transportation (91 | 5.4%), and Material Moving (49 | 2.9%).
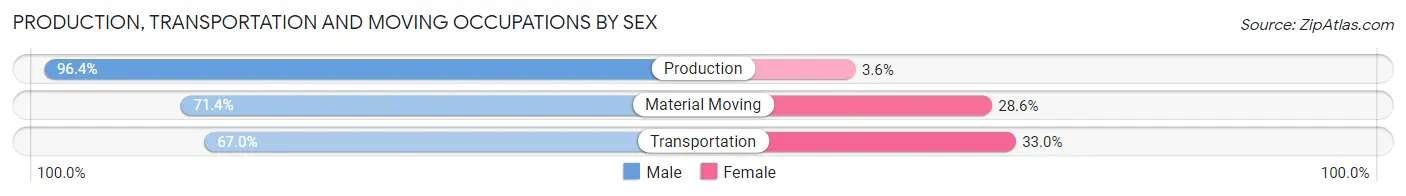
Production, Transportation and Moving Occupations by Sex
| Occupation | Male | Female |
| Production | 271 (96.4%) | 10 (3.6%) |
| Transportation | 61 (67.0%) | 30 (33.0%) |
| Material Moving | 35 (71.4%) | 14 (28.6%) |
| Total (Category) | 367 (87.2%) | 54 (12.8%) |
| Total (Overall) | 772 (45.6%) | 922 (54.4%) |
Employment Industries by Sex in Brownsville
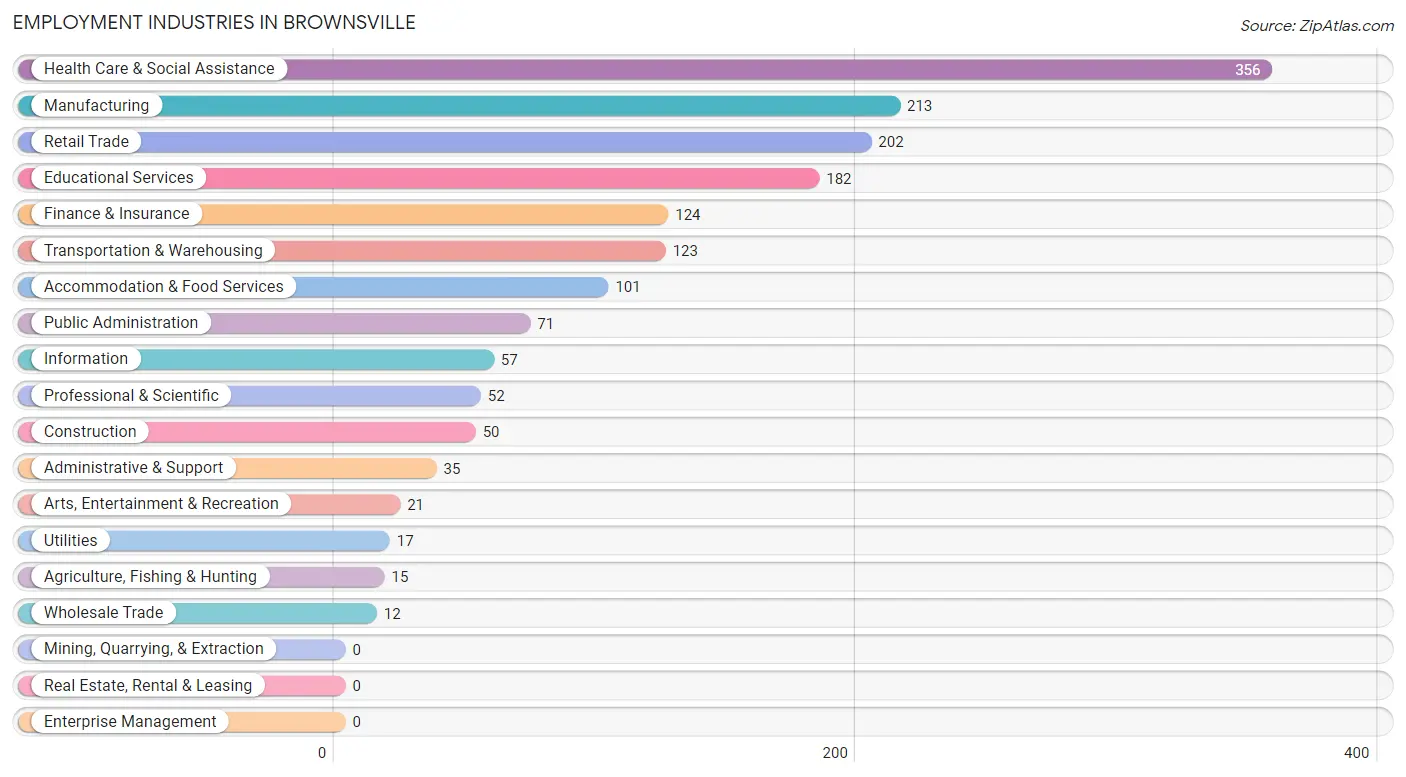
Employment Industries in Brownsville
The major employment industries in Brownsville include Health Care & Social Assistance (356 | 21.0%), Manufacturing (213 | 12.6%), Retail Trade (202 | 11.9%), Educational Services (182 | 10.7%), and Finance & Insurance (124 | 7.3%).
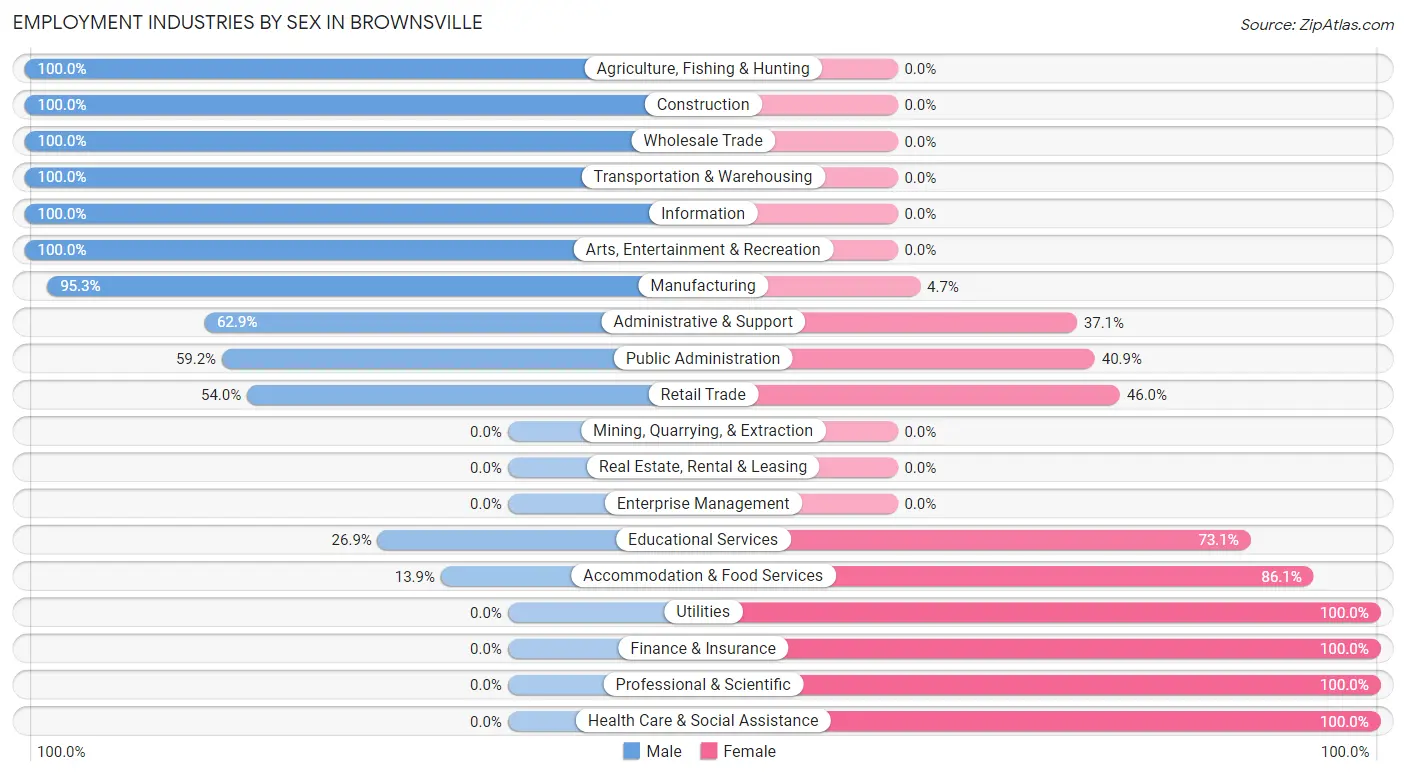
Employment Industries by Sex in Brownsville
The Brownsville industries that see more men than women are Agriculture, Fishing & Hunting (100.0%), Construction (100.0%), and Wholesale Trade (100.0%), whereas the industries that tend to have a higher number of women are Utilities (100.0%), Finance & Insurance (100.0%), and Professional & Scientific (100.0%).
| Industry | Male | Female |
| Agriculture, Fishing & Hunting | 15 (100.0%) | 0 (0.0%) |
| Mining, Quarrying, & Extraction | 0 (0.0%) | 0 (0.0%) |
| Construction | 50 (100.0%) | 0 (0.0%) |
| Manufacturing | 203 (95.3%) | 10 (4.7%) |
| Wholesale Trade | 12 (100.0%) | 0 (0.0%) |
| Retail Trade | 109 (54.0%) | 93 (46.0%) |
| Transportation & Warehousing | 123 (100.0%) | 0 (0.0%) |
| Utilities | 0 (0.0%) | 17 (100.0%) |
| Information | 57 (100.0%) | 0 (0.0%) |
| Finance & Insurance | 0 (0.0%) | 124 (100.0%) |
| Real Estate, Rental & Leasing | 0 (0.0%) | 0 (0.0%) |
| Professional & Scientific | 0 (0.0%) | 52 (100.0%) |
| Enterprise Management | 0 (0.0%) | 0 (0.0%) |
| Administrative & Support | 22 (62.9%) | 13 (37.1%) |
| Educational Services | 49 (26.9%) | 133 (73.1%) |
| Health Care & Social Assistance | 0 (0.0%) | 356 (100.0%) |
| Arts, Entertainment & Recreation | 21 (100.0%) | 0 (0.0%) |
| Accommodation & Food Services | 14 (13.9%) | 87 (86.1%) |
| Public Administration | 42 (59.2%) | 29 (40.8%) |
| Total | 772 (45.6%) | 922 (54.4%) |
Education in Brownsville
School Enrollment in Brownsville
The most common levels of schooling among the 1,016 students in Brownsville are high school (413 | 40.6%), middle school (256 | 25.2%), and elementary school (214 | 21.1%).
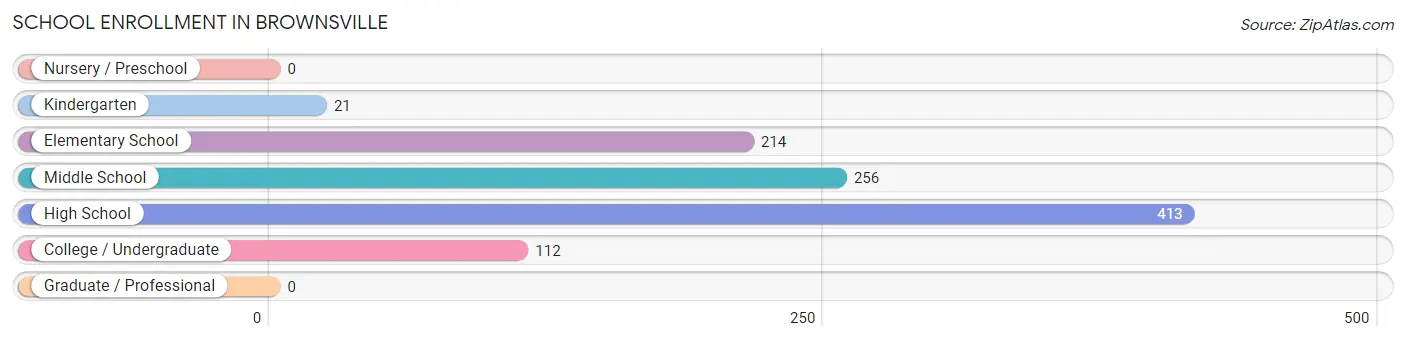
| School Level | # Students | % Students |
| Nursery / Preschool | 0 | 0.0% |
| Kindergarten | 21 | 2.1% |
| Elementary School | 214 | 21.1% |
| Middle School | 256 | 25.2% |
| High School | 413 | 40.6% |
| College / Undergraduate | 112 | 11.0% |
| Graduate / Professional | 0 | 0.0% |
| Total | 1,016 | 100.0% |
School Enrollment by Age by Funding Source in Brownsville
Out of a total of 1,016 students who are enrolled in schools in Brownsville, 34 (3.3%) attend a private institution, while the remaining 982 (96.7%) are enrolled in public schools. The age group of 5 to 9 year old has the highest likelihood of being enrolled in private schools, with 34 (15.2% in the age bracket) enrolled. Conversely, the age group of 10 to 14 year olds has the lowest likelihood of being enrolled in a private school, with 495 (100.0% in the age bracket) attending a public institution.
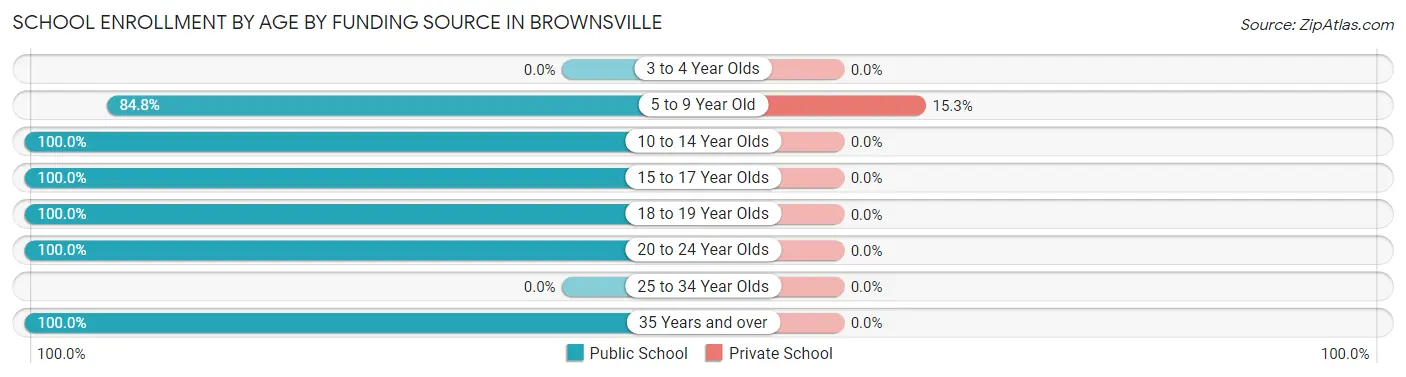
| Age Bracket | Public School | Private School |
| 3 to 4 Year Olds | 0 (0.0%) | 0 (0.0%) |
| 5 to 9 Year Old | 189 (84.8%) | 34 (15.2%) |
| 10 to 14 Year Olds | 495 (100.0%) | 0 (0.0%) |
| 15 to 17 Year Olds | 90 (100.0%) | 0 (0.0%) |
| 18 to 19 Year Olds | 126 (100.0%) | 0 (0.0%) |
| 20 to 24 Year Olds | 67 (100.0%) | 0 (0.0%) |
| 25 to 34 Year Olds | 0 (0.0%) | 0 (0.0%) |
| 35 Years and over | 15 (100.0%) | 0 (0.0%) |
| Total | 982 (96.7%) | 34 (3.3%) |
Educational Attainment by Field of Study in Brownsville
Science & technology (95 | 27.3%), education (73 | 21.0%), bio, nature & agricultural (69 | 19.8%), business (55 | 15.8%), and arts & humanities (22 | 6.3%) are the most common fields of study among 348 individuals in Brownsville who have obtained a bachelor's degree or higher.
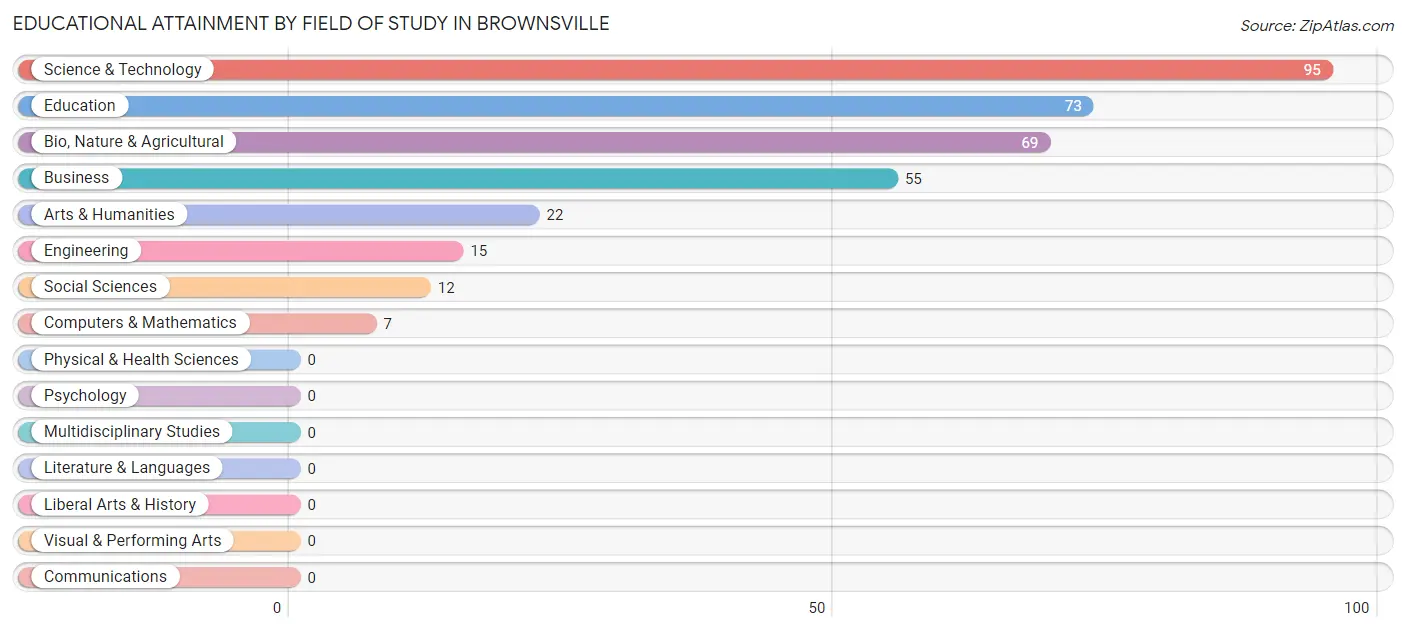
| Field of Study | # Graduates | % Graduates |
| Computers & Mathematics | 7 | 2.0% |
| Bio, Nature & Agricultural | 69 | 19.8% |
| Physical & Health Sciences | 0 | 0.0% |
| Psychology | 0 | 0.0% |
| Social Sciences | 12 | 3.5% |
| Engineering | 15 | 4.3% |
| Multidisciplinary Studies | 0 | 0.0% |
| Science & Technology | 95 | 27.3% |
| Business | 55 | 15.8% |
| Education | 73 | 21.0% |
| Literature & Languages | 0 | 0.0% |
| Liberal Arts & History | 0 | 0.0% |
| Visual & Performing Arts | 0 | 0.0% |
| Communications | 0 | 0.0% |
| Arts & Humanities | 22 | 6.3% |
| Total | 348 | 100.0% |
Transportation & Commute in Brownsville
Vehicle Availability by Sex in Brownsville
The most prevalent vehicle ownership categories in Brownsville are males with 1 vehicle (316, accounting for 40.9%) and females with 1 vehicle (357, making up 34.3%).
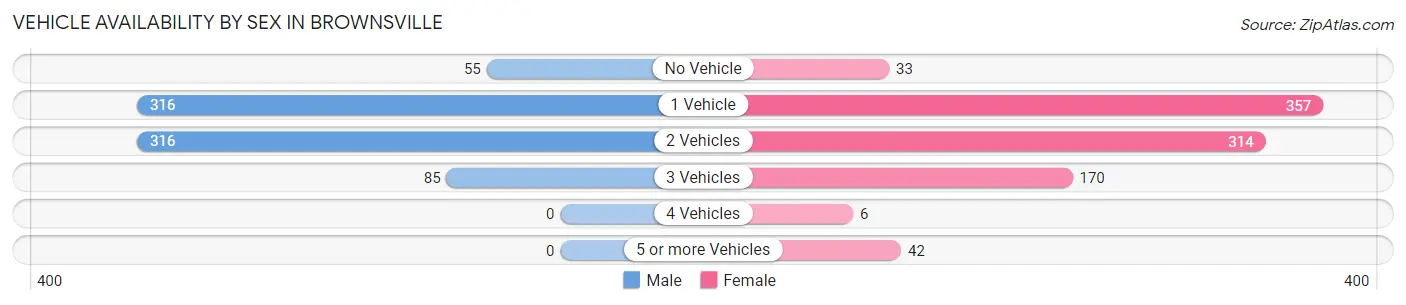
| Vehicles Available | Male | Female |
| No Vehicle | 55 (7.1%) | 33 (3.6%) |
| 1 Vehicle | 316 (40.9%) | 357 (38.7%) |
| 2 Vehicles | 316 (40.9%) | 314 (34.1%) |
| 3 Vehicles | 85 (11.0%) | 170 (18.4%) |
| 4 Vehicles | 0 (0.0%) | 6 (0.6%) |
| 5 or more Vehicles | 0 (0.0%) | 42 (4.6%) |
| Total | 772 (100.0%) | 922 (100.0%) |
Commute Time in Brownsville
The most frequently occuring commute durations in Brownsville are 10 to 14 minutes (455 commuters, 28.4%), 15 to 19 minutes (439 commuters, 27.4%), and 20 to 24 minutes (247 commuters, 15.4%).
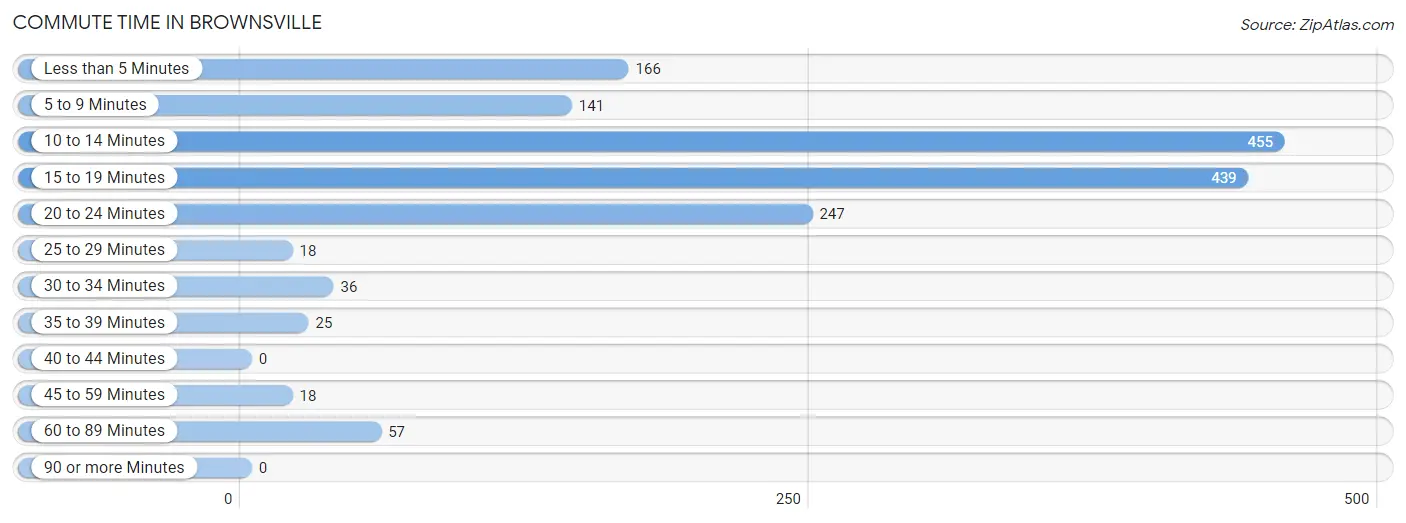
| Commute Time | # Commuters | % Commuters |
| Less than 5 Minutes | 166 | 10.4% |
| 5 to 9 Minutes | 141 | 8.8% |
| 10 to 14 Minutes | 455 | 28.4% |
| 15 to 19 Minutes | 439 | 27.4% |
| 20 to 24 Minutes | 247 | 15.4% |
| 25 to 29 Minutes | 18 | 1.1% |
| 30 to 34 Minutes | 36 | 2.2% |
| 35 to 39 Minutes | 25 | 1.6% |
| 40 to 44 Minutes | 0 | 0.0% |
| 45 to 59 Minutes | 18 | 1.1% |
| 60 to 89 Minutes | 57 | 3.6% |
| 90 or more Minutes | 0 | 0.0% |
Commute Time by Sex in Brownsville
The most common commute times in Brownsville are 10 to 14 minutes (201 commuters, 29.1%) for males and 15 to 19 minutes (292 commuters, 32.0%) for females.
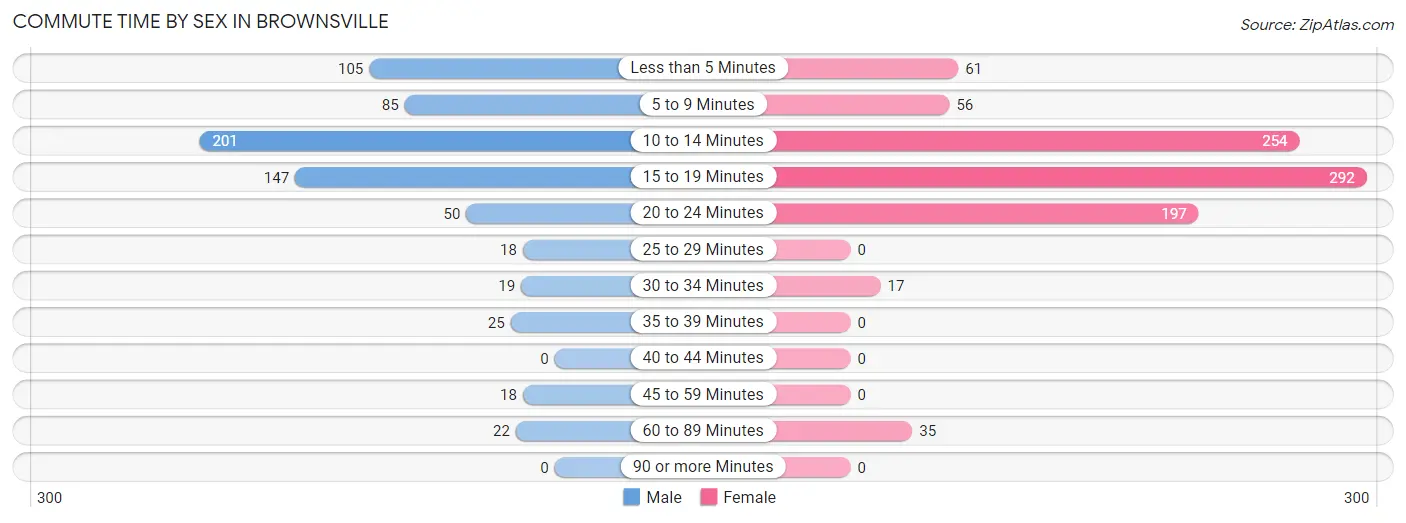
| Commute Time | Male | Female |
| Less than 5 Minutes | 105 (15.2%) | 61 (6.7%) |
| 5 to 9 Minutes | 85 (12.3%) | 56 (6.1%) |
| 10 to 14 Minutes | 201 (29.1%) | 254 (27.9%) |
| 15 to 19 Minutes | 147 (21.3%) | 292 (32.0%) |
| 20 to 24 Minutes | 50 (7.2%) | 197 (21.6%) |
| 25 to 29 Minutes | 18 (2.6%) | 0 (0.0%) |
| 30 to 34 Minutes | 19 (2.8%) | 17 (1.9%) |
| 35 to 39 Minutes | 25 (3.6%) | 0 (0.0%) |
| 40 to 44 Minutes | 0 (0.0%) | 0 (0.0%) |
| 45 to 59 Minutes | 18 (2.6%) | 0 (0.0%) |
| 60 to 89 Minutes | 22 (3.2%) | 35 (3.8%) |
| 90 or more Minutes | 0 (0.0%) | 0 (0.0%) |
Time of Departure to Work by Sex in Brownsville
The most frequent times of departure to work in Brownsville are 7:00 AM to 7:29 AM (170, 24.6%) for males and 7:00 AM to 7:29 AM (229, 25.1%) for females.
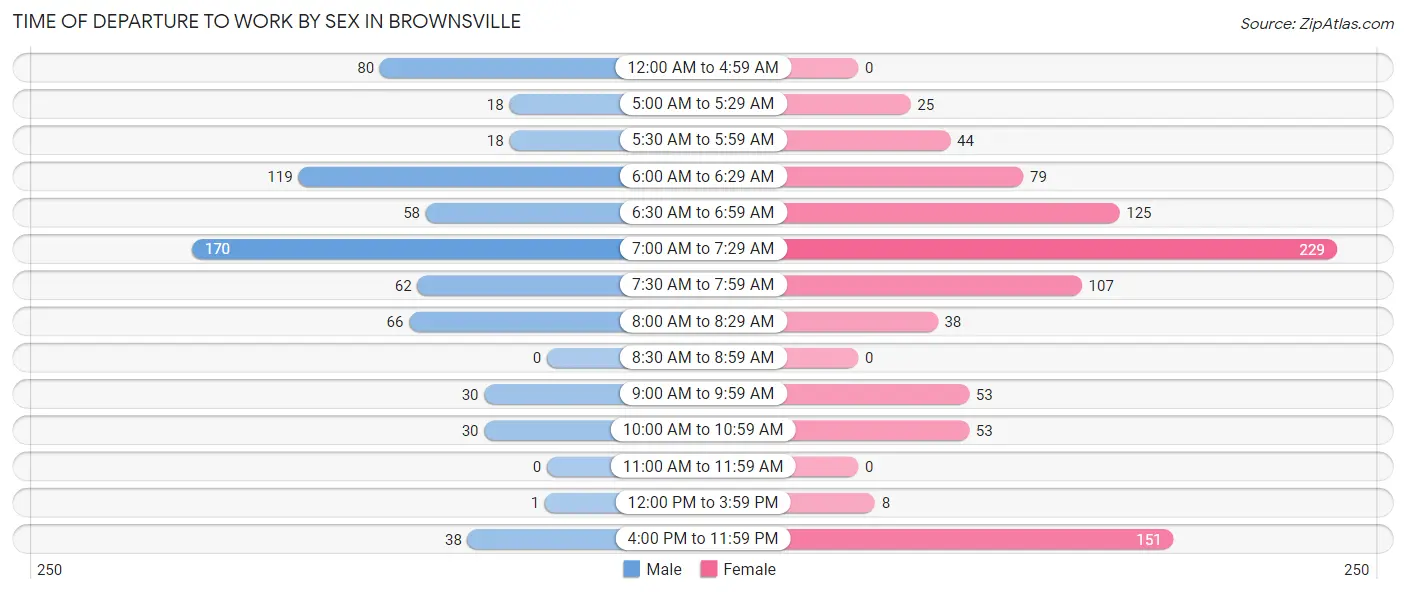
| Time of Departure | Male | Female |
| 12:00 AM to 4:59 AM | 80 (11.6%) | 0 (0.0%) |
| 5:00 AM to 5:29 AM | 18 (2.6%) | 25 (2.7%) |
| 5:30 AM to 5:59 AM | 18 (2.6%) | 44 (4.8%) |
| 6:00 AM to 6:29 AM | 119 (17.2%) | 79 (8.7%) |
| 6:30 AM to 6:59 AM | 58 (8.4%) | 125 (13.7%) |
| 7:00 AM to 7:29 AM | 170 (24.6%) | 229 (25.1%) |
| 7:30 AM to 7:59 AM | 62 (9.0%) | 107 (11.7%) |
| 8:00 AM to 8:29 AM | 66 (9.6%) | 38 (4.2%) |
| 8:30 AM to 8:59 AM | 0 (0.0%) | 0 (0.0%) |
| 9:00 AM to 9:59 AM | 30 (4.3%) | 53 (5.8%) |
| 10:00 AM to 10:59 AM | 30 (4.3%) | 53 (5.8%) |
| 11:00 AM to 11:59 AM | 0 (0.0%) | 0 (0.0%) |
| 12:00 PM to 3:59 PM | 1 (0.1%) | 8 (0.9%) |
| 4:00 PM to 11:59 PM | 38 (5.5%) | 151 (16.6%) |
| Total | 690 (100.0%) | 912 (100.0%) |
Housing Occupancy in Brownsville
Occupancy by Ownership in Brownsville
Of the total 1,788 dwellings in Brownsville, owner-occupied units account for 1,121 (62.7%), while renter-occupied units make up 667 (37.3%).
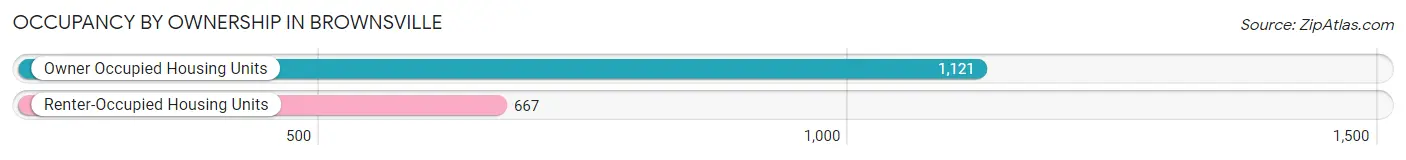
| Occupancy | # Housing Units | % Housing Units |
| Owner Occupied Housing Units | 1,121 | 62.7% |
| Renter-Occupied Housing Units | 667 | 37.3% |
| Total Occupied Housing Units | 1,788 | 100.0% |
Occupancy by Household Size in Brownsville
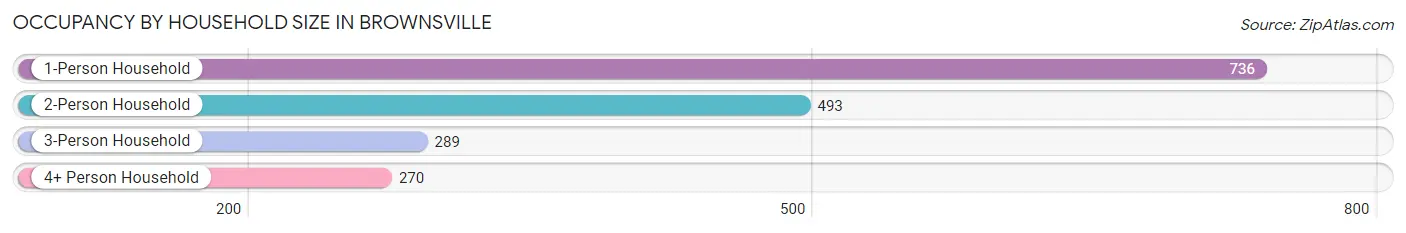
| Household Size | # Housing Units | % Housing Units |
| 1-Person Household | 736 | 41.2% |
| 2-Person Household | 493 | 27.6% |
| 3-Person Household | 289 | 16.2% |
| 4+ Person Household | 270 | 15.1% |
| Total Housing Units | 1,788 | 100.0% |
Occupancy by Ownership by Household Size in Brownsville
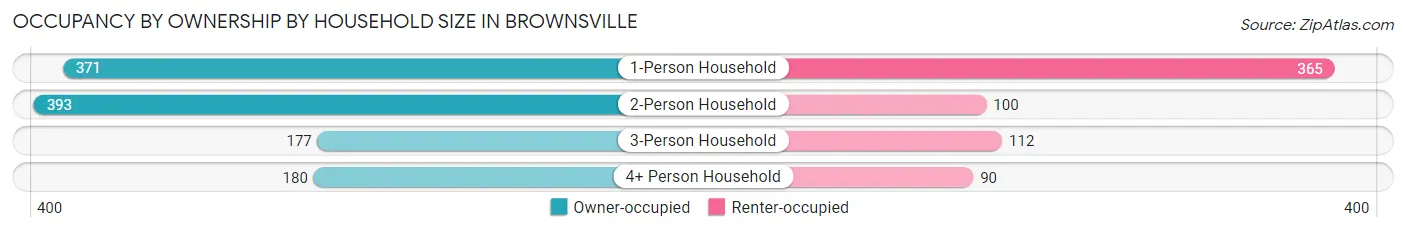
| Household Size | Owner-occupied | Renter-occupied |
| 1-Person Household | 371 (50.4%) | 365 (49.6%) |
| 2-Person Household | 393 (79.7%) | 100 (20.3%) |
| 3-Person Household | 177 (61.3%) | 112 (38.8%) |
| 4+ Person Household | 180 (66.7%) | 90 (33.3%) |
| Total Housing Units | 1,121 (62.7%) | 667 (37.3%) |
Occupancy by Educational Attainment in Brownsville
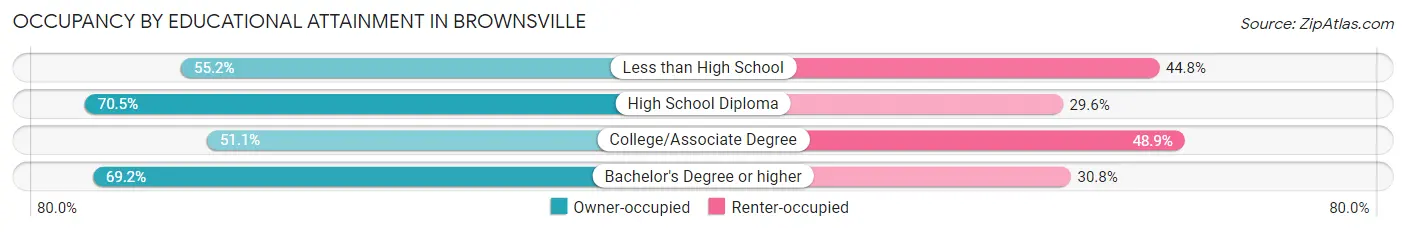
| Household Size | Owner-occupied | Renter-occupied |
| Less than High School | 128 (55.2%) | 104 (44.8%) |
| High School Diploma | 546 (70.5%) | 229 (29.5%) |
| College/Associate Degree | 263 (51.1%) | 252 (48.9%) |
| Bachelor's Degree or higher | 184 (69.2%) | 82 (30.8%) |
Occupancy by Age of Householder in Brownsville
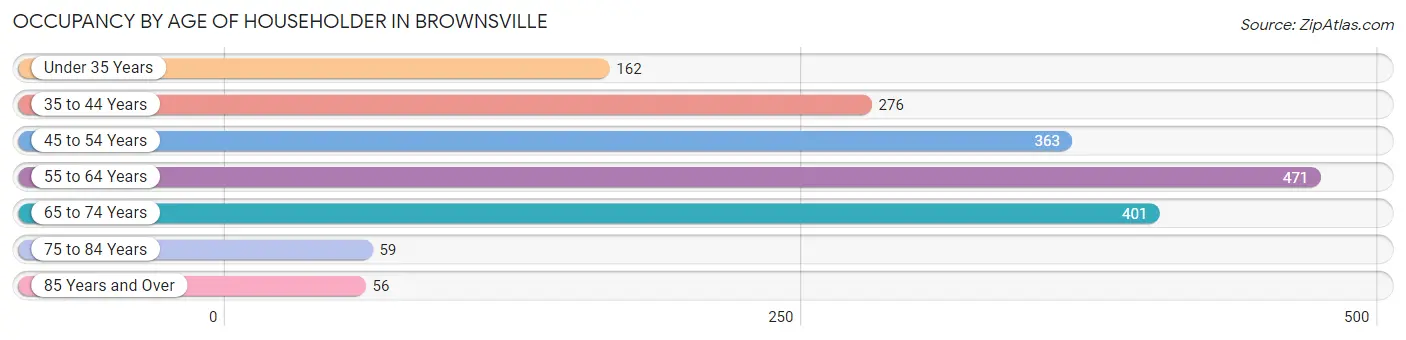
| Age Bracket | # Households | % Households |
| Under 35 Years | 162 | 9.1% |
| 35 to 44 Years | 276 | 15.4% |
| 45 to 54 Years | 363 | 20.3% |
| 55 to 64 Years | 471 | 26.3% |
| 65 to 74 Years | 401 | 22.4% |
| 75 to 84 Years | 59 | 3.3% |
| 85 Years and Over | 56 | 3.1% |
| Total | 1,788 | 100.0% |
Housing Finances in Brownsville
Median Income by Occupancy in Brownsville
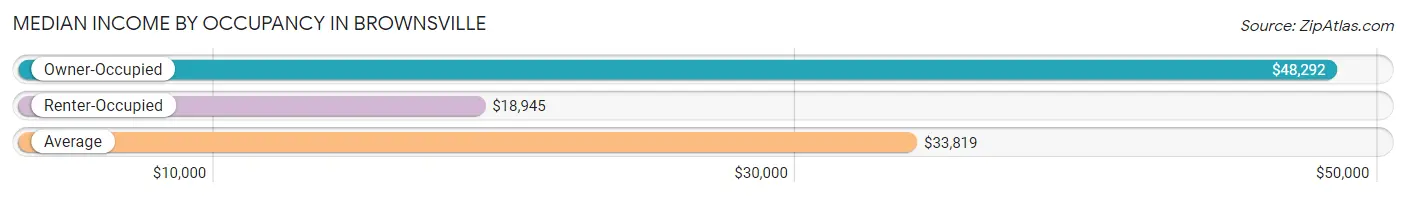
| Occupancy Type | # Households | Median Income |
| Owner-Occupied | 1,121 (62.7%) | $48,292 |
| Renter-Occupied | 667 (37.3%) | $18,945 |
| Average | 1,788 (100.0%) | $33,819 |
Occupancy by Householder Income Bracket in Brownsville
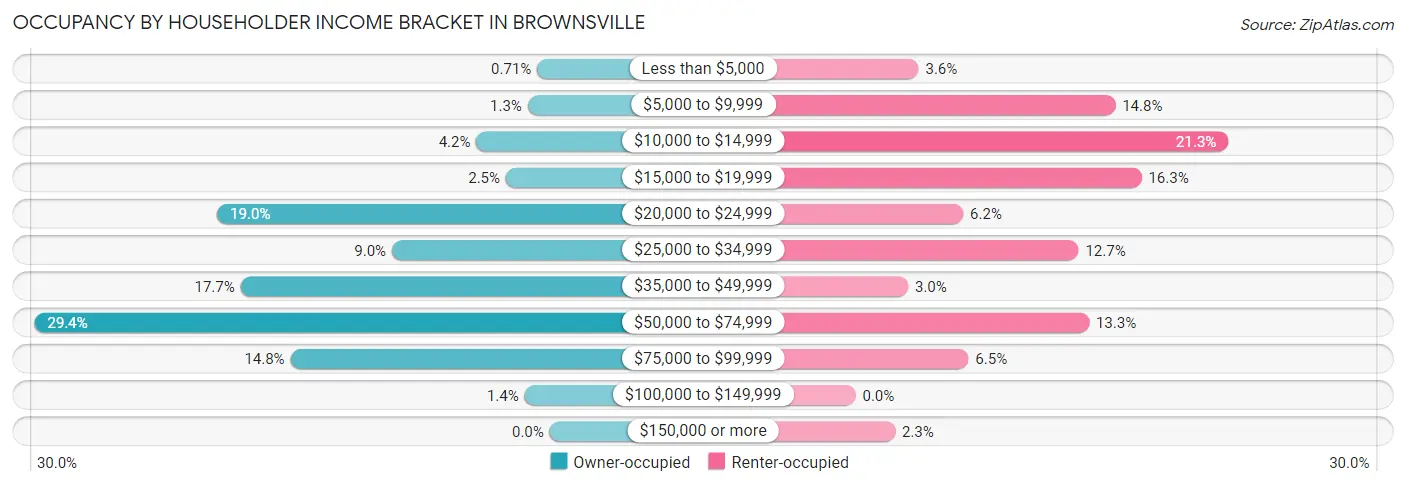
| Income Bracket | Owner-occupied | Renter-occupied |
| Less than $5,000 | 8 (0.7%) | 24 (3.6%) |
| $5,000 to $9,999 | 14 (1.3%) | 99 (14.8%) |
| $10,000 to $14,999 | 47 (4.2%) | 142 (21.3%) |
| $15,000 to $19,999 | 28 (2.5%) | 109 (16.3%) |
| $20,000 to $24,999 | 213 (19.0%) | 41 (6.1%) |
| $25,000 to $34,999 | 101 (9.0%) | 85 (12.7%) |
| $35,000 to $49,999 | 198 (17.7%) | 20 (3.0%) |
| $50,000 to $74,999 | 330 (29.4%) | 89 (13.3%) |
| $75,000 to $99,999 | 166 (14.8%) | 43 (6.5%) |
| $100,000 to $149,999 | 16 (1.4%) | 0 (0.0%) |
| $150,000 or more | 0 (0.0%) | 15 (2.2%) |
| Total | 1,121 (100.0%) | 667 (100.0%) |
Monthly Housing Cost Tiers in Brownsville
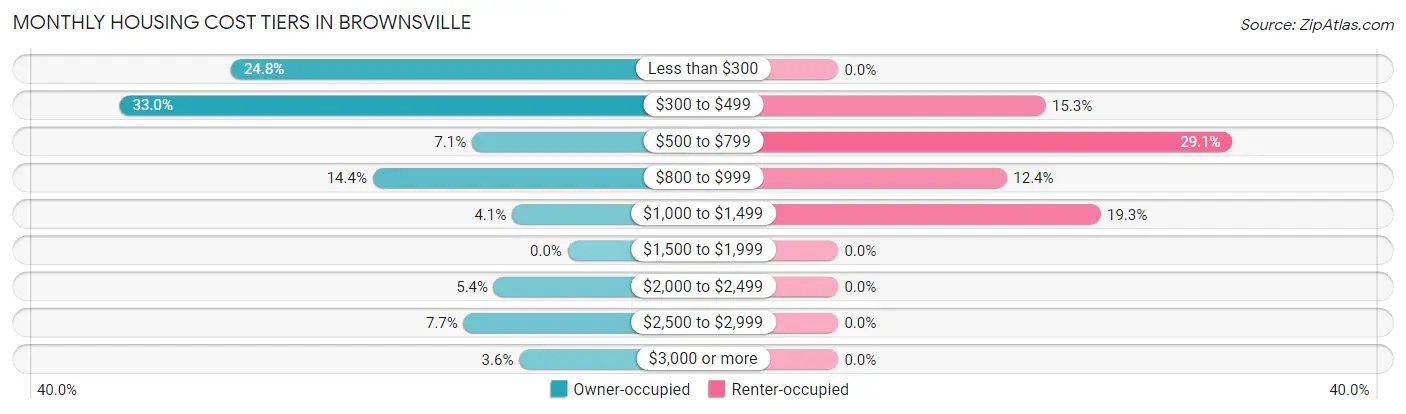
| Monthly Cost | Owner-occupied | Renter-occupied |
| Less than $300 | 278 (24.8%) | 0 (0.0%) |
| $300 to $499 | 370 (33.0%) | 102 (15.3%) |
| $500 to $799 | 79 (7.0%) | 194 (29.1%) |
| $800 to $999 | 161 (14.4%) | 83 (12.4%) |
| $1,000 to $1,499 | 46 (4.1%) | 129 (19.3%) |
| $1,500 to $1,999 | 0 (0.0%) | 0 (0.0%) |
| $2,000 to $2,499 | 61 (5.4%) | 0 (0.0%) |
| $2,500 to $2,999 | 86 (7.7%) | 0 (0.0%) |
| $3,000 or more | 40 (3.6%) | 0 (0.0%) |
| Total | 1,121 (100.0%) | 667 (100.0%) |
Physical Housing Characteristics in Brownsville
Housing Structures in Brownsville
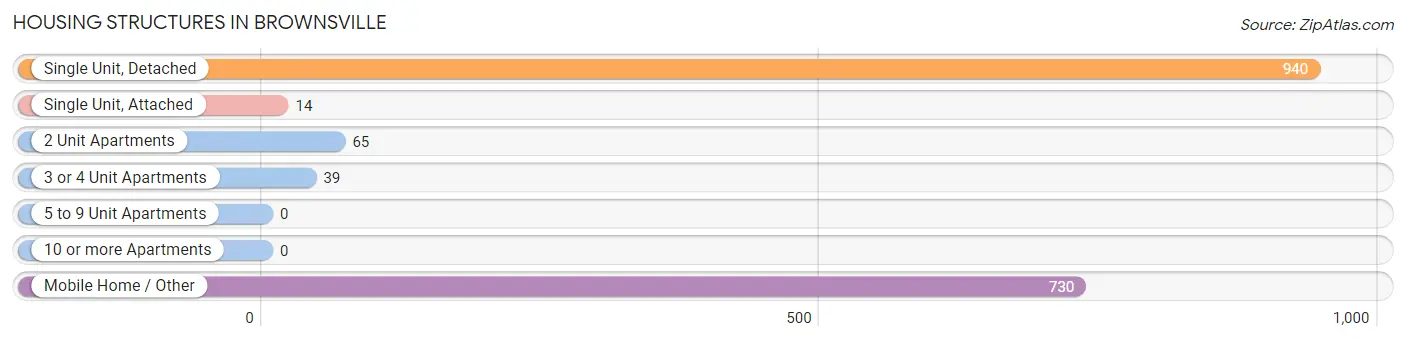
| Structure Type | # Housing Units | % Housing Units |
| Single Unit, Detached | 940 | 52.6% |
| Single Unit, Attached | 14 | 0.8% |
| 2 Unit Apartments | 65 | 3.6% |
| 3 or 4 Unit Apartments | 39 | 2.2% |
| 5 to 9 Unit Apartments | 0 | 0.0% |
| 10 or more Apartments | 0 | 0.0% |
| Mobile Home / Other | 730 | 40.8% |
| Total | 1,788 | 100.0% |
Housing Structures by Occupancy in Brownsville
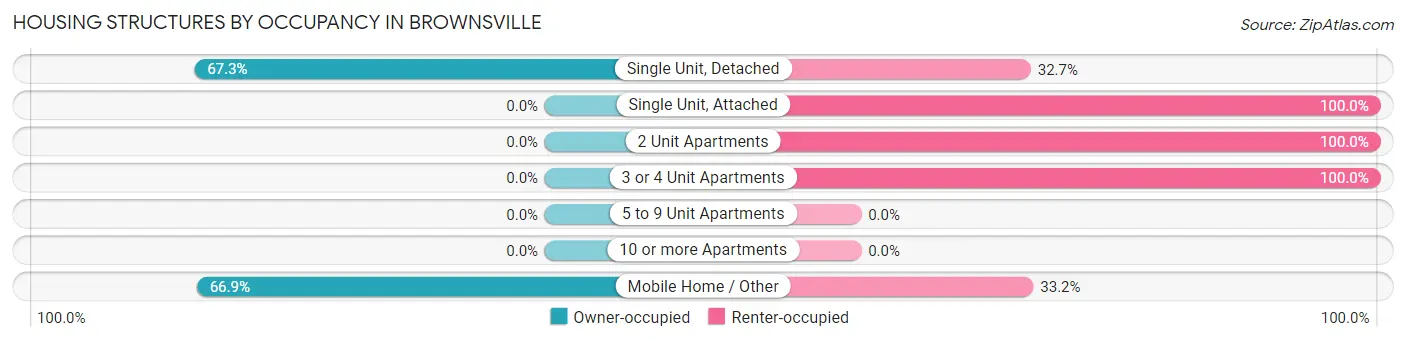
| Structure Type | Owner-occupied | Renter-occupied |
| Single Unit, Detached | 633 (67.3%) | 307 (32.7%) |
| Single Unit, Attached | 0 (0.0%) | 14 (100.0%) |
| 2 Unit Apartments | 0 (0.0%) | 65 (100.0%) |
| 3 or 4 Unit Apartments | 0 (0.0%) | 39 (100.0%) |
| 5 to 9 Unit Apartments | 0 (0.0%) | 0 (0.0%) |
| 10 or more Apartments | 0 (0.0%) | 0 (0.0%) |
| Mobile Home / Other | 488 (66.8%) | 242 (33.2%) |
| Total | 1,121 (62.7%) | 667 (37.3%) |
Housing Structures by Number of Rooms in Brownsville
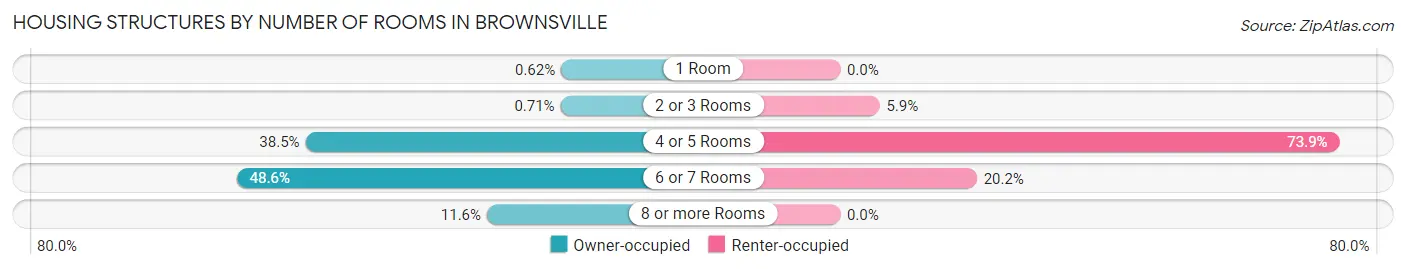
| Number of Rooms | Owner-occupied | Renter-occupied |
| 1 Room | 7 (0.6%) | 0 (0.0%) |
| 2 or 3 Rooms | 8 (0.7%) | 39 (5.9%) |
| 4 or 5 Rooms | 431 (38.5%) | 493 (73.9%) |
| 6 or 7 Rooms | 545 (48.6%) | 135 (20.2%) |
| 8 or more Rooms | 130 (11.6%) | 0 (0.0%) |
| Total | 1,121 (100.0%) | 667 (100.0%) |
Housing Structure by Heating Type in Brownsville
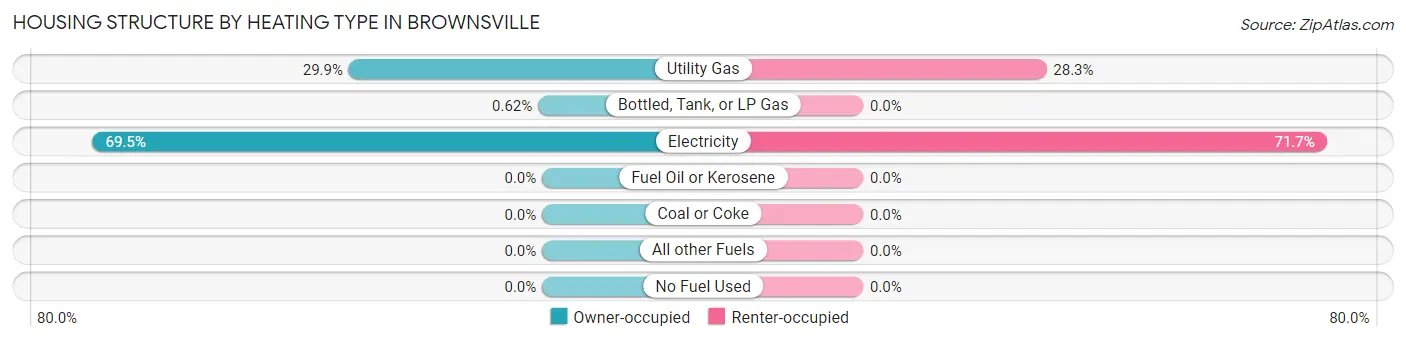
| Heating Type | Owner-occupied | Renter-occupied |
| Utility Gas | 335 (29.9%) | 189 (28.3%) |
| Bottled, Tank, or LP Gas | 7 (0.6%) | 0 (0.0%) |
| Electricity | 779 (69.5%) | 478 (71.7%) |
| Fuel Oil or Kerosene | 0 (0.0%) | 0 (0.0%) |
| Coal or Coke | 0 (0.0%) | 0 (0.0%) |
| All other Fuels | 0 (0.0%) | 0 (0.0%) |
| No Fuel Used | 0 (0.0%) | 0 (0.0%) |
| Total | 1,121 (100.0%) | 667 (100.0%) |
Household Vehicle Usage in Brownsville
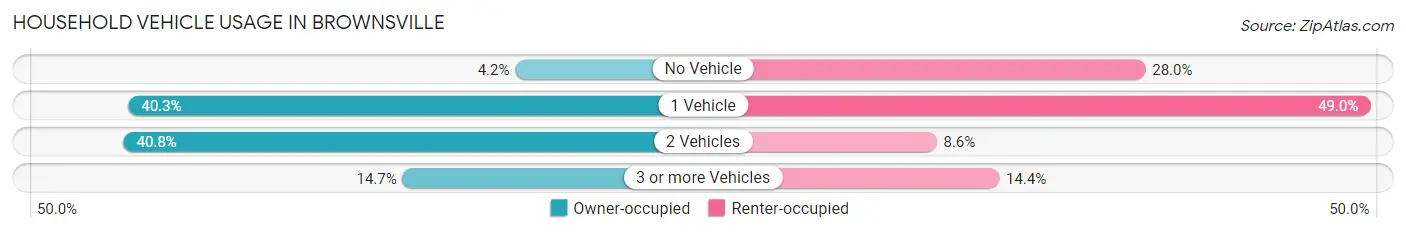
| Vehicles per Household | Owner-occupied | Renter-occupied |
| No Vehicle | 47 (4.2%) | 187 (28.0%) |
| 1 Vehicle | 452 (40.3%) | 327 (49.0%) |
| 2 Vehicles | 457 (40.8%) | 57 (8.6%) |
| 3 or more Vehicles | 165 (14.7%) | 96 (14.4%) |
| Total | 1,121 (100.0%) | 667 (100.0%) |
Real Estate & Mortgages in Brownsville
Real Estate and Mortgage Overview in Brownsville
| Characteristic | Without Mortgage | With Mortgage |
| Housing Units | 793 | 328 |
| Median Property Value | $60,400 | $110,600 |
| Median Household Income | $41,250 | $0 |
| Monthly Housing Costs | $359 | $27 |
| Real Estate Taxes | $199 | $131 |
Property Value by Mortgage Status in Brownsville
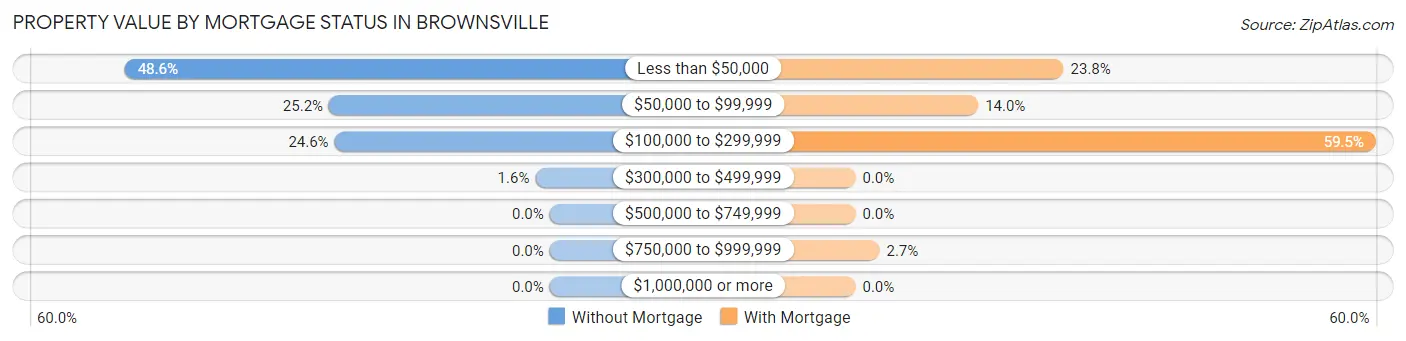
| Property Value | Without Mortgage | With Mortgage |
| Less than $50,000 | 385 (48.5%) | 78 (23.8%) |
| $50,000 to $99,999 | 200 (25.2%) | 46 (14.0%) |
| $100,000 to $299,999 | 195 (24.6%) | 195 (59.5%) |
| $300,000 to $499,999 | 13 (1.6%) | 0 (0.0%) |
| $500,000 to $749,999 | 0 (0.0%) | 0 (0.0%) |
| $750,000 to $999,999 | 0 (0.0%) | 9 (2.7%) |
| $1,000,000 or more | 0 (0.0%) | 0 (0.0%) |
| Total | 793 (100.0%) | 328 (100.0%) |
Household Income by Mortgage Status in Brownsville
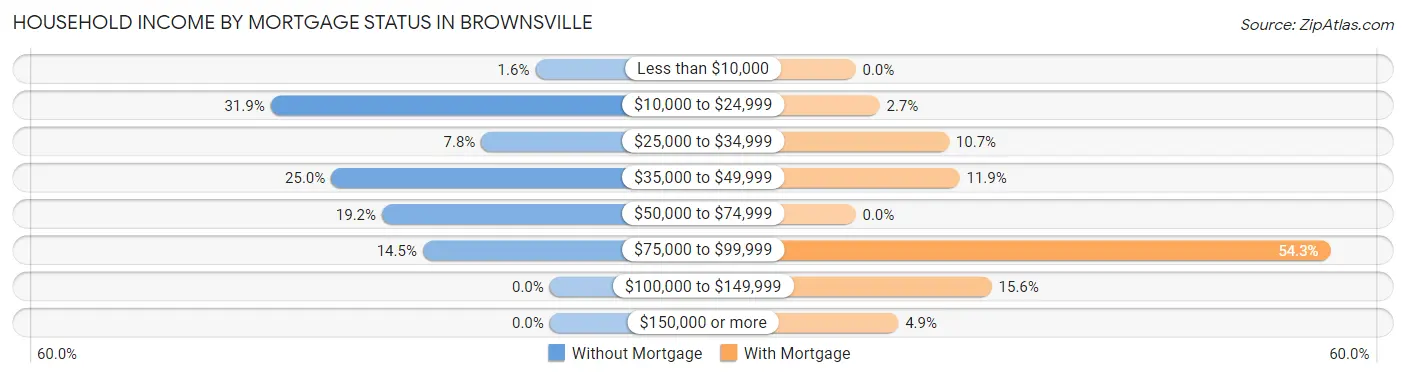
| Household Income | Without Mortgage | With Mortgage |
| Less than $10,000 | 13 (1.6%) | 0 (0.0%) |
| $10,000 to $24,999 | 253 (31.9%) | 9 (2.7%) |
| $25,000 to $34,999 | 62 (7.8%) | 35 (10.7%) |
| $35,000 to $49,999 | 198 (25.0%) | 39 (11.9%) |
| $50,000 to $74,999 | 152 (19.2%) | 0 (0.0%) |
| $75,000 to $99,999 | 115 (14.5%) | 178 (54.3%) |
| $100,000 to $149,999 | 0 (0.0%) | 51 (15.5%) |
| $150,000 or more | 0 (0.0%) | 16 (4.9%) |
| Total | 793 (100.0%) | 328 (100.0%) |
Property Value to Household Income Ratio in Brownsville
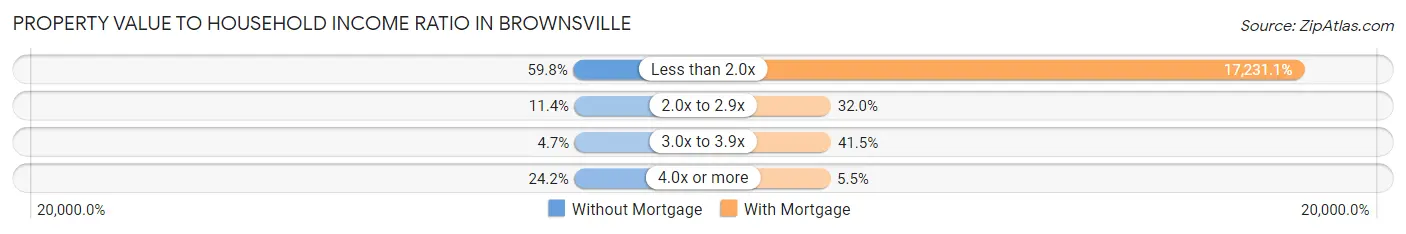
| Value-to-Income Ratio | Without Mortgage | With Mortgage |
| Less than 2.0x | 474 (59.8%) | 56,518 (17,231.1%) |
| 2.0x to 2.9x | 90 (11.4%) | 105 (32.0%) |
| 3.0x to 3.9x | 37 (4.7%) | 136 (41.5%) |
| 4.0x or more | 192 (24.2%) | 18 (5.5%) |
| Total | 793 (100.0%) | 328 (100.0%) |
Real Estate Taxes by Mortgage Status in Brownsville
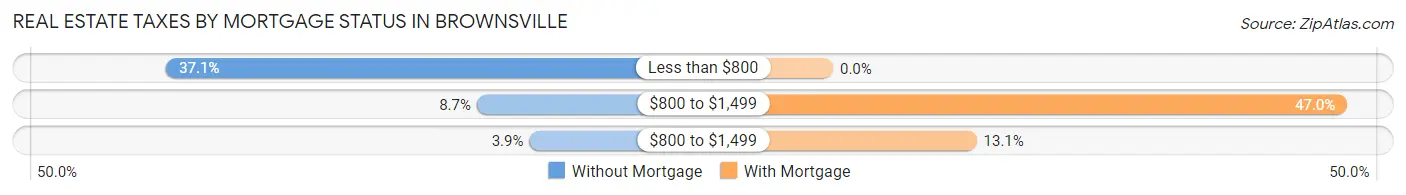
| Property Taxes | Without Mortgage | With Mortgage |
| Less than $800 | 294 (37.1%) | 0 (0.0%) |
| $800 to $1,499 | 69 (8.7%) | 154 (46.9%) |
| $800 to $1,499 | 31 (3.9%) | 43 (13.1%) |
| Total | 793 (100.0%) | 328 (100.0%) |
Health & Disability in Brownsville
Health Insurance Coverage by Age in Brownsville
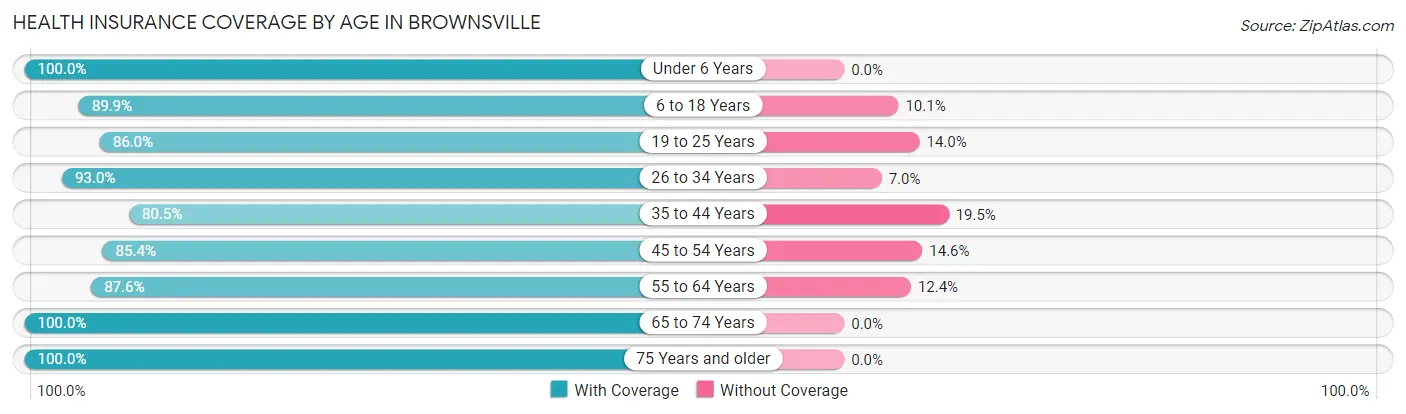
| Age Bracket | With Coverage | Without Coverage |
| Under 6 Years | 319 (100.0%) | 0 (0.0%) |
| 6 to 18 Years | 809 (89.9%) | 91 (10.1%) |
| 19 to 25 Years | 288 (86.0%) | 47 (14.0%) |
| 26 to 34 Years | 280 (93.0%) | 21 (7.0%) |
| 35 to 44 Years | 397 (80.5%) | 96 (19.5%) |
| 45 to 54 Years | 405 (85.4%) | 69 (14.6%) |
| 55 to 64 Years | 620 (87.6%) | 88 (12.4%) |
| 65 to 74 Years | 526 (100.0%) | 0 (0.0%) |
| 75 Years and older | 142 (100.0%) | 0 (0.0%) |
| Total | 3,786 (90.2%) | 412 (9.8%) |
Health Insurance Coverage by Citizenship Status in Brownsville
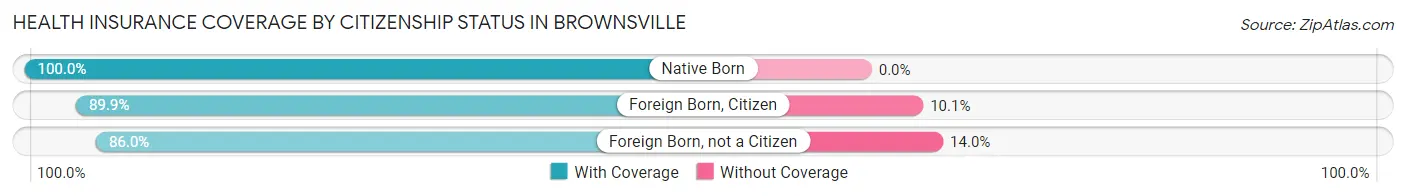
| Citizenship Status | With Coverage | Without Coverage |
| Native Born | 319 (100.0%) | 0 (0.0%) |
| Foreign Born, Citizen | 809 (89.9%) | 91 (10.1%) |
| Foreign Born, not a Citizen | 288 (86.0%) | 47 (14.0%) |
Health Insurance Coverage by Household Income in Brownsville
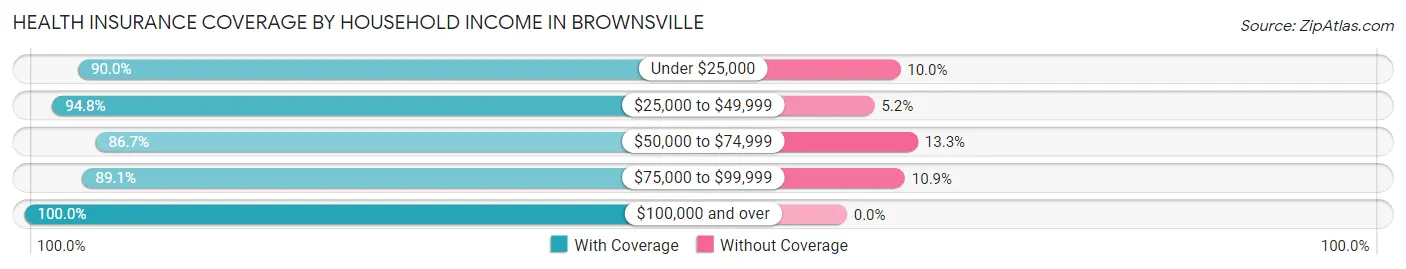
| Household Income | With Coverage | Without Coverage |
| Under $25,000 | 1,400 (90.0%) | 156 (10.0%) |
| $25,000 to $49,999 | 768 (94.8%) | 42 (5.2%) |
| $50,000 to $74,999 | 1,022 (86.7%) | 157 (13.3%) |
| $75,000 to $99,999 | 467 (89.1%) | 57 (10.9%) |
| $100,000 and over | 121 (100.0%) | 0 (0.0%) |
Public vs Private Health Insurance Coverage by Age in Brownsville
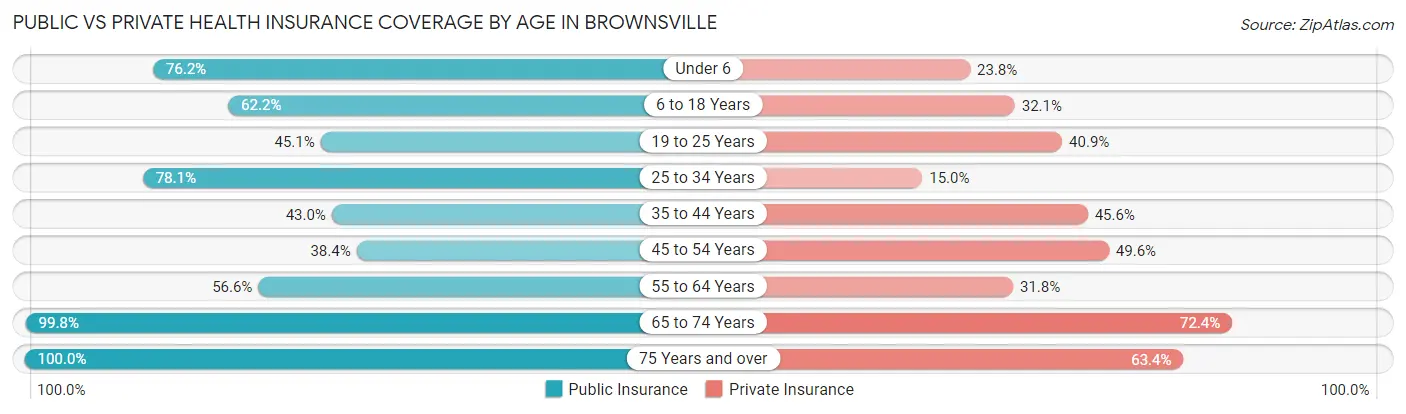
| Age Bracket | Public Insurance | Private Insurance |
| Under 6 | 243 (76.2%) | 76 (23.8%) |
| 6 to 18 Years | 560 (62.2%) | 289 (32.1%) |
| 19 to 25 Years | 151 (45.1%) | 137 (40.9%) |
| 25 to 34 Years | 235 (78.1%) | 45 (14.9%) |
| 35 to 44 Years | 212 (43.0%) | 225 (45.6%) |
| 45 to 54 Years | 182 (38.4%) | 235 (49.6%) |
| 55 to 64 Years | 401 (56.6%) | 225 (31.8%) |
| 65 to 74 Years | 525 (99.8%) | 381 (72.4%) |
| 75 Years and over | 142 (100.0%) | 90 (63.4%) |
| Total | 2,651 (63.1%) | 1,703 (40.6%) |
Disability Status by Sex by Age in Brownsville
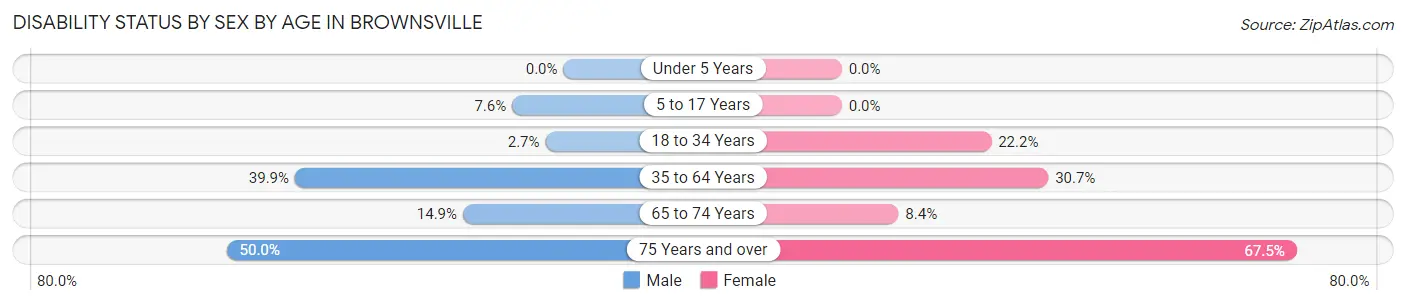
| Age Bracket | Male | Female |
| Under 5 Years | 0 (0.0%) | 0 (0.0%) |
| 5 to 17 Years | 26 (7.6%) | 0 (0.0%) |
| 18 to 34 Years | 10 (2.7%) | 83 (22.2%) |
| 35 to 64 Years | 301 (39.9%) | 282 (30.6%) |
| 65 to 74 Years | 27 (14.9%) | 29 (8.4%) |
| 75 Years and over | 14 (50.0%) | 77 (67.5%) |
Disability Class by Sex by Age in Brownsville
Disability Class: Hearing Difficulty
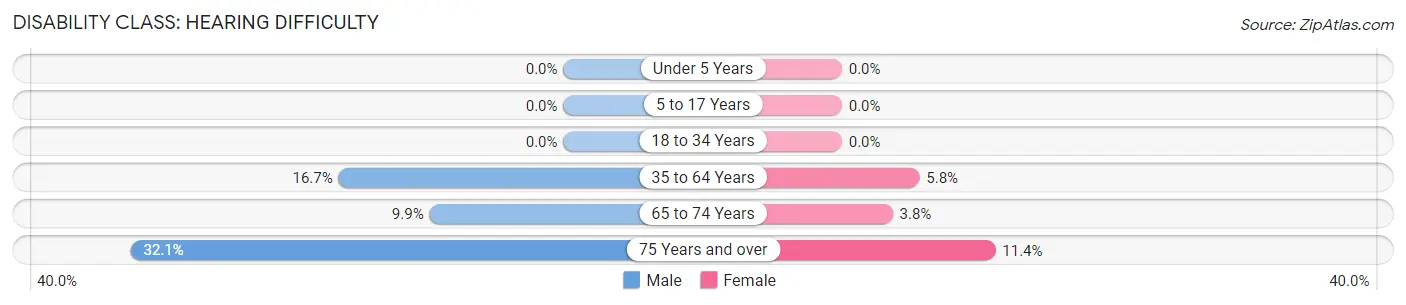
| Age Bracket | Male | Female |
| Under 5 Years | 0 (0.0%) | 0 (0.0%) |
| 5 to 17 Years | 0 (0.0%) | 0 (0.0%) |
| 18 to 34 Years | 0 (0.0%) | 0 (0.0%) |
| 35 to 64 Years | 126 (16.7%) | 53 (5.8%) |
| 65 to 74 Years | 18 (9.9%) | 13 (3.8%) |
| 75 Years and over | 9 (32.1%) | 13 (11.4%) |
Disability Class: Vision Difficulty
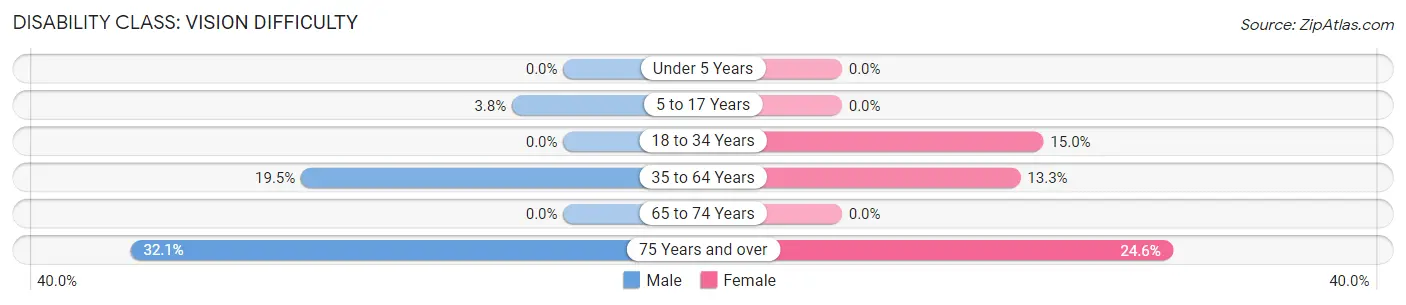
| Age Bracket | Male | Female |
| Under 5 Years | 0 (0.0%) | 0 (0.0%) |
| 5 to 17 Years | 13 (3.8%) | 0 (0.0%) |
| 18 to 34 Years | 0 (0.0%) | 56 (15.0%) |
| 35 to 64 Years | 147 (19.5%) | 122 (13.3%) |
| 65 to 74 Years | 0 (0.0%) | 0 (0.0%) |
| 75 Years and over | 9 (32.1%) | 28 (24.6%) |
Disability Class: Cognitive Difficulty
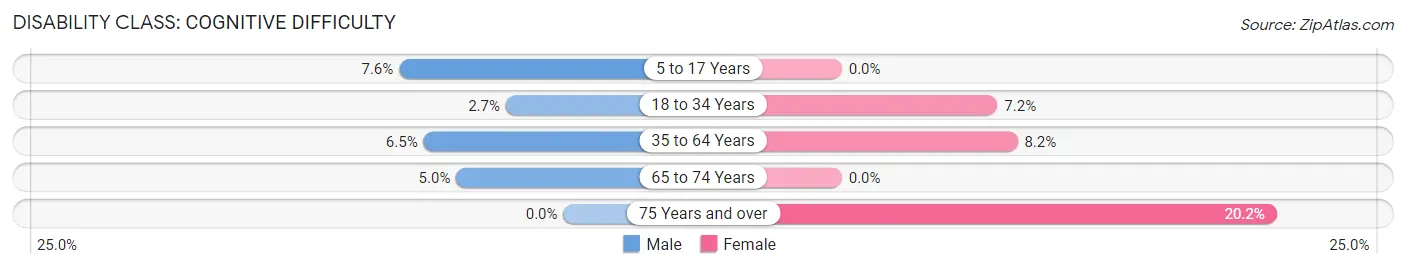
| Age Bracket | Male | Female |
| 5 to 17 Years | 26 (7.6%) | 0 (0.0%) |
| 18 to 34 Years | 10 (2.7%) | 27 (7.2%) |
| 35 to 64 Years | 49 (6.5%) | 75 (8.2%) |
| 65 to 74 Years | 9 (5.0%) | 0 (0.0%) |
| 75 Years and over | 0 (0.0%) | 23 (20.2%) |
Disability Class: Ambulatory Difficulty
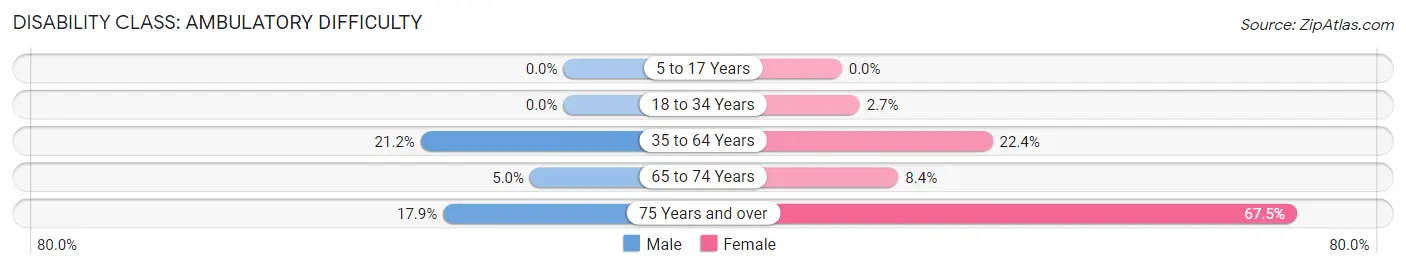
| Age Bracket | Male | Female |
| 5 to 17 Years | 0 (0.0%) | 0 (0.0%) |
| 18 to 34 Years | 0 (0.0%) | 10 (2.7%) |
| 35 to 64 Years | 160 (21.2%) | 206 (22.4%) |
| 65 to 74 Years | 9 (5.0%) | 29 (8.4%) |
| 75 Years and over | 5 (17.9%) | 77 (67.5%) |
Disability Class: Self-Care Difficulty
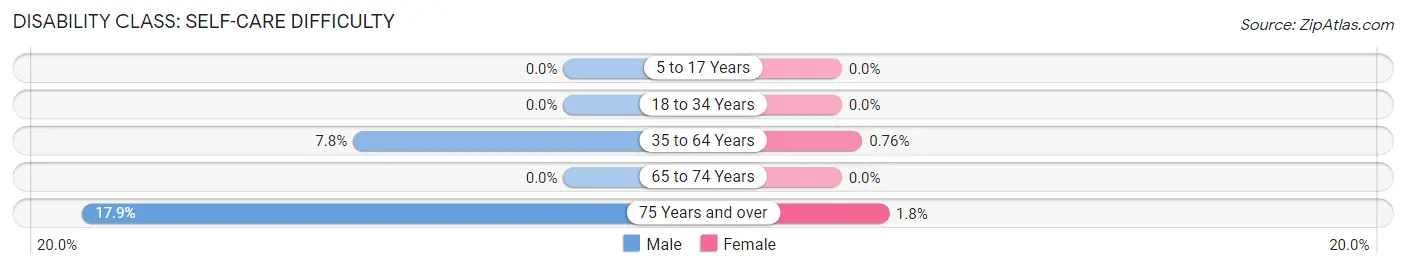
| Age Bracket | Male | Female |
| 5 to 17 Years | 0 (0.0%) | 0 (0.0%) |
| 18 to 34 Years | 0 (0.0%) | 0 (0.0%) |
| 35 to 64 Years | 59 (7.8%) | 7 (0.8%) |
| 65 to 74 Years | 0 (0.0%) | 0 (0.0%) |
| 75 Years and over | 5 (17.9%) | 2 (1.8%) |
Technology Access in Brownsville
Computing Device Access in Brownsville
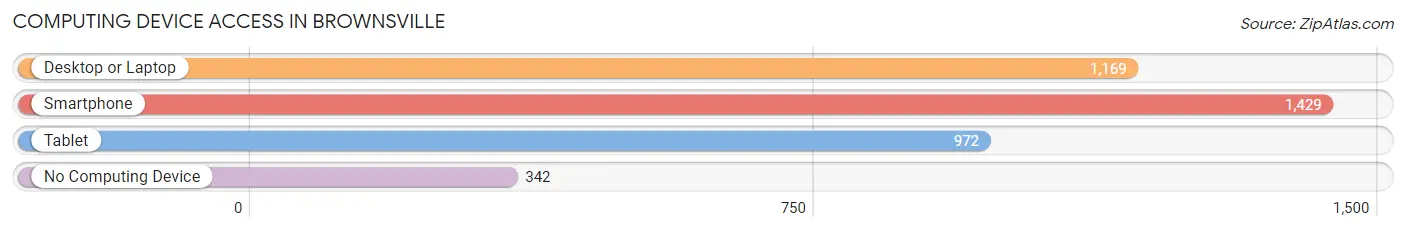
| Device Type | # Households | % Households |
| Desktop or Laptop | 1,169 | 65.4% |
| Smartphone | 1,429 | 79.9% |
| Tablet | 972 | 54.4% |
| No Computing Device | 342 | 19.1% |
| Total | 1,788 | 100.0% |
Internet Access in Brownsville
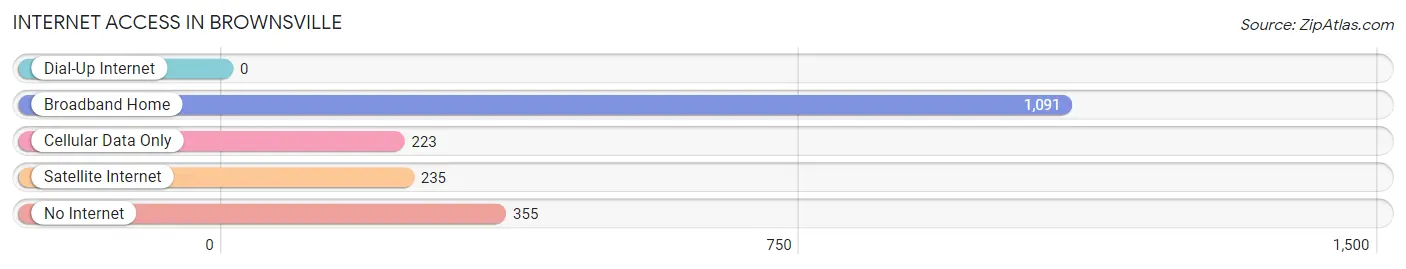
| Internet Type | # Households | % Households |
| Dial-Up Internet | 0 | 0.0% |
| Broadband Home | 1,091 | 61.0% |
| Cellular Data Only | 223 | 12.5% |
| Satellite Internet | 235 | 13.1% |
| No Internet | 355 | 19.9% |
| Total | 1,788 | 100.0% |
Brownsville Summary
Brownsville is a small town located in the state of Louisiana, United States. It is situated in the northern part of the state, in the parish of East Carroll. The town has a population of approximately 1,000 people and is located on the banks of the Mississippi River.
History
Brownsville was founded in 1837 by a group of settlers from the nearby town of Vicksburg. The town was named after the first settler, William Brown, who had purchased the land from the Choctaw Indians. The town was originally a trading post and a ferry crossing point for travelers crossing the Mississippi River.
In the late 1800s, Brownsville became a major port for the cotton industry. The town was also a major stop on the Mississippi River for steamboats and barges. The town was also home to a number of sawmills and lumberyards.
In the early 1900s, Brownsville was a major center for the oil industry. The town was home to several oil refineries and was a major supplier of oil to the United States Navy during World War II.
Geography
Brownsville is located in the northern part of Louisiana, in the parish of East Carroll. The town is situated on the banks of the Mississippi River, and is surrounded by the towns of Vicksburg, Natchez, and Ferriday. The town is located approximately 50 miles south of the state capital, Baton Rouge.
The town has a total area of 1.2 square miles, all of which is land. The town is located at an elevation of approximately 50 feet above sea level.
Economy
The economy of Brownsville is largely based on agriculture and tourism. The town is home to several farms, which produce a variety of crops, including cotton, corn, soybeans, and wheat. The town is also home to several tourist attractions, including the historic Brownsville Museum and the Natchez Trace Parkway.
The town is also home to several small businesses, including restaurants, retail stores, and service providers. The town is also home to a number of manufacturing companies, which produce a variety of products, including furniture, clothing, and electronics.
Demographics
As of the 2010 census, the population of Brownsville was 1,000 people. The town has a population density of 833 people per square mile. The racial makeup of the town is 79.2% White, 18.2% African American, 0.2% Native American, 0.2% Asian, 0.2% from other races, and 1.9% from two or more races.
The median household income in Brownsville is $30,000, and the median family income is $35,000. The town has a poverty rate of 22.2%. The town has a high school graduation rate of 79.2%. The town has a population of approximately 1,000 people, and the median age is 37.
Common Questions
What is the Total Population of Brownsville?
Total Population of Brownsville is 4,198.
What is the Total Male Population of Brownsville?
Total Male Population of Brownsville is 1,842.
What is the Total Female Population of Brownsville?
Total Female Population of Brownsville is 2,356.
What is the Ratio of Males per 100 Females in Brownsville?
There are 78.18 Males per 100 Females in Brownsville.
What is the Ratio of Females per 100 Males in Brownsville?
There are 127.90 Females per 100 Males in Brownsville.
What is the Median Population Age in Brownsville?
Median Population Age in Brownsville is 42.2 Years.
What is the Average Family Size in Brownsville
Average Family Size in Brownsville is 3.1 People.
What is the Average Household Size in Brownsville
Average Household Size in Brownsville is 2.3 People.
What is Per Capita Income in Brownsville?
Per Capita income in Brownsville is $18,774.
What is the Median Family Income in Brownsville?
Median Family Income in Brownsville is $48,415.
What is the Median Household income in Brownsville?
Median Household Income in Brownsville is $33,819.
What is Income or Wage Gap in Brownsville?
Income or Wage Gap in Brownsville is 34.6%.
Women in Brownsville earn 65.4 cents for every dollar earned by a man.
What is Family Income Deficit in Brownsville?
Family Income Deficit in Brownsville is $15,218.
Families that are below poverty line in Brownsville earn $15,218 less on average than the poverty threshold level.
What is Inequality or Gini Index in Brownsville?
Inequality or Gini Index in Brownsville is 0.38.
How Large is the Labor Force in Brownsville?
There are 1,894 People in the Labor Forcein in Brownsville.
What is the Percentage of People in the Labor Force in Brownsville?
59.8% of People are in the Labor Force in Brownsville.
What is the Unemployment Rate in Brownsville?
Unemployment Rate in Brownsville is 10.6%.