New Llano, LA
New Llano Map

New Llano Overview
2,290
TOTAL POPULATION
1,094
MALE POPULATION
1,196
FEMALE POPULATION
91.47
MALES / 100 FEMALES
109.32
FEMALES / 100 MALES
36.1
MEDIAN AGE
2.9
AVG FAMILY SIZE
2.3
AVG HOUSEHOLD SIZE
$25,036
PER CAPITA INCOME
$59,598
AVG FAMILY INCOME
$50,758
AVG HOUSEHOLD INCOME
30.8%
WAGE / INCOME GAP [ % ]
69.2¢/ $1
WAGE / INCOME GAP [ $ ]
0.40
INEQUALITY / GINI INDEX
1,117
LABOR FORCE [ PEOPLE ]
60.4%
PERCENT IN LABOR FORCE
15.6%
UNEMPLOYMENT RATE
New Llano Zip Codes
New Llano Area Codes
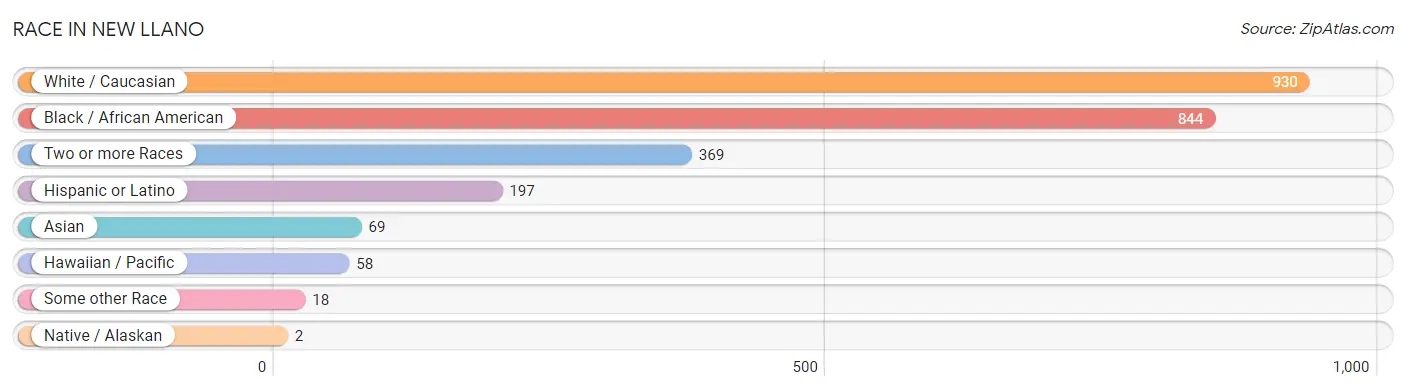
Race in New Llano
The most populous races in New Llano are White / Caucasian (930 | 40.6%), Black / African American (844 | 36.9%), and Two or more Races (369 | 16.1%).
| Race | # Population | % Population |
| Asian | 69 | 3.0% |
| Black / African American | 844 | 36.9% |
| Hawaiian / Pacific | 58 | 2.5% |
| Hispanic or Latino | 197 | 8.6% |
| Native / Alaskan | 2 | 0.1% |
| White / Caucasian | 930 | 40.6% |
| Two or more Races | 369 | 16.1% |
| Some other Race | 18 | 0.8% |
| Total | 2,290 | 100.0% |
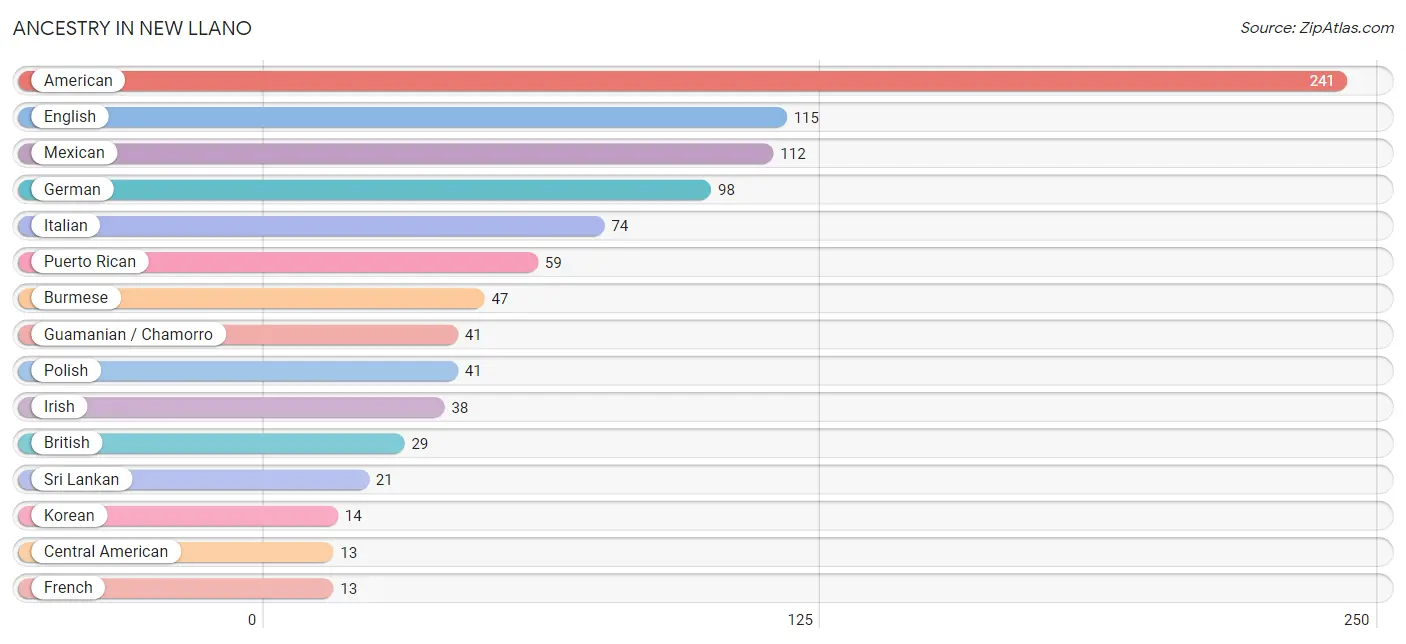
Ancestry in New Llano
The most populous ancestries reported in New Llano are American (241 | 10.5%), English (115 | 5.0%), Mexican (112 | 4.9%), German (98 | 4.3%), and Italian (74 | 3.2%), together accounting for 27.9% of all New Llano residents.
| Ancestry | # Population | % Population |
| Afghan | 3 | 0.1% |
| African | 3 | 0.1% |
| American | 241 | 10.5% |
| Arab | 6 | 0.3% |
| Bhutanese | 3 | 0.1% |
| British | 29 | 1.3% |
| Burmese | 47 | 2.1% |
| Central American | 13 | 0.6% |
| Choctaw | 8 | 0.4% |
| Cuban | 2 | 0.1% |
| Danish | 7 | 0.3% |
| Eastern European | 2 | 0.1% |
| English | 115 | 5.0% |
| European | 6 | 0.3% |
| Filipino | 3 | 0.1% |
| Finnish | 2 | 0.1% |
| French | 13 | 0.6% |
| French Canadian | 5 | 0.2% |
| German | 98 | 4.3% |
| Guamanian / Chamorro | 41 | 1.8% |
| Honduran | 12 | 0.5% |
| Indian (Asian) | 13 | 0.6% |
| Iraqi | 4 | 0.2% |
| Irish | 38 | 1.7% |
| Italian | 74 | 3.2% |
| Jamaican | 2 | 0.1% |
| Korean | 14 | 0.6% |
| Mexican | 112 | 4.9% |
| Mexican American Indian | 2 | 0.1% |
| Native Hawaiian | 10 | 0.4% |
| Norwegian | 8 | 0.4% |
| Pakistani | 5 | 0.2% |
| Panamanian | 1 | 0.0% |
| Polish | 41 | 1.8% |
| Puerto Rican | 59 | 2.6% |
| Russian | 3 | 0.1% |
| Scandinavian | 11 | 0.5% |
| Scotch-Irish | 13 | 0.6% |
| Scottish | 8 | 0.4% |
| Spaniard | 11 | 0.5% |
| Sri Lankan | 21 | 0.9% |
| Subsaharan African | 3 | 0.1% |
| Swedish | 3 | 0.1% |
| Ukrainian | 7 | 0.3% |
| Vietnamese | 2 | 0.1% |
| Welsh | 7 | 0.3% | View All 46 Rows |
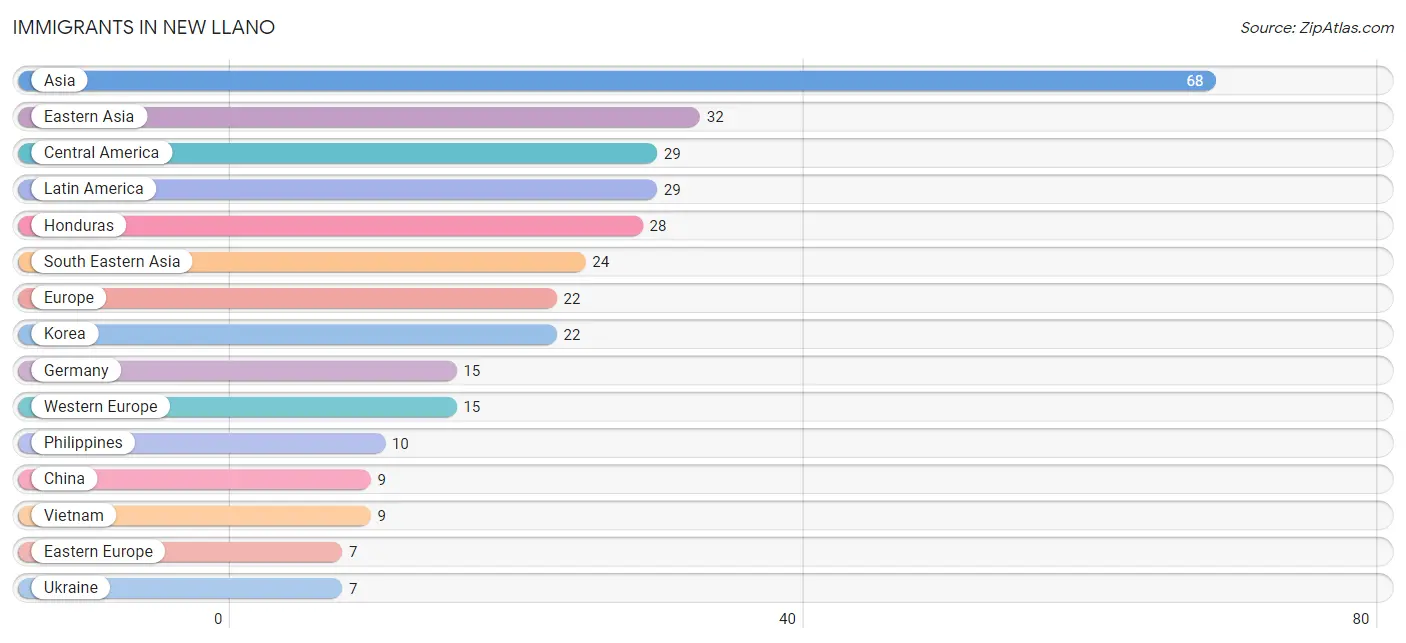
Immigrants in New Llano
The most numerous immigrant groups reported in New Llano came from Asia (68 | 3.0%), Eastern Asia (32 | 1.4%), Central America (29 | 1.3%), Latin America (29 | 1.3%), and Honduras (28 | 1.2%), together accounting for 8.1% of all New Llano residents.
| Immigration Origin | # Population | % Population |
| Afghanistan | 3 | 0.1% |
| Africa | 3 | 0.1% |
| Asia | 68 | 3.0% |
| Bangladesh | 2 | 0.1% |
| Central America | 29 | 1.3% |
| China | 9 | 0.4% |
| Eastern Asia | 32 | 1.4% |
| Eastern Europe | 7 | 0.3% |
| Europe | 22 | 1.0% |
| Germany | 15 | 0.7% |
| Honduras | 28 | 1.2% |
| Iraq | 4 | 0.2% |
| Japan | 1 | 0.0% |
| Korea | 22 | 1.0% |
| Kuwait | 2 | 0.1% |
| Latin America | 29 | 1.3% |
| Middle Africa | 3 | 0.1% |
| Nepal | 1 | 0.0% |
| Panama | 1 | 0.0% |
| Philippines | 10 | 0.4% |
| South Central Asia | 6 | 0.3% |
| South Eastern Asia | 24 | 1.1% |
| Taiwan | 3 | 0.1% |
| Thailand | 5 | 0.2% |
| Ukraine | 7 | 0.3% |
| Vietnam | 9 | 0.4% |
| Western Asia | 6 | 0.3% |
| Western Europe | 15 | 0.7% | View All 28 Rows |
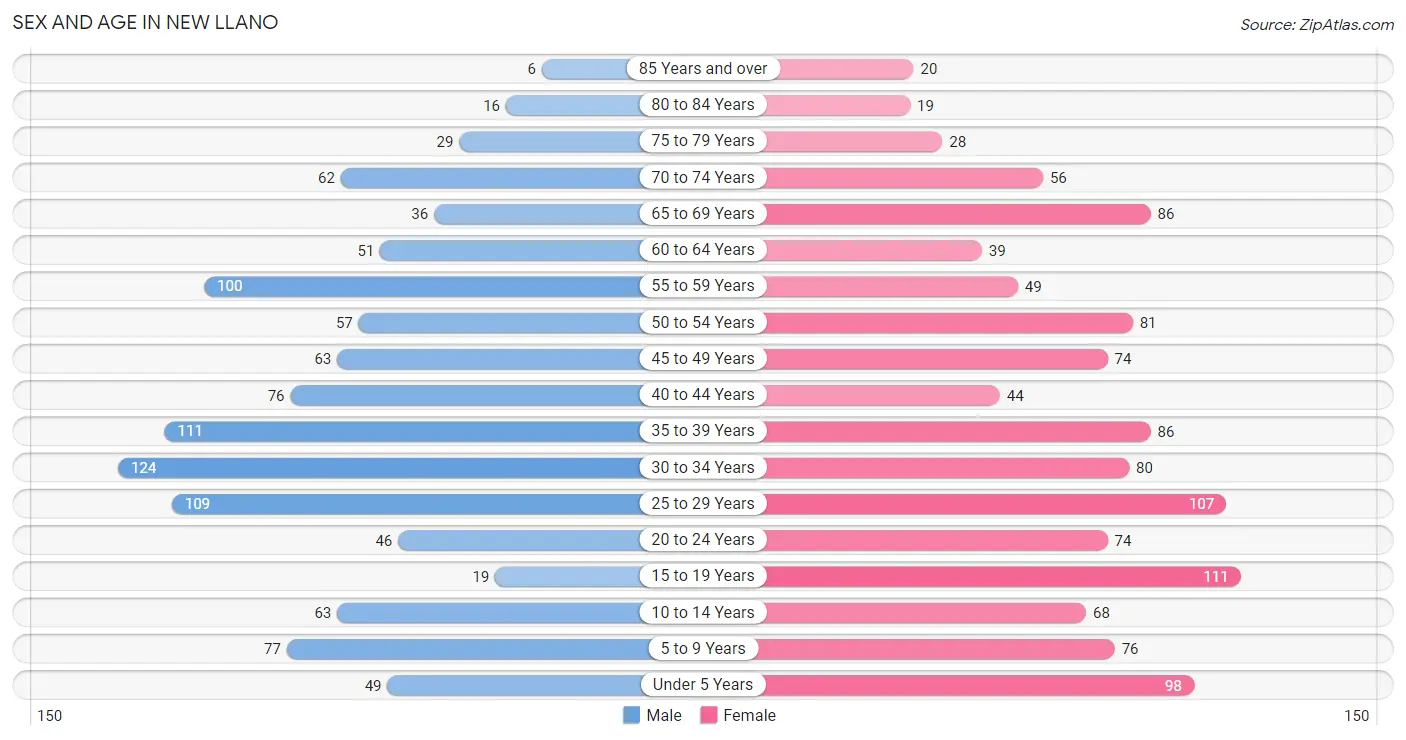
Sex and Age in New Llano
Sex and Age in New Llano
The most populous age groups in New Llano are 30 to 34 Years (124 | 11.3%) for men and 15 to 19 Years (111 | 9.3%) for women.
| Age Bracket | Male | Female |
| Under 5 Years | 49 (4.5%) | 98 (8.2%) |
| 5 to 9 Years | 77 (7.0%) | 76 (6.4%) |
| 10 to 14 Years | 63 (5.8%) | 68 (5.7%) |
| 15 to 19 Years | 19 (1.7%) | 111 (9.3%) |
| 20 to 24 Years | 46 (4.2%) | 74 (6.2%) |
| 25 to 29 Years | 109 (10.0%) | 107 (8.9%) |
| 30 to 34 Years | 124 (11.3%) | 80 (6.7%) |
| 35 to 39 Years | 111 (10.2%) | 86 (7.2%) |
| 40 to 44 Years | 76 (7.0%) | 44 (3.7%) |
| 45 to 49 Years | 63 (5.8%) | 74 (6.2%) |
| 50 to 54 Years | 57 (5.2%) | 81 (6.8%) |
| 55 to 59 Years | 100 (9.1%) | 49 (4.1%) |
| 60 to 64 Years | 51 (4.7%) | 39 (3.3%) |
| 65 to 69 Years | 36 (3.3%) | 86 (7.2%) |
| 70 to 74 Years | 62 (5.7%) | 56 (4.7%) |
| 75 to 79 Years | 29 (2.6%) | 28 (2.3%) |
| 80 to 84 Years | 16 (1.5%) | 19 (1.6%) |
| 85 Years and over | 6 (0.5%) | 20 (1.7%) |
| Total | 1,094 (100.0%) | 1,196 (100.0%) |
Families and Households in New Llano
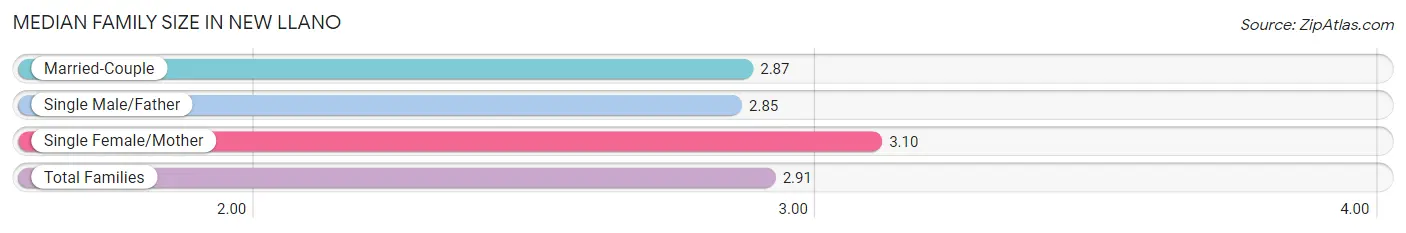
Median Family Size in New Llano
The median family size in New Llano is 2.91 persons per family, with single female/mother families (114 | 19.1%) accounting for the largest median family size of 3.1 persons per family. On the other hand, single male/father families (72 | 12.1%) represent the smallest median family size with 2.85 persons per family.
| Family Type | # Families | Family Size |
| Married-Couple | 411 (68.8%) | 2.87 |
| Single Male/Father | 72 (12.1%) | 2.85 |
| Single Female/Mother | 114 (19.1%) | 3.10 |
| Total Families | 597 (100.0%) | 2.91 |
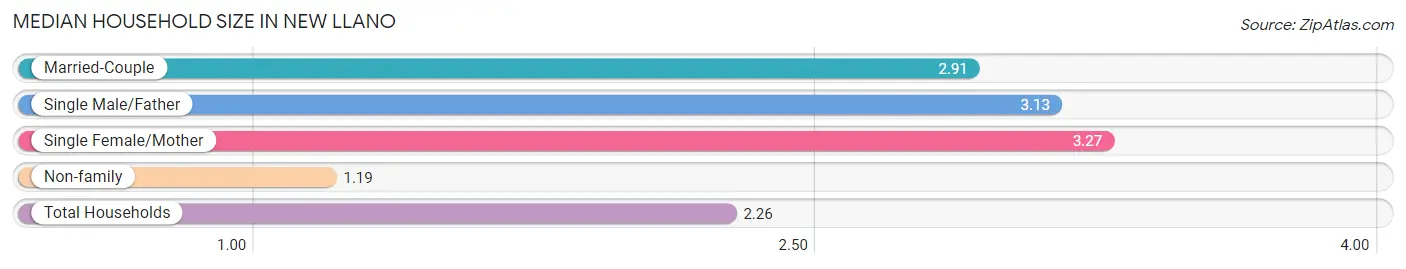
Median Household Size in New Llano
The median household size in New Llano is 2.26 persons per household, with single female/mother households (114 | 11.2%) accounting for the largest median household size of 3.27 persons per household. non-family households (417 | 41.1%) represent the smallest median household size with 1.19 persons per household.
| Household Type | # Households | Household Size |
| Married-Couple | 411 (40.5%) | 2.91 |
| Single Male/Father | 72 (7.1%) | 3.13 |
| Single Female/Mother | 114 (11.2%) | 3.27 |
| Non-family | 417 (41.1%) | 1.19 |
| Total Households | 1,014 (100.0%) | 2.26 |
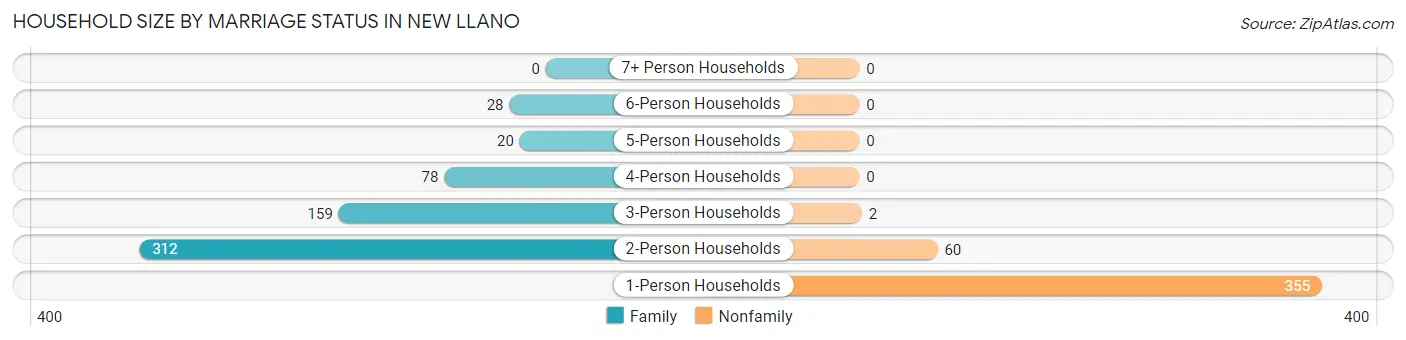
Household Size by Marriage Status in New Llano
Out of a total of 1,014 households in New Llano, 597 (58.9%) are family households, while 417 (41.1%) are nonfamily households. The most numerous type of family households are 2-person households, comprising 312, and the most common type of nonfamily households are 1-person households, comprising 355.
| Household Size | Family Households | Nonfamily Households |
| 1-Person Households | - | 355 (35.0%) |
| 2-Person Households | 312 (30.8%) | 60 (5.9%) |
| 3-Person Households | 159 (15.7%) | 2 (0.2%) |
| 4-Person Households | 78 (7.7%) | 0 (0.0%) |
| 5-Person Households | 20 (2.0%) | 0 (0.0%) |
| 6-Person Households | 28 (2.8%) | 0 (0.0%) |
| 7+ Person Households | 0 (0.0%) | 0 (0.0%) |
| Total | 597 (58.9%) | 417 (41.1%) |
Female Fertility in New Llano
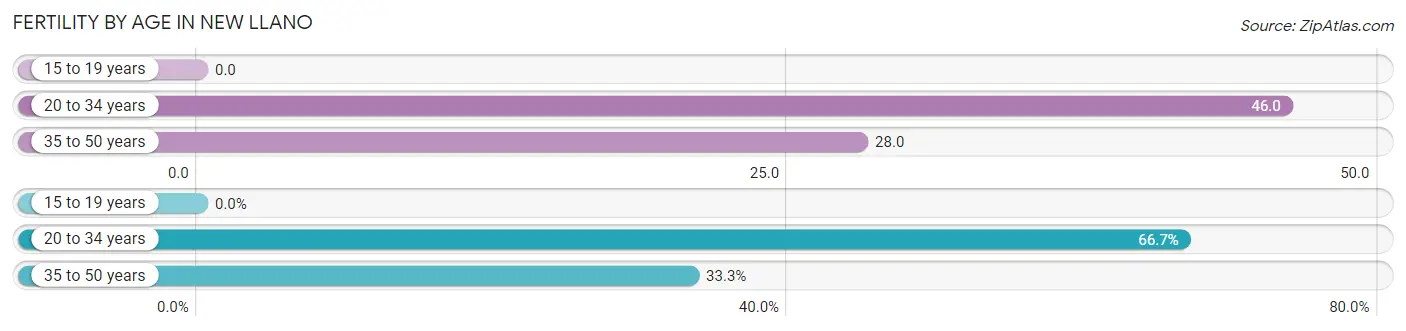
Fertility by Age in New Llano
Average fertility rate in New Llano is 31.0 births per 1,000 women. Women in the age bracket of 20 to 34 years have the highest fertility rate with 46.0 births per 1,000 women. Women in the age bracket of 20 to 34 years acount for 66.7% of all women with births.
| Age Bracket | Women with Births | Births / 1,000 Women |
| 15 to 19 years | 0 (0.0%) | 0.0 |
| 20 to 34 years | 12 (66.7%) | 46.0 |
| 35 to 50 years | 6 (33.3%) | 28.0 |
| Total | 18 (100.0%) | 31.0 |
Fertility by Age by Marriage Status in New Llano
33.3% of women with births (18) in New Llano are married. The highest percentage of unmarried women with births falls into 20 to 34 years age bracket with 100.0% of them unmarried at the time of birth, while the lowest percentage of unmarried women with births belong to 35 to 50 years age bracket with 0.0% of them unmarried.
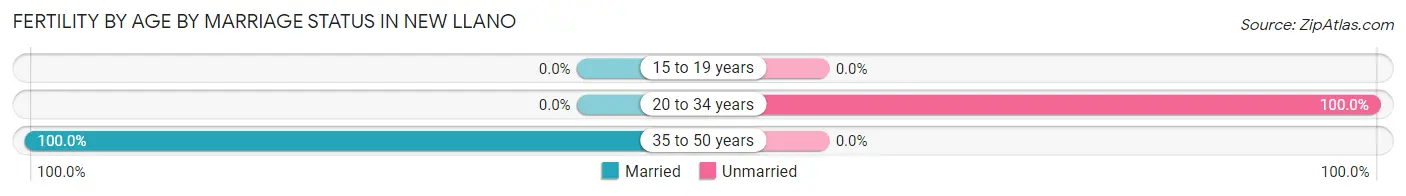
| Age Bracket | Married | Unmarried |
| 15 to 19 years | 0 (0.0%) | 0 (0.0%) |
| 20 to 34 years | 0 (0.0%) | 12 (100.0%) |
| 35 to 50 years | 6 (100.0%) | 0 (0.0%) |
| Total | 6 (33.3%) | 12 (66.7%) |
Fertility by Education in New Llano
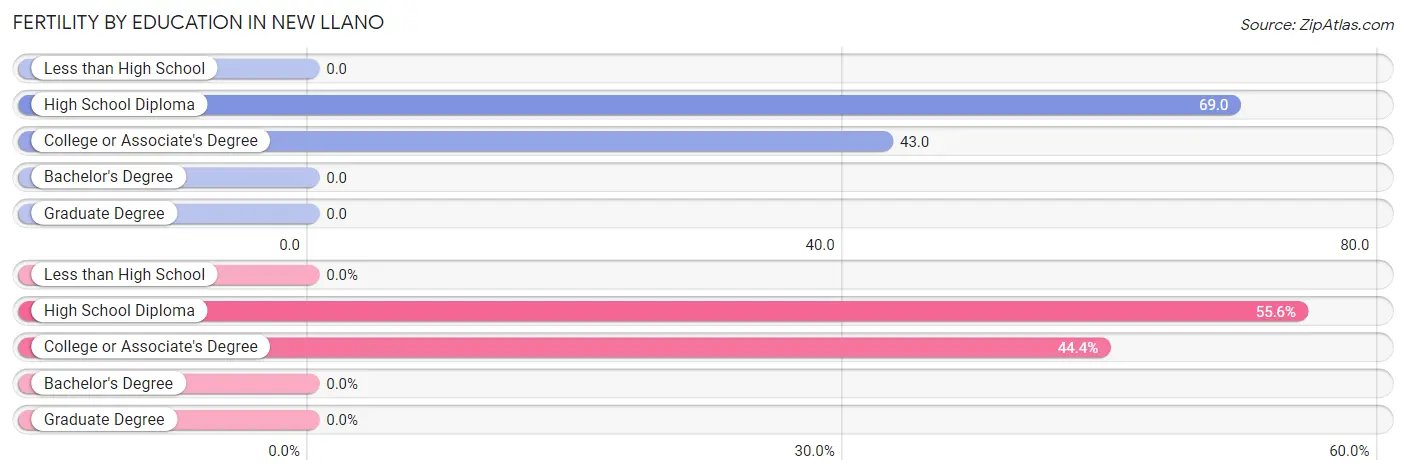
| Educational Attainment | Women with Births | Births / 1,000 Women |
| Less than High School | 0 (0.0%) | 0.0 |
| High School Diploma | 10 (55.6%) | 69.0 |
| College or Associate's Degree | 8 (44.4%) | 43.0 |
| Bachelor's Degree | 0 (0.0%) | 0.0 |
| Graduate Degree | 0 (0.0%) | 0.0 |
| Total | 18 (100.0%) | 31.0 |
Fertility by Education by Marriage Status in New Llano
66.7% of women with births in New Llano are unmarried. Women with the educational attainment of college or associate's degree are most likely to be married with 75.0% of them married at childbirth, while women with the educational attainment of high school diploma are least likely to be married with 100.0% of them unmarried at childbirth.
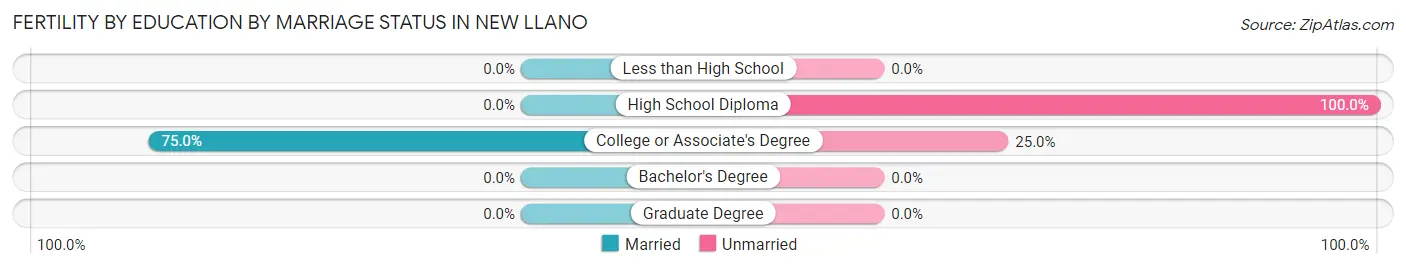
| Educational Attainment | Married | Unmarried |
| Less than High School | 0 (0.0%) | 0 (0.0%) |
| High School Diploma | 0 (0.0%) | 10 (100.0%) |
| College or Associate's Degree | 6 (75.0%) | 2 (25.0%) |
| Bachelor's Degree | 0 (0.0%) | 0 (0.0%) |
| Graduate Degree | 0 (0.0%) | 0 (0.0%) |
| Total | 6 (33.3%) | 12 (66.7%) |
Income in New Llano
Income Overview in New Llano
Per Capita Income in New Llano is $25,036, while median incomes of families and households are $59,598 and $50,758 respectively.
| Characteristic | Number | Measure |
| Per Capita Income | 2,290 | $25,036 |
| Median Family Income | 597 | $59,598 |
| Mean Family Income | 597 | $68,698 |
| Median Household Income | 1,014 | $50,758 |
| Mean Household Income | 1,014 | $57,696 |
| Income Deficit | 597 | $0 |
| Wage / Income Gap (%) | 2,290 | 30.77% |
| Wage / Income Gap ($) | 2,290 | 69.23¢ per $1 |
| Gini / Inequality Index | 2,290 | 0.40 |
Earnings by Sex in New Llano
Average Earnings in New Llano are $32,668, $37,917 for men and $26,250 for women, a difference of 30.8%.
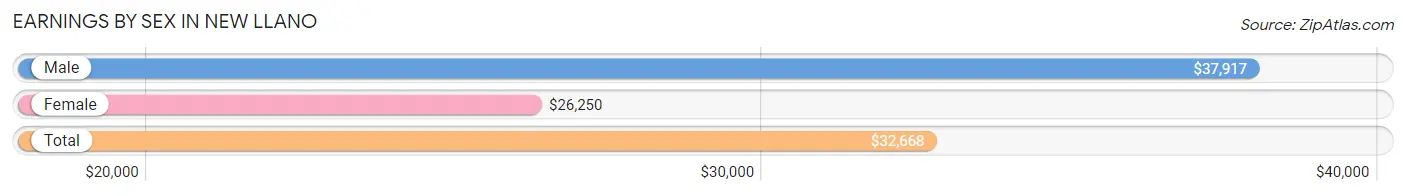
| Sex | Number | Average Earnings |
| Male | 590 (56.1%) | $37,917 |
| Female | 461 (43.9%) | $26,250 |
| Total | 1,051 (100.0%) | $32,668 |
Earnings by Sex by Income Bracket in New Llano
The most common earnings brackets in New Llano are $55,000 to $64,999 for men (83 | 14.1%) and $25,000 to $29,999 for women (57 | 12.4%).
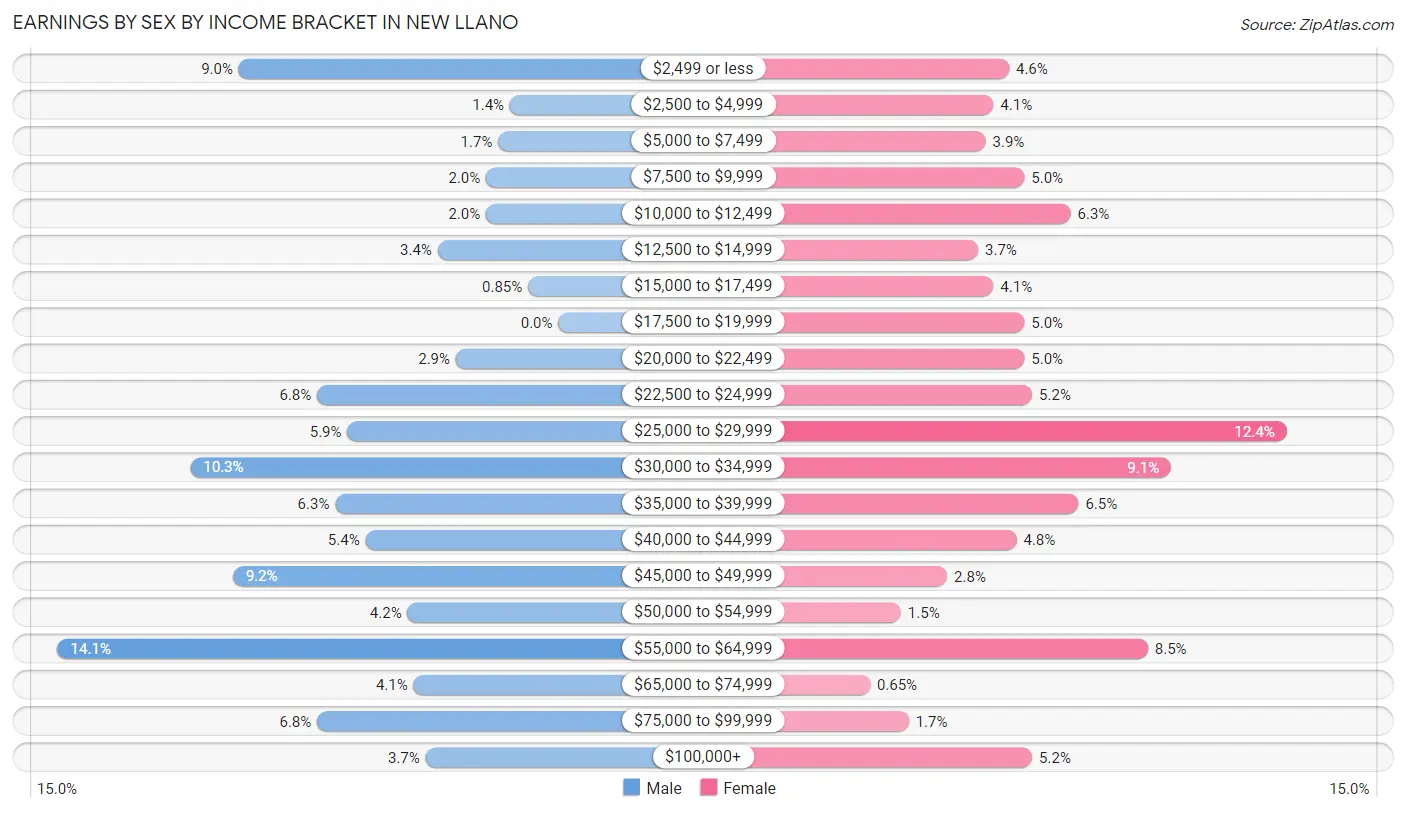
| Income | Male | Female |
| $2,499 or less | 53 (9.0%) | 21 (4.6%) |
| $2,500 to $4,999 | 8 (1.4%) | 19 (4.1%) |
| $5,000 to $7,499 | 10 (1.7%) | 18 (3.9%) |
| $7,500 to $9,999 | 12 (2.0%) | 23 (5.0%) |
| $10,000 to $12,499 | 12 (2.0%) | 29 (6.3%) |
| $12,500 to $14,999 | 20 (3.4%) | 17 (3.7%) |
| $15,000 to $17,499 | 5 (0.9%) | 19 (4.1%) |
| $17,500 to $19,999 | 0 (0.0%) | 23 (5.0%) |
| $20,000 to $22,499 | 17 (2.9%) | 23 (5.0%) |
| $22,500 to $24,999 | 40 (6.8%) | 24 (5.2%) |
| $25,000 to $29,999 | 35 (5.9%) | 57 (12.4%) |
| $30,000 to $34,999 | 61 (10.3%) | 42 (9.1%) |
| $35,000 to $39,999 | 37 (6.3%) | 30 (6.5%) |
| $40,000 to $44,999 | 32 (5.4%) | 22 (4.8%) |
| $45,000 to $49,999 | 54 (9.1%) | 13 (2.8%) |
| $50,000 to $54,999 | 25 (4.2%) | 7 (1.5%) |
| $55,000 to $64,999 | 83 (14.1%) | 39 (8.5%) |
| $65,000 to $74,999 | 24 (4.1%) | 3 (0.6%) |
| $75,000 to $99,999 | 40 (6.8%) | 8 (1.7%) |
| $100,000+ | 22 (3.7%) | 24 (5.2%) |
| Total | 590 (100.0%) | 461 (100.0%) |
Earnings by Sex by Educational Attainment in New Llano
Average earnings in New Llano are $39,514 for men and $28,167 for women, a difference of 28.7%. Men with an educational attainment of graduate degree enjoy the highest average annual earnings of $73,125, while those with less than high school education earn the least with $29,653. Women with an educational attainment of graduate degree earn the most with the average annual earnings of $57,500, while those with less than high school education have the smallest earnings of $11,635.
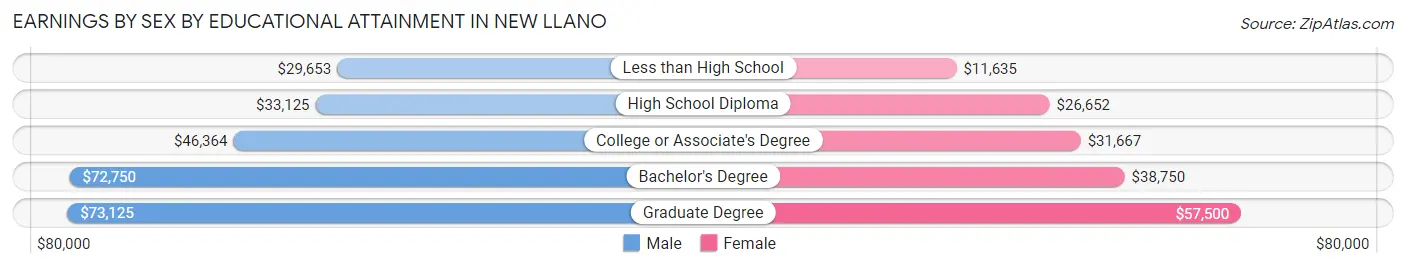
| Educational Attainment | Male Income | Female Income |
| Less than High School | $29,653 | $11,635 |
| High School Diploma | $33,125 | $26,652 |
| College or Associate's Degree | $46,364 | $31,667 |
| Bachelor's Degree | $72,750 | $38,750 |
| Graduate Degree | $73,125 | $57,500 |
| Total | $39,514 | $28,167 |
Family Income in New Llano
Family Income Brackets in New Llano
According to the New Llano family income data, there are 145 families falling into the $50,000 to $74,999 income range, which is the most common income bracket and makes up 24.3% of all families. Conversely, the $200,000+ income bracket is the least frequent group with only 7 families (1.2%) belonging to this category.
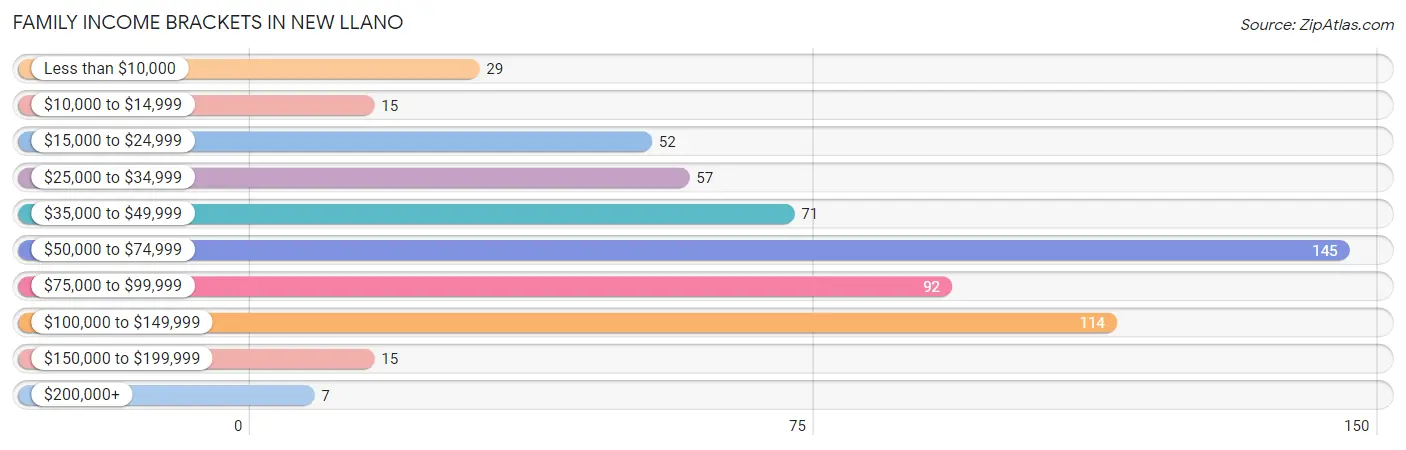
| Income Bracket | # Families | % Families |
| Less than $10,000 | 29 | 4.9% |
| $10,000 to $14,999 | 15 | 2.5% |
| $15,000 to $24,999 | 52 | 8.7% |
| $25,000 to $34,999 | 57 | 9.5% |
| $35,000 to $49,999 | 71 | 11.9% |
| $50,000 to $74,999 | 145 | 24.3% |
| $75,000 to $99,999 | 92 | 15.4% |
| $100,000 to $149,999 | 114 | 19.1% |
| $150,000 to $199,999 | 15 | 2.5% |
| $200,000+ | 7 | 1.2% |
Family Income by Famaliy Size in New Llano
5-person families (20 | 3.4%) account for the highest median family income in New Llano with $75,000 per family, while 2-person families (338 | 56.6%) have the highest median income of $33,500 per family member.
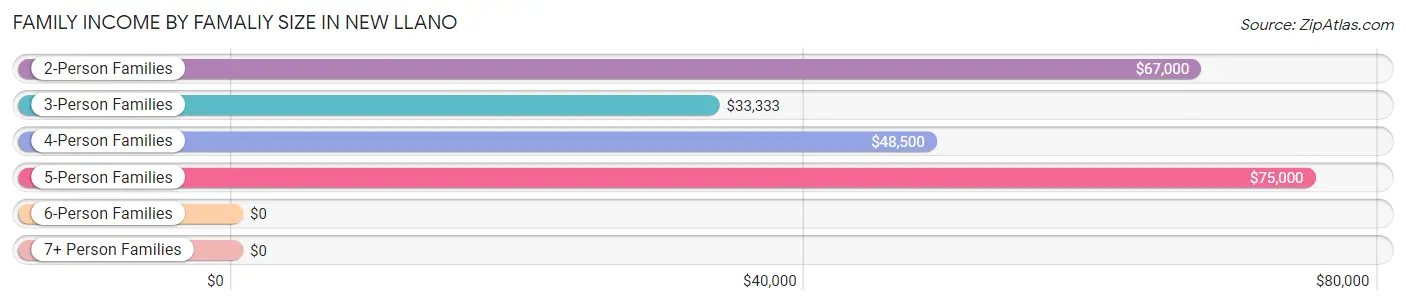
| Income Bracket | # Families | Median Income |
| 2-Person Families | 338 (56.6%) | $67,000 |
| 3-Person Families | 144 (24.1%) | $33,333 |
| 4-Person Families | 70 (11.7%) | $48,500 |
| 5-Person Families | 20 (3.4%) | $75,000 |
| 6-Person Families | 25 (4.2%) | $0 |
| 7+ Person Families | 0 (0.0%) | $0 |
| Total | 597 (100.0%) | $59,598 |
Family Income by Number of Earners in New Llano
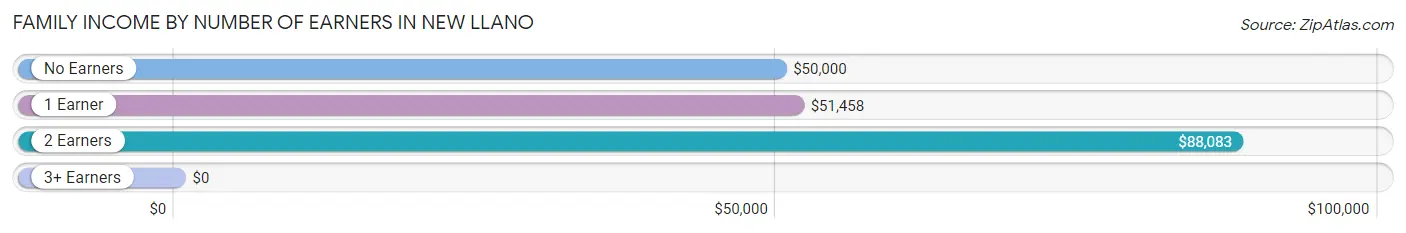
| Number of Earners | # Families | Median Income |
| No Earners | 88 (14.7%) | $50,000 |
| 1 Earner | 302 (50.6%) | $51,458 |
| 2 Earners | 203 (34.0%) | $88,083 |
| 3+ Earners | 4 (0.7%) | $0 |
| Total | 597 (100.0%) | $59,598 |
Household Income in New Llano
Household Income Brackets in New Llano
With 241 households falling in the category, the $50,000 to $74,999 income range is the most frequent in New Llano, accounting for 23.8% of all households. In contrast, only 10 households (1.0%) fall into the $200,000+ income bracket, making it the least populous group.
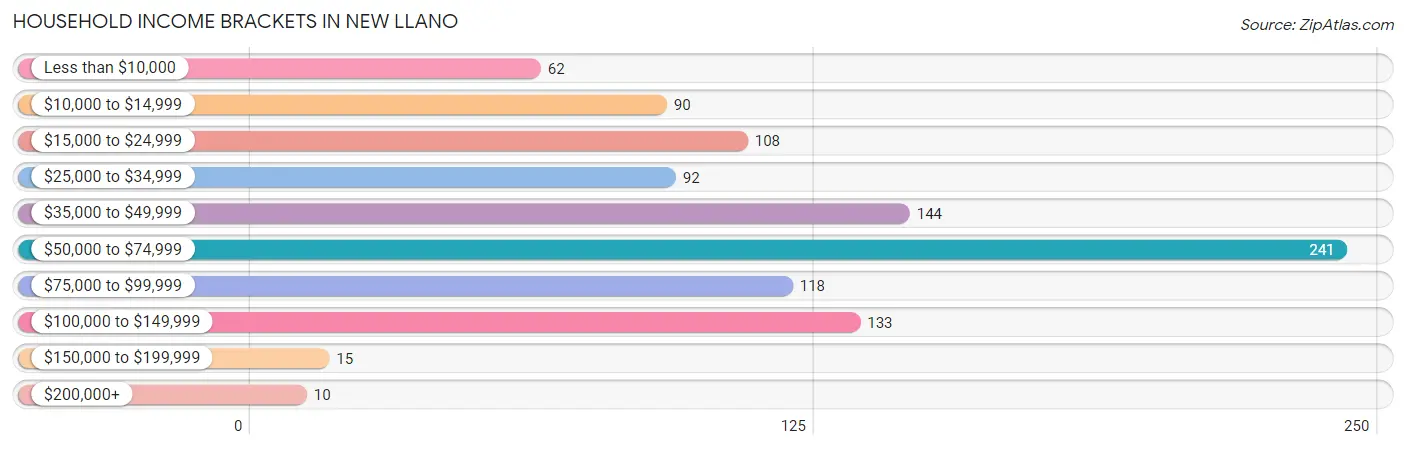
| Income Bracket | # Households | % Households |
| Less than $10,000 | 62 | 6.1% |
| $10,000 to $14,999 | 90 | 8.9% |
| $15,000 to $24,999 | 108 | 10.7% |
| $25,000 to $34,999 | 92 | 9.1% |
| $35,000 to $49,999 | 144 | 14.2% |
| $50,000 to $74,999 | 241 | 23.8% |
| $75,000 to $99,999 | 118 | 11.6% |
| $100,000 to $149,999 | 133 | 13.1% |
| $150,000 to $199,999 | 15 | 1.5% |
| $200,000+ | 10 | 1.0% |
Household Income by Householder Age in New Llano
The median household income in New Llano is $50,758, with the highest median household income of $56,292 found in the 25 to 44 years age bracket for the primary householder. A total of 427 households (42.1%) fall into this category. Meanwhile, the 65+ years age bracket for the primary householder has the lowest median household income of $36,875, with 221 households (21.8%) in this group.
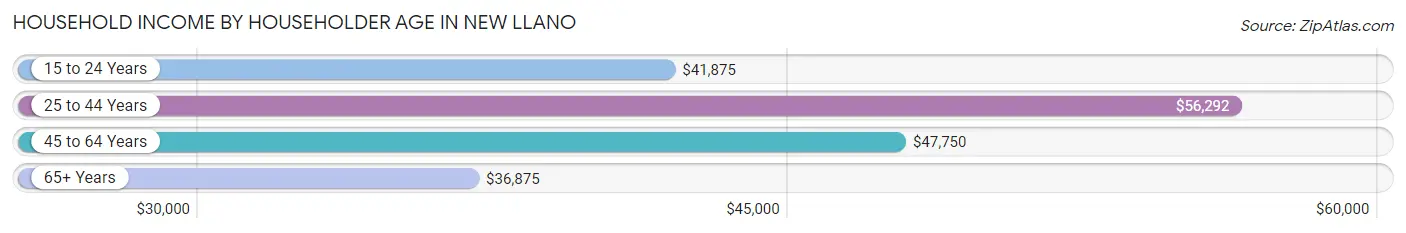
| Income Bracket | # Households | Median Income |
| 15 to 24 Years | 39 (3.8%) | $41,875 |
| 25 to 44 Years | 427 (42.1%) | $56,292 |
| 45 to 64 Years | 327 (32.3%) | $47,750 |
| 65+ Years | 221 (21.8%) | $36,875 |
| Total | 1,014 (100.0%) | $50,758 |
Poverty in New Llano
Income Below Poverty by Sex and Age in New Llano
With 14.1% poverty level for males and 23.1% for females among the residents of New Llano, 16 and 17 year old males and 5 year old females are the most vulnerable to poverty, with 2 males (66.7%) and 5 females (100.0%) in their respective age groups living below the poverty level.
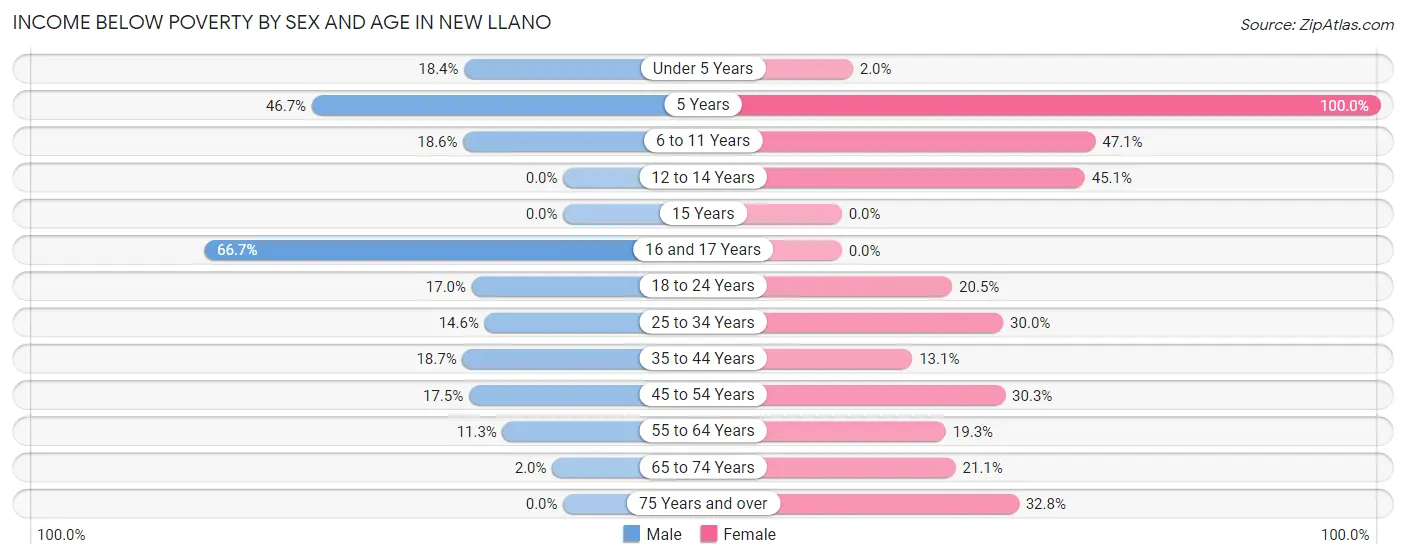
| Age Bracket | Male | Female |
| Under 5 Years | 9 (18.4%) | 2 (2.0%) |
| 5 Years | 7 (46.7%) | 5 (100.0%) |
| 6 to 11 Years | 18 (18.6%) | 40 (47.1%) |
| 12 to 14 Years | 0 (0.0%) | 23 (45.1%) |
| 15 Years | 0 (0.0%) | 0 (0.0%) |
| 16 and 17 Years | 2 (66.7%) | 0 (0.0%) |
| 18 to 24 Years | 9 (17.0%) | 17 (20.5%) |
| 25 to 34 Years | 34 (14.6%) | 56 (29.9%) |
| 35 to 44 Years | 35 (18.7%) | 17 (13.1%) |
| 45 to 54 Years | 21 (17.5%) | 47 (30.3%) |
| 55 to 64 Years | 17 (11.3%) | 17 (19.3%) |
| 65 to 74 Years | 2 (2.0%) | 30 (21.1%) |
| 75 Years and over | 0 (0.0%) | 22 (32.8%) |
| Total | 154 (14.1%) | 276 (23.1%) |
Income Above Poverty by Sex and Age in New Llano
According to the poverty statistics in New Llano, males aged 12 to 14 years and females aged 16 and 17 years are the age groups that are most secure financially, with 100.0% of males and 100.0% of females in these age groups living above the poverty line.
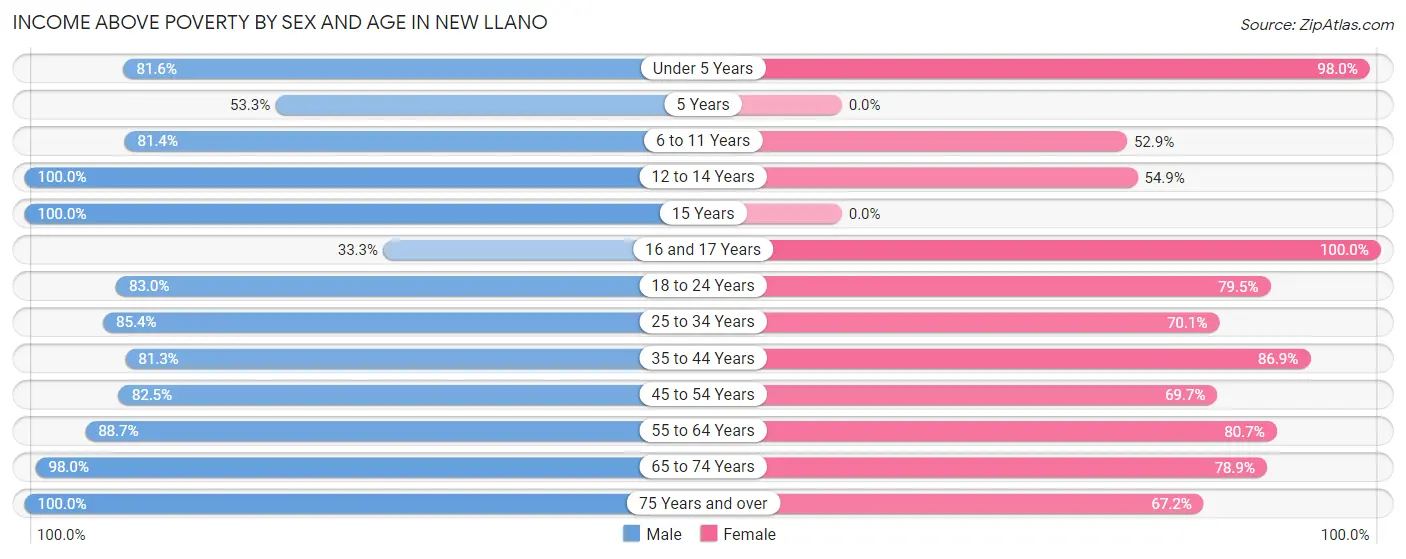
| Age Bracket | Male | Female |
| Under 5 Years | 40 (81.6%) | 96 (98.0%) |
| 5 Years | 8 (53.3%) | 0 (0.0%) |
| 6 to 11 Years | 79 (81.4%) | 45 (52.9%) |
| 12 to 14 Years | 28 (100.0%) | 28 (54.9%) |
| 15 Years | 9 (100.0%) | 0 (0.0%) |
| 16 and 17 Years | 1 (33.3%) | 102 (100.0%) |
| 18 to 24 Years | 44 (83.0%) | 66 (79.5%) |
| 25 to 34 Years | 199 (85.4%) | 131 (70.1%) |
| 35 to 44 Years | 152 (81.3%) | 113 (86.9%) |
| 45 to 54 Years | 99 (82.5%) | 108 (69.7%) |
| 55 to 64 Years | 134 (88.7%) | 71 (80.7%) |
| 65 to 74 Years | 96 (98.0%) | 112 (78.9%) |
| 75 Years and over | 51 (100.0%) | 45 (67.2%) |
| Total | 940 (85.9%) | 917 (76.9%) |
Income Below Poverty Among Married-Couple Families in New Llano
The poverty statistics for married-couple families in New Llano show that 9.2% or 38 of the total 411 families live below the poverty line. Families with 1 or 2 children have the highest poverty rate of 22.0%, comprising of 26 families. On the other hand, families with no children have the lowest poverty rate of 2.3%, which includes 6 families.

| Children | Above Poverty | Below Poverty |
| No Children | 252 (97.7%) | 6 (2.3%) |
| 1 or 2 Children | 92 (78.0%) | 26 (22.0%) |
| 3 or 4 Children | 29 (82.9%) | 6 (17.1%) |
| 5 or more Children | 0 (0.0%) | 0 (0.0%) |
| Total | 373 (90.7%) | 38 (9.2%) |
Income Below Poverty Among Single-Parent Households in New Llano
According to the poverty data in New Llano, 1.4% or 1 single-father households and 35.1% or 40 single-mother households are living below the poverty line. Among single-father households, those with no children have the highest poverty rate, with 1 households (5.6%) experiencing poverty. Likewise, among single-mother households, those with 3 or 4 children have the highest poverty rate, with 10 households (100.0%) falling below the poverty line.
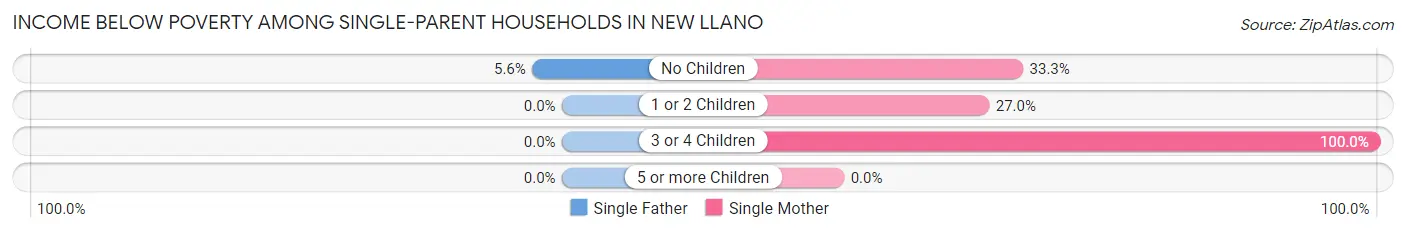
| Children | Single Father | Single Mother |
| No Children | 1 (5.6%) | 10 (33.3%) |
| 1 or 2 Children | 0 (0.0%) | 20 (27.0%) |
| 3 or 4 Children | 0 (0.0%) | 10 (100.0%) |
| 5 or more Children | 0 (0.0%) | 0 (0.0%) |
| Total | 1 (1.4%) | 40 (35.1%) |
Income Below Poverty Among Married-Couple vs Single-Parent Households in New Llano
The poverty data for New Llano shows that 38 of the married-couple family households (9.2%) and 41 of the single-parent households (22.0%) are living below the poverty level. Within the married-couple family households, those with 1 or 2 children have the highest poverty rate, with 26 households (22.0%) falling below the poverty line. Among the single-parent households, those with 3 or 4 children have the highest poverty rate, with 10 household (100.0%) living below poverty.
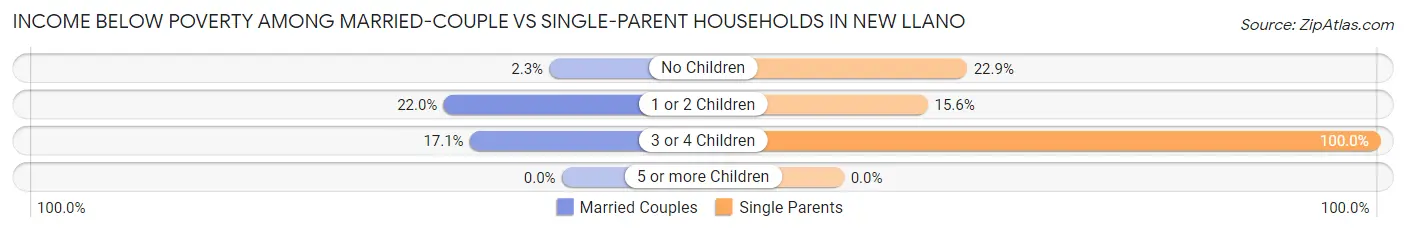
| Children | Married-Couple Families | Single-Parent Households |
| No Children | 6 (2.3%) | 11 (22.9%) |
| 1 or 2 Children | 26 (22.0%) | 20 (15.6%) |
| 3 or 4 Children | 6 (17.1%) | 10 (100.0%) |
| 5 or more Children | 0 (0.0%) | 0 (0.0%) |
| Total | 38 (9.2%) | 41 (22.0%) |
Employment Characteristics in New Llano
Employment by Class of Employer in New Llano
Among the 944 employed individuals in New Llano, private company employees (511 | 54.1%), federal government employees (242 | 25.6%), and self-employed (not incorporated) (66 | 7.0%) make up the most common classes of employment.
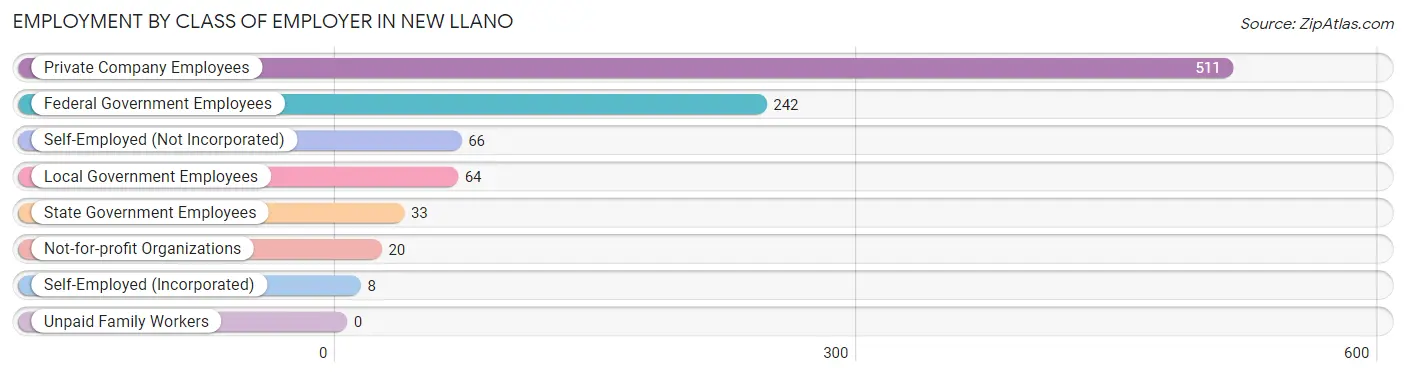
| Employer Class | # Employees | % Employees |
| Private Company Employees | 511 | 54.1% |
| Self-Employed (Incorporated) | 8 | 0.9% |
| Self-Employed (Not Incorporated) | 66 | 7.0% |
| Not-for-profit Organizations | 20 | 2.1% |
| Local Government Employees | 64 | 6.8% |
| State Government Employees | 33 | 3.5% |
| Federal Government Employees | 242 | 25.6% |
| Unpaid Family Workers | 0 | 0.0% |
| Total | 944 | 100.0% |
Employment Status by Age in New Llano
According to the labor force statistics for New Llano, out of the total population over 16 years of age (1,850), 60.4% or 1,117 individuals are in the labor force, with 15.6% or 174 of them unemployed. The age group with the highest labor force participation rate is 20 to 24 years, with 93.3% or 112 individuals in the labor force. Within the labor force, the 16 to 19 years age range has the highest percentage of unemployed individuals, with 83.3% or 85 of them being unemployed.
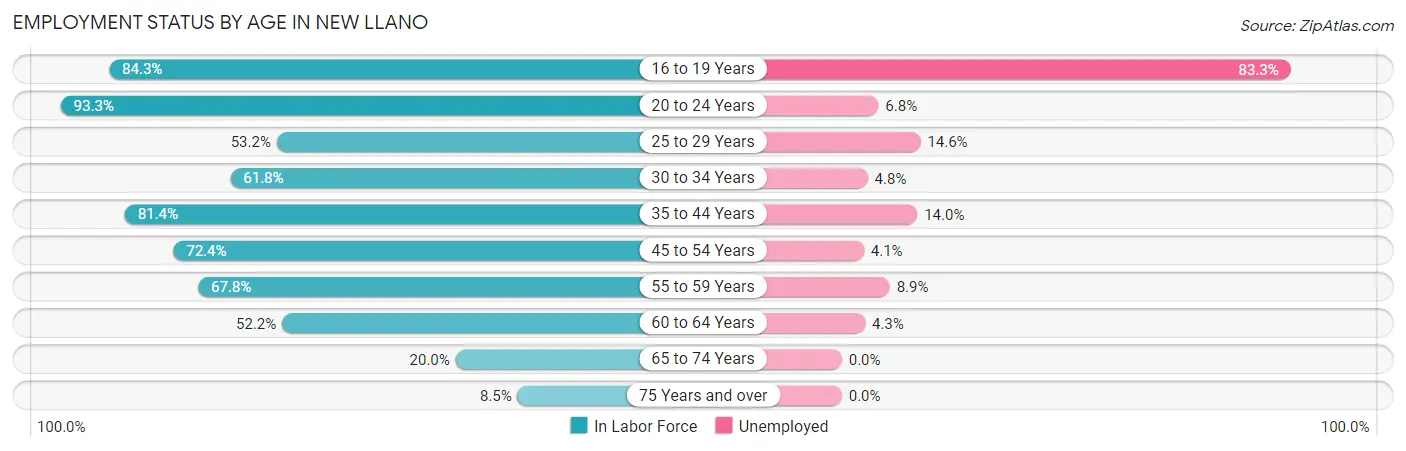
| Age Bracket | In Labor Force | Unemployed |
| 16 to 19 Years | 102 (84.3%) | 85 (83.3%) |
| 20 to 24 Years | 112 (93.3%) | 8 (6.8%) |
| 25 to 29 Years | 115 (53.2%) | 17 (14.6%) |
| 30 to 34 Years | 126 (61.8%) | 6 (4.8%) |
| 35 to 44 Years | 258 (81.4%) | 36 (14.0%) |
| 45 to 54 Years | 199 (72.4%) | 8 (4.1%) |
| 55 to 59 Years | 101 (67.8%) | 9 (8.9%) |
| 60 to 64 Years | 47 (52.2%) | 2 (4.3%) |
| 65 to 74 Years | 48 (20.0%) | 0 (0.0%) |
| 75 Years and over | 10 (8.5%) | 0 (0.0%) |
| Total | 1,117 (60.4%) | 174 (15.6%) |
Employment Status by Educational Attainment in New Llano
According to labor force statistics for New Llano, 67.6% of individuals (846) out of the total population between 25 and 64 years of age (1,251) are in the labor force, with 8.8% or 74 of them being unemployed. The group with the highest labor force participation rate are those with the educational attainment of college / associate degree, with 78.2% or 370 individuals in the labor force. Within the labor force, individuals with less than high school education have the highest percentage of unemployment, with 16.5% or 15 of them being unemployed.
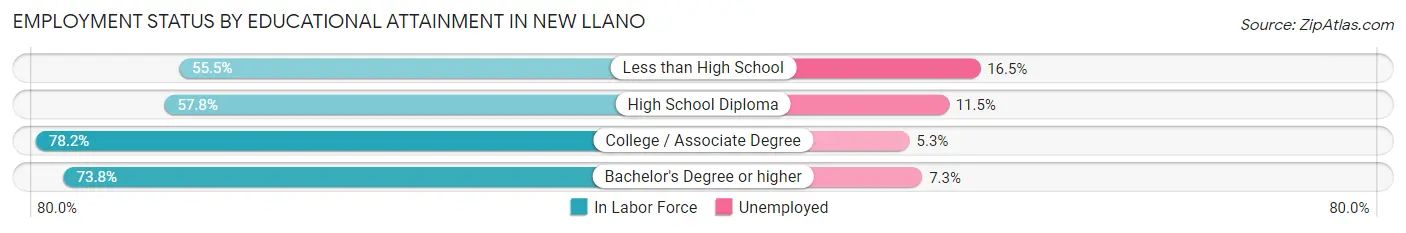
| Educational Attainment | In Labor Force | Unemployed |
| Less than High School | 91 (55.5%) | 27 (16.5%) |
| High School Diploma | 247 (57.8%) | 49 (11.5%) |
| College / Associate Degree | 370 (78.2%) | 25 (5.3%) |
| Bachelor's Degree or higher | 138 (73.8%) | 14 (7.3%) |
| Total | 846 (67.6%) | 110 (8.8%) |
Employment Occupations by Sex in New Llano
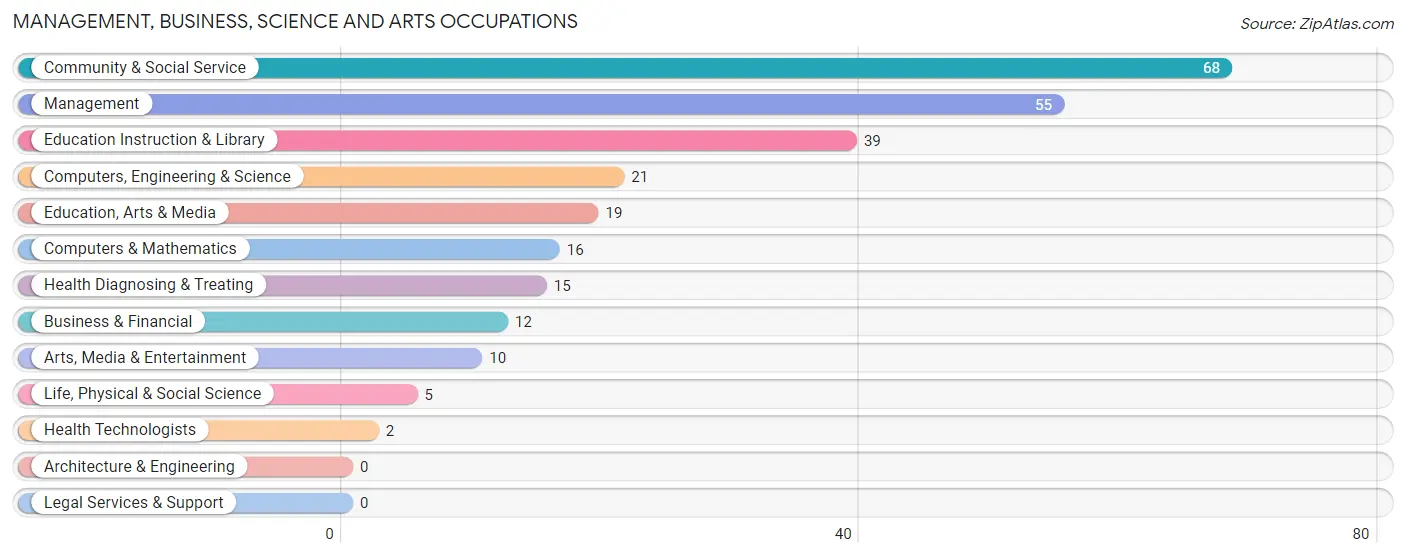
Management, Business, Science and Arts Occupations
The most common Management, Business, Science and Arts occupations in New Llano are Community & Social Service (68 | 7.9%), Management (55 | 6.4%), Education Instruction & Library (39 | 4.5%), Computers, Engineering & Science (21 | 2.4%), and Education, Arts & Media (19 | 2.2%).
Management, Business, Science and Arts Occupations by Sex
Within the Management, Business, Science and Arts occupations in New Llano, the most male-oriented occupations are Life, Physical & Social Science (100.0%), Arts, Media & Entertainment (90.0%), and Computers, Engineering & Science (66.7%), while the most female-oriented occupations are Health Technologists (100.0%), Health Diagnosing & Treating (93.3%), and Management (58.2%).
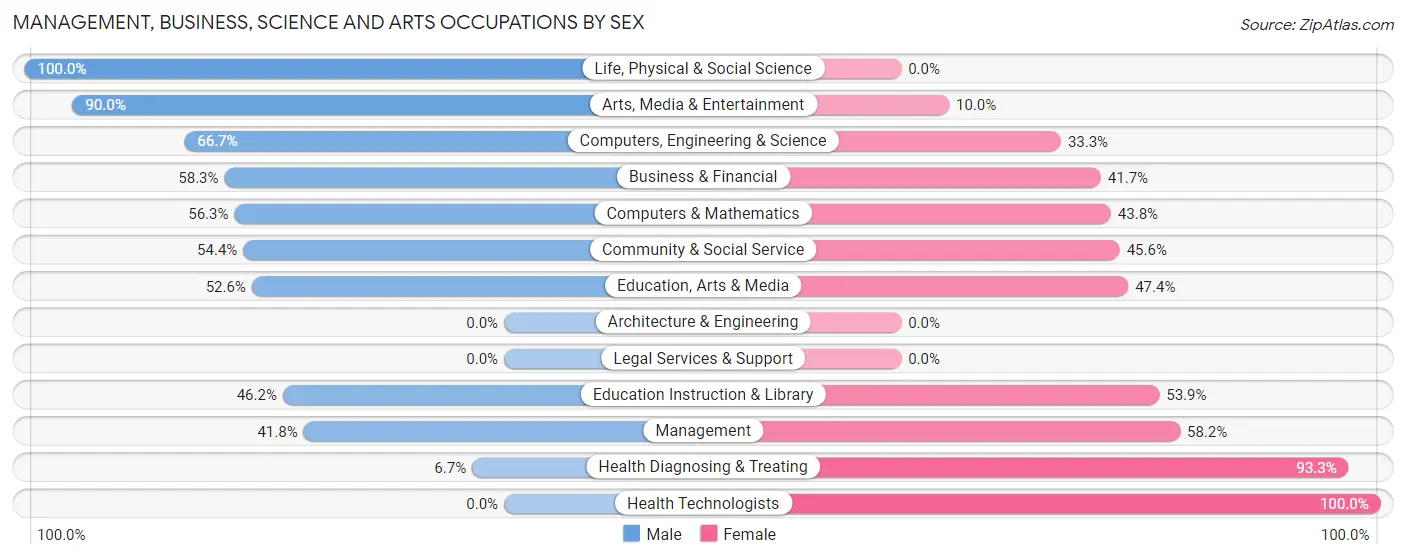
| Occupation | Male | Female |
| Management | 23 (41.8%) | 32 (58.2%) |
| Business & Financial | 7 (58.3%) | 5 (41.7%) |
| Computers, Engineering & Science | 14 (66.7%) | 7 (33.3%) |
| Computers & Mathematics | 9 (56.2%) | 7 (43.8%) |
| Architecture & Engineering | 0 (0.0%) | 0 (0.0%) |
| Life, Physical & Social Science | 5 (100.0%) | 0 (0.0%) |
| Community & Social Service | 37 (54.4%) | 31 (45.6%) |
| Education, Arts & Media | 10 (52.6%) | 9 (47.4%) |
| Legal Services & Support | 0 (0.0%) | 0 (0.0%) |
| Education Instruction & Library | 18 (46.2%) | 21 (53.8%) |
| Arts, Media & Entertainment | 9 (90.0%) | 1 (10.0%) |
| Health Diagnosing & Treating | 1 (6.7%) | 14 (93.3%) |
| Health Technologists | 0 (0.0%) | 2 (100.0%) |
| Total (Category) | 82 (47.9%) | 89 (52.0%) |
| Total (Overall) | 451 (52.4%) | 410 (47.6%) |
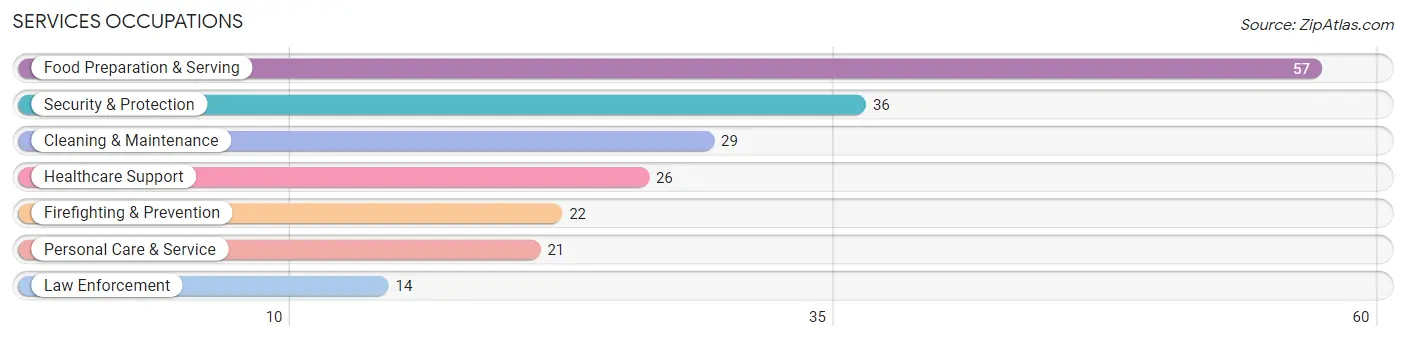
Services Occupations
The most common Services occupations in New Llano are Food Preparation & Serving (57 | 6.6%), Security & Protection (36 | 4.2%), Cleaning & Maintenance (29 | 3.4%), Healthcare Support (26 | 3.0%), and Firefighting & Prevention (22 | 2.6%).
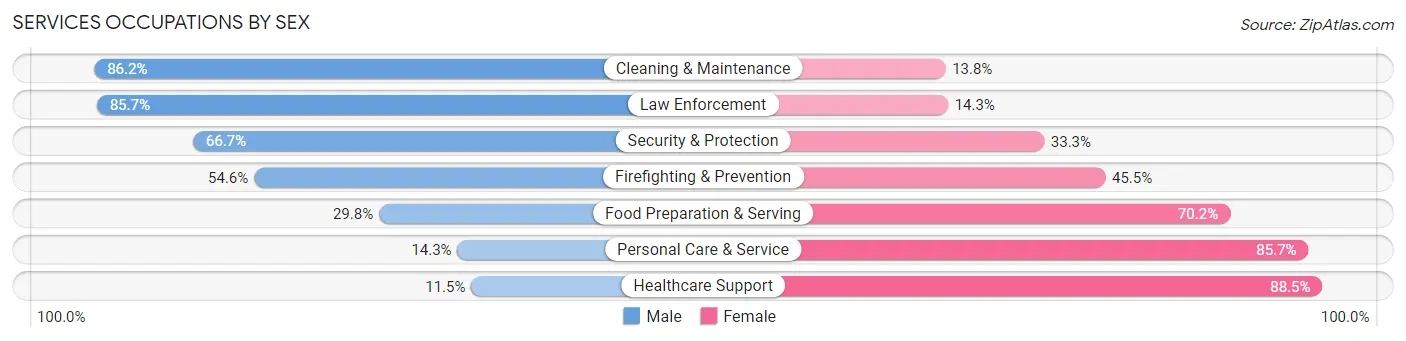
Services Occupations by Sex
Within the Services occupations in New Llano, the most male-oriented occupations are Cleaning & Maintenance (86.2%), Law Enforcement (85.7%), and Security & Protection (66.7%), while the most female-oriented occupations are Healthcare Support (88.5%), Personal Care & Service (85.7%), and Food Preparation & Serving (70.2%).
| Occupation | Male | Female |
| Healthcare Support | 3 (11.5%) | 23 (88.5%) |
| Security & Protection | 24 (66.7%) | 12 (33.3%) |
| Firefighting & Prevention | 12 (54.5%) | 10 (45.5%) |
| Law Enforcement | 12 (85.7%) | 2 (14.3%) |
| Food Preparation & Serving | 17 (29.8%) | 40 (70.2%) |
| Cleaning & Maintenance | 25 (86.2%) | 4 (13.8%) |
| Personal Care & Service | 3 (14.3%) | 18 (85.7%) |
| Total (Category) | 72 (42.6%) | 97 (57.4%) |
| Total (Overall) | 451 (52.4%) | 410 (47.6%) |
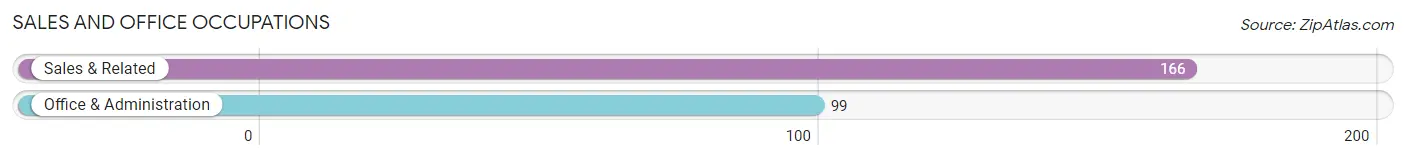
Sales and Office Occupations
The most common Sales and Office occupations in New Llano are Sales & Related (166 | 19.3%), and Office & Administration (99 | 11.5%).
Sales and Office Occupations by Sex

| Occupation | Male | Female |
| Sales & Related | 60 (36.1%) | 106 (63.9%) |
| Office & Administration | 18 (18.2%) | 81 (81.8%) |
| Total (Category) | 78 (29.4%) | 187 (70.6%) |
| Total (Overall) | 451 (52.4%) | 410 (47.6%) |
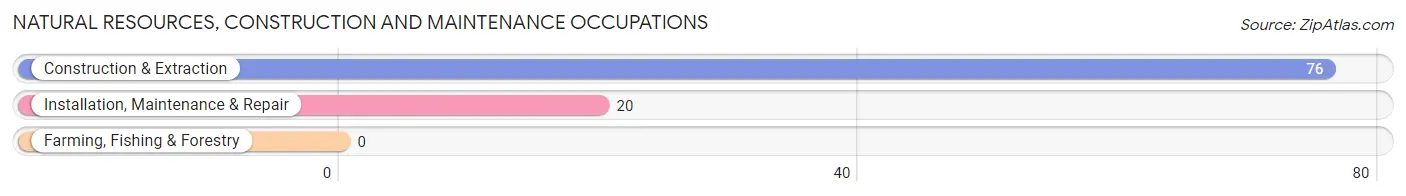
Natural Resources, Construction and Maintenance Occupations
The most common Natural Resources, Construction and Maintenance occupations in New Llano are Construction & Extraction (76 | 8.8%), and Installation, Maintenance & Repair (20 | 2.3%).
Natural Resources, Construction and Maintenance Occupations by Sex
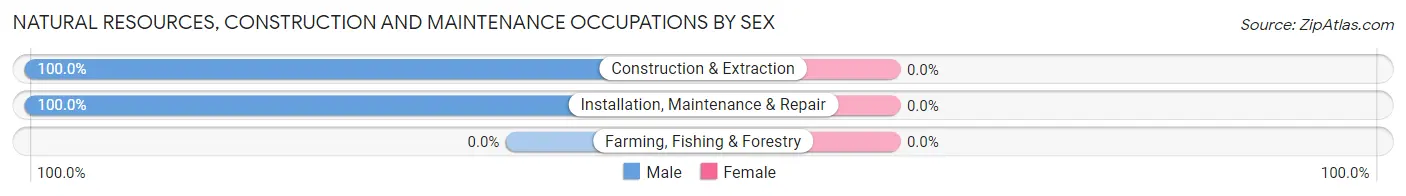
| Occupation | Male | Female |
| Farming, Fishing & Forestry | 0 (0.0%) | 0 (0.0%) |
| Construction & Extraction | 76 (100.0%) | 0 (0.0%) |
| Installation, Maintenance & Repair | 20 (100.0%) | 0 (0.0%) |
| Total (Category) | 96 (100.0%) | 0 (0.0%) |
| Total (Overall) | 451 (52.4%) | 410 (47.6%) |
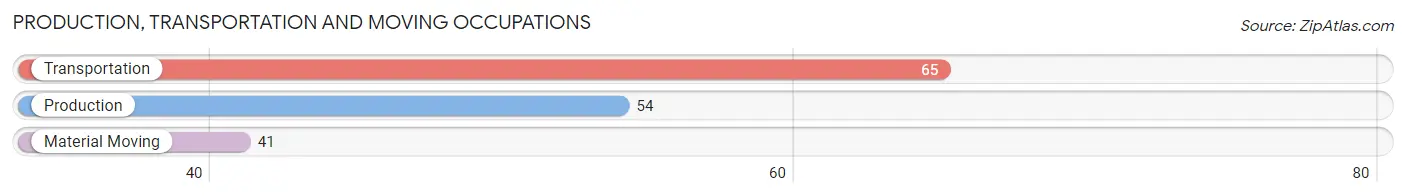
Production, Transportation and Moving Occupations
The most common Production, Transportation and Moving occupations in New Llano are Transportation (65 | 7.5%), Production (54 | 6.3%), and Material Moving (41 | 4.8%).
Production, Transportation and Moving Occupations by Sex
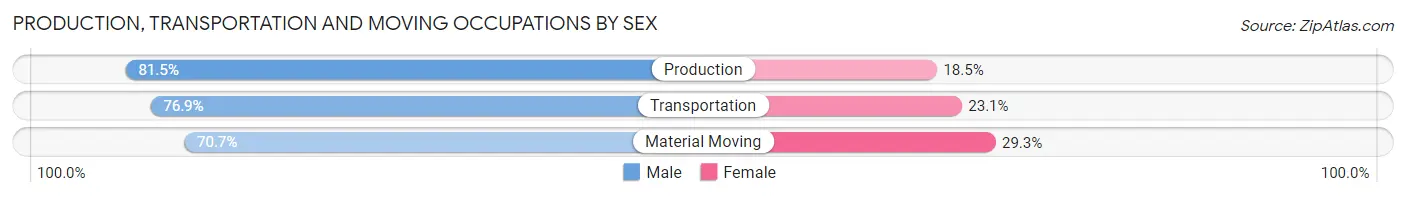
| Occupation | Male | Female |
| Production | 44 (81.5%) | 10 (18.5%) |
| Transportation | 50 (76.9%) | 15 (23.1%) |
| Material Moving | 29 (70.7%) | 12 (29.3%) |
| Total (Category) | 123 (76.9%) | 37 (23.1%) |
| Total (Overall) | 451 (52.4%) | 410 (47.6%) |
Employment Industries by Sex in New Llano
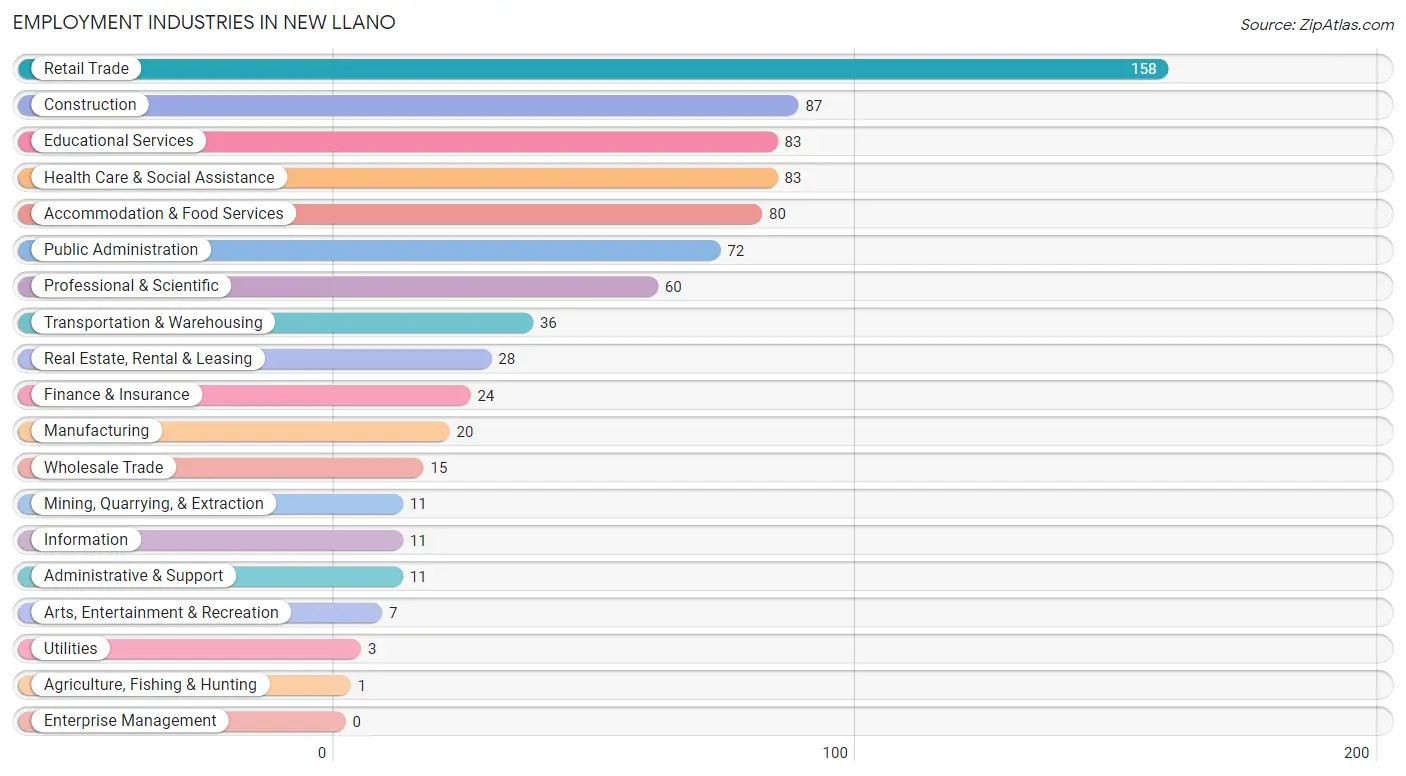
Employment Industries in New Llano
The major employment industries in New Llano include Retail Trade (158 | 18.3%), Construction (87 | 10.1%), Educational Services (83 | 9.6%), Health Care & Social Assistance (83 | 9.6%), and Accommodation & Food Services (80 | 9.3%).
Employment Industries by Sex in New Llano
The New Llano industries that see more men than women are Construction (100.0%), Utilities (100.0%), and Transportation & Warehousing (83.3%), whereas the industries that tend to have a higher number of women are Agriculture, Fishing & Hunting (100.0%), Finance & Insurance (100.0%), and Arts, Entertainment & Recreation (100.0%).
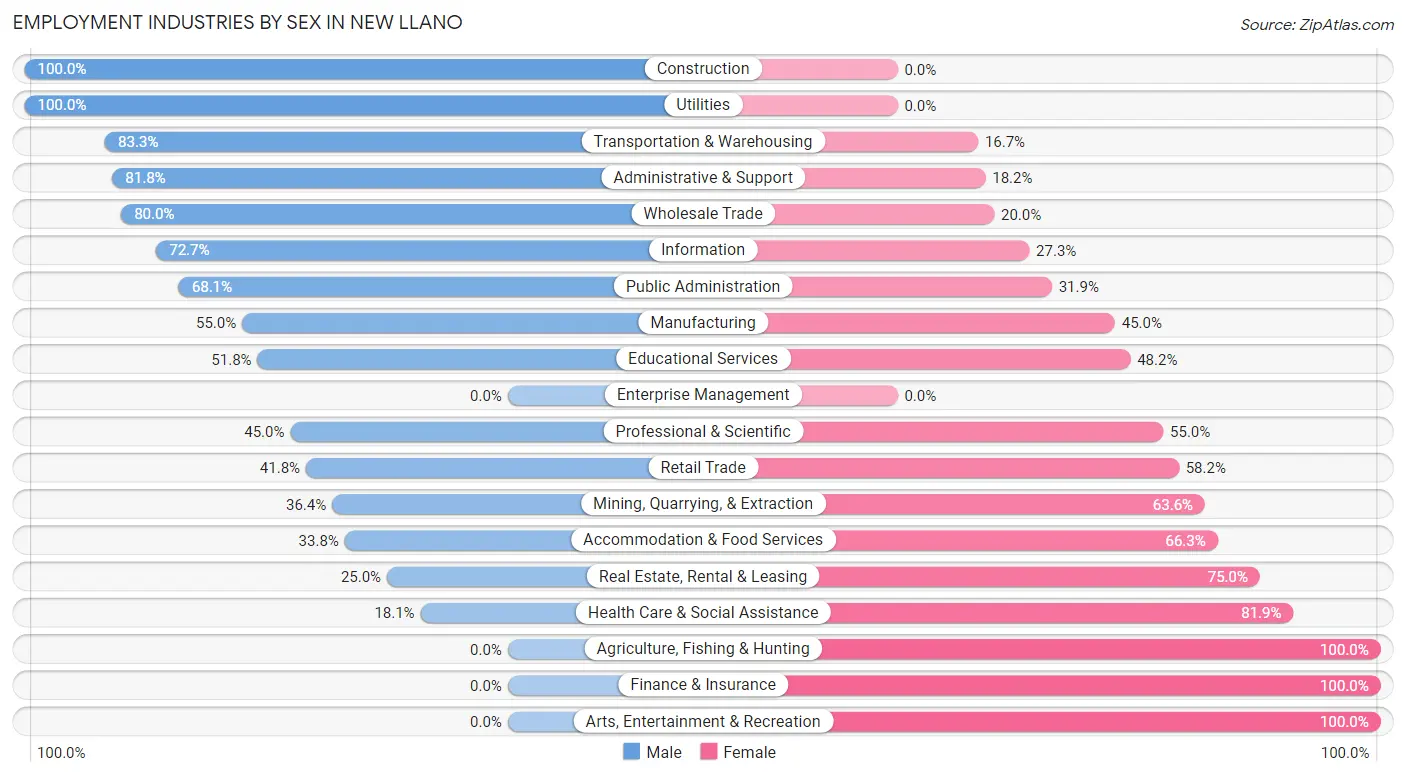
| Industry | Male | Female |
| Agriculture, Fishing & Hunting | 0 (0.0%) | 1 (100.0%) |
| Mining, Quarrying, & Extraction | 4 (36.4%) | 7 (63.6%) |
| Construction | 87 (100.0%) | 0 (0.0%) |
| Manufacturing | 11 (55.0%) | 9 (45.0%) |
| Wholesale Trade | 12 (80.0%) | 3 (20.0%) |
| Retail Trade | 66 (41.8%) | 92 (58.2%) |
| Transportation & Warehousing | 30 (83.3%) | 6 (16.7%) |
| Utilities | 3 (100.0%) | 0 (0.0%) |
| Information | 8 (72.7%) | 3 (27.3%) |
| Finance & Insurance | 0 (0.0%) | 24 (100.0%) |
| Real Estate, Rental & Leasing | 7 (25.0%) | 21 (75.0%) |
| Professional & Scientific | 27 (45.0%) | 33 (55.0%) |
| Enterprise Management | 0 (0.0%) | 0 (0.0%) |
| Administrative & Support | 9 (81.8%) | 2 (18.2%) |
| Educational Services | 43 (51.8%) | 40 (48.2%) |
| Health Care & Social Assistance | 15 (18.1%) | 68 (81.9%) |
| Arts, Entertainment & Recreation | 0 (0.0%) | 7 (100.0%) |
| Accommodation & Food Services | 27 (33.8%) | 53 (66.2%) |
| Public Administration | 49 (68.1%) | 23 (31.9%) |
| Total | 451 (52.4%) | 410 (47.6%) |
Education in New Llano
School Enrollment in New Llano
The most common levels of schooling among the 413 students in New Llano are elementary school (122 | 29.5%), middle school (103 | 24.9%), and college / undergraduate (68 | 16.5%).
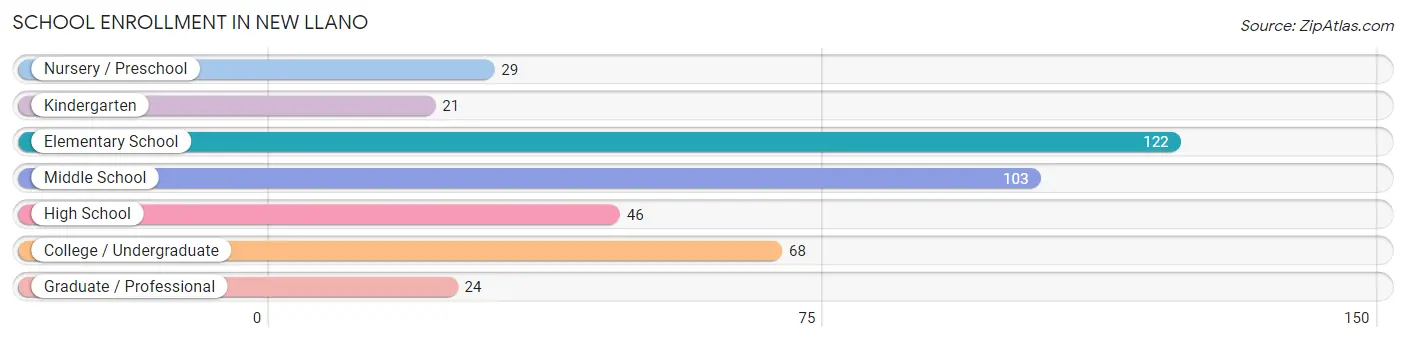
| School Level | # Students | % Students |
| Nursery / Preschool | 29 | 7.0% |
| Kindergarten | 21 | 5.1% |
| Elementary School | 122 | 29.5% |
| Middle School | 103 | 24.9% |
| High School | 46 | 11.1% |
| College / Undergraduate | 68 | 16.5% |
| Graduate / Professional | 24 | 5.8% |
| Total | 413 | 100.0% |
School Enrollment by Age by Funding Source in New Llano
Out of a total of 413 students who are enrolled in schools in New Llano, 42 (10.2%) attend a private institution, while the remaining 371 (89.8%) are enrolled in public schools. The age group of 3 to 4 year olds has the highest likelihood of being enrolled in private schools, with 9 (50.0% in the age bracket) enrolled. Conversely, the age group of 15 to 17 year olds has the lowest likelihood of being enrolled in a private school, with 32 (100.0% in the age bracket) attending a public institution.
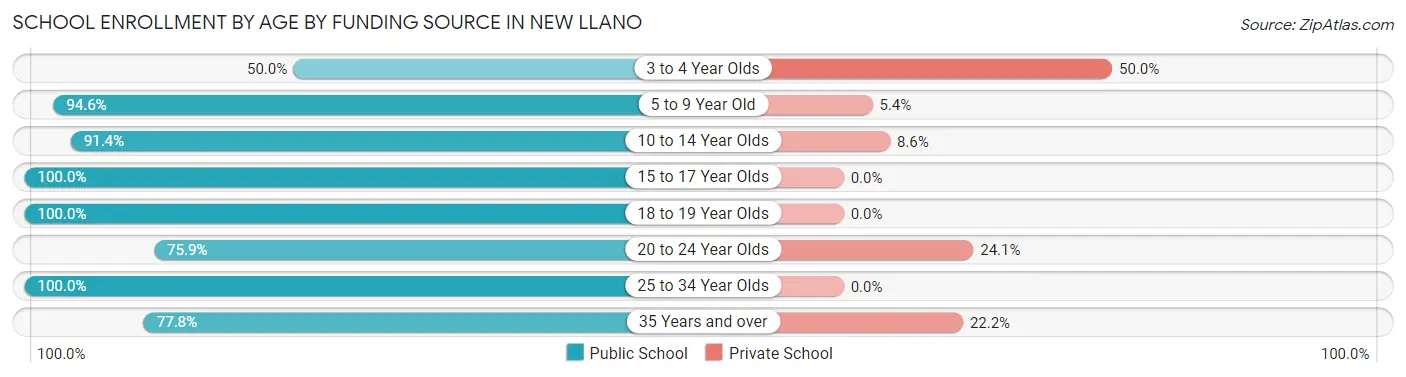
| Age Bracket | Public School | Private School |
| 3 to 4 Year Olds | 9 (50.0%) | 9 (50.0%) |
| 5 to 9 Year Old | 141 (94.6%) | 8 (5.4%) |
| 10 to 14 Year Olds | 106 (91.4%) | 10 (8.6%) |
| 15 to 17 Year Olds | 32 (100.0%) | 0 (0.0%) |
| 18 to 19 Year Olds | 4 (100.0%) | 0 (0.0%) |
| 20 to 24 Year Olds | 22 (75.9%) | 7 (24.1%) |
| 25 to 34 Year Olds | 29 (100.0%) | 0 (0.0%) |
| 35 Years and over | 28 (77.8%) | 8 (22.2%) |
| Total | 371 (89.8%) | 42 (10.2%) |
Educational Attainment by Field of Study in New Llano
Business (58 | 24.1%), social sciences (34 | 14.1%), psychology (25 | 10.4%), education (25 | 10.4%), and arts & humanities (22 | 9.1%) are the most common fields of study among 241 individuals in New Llano who have obtained a bachelor's degree or higher.
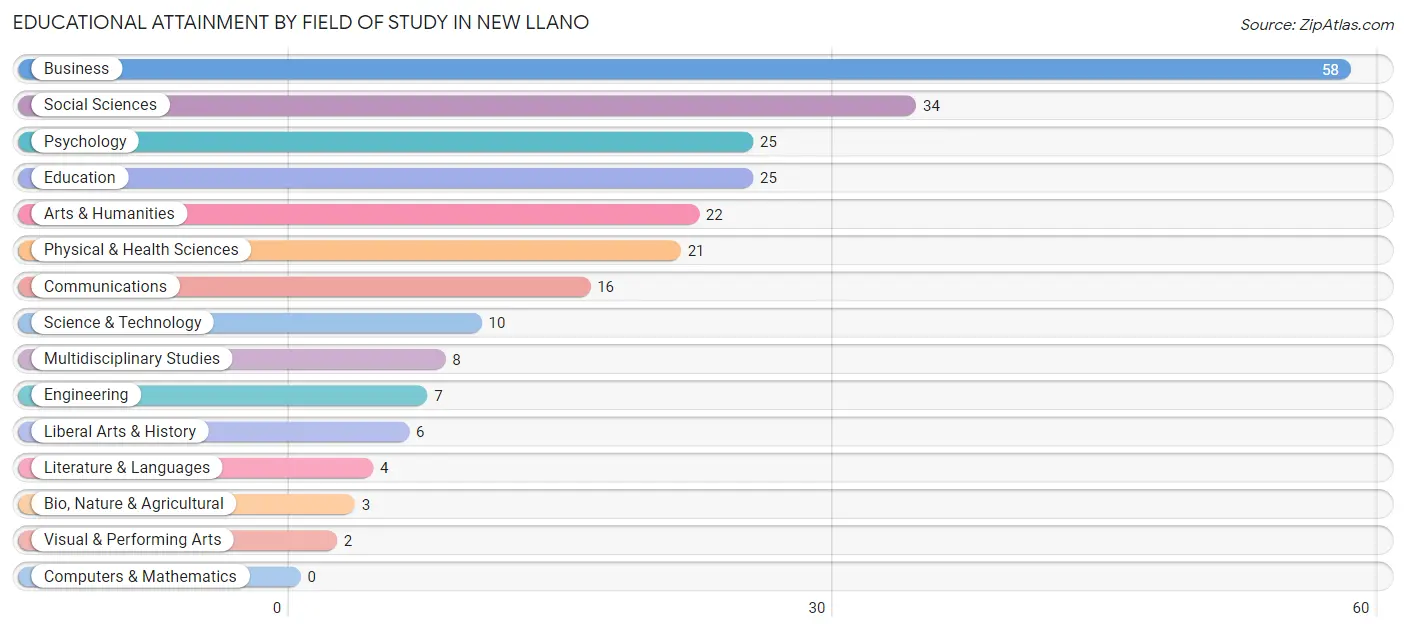
| Field of Study | # Graduates | % Graduates |
| Computers & Mathematics | 0 | 0.0% |
| Bio, Nature & Agricultural | 3 | 1.2% |
| Physical & Health Sciences | 21 | 8.7% |
| Psychology | 25 | 10.4% |
| Social Sciences | 34 | 14.1% |
| Engineering | 7 | 2.9% |
| Multidisciplinary Studies | 8 | 3.3% |
| Science & Technology | 10 | 4.2% |
| Business | 58 | 24.1% |
| Education | 25 | 10.4% |
| Literature & Languages | 4 | 1.7% |
| Liberal Arts & History | 6 | 2.5% |
| Visual & Performing Arts | 2 | 0.8% |
| Communications | 16 | 6.6% |
| Arts & Humanities | 22 | 9.1% |
| Total | 241 | 100.0% |
Transportation & Commute in New Llano
Vehicle Availability by Sex in New Llano
The most prevalent vehicle ownership categories in New Llano are males with 2 vehicles (200, accounting for 38.7%) and females with 2 vehicles (186, making up 46.8%).
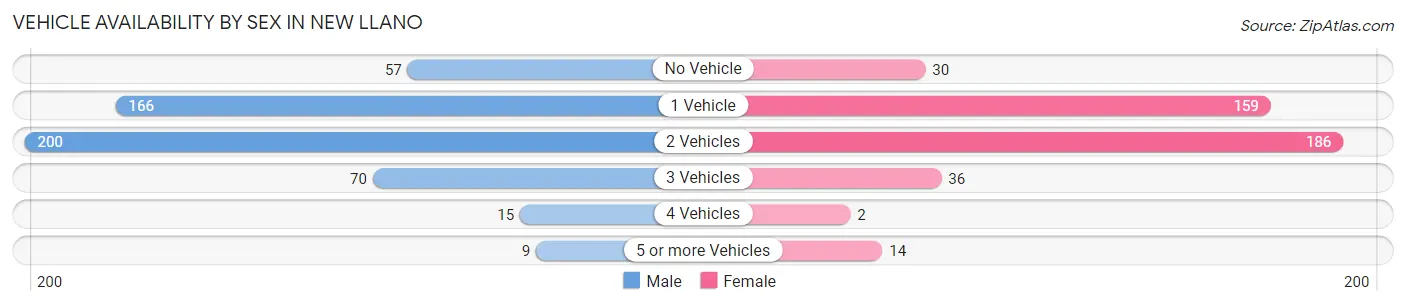
| Vehicles Available | Male | Female |
| No Vehicle | 57 (11.0%) | 30 (7.0%) |
| 1 Vehicle | 166 (32.1%) | 159 (37.2%) |
| 2 Vehicles | 200 (38.7%) | 186 (43.6%) |
| 3 Vehicles | 70 (13.5%) | 36 (8.4%) |
| 4 Vehicles | 15 (2.9%) | 2 (0.5%) |
| 5 or more Vehicles | 9 (1.7%) | 14 (3.3%) |
| Total | 517 (100.0%) | 427 (100.0%) |
Commute Time in New Llano
The most frequently occuring commute durations in New Llano are 15 to 19 minutes (270 commuters, 29.3%), 5 to 9 minutes (194 commuters, 21.1%), and 20 to 24 minutes (148 commuters, 16.1%).
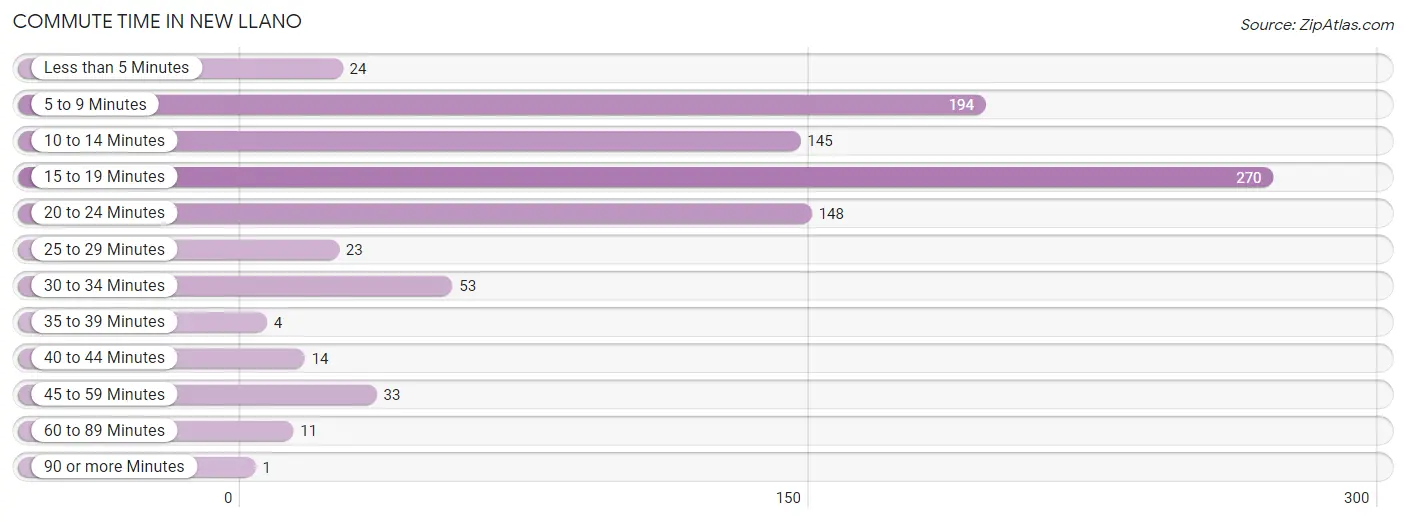
| Commute Time | # Commuters | % Commuters |
| Less than 5 Minutes | 24 | 2.6% |
| 5 to 9 Minutes | 194 | 21.1% |
| 10 to 14 Minutes | 145 | 15.8% |
| 15 to 19 Minutes | 270 | 29.3% |
| 20 to 24 Minutes | 148 | 16.1% |
| 25 to 29 Minutes | 23 | 2.5% |
| 30 to 34 Minutes | 53 | 5.8% |
| 35 to 39 Minutes | 4 | 0.4% |
| 40 to 44 Minutes | 14 | 1.5% |
| 45 to 59 Minutes | 33 | 3.6% |
| 60 to 89 Minutes | 11 | 1.2% |
| 90 or more Minutes | 1 | 0.1% |
Commute Time by Sex in New Llano
The most common commute times in New Llano are 15 to 19 minutes (147 commuters, 28.4%) for males and 15 to 19 minutes (123 commuters, 30.5%) for females.
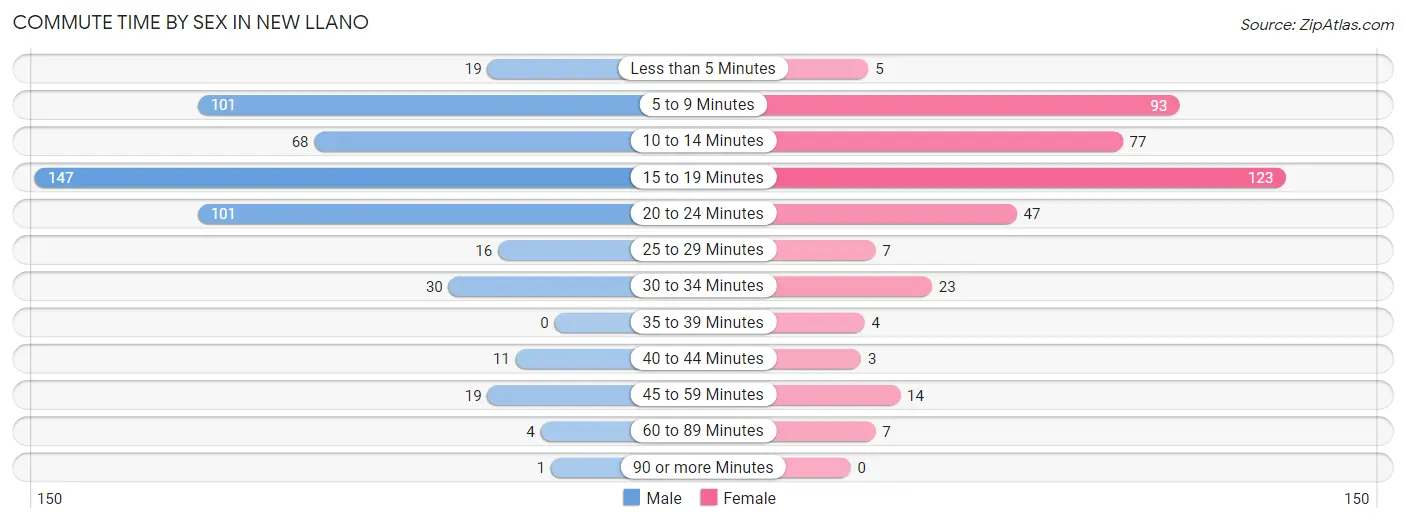
| Commute Time | Male | Female |
| Less than 5 Minutes | 19 (3.7%) | 5 (1.2%) |
| 5 to 9 Minutes | 101 (19.5%) | 93 (23.1%) |
| 10 to 14 Minutes | 68 (13.2%) | 77 (19.1%) |
| 15 to 19 Minutes | 147 (28.4%) | 123 (30.5%) |
| 20 to 24 Minutes | 101 (19.5%) | 47 (11.7%) |
| 25 to 29 Minutes | 16 (3.1%) | 7 (1.7%) |
| 30 to 34 Minutes | 30 (5.8%) | 23 (5.7%) |
| 35 to 39 Minutes | 0 (0.0%) | 4 (1.0%) |
| 40 to 44 Minutes | 11 (2.1%) | 3 (0.7%) |
| 45 to 59 Minutes | 19 (3.7%) | 14 (3.5%) |
| 60 to 89 Minutes | 4 (0.8%) | 7 (1.7%) |
| 90 or more Minutes | 1 (0.2%) | 0 (0.0%) |
Time of Departure to Work by Sex in New Llano
The most frequent times of departure to work in New Llano are 6:00 AM to 6:29 AM (91, 17.6%) for males and 7:00 AM to 7:29 AM (92, 22.8%) for females.
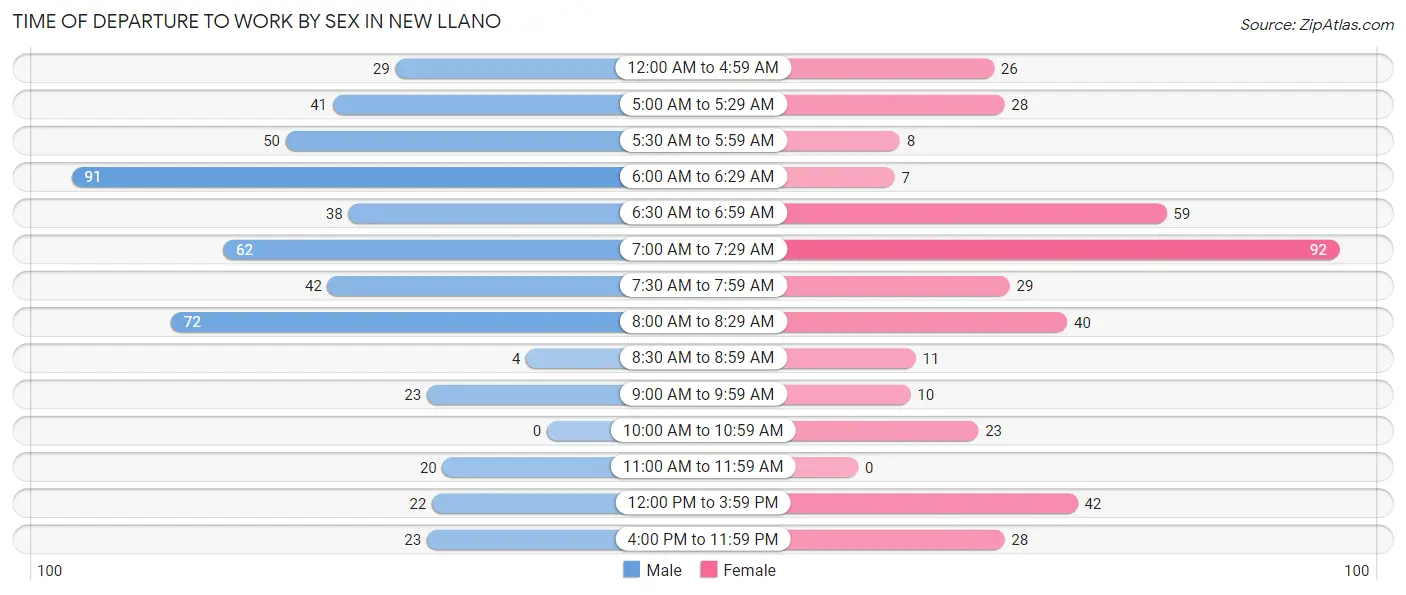
| Time of Departure | Male | Female |
| 12:00 AM to 4:59 AM | 29 (5.6%) | 26 (6.5%) |
| 5:00 AM to 5:29 AM | 41 (7.9%) | 28 (7.0%) |
| 5:30 AM to 5:59 AM | 50 (9.7%) | 8 (2.0%) |
| 6:00 AM to 6:29 AM | 91 (17.6%) | 7 (1.7%) |
| 6:30 AM to 6:59 AM | 38 (7.3%) | 59 (14.6%) |
| 7:00 AM to 7:29 AM | 62 (12.0%) | 92 (22.8%) |
| 7:30 AM to 7:59 AM | 42 (8.1%) | 29 (7.2%) |
| 8:00 AM to 8:29 AM | 72 (13.9%) | 40 (9.9%) |
| 8:30 AM to 8:59 AM | 4 (0.8%) | 11 (2.7%) |
| 9:00 AM to 9:59 AM | 23 (4.4%) | 10 (2.5%) |
| 10:00 AM to 10:59 AM | 0 (0.0%) | 23 (5.7%) |
| 11:00 AM to 11:59 AM | 20 (3.9%) | 0 (0.0%) |
| 12:00 PM to 3:59 PM | 22 (4.3%) | 42 (10.4%) |
| 4:00 PM to 11:59 PM | 23 (4.4%) | 28 (7.0%) |
| Total | 517 (100.0%) | 403 (100.0%) |
Housing Occupancy in New Llano
Occupancy by Ownership in New Llano
Of the total 1,014 dwellings in New Llano, owner-occupied units account for 487 (48.0%), while renter-occupied units make up 527 (52.0%).
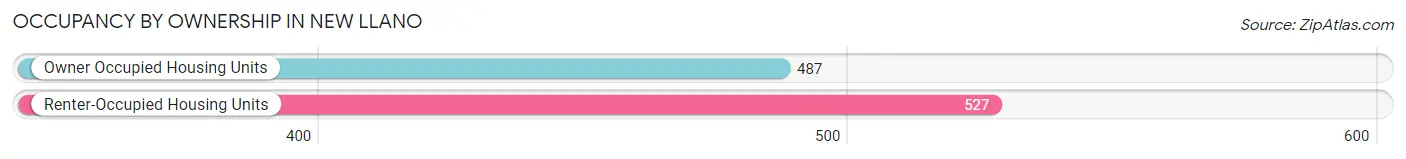
| Occupancy | # Housing Units | % Housing Units |
| Owner Occupied Housing Units | 487 | 48.0% |
| Renter-Occupied Housing Units | 527 | 52.0% |
| Total Occupied Housing Units | 1,014 | 100.0% |
Occupancy by Household Size in New Llano
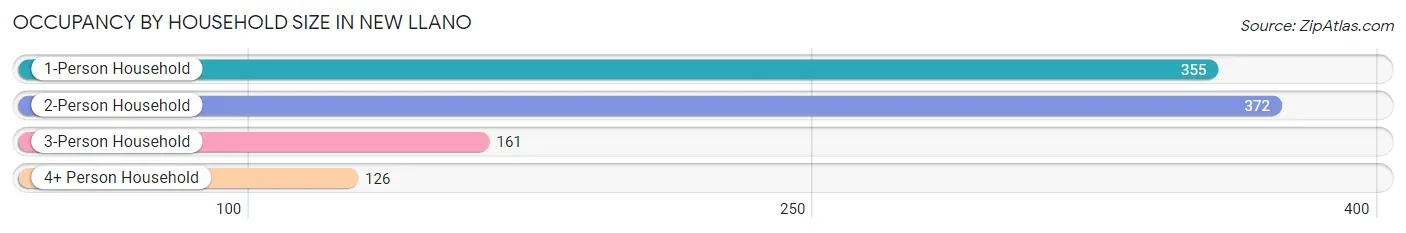
| Household Size | # Housing Units | % Housing Units |
| 1-Person Household | 355 | 35.0% |
| 2-Person Household | 372 | 36.7% |
| 3-Person Household | 161 | 15.9% |
| 4+ Person Household | 126 | 12.4% |
| Total Housing Units | 1,014 | 100.0% |
Occupancy by Ownership by Household Size in New Llano
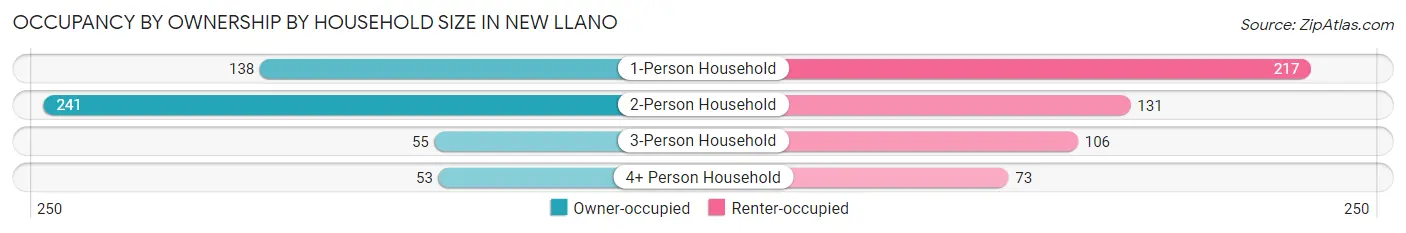
| Household Size | Owner-occupied | Renter-occupied |
| 1-Person Household | 138 (38.9%) | 217 (61.1%) |
| 2-Person Household | 241 (64.8%) | 131 (35.2%) |
| 3-Person Household | 55 (34.2%) | 106 (65.8%) |
| 4+ Person Household | 53 (42.1%) | 73 (57.9%) |
| Total Housing Units | 487 (48.0%) | 527 (52.0%) |
Occupancy by Educational Attainment in New Llano
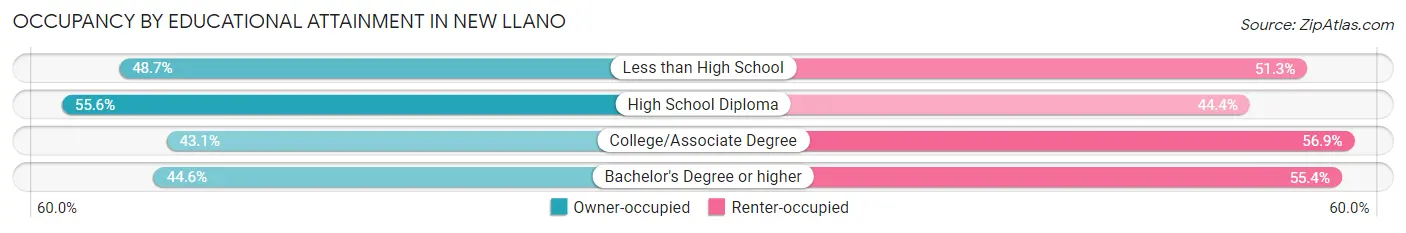
| Household Size | Owner-occupied | Renter-occupied |
| Less than High School | 58 (48.7%) | 61 (51.3%) |
| High School Diploma | 180 (55.6%) | 144 (44.4%) |
| College/Associate Degree | 166 (43.1%) | 219 (56.9%) |
| Bachelor's Degree or higher | 83 (44.6%) | 103 (55.4%) |
Occupancy by Age of Householder in New Llano

| Age Bracket | # Households | % Households |
| Under 35 Years | 254 | 25.1% |
| 35 to 44 Years | 212 | 20.9% |
| 45 to 54 Years | 161 | 15.9% |
| 55 to 64 Years | 166 | 16.4% |
| 65 to 74 Years | 147 | 14.5% |
| 75 to 84 Years | 63 | 6.2% |
| 85 Years and Over | 11 | 1.1% |
| Total | 1,014 | 100.0% |
Housing Finances in New Llano
Median Income by Occupancy in New Llano
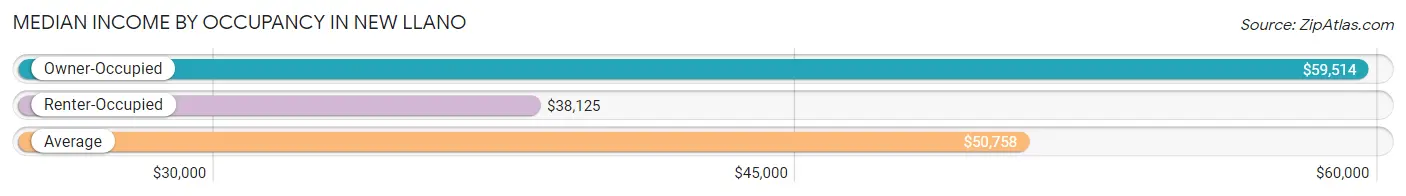
| Occupancy Type | # Households | Median Income |
| Owner-Occupied | 487 (48.0%) | $59,514 |
| Renter-Occupied | 527 (52.0%) | $38,125 |
| Average | 1,014 (100.0%) | $50,758 |
Occupancy by Householder Income Bracket in New Llano
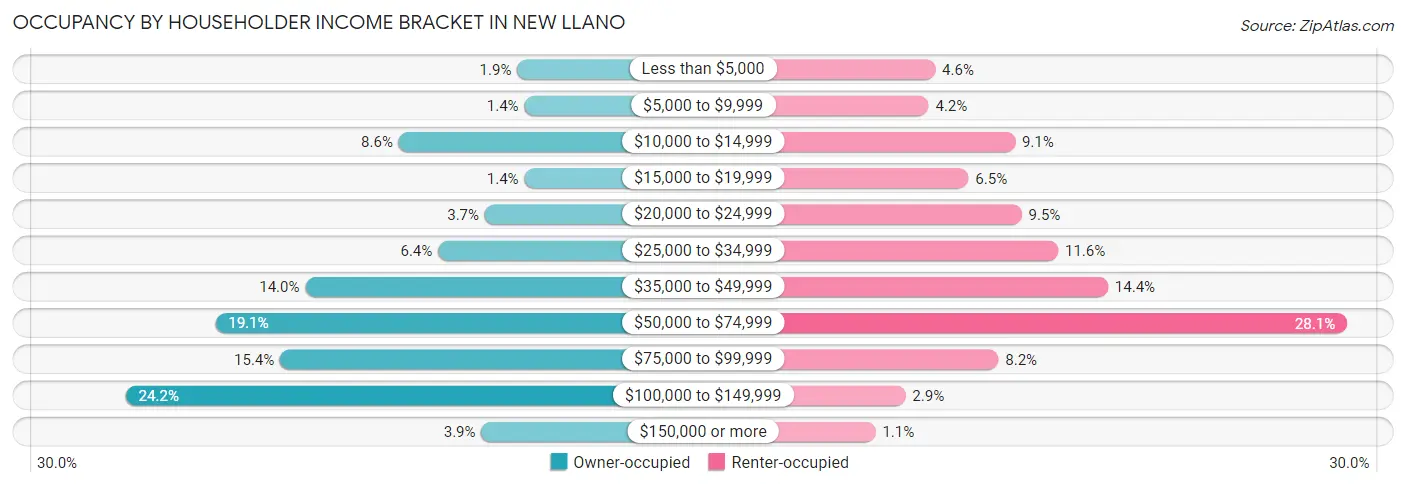
| Income Bracket | Owner-occupied | Renter-occupied |
| Less than $5,000 | 9 (1.8%) | 24 (4.5%) |
| $5,000 to $9,999 | 7 (1.4%) | 22 (4.2%) |
| $10,000 to $14,999 | 42 (8.6%) | 48 (9.1%) |
| $15,000 to $19,999 | 7 (1.4%) | 34 (6.5%) |
| $20,000 to $24,999 | 18 (3.7%) | 50 (9.5%) |
| $25,000 to $34,999 | 31 (6.4%) | 61 (11.6%) |
| $35,000 to $49,999 | 68 (14.0%) | 76 (14.4%) |
| $50,000 to $74,999 | 93 (19.1%) | 148 (28.1%) |
| $75,000 to $99,999 | 75 (15.4%) | 43 (8.2%) |
| $100,000 to $149,999 | 118 (24.2%) | 15 (2.9%) |
| $150,000 or more | 19 (3.9%) | 6 (1.1%) |
| Total | 487 (100.0%) | 527 (100.0%) |
Monthly Housing Cost Tiers in New Llano
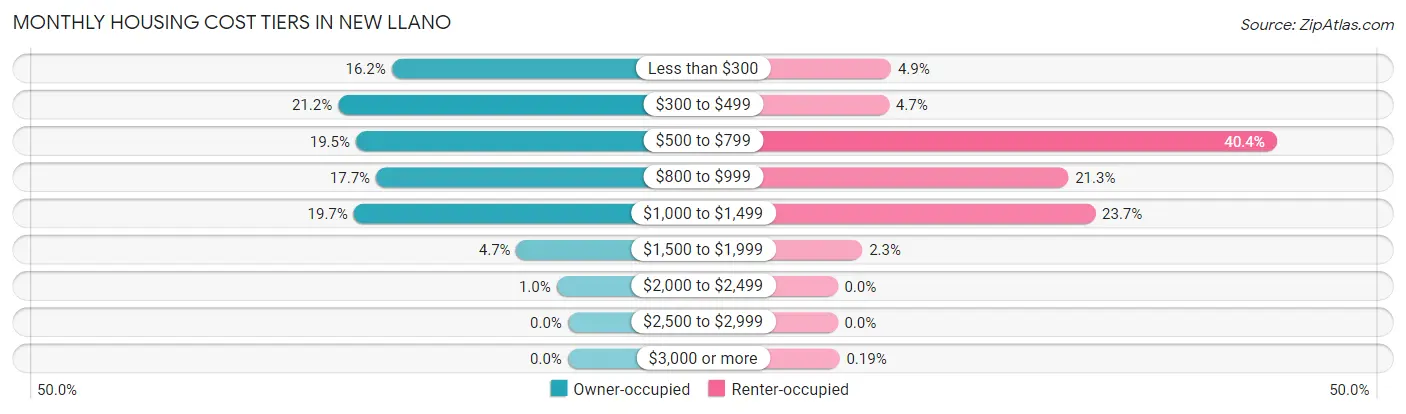
| Monthly Cost | Owner-occupied | Renter-occupied |
| Less than $300 | 79 (16.2%) | 26 (4.9%) |
| $300 to $499 | 103 (21.1%) | 25 (4.7%) |
| $500 to $799 | 95 (19.5%) | 213 (40.4%) |
| $800 to $999 | 86 (17.7%) | 112 (21.2%) |
| $1,000 to $1,499 | 96 (19.7%) | 125 (23.7%) |
| $1,500 to $1,999 | 23 (4.7%) | 12 (2.3%) |
| $2,000 to $2,499 | 5 (1.0%) | 0 (0.0%) |
| $2,500 to $2,999 | 0 (0.0%) | 0 (0.0%) |
| $3,000 or more | 0 (0.0%) | 1 (0.2%) |
| Total | 487 (100.0%) | 527 (100.0%) |
Physical Housing Characteristics in New Llano
Housing Structures in New Llano

| Structure Type | # Housing Units | % Housing Units |
| Single Unit, Detached | 698 | 68.8% |
| Single Unit, Attached | 6 | 0.6% |
| 2 Unit Apartments | 0 | 0.0% |
| 3 or 4 Unit Apartments | 70 | 6.9% |
| 5 to 9 Unit Apartments | 68 | 6.7% |
| 10 or more Apartments | 83 | 8.2% |
| Mobile Home / Other | 89 | 8.8% |
| Total | 1,014 | 100.0% |
Housing Structures by Occupancy in New Llano
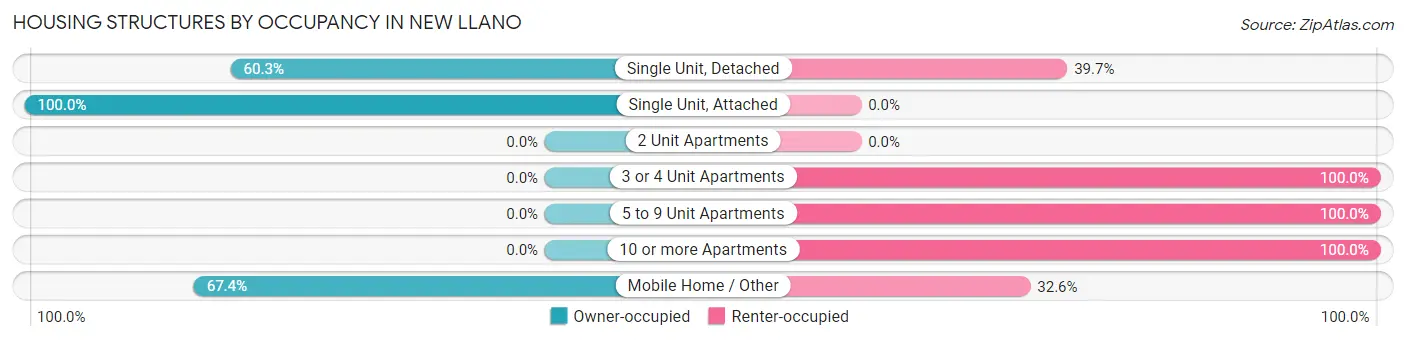
| Structure Type | Owner-occupied | Renter-occupied |
| Single Unit, Detached | 421 (60.3%) | 277 (39.7%) |
| Single Unit, Attached | 6 (100.0%) | 0 (0.0%) |
| 2 Unit Apartments | 0 (0.0%) | 0 (0.0%) |
| 3 or 4 Unit Apartments | 0 (0.0%) | 70 (100.0%) |
| 5 to 9 Unit Apartments | 0 (0.0%) | 68 (100.0%) |
| 10 or more Apartments | 0 (0.0%) | 83 (100.0%) |
| Mobile Home / Other | 60 (67.4%) | 29 (32.6%) |
| Total | 487 (48.0%) | 527 (52.0%) |
Housing Structures by Number of Rooms in New Llano
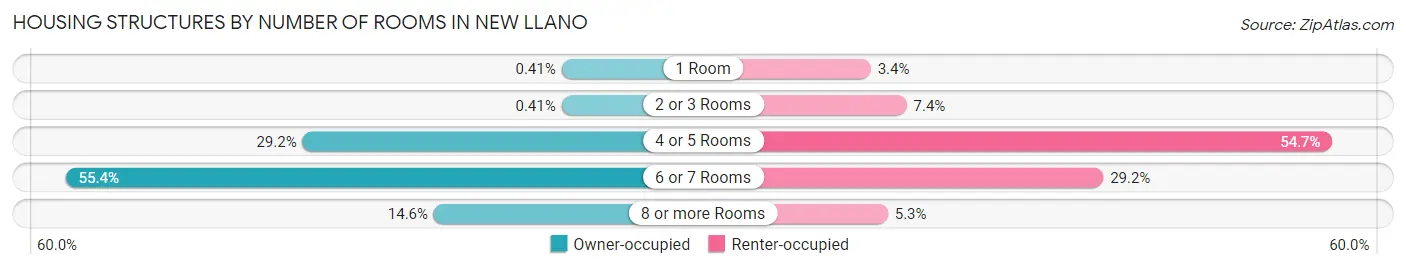
| Number of Rooms | Owner-occupied | Renter-occupied |
| 1 Room | 2 (0.4%) | 18 (3.4%) |
| 2 or 3 Rooms | 2 (0.4%) | 39 (7.4%) |
| 4 or 5 Rooms | 142 (29.2%) | 288 (54.6%) |
| 6 or 7 Rooms | 270 (55.4%) | 154 (29.2%) |
| 8 or more Rooms | 71 (14.6%) | 28 (5.3%) |
| Total | 487 (100.0%) | 527 (100.0%) |
Housing Structure by Heating Type in New Llano
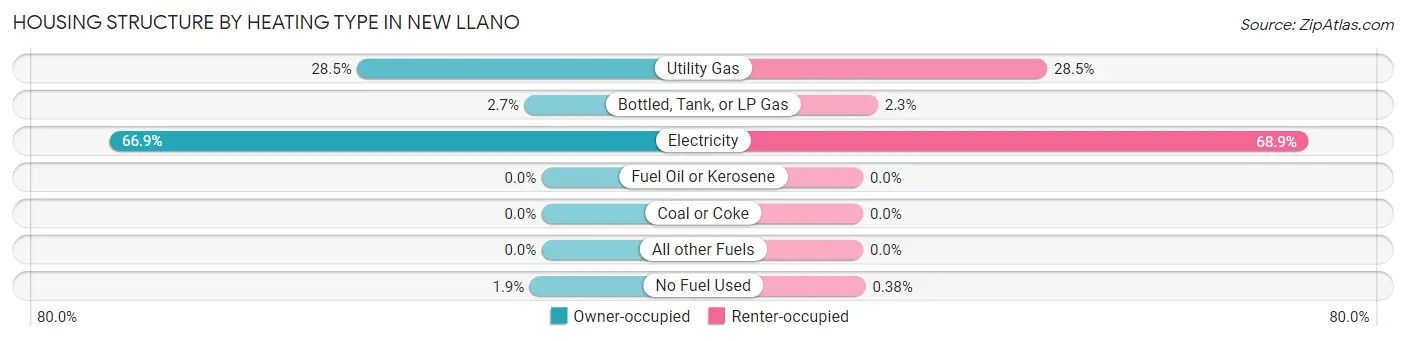
| Heating Type | Owner-occupied | Renter-occupied |
| Utility Gas | 139 (28.5%) | 150 (28.5%) |
| Bottled, Tank, or LP Gas | 13 (2.7%) | 12 (2.3%) |
| Electricity | 326 (66.9%) | 363 (68.9%) |
| Fuel Oil or Kerosene | 0 (0.0%) | 0 (0.0%) |
| Coal or Coke | 0 (0.0%) | 0 (0.0%) |
| All other Fuels | 0 (0.0%) | 0 (0.0%) |
| No Fuel Used | 9 (1.8%) | 2 (0.4%) |
| Total | 487 (100.0%) | 527 (100.0%) |
Household Vehicle Usage in New Llano
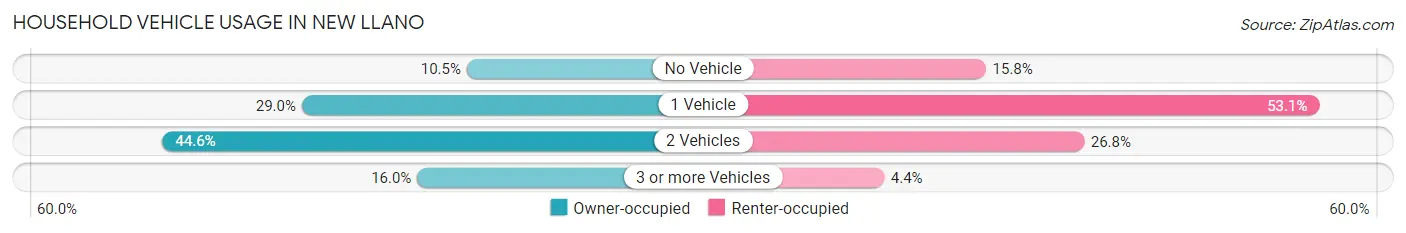
| Vehicles per Household | Owner-occupied | Renter-occupied |
| No Vehicle | 51 (10.5%) | 83 (15.8%) |
| 1 Vehicle | 141 (28.9%) | 280 (53.1%) |
| 2 Vehicles | 217 (44.6%) | 141 (26.8%) |
| 3 or more Vehicles | 78 (16.0%) | 23 (4.4%) |
| Total | 487 (100.0%) | 527 (100.0%) |
Real Estate & Mortgages in New Llano
Real Estate and Mortgage Overview in New Llano
| Characteristic | Without Mortgage | With Mortgage |
| Housing Units | 231 | 256 |
| Median Property Value | $131,300 | $120,500 |
| Median Household Income | $55,221 | $14 |
| Monthly Housing Costs | $353 | $0 |
| Real Estate Taxes | $199 | $105 |
Property Value by Mortgage Status in New Llano
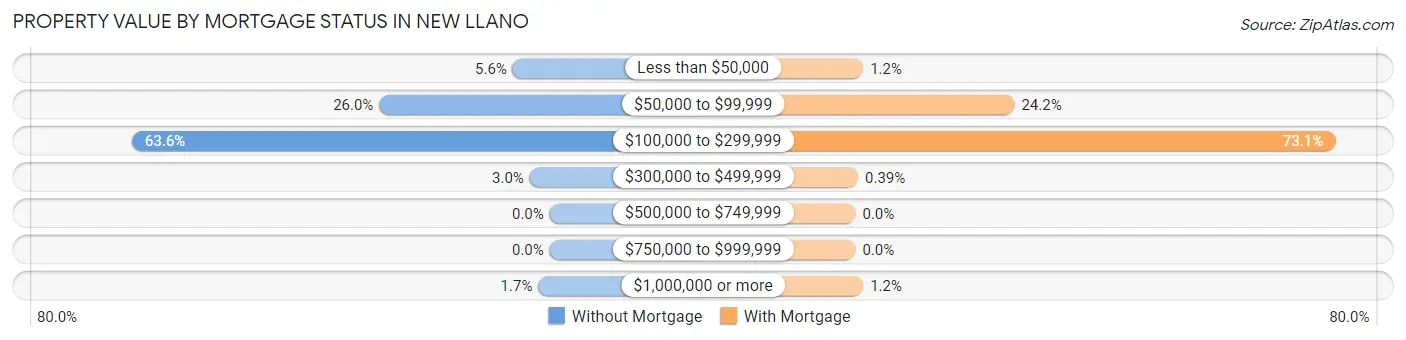
| Property Value | Without Mortgage | With Mortgage |
| Less than $50,000 | 13 (5.6%) | 3 (1.2%) |
| $50,000 to $99,999 | 60 (26.0%) | 62 (24.2%) |
| $100,000 to $299,999 | 147 (63.6%) | 187 (73.1%) |
| $300,000 to $499,999 | 7 (3.0%) | 1 (0.4%) |
| $500,000 to $749,999 | 0 (0.0%) | 0 (0.0%) |
| $750,000 to $999,999 | 0 (0.0%) | 0 (0.0%) |
| $1,000,000 or more | 4 (1.7%) | 3 (1.2%) |
| Total | 231 (100.0%) | 256 (100.0%) |
Household Income by Mortgage Status in New Llano
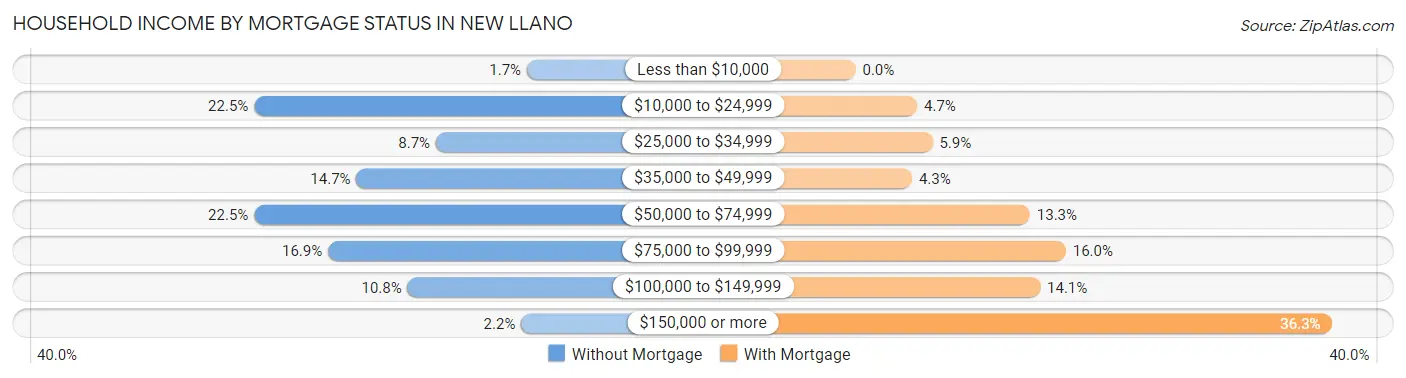
| Household Income | Without Mortgage | With Mortgage |
| Less than $10,000 | 4 (1.7%) | 0 (0.0%) |
| $10,000 to $24,999 | 52 (22.5%) | 12 (4.7%) |
| $25,000 to $34,999 | 20 (8.7%) | 15 (5.9%) |
| $35,000 to $49,999 | 34 (14.7%) | 11 (4.3%) |
| $50,000 to $74,999 | 52 (22.5%) | 34 (13.3%) |
| $75,000 to $99,999 | 39 (16.9%) | 41 (16.0%) |
| $100,000 to $149,999 | 25 (10.8%) | 36 (14.1%) |
| $150,000 or more | 5 (2.2%) | 93 (36.3%) |
| Total | 231 (100.0%) | 256 (100.0%) |
Property Value to Household Income Ratio in New Llano
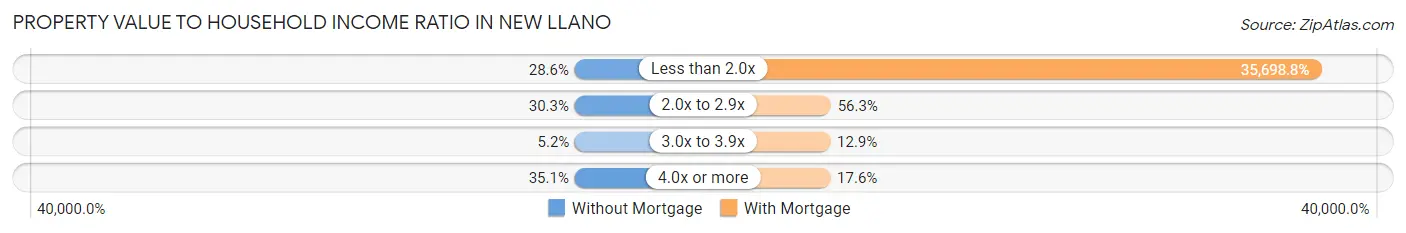
| Value-to-Income Ratio | Without Mortgage | With Mortgage |
| Less than 2.0x | 66 (28.6%) | 91,389 (35,698.8%) |
| 2.0x to 2.9x | 70 (30.3%) | 144 (56.2%) |
| 3.0x to 3.9x | 12 (5.2%) | 33 (12.9%) |
| 4.0x or more | 81 (35.1%) | 45 (17.6%) |
| Total | 231 (100.0%) | 256 (100.0%) |
Real Estate Taxes by Mortgage Status in New Llano

| Property Taxes | Without Mortgage | With Mortgage |
| Less than $800 | 148 (64.1%) | 5 (1.9%) |
| $800 to $1,499 | 6 (2.6%) | 107 (41.8%) |
| $800 to $1,499 | 2 (0.9%) | 27 (10.5%) |
| Total | 231 (100.0%) | 256 (100.0%) |
Health & Disability in New Llano
Health Insurance Coverage by Age in New Llano
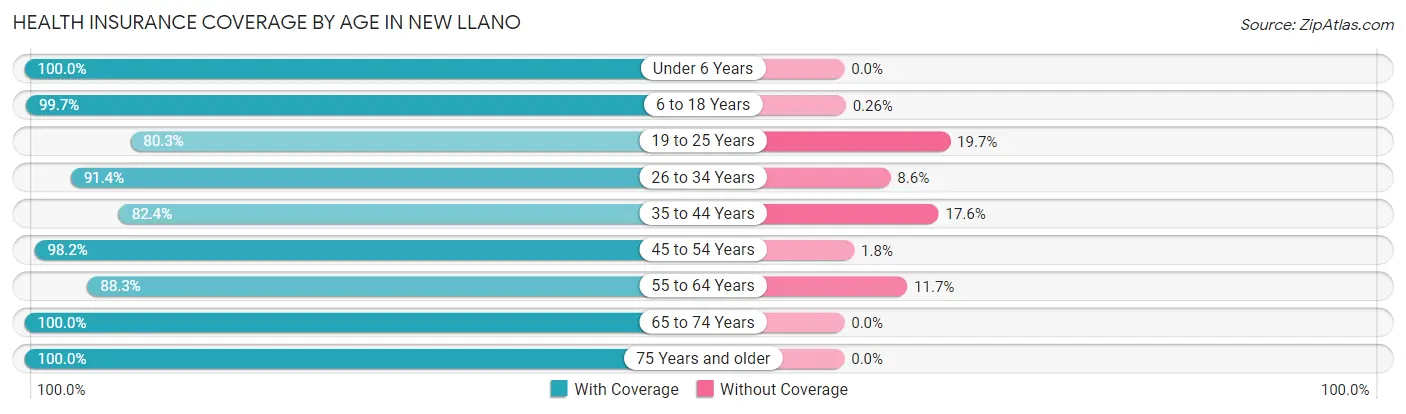
| Age Bracket | With Coverage | Without Coverage |
| Under 6 Years | 167 (100.0%) | 0 (0.0%) |
| 6 to 18 Years | 381 (99.7%) | 1 (0.3%) |
| 19 to 25 Years | 122 (80.3%) | 30 (19.7%) |
| 26 to 34 Years | 319 (91.4%) | 30 (8.6%) |
| 35 to 44 Years | 225 (82.4%) | 48 (17.6%) |
| 45 to 54 Years | 267 (98.2%) | 5 (1.8%) |
| 55 to 64 Years | 211 (88.3%) | 28 (11.7%) |
| 65 to 74 Years | 240 (100.0%) | 0 (0.0%) |
| 75 Years and older | 118 (100.0%) | 0 (0.0%) |
| Total | 2,050 (93.5%) | 142 (6.5%) |
Health Insurance Coverage by Citizenship Status in New Llano
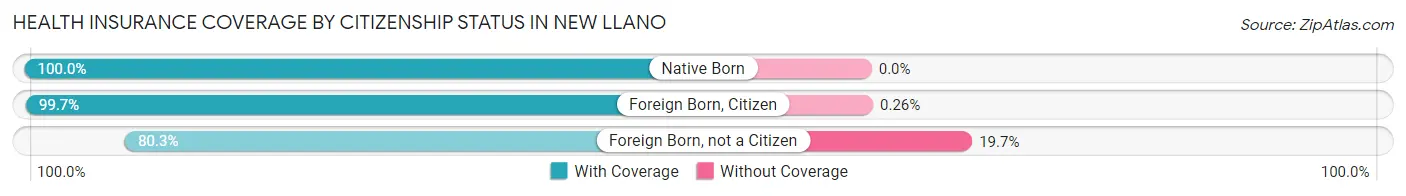
| Citizenship Status | With Coverage | Without Coverage |
| Native Born | 167 (100.0%) | 0 (0.0%) |
| Foreign Born, Citizen | 381 (99.7%) | 1 (0.3%) |
| Foreign Born, not a Citizen | 122 (80.3%) | 30 (19.7%) |
Health Insurance Coverage by Household Income in New Llano
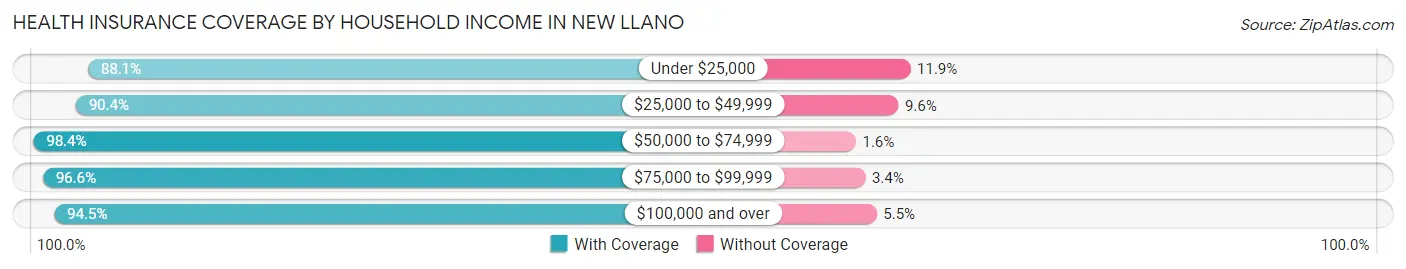
| Household Income | With Coverage | Without Coverage |
| Under $25,000 | 394 (88.1%) | 53 (11.9%) |
| $25,000 to $49,999 | 472 (90.4%) | 50 (9.6%) |
| $50,000 to $74,999 | 599 (98.4%) | 10 (1.6%) |
| $75,000 to $99,999 | 227 (96.6%) | 8 (3.4%) |
| $100,000 and over | 358 (94.5%) | 21 (5.5%) |
Public vs Private Health Insurance Coverage by Age in New Llano
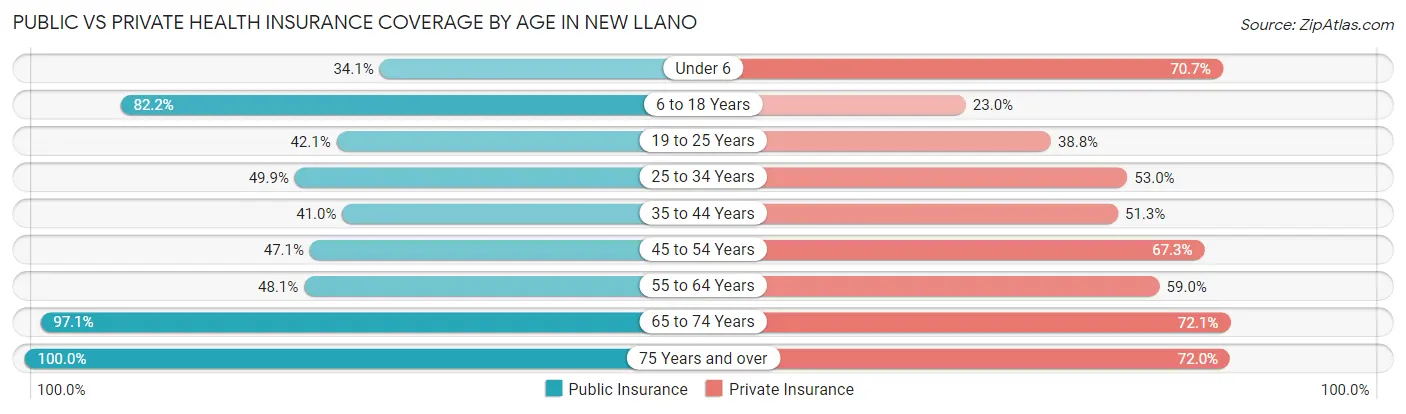
| Age Bracket | Public Insurance | Private Insurance |
| Under 6 | 57 (34.1%) | 118 (70.7%) |
| 6 to 18 Years | 314 (82.2%) | 88 (23.0%) |
| 19 to 25 Years | 64 (42.1%) | 59 (38.8%) |
| 25 to 34 Years | 174 (49.9%) | 185 (53.0%) |
| 35 to 44 Years | 112 (41.0%) | 140 (51.3%) |
| 45 to 54 Years | 128 (47.1%) | 183 (67.3%) |
| 55 to 64 Years | 115 (48.1%) | 141 (59.0%) |
| 65 to 74 Years | 233 (97.1%) | 173 (72.1%) |
| 75 Years and over | 118 (100.0%) | 85 (72.0%) |
| Total | 1,315 (60.0%) | 1,172 (53.5%) |
Disability Status by Sex by Age in New Llano
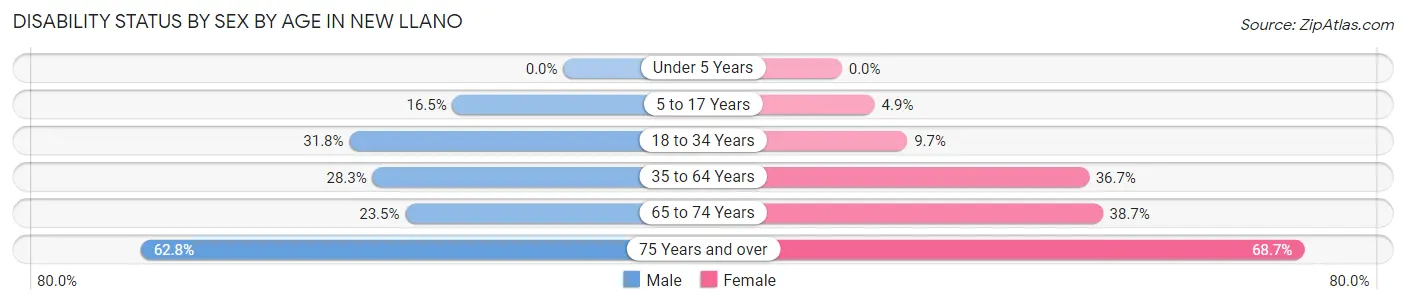
| Age Bracket | Male | Female |
| Under 5 Years | 0 (0.0%) | 0 (0.0%) |
| 5 to 17 Years | 25 (16.5%) | 12 (4.9%) |
| 18 to 34 Years | 82 (31.8%) | 24 (9.7%) |
| 35 to 64 Years | 117 (28.3%) | 136 (36.7%) |
| 65 to 74 Years | 23 (23.5%) | 55 (38.7%) |
| 75 Years and over | 32 (62.7%) | 46 (68.7%) |
Disability Class by Sex by Age in New Llano
Disability Class: Hearing Difficulty
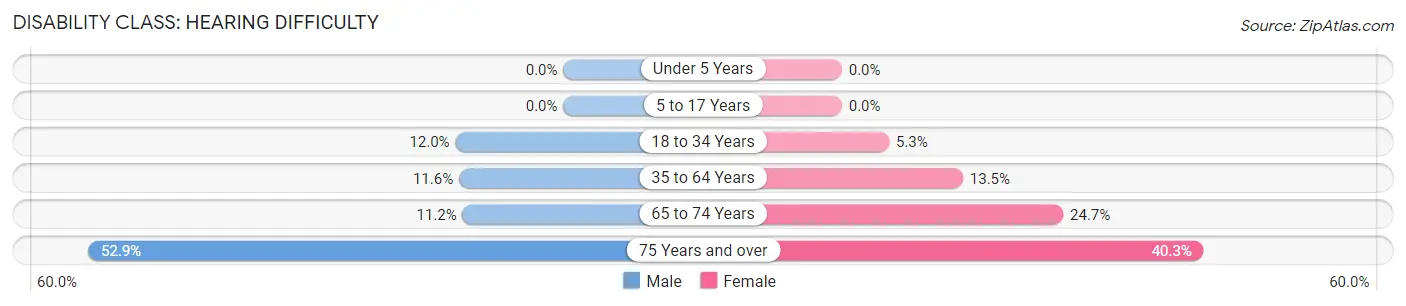
| Age Bracket | Male | Female |
| Under 5 Years | 0 (0.0%) | 0 (0.0%) |
| 5 to 17 Years | 0 (0.0%) | 0 (0.0%) |
| 18 to 34 Years | 31 (12.0%) | 13 (5.3%) |
| 35 to 64 Years | 48 (11.6%) | 50 (13.5%) |
| 65 to 74 Years | 11 (11.2%) | 35 (24.6%) |
| 75 Years and over | 27 (52.9%) | 27 (40.3%) |
Disability Class: Vision Difficulty
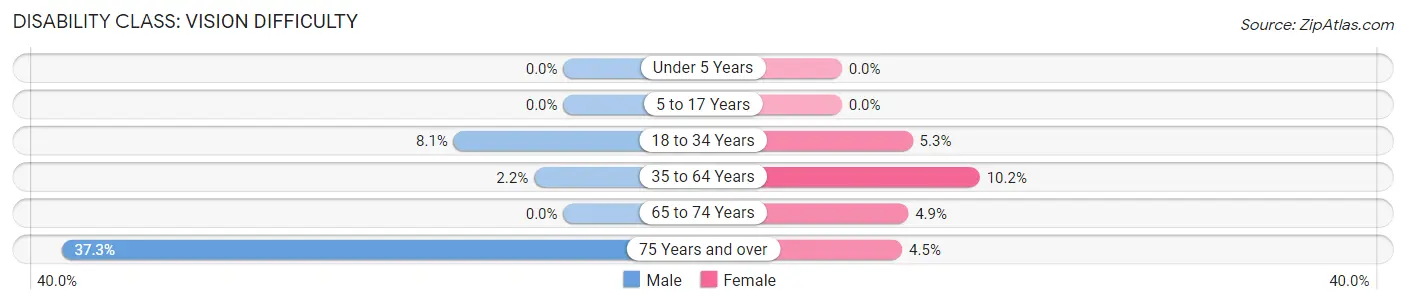
| Age Bracket | Male | Female |
| Under 5 Years | 0 (0.0%) | 0 (0.0%) |
| 5 to 17 Years | 0 (0.0%) | 0 (0.0%) |
| 18 to 34 Years | 21 (8.1%) | 13 (5.3%) |
| 35 to 64 Years | 9 (2.2%) | 38 (10.2%) |
| 65 to 74 Years | 0 (0.0%) | 7 (4.9%) |
| 75 Years and over | 19 (37.2%) | 3 (4.5%) |
Disability Class: Cognitive Difficulty
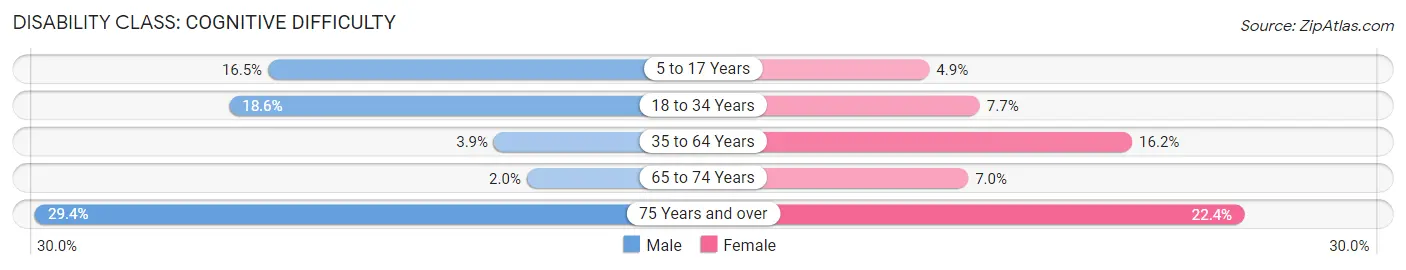
| Age Bracket | Male | Female |
| 5 to 17 Years | 25 (16.5%) | 12 (4.9%) |
| 18 to 34 Years | 48 (18.6%) | 19 (7.7%) |
| 35 to 64 Years | 16 (3.9%) | 60 (16.2%) |
| 65 to 74 Years | 2 (2.0%) | 10 (7.0%) |
| 75 Years and over | 15 (29.4%) | 15 (22.4%) |
Disability Class: Ambulatory Difficulty
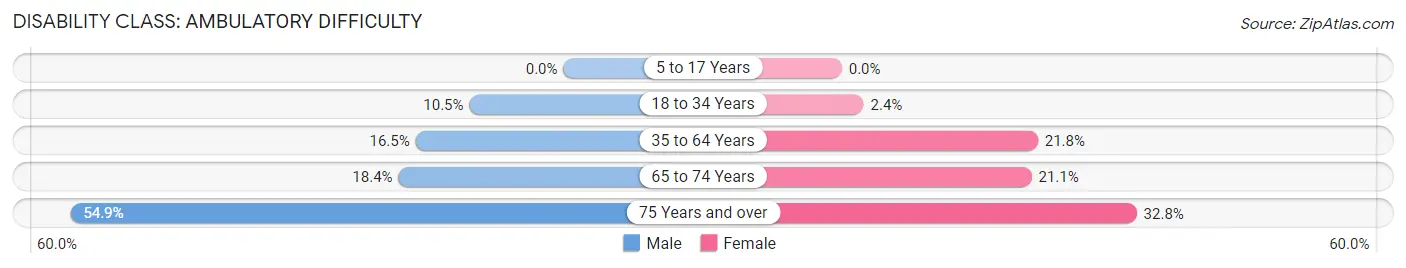
| Age Bracket | Male | Female |
| 5 to 17 Years | 0 (0.0%) | 0 (0.0%) |
| 18 to 34 Years | 27 (10.5%) | 6 (2.4%) |
| 35 to 64 Years | 68 (16.5%) | 81 (21.8%) |
| 65 to 74 Years | 18 (18.4%) | 30 (21.1%) |
| 75 Years and over | 28 (54.9%) | 22 (32.8%) |
Disability Class: Self-Care Difficulty
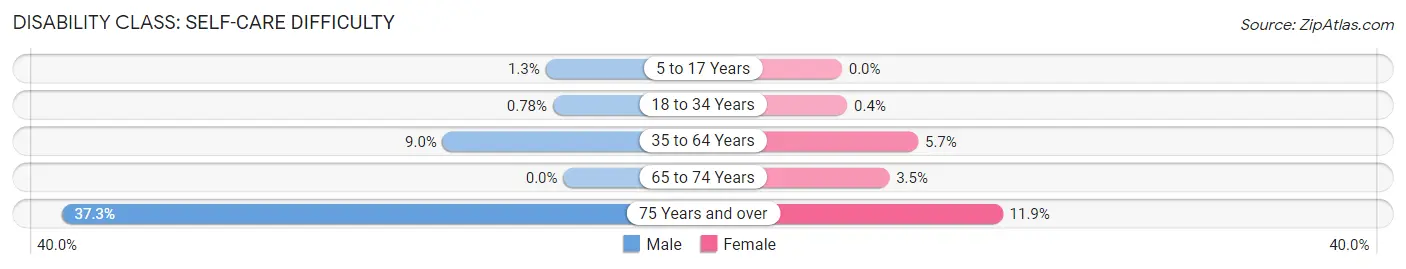
| Age Bracket | Male | Female |
| 5 to 17 Years | 2 (1.3%) | 0 (0.0%) |
| 18 to 34 Years | 2 (0.8%) | 1 (0.4%) |
| 35 to 64 Years | 37 (9.0%) | 21 (5.7%) |
| 65 to 74 Years | 0 (0.0%) | 5 (3.5%) |
| 75 Years and over | 19 (37.2%) | 8 (11.9%) |
Technology Access in New Llano
Computing Device Access in New Llano
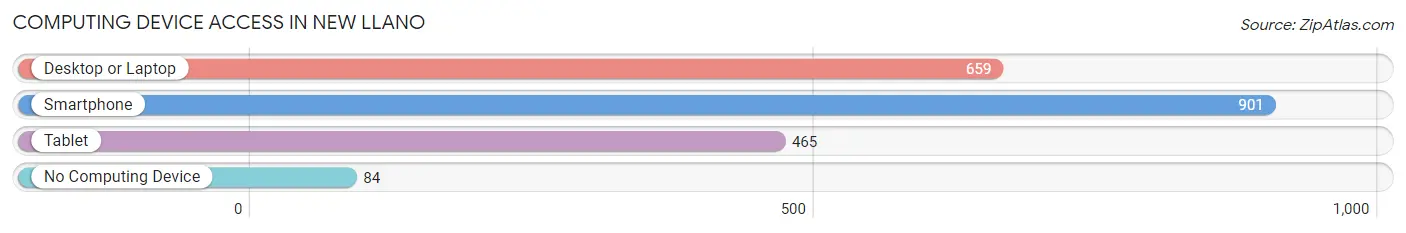
| Device Type | # Households | % Households |
| Desktop or Laptop | 659 | 65.0% |
| Smartphone | 901 | 88.9% |
| Tablet | 465 | 45.9% |
| No Computing Device | 84 | 8.3% |
| Total | 1,014 | 100.0% |
Internet Access in New Llano
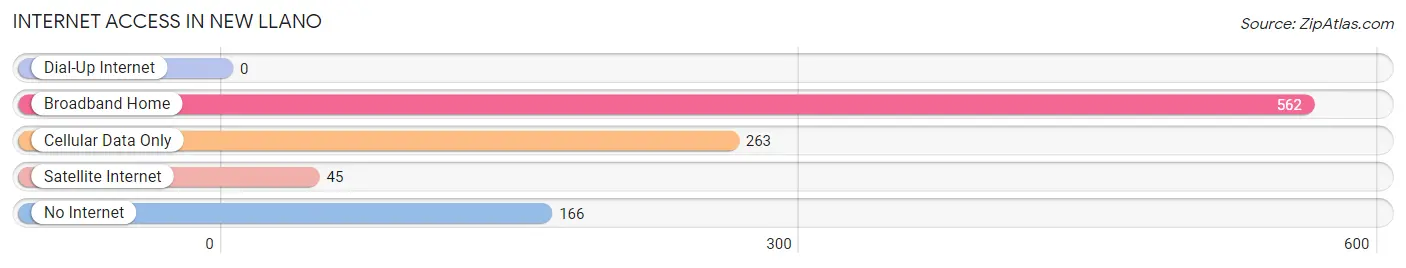
| Internet Type | # Households | % Households |
| Dial-Up Internet | 0 | 0.0% |
| Broadband Home | 562 | 55.4% |
| Cellular Data Only | 263 | 25.9% |
| Satellite Internet | 45 | 4.4% |
| No Internet | 166 | 16.4% |
| Total | 1,014 | 100.0% |
New Llano Summary
Llano, Louisiana is a small town located in Vernon Parish, Louisiana. It is situated on the banks of the Sabine River, and is home to a population of approximately 1,000 people. The town was founded in 1883 by the Louisiana and Texas Railroad Company, and was named after the nearby Llano Estacado, a large plateau in the Texas Panhandle.
History
The town of Llano was founded in 1883 by the Louisiana and Texas Railroad Company. The town was named after the nearby Llano Estacado, a large plateau in the Texas Panhandle. The town was originally a small farming community, and the railroad provided the town with a means of transportation and commerce. The town grew slowly, and by the early 1900s, it had become a bustling center of commerce and industry.
The town was home to several businesses, including a cotton gin, a sawmill, a grist mill, and a general store. The town also had a post office, a bank, and a hotel. The town was also home to a number of churches, including the First Baptist Church, the Methodist Church, and the Catholic Church.
In the early 1900s, the town was also home to a number of saloons and gambling halls. The town was known for its wild and rowdy atmosphere, and it was not uncommon for fights to break out in the streets.
In the 1920s, the town began to decline as the railroad began to move away from the area. The town was also hit hard by the Great Depression, and many of the businesses in the town closed. The town continued to decline until the 1950s, when the town began to experience a resurgence.
Geography
Llano is located in Vernon Parish, Louisiana. It is situated on the banks of the Sabine River, and is approximately 30 miles south of the city of Leesville. The town is surrounded by rolling hills and forests, and is home to a number of small lakes and streams. The town is located in a humid subtropical climate, and experiences hot, humid summers and mild winters.
Economy
The economy of Llano is largely based on agriculture and forestry. The town is home to a number of farms, and the surrounding area is home to a number of timber companies. The town is also home to a number of small businesses, including restaurants, stores, and service providers.
Demographics
As of the 2010 census, the population of Llano was 1,000. The town is predominantly white, with a small African American population. The median household income in the town is $30,000, and the median home value is $90,000. The town is served by the Vernon Parish School District.
Common Questions
What is the Total Population of New Llano?
Total Population of New Llano is 2,290.
What is the Total Male Population of New Llano?
Total Male Population of New Llano is 1,094.
What is the Total Female Population of New Llano?
Total Female Population of New Llano is 1,196.
What is the Ratio of Males per 100 Females in New Llano?
There are 91.47 Males per 100 Females in New Llano.
What is the Ratio of Females per 100 Males in New Llano?
There are 109.32 Females per 100 Males in New Llano.
What is the Median Population Age in New Llano?
Median Population Age in New Llano is 36.1 Years.
What is the Average Family Size in New Llano
Average Family Size in New Llano is 2.9 People.
What is the Average Household Size in New Llano
Average Household Size in New Llano is 2.3 People.
What is Per Capita Income in New Llano?
Per Capita income in New Llano is $25,036.
What is the Median Family Income in New Llano?
Median Family Income in New Llano is $59,598.
What is the Median Household income in New Llano?
Median Household Income in New Llano is $50,758.
What is Income or Wage Gap in New Llano?
Income or Wage Gap in New Llano is 30.8%.
Women in New Llano earn 69.2 cents for every dollar earned by a man.
What is Inequality or Gini Index in New Llano?
Inequality or Gini Index in New Llano is 0.40.
How Large is the Labor Force in New Llano?
There are 1,117 People in the Labor Forcein in New Llano.
What is the Percentage of People in the Labor Force in New Llano?
60.4% of People are in the Labor Force in New Llano.
What is the Unemployment Rate in New Llano?
Unemployment Rate in New Llano is 15.6%.