Vienna Bend, LA
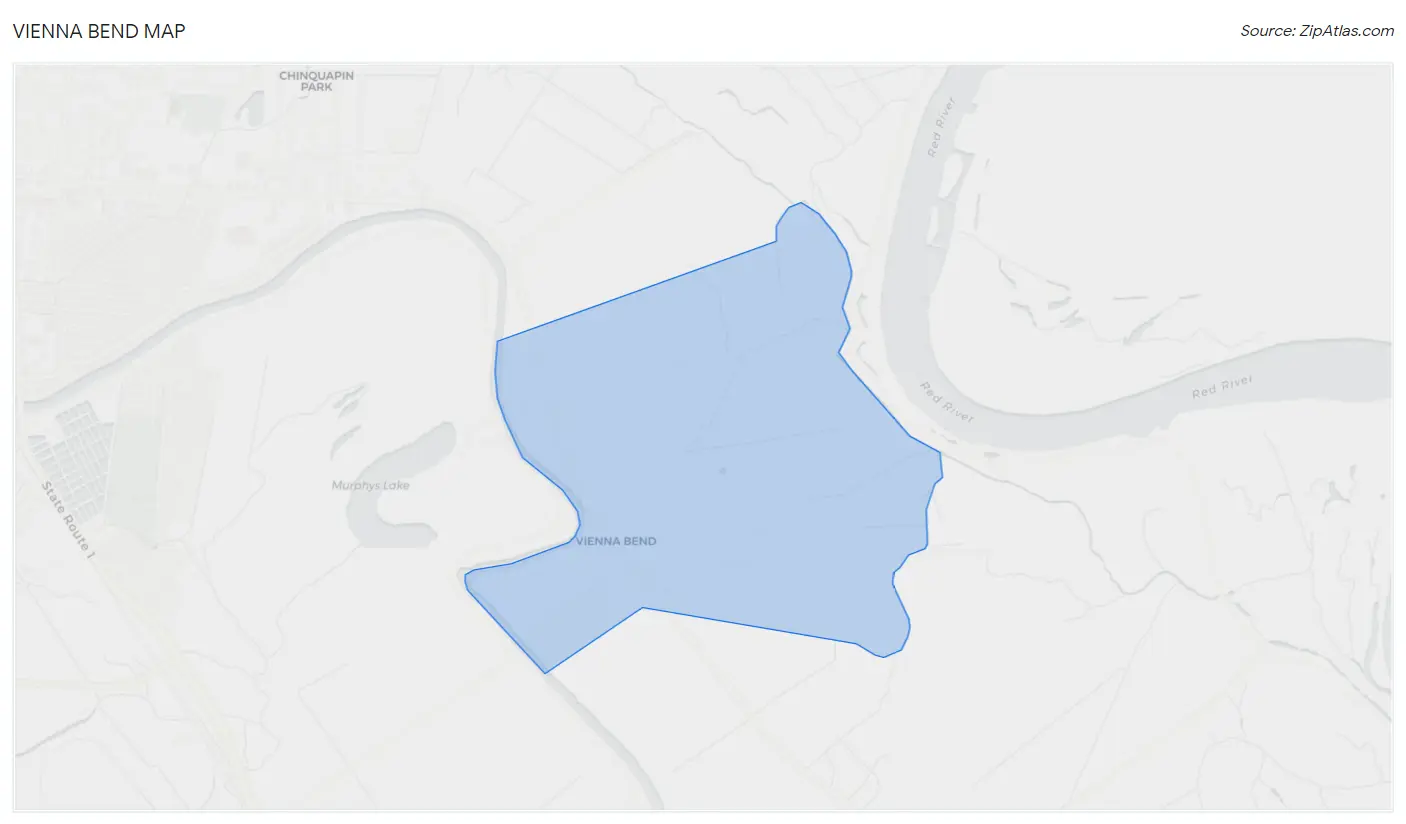
Vienna Bend Map
Vienna Bend Overview
1,666
TOTAL POPULATION
737
MALE POPULATION
929
FEMALE POPULATION
79.33
MALES / 100 FEMALES
126.05
FEMALES / 100 MALES
35.8
MEDIAN AGE
3.4
AVG FAMILY SIZE
3.0
AVG HOUSEHOLD SIZE
$19,594
PER CAPITA INCOME
$44,958
AVG FAMILY INCOME
$42,754
AVG HOUSEHOLD INCOME
5.2%
WAGE / INCOME GAP [ % ]
94.8¢/ $1
WAGE / INCOME GAP [ $ ]
0.39
INEQUALITY / GINI INDEX
906
LABOR FORCE [ PEOPLE ]
69.4%
PERCENT IN LABOR FORCE
12.6%
UNEMPLOYMENT RATE
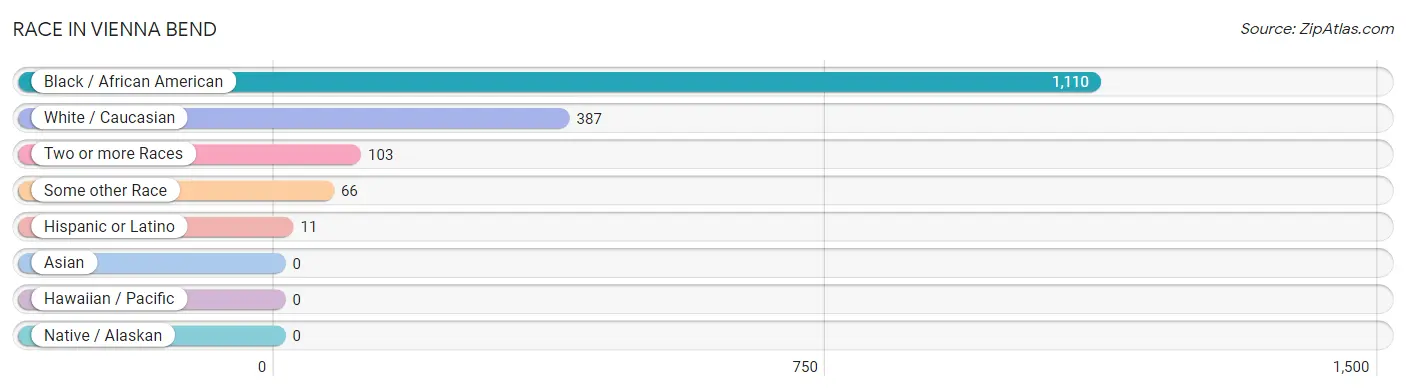
Race in Vienna Bend
The most populous races in Vienna Bend are Black / African American (1,110 | 66.6%), White / Caucasian (387 | 23.2%), and Two or more Races (103 | 6.2%).
| Race | # Population | % Population |
| Asian | 0 | 0.0% |
| Black / African American | 1,110 | 66.6% |
| Hawaiian / Pacific | 0 | 0.0% |
| Hispanic or Latino | 11 | 0.7% |
| Native / Alaskan | 0 | 0.0% |
| White / Caucasian | 387 | 23.2% |
| Two or more Races | 103 | 6.2% |
| Some other Race | 66 | 4.0% |
| Total | 1,666 | 100.0% |
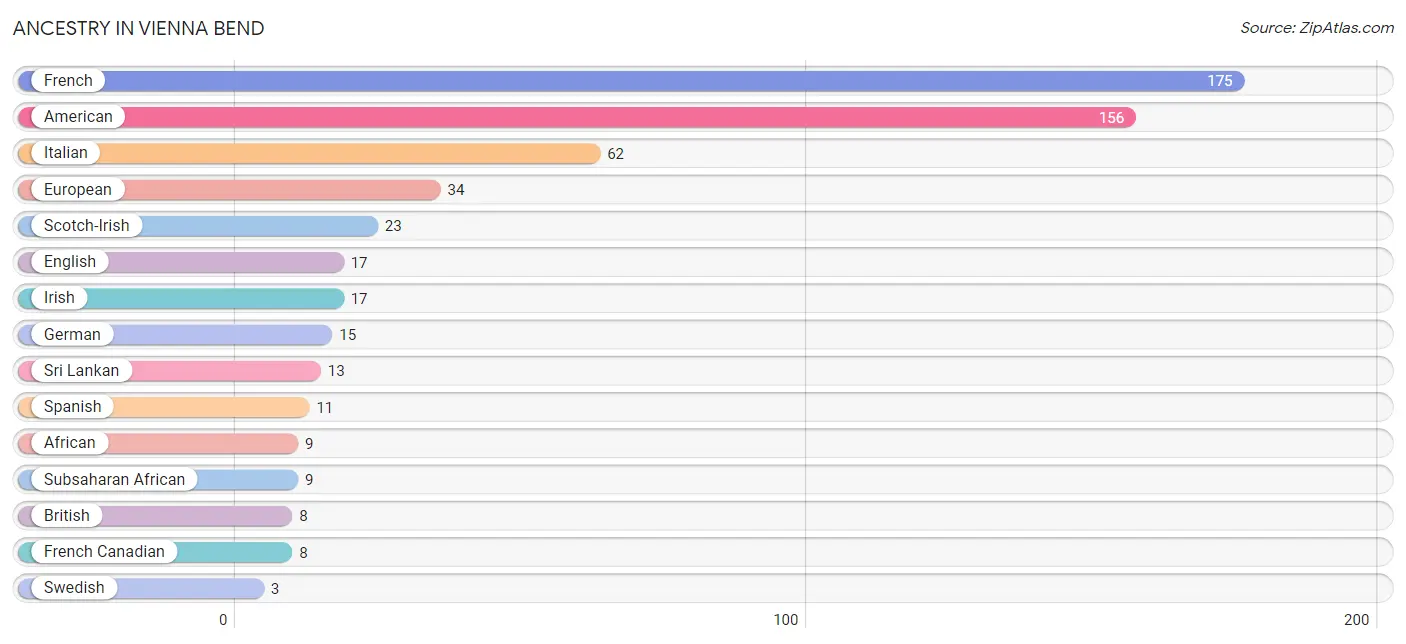
Ancestry in Vienna Bend
The most populous ancestries reported in Vienna Bend are French (175 | 10.5%), American (156 | 9.4%), Italian (62 | 3.7%), European (34 | 2.0%), and Scotch-Irish (23 | 1.4%), together accounting for 27.0% of all Vienna Bend residents.
| Ancestry | # Population | % Population |
| African | 9 | 0.5% |
| American | 156 | 9.4% |
| British | 8 | 0.5% |
| English | 17 | 1.0% |
| European | 34 | 2.0% |
| French | 175 | 10.5% |
| French Canadian | 8 | 0.5% |
| German | 15 | 0.9% |
| Irish | 17 | 1.0% |
| Italian | 62 | 3.7% |
| Scotch-Irish | 23 | 1.4% |
| Spanish | 11 | 0.7% |
| Sri Lankan | 13 | 0.8% |
| Subsaharan African | 9 | 0.5% |
| Swedish | 3 | 0.2% | View All 15 Rows |
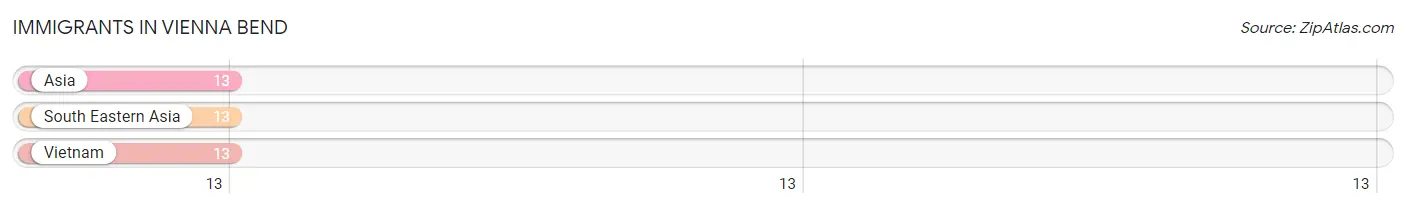
Immigrants in Vienna Bend
The most numerous immigrant groups reported in Vienna Bend came from Asia (13 | 0.8%), South Eastern Asia (13 | 0.8%), and Vietnam (13 | 0.8%), together accounting for 2.3% of all Vienna Bend residents.
| Immigration Origin | # Population | % Population |
| Asia | 13 | 0.8% |
| South Eastern Asia | 13 | 0.8% |
| Vietnam | 13 | 0.8% | View All 3 Rows |
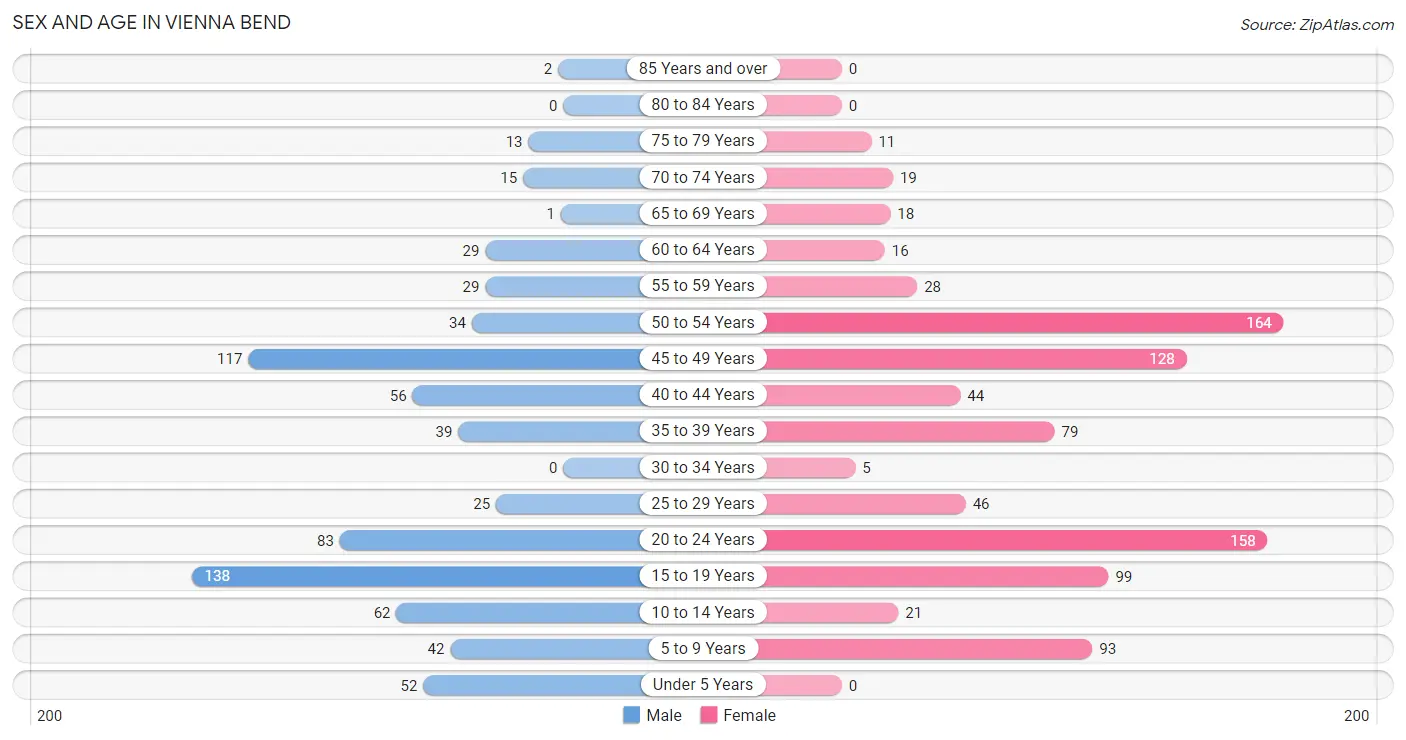
Sex and Age in Vienna Bend
Sex and Age in Vienna Bend
The most populous age groups in Vienna Bend are 15 to 19 Years (138 | 18.7%) for men and 50 to 54 Years (164 | 17.6%) for women.
| Age Bracket | Male | Female |
| Under 5 Years | 52 (7.1%) | 0 (0.0%) |
| 5 to 9 Years | 42 (5.7%) | 93 (10.0%) |
| 10 to 14 Years | 62 (8.4%) | 21 (2.3%) |
| 15 to 19 Years | 138 (18.7%) | 99 (10.7%) |
| 20 to 24 Years | 83 (11.3%) | 158 (17.0%) |
| 25 to 29 Years | 25 (3.4%) | 46 (5.0%) |
| 30 to 34 Years | 0 (0.0%) | 5 (0.5%) |
| 35 to 39 Years | 39 (5.3%) | 79 (8.5%) |
| 40 to 44 Years | 56 (7.6%) | 44 (4.7%) |
| 45 to 49 Years | 117 (15.9%) | 128 (13.8%) |
| 50 to 54 Years | 34 (4.6%) | 164 (17.6%) |
| 55 to 59 Years | 29 (3.9%) | 28 (3.0%) |
| 60 to 64 Years | 29 (3.9%) | 16 (1.7%) |
| 65 to 69 Years | 1 (0.1%) | 18 (1.9%) |
| 70 to 74 Years | 15 (2.0%) | 19 (2.1%) |
| 75 to 79 Years | 13 (1.8%) | 11 (1.2%) |
| 80 to 84 Years | 0 (0.0%) | 0 (0.0%) |
| 85 Years and over | 2 (0.3%) | 0 (0.0%) |
| Total | 737 (100.0%) | 929 (100.0%) |
Families and Households in Vienna Bend
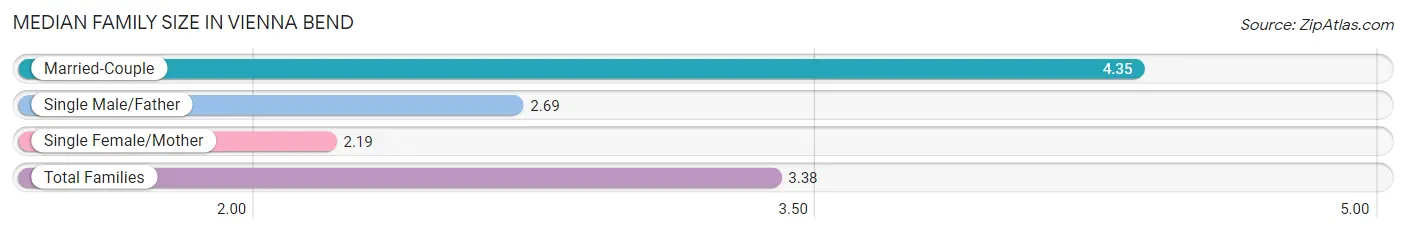
Median Family Size in Vienna Bend
The median family size in Vienna Bend is 3.38 persons per family, with married-couple families (245 | 54.4%) accounting for the largest median family size of 4.35 persons per family. On the other hand, single female/mother families (189 | 42.0%) represent the smallest median family size with 2.19 persons per family.
| Family Type | # Families | Family Size |
| Married-Couple | 245 (54.4%) | 4.35 |
| Single Male/Father | 16 (3.6%) | 2.69 |
| Single Female/Mother | 189 (42.0%) | 2.19 |
| Total Families | 450 (100.0%) | 3.38 |
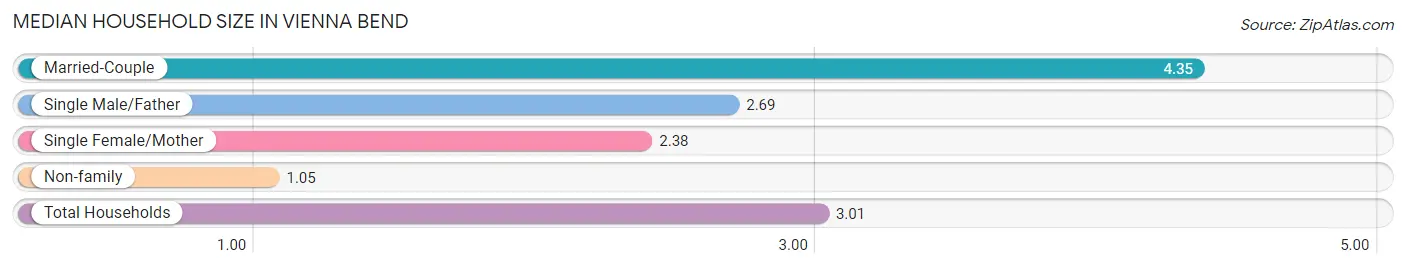
Median Household Size in Vienna Bend
The median household size in Vienna Bend is 3.01 persons per household, with married-couple households (245 | 44.2%) accounting for the largest median household size of 4.35 persons per household. non-family households (104 | 18.8%) represent the smallest median household size with 1.05 persons per household.
| Household Type | # Households | Household Size |
| Married-Couple | 245 (44.2%) | 4.35 |
| Single Male/Father | 16 (2.9%) | 2.69 |
| Single Female/Mother | 189 (34.1%) | 2.38 |
| Non-family | 104 (18.8%) | 1.05 |
| Total Households | 554 (100.0%) | 3.01 |
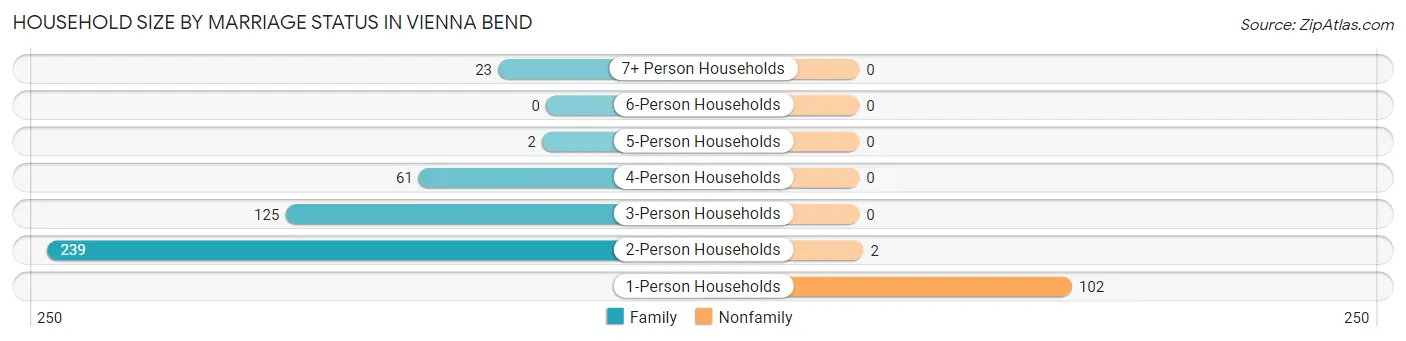
Household Size by Marriage Status in Vienna Bend
Out of a total of 554 households in Vienna Bend, 450 (81.2%) are family households, while 104 (18.8%) are nonfamily households. The most numerous type of family households are 2-person households, comprising 239, and the most common type of nonfamily households are 1-person households, comprising 102.
| Household Size | Family Households | Nonfamily Households |
| 1-Person Households | - | 102 (18.4%) |
| 2-Person Households | 239 (43.1%) | 2 (0.4%) |
| 3-Person Households | 125 (22.6%) | 0 (0.0%) |
| 4-Person Households | 61 (11.0%) | 0 (0.0%) |
| 5-Person Households | 2 (0.4%) | 0 (0.0%) |
| 6-Person Households | 0 (0.0%) | 0 (0.0%) |
| 7+ Person Households | 23 (4.2%) | 0 (0.0%) |
| Total | 450 (81.2%) | 104 (18.8%) |
Female Fertility in Vienna Bend
Fertility by Age in Vienna Bend
Average fertility rate in Vienna Bend is 11.0 births per 1,000 women. Women in the age bracket of 20 to 34 years have the highest fertility rate with 14.0 births per 1,000 women. Women in the age bracket of 20 to 34 years acount for 50.0% of all women with births.
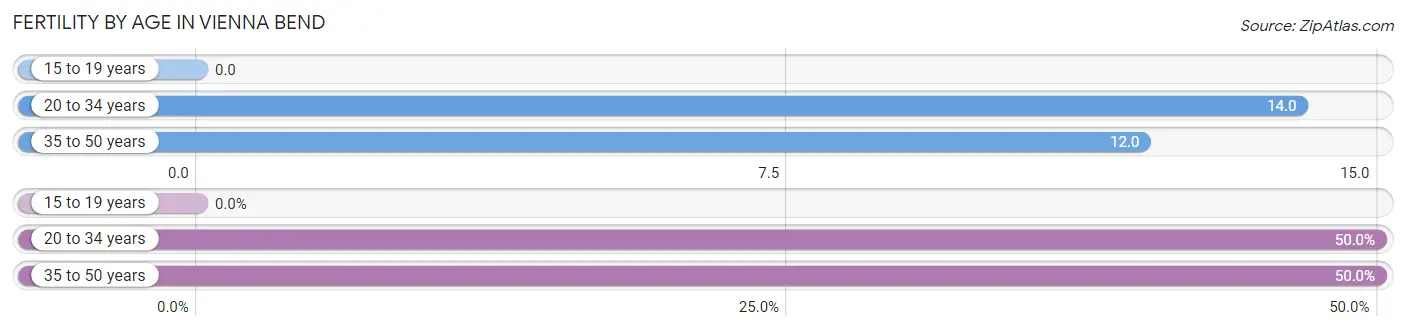
| Age Bracket | Women with Births | Births / 1,000 Women |
| 15 to 19 years | 0 (0.0%) | 0.0 |
| 20 to 34 years | 3 (50.0%) | 14.0 |
| 35 to 50 years | 3 (50.0%) | 12.0 |
| Total | 6 (100.0%) | 11.0 |
Fertility by Age by Marriage Status in Vienna Bend
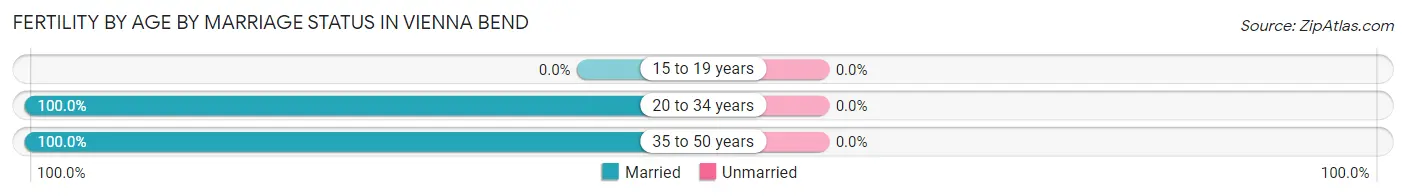
| Age Bracket | Married | Unmarried |
| 15 to 19 years | 0 (0.0%) | 0 (0.0%) |
| 20 to 34 years | 3 (100.0%) | 0 (0.0%) |
| 35 to 50 years | 3 (100.0%) | 0 (0.0%) |
| Total | 6 (100.0%) | 0 (0.0%) |
Fertility by Education in Vienna Bend
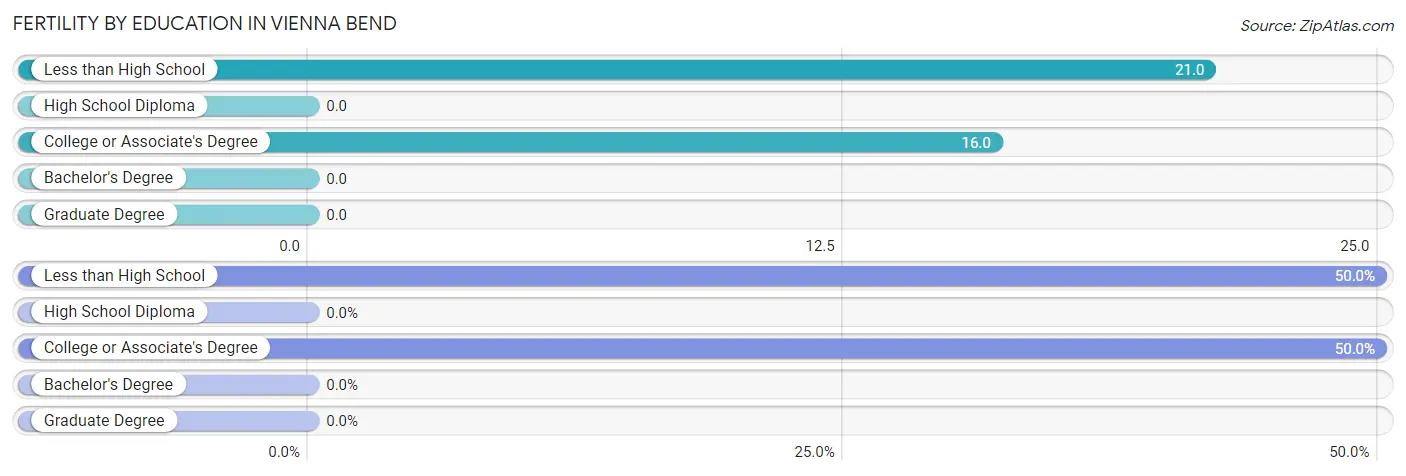
| Educational Attainment | Women with Births | Births / 1,000 Women |
| Less than High School | 3 (50.0%) | 21.0 |
| High School Diploma | 0 (0.0%) | 0.0 |
| College or Associate's Degree | 3 (50.0%) | 16.0 |
| Bachelor's Degree | 0 (0.0%) | 0.0 |
| Graduate Degree | 0 (0.0%) | 0.0 |
| Total | 6 (100.0%) | 11.0 |
Fertility by Education by Marriage Status in Vienna Bend
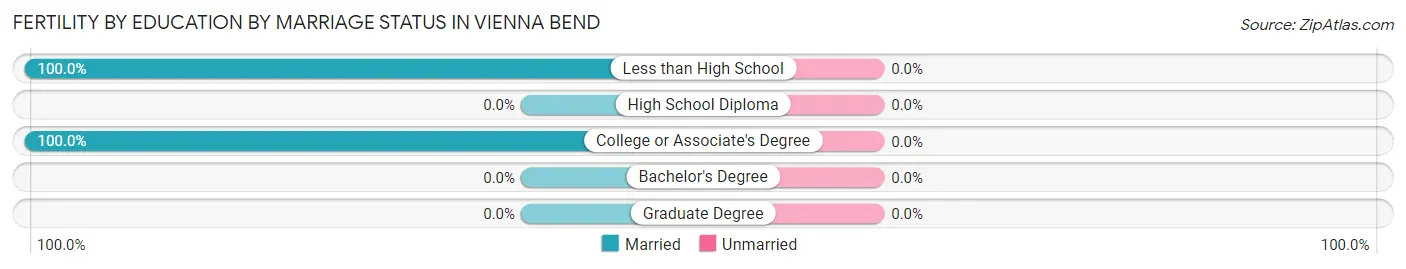
| Educational Attainment | Married | Unmarried |
| Less than High School | 3 (100.0%) | 0 (0.0%) |
| High School Diploma | 0 (0.0%) | 0 (0.0%) |
| College or Associate's Degree | 3 (100.0%) | 0 (0.0%) |
| Bachelor's Degree | 0 (0.0%) | 0 (0.0%) |
| Graduate Degree | 0 (0.0%) | 0 (0.0%) |
| Total | 6 (100.0%) | 0 (0.0%) |
Income in Vienna Bend
Income Overview in Vienna Bend
Per Capita Income in Vienna Bend is $19,594, while median incomes of families and households are $44,958 and $42,754 respectively.
| Characteristic | Number | Measure |
| Per Capita Income | 1,666 | $19,594 |
| Median Family Income | 450 | $44,958 |
| Mean Family Income | 450 | $58,015 |
| Median Household Income | 554 | $42,754 |
| Mean Household Income | 554 | $53,162 |
| Income Deficit | 450 | $0 |
| Wage / Income Gap (%) | 1,666 | 5.19% |
| Wage / Income Gap ($) | 1,666 | 94.81¢ per $1 |
| Gini / Inequality Index | 1,666 | 0.39 |
Earnings by Sex in Vienna Bend
Average Earnings in Vienna Bend are $21,213, $20,357 for men and $21,471 for women, a difference of 5.2%.
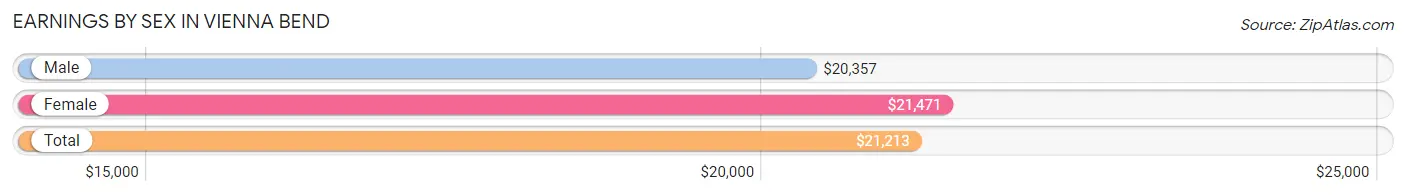
| Sex | Number | Average Earnings |
| Male | 330 (36.3%) | $20,357 |
| Female | 580 (63.7%) | $21,471 |
| Total | 910 (100.0%) | $21,213 |
Earnings by Sex by Income Bracket in Vienna Bend
The most common earnings brackets in Vienna Bend are $20,000 to $22,499 for men (63 | 19.1%) and $20,000 to $22,499 for women (209 | 36.0%).
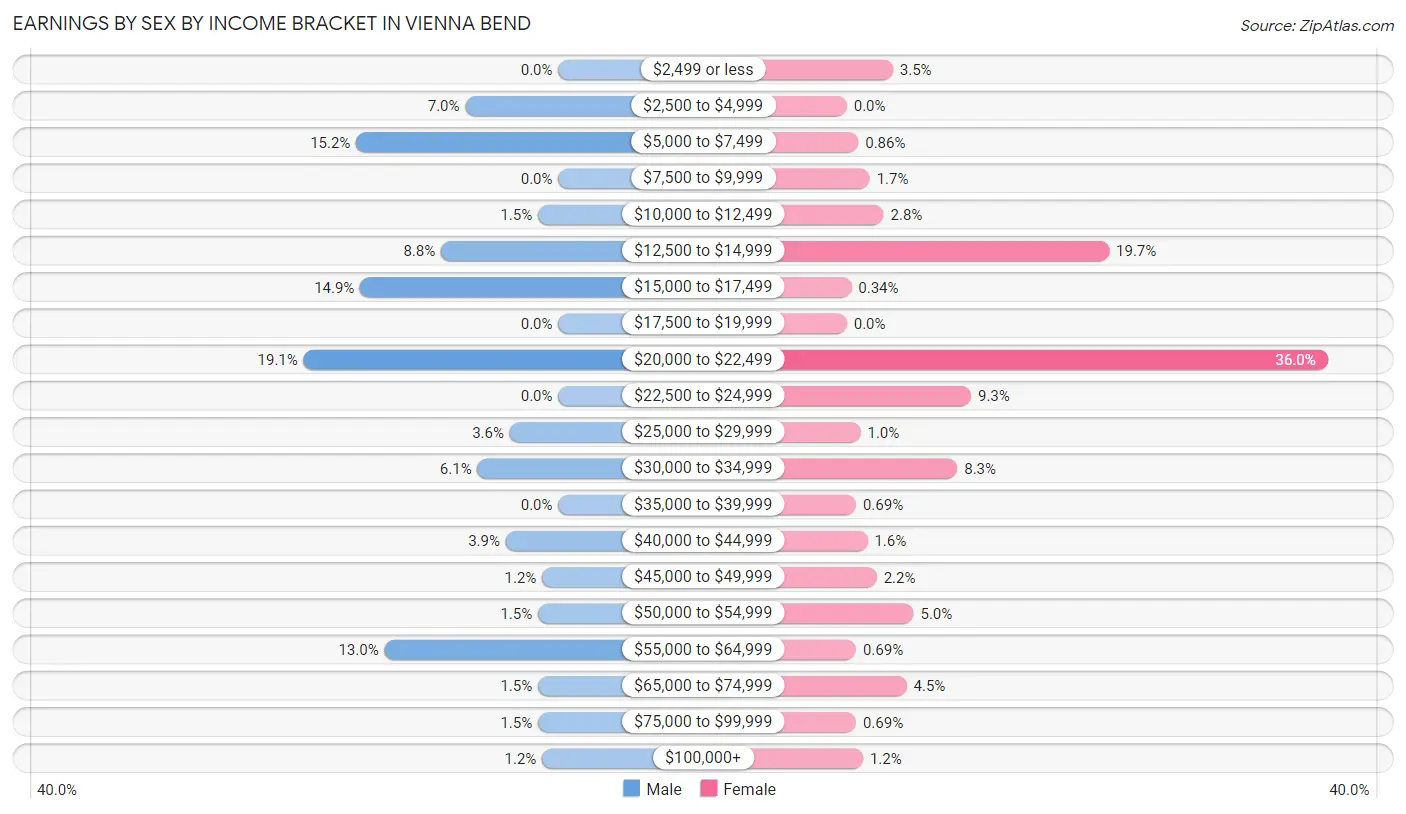
| Income | Male | Female |
| $2,499 or less | 0 (0.0%) | 20 (3.5%) |
| $2,500 to $4,999 | 23 (7.0%) | 0 (0.0%) |
| $5,000 to $7,499 | 50 (15.1%) | 5 (0.9%) |
| $7,500 to $9,999 | 0 (0.0%) | 10 (1.7%) |
| $10,000 to $12,499 | 5 (1.5%) | 16 (2.8%) |
| $12,500 to $14,999 | 29 (8.8%) | 114 (19.7%) |
| $15,000 to $17,499 | 49 (14.8%) | 2 (0.3%) |
| $17,500 to $19,999 | 0 (0.0%) | 0 (0.0%) |
| $20,000 to $22,499 | 63 (19.1%) | 209 (36.0%) |
| $22,500 to $24,999 | 0 (0.0%) | 54 (9.3%) |
| $25,000 to $29,999 | 12 (3.6%) | 6 (1.0%) |
| $30,000 to $34,999 | 20 (6.1%) | 48 (8.3%) |
| $35,000 to $39,999 | 0 (0.0%) | 4 (0.7%) |
| $40,000 to $44,999 | 13 (3.9%) | 9 (1.5%) |
| $45,000 to $49,999 | 4 (1.2%) | 13 (2.2%) |
| $50,000 to $54,999 | 5 (1.5%) | 29 (5.0%) |
| $55,000 to $64,999 | 43 (13.0%) | 4 (0.7%) |
| $65,000 to $74,999 | 5 (1.5%) | 26 (4.5%) |
| $75,000 to $99,999 | 5 (1.5%) | 4 (0.7%) |
| $100,000+ | 4 (1.2%) | 7 (1.2%) |
| Total | 330 (100.0%) | 580 (100.0%) |
Earnings by Sex by Educational Attainment in Vienna Bend
Average earnings in Vienna Bend are $21,885 for men and $21,993 for women, a difference of 0.5%. Men with an educational attainment of college or associate's degree enjoy the highest average annual earnings of $30,882, while those with high school diploma education earn the least with $21,587. Women with an educational attainment of graduate degree earn the most with the average annual earnings of $84,375, while those with high school diploma education have the smallest earnings of $10,625.
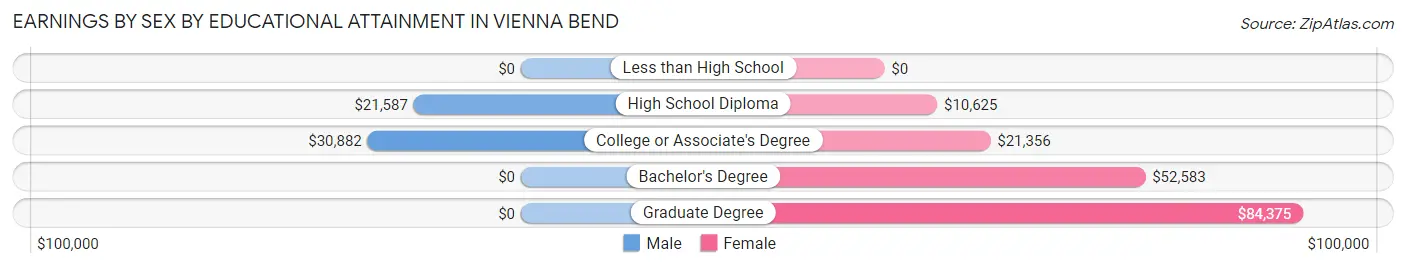
| Educational Attainment | Male Income | Female Income |
| Less than High School | - | - |
| High School Diploma | $21,587 | $10,625 |
| College or Associate's Degree | $30,882 | $21,356 |
| Bachelor's Degree | - | - |
| Graduate Degree | - | - |
| Total | $21,885 | $21,993 |
Family Income in Vienna Bend
Family Income Brackets in Vienna Bend
According to the Vienna Bend family income data, there are 135 families falling into the $50,000 to $74,999 income range, which is the most common income bracket and makes up 30.0% of all families. Conversely, the $200,000+ income bracket is the least frequent group with only 1 families (0.2%) belonging to this category.
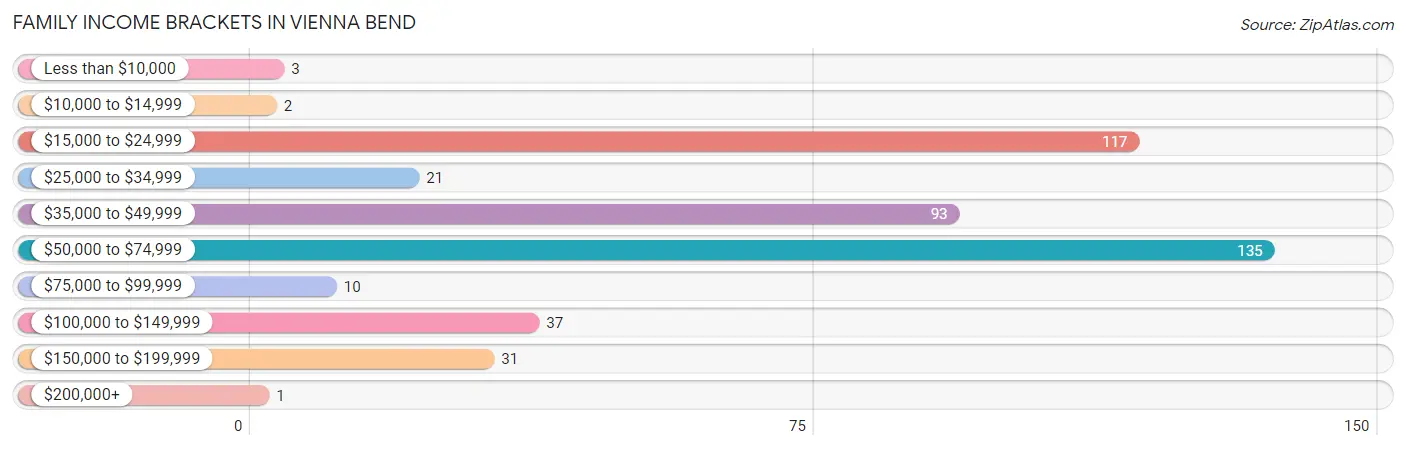
| Income Bracket | # Families | % Families |
| Less than $10,000 | 3 | 0.7% |
| $10,000 to $14,999 | 2 | 0.4% |
| $15,000 to $24,999 | 117 | 26.0% |
| $25,000 to $34,999 | 21 | 4.7% |
| $35,000 to $49,999 | 93 | 20.7% |
| $50,000 to $74,999 | 135 | 30.0% |
| $75,000 to $99,999 | 10 | 2.2% |
| $100,000 to $149,999 | 37 | 8.2% |
| $150,000 to $199,999 | 31 | 6.9% |
| $200,000+ | 1 | 0.2% |
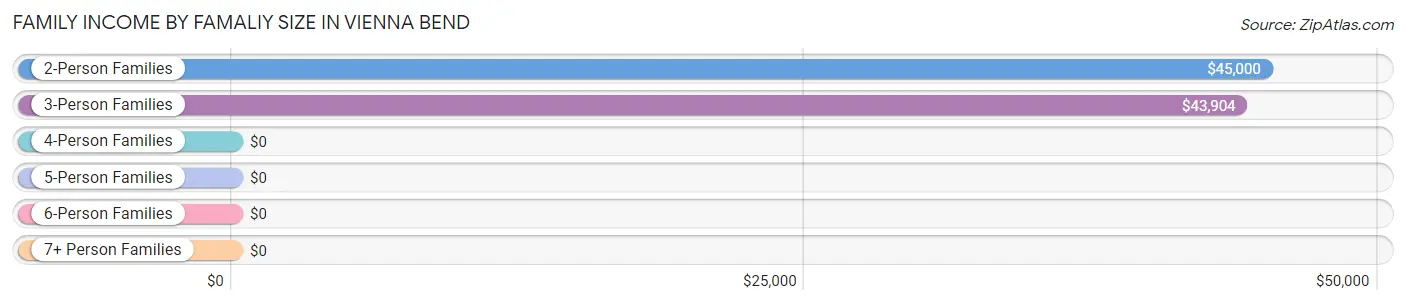
Family Income by Famaliy Size in Vienna Bend
2-person families (278 | 61.8%) account for the highest median family income in Vienna Bend with $45,000 per family, while 2-person families (278 | 61.8%) have the highest median income of $22,500 per family member.
| Income Bracket | # Families | Median Income |
| 2-Person Families | 278 (61.8%) | $45,000 |
| 3-Person Families | 86 (19.1%) | $43,904 |
| 4-Person Families | 61 (13.6%) | $0 |
| 5-Person Families | 2 (0.4%) | $0 |
| 6-Person Families | 0 (0.0%) | $0 |
| 7+ Person Families | 23 (5.1%) | $0 |
| Total | 450 (100.0%) | $44,958 |
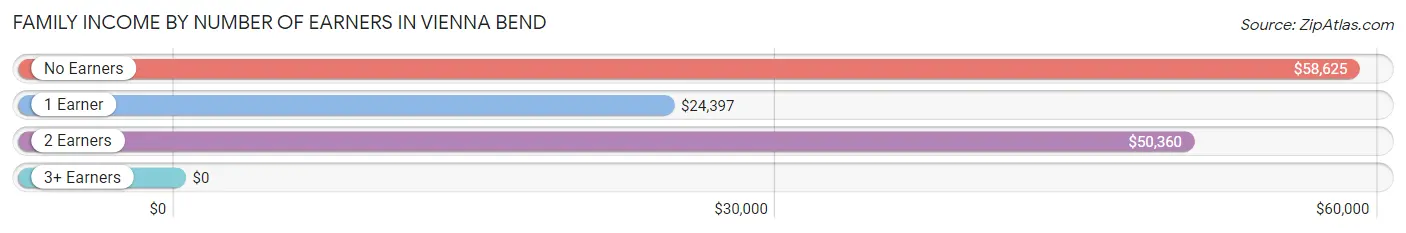
Family Income by Number of Earners in Vienna Bend
| Number of Earners | # Families | Median Income |
| No Earners | 57 (12.7%) | $58,625 |
| 1 Earner | 179 (39.8%) | $24,397 |
| 2 Earners | 195 (43.3%) | $50,360 |
| 3+ Earners | 19 (4.2%) | $0 |
| Total | 450 (100.0%) | $44,958 |
Household Income in Vienna Bend
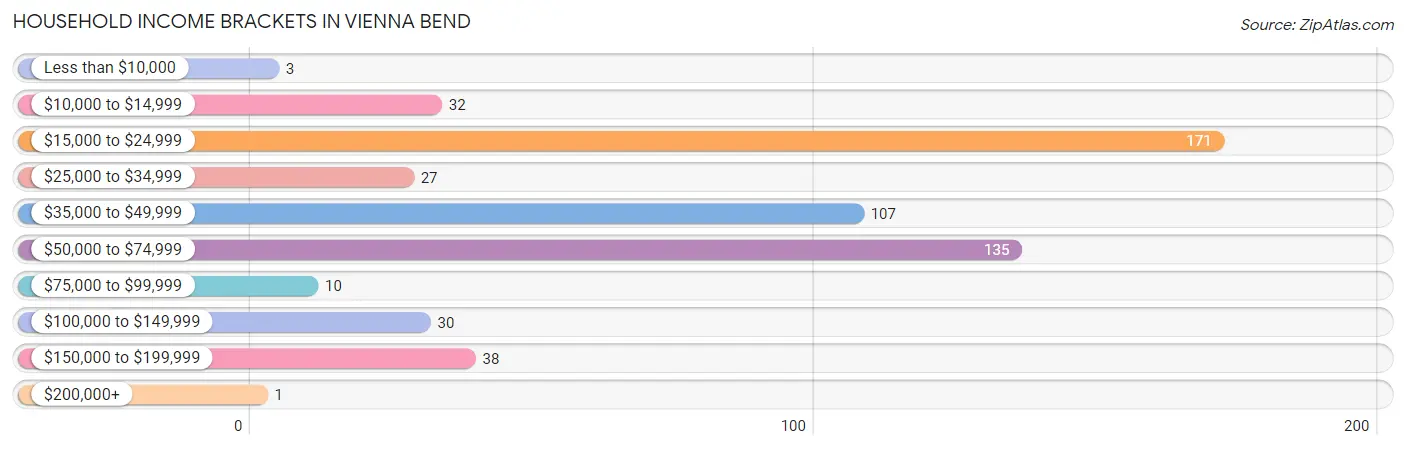
Household Income Brackets in Vienna Bend
With 171 households falling in the category, the $15,000 to $24,999 income range is the most frequent in Vienna Bend, accounting for 30.9% of all households. In contrast, only 1 households (0.2%) fall into the $200,000+ income bracket, making it the least populous group.
| Income Bracket | # Households | % Households |
| Less than $10,000 | 3 | 0.5% |
| $10,000 to $14,999 | 32 | 5.8% |
| $15,000 to $24,999 | 171 | 30.9% |
| $25,000 to $34,999 | 27 | 4.9% |
| $35,000 to $49,999 | 107 | 19.3% |
| $50,000 to $74,999 | 135 | 24.4% |
| $75,000 to $99,999 | 10 | 1.8% |
| $100,000 to $149,999 | 30 | 5.4% |
| $150,000 to $199,999 | 38 | 6.9% |
| $200,000+ | 1 | 0.2% |
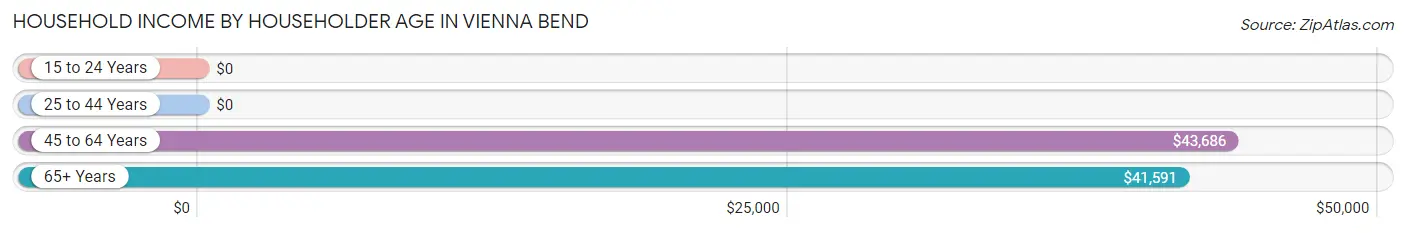
Household Income by Householder Age in Vienna Bend
The median household income in Vienna Bend is $42,754, with the highest median household income of $43,686 found in the 45 to 64 years age bracket for the primary householder. A total of 322 households (58.1%) fall into this category. Meanwhile, the 15 to 24 years age bracket for the primary householder has the lowest median household income of $0, with 10 households (1.8%) in this group.
| Income Bracket | # Households | Median Income |
| 15 to 24 Years | 10 (1.8%) | $0 |
| 25 to 44 Years | 168 (30.3%) | $0 |
| 45 to 64 Years | 322 (58.1%) | $43,686 |
| 65+ Years | 54 (9.8%) | $41,591 |
| Total | 554 (100.0%) | $42,754 |
Poverty in Vienna Bend
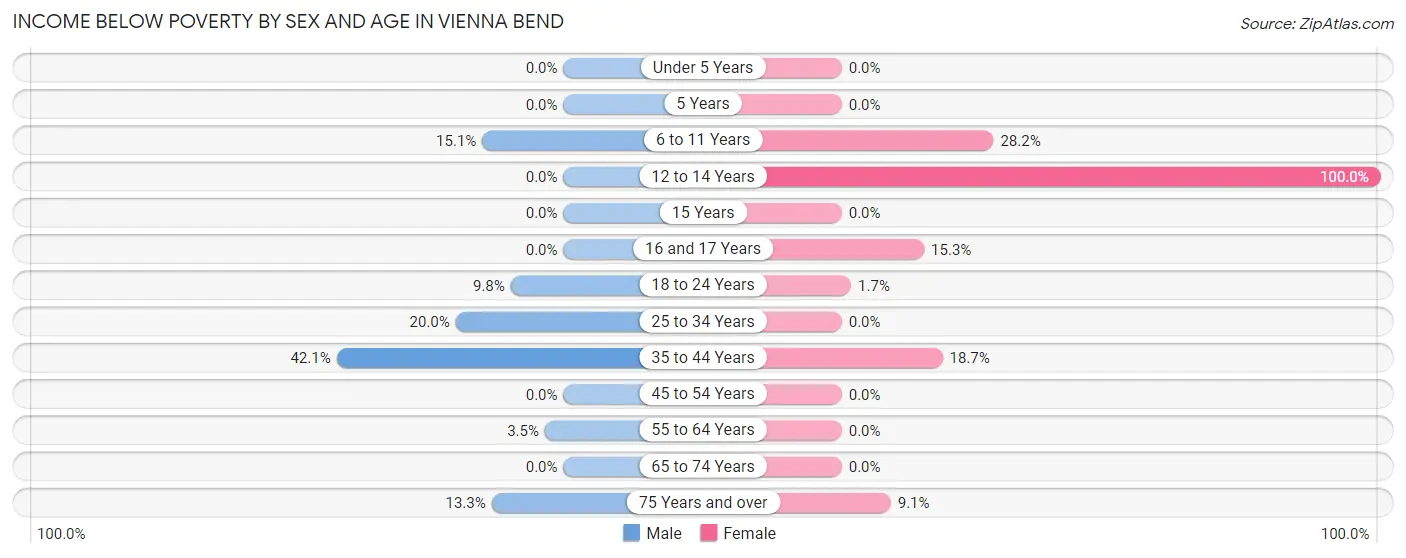
Income Below Poverty by Sex and Age in Vienna Bend
With 9.5% poverty level for males and 8.2% for females among the residents of Vienna Bend, 35 to 44 year old males and 12 to 14 year old females are the most vulnerable to poverty, with 40 males (42.1%) and 7 females (100.0%) in their respective age groups living below the poverty level.
| Age Bracket | Male | Female |
| Under 5 Years | 0 (0.0%) | 0 (0.0%) |
| 5 Years | 0 (0.0%) | 0 (0.0%) |
| 6 to 11 Years | 11 (15.1%) | 29 (28.2%) |
| 12 to 14 Years | 0 (0.0%) | 7 (100.0%) |
| 15 Years | 0 (0.0%) | 0 (0.0%) |
| 16 and 17 Years | 0 (0.0%) | 13 (15.3%) |
| 18 to 24 Years | 10 (9.8%) | 3 (1.7%) |
| 25 to 34 Years | 5 (20.0%) | 0 (0.0%) |
| 35 to 44 Years | 40 (42.1%) | 23 (18.7%) |
| 45 to 54 Years | 0 (0.0%) | 0 (0.0%) |
| 55 to 64 Years | 2 (3.5%) | 0 (0.0%) |
| 65 to 74 Years | 0 (0.0%) | 0 (0.0%) |
| 75 Years and over | 2 (13.3%) | 1 (9.1%) |
| Total | 70 (9.5%) | 76 (8.2%) |
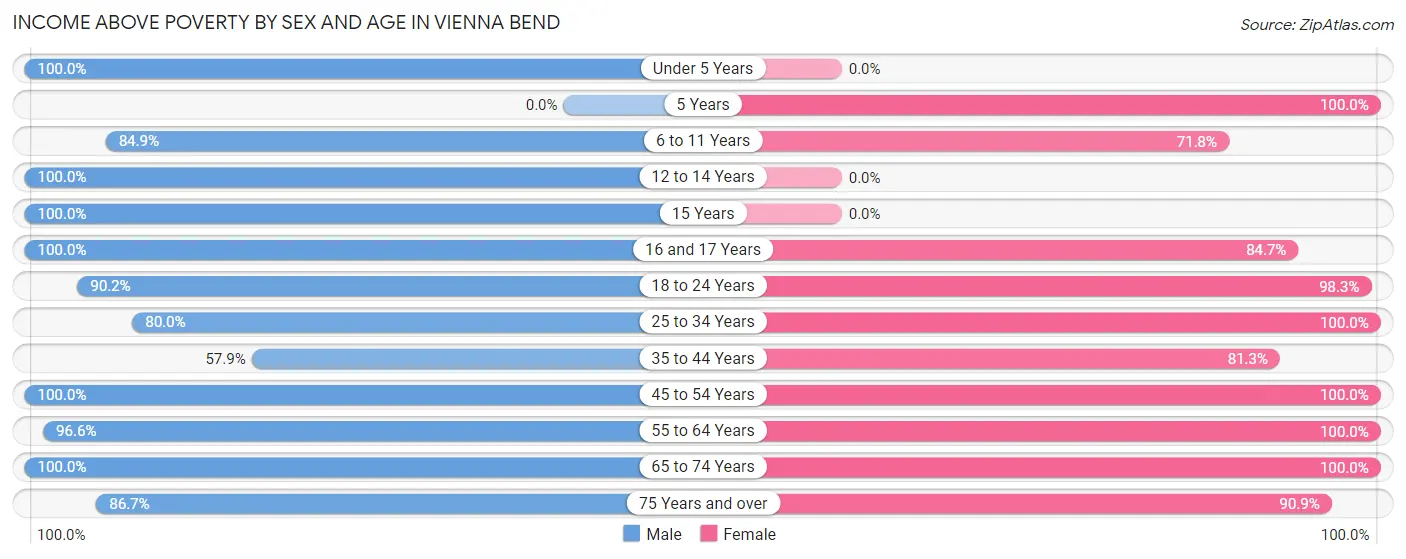
Income Above Poverty by Sex and Age in Vienna Bend
According to the poverty statistics in Vienna Bend, males aged under 5 years and females aged 5 years are the age groups that are most secure financially, with 100.0% of males and 100.0% of females in these age groups living above the poverty line.
| Age Bracket | Male | Female |
| Under 5 Years | 52 (100.0%) | 0 (0.0%) |
| 5 Years | 0 (0.0%) | 4 (100.0%) |
| 6 to 11 Years | 62 (84.9%) | 74 (71.8%) |
| 12 to 14 Years | 31 (100.0%) | 0 (0.0%) |
| 15 Years | 90 (100.0%) | 0 (0.0%) |
| 16 and 17 Years | 29 (100.0%) | 72 (84.7%) |
| 18 to 24 Years | 92 (90.2%) | 169 (98.3%) |
| 25 to 34 Years | 20 (80.0%) | 51 (100.0%) |
| 35 to 44 Years | 55 (57.9%) | 100 (81.3%) |
| 45 to 54 Years | 151 (100.0%) | 292 (100.0%) |
| 55 to 64 Years | 56 (96.6%) | 44 (100.0%) |
| 65 to 74 Years | 16 (100.0%) | 37 (100.0%) |
| 75 Years and over | 13 (86.7%) | 10 (90.9%) |
| Total | 667 (90.5%) | 853 (91.8%) |
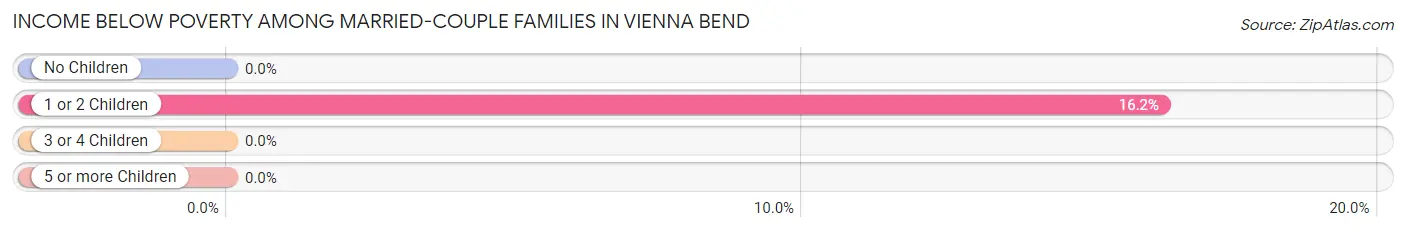
Income Below Poverty Among Married-Couple Families in Vienna Bend
The poverty statistics for married-couple families in Vienna Bend show that 7.8% or 19 of the total 245 families live below the poverty line. Families with 1 or 2 children have the highest poverty rate of 16.2%, comprising of 19 families. On the other hand, families with no children have the lowest poverty rate of 0.0%, which includes 0 families.
| Children | Above Poverty | Below Poverty |
| No Children | 105 (100.0%) | 0 (0.0%) |
| 1 or 2 Children | 98 (83.8%) | 19 (16.2%) |
| 3 or 4 Children | 0 (0.0%) | 0 (0.0%) |
| 5 or more Children | 23 (100.0%) | 0 (0.0%) |
| Total | 226 (92.2%) | 19 (7.8%) |
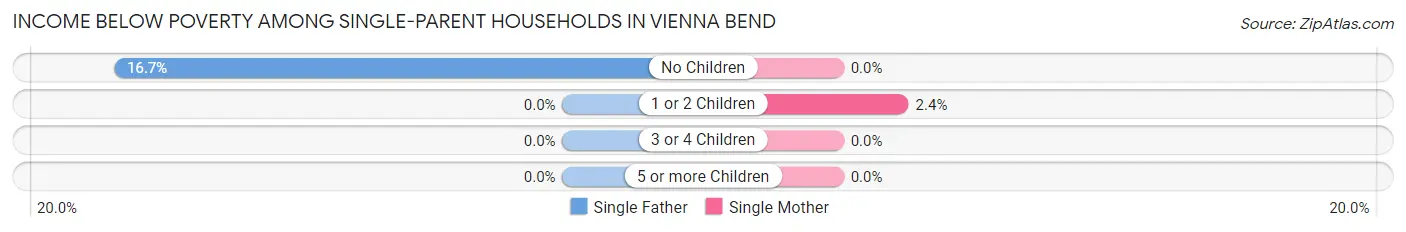
Income Below Poverty Among Single-Parent Households in Vienna Bend
According to the poverty data in Vienna Bend, 12.5% or 2 single-father households and 1.6% or 3 single-mother households are living below the poverty line. Among single-father households, those with no children have the highest poverty rate, with 2 households (16.7%) experiencing poverty. Likewise, among single-mother households, those with 1 or 2 children have the highest poverty rate, with 3 households (2.4%) falling below the poverty line.
| Children | Single Father | Single Mother |
| No Children | 2 (16.7%) | 0 (0.0%) |
| 1 or 2 Children | 0 (0.0%) | 3 (2.4%) |
| 3 or 4 Children | 0 (0.0%) | 0 (0.0%) |
| 5 or more Children | 0 (0.0%) | 0 (0.0%) |
| Total | 2 (12.5%) | 3 (1.6%) |
Income Below Poverty Among Married-Couple vs Single-Parent Households in Vienna Bend
The poverty data for Vienna Bend shows that 19 of the married-couple family households (7.8%) and 5 of the single-parent households (2.4%) are living below the poverty level. Within the married-couple family households, those with 1 or 2 children have the highest poverty rate, with 19 households (16.2%) falling below the poverty line. Among the single-parent households, those with no children have the highest poverty rate, with 2 household (2.6%) living below poverty.
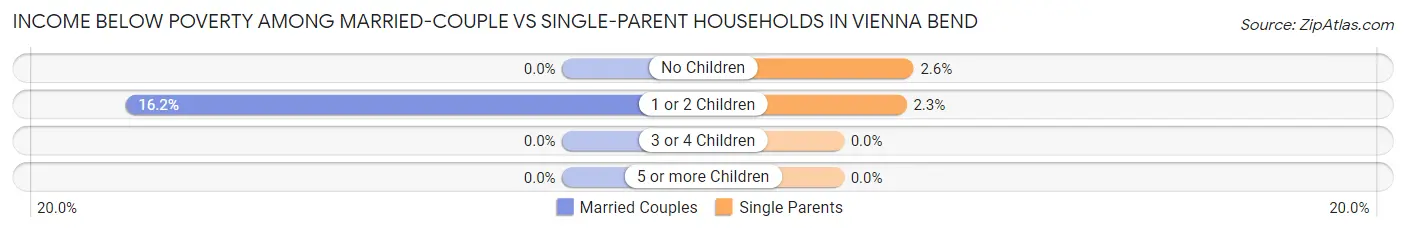
| Children | Married-Couple Families | Single-Parent Households |
| No Children | 0 (0.0%) | 2 (2.6%) |
| 1 or 2 Children | 19 (16.2%) | 3 (2.3%) |
| 3 or 4 Children | 0 (0.0%) | 0 (0.0%) |
| 5 or more Children | 0 (0.0%) | 0 (0.0%) |
| Total | 19 (7.8%) | 5 (2.4%) |
Employment Characteristics in Vienna Bend
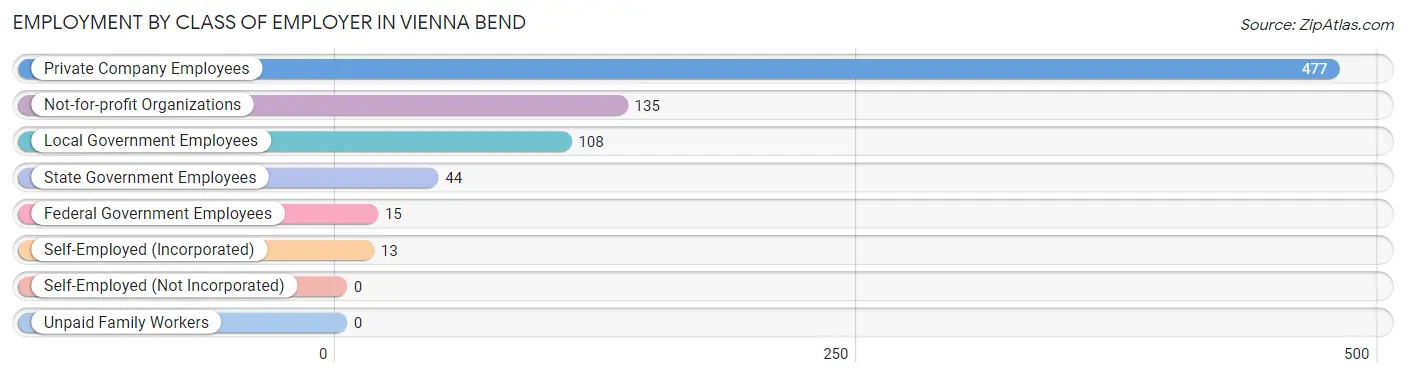
Employment by Class of Employer in Vienna Bend
Among the 792 employed individuals in Vienna Bend, private company employees (477 | 60.2%), not-for-profit organizations (135 | 17.1%), and local government employees (108 | 13.6%) make up the most common classes of employment.
| Employer Class | # Employees | % Employees |
| Private Company Employees | 477 | 60.2% |
| Self-Employed (Incorporated) | 13 | 1.6% |
| Self-Employed (Not Incorporated) | 0 | 0.0% |
| Not-for-profit Organizations | 135 | 17.1% |
| Local Government Employees | 108 | 13.6% |
| State Government Employees | 44 | 5.6% |
| Federal Government Employees | 15 | 1.9% |
| Unpaid Family Workers | 0 | 0.0% |
| Total | 792 | 100.0% |
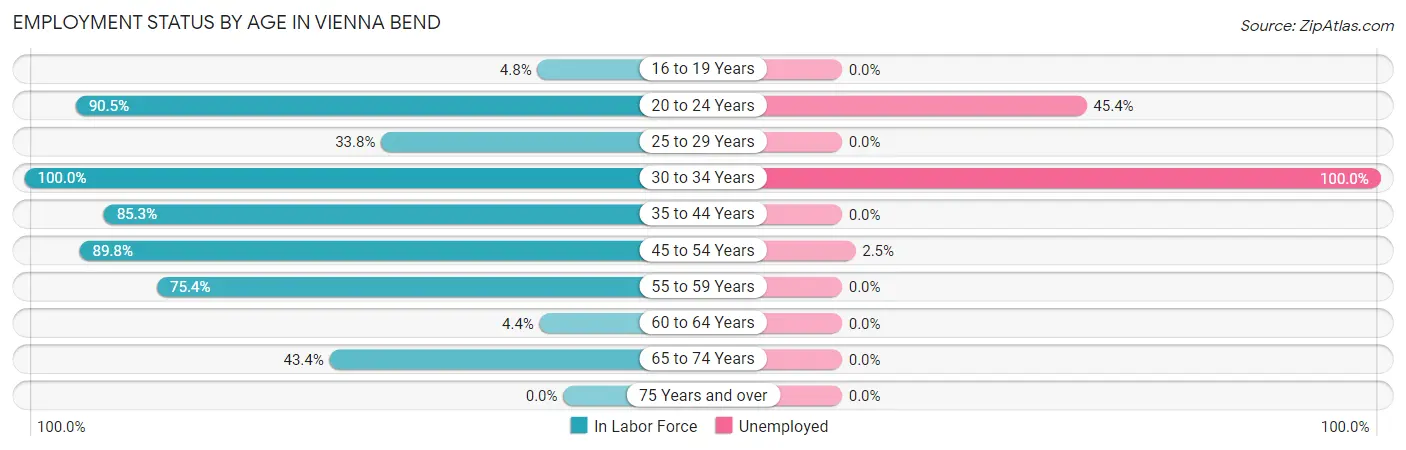
Employment Status by Age in Vienna Bend
According to the labor force statistics for Vienna Bend, out of the total population over 16 years of age (1,306), 69.4% or 906 individuals are in the labor force, with 12.6% or 114 of them unemployed. The age group with the highest labor force participation rate is 30 to 34 years, with 100.0% or 5 individuals in the labor force. Within the labor force, the 30 to 34 years age range has the highest percentage of unemployed individuals, with 100.0% or 5 of them being unemployed.
| Age Bracket | In Labor Force | Unemployed |
| 16 to 19 Years | 7 (4.8%) | 0 (0.0%) |
| 20 to 24 Years | 218 (90.5%) | 99 (45.4%) |
| 25 to 29 Years | 24 (33.8%) | 0 (0.0%) |
| 30 to 34 Years | 5 (100.0%) | 5 (100.0%) |
| 35 to 44 Years | 186 (85.3%) | 0 (0.0%) |
| 45 to 54 Years | 398 (89.8%) | 10 (2.5%) |
| 55 to 59 Years | 43 (75.4%) | 0 (0.0%) |
| 60 to 64 Years | 2 (4.4%) | 0 (0.0%) |
| 65 to 74 Years | 23 (43.4%) | 0 (0.0%) |
| 75 Years and over | 0 (0.0%) | 0 (0.0%) |
| Total | 906 (69.4%) | 114 (12.6%) |
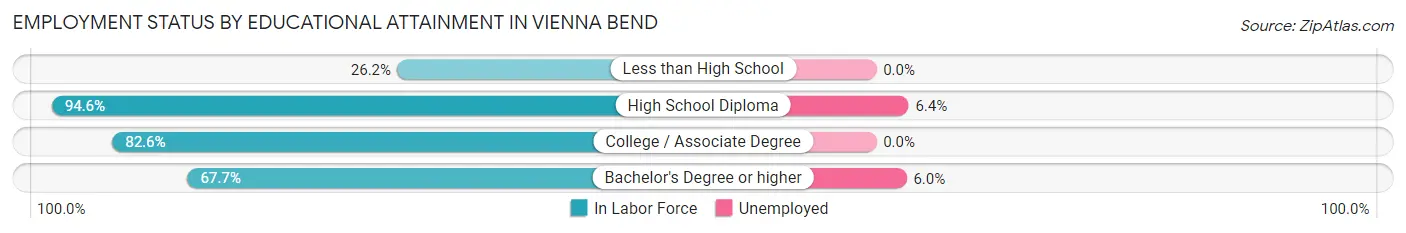
Employment Status by Educational Attainment in Vienna Bend
According to labor force statistics for Vienna Bend, 78.4% of individuals (658) out of the total population between 25 and 64 years of age (839) are in the labor force, with 2.3% or 15 of them being unemployed. The group with the highest labor force participation rate are those with the educational attainment of high school diploma, with 94.6% or 157 individuals in the labor force. Within the labor force, individuals with high school diploma education have the highest percentage of unemployment, with 6.4% or 10 of them being unemployed.
| Educational Attainment | In Labor Force | Unemployed |
| Less than High School | 17 (26.2%) | 0 (0.0%) |
| High School Diploma | 157 (94.6%) | 11 (6.4%) |
| College / Associate Degree | 400 (82.6%) | 0 (0.0%) |
| Bachelor's Degree or higher | 84 (67.7%) | 7 (6.0%) |
| Total | 658 (78.4%) | 19 (2.3%) |
Employment Occupations by Sex in Vienna Bend
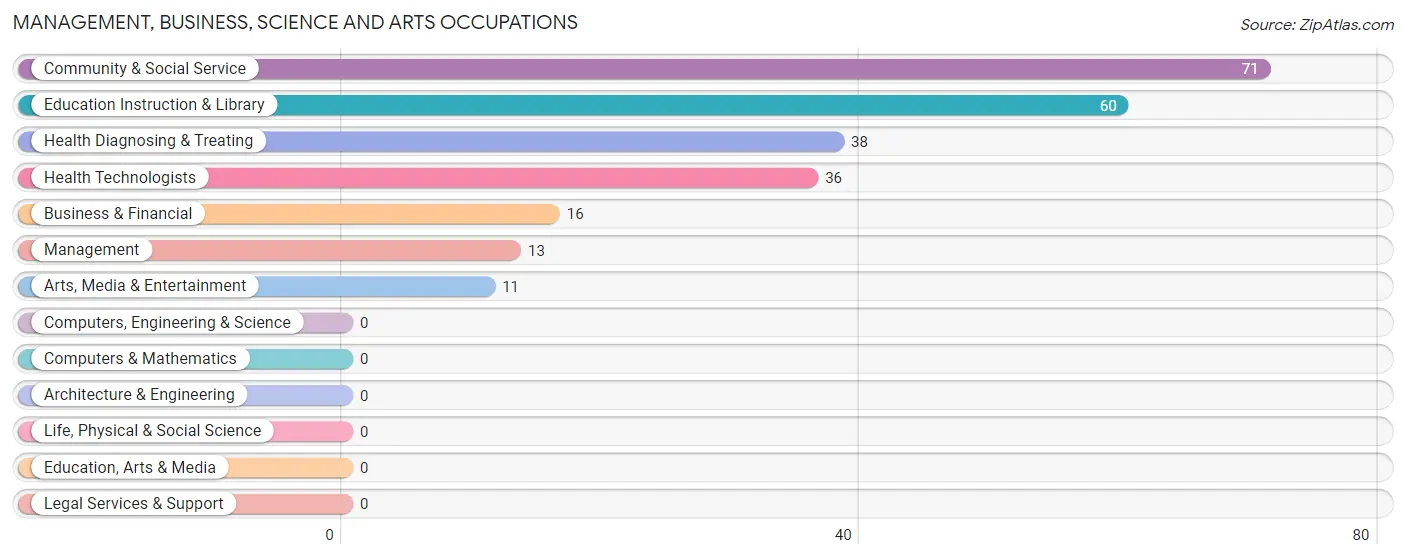
Management, Business, Science and Arts Occupations
The most common Management, Business, Science and Arts occupations in Vienna Bend are Community & Social Service (71 | 9.0%), Education Instruction & Library (60 | 7.6%), Health Diagnosing & Treating (38 | 4.8%), Health Technologists (36 | 4.5%), and Business & Financial (16 | 2.0%).
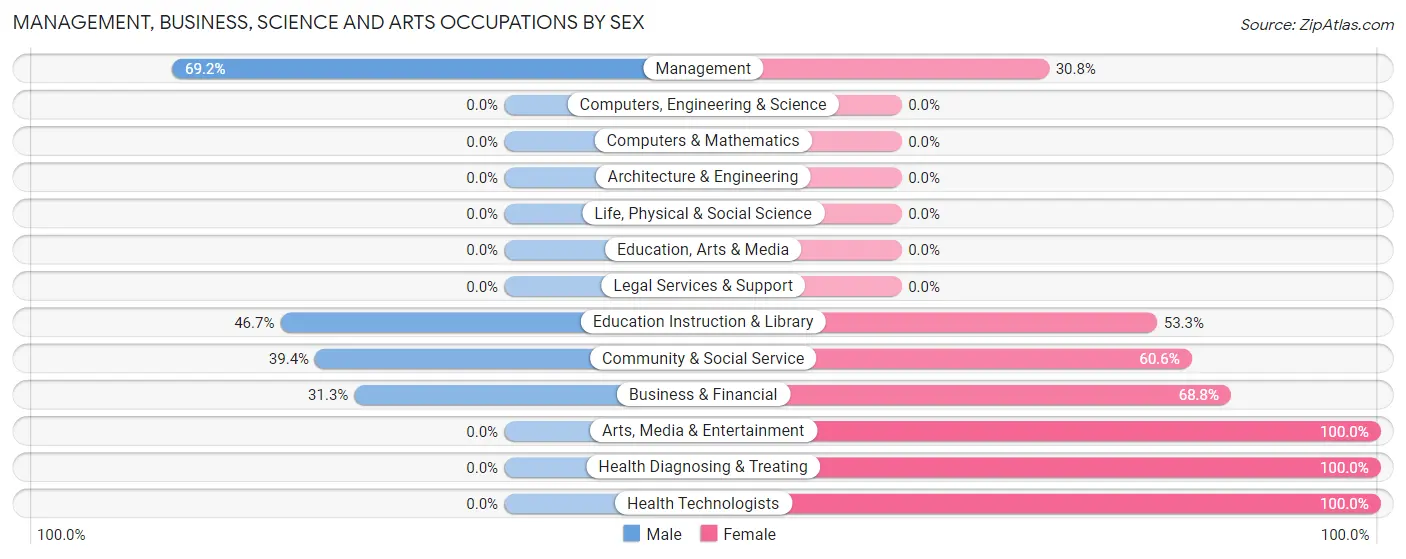
Management, Business, Science and Arts Occupations by Sex
Within the Management, Business, Science and Arts occupations in Vienna Bend, the most male-oriented occupations are Management (69.2%), Education Instruction & Library (46.7%), and Community & Social Service (39.4%), while the most female-oriented occupations are Arts, Media & Entertainment (100.0%), Health Diagnosing & Treating (100.0%), and Health Technologists (100.0%).
| Occupation | Male | Female |
| Management | 9 (69.2%) | 4 (30.8%) |
| Business & Financial | 5 (31.2%) | 11 (68.8%) |
| Computers, Engineering & Science | 0 (0.0%) | 0 (0.0%) |
| Computers & Mathematics | 0 (0.0%) | 0 (0.0%) |
| Architecture & Engineering | 0 (0.0%) | 0 (0.0%) |
| Life, Physical & Social Science | 0 (0.0%) | 0 (0.0%) |
| Community & Social Service | 28 (39.4%) | 43 (60.6%) |
| Education, Arts & Media | 0 (0.0%) | 0 (0.0%) |
| Legal Services & Support | 0 (0.0%) | 0 (0.0%) |
| Education Instruction & Library | 28 (46.7%) | 32 (53.3%) |
| Arts, Media & Entertainment | 0 (0.0%) | 11 (100.0%) |
| Health Diagnosing & Treating | 0 (0.0%) | 38 (100.0%) |
| Health Technologists | 0 (0.0%) | 36 (100.0%) |
| Total (Category) | 42 (30.4%) | 96 (69.6%) |
| Total (Overall) | 330 (41.7%) | 462 (58.3%) |
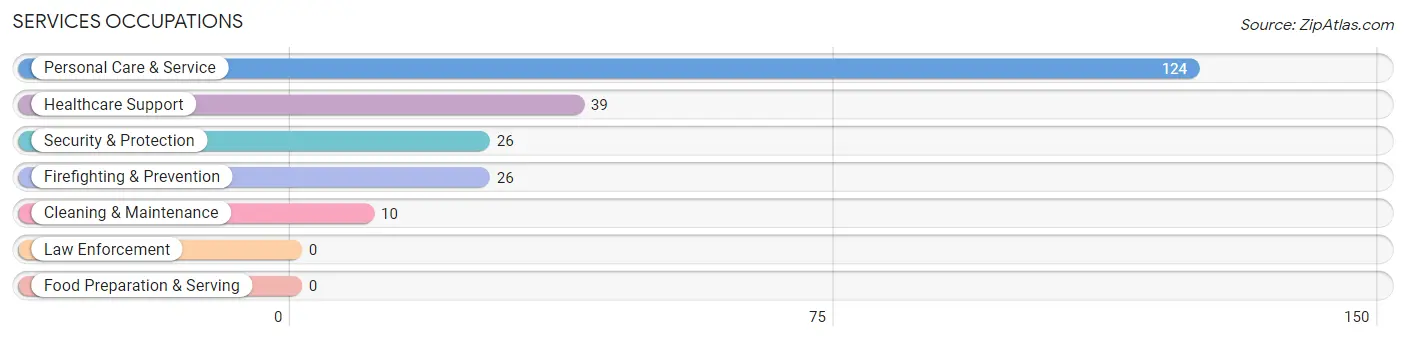
Services Occupations
The most common Services occupations in Vienna Bend are Personal Care & Service (124 | 15.7%), Healthcare Support (39 | 4.9%), Security & Protection (26 | 3.3%), Firefighting & Prevention (26 | 3.3%), and Cleaning & Maintenance (10 | 1.3%).
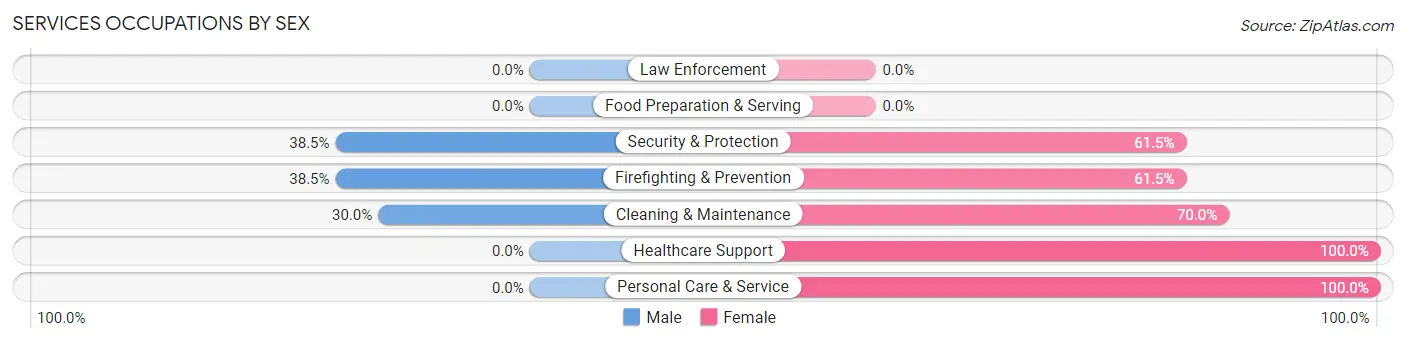
Services Occupations by Sex
Within the Services occupations in Vienna Bend, the most male-oriented occupations are Security & Protection (38.5%), Firefighting & Prevention (38.5%), and Cleaning & Maintenance (30.0%), while the most female-oriented occupations are Healthcare Support (100.0%), Personal Care & Service (100.0%), and Cleaning & Maintenance (70.0%).
| Occupation | Male | Female |
| Healthcare Support | 0 (0.0%) | 39 (100.0%) |
| Security & Protection | 10 (38.5%) | 16 (61.5%) |
| Firefighting & Prevention | 10 (38.5%) | 16 (61.5%) |
| Law Enforcement | 0 (0.0%) | 0 (0.0%) |
| Food Preparation & Serving | 0 (0.0%) | 0 (0.0%) |
| Cleaning & Maintenance | 3 (30.0%) | 7 (70.0%) |
| Personal Care & Service | 0 (0.0%) | 124 (100.0%) |
| Total (Category) | 13 (6.5%) | 186 (93.5%) |
| Total (Overall) | 330 (41.7%) | 462 (58.3%) |
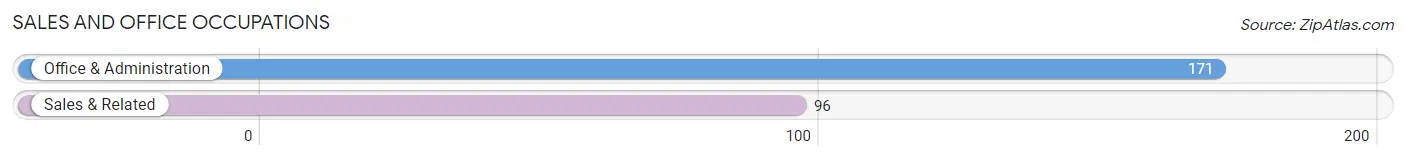
Sales and Office Occupations
The most common Sales and Office occupations in Vienna Bend are Office & Administration (171 | 21.6%), and Sales & Related (96 | 12.1%).
Sales and Office Occupations by Sex
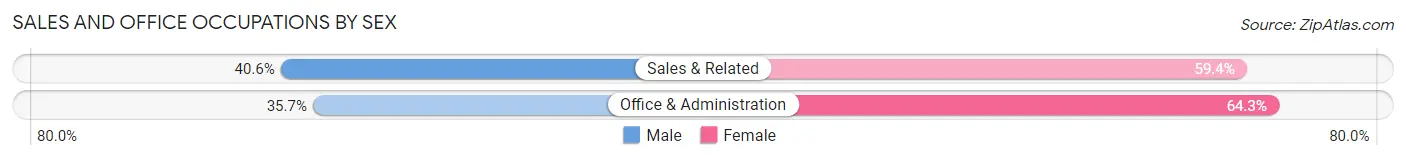
| Occupation | Male | Female |
| Sales & Related | 39 (40.6%) | 57 (59.4%) |
| Office & Administration | 61 (35.7%) | 110 (64.3%) |
| Total (Category) | 100 (37.4%) | 167 (62.5%) |
| Total (Overall) | 330 (41.7%) | 462 (58.3%) |
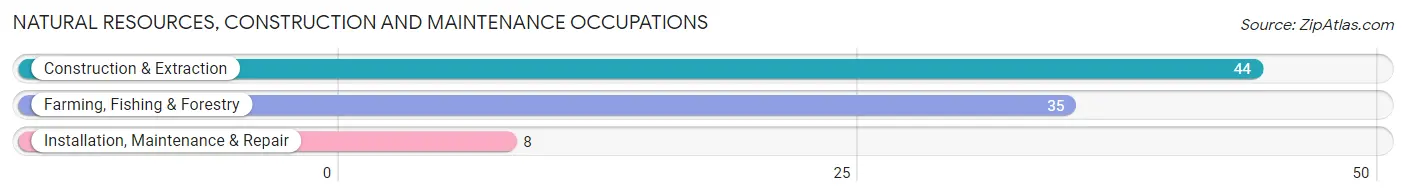
Natural Resources, Construction and Maintenance Occupations
The most common Natural Resources, Construction and Maintenance occupations in Vienna Bend are Construction & Extraction (44 | 5.6%), Farming, Fishing & Forestry (35 | 4.4%), and Installation, Maintenance & Repair (8 | 1.0%).
Natural Resources, Construction and Maintenance Occupations by Sex
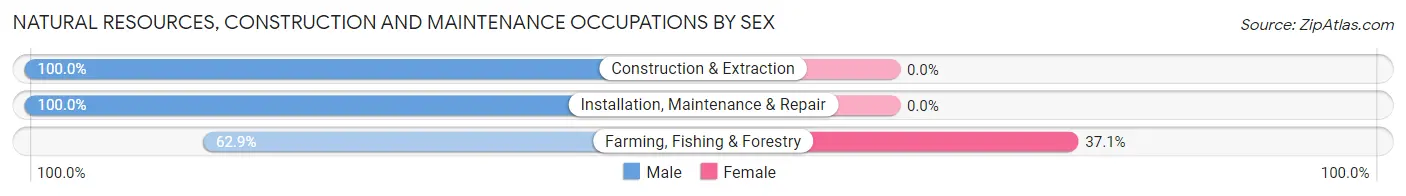
| Occupation | Male | Female |
| Farming, Fishing & Forestry | 22 (62.9%) | 13 (37.1%) |
| Construction & Extraction | 44 (100.0%) | 0 (0.0%) |
| Installation, Maintenance & Repair | 8 (100.0%) | 0 (0.0%) |
| Total (Category) | 74 (85.1%) | 13 (14.9%) |
| Total (Overall) | 330 (41.7%) | 462 (58.3%) |
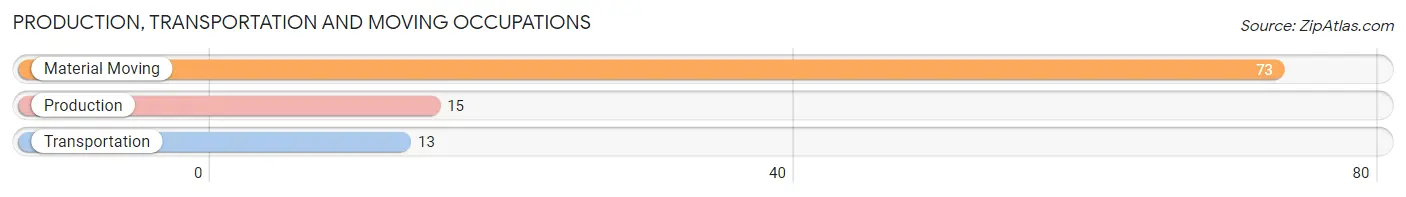
Production, Transportation and Moving Occupations
The most common Production, Transportation and Moving occupations in Vienna Bend are Material Moving (73 | 9.2%), Production (15 | 1.9%), and Transportation (13 | 1.6%).
Production, Transportation and Moving Occupations by Sex
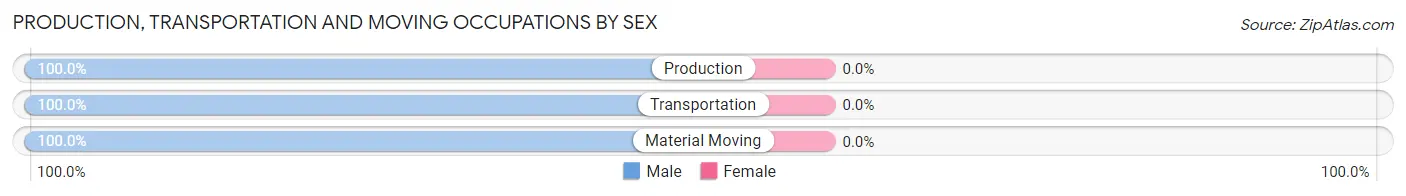
| Occupation | Male | Female |
| Production | 15 (100.0%) | 0 (0.0%) |
| Transportation | 13 (100.0%) | 0 (0.0%) |
| Material Moving | 73 (100.0%) | 0 (0.0%) |
| Total (Category) | 101 (100.0%) | 0 (0.0%) |
| Total (Overall) | 330 (41.7%) | 462 (58.3%) |
Employment Industries by Sex in Vienna Bend
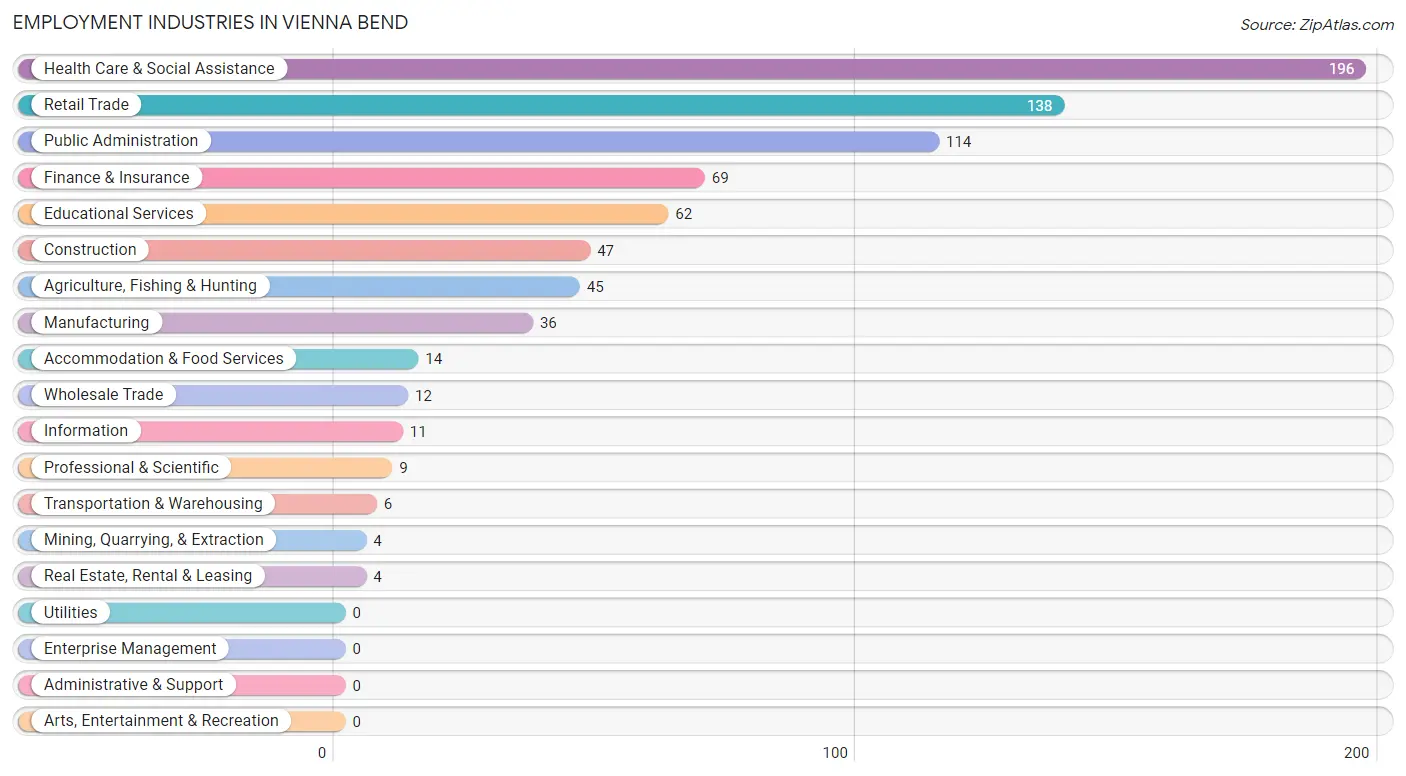
Employment Industries in Vienna Bend
The major employment industries in Vienna Bend include Health Care & Social Assistance (196 | 24.7%), Retail Trade (138 | 17.4%), Public Administration (114 | 14.4%), Finance & Insurance (69 | 8.7%), and Educational Services (62 | 7.8%).
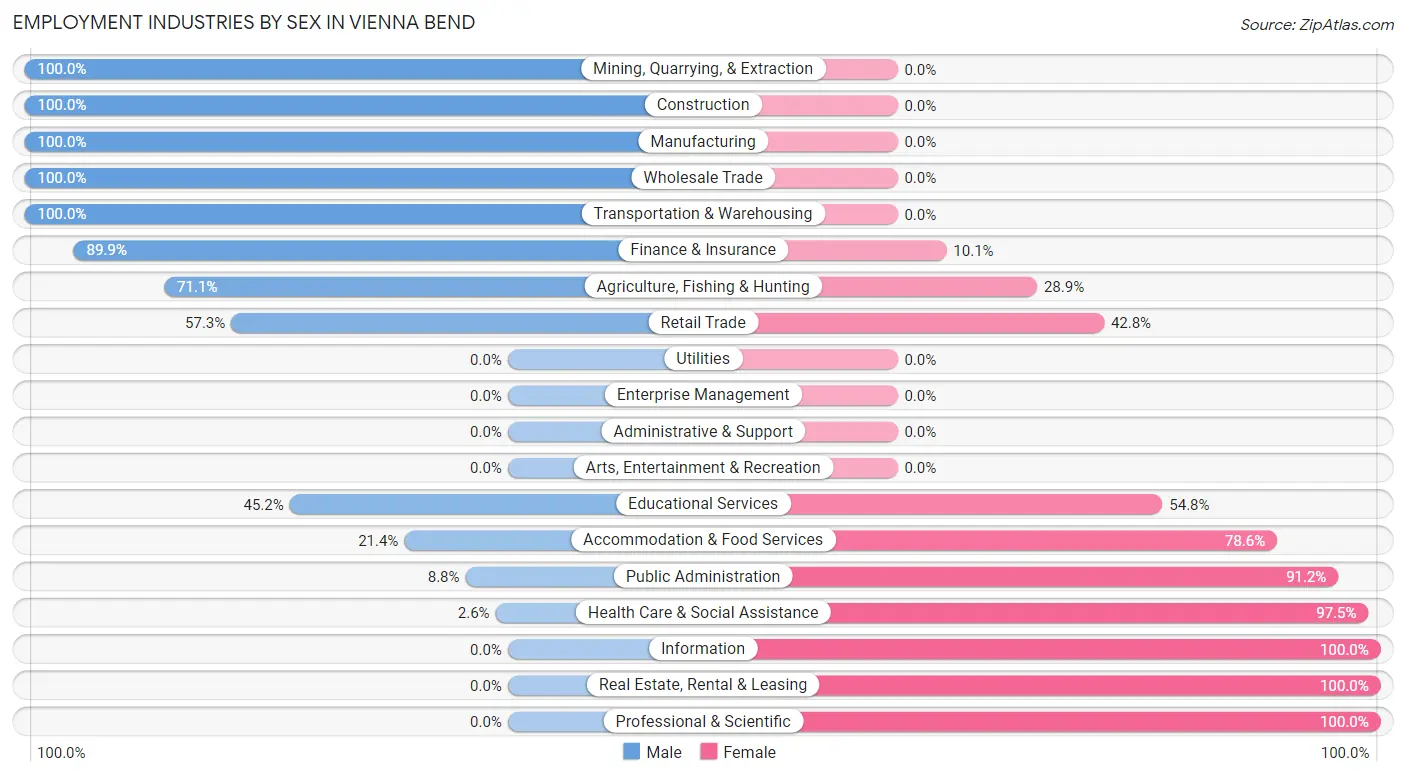
Employment Industries by Sex in Vienna Bend
The Vienna Bend industries that see more men than women are Mining, Quarrying, & Extraction (100.0%), Construction (100.0%), and Manufacturing (100.0%), whereas the industries that tend to have a higher number of women are Information (100.0%), Real Estate, Rental & Leasing (100.0%), and Professional & Scientific (100.0%).
| Industry | Male | Female |
| Agriculture, Fishing & Hunting | 32 (71.1%) | 13 (28.9%) |
| Mining, Quarrying, & Extraction | 4 (100.0%) | 0 (0.0%) |
| Construction | 47 (100.0%) | 0 (0.0%) |
| Manufacturing | 36 (100.0%) | 0 (0.0%) |
| Wholesale Trade | 12 (100.0%) | 0 (0.0%) |
| Retail Trade | 79 (57.3%) | 59 (42.7%) |
| Transportation & Warehousing | 6 (100.0%) | 0 (0.0%) |
| Utilities | 0 (0.0%) | 0 (0.0%) |
| Information | 0 (0.0%) | 11 (100.0%) |
| Finance & Insurance | 62 (89.9%) | 7 (10.1%) |
| Real Estate, Rental & Leasing | 0 (0.0%) | 4 (100.0%) |
| Professional & Scientific | 0 (0.0%) | 9 (100.0%) |
| Enterprise Management | 0 (0.0%) | 0 (0.0%) |
| Administrative & Support | 0 (0.0%) | 0 (0.0%) |
| Educational Services | 28 (45.2%) | 34 (54.8%) |
| Health Care & Social Assistance | 5 (2.5%) | 191 (97.5%) |
| Arts, Entertainment & Recreation | 0 (0.0%) | 0 (0.0%) |
| Accommodation & Food Services | 3 (21.4%) | 11 (78.6%) |
| Public Administration | 10 (8.8%) | 104 (91.2%) |
| Total | 330 (41.7%) | 462 (58.3%) |
Education in Vienna Bend
School Enrollment in Vienna Bend
The most common levels of schooling among the 532 students in Vienna Bend are high school (172 | 32.3%), elementary school (171 | 32.1%), and college / undergraduate (74 | 13.9%).
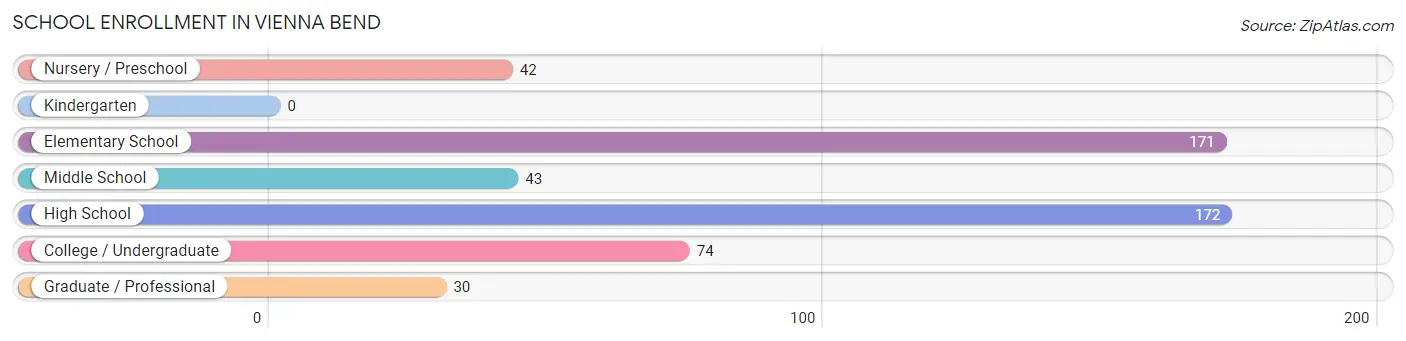
| School Level | # Students | % Students |
| Nursery / Preschool | 42 | 7.9% |
| Kindergarten | 0 | 0.0% |
| Elementary School | 171 | 32.1% |
| Middle School | 43 | 8.1% |
| High School | 172 | 32.3% |
| College / Undergraduate | 74 | 13.9% |
| Graduate / Professional | 30 | 5.6% |
| Total | 532 | 100.0% |
School Enrollment by Age by Funding Source in Vienna Bend
Out of a total of 532 students who are enrolled in schools in Vienna Bend, 40 (7.5%) attend a private institution, while the remaining 492 (92.5%) are enrolled in public schools. The age group of 20 to 24 year olds has the highest likelihood of being enrolled in private schools, with 25 (47.2% in the age bracket) enrolled. Conversely, the age group of 15 to 17 year olds has the lowest likelihood of being enrolled in a private school, with 155 (100.0% in the age bracket) attending a public institution.
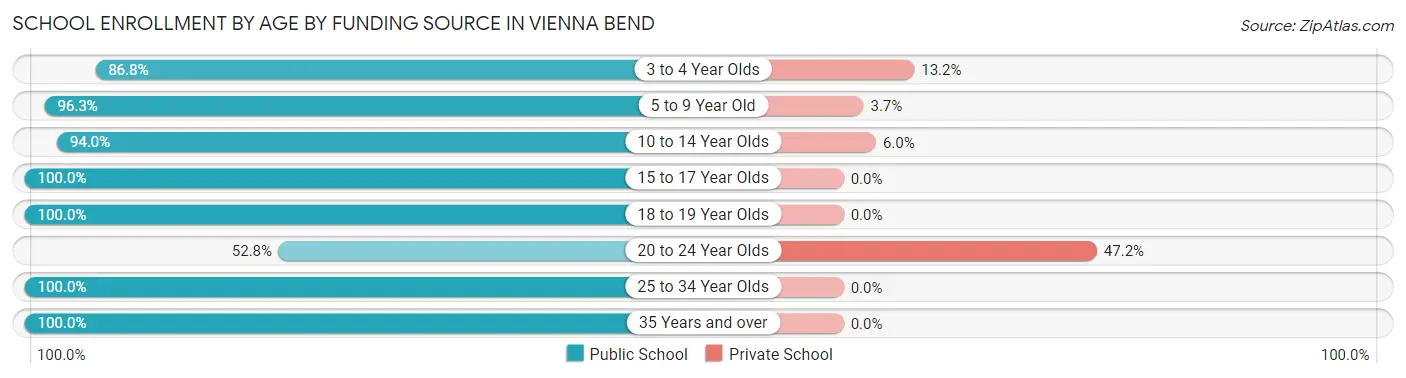
| Age Bracket | Public School | Private School |
| 3 to 4 Year Olds | 33 (86.8%) | 5 (13.2%) |
| 5 to 9 Year Old | 130 (96.3%) | 5 (3.7%) |
| 10 to 14 Year Olds | 78 (94.0%) | 5 (6.0%) |
| 15 to 17 Year Olds | 155 (100.0%) | 0 (0.0%) |
| 18 to 19 Year Olds | 24 (100.0%) | 0 (0.0%) |
| 20 to 24 Year Olds | 28 (52.8%) | 25 (47.2%) |
| 25 to 34 Year Olds | 18 (100.0%) | 0 (0.0%) |
| 35 Years and over | 26 (100.0%) | 0 (0.0%) |
| Total | 492 (92.5%) | 40 (7.5%) |
Educational Attainment by Field of Study in Vienna Bend
Business (47 | 26.9%), visual & performing arts (35 | 20.0%), education (22 | 12.6%), communications (21 | 12.0%), and psychology (20 | 11.4%) are the most common fields of study among 175 individuals in Vienna Bend who have obtained a bachelor's degree or higher.
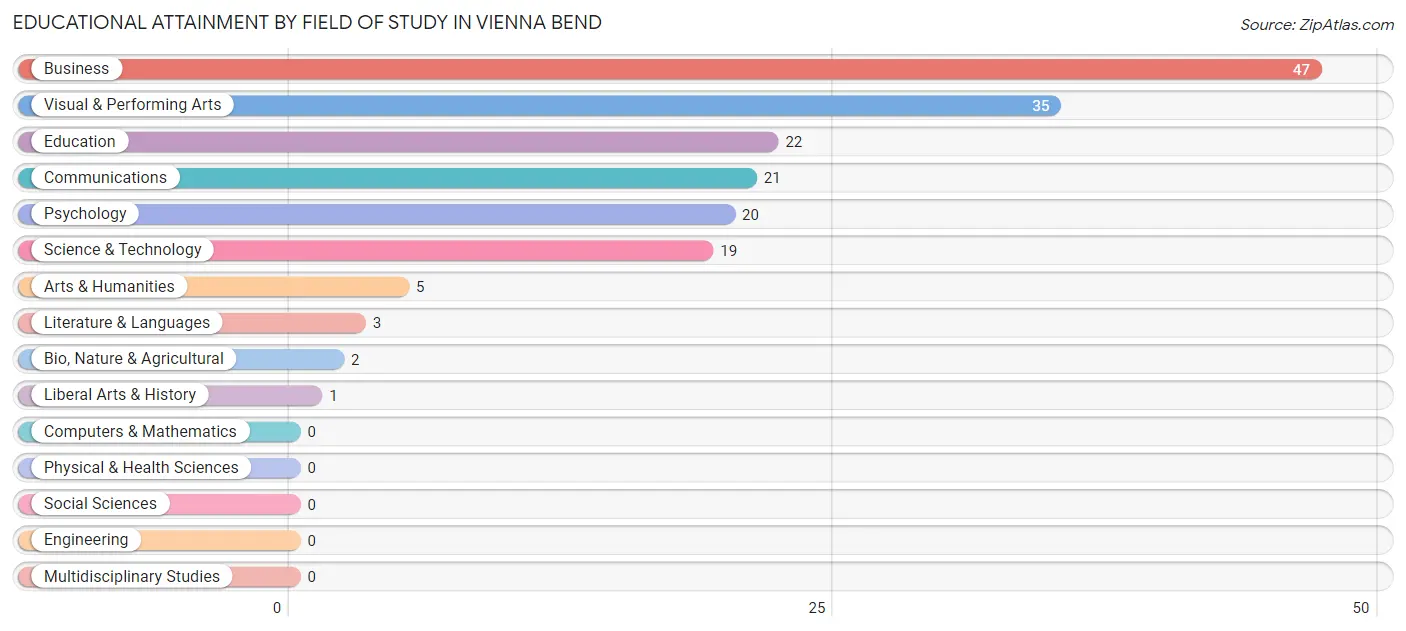
| Field of Study | # Graduates | % Graduates |
| Computers & Mathematics | 0 | 0.0% |
| Bio, Nature & Agricultural | 2 | 1.1% |
| Physical & Health Sciences | 0 | 0.0% |
| Psychology | 20 | 11.4% |
| Social Sciences | 0 | 0.0% |
| Engineering | 0 | 0.0% |
| Multidisciplinary Studies | 0 | 0.0% |
| Science & Technology | 19 | 10.9% |
| Business | 47 | 26.9% |
| Education | 22 | 12.6% |
| Literature & Languages | 3 | 1.7% |
| Liberal Arts & History | 1 | 0.6% |
| Visual & Performing Arts | 35 | 20.0% |
| Communications | 21 | 12.0% |
| Arts & Humanities | 5 | 2.9% |
| Total | 175 | 100.0% |
Transportation & Commute in Vienna Bend
Vehicle Availability by Sex in Vienna Bend
The most prevalent vehicle ownership categories in Vienna Bend are males with 3 vehicles (123, accounting for 37.3%) and females with 3 vehicles (55, making up 26.6%).
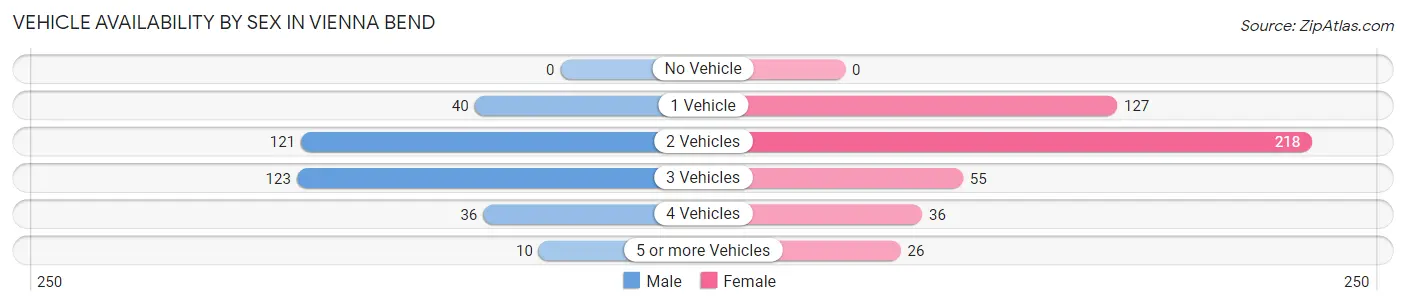
| Vehicles Available | Male | Female |
| No Vehicle | 0 (0.0%) | 0 (0.0%) |
| 1 Vehicle | 40 (12.1%) | 127 (27.5%) |
| 2 Vehicles | 121 (36.7%) | 218 (47.2%) |
| 3 Vehicles | 123 (37.3%) | 55 (11.9%) |
| 4 Vehicles | 36 (10.9%) | 36 (7.8%) |
| 5 or more Vehicles | 10 (3.0%) | 26 (5.6%) |
| Total | 330 (100.0%) | 462 (100.0%) |
Commute Time in Vienna Bend
The most frequently occuring commute durations in Vienna Bend are 10 to 14 minutes (202 commuters, 25.9%), 15 to 19 minutes (195 commuters, 25.0%), and 5 to 9 minutes (121 commuters, 15.5%).
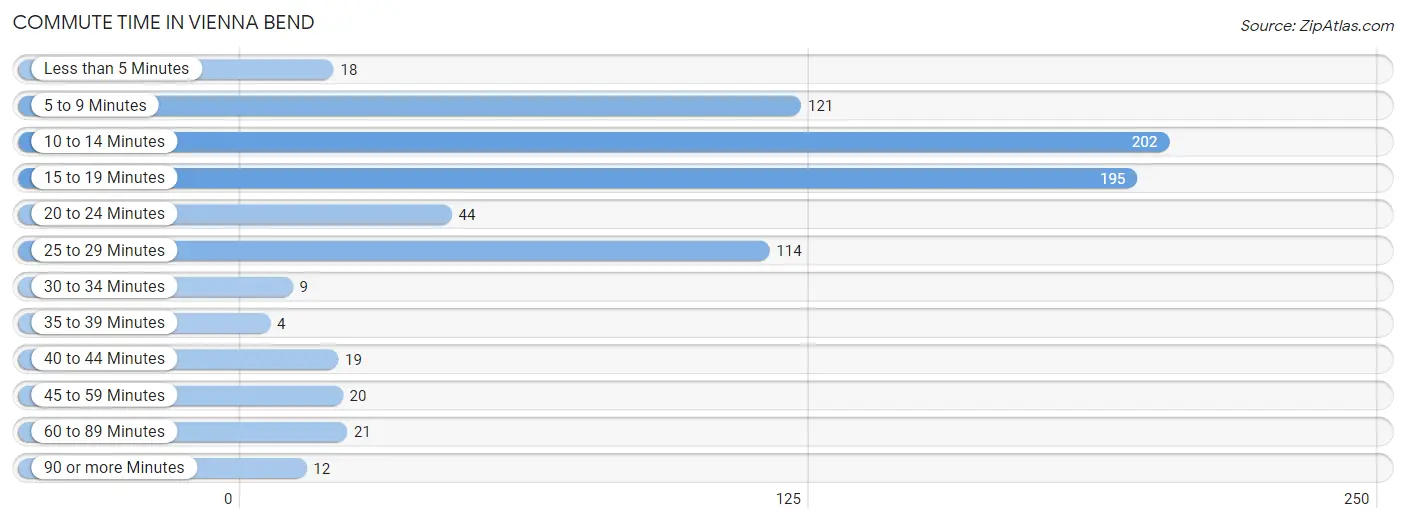
| Commute Time | # Commuters | % Commuters |
| Less than 5 Minutes | 18 | 2.3% |
| 5 to 9 Minutes | 121 | 15.5% |
| 10 to 14 Minutes | 202 | 25.9% |
| 15 to 19 Minutes | 195 | 25.0% |
| 20 to 24 Minutes | 44 | 5.7% |
| 25 to 29 Minutes | 114 | 14.6% |
| 30 to 34 Minutes | 9 | 1.2% |
| 35 to 39 Minutes | 4 | 0.5% |
| 40 to 44 Minutes | 19 | 2.4% |
| 45 to 59 Minutes | 20 | 2.6% |
| 60 to 89 Minutes | 21 | 2.7% |
| 90 or more Minutes | 12 | 1.5% |
Commute Time by Sex in Vienna Bend
The most common commute times in Vienna Bend are 10 to 14 minutes (88 commuters, 27.3%) for males and 15 to 19 minutes (141 commuters, 30.8%) for females.
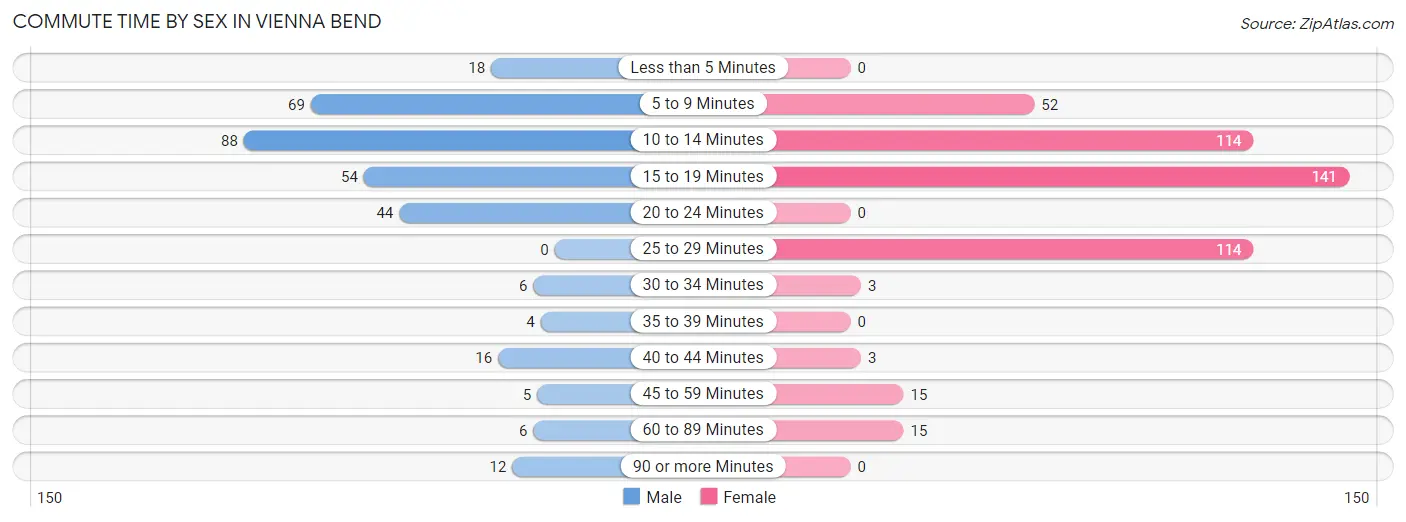
| Commute Time | Male | Female |
| Less than 5 Minutes | 18 (5.6%) | 0 (0.0%) |
| 5 to 9 Minutes | 69 (21.4%) | 52 (11.4%) |
| 10 to 14 Minutes | 88 (27.3%) | 114 (24.9%) |
| 15 to 19 Minutes | 54 (16.8%) | 141 (30.8%) |
| 20 to 24 Minutes | 44 (13.7%) | 0 (0.0%) |
| 25 to 29 Minutes | 0 (0.0%) | 114 (24.9%) |
| 30 to 34 Minutes | 6 (1.9%) | 3 (0.7%) |
| 35 to 39 Minutes | 4 (1.2%) | 0 (0.0%) |
| 40 to 44 Minutes | 16 (5.0%) | 3 (0.7%) |
| 45 to 59 Minutes | 5 (1.5%) | 15 (3.3%) |
| 60 to 89 Minutes | 6 (1.9%) | 15 (3.3%) |
| 90 or more Minutes | 12 (3.7%) | 0 (0.0%) |
Time of Departure to Work by Sex in Vienna Bend
The most frequent times of departure to work in Vienna Bend are 7:30 AM to 7:59 AM (87, 27.0%) for males and 7:00 AM to 7:29 AM (284, 62.1%) for females.
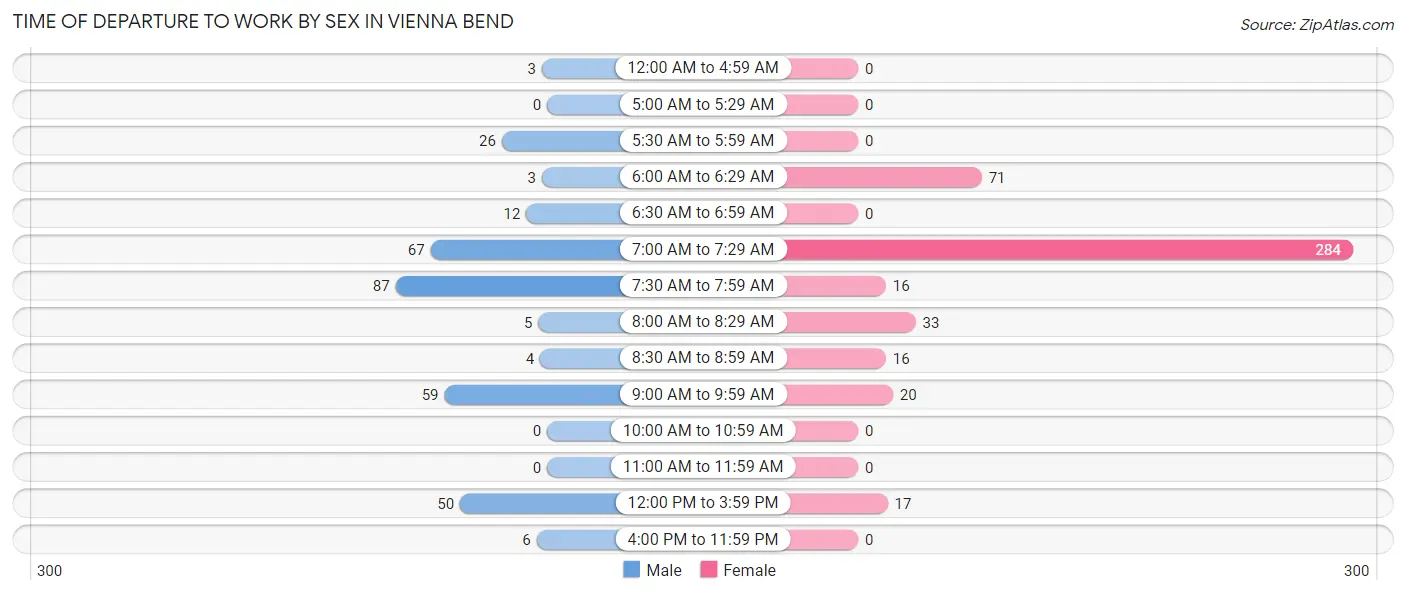
| Time of Departure | Male | Female |
| 12:00 AM to 4:59 AM | 3 (0.9%) | 0 (0.0%) |
| 5:00 AM to 5:29 AM | 0 (0.0%) | 0 (0.0%) |
| 5:30 AM to 5:59 AM | 26 (8.1%) | 0 (0.0%) |
| 6:00 AM to 6:29 AM | 3 (0.9%) | 71 (15.5%) |
| 6:30 AM to 6:59 AM | 12 (3.7%) | 0 (0.0%) |
| 7:00 AM to 7:29 AM | 67 (20.8%) | 284 (62.1%) |
| 7:30 AM to 7:59 AM | 87 (27.0%) | 16 (3.5%) |
| 8:00 AM to 8:29 AM | 5 (1.5%) | 33 (7.2%) |
| 8:30 AM to 8:59 AM | 4 (1.2%) | 16 (3.5%) |
| 9:00 AM to 9:59 AM | 59 (18.3%) | 20 (4.4%) |
| 10:00 AM to 10:59 AM | 0 (0.0%) | 0 (0.0%) |
| 11:00 AM to 11:59 AM | 0 (0.0%) | 0 (0.0%) |
| 12:00 PM to 3:59 PM | 50 (15.5%) | 17 (3.7%) |
| 4:00 PM to 11:59 PM | 6 (1.9%) | 0 (0.0%) |
| Total | 322 (100.0%) | 457 (100.0%) |
Housing Occupancy in Vienna Bend
Occupancy by Ownership in Vienna Bend
Of the total 554 dwellings in Vienna Bend, owner-occupied units account for 364 (65.7%), while renter-occupied units make up 190 (34.3%).
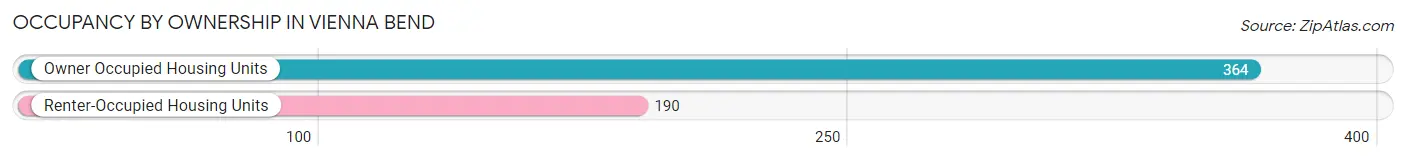
| Occupancy | # Housing Units | % Housing Units |
| Owner Occupied Housing Units | 364 | 65.7% |
| Renter-Occupied Housing Units | 190 | 34.3% |
| Total Occupied Housing Units | 554 | 100.0% |
Occupancy by Household Size in Vienna Bend
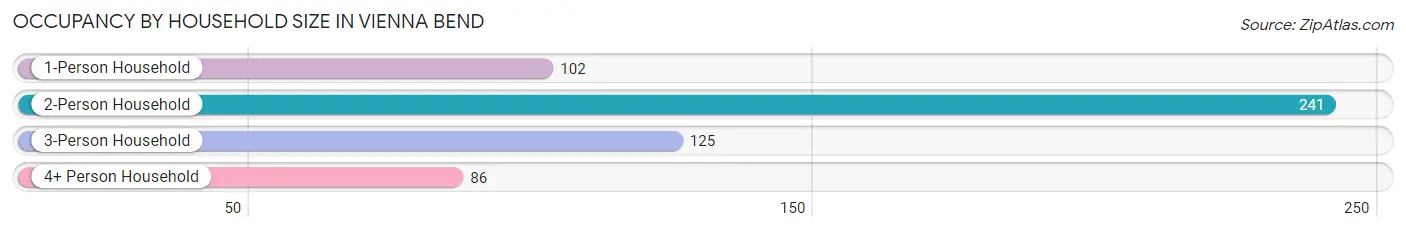
| Household Size | # Housing Units | % Housing Units |
| 1-Person Household | 102 | 18.4% |
| 2-Person Household | 241 | 43.5% |
| 3-Person Household | 125 | 22.6% |
| 4+ Person Household | 86 | 15.5% |
| Total Housing Units | 554 | 100.0% |
Occupancy by Ownership by Household Size in Vienna Bend
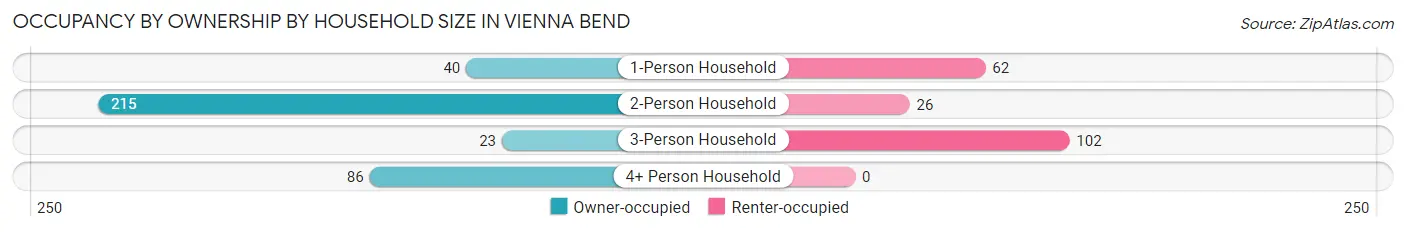
| Household Size | Owner-occupied | Renter-occupied |
| 1-Person Household | 40 (39.2%) | 62 (60.8%) |
| 2-Person Household | 215 (89.2%) | 26 (10.8%) |
| 3-Person Household | 23 (18.4%) | 102 (81.6%) |
| 4+ Person Household | 86 (100.0%) | 0 (0.0%) |
| Total Housing Units | 364 (65.7%) | 190 (34.3%) |
Occupancy by Educational Attainment in Vienna Bend
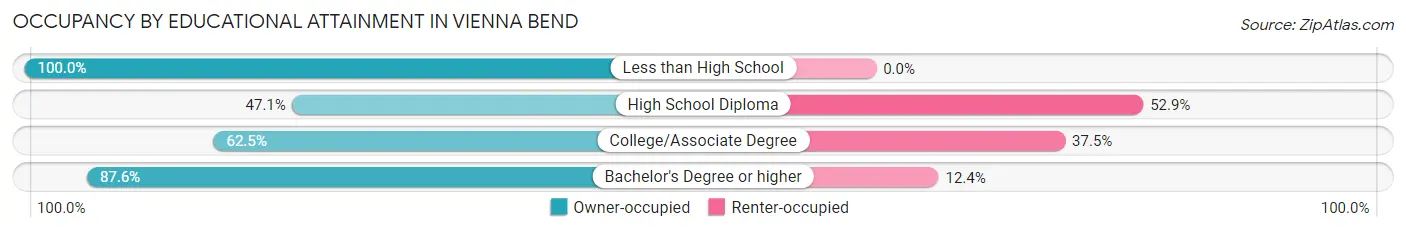
| Household Size | Owner-occupied | Renter-occupied |
| Less than High School | 3 (100.0%) | 0 (0.0%) |
| High School Diploma | 24 (47.1%) | 27 (52.9%) |
| College/Associate Degree | 252 (62.5%) | 151 (37.5%) |
| Bachelor's Degree or higher | 85 (87.6%) | 12 (12.4%) |
Occupancy by Age of Householder in Vienna Bend
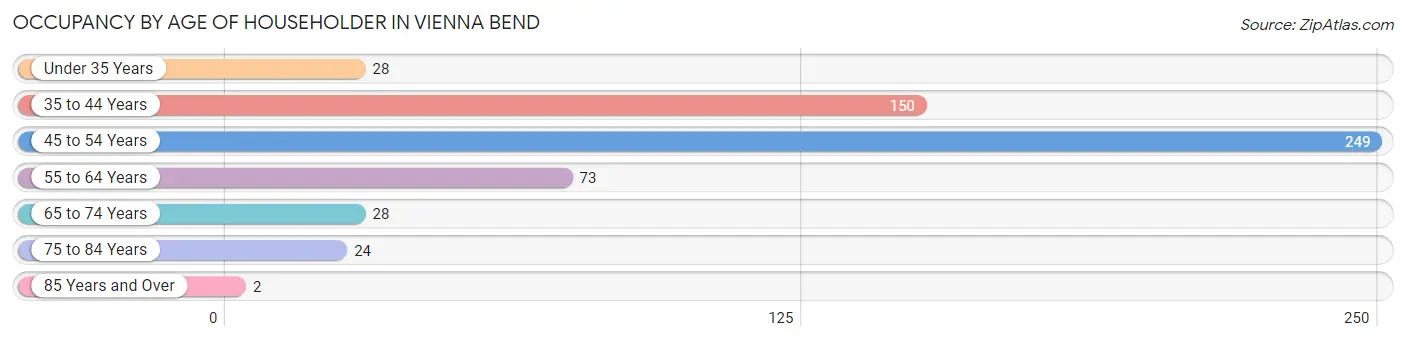
| Age Bracket | # Households | % Households |
| Under 35 Years | 28 | 5.1% |
| 35 to 44 Years | 150 | 27.1% |
| 45 to 54 Years | 249 | 45.0% |
| 55 to 64 Years | 73 | 13.2% |
| 65 to 74 Years | 28 | 5.1% |
| 75 to 84 Years | 24 | 4.3% |
| 85 Years and Over | 2 | 0.4% |
| Total | 554 | 100.0% |
Housing Finances in Vienna Bend
Median Income by Occupancy in Vienna Bend
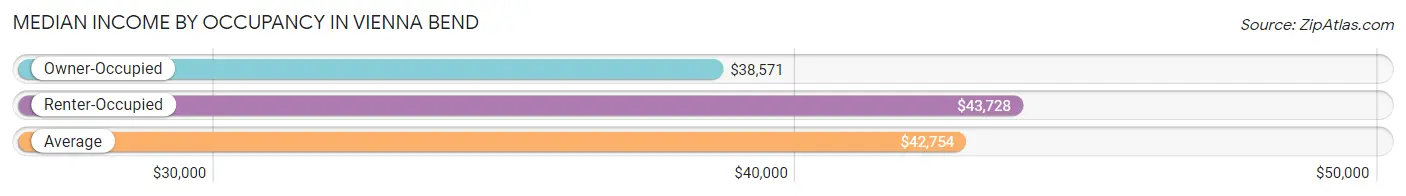
| Occupancy Type | # Households | Median Income |
| Owner-Occupied | 364 (65.7%) | $38,571 |
| Renter-Occupied | 190 (34.3%) | $43,728 |
| Average | 554 (100.0%) | $42,754 |
Occupancy by Householder Income Bracket in Vienna Bend
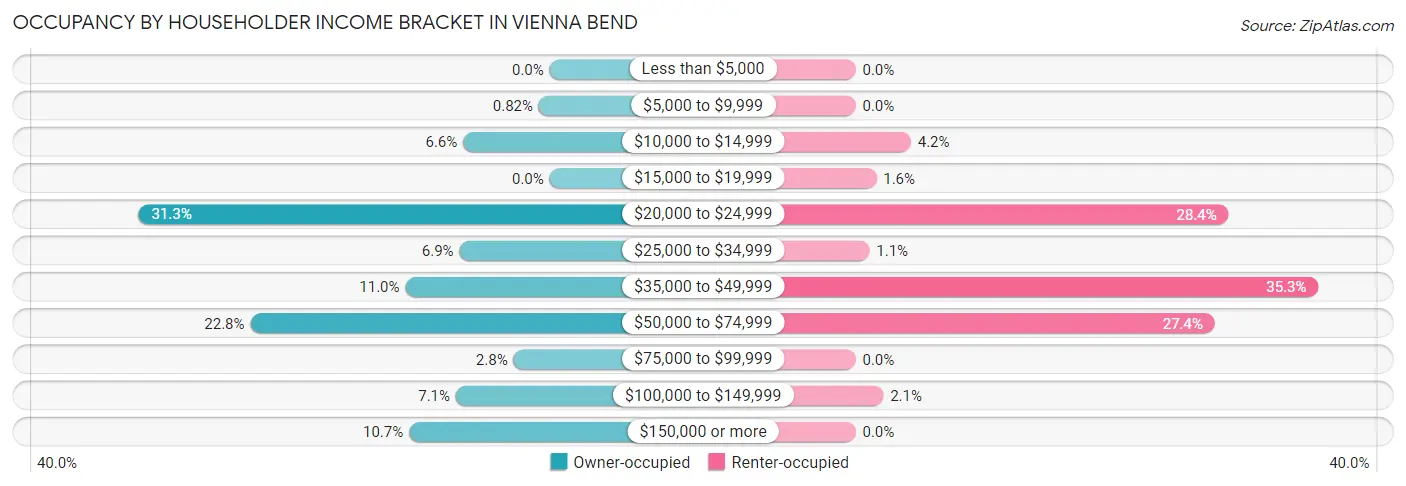
| Income Bracket | Owner-occupied | Renter-occupied |
| Less than $5,000 | 0 (0.0%) | 0 (0.0%) |
| $5,000 to $9,999 | 3 (0.8%) | 0 (0.0%) |
| $10,000 to $14,999 | 24 (6.6%) | 8 (4.2%) |
| $15,000 to $19,999 | 0 (0.0%) | 3 (1.6%) |
| $20,000 to $24,999 | 114 (31.3%) | 54 (28.4%) |
| $25,000 to $34,999 | 25 (6.9%) | 2 (1.1%) |
| $35,000 to $49,999 | 40 (11.0%) | 67 (35.3%) |
| $50,000 to $74,999 | 83 (22.8%) | 52 (27.4%) |
| $75,000 to $99,999 | 10 (2.8%) | 0 (0.0%) |
| $100,000 to $149,999 | 26 (7.1%) | 4 (2.1%) |
| $150,000 or more | 39 (10.7%) | 0 (0.0%) |
| Total | 364 (100.0%) | 190 (100.0%) |
Monthly Housing Cost Tiers in Vienna Bend
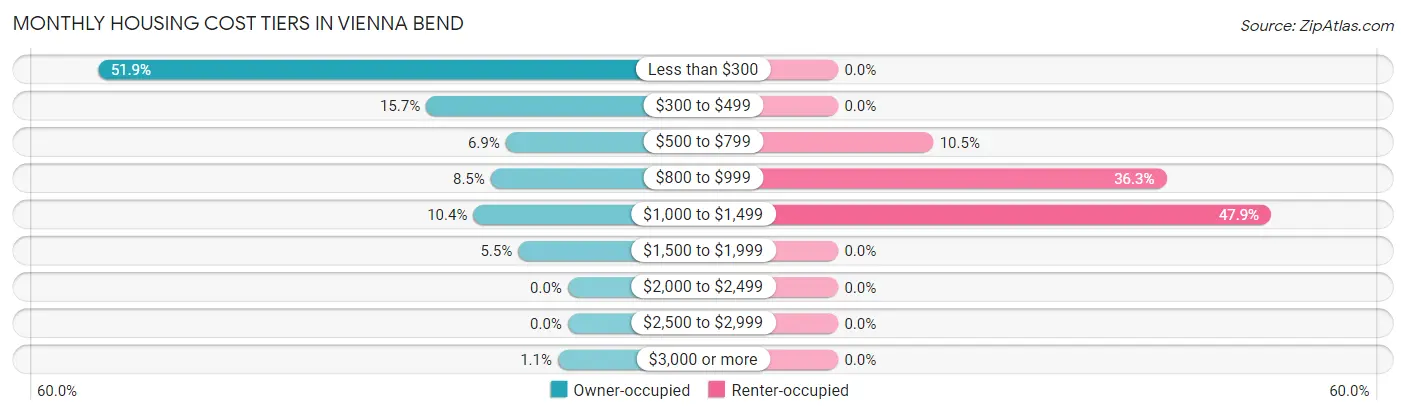
| Monthly Cost | Owner-occupied | Renter-occupied |
| Less than $300 | 189 (51.9%) | 0 (0.0%) |
| $300 to $499 | 57 (15.7%) | 0 (0.0%) |
| $500 to $799 | 25 (6.9%) | 20 (10.5%) |
| $800 to $999 | 31 (8.5%) | 69 (36.3%) |
| $1,000 to $1,499 | 38 (10.4%) | 91 (47.9%) |
| $1,500 to $1,999 | 20 (5.5%) | 0 (0.0%) |
| $2,000 to $2,499 | 0 (0.0%) | 0 (0.0%) |
| $2,500 to $2,999 | 0 (0.0%) | 0 (0.0%) |
| $3,000 or more | 4 (1.1%) | 0 (0.0%) |
| Total | 364 (100.0%) | 190 (100.0%) |
Physical Housing Characteristics in Vienna Bend
Housing Structures in Vienna Bend
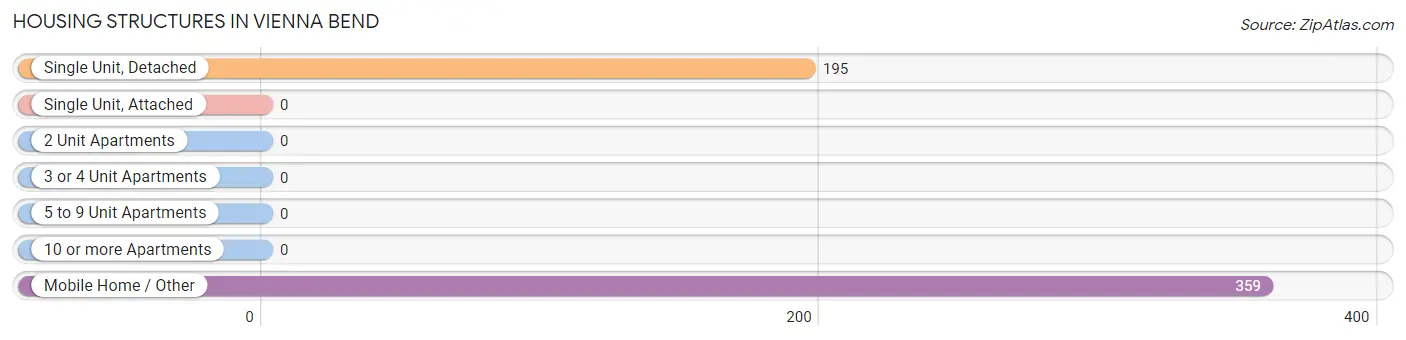
| Structure Type | # Housing Units | % Housing Units |
| Single Unit, Detached | 195 | 35.2% |
| Single Unit, Attached | 0 | 0.0% |
| 2 Unit Apartments | 0 | 0.0% |
| 3 or 4 Unit Apartments | 0 | 0.0% |
| 5 to 9 Unit Apartments | 0 | 0.0% |
| 10 or more Apartments | 0 | 0.0% |
| Mobile Home / Other | 359 | 64.8% |
| Total | 554 | 100.0% |
Housing Structures by Occupancy in Vienna Bend
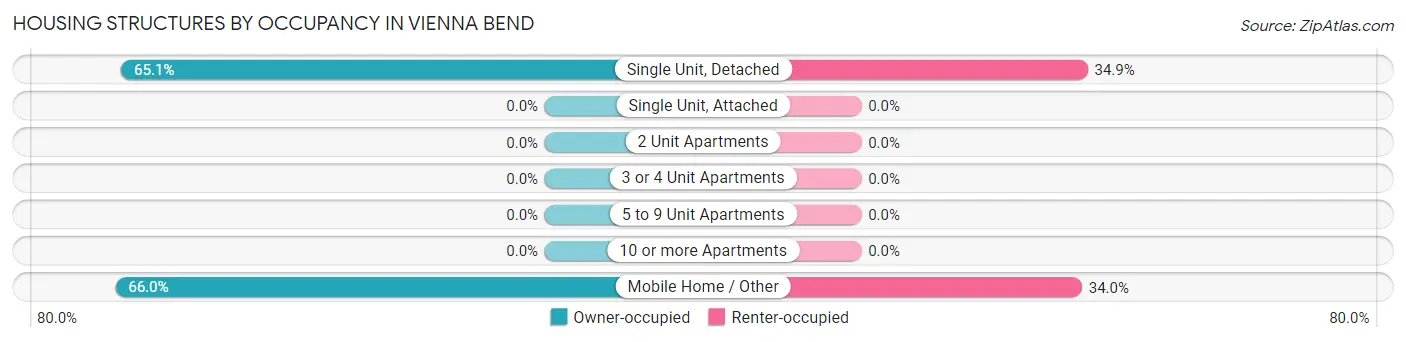
| Structure Type | Owner-occupied | Renter-occupied |
| Single Unit, Detached | 127 (65.1%) | 68 (34.9%) |
| Single Unit, Attached | 0 (0.0%) | 0 (0.0%) |
| 2 Unit Apartments | 0 (0.0%) | 0 (0.0%) |
| 3 or 4 Unit Apartments | 0 (0.0%) | 0 (0.0%) |
| 5 to 9 Unit Apartments | 0 (0.0%) | 0 (0.0%) |
| 10 or more Apartments | 0 (0.0%) | 0 (0.0%) |
| Mobile Home / Other | 237 (66.0%) | 122 (34.0%) |
| Total | 364 (65.7%) | 190 (34.3%) |
Housing Structures by Number of Rooms in Vienna Bend
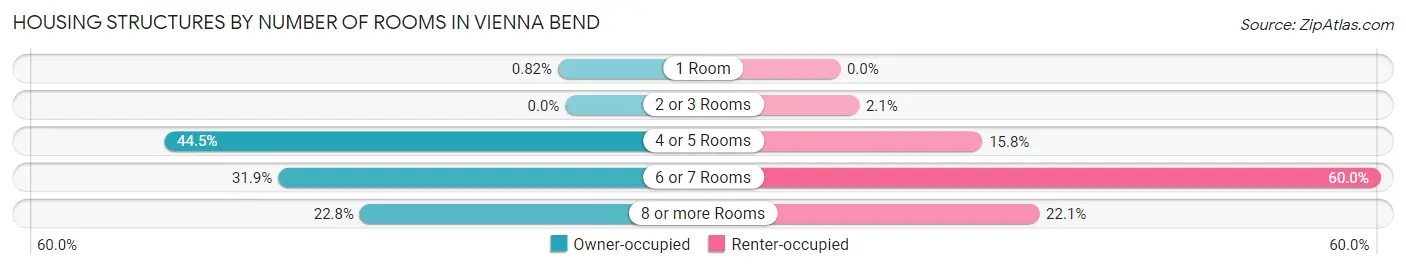
| Number of Rooms | Owner-occupied | Renter-occupied |
| 1 Room | 3 (0.8%) | 0 (0.0%) |
| 2 or 3 Rooms | 0 (0.0%) | 4 (2.1%) |
| 4 or 5 Rooms | 162 (44.5%) | 30 (15.8%) |
| 6 or 7 Rooms | 116 (31.9%) | 114 (60.0%) |
| 8 or more Rooms | 83 (22.8%) | 42 (22.1%) |
| Total | 364 (100.0%) | 190 (100.0%) |
Housing Structure by Heating Type in Vienna Bend
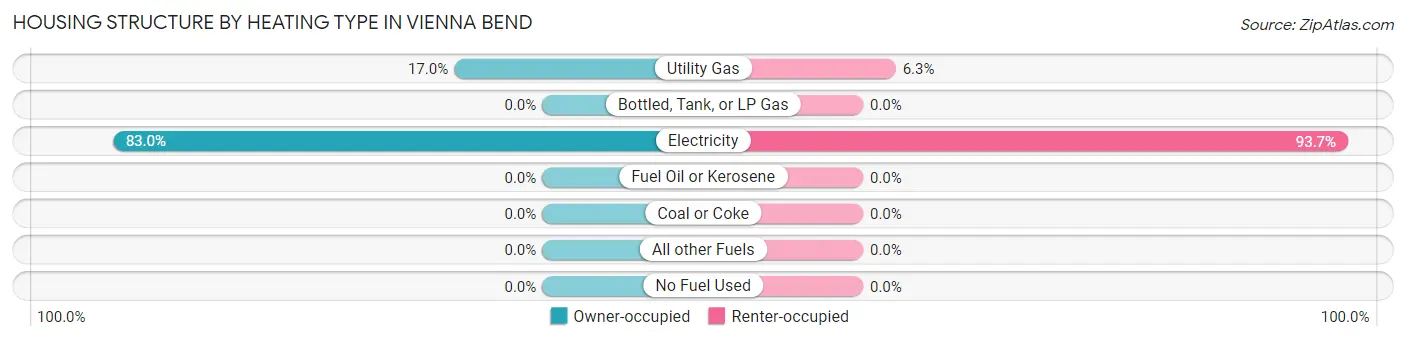
| Heating Type | Owner-occupied | Renter-occupied |
| Utility Gas | 62 (17.0%) | 12 (6.3%) |
| Bottled, Tank, or LP Gas | 0 (0.0%) | 0 (0.0%) |
| Electricity | 302 (83.0%) | 178 (93.7%) |
| Fuel Oil or Kerosene | 0 (0.0%) | 0 (0.0%) |
| Coal or Coke | 0 (0.0%) | 0 (0.0%) |
| All other Fuels | 0 (0.0%) | 0 (0.0%) |
| No Fuel Used | 0 (0.0%) | 0 (0.0%) |
| Total | 364 (100.0%) | 190 (100.0%) |
Household Vehicle Usage in Vienna Bend
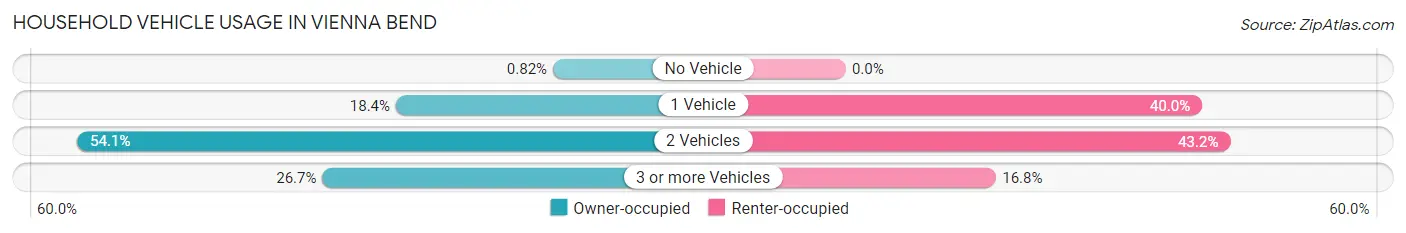
| Vehicles per Household | Owner-occupied | Renter-occupied |
| No Vehicle | 3 (0.8%) | 0 (0.0%) |
| 1 Vehicle | 67 (18.4%) | 76 (40.0%) |
| 2 Vehicles | 197 (54.1%) | 82 (43.2%) |
| 3 or more Vehicles | 97 (26.7%) | 32 (16.8%) |
| Total | 364 (100.0%) | 190 (100.0%) |
Real Estate & Mortgages in Vienna Bend
Real Estate and Mortgage Overview in Vienna Bend
| Characteristic | Without Mortgage | With Mortgage |
| Housing Units | 260 | 104 |
| Median Property Value | - | - |
| Median Household Income | $24,759 | $28 |
| Monthly Housing Costs | $283 | $4 |
| Real Estate Taxes | $199 | $35 |
Property Value by Mortgage Status in Vienna Bend
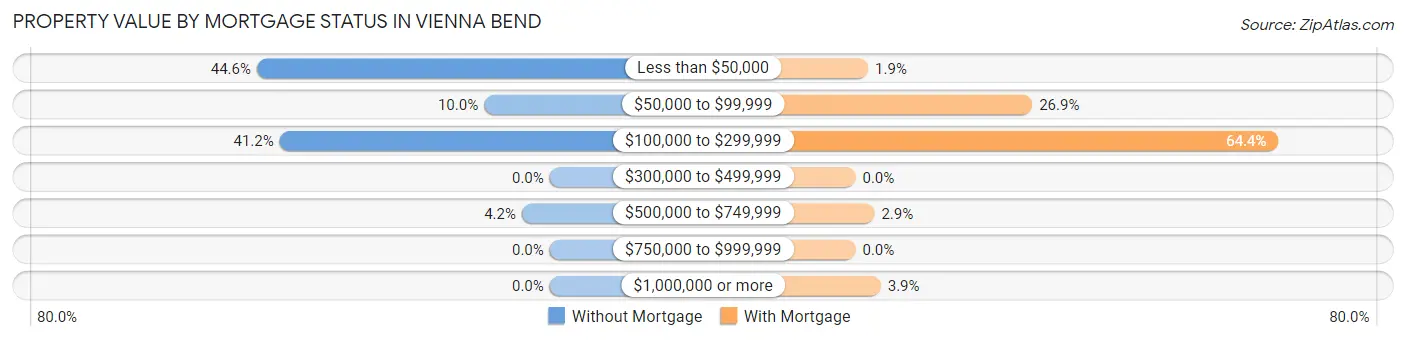
| Property Value | Without Mortgage | With Mortgage |
| Less than $50,000 | 116 (44.6%) | 2 (1.9%) |
| $50,000 to $99,999 | 26 (10.0%) | 28 (26.9%) |
| $100,000 to $299,999 | 107 (41.1%) | 67 (64.4%) |
| $300,000 to $499,999 | 0 (0.0%) | 0 (0.0%) |
| $500,000 to $749,999 | 11 (4.2%) | 3 (2.9%) |
| $750,000 to $999,999 | 0 (0.0%) | 0 (0.0%) |
| $1,000,000 or more | 0 (0.0%) | 4 (3.8%) |
| Total | 260 (100.0%) | 104 (100.0%) |
Household Income by Mortgage Status in Vienna Bend
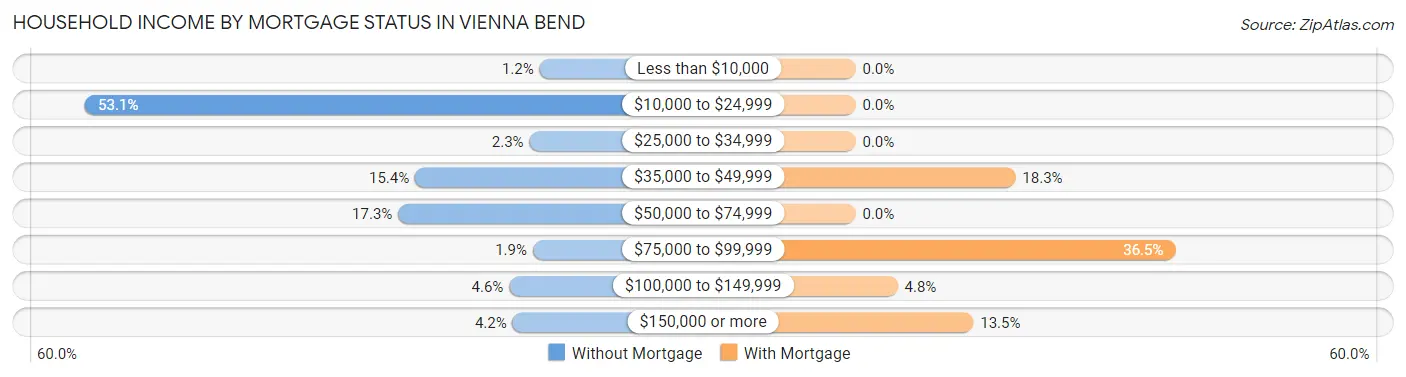
| Household Income | Without Mortgage | With Mortgage |
| Less than $10,000 | 3 (1.1%) | 0 (0.0%) |
| $10,000 to $24,999 | 138 (53.1%) | 0 (0.0%) |
| $25,000 to $34,999 | 6 (2.3%) | 0 (0.0%) |
| $35,000 to $49,999 | 40 (15.4%) | 19 (18.3%) |
| $50,000 to $74,999 | 45 (17.3%) | 0 (0.0%) |
| $75,000 to $99,999 | 5 (1.9%) | 38 (36.5%) |
| $100,000 to $149,999 | 12 (4.6%) | 5 (4.8%) |
| $150,000 or more | 11 (4.2%) | 14 (13.5%) |
| Total | 260 (100.0%) | 104 (100.0%) |
Property Value to Household Income Ratio in Vienna Bend
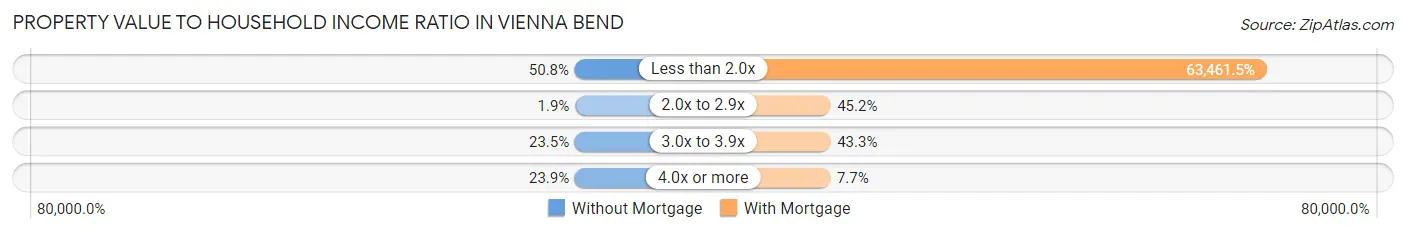
| Value-to-Income Ratio | Without Mortgage | With Mortgage |
| Less than 2.0x | 132 (50.8%) | 66,000 (63,461.5%) |
| 2.0x to 2.9x | 5 (1.9%) | 47 (45.2%) |
| 3.0x to 3.9x | 61 (23.5%) | 45 (43.3%) |
| 4.0x or more | 62 (23.8%) | 8 (7.7%) |
| Total | 260 (100.0%) | 104 (100.0%) |
Real Estate Taxes by Mortgage Status in Vienna Bend
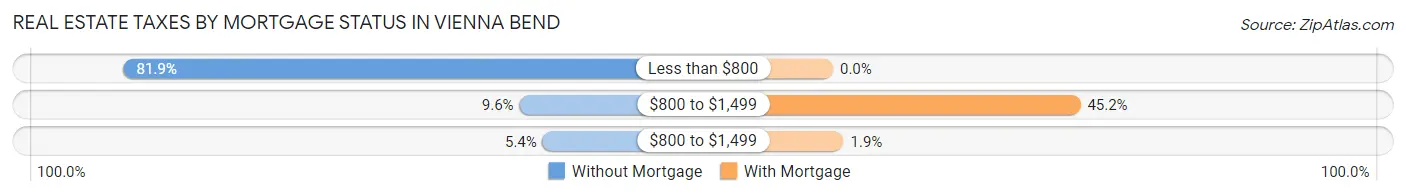
| Property Taxes | Without Mortgage | With Mortgage |
| Less than $800 | 213 (81.9%) | 0 (0.0%) |
| $800 to $1,499 | 25 (9.6%) | 47 (45.2%) |
| $800 to $1,499 | 14 (5.4%) | 2 (1.9%) |
| Total | 260 (100.0%) | 104 (100.0%) |
Health & Disability in Vienna Bend
Health Insurance Coverage by Age in Vienna Bend
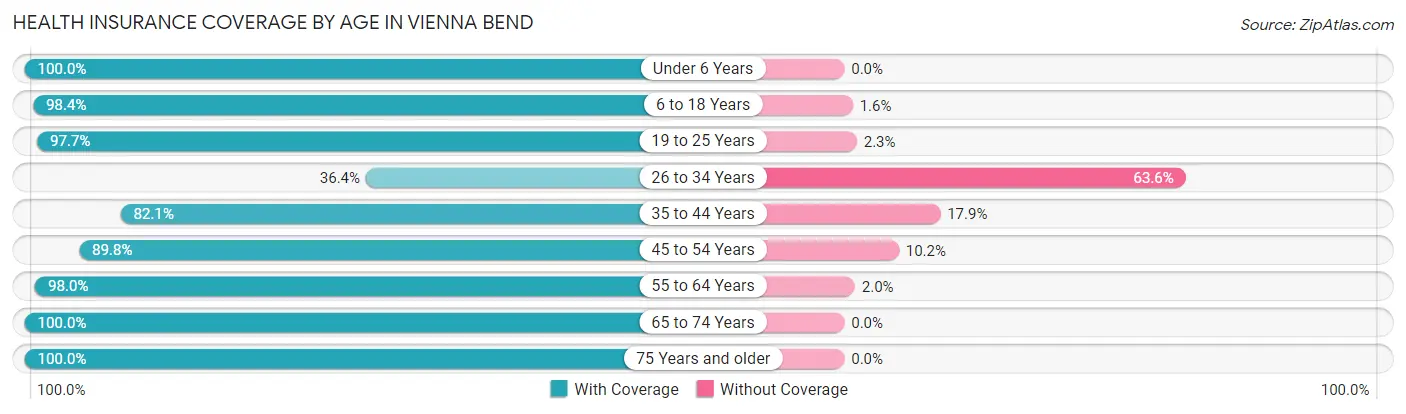
| Age Bracket | With Coverage | Without Coverage |
| Under 6 Years | 56 (100.0%) | 0 (0.0%) |
| 6 to 18 Years | 438 (98.4%) | 7 (1.6%) |
| 19 to 25 Years | 251 (97.7%) | 6 (2.3%) |
| 26 to 34 Years | 24 (36.4%) | 42 (63.6%) |
| 35 to 44 Years | 179 (82.1%) | 39 (17.9%) |
| 45 to 54 Years | 398 (89.8%) | 45 (10.2%) |
| 55 to 64 Years | 100 (98.0%) | 2 (2.0%) |
| 65 to 74 Years | 53 (100.0%) | 0 (0.0%) |
| 75 Years and older | 26 (100.0%) | 0 (0.0%) |
| Total | 1,525 (91.5%) | 141 (8.5%) |
Health Insurance Coverage by Citizenship Status in Vienna Bend
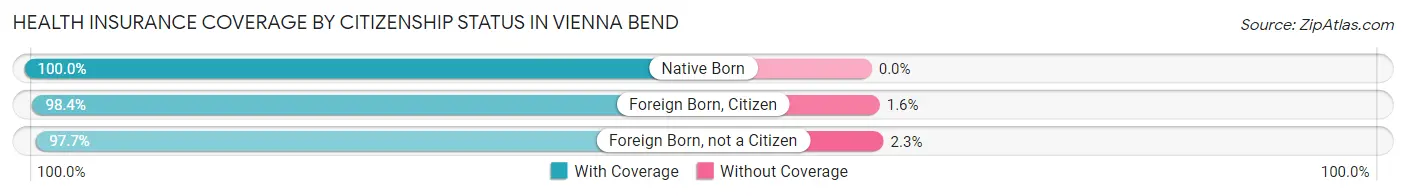
| Citizenship Status | With Coverage | Without Coverage |
| Native Born | 56 (100.0%) | 0 (0.0%) |
| Foreign Born, Citizen | 438 (98.4%) | 7 (1.6%) |
| Foreign Born, not a Citizen | 251 (97.7%) | 6 (2.3%) |
Health Insurance Coverage by Household Income in Vienna Bend
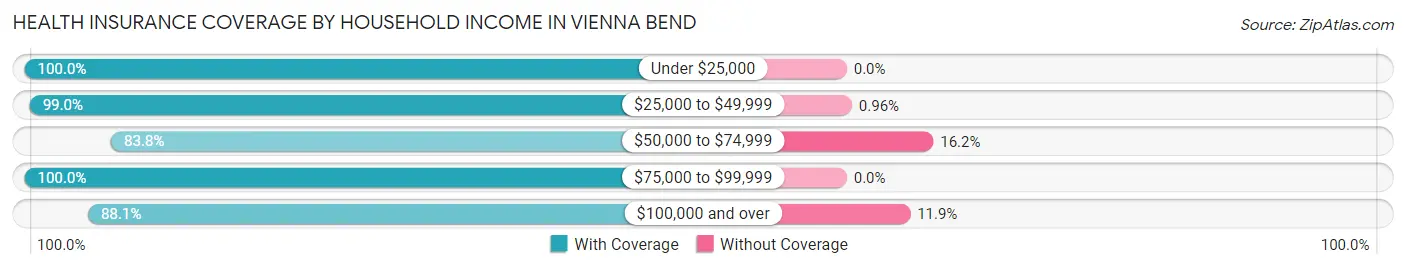
| Household Income | With Coverage | Without Coverage |
| Under $25,000 | 282 (100.0%) | 0 (0.0%) |
| $25,000 to $49,999 | 412 (99.0%) | 4 (1.0%) |
| $50,000 to $74,999 | 512 (83.8%) | 99 (16.2%) |
| $75,000 to $99,999 | 37 (100.0%) | 0 (0.0%) |
| $100,000 and over | 282 (88.1%) | 38 (11.9%) |
Public vs Private Health Insurance Coverage by Age in Vienna Bend
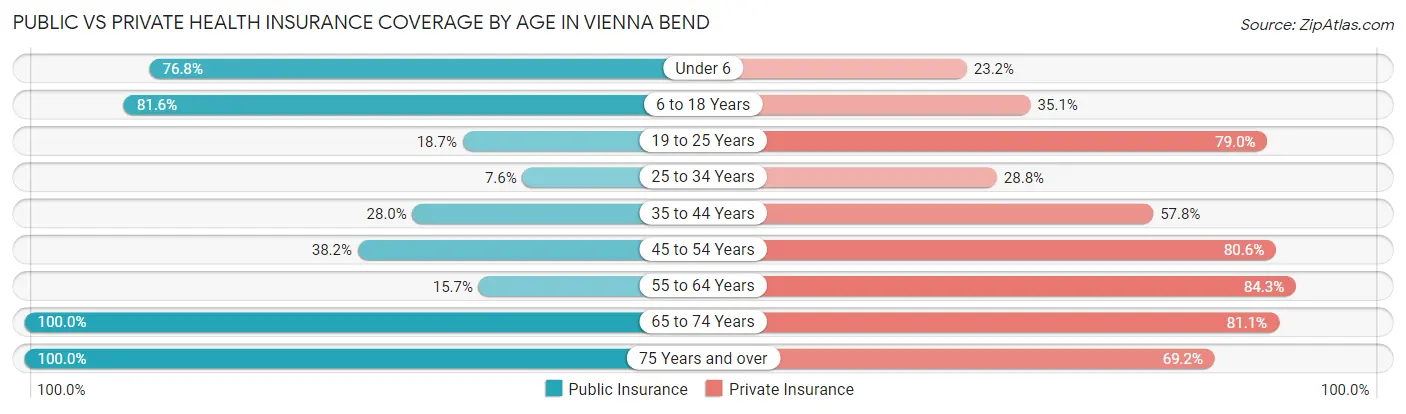
| Age Bracket | Public Insurance | Private Insurance |
| Under 6 | 43 (76.8%) | 13 (23.2%) |
| 6 to 18 Years | 363 (81.6%) | 156 (35.1%) |
| 19 to 25 Years | 48 (18.7%) | 203 (79.0%) |
| 25 to 34 Years | 5 (7.6%) | 19 (28.8%) |
| 35 to 44 Years | 61 (28.0%) | 126 (57.8%) |
| 45 to 54 Years | 169 (38.2%) | 357 (80.6%) |
| 55 to 64 Years | 16 (15.7%) | 86 (84.3%) |
| 65 to 74 Years | 53 (100.0%) | 43 (81.1%) |
| 75 Years and over | 26 (100.0%) | 18 (69.2%) |
| Total | 784 (47.1%) | 1,021 (61.3%) |
Disability Status by Sex by Age in Vienna Bend
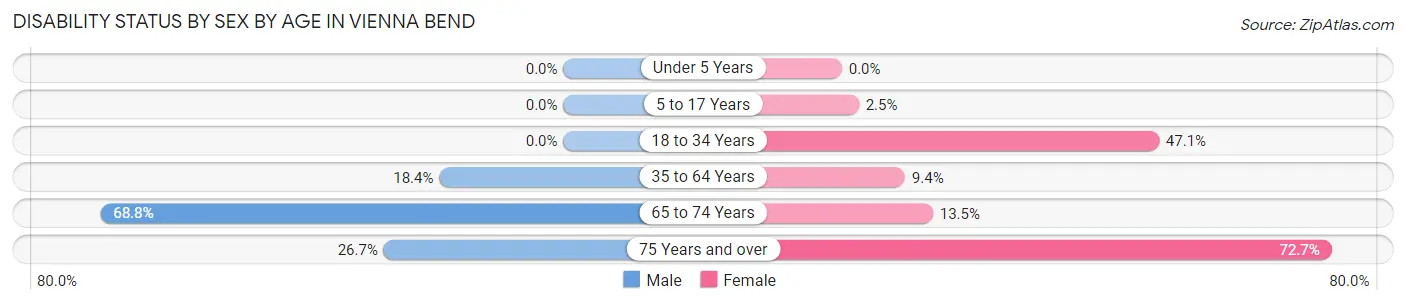
| Age Bracket | Male | Female |
| Under 5 Years | 0 (0.0%) | 0 (0.0%) |
| 5 to 17 Years | 0 (0.0%) | 5 (2.5%) |
| 18 to 34 Years | 0 (0.0%) | 105 (47.1%) |
| 35 to 64 Years | 56 (18.4%) | 43 (9.4%) |
| 65 to 74 Years | 11 (68.8%) | 5 (13.5%) |
| 75 Years and over | 4 (26.7%) | 8 (72.7%) |
Disability Class by Sex by Age in Vienna Bend
Disability Class: Hearing Difficulty
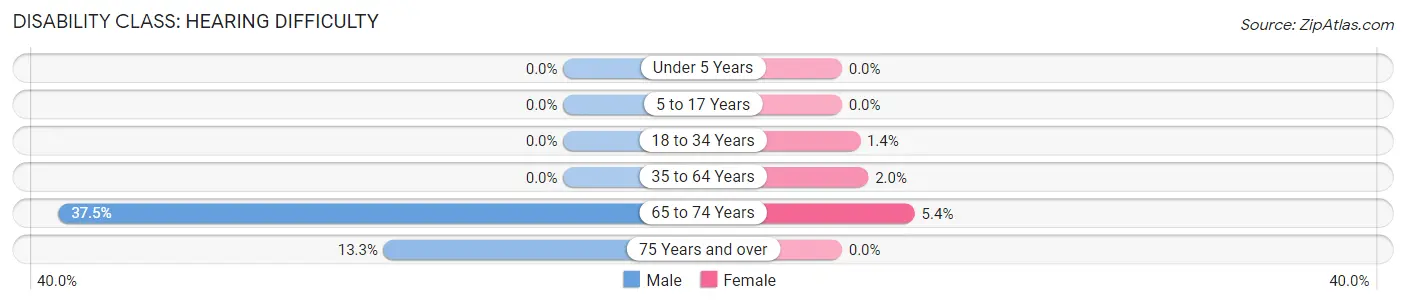
| Age Bracket | Male | Female |
| Under 5 Years | 0 (0.0%) | 0 (0.0%) |
| 5 to 17 Years | 0 (0.0%) | 0 (0.0%) |
| 18 to 34 Years | 0 (0.0%) | 3 (1.3%) |
| 35 to 64 Years | 0 (0.0%) | 9 (2.0%) |
| 65 to 74 Years | 6 (37.5%) | 2 (5.4%) |
| 75 Years and over | 2 (13.3%) | 0 (0.0%) |
Disability Class: Vision Difficulty
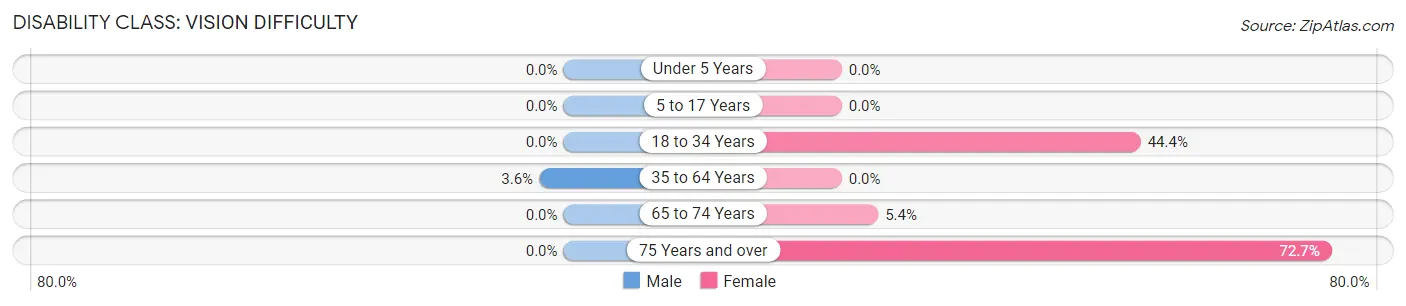
| Age Bracket | Male | Female |
| Under 5 Years | 0 (0.0%) | 0 (0.0%) |
| 5 to 17 Years | 0 (0.0%) | 0 (0.0%) |
| 18 to 34 Years | 0 (0.0%) | 99 (44.4%) |
| 35 to 64 Years | 11 (3.6%) | 0 (0.0%) |
| 65 to 74 Years | 0 (0.0%) | 2 (5.4%) |
| 75 Years and over | 0 (0.0%) | 8 (72.7%) |
Disability Class: Cognitive Difficulty
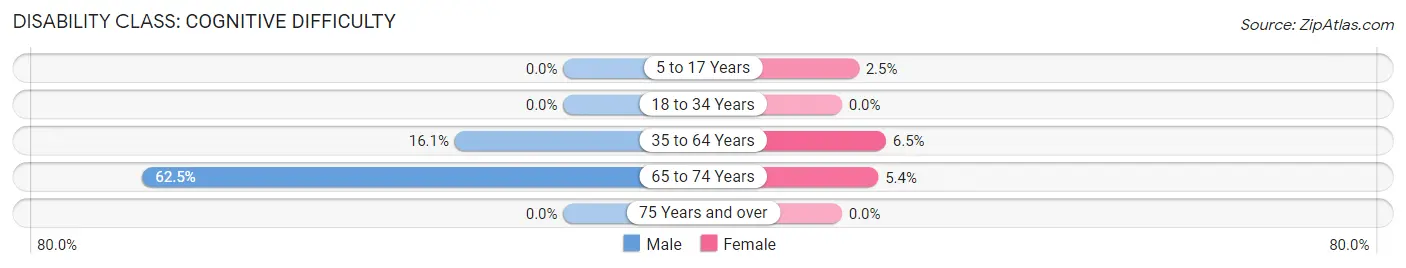
| Age Bracket | Male | Female |
| 5 to 17 Years | 0 (0.0%) | 5 (2.5%) |
| 18 to 34 Years | 0 (0.0%) | 0 (0.0%) |
| 35 to 64 Years | 49 (16.1%) | 30 (6.5%) |
| 65 to 74 Years | 10 (62.5%) | 2 (5.4%) |
| 75 Years and over | 0 (0.0%) | 0 (0.0%) |
Disability Class: Ambulatory Difficulty
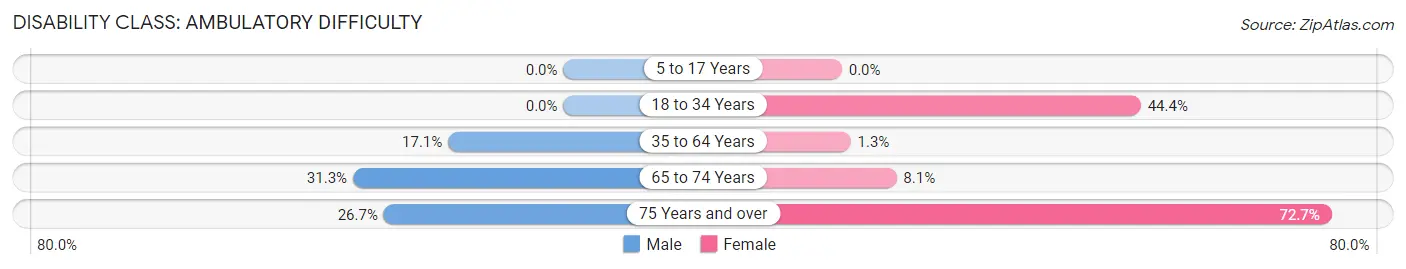
| Age Bracket | Male | Female |
| 5 to 17 Years | 0 (0.0%) | 0 (0.0%) |
| 18 to 34 Years | 0 (0.0%) | 99 (44.4%) |
| 35 to 64 Years | 52 (17.1%) | 6 (1.3%) |
| 65 to 74 Years | 5 (31.2%) | 3 (8.1%) |
| 75 Years and over | 4 (26.7%) | 8 (72.7%) |
Disability Class: Self-Care Difficulty
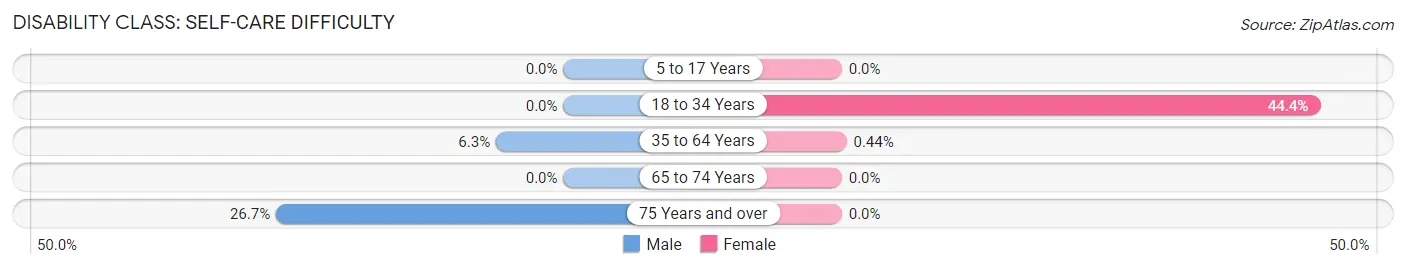
| Age Bracket | Male | Female |
| 5 to 17 Years | 0 (0.0%) | 0 (0.0%) |
| 18 to 34 Years | 0 (0.0%) | 99 (44.4%) |
| 35 to 64 Years | 19 (6.2%) | 2 (0.4%) |
| 65 to 74 Years | 0 (0.0%) | 0 (0.0%) |
| 75 Years and over | 4 (26.7%) | 0 (0.0%) |
Technology Access in Vienna Bend
Computing Device Access in Vienna Bend
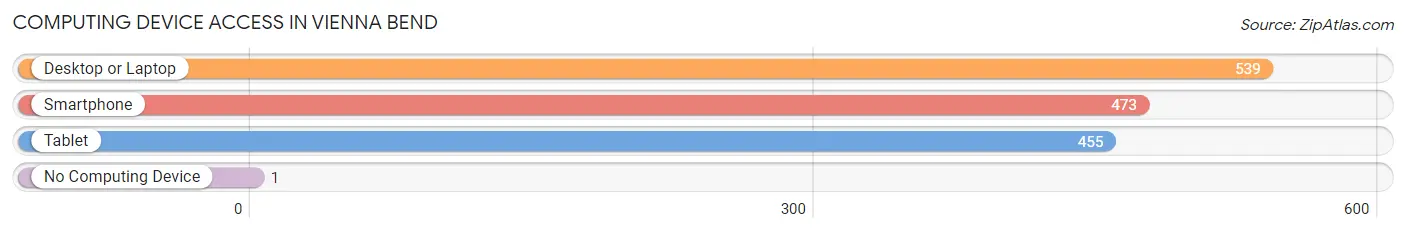
| Device Type | # Households | % Households |
| Desktop or Laptop | 539 | 97.3% |
| Smartphone | 473 | 85.4% |
| Tablet | 455 | 82.1% |
| No Computing Device | 1 | 0.2% |
| Total | 554 | 100.0% |
Internet Access in Vienna Bend
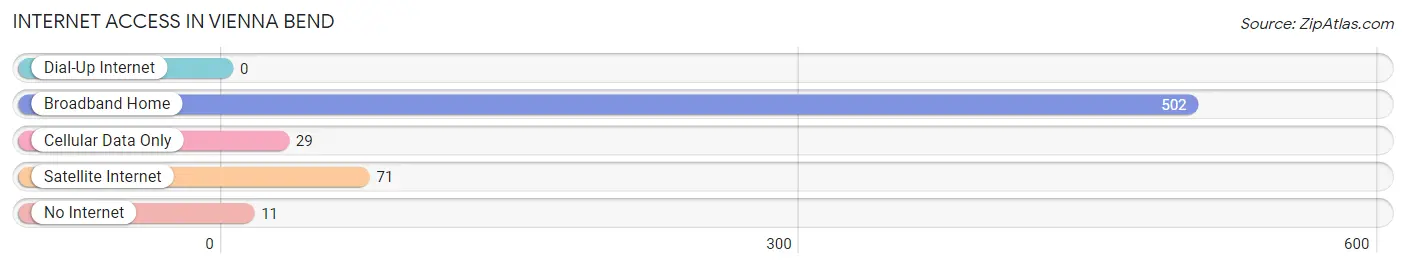
| Internet Type | # Households | % Households |
| Dial-Up Internet | 0 | 0.0% |
| Broadband Home | 502 | 90.6% |
| Cellular Data Only | 29 | 5.2% |
| Satellite Internet | 71 | 12.8% |
| No Internet | 11 | 2.0% |
| Total | 554 | 100.0% |
Vienna Bend Summary
Vienna Bend is a small unincorporated community located in Grant Parish, Louisiana. It is situated on the banks of the Red River, approximately 10 miles south of Colfax. The community is home to a population of approximately 500 people, and is known for its rural charm and friendly atmosphere.
History
Vienna Bend was first settled in the early 1800s by a group of French-Canadian settlers. The settlement was originally known as “La Pointe”, and was located on the banks of the Red River. The settlement was later renamed Vienna Bend, after the nearby Vienna Bend of the Red River.
The area was a popular spot for steamboat traffic in the early 19th century, and the settlement grew rapidly. By the mid-1800s, Vienna Bend had become a thriving community, with a population of over 1,000 people.
The town was home to a variety of businesses, including a general store, a blacksmith shop, a cotton gin, and a sawmill. The town also had a post office, a school, and several churches.
In the late 1800s, the town began to decline in population, as many of the residents moved away in search of better economic opportunities. By the early 1900s, the population had dropped to just over 500 people.
Geography
Vienna Bend is located in Grant Parish, Louisiana, approximately 10 miles south of Colfax. The town is situated on the banks of the Red River, and is surrounded by rolling hills and wooded areas.
The town is located in a humid subtropical climate zone, with hot, humid summers and mild winters. The average annual temperature is around 70 degrees Fahrenheit, and the average annual precipitation is around 50 inches.
Economy
The economy of Vienna Bend is largely based on agriculture and forestry. The town is home to several farms, which produce a variety of crops, including cotton, corn, soybeans, and wheat. The town is also home to several timber companies, which harvest timber from the surrounding forests.
The town is also home to several small businesses, including a general store, a gas station, and a restaurant. The town is also home to a post office, a school, and several churches.
Demographics
As of the 2010 census, the population of Vienna Bend was 498 people. The racial makeup of the town was 97.2% White, 0.6% African American, 0.2% Native American, 0.2% Asian, 0.2% from other races, and 1.8% from two or more races.
The median household income in Vienna Bend was $30,000, and the median family income was $35,000. The per capita income was $14,000. Approximately 15.7% of the population was below the poverty line.
Conclusion
Vienna Bend is a small unincorporated community located in Grant Parish, Louisiana. It is situated on the banks of the Red River, and is home to a population of approximately 500 people. The town is known for its rural charm and friendly atmosphere, and is home to a variety of businesses and industries. The economy of Vienna Bend is largely based on agriculture and forestry, and the town is home to several small businesses. The population of Vienna Bend is predominantly White, with a median household income of $30,000.
Common Questions
What is the Total Population of Vienna Bend?
Total Population of Vienna Bend is 1,666.
What is the Total Male Population of Vienna Bend?
Total Male Population of Vienna Bend is 737.
What is the Total Female Population of Vienna Bend?
Total Female Population of Vienna Bend is 929.
What is the Ratio of Males per 100 Females in Vienna Bend?
There are 79.33 Males per 100 Females in Vienna Bend.
What is the Ratio of Females per 100 Males in Vienna Bend?
There are 126.05 Females per 100 Males in Vienna Bend.
What is the Median Population Age in Vienna Bend?
Median Population Age in Vienna Bend is 35.8 Years.
What is the Average Family Size in Vienna Bend
Average Family Size in Vienna Bend is 3.4 People.
What is the Average Household Size in Vienna Bend
Average Household Size in Vienna Bend is 3.0 People.
What is Per Capita Income in Vienna Bend?
Per Capita income in Vienna Bend is $19,594.
What is the Median Family Income in Vienna Bend?
Median Family Income in Vienna Bend is $44,958.
What is the Median Household income in Vienna Bend?
Median Household Income in Vienna Bend is $42,754.
What is Income or Wage Gap in Vienna Bend?
Income or Wage Gap in Vienna Bend is 5.2%.
Women in Vienna Bend earn 94.8 cents for every dollar earned by a man.
What is Inequality or Gini Index in Vienna Bend?
Inequality or Gini Index in Vienna Bend is 0.39.
How Large is the Labor Force in Vienna Bend?
There are 906 People in the Labor Forcein in Vienna Bend.
What is the Percentage of People in the Labor Force in Vienna Bend?
69.4% of People are in the Labor Force in Vienna Bend.
What is the Unemployment Rate in Vienna Bend?
Unemployment Rate in Vienna Bend is 12.6%.