Cities with the Highest Percentage of Population Employed in Real Estate, Rental & Leasing in Louisiana
RELATED REPORTS & OPTIONS
Real Estate, Rental & Leasing
Louisiana
Compare Cities
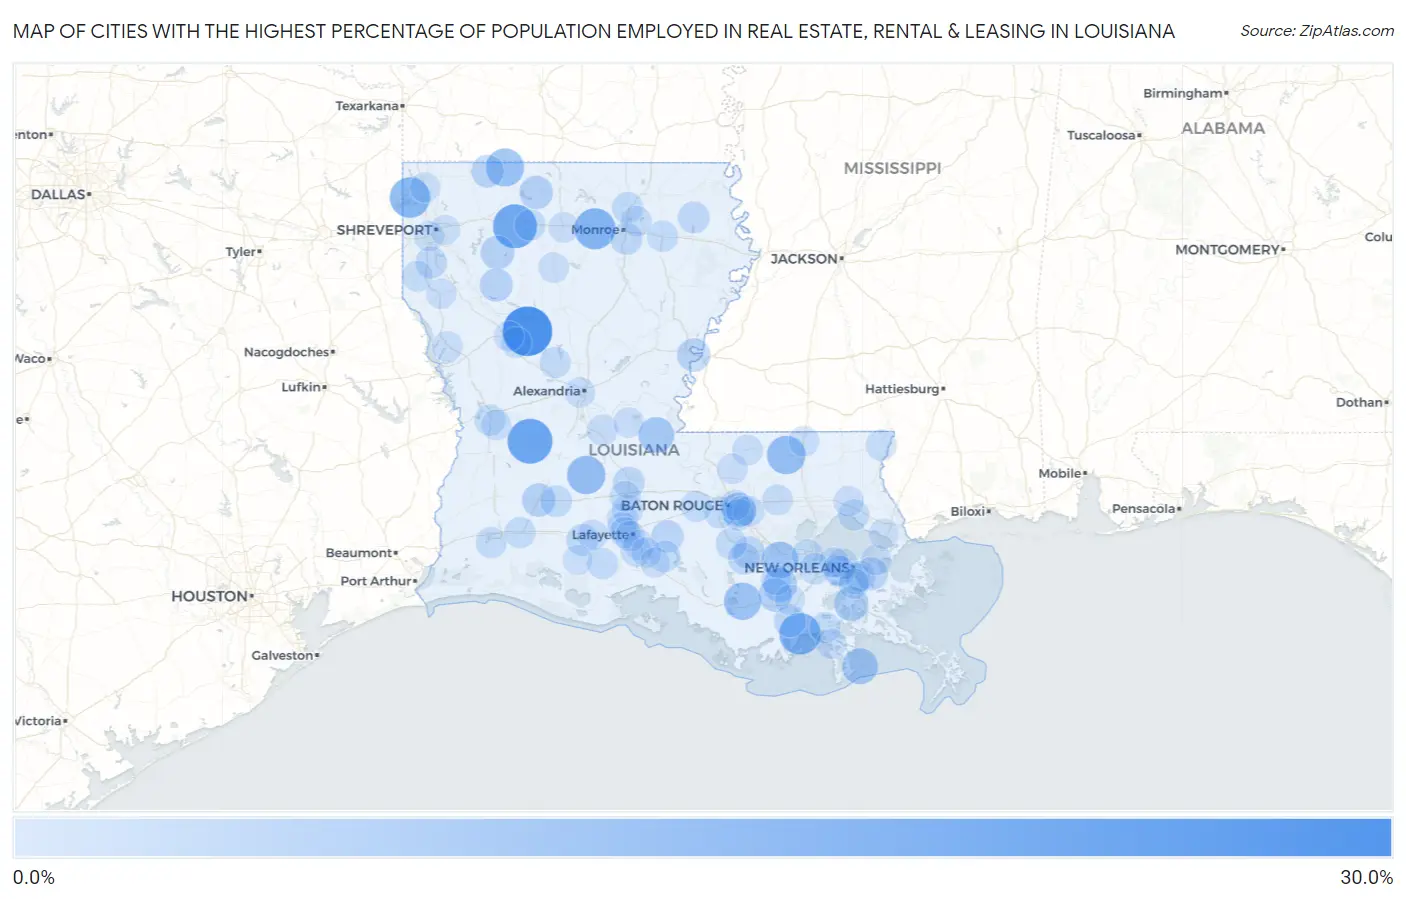
Map of Cities with the Highest Percentage of Population Employed in Real Estate, Rental & Leasing in Louisiana
0.0%
30.0%
Cities with the Highest Percentage of Population Employed in Real Estate, Rental & Leasing in Louisiana
| City | % Employed | vs State | vs National | |
| 1. | St Maurice | 27.8% | 1.6%(+26.2)#1 | 1.9%(+25.9)#81 |
| 2. | Pitkin | 21.2% | 1.6%(+19.6)#2 | 1.9%(+19.4)#140 |
| 3. | Gibsland | 20.1% | 1.6%(+18.5)#3 | 1.9%(+18.2)#152 |
| 4. | Montegut | 16.9% | 1.6%(+15.3)#4 | 1.9%(+15.0)#196 |
| 5. | Calhoun | 16.2% | 1.6%(+14.6)#5 | 1.9%(+14.3)#213 |
| 6. | Oil City | 15.2% | 1.6%(+13.6)#6 | 1.9%(+13.4)#238 |
| 7. | Greensburg | 12.8% | 1.6%(+11.2)#7 | 1.9%(+10.9)#330 |
| 8. | Reddell | 12.4% | 1.6%(+10.8)#8 | 1.9%(+10.5)#349 |
| 9. | Haynesville | 11.9% | 1.6%(+10.3)#9 | 1.9%(+10.1)#379 |
| 10. | Bayou L Ourse | 11.1% | 1.6%(+9.50)#10 | 1.9%(+9.22)#434 |
| 11. | Paulina | 10.3% | 1.6%(+8.72)#11 | 1.9%(+8.44)#499 |
| 12. | Grand Isle | 9.3% | 1.6%(+7.72)#12 | 1.9%(+7.44)#604 |
| 13. | Simmesport | 9.1% | 1.6%(+7.50)#13 | 1.9%(+7.22)#632 |
| 14. | Westminster | 7.7% | 1.6%(+6.12)#14 | 1.9%(+5.84)#874 |
| 15. | Lafitte | 7.3% | 1.6%(+5.69)#15 | 1.9%(+5.41)#968 |
| 16. | Choctaw | 6.8% | 1.6%(+5.22)#16 | 1.9%(+4.93)#1,095 |
| 17. | Lisbon | 6.2% | 1.6%(+4.64)#17 | 1.9%(+4.36)#1,274 |
| 18. | Jamestown | 6.2% | 1.6%(+4.64)#18 | 1.9%(+4.36)#1,276 |
| 19. | Kinder | 6.1% | 1.6%(+4.50)#19 | 1.9%(+4.21)#1,332 |
| 20. | Lafourche Crossing | 6.0% | 1.6%(+4.43)#20 | 1.9%(+4.14)#1,359 |
| 21. | Minorca | 5.8% | 1.6%(+4.14)#21 | 1.9%(+3.86)#1,477 |
| 22. | Martin | 5.6% | 1.6%(+4.02)#22 | 1.9%(+3.73)#1,534 |
| 23. | Shongaloo | 5.1% | 1.6%(+3.52)#23 | 1.9%(+3.24)#1,791 |
| 24. | Meraux | 5.1% | 1.6%(+3.49)#24 | 1.9%(+3.21)#1,802 |
| 25. | Catahoula | 4.7% | 1.6%(+3.11)#25 | 1.9%(+2.83)#2,046 |
| 26. | Donaldsonville | 4.4% | 1.6%(+2.74)#26 | 1.9%(+2.46)#2,323 |
| 27. | Presquille | 4.2% | 1.6%(+2.59)#27 | 1.9%(+2.30)#2,447 |
| 28. | Richwood | 4.1% | 1.6%(+2.47)#28 | 1.9%(+2.19)#2,572 |
| 29. | Estherwood | 4.1% | 1.6%(+2.44)#29 | 1.9%(+2.16)#2,602 |
| 30. | Stonewall | 4.0% | 1.6%(+2.36)#30 | 1.9%(+2.08)#2,693 |
| 31. | Belle Rose | 3.9% | 1.6%(+2.29)#31 | 1.9%(+2.00)#2,775 |
| 32. | Washington | 3.8% | 1.6%(+2.20)#32 | 1.9%(+1.92)#2,865 |
| 33. | Epps | 3.8% | 1.6%(+2.20)#33 | 1.9%(+1.92)#2,867 |
| 34. | Elton | 3.7% | 1.6%(+2.10)#34 | 1.9%(+1.82)#2,995 |
| 35. | Brusly | 3.6% | 1.6%(+2.02)#35 | 1.9%(+1.74)#3,118 |
| 36. | White Castle | 3.6% | 1.6%(+1.99)#36 | 1.9%(+1.71)#3,148 |
| 37. | Sterlington | 3.3% | 1.6%(+1.73)#37 | 1.9%(+1.45)#3,508 |
| 38. | Laplace | 3.3% | 1.6%(+1.69)#38 | 1.9%(+1.41)#3,583 |
| 39. | Hahnville | 3.3% | 1.6%(+1.66)#39 | 1.9%(+1.38)#3,634 |
| 40. | New Llano | 3.3% | 1.6%(+1.64)#40 | 1.9%(+1.36)#3,673 |
| 41. | Oak Hills Place | 3.2% | 1.6%(+1.61)#41 | 1.9%(+1.33)#3,730 |
| 42. | Rayville | 3.2% | 1.6%(+1.60)#42 | 1.9%(+1.32)#3,759 |
| 43. | Loreauville | 3.2% | 1.6%(+1.59)#43 | 1.9%(+1.31)#3,774 |
| 44. | Rosedale | 3.2% | 1.6%(+1.57)#44 | 1.9%(+1.29)#3,800 |
| 45. | Mandeville | 3.2% | 1.6%(+1.56)#45 | 1.9%(+1.28)#3,811 |
| 46. | Colfax | 3.1% | 1.6%(+1.54)#46 | 1.9%(+1.25)#3,856 |
| 47. | Iowa | 3.1% | 1.6%(+1.53)#47 | 1.9%(+1.25)#3,861 |
| 48. | Cut Off | 3.1% | 1.6%(+1.49)#48 | 1.9%(+1.21)#3,930 |
| 49. | Arcadia | 3.0% | 1.6%(+1.44)#49 | 1.9%(+1.15)#4,039 |
| 50. | Harvey | 3.0% | 1.6%(+1.41)#50 | 1.9%(+1.13)#4,079 |
| 51. | Prien | 3.0% | 1.6%(+1.38)#51 | 1.9%(+1.10)#4,142 |
| 52. | Kaplan | 3.0% | 1.6%(+1.38)#52 | 1.9%(+1.09)#4,145 |
| 53. | Youngsville | 2.9% | 1.6%(+1.29)#53 | 1.9%(+1.01)#4,325 |
| 54. | Swartz | 2.9% | 1.6%(+1.27)#54 | 1.9%(+0.989)#4,360 |
| 55. | Cheneyville | 2.8% | 1.6%(+1.23)#55 | 1.9%(+0.952)#4,442 |
| 56. | Lewisburg | 2.8% | 1.6%(+1.23)#56 | 1.9%(+0.945)#4,456 |
| 57. | Crowley | 2.8% | 1.6%(+1.16)#57 | 1.9%(+0.875)#4,609 |
| 58. | Cankton | 2.8% | 1.6%(+1.16)#58 | 1.9%(+0.875)#4,611 |
| 59. | Varnado | 2.7% | 1.6%(+1.12)#59 | 1.9%(+0.836)#4,712 |
| 60. | Livingston | 2.7% | 1.6%(+1.10)#60 | 1.9%(+0.823)#4,746 |
| 61. | River Ridge | 2.7% | 1.6%(+1.08)#61 | 1.9%(+0.795)#4,815 |
| 62. | Ossun | 2.7% | 1.6%(+1.06)#62 | 1.9%(+0.781)#4,851 |
| 63. | Keachi | 2.7% | 1.6%(+1.06)#63 | 1.9%(+0.775)#4,873 |
| 64. | Sunset | 2.7% | 1.6%(+1.05)#64 | 1.9%(+0.770)#4,891 |
| 65. | Metairie | 2.7% | 1.6%(+1.04)#65 | 1.9%(+0.760)#4,924 |
| 66. | Terrytown | 2.7% | 1.6%(+1.04)#66 | 1.9%(+0.760)#4,925 |
| 67. | Opelousas | 2.6% | 1.6%(+1.04)#67 | 1.9%(+0.755)#4,934 |
| 68. | Natchez | 2.6% | 1.6%(+1.02)#68 | 1.9%(+0.740)#4,971 |
| 69. | Clinton | 2.5% | 1.6%(+0.927)#69 | 1.9%(+0.645)#5,245 |
| 70. | Scott | 2.5% | 1.6%(+0.925)#70 | 1.9%(+0.643)#5,250 |
| 71. | Shenandoah | 2.5% | 1.6%(+0.901)#71 | 1.9%(+0.619)#5,303 |
| 72. | Harahan | 2.5% | 1.6%(+0.871)#72 | 1.9%(+0.589)#5,383 |
| 73. | Kentwood | 2.4% | 1.6%(+0.825)#73 | 1.9%(+0.543)#5,541 |
| 74. | Chackbay | 2.4% | 1.6%(+0.809)#74 | 1.9%(+0.527)#5,581 |
| 75. | Zwolle | 2.3% | 1.6%(+0.716)#75 | 1.9%(+0.434)#5,883 |
| 76. | Broussard | 2.3% | 1.6%(+0.701)#76 | 1.9%(+0.419)#5,927 |
| 77. | Slaughter | 2.3% | 1.6%(+0.653)#77 | 1.9%(+0.371)#6,099 |
| 78. | New Orleans | 2.3% | 1.6%(+0.653)#78 | 1.9%(+0.371)#6,102 |
| 79. | Lafayette | 2.3% | 1.6%(+0.642)#79 | 1.9%(+0.360)#6,139 |
| 80. | Covington | 2.2% | 1.6%(+0.611)#80 | 1.9%(+0.329)#6,249 |
| 81. | Mansura | 2.2% | 1.6%(+0.596)#81 | 1.9%(+0.314)#6,289 |
| 82. | Ruston | 2.2% | 1.6%(+0.593)#82 | 1.9%(+0.311)#6,302 |
| 83. | Alexandria | 2.2% | 1.6%(+0.579)#83 | 1.9%(+0.297)#6,360 |
| 84. | Jonesboro | 2.2% | 1.6%(+0.576)#84 | 1.9%(+0.294)#6,374 |
| 85. | Mansfield | 2.2% | 1.6%(+0.570)#85 | 1.9%(+0.287)#6,398 |
| 86. | Fort Polk South | 2.2% | 1.6%(+0.564)#86 | 1.9%(+0.282)#6,415 |
| 87. | Golden Meadow | 2.2% | 1.6%(+0.544)#87 | 1.9%(+0.261)#6,489 |
| 88. | Woodmere | 2.1% | 1.6%(+0.540)#88 | 1.9%(+0.258)#6,499 |
| 89. | Shreveport | 2.1% | 1.6%(+0.495)#89 | 1.9%(+0.213)#6,653 |
| 90. | Baton Rouge | 2.1% | 1.6%(+0.441)#90 | 1.9%(+0.159)#6,853 |
| 91. | Inniswold | 2.0% | 1.6%(+0.431)#91 | 1.9%(+0.149)#6,879 |
| 92. | Kenner | 2.0% | 1.6%(+0.427)#92 | 1.9%(+0.145)#6,906 |
| 93. | Raceland | 2.0% | 1.6%(+0.422)#93 | 1.9%(+0.140)#6,919 |
| 94. | Cade | 2.0% | 1.6%(+0.401)#94 | 1.9%(+0.119)#7,005 |
| 95. | Bossier City | 2.0% | 1.6%(+0.367)#95 | 1.9%(+0.085)#7,158 |
| 96. | New Iberia | 2.0% | 1.6%(+0.344)#96 | 1.9%(+0.061)#7,249 |
| 97. | Eden Isle | 1.9% | 1.6%(+0.282)#97 | 1.9%(-0.000)#7,479 |
| 98. | Gilliam | 1.9% | 1.6%(+0.277)#98 | 1.9%(-0.005)#7,502 |
| 99. | Gueydan | 1.9% | 1.6%(+0.242)#99 | 1.9%(-0.040)#7,631 |
| 100. | Natchitoches | 1.8% | 1.6%(+0.224)#100 | 1.9%(-0.059)#7,705 |
Common Questions
What are the Top 10 Cities with the Highest Percentage of Population Employed in Real Estate, Rental & Leasing in Louisiana?
Top 10 Cities with the Highest Percentage of Population Employed in Real Estate, Rental & Leasing in Louisiana are:
#1
27.8%
#2
21.2%
#3
20.1%
#4
16.9%
#5
16.2%
#6
15.2%
#7
12.8%
#8
12.4%
#9
11.9%
#10
11.1%
What city has the Highest Percentage of Population Employed in Real Estate, Rental & Leasing in Louisiana?
St Maurice has the Highest Percentage of Population Employed in Real Estate, Rental & Leasing in Louisiana with 27.8%.
What is the Percentage of Population Employed in Real Estate, Rental & Leasing in the State of Louisiana?
Percentage of Population Employed in Real Estate, Rental & Leasing in Louisiana is 1.6%.
What is the Percentage of Population Employed in Real Estate, Rental & Leasing in the United States?
Percentage of Population Employed in Real Estate, Rental & Leasing in the United States is 1.9%.