Dubach, LA
Dubach Map
Dubach Overview
1,026
TOTAL POPULATION
458
MALE POPULATION
568
FEMALE POPULATION
80.63
MALES / 100 FEMALES
124.02
FEMALES / 100 MALES
30.4
MEDIAN AGE
3.3
AVG FAMILY SIZE
2.5
AVG HOUSEHOLD SIZE
$22,041
PER CAPITA INCOME
$59,167
AVG FAMILY INCOME
$31,953
AVG HOUSEHOLD INCOME
0.48
INEQUALITY / GINI INDEX
486
LABOR FORCE [ PEOPLE ]
56.2%
PERCENT IN LABOR FORCE
2.9%
UNEMPLOYMENT RATE
Dubach Zip Codes
Dubach Area Codes
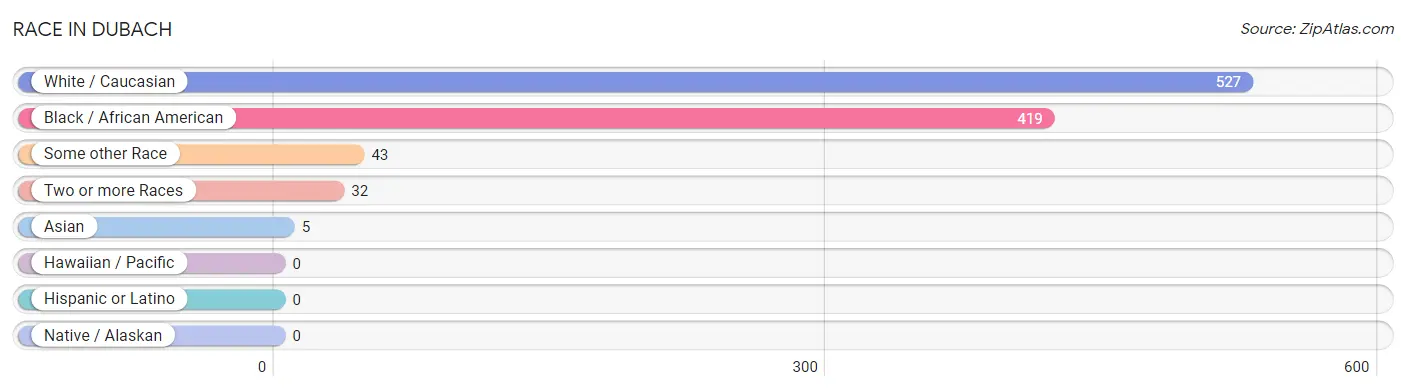
Race in Dubach
The most populous races in Dubach are White / Caucasian (527 | 51.4%), Black / African American (419 | 40.8%), and Some other Race (43 | 4.2%).
| Race | # Population | % Population |
| Asian | 5 | 0.5% |
| Black / African American | 419 | 40.8% |
| Hawaiian / Pacific | 0 | 0.0% |
| Hispanic or Latino | 0 | 0.0% |
| Native / Alaskan | 0 | 0.0% |
| White / Caucasian | 527 | 51.4% |
| Two or more Races | 32 | 3.1% |
| Some other Race | 43 | 4.2% |
| Total | 1,026 | 100.0% |
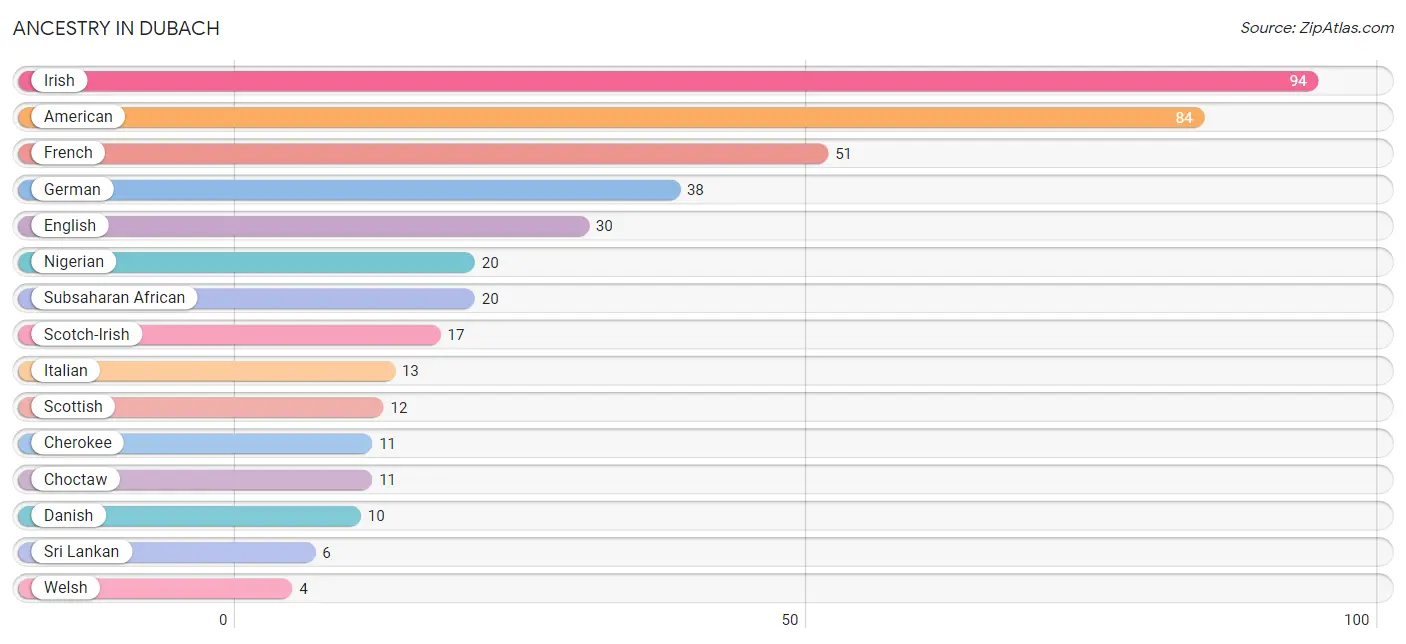
Ancestry in Dubach
The most populous ancestries reported in Dubach are Irish (94 | 9.2%), American (84 | 8.2%), French (51 | 5.0%), German (38 | 3.7%), and English (30 | 2.9%), together accounting for 28.9% of all Dubach residents.
| Ancestry | # Population | % Population |
| American | 84 | 8.2% |
| Cherokee | 11 | 1.1% |
| Choctaw | 11 | 1.1% |
| Danish | 10 | 1.0% |
| English | 30 | 2.9% |
| French | 51 | 5.0% |
| German | 38 | 3.7% |
| Indian (Asian) | 3 | 0.3% |
| Irish | 94 | 9.2% |
| Italian | 13 | 1.3% |
| Nigerian | 20 | 1.9% |
| Scotch-Irish | 17 | 1.7% |
| Scottish | 12 | 1.2% |
| Sri Lankan | 6 | 0.6% |
| Subsaharan African | 20 | 1.9% |
| Welsh | 4 | 0.4% | View All 16 Rows |
Immigrants in Dubach
The most numerous immigrant groups reported in Dubach came from Asia (3 | 0.3%), South Eastern Asia (3 | 0.3%), and Vietnam (3 | 0.3%), together accounting for 0.9% of all Dubach residents.

| Immigration Origin | # Population | % Population |
| Asia | 3 | 0.3% |
| South Eastern Asia | 3 | 0.3% |
| Vietnam | 3 | 0.3% | View All 3 Rows |
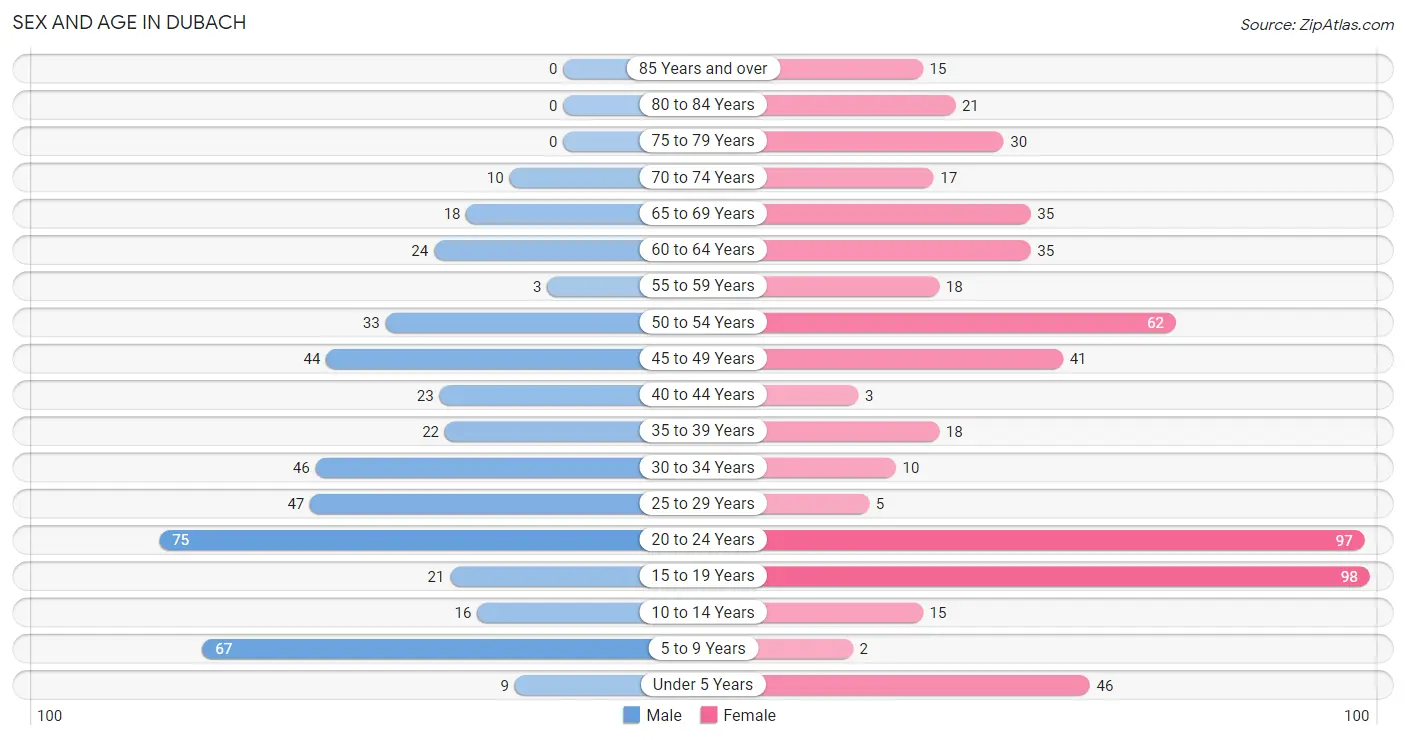
Sex and Age in Dubach
Sex and Age in Dubach
The most populous age groups in Dubach are 20 to 24 Years (75 | 16.4%) for men and 15 to 19 Years (98 | 17.2%) for women.
| Age Bracket | Male | Female |
| Under 5 Years | 9 (2.0%) | 46 (8.1%) |
| 5 to 9 Years | 67 (14.6%) | 2 (0.4%) |
| 10 to 14 Years | 16 (3.5%) | 15 (2.6%) |
| 15 to 19 Years | 21 (4.6%) | 98 (17.2%) |
| 20 to 24 Years | 75 (16.4%) | 97 (17.1%) |
| 25 to 29 Years | 47 (10.3%) | 5 (0.9%) |
| 30 to 34 Years | 46 (10.0%) | 10 (1.8%) |
| 35 to 39 Years | 22 (4.8%) | 18 (3.2%) |
| 40 to 44 Years | 23 (5.0%) | 3 (0.5%) |
| 45 to 49 Years | 44 (9.6%) | 41 (7.2%) |
| 50 to 54 Years | 33 (7.2%) | 62 (10.9%) |
| 55 to 59 Years | 3 (0.7%) | 18 (3.2%) |
| 60 to 64 Years | 24 (5.2%) | 35 (6.2%) |
| 65 to 69 Years | 18 (3.9%) | 35 (6.2%) |
| 70 to 74 Years | 10 (2.2%) | 17 (3.0%) |
| 75 to 79 Years | 0 (0.0%) | 30 (5.3%) |
| 80 to 84 Years | 0 (0.0%) | 21 (3.7%) |
| 85 Years and over | 0 (0.0%) | 15 (2.6%) |
| Total | 458 (100.0%) | 568 (100.0%) |
Families and Households in Dubach
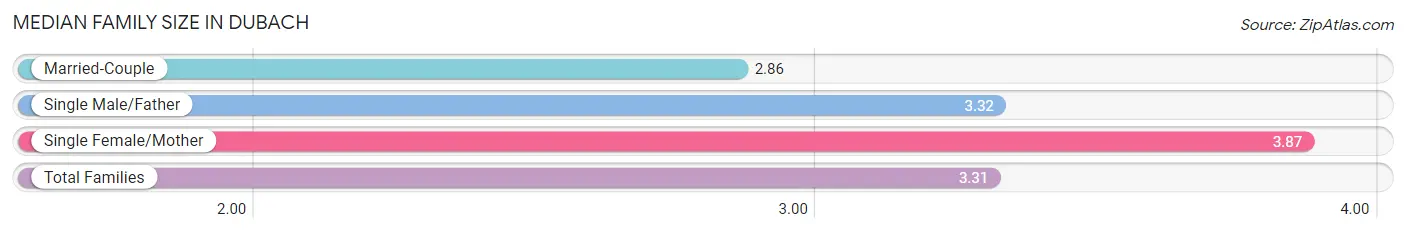
Median Family Size in Dubach
The median family size in Dubach is 3.31 persons per family, with single female/mother families (79 | 35.0%) accounting for the largest median family size of 3.87 persons per family. On the other hand, married-couple families (103 | 45.6%) represent the smallest median family size with 2.86 persons per family.
| Family Type | # Families | Family Size |
| Married-Couple | 103 (45.6%) | 2.86 |
| Single Male/Father | 44 (19.5%) | 3.32 |
| Single Female/Mother | 79 (35.0%) | 3.87 |
| Total Families | 226 (100.0%) | 3.31 |
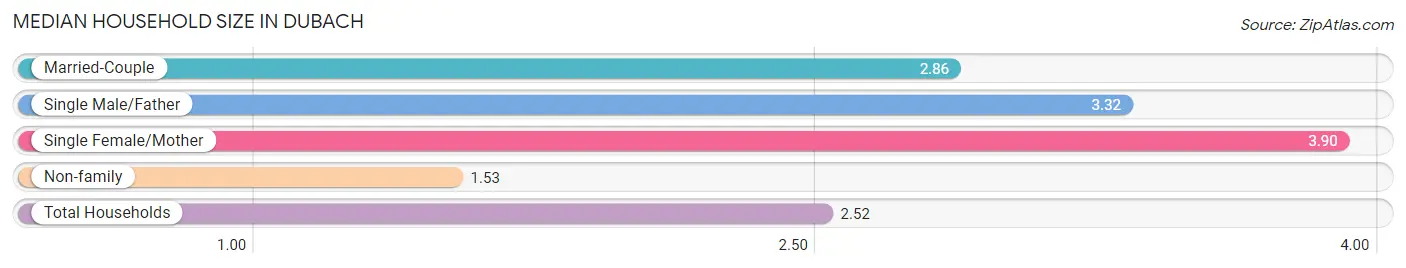
Median Household Size in Dubach
The median household size in Dubach is 2.52 persons per household, with single female/mother households (79 | 19.4%) accounting for the largest median household size of 3.9 persons per household. non-family households (181 | 44.5%) represent the smallest median household size with 1.53 persons per household.
| Household Type | # Households | Household Size |
| Married-Couple | 103 (25.3%) | 2.86 |
| Single Male/Father | 44 (10.8%) | 3.32 |
| Single Female/Mother | 79 (19.4%) | 3.90 |
| Non-family | 181 (44.5%) | 1.53 |
| Total Households | 407 (100.0%) | 2.52 |
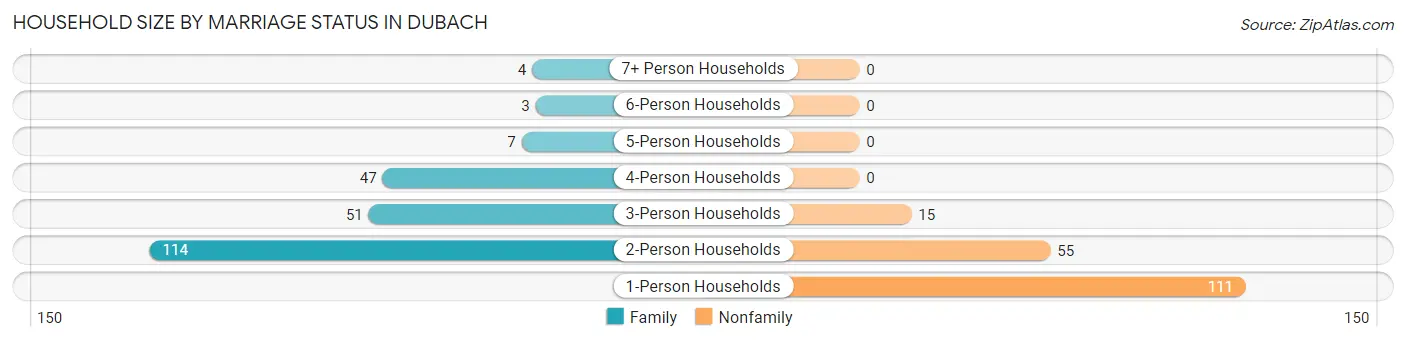
Household Size by Marriage Status in Dubach
Out of a total of 407 households in Dubach, 226 (55.5%) are family households, while 181 (44.5%) are nonfamily households. The most numerous type of family households are 2-person households, comprising 114, and the most common type of nonfamily households are 1-person households, comprising 111.
| Household Size | Family Households | Nonfamily Households |
| 1-Person Households | - | 111 (27.3%) |
| 2-Person Households | 114 (28.0%) | 55 (13.5%) |
| 3-Person Households | 51 (12.5%) | 15 (3.7%) |
| 4-Person Households | 47 (11.6%) | 0 (0.0%) |
| 5-Person Households | 7 (1.7%) | 0 (0.0%) |
| 6-Person Households | 3 (0.7%) | 0 (0.0%) |
| 7+ Person Households | 4 (1.0%) | 0 (0.0%) |
| Total | 226 (55.5%) | 181 (44.5%) |
Female Fertility in Dubach
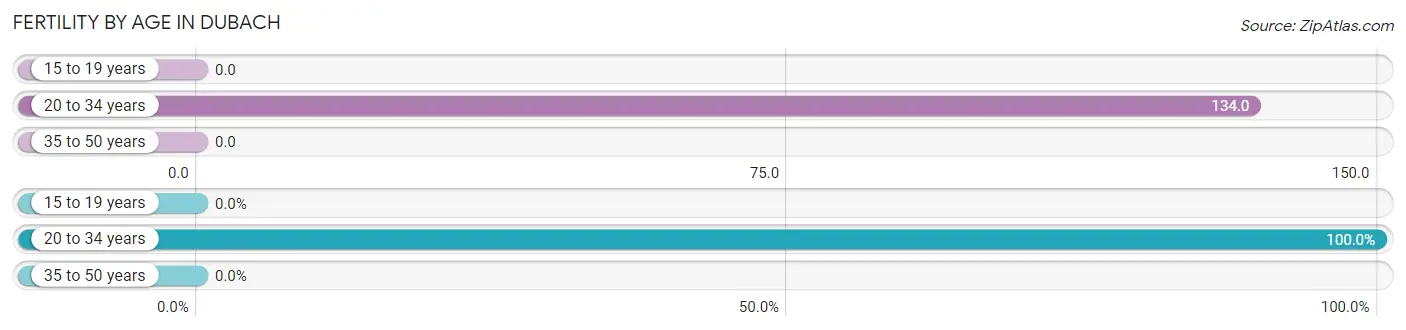
Fertility by Age in Dubach
Average fertility rate in Dubach is 53.0 births per 1,000 women. Women in the age bracket of 20 to 34 years have the highest fertility rate with 134.0 births per 1,000 women. Women in the age bracket of 20 to 34 years acount for 100.0% of all women with births.
| Age Bracket | Women with Births | Births / 1,000 Women |
| 15 to 19 years | 0 (0.0%) | 0.0 |
| 20 to 34 years | 15 (100.0%) | 134.0 |
| 35 to 50 years | 0 (0.0%) | 0.0 |
| Total | 15 (100.0%) | 53.0 |
Fertility by Age by Marriage Status in Dubach
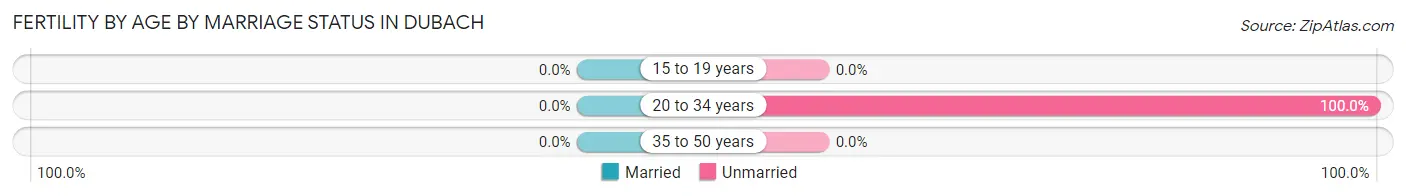
| Age Bracket | Married | Unmarried |
| 15 to 19 years | 0 (0.0%) | 0 (0.0%) |
| 20 to 34 years | 0 (0.0%) | 15 (100.0%) |
| 35 to 50 years | 0 (0.0%) | 0 (0.0%) |
| Total | 0 (0.0%) | 15 (100.0%) |
Fertility by Education in Dubach
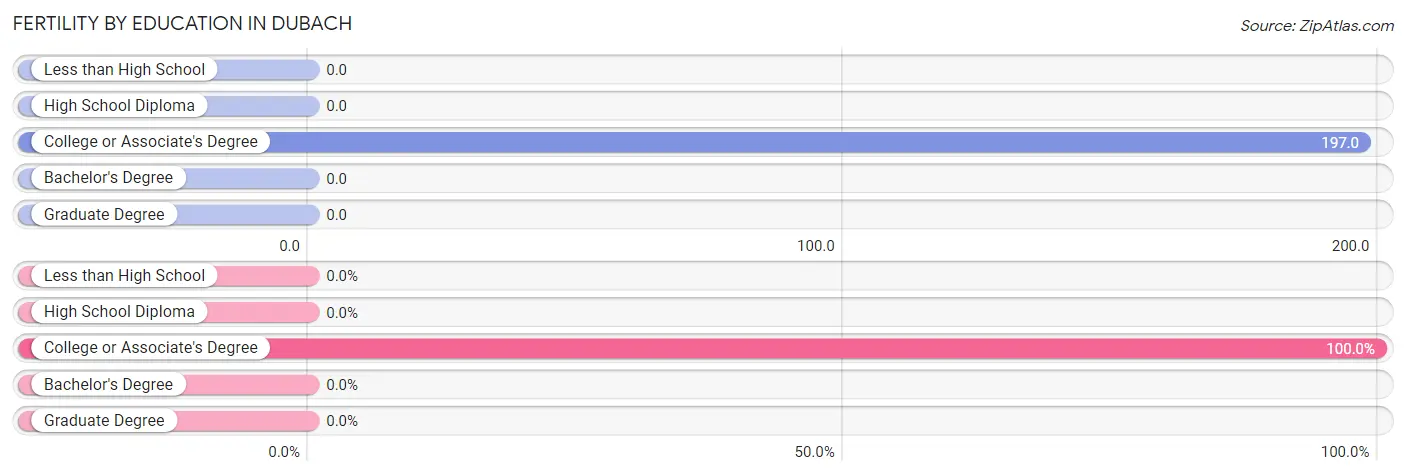
| Educational Attainment | Women with Births | Births / 1,000 Women |
| Less than High School | 0 (0.0%) | 0.0 |
| High School Diploma | 0 (0.0%) | 0.0 |
| College or Associate's Degree | 15 (100.0%) | 197.0 |
| Bachelor's Degree | 0 (0.0%) | 0.0 |
| Graduate Degree | 0 (0.0%) | 0.0 |
| Total | 15 (100.0%) | 53.0 |
Fertility by Education by Marriage Status in Dubach
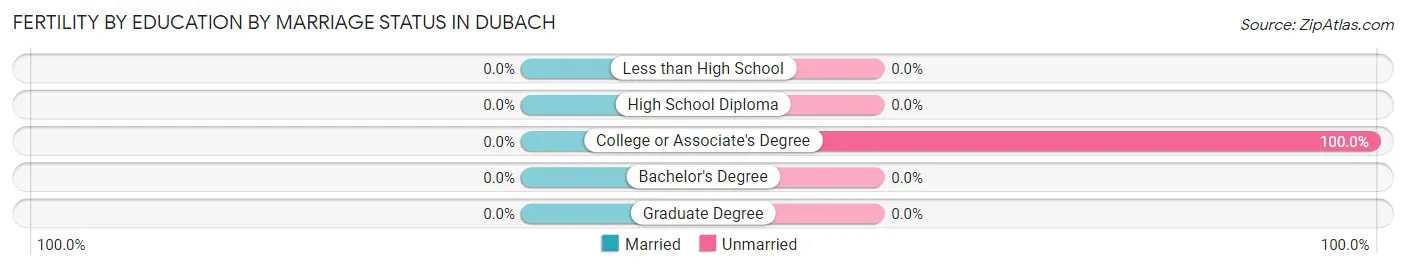
| Educational Attainment | Married | Unmarried |
| Less than High School | 0 (0.0%) | 0 (0.0%) |
| High School Diploma | 0 (0.0%) | 0 (0.0%) |
| College or Associate's Degree | 0 (0.0%) | 15 (100.0%) |
| Bachelor's Degree | 0 (0.0%) | 0 (0.0%) |
| Graduate Degree | 0 (0.0%) | 0 (0.0%) |
| Total | 0 (0.0%) | 15 (100.0%) |
Income in Dubach
Income Overview in Dubach
Per Capita Income in Dubach is $22,041, while median incomes of families and households are $59,167 and $31,953 respectively.
| Characteristic | Number | Measure |
| Per Capita Income | 1,026 | $22,041 |
| Median Family Income | 226 | $59,167 |
| Mean Family Income | 226 | $69,762 |
| Median Household Income | 407 | $31,953 |
| Mean Household Income | 407 | $52,991 |
| Income Deficit | 226 | $0 |
| Wage / Income Gap (%) | 1,026 | 0.00% |
| Wage / Income Gap ($) | 1,026 | 100.00¢ per $1 |
| Gini / Inequality Index | 1,026 | 0.48 |
Earnings by Sex in Dubach
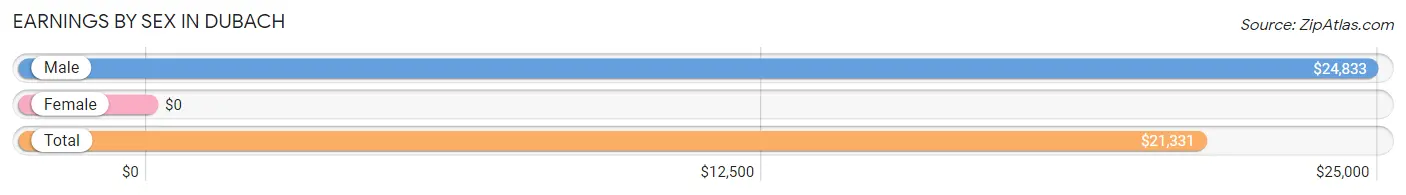
| Sex | Number | Average Earnings |
| Male | 296 (52.6%) | $24,833 |
| Female | 267 (47.4%) | $0 |
| Total | 563 (100.0%) | $21,331 |
Earnings by Sex by Income Bracket in Dubach
The most common earnings brackets in Dubach are $12,500 to $14,999 for men (42 | 14.2%) and $2,499 or less for women (76 | 28.5%).
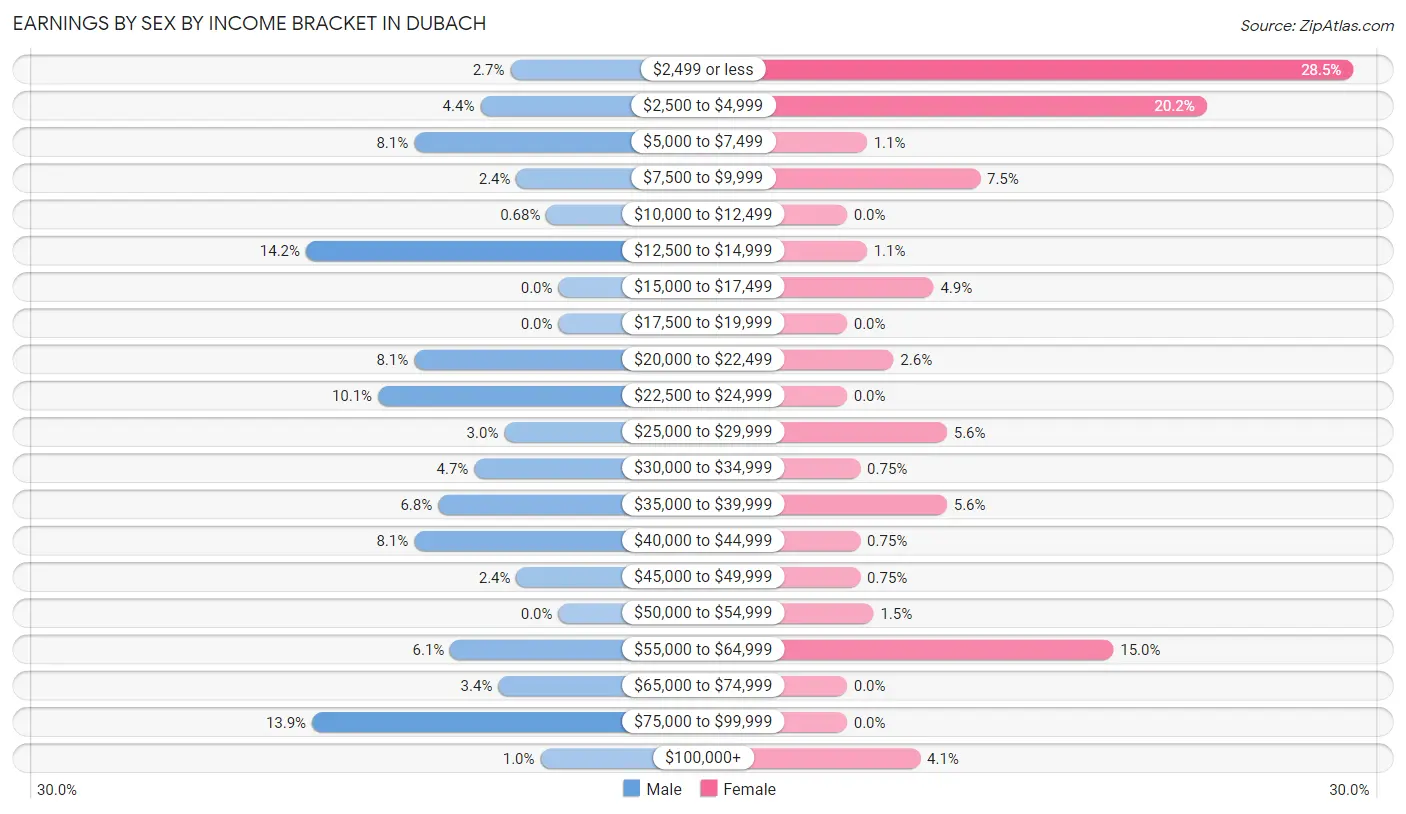
| Income | Male | Female |
| $2,499 or less | 8 (2.7%) | 76 (28.5%) |
| $2,500 to $4,999 | 13 (4.4%) | 54 (20.2%) |
| $5,000 to $7,499 | 24 (8.1%) | 3 (1.1%) |
| $7,500 to $9,999 | 7 (2.4%) | 20 (7.5%) |
| $10,000 to $12,499 | 2 (0.7%) | 0 (0.0%) |
| $12,500 to $14,999 | 42 (14.2%) | 3 (1.1%) |
| $15,000 to $17,499 | 0 (0.0%) | 13 (4.9%) |
| $17,500 to $19,999 | 0 (0.0%) | 0 (0.0%) |
| $20,000 to $22,499 | 24 (8.1%) | 7 (2.6%) |
| $22,500 to $24,999 | 30 (10.1%) | 0 (0.0%) |
| $25,000 to $29,999 | 9 (3.0%) | 15 (5.6%) |
| $30,000 to $34,999 | 14 (4.7%) | 2 (0.7%) |
| $35,000 to $39,999 | 20 (6.8%) | 15 (5.6%) |
| $40,000 to $44,999 | 24 (8.1%) | 2 (0.7%) |
| $45,000 to $49,999 | 7 (2.4%) | 2 (0.7%) |
| $50,000 to $54,999 | 0 (0.0%) | 4 (1.5%) |
| $55,000 to $64,999 | 18 (6.1%) | 40 (15.0%) |
| $65,000 to $74,999 | 10 (3.4%) | 0 (0.0%) |
| $75,000 to $99,999 | 41 (13.9%) | 0 (0.0%) |
| $100,000+ | 3 (1.0%) | 11 (4.1%) |
| Total | 296 (100.0%) | 267 (100.0%) |
Earnings by Sex by Educational Attainment in Dubach
Average earnings in Dubach are $33,594 for men and $36,250 for women, a difference of 7.3%. Men with an educational attainment of bachelor's degree enjoy the highest average annual earnings of $70,833, while those with less than high school education earn the least with $7,679. Women with an educational attainment of bachelor's degree earn the most with the average annual earnings of $62,938, while those with less than high school education have the smallest earnings of $8,750.
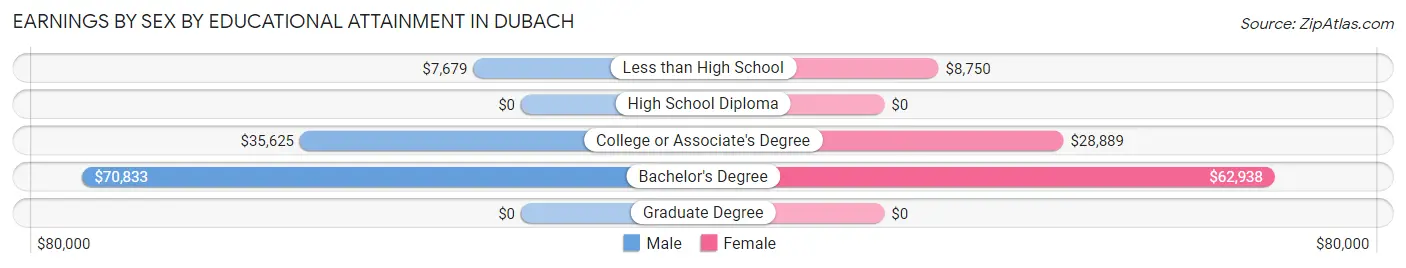
| Educational Attainment | Male Income | Female Income |
| Less than High School | $7,679 | $8,750 |
| High School Diploma | - | - |
| College or Associate's Degree | $35,625 | $28,889 |
| Bachelor's Degree | $70,833 | $62,938 |
| Graduate Degree | - | - |
| Total | $33,594 | $36,250 |
Family Income in Dubach
Family Income Brackets in Dubach
According to the Dubach family income data, there are 41 families falling into the $50,000 to $74,999 income range, which is the most common income bracket and makes up 18.1% of all families. Conversely, the $10,000 to $14,999 income bracket is the least frequent group with only 2 families (0.9%) belonging to this category.
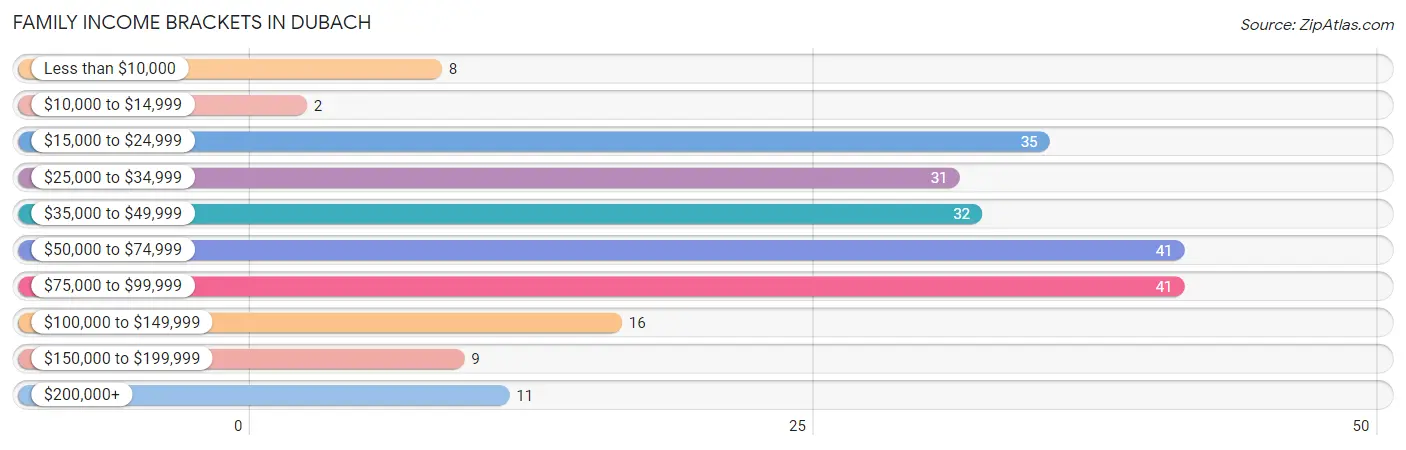
| Income Bracket | # Families | % Families |
| Less than $10,000 | 8 | 3.5% |
| $10,000 to $14,999 | 2 | 0.9% |
| $15,000 to $24,999 | 35 | 15.5% |
| $25,000 to $34,999 | 31 | 13.7% |
| $35,000 to $49,999 | 32 | 14.2% |
| $50,000 to $74,999 | 41 | 18.1% |
| $75,000 to $99,999 | 41 | 18.1% |
| $100,000 to $149,999 | 16 | 7.1% |
| $150,000 to $199,999 | 9 | 4.0% |
| $200,000+ | 11 | 4.9% |
Family Income by Famaliy Size in Dubach
4-person families (47 | 20.8%) account for the highest median family income in Dubach with $98,594 per family, while 4-person families (47 | 20.8%) have the highest median income of $24,648 per family member.
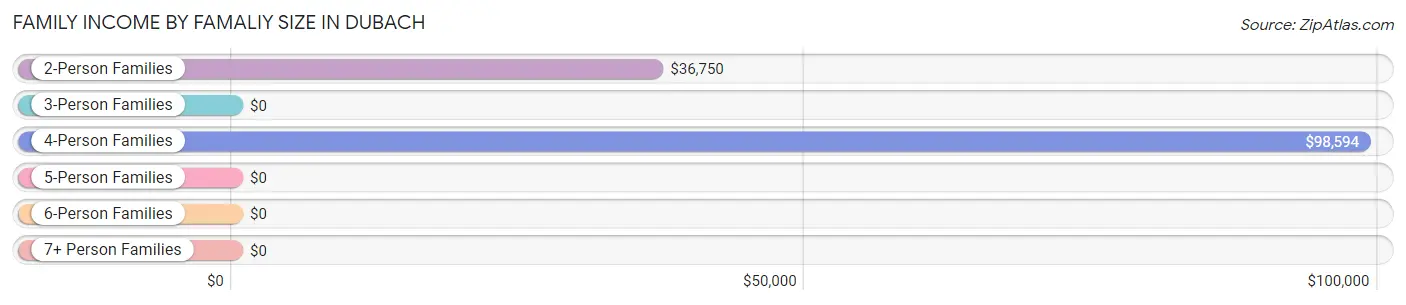
| Income Bracket | # Families | Median Income |
| 2-Person Families | 114 (50.4%) | $36,750 |
| 3-Person Families | 51 (22.6%) | $0 |
| 4-Person Families | 47 (20.8%) | $98,594 |
| 5-Person Families | 7 (3.1%) | $0 |
| 6-Person Families | 7 (3.1%) | $0 |
| 7+ Person Families | 0 (0.0%) | $0 |
| Total | 226 (100.0%) | $59,167 |
Family Income by Number of Earners in Dubach
The median family income in Dubach is $59,167, with families comprising 3+ earners (16) having the highest median family income of $160,417, while families with no earners (30) have the lowest median family income of $30,192, accounting for 7.1% and 13.3% of families, respectively.
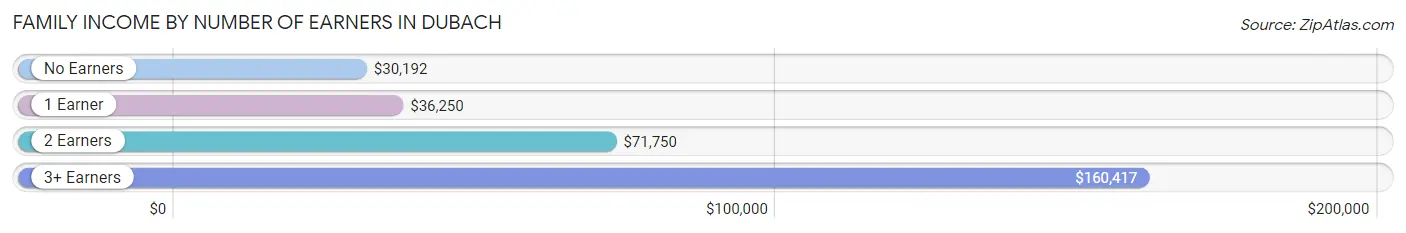
| Number of Earners | # Families | Median Income |
| No Earners | 30 (13.3%) | $30,192 |
| 1 Earner | 104 (46.0%) | $36,250 |
| 2 Earners | 76 (33.6%) | $71,750 |
| 3+ Earners | 16 (7.1%) | $160,417 |
| Total | 226 (100.0%) | $59,167 |
Household Income in Dubach
Household Income Brackets in Dubach
With 102 households falling in the category, the $15,000 to $24,999 income range is the most frequent in Dubach, accounting for 25.1% of all households. In contrast, only 9 households (2.2%) fall into the $150,000 to $199,999 income bracket, making it the least populous group.
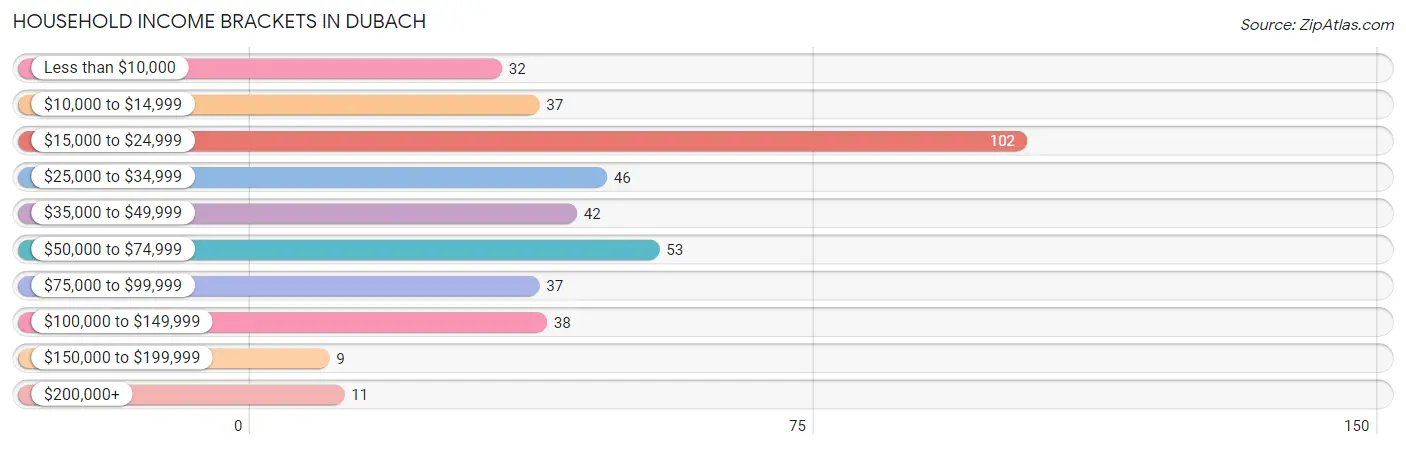
| Income Bracket | # Households | % Households |
| Less than $10,000 | 32 | 7.9% |
| $10,000 to $14,999 | 37 | 9.1% |
| $15,000 to $24,999 | 102 | 25.1% |
| $25,000 to $34,999 | 46 | 11.3% |
| $35,000 to $49,999 | 42 | 10.3% |
| $50,000 to $74,999 | 53 | 13.0% |
| $75,000 to $99,999 | 37 | 9.1% |
| $100,000 to $149,999 | 38 | 9.3% |
| $150,000 to $199,999 | 9 | 2.2% |
| $200,000+ | 11 | 2.7% |
Household Income by Householder Age in Dubach
The median household income in Dubach is $31,953, with the highest median household income of $58,295 found in the 25 to 44 years age bracket for the primary householder. A total of 69 households (17.0%) fall into this category. Meanwhile, the 15 to 24 years age bracket for the primary householder has the lowest median household income of $0, with 58 households (14.2%) in this group.
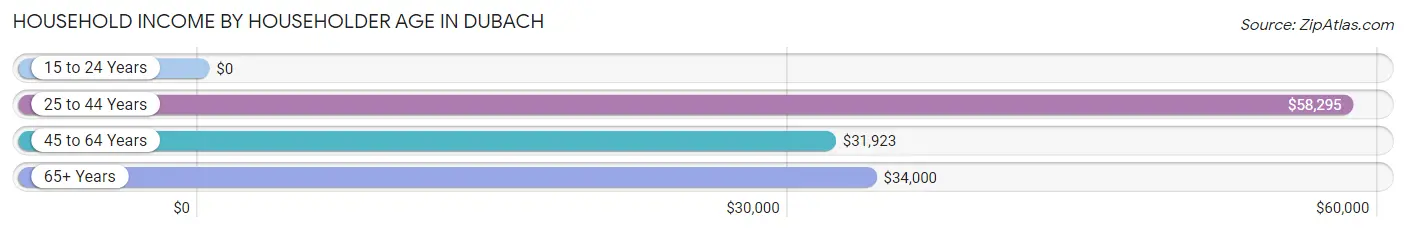
| Income Bracket | # Households | Median Income |
| 15 to 24 Years | 58 (14.2%) | $0 |
| 25 to 44 Years | 69 (17.0%) | $58,295 |
| 45 to 64 Years | 168 (41.3%) | $31,923 |
| 65+ Years | 112 (27.5%) | $34,000 |
| Total | 407 (100.0%) | $31,953 |
Poverty in Dubach
Income Below Poverty by Sex and Age in Dubach
With 27.7% poverty level for males and 43.0% for females among the residents of Dubach, 5 year old males and 15 year old females are the most vulnerable to poverty, with 6 males (85.7%) and 4 females (100.0%) in their respective age groups living below the poverty level.
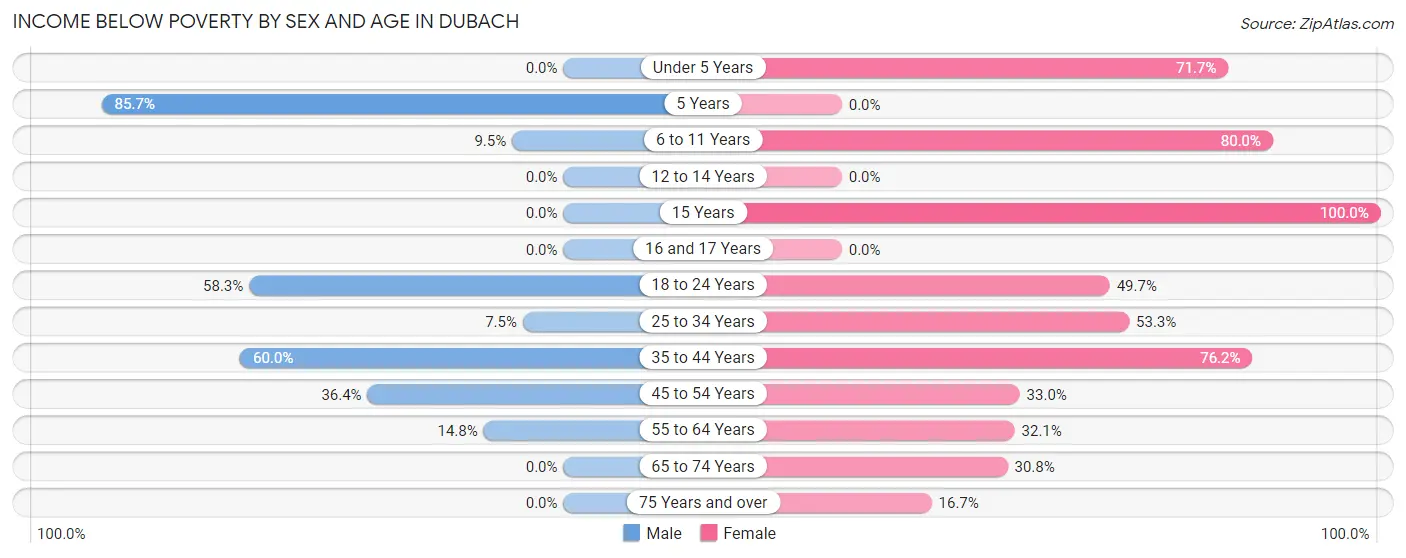
| Age Bracket | Male | Female |
| Under 5 Years | 0 (0.0%) | 33 (71.7%) |
| 5 Years | 6 (85.7%) | 0 (0.0%) |
| 6 to 11 Years | 6 (9.5%) | 12 (80.0%) |
| 12 to 14 Years | 0 (0.0%) | 0 (0.0%) |
| 15 Years | 0 (0.0%) | 4 (100.0%) |
| 16 and 17 Years | 0 (0.0%) | 0 (0.0%) |
| 18 to 24 Years | 49 (58.3%) | 93 (49.7%) |
| 25 to 34 Years | 7 (7.5%) | 8 (53.3%) |
| 35 to 44 Years | 27 (60.0%) | 16 (76.2%) |
| 45 to 54 Years | 28 (36.4%) | 34 (33.0%) |
| 55 to 64 Years | 4 (14.8%) | 17 (32.1%) |
| 65 to 74 Years | 0 (0.0%) | 16 (30.8%) |
| 75 Years and over | 0 (0.0%) | 11 (16.7%) |
| Total | 127 (27.7%) | 244 (43.0%) |
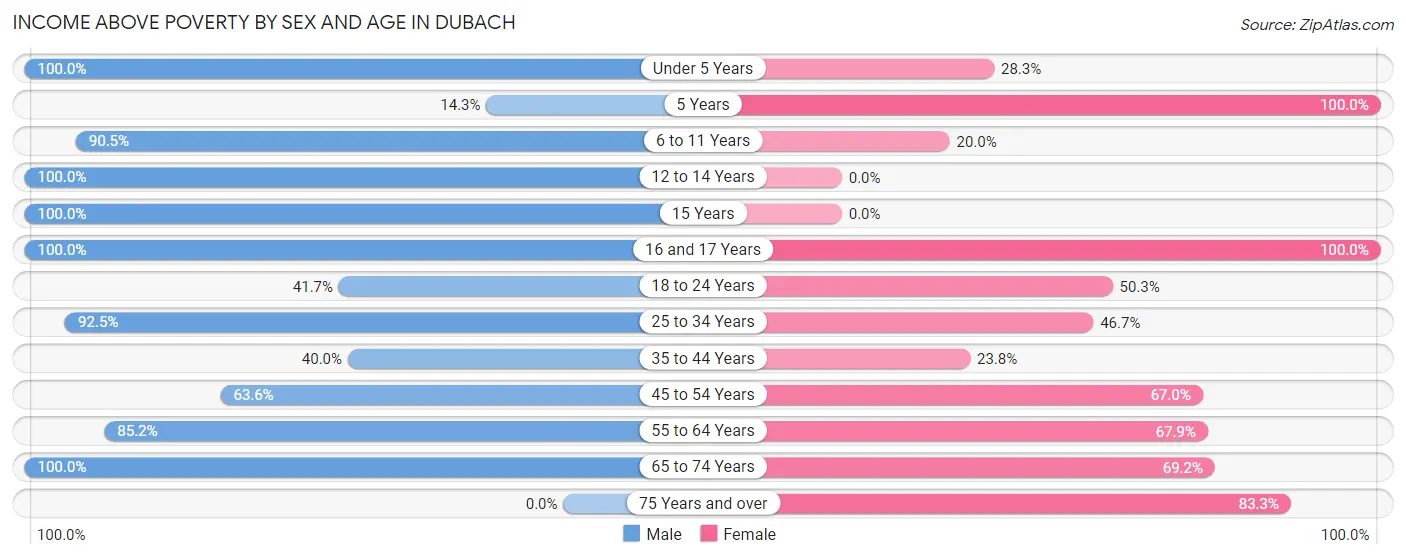
Income Above Poverty by Sex and Age in Dubach
According to the poverty statistics in Dubach, males aged under 5 years and females aged 5 years are the age groups that are most secure financially, with 100.0% of males and 100.0% of females in these age groups living above the poverty line.
| Age Bracket | Male | Female |
| Under 5 Years | 9 (100.0%) | 13 (28.3%) |
| 5 Years | 1 (14.3%) | 2 (100.0%) |
| 6 to 11 Years | 57 (90.5%) | 3 (20.0%) |
| 12 to 14 Years | 13 (100.0%) | 0 (0.0%) |
| 15 Years | 2 (100.0%) | 0 (0.0%) |
| 16 and 17 Years | 10 (100.0%) | 4 (100.0%) |
| 18 to 24 Years | 35 (41.7%) | 94 (50.3%) |
| 25 to 34 Years | 86 (92.5%) | 7 (46.7%) |
| 35 to 44 Years | 18 (40.0%) | 5 (23.8%) |
| 45 to 54 Years | 49 (63.6%) | 69 (67.0%) |
| 55 to 64 Years | 23 (85.2%) | 36 (67.9%) |
| 65 to 74 Years | 28 (100.0%) | 36 (69.2%) |
| 75 Years and over | 0 (0.0%) | 55 (83.3%) |
| Total | 331 (72.3%) | 324 (57.0%) |
Income Below Poverty Among Married-Couple Families in Dubach
The poverty statistics for married-couple families in Dubach show that 10.7% or 11 of the total 103 families live below the poverty line. Families with 1 or 2 children have the highest poverty rate of 37.9%, comprising of 11 families. On the other hand, families with no children have the lowest poverty rate of 0.0%, which includes 0 families.
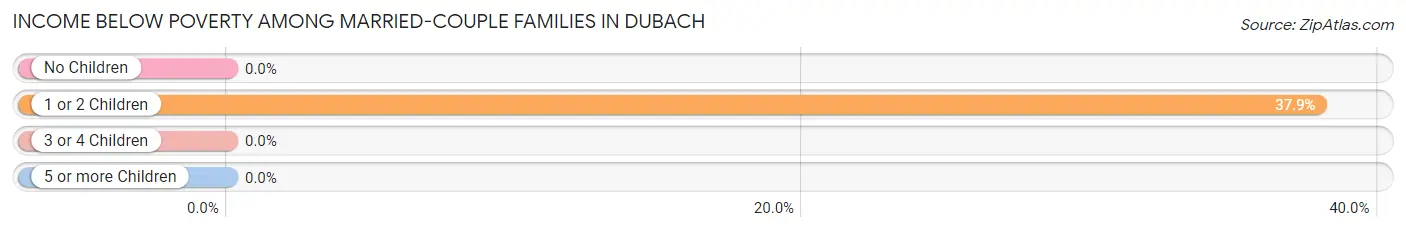
| Children | Above Poverty | Below Poverty |
| No Children | 71 (100.0%) | 0 (0.0%) |
| 1 or 2 Children | 18 (62.1%) | 11 (37.9%) |
| 3 or 4 Children | 3 (100.0%) | 0 (0.0%) |
| 5 or more Children | 0 (0.0%) | 0 (0.0%) |
| Total | 92 (89.3%) | 11 (10.7%) |
Income Below Poverty Among Single-Parent Households in Dubach
According to the poverty data in Dubach, 20.4% or 9 single-father households and 26.6% or 21 single-mother households are living below the poverty line. Among single-father households, those with no children have the highest poverty rate, with 4 households (36.4%) experiencing poverty. Likewise, among single-mother households, those with no children have the highest poverty rate, with 11 households (40.7%) falling below the poverty line.
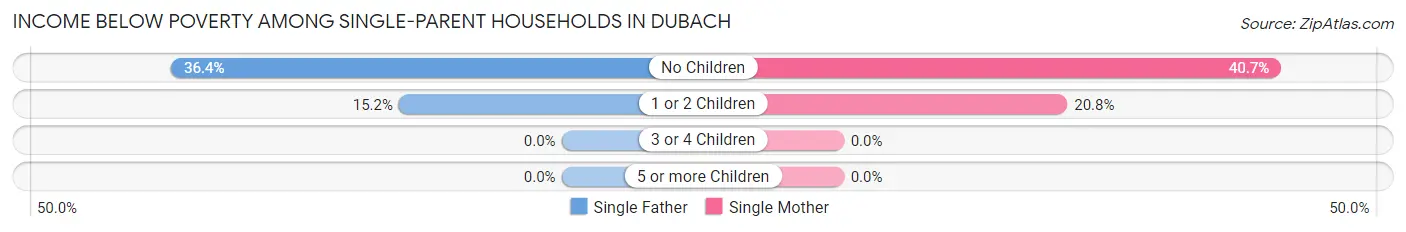
| Children | Single Father | Single Mother |
| No Children | 4 (36.4%) | 11 (40.7%) |
| 1 or 2 Children | 5 (15.1%) | 10 (20.8%) |
| 3 or 4 Children | 0 (0.0%) | 0 (0.0%) |
| 5 or more Children | 0 (0.0%) | 0 (0.0%) |
| Total | 9 (20.4%) | 21 (26.6%) |
Income Below Poverty Among Married-Couple vs Single-Parent Households in Dubach
The poverty data for Dubach shows that 11 of the married-couple family households (10.7%) and 30 of the single-parent households (24.4%) are living below the poverty level. Within the married-couple family households, those with 1 or 2 children have the highest poverty rate, with 11 households (37.9%) falling below the poverty line. Among the single-parent households, those with no children have the highest poverty rate, with 15 household (39.5%) living below poverty.
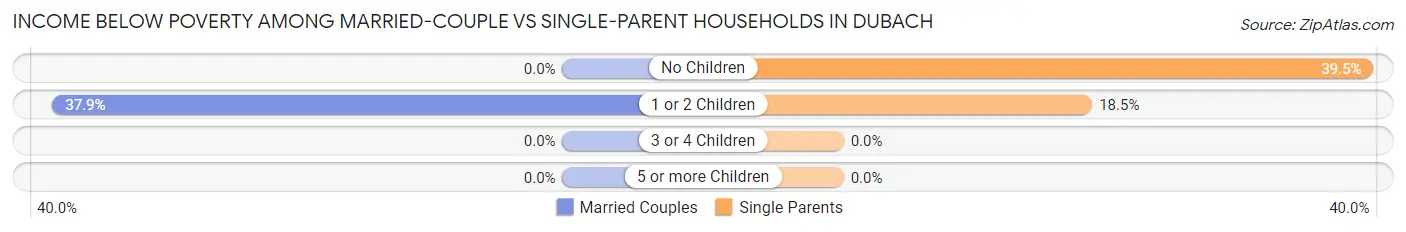
| Children | Married-Couple Families | Single-Parent Households |
| No Children | 0 (0.0%) | 15 (39.5%) |
| 1 or 2 Children | 11 (37.9%) | 15 (18.5%) |
| 3 or 4 Children | 0 (0.0%) | 0 (0.0%) |
| 5 or more Children | 0 (0.0%) | 0 (0.0%) |
| Total | 11 (10.7%) | 30 (24.4%) |
Employment Characteristics in Dubach
Employment by Class of Employer in Dubach
Among the 463 employed individuals in Dubach, private company employees (323 | 69.8%), state government employees (65 | 14.0%), and local government employees (35 | 7.6%) make up the most common classes of employment.
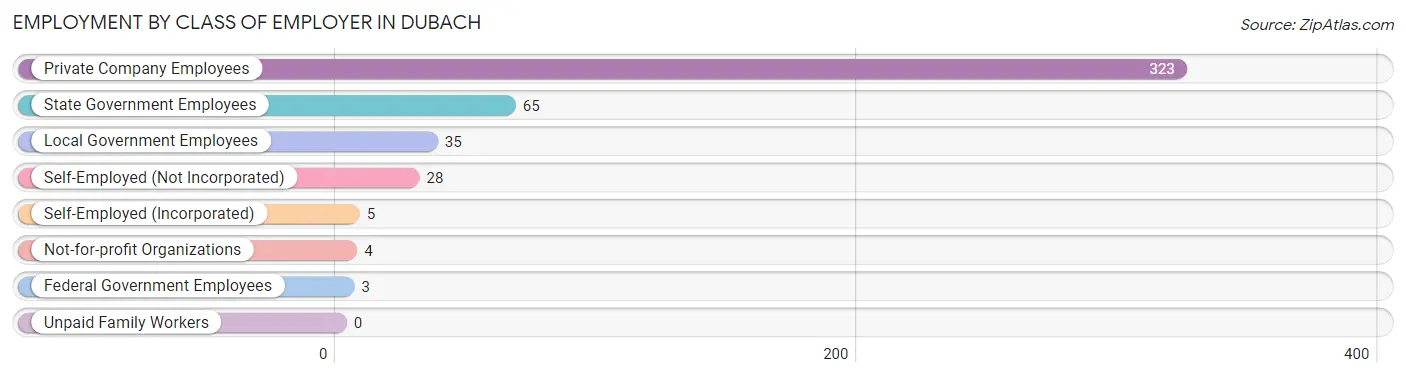
| Employer Class | # Employees | % Employees |
| Private Company Employees | 323 | 69.8% |
| Self-Employed (Incorporated) | 5 | 1.1% |
| Self-Employed (Not Incorporated) | 28 | 6.0% |
| Not-for-profit Organizations | 4 | 0.9% |
| Local Government Employees | 35 | 7.6% |
| State Government Employees | 65 | 14.0% |
| Federal Government Employees | 3 | 0.6% |
| Unpaid Family Workers | 0 | 0.0% |
| Total | 463 | 100.0% |
Employment Status by Age in Dubach
According to the labor force statistics for Dubach, out of the total population over 16 years of age (865), 56.2% or 486 individuals are in the labor force, with 2.9% or 14 of them unemployed. The age group with the highest labor force participation rate is 25 to 29 years, with 100.0% or 52 individuals in the labor force. Within the labor force, the 30 to 34 years age range has the highest percentage of unemployed individuals, with 22.9% or 11 of them being unemployed.
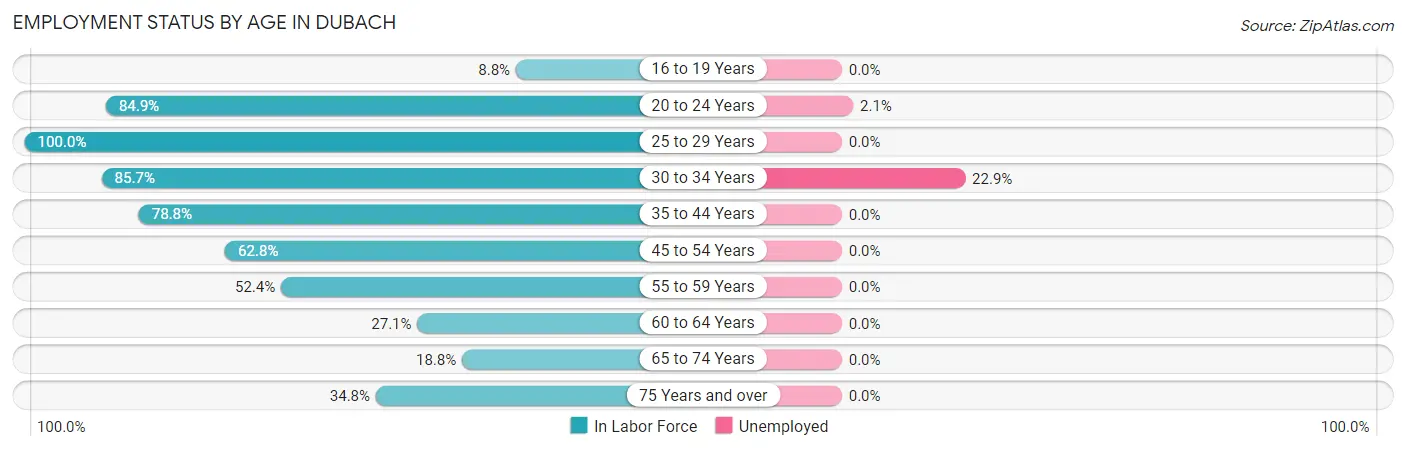
| Age Bracket | In Labor Force | Unemployed |
| 16 to 19 Years | 10 (8.8%) | 0 (0.0%) |
| 20 to 24 Years | 146 (84.9%) | 3 (2.1%) |
| 25 to 29 Years | 52 (100.0%) | 0 (0.0%) |
| 30 to 34 Years | 48 (85.7%) | 11 (22.9%) |
| 35 to 44 Years | 52 (78.8%) | 0 (0.0%) |
| 45 to 54 Years | 113 (62.8%) | 0 (0.0%) |
| 55 to 59 Years | 11 (52.4%) | 0 (0.0%) |
| 60 to 64 Years | 16 (27.1%) | 0 (0.0%) |
| 65 to 74 Years | 15 (18.8%) | 0 (0.0%) |
| 75 Years and over | 23 (34.8%) | 0 (0.0%) |
| Total | 486 (56.2%) | 14 (2.9%) |
Employment Status by Educational Attainment in Dubach
According to labor force statistics for Dubach, 67.3% of individuals (292) out of the total population between 25 and 64 years of age (434) are in the labor force, with 3.8% or 11 of them being unemployed. The group with the highest labor force participation rate are those with the educational attainment of bachelor's degree or higher, with 82.7% or 43 individuals in the labor force. Within the labor force, individuals with high school diploma education have the highest percentage of unemployment, with 8.4% or 11 of them being unemployed.
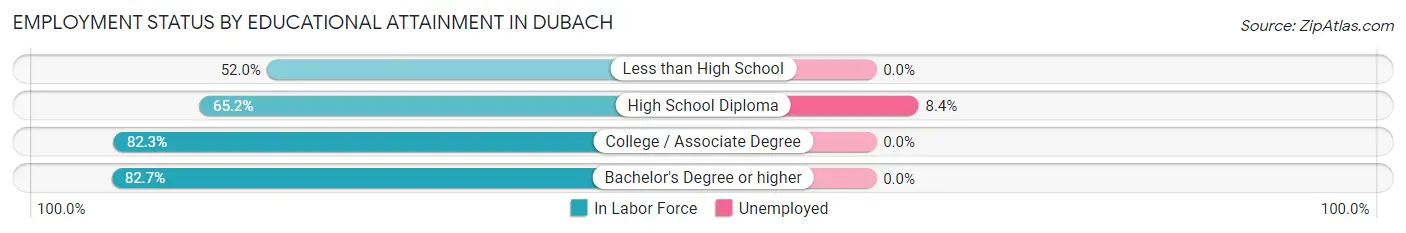
| Educational Attainment | In Labor Force | Unemployed |
| Less than High School | 53 (52.0%) | 0 (0.0%) |
| High School Diploma | 131 (65.2%) | 17 (8.4%) |
| College / Associate Degree | 65 (82.3%) | 0 (0.0%) |
| Bachelor's Degree or higher | 43 (82.7%) | 0 (0.0%) |
| Total | 292 (67.3%) | 16 (3.8%) |
Employment Occupations by Sex in Dubach
Management, Business, Science and Arts Occupations
The most common Management, Business, Science and Arts occupations in Dubach are Community & Social Service (55 | 11.7%), Education Instruction & Library (55 | 11.7%), Management (39 | 8.3%), Health Diagnosing & Treating (7 | 1.5%), and Computers, Engineering & Science (3 | 0.6%).
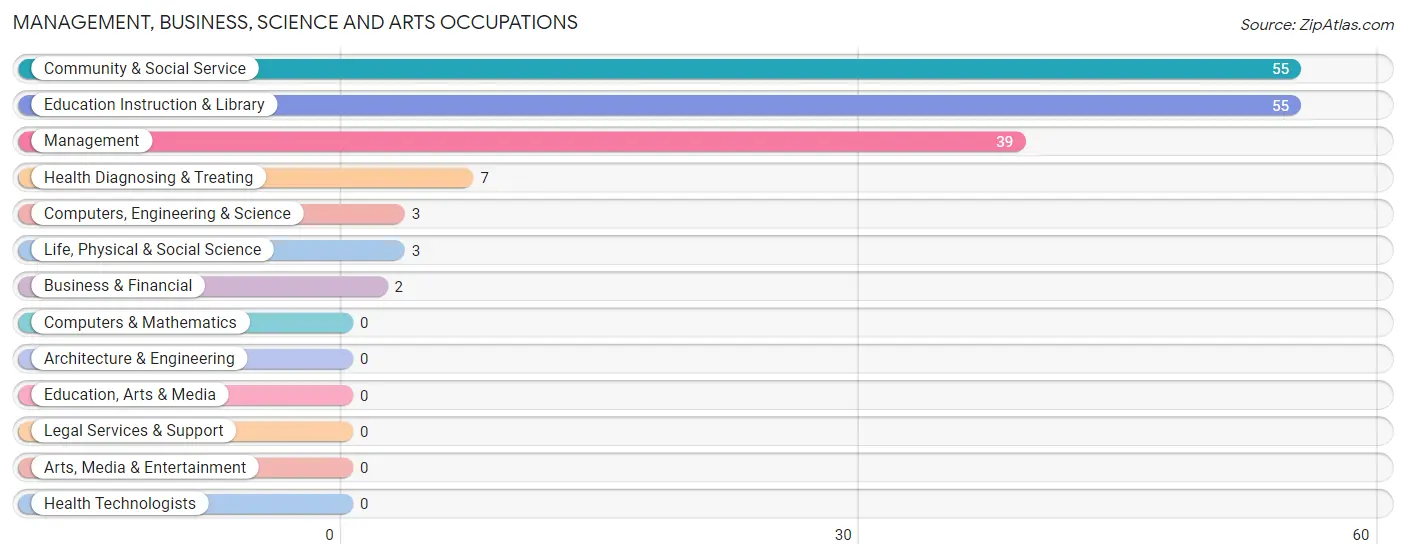
Management, Business, Science and Arts Occupations by Sex
Within the Management, Business, Science and Arts occupations in Dubach, the most male-oriented occupations are Business & Financial (100.0%), Computers, Engineering & Science (100.0%), and Life, Physical & Social Science (100.0%), while the most female-oriented occupations are Community & Social Service (100.0%), Education Instruction & Library (100.0%), and Health Diagnosing & Treating (100.0%).
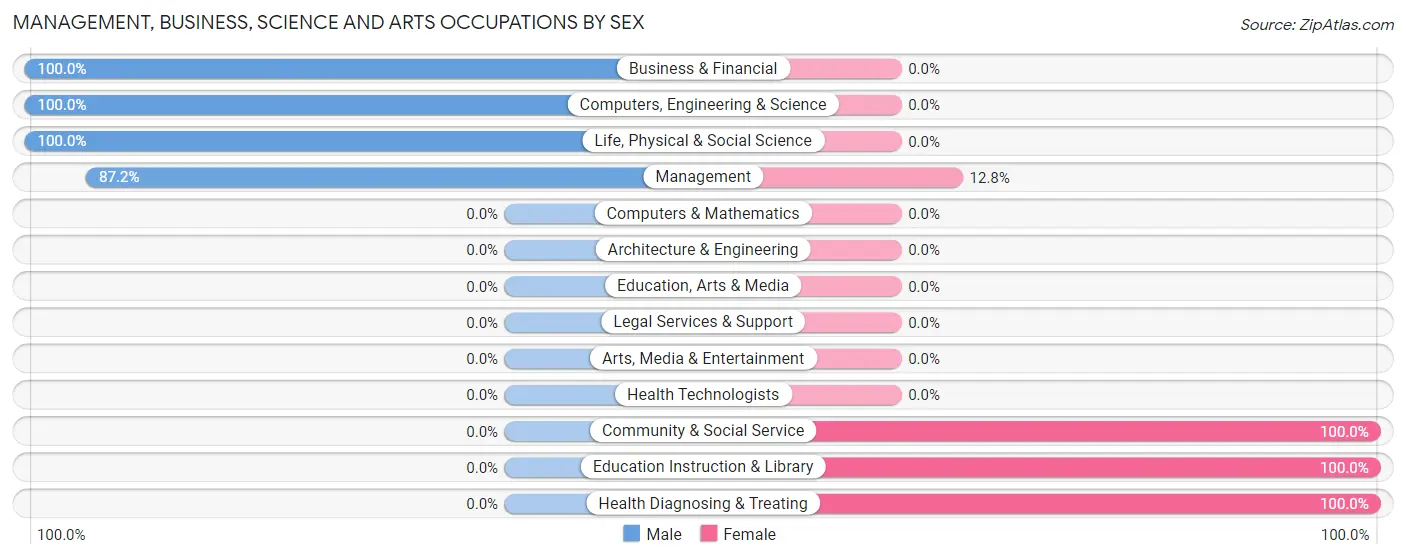
| Occupation | Male | Female |
| Management | 34 (87.2%) | 5 (12.8%) |
| Business & Financial | 2 (100.0%) | 0 (0.0%) |
| Computers, Engineering & Science | 3 (100.0%) | 0 (0.0%) |
| Computers & Mathematics | 0 (0.0%) | 0 (0.0%) |
| Architecture & Engineering | 0 (0.0%) | 0 (0.0%) |
| Life, Physical & Social Science | 3 (100.0%) | 0 (0.0%) |
| Community & Social Service | 0 (0.0%) | 55 (100.0%) |
| Education, Arts & Media | 0 (0.0%) | 0 (0.0%) |
| Legal Services & Support | 0 (0.0%) | 0 (0.0%) |
| Education Instruction & Library | 0 (0.0%) | 55 (100.0%) |
| Arts, Media & Entertainment | 0 (0.0%) | 0 (0.0%) |
| Health Diagnosing & Treating | 0 (0.0%) | 7 (100.0%) |
| Health Technologists | 0 (0.0%) | 0 (0.0%) |
| Total (Category) | 39 (36.8%) | 67 (63.2%) |
| Total (Overall) | 275 (58.3%) | 197 (41.7%) |
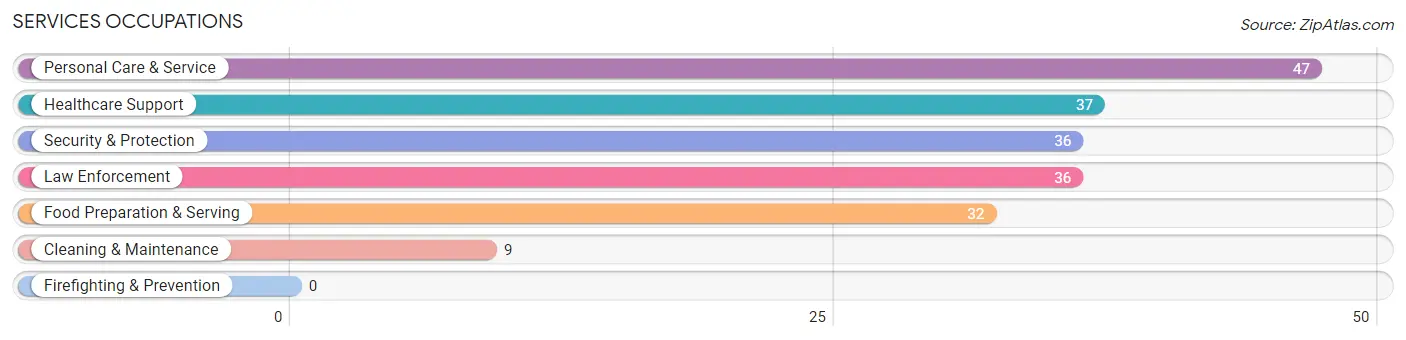
Services Occupations
The most common Services occupations in Dubach are Personal Care & Service (47 | 10.0%), Healthcare Support (37 | 7.8%), Security & Protection (36 | 7.6%), Law Enforcement (36 | 7.6%), and Food Preparation & Serving (32 | 6.8%).
Services Occupations by Sex
Within the Services occupations in Dubach, the most male-oriented occupations are Security & Protection (100.0%), Law Enforcement (100.0%), and Cleaning & Maintenance (100.0%), while the most female-oriented occupations are Personal Care & Service (100.0%), Healthcare Support (78.4%), and Food Preparation & Serving (34.4%).
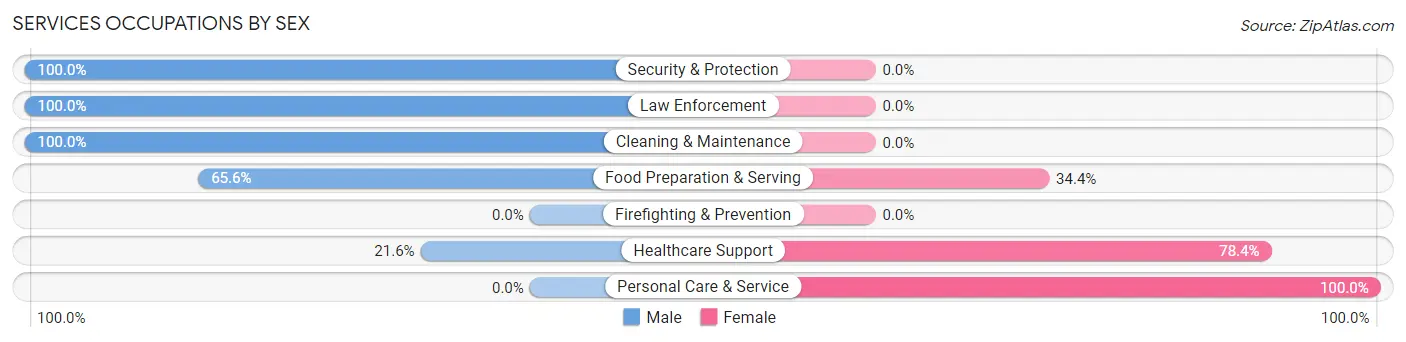
| Occupation | Male | Female |
| Healthcare Support | 8 (21.6%) | 29 (78.4%) |
| Security & Protection | 36 (100.0%) | 0 (0.0%) |
| Firefighting & Prevention | 0 (0.0%) | 0 (0.0%) |
| Law Enforcement | 36 (100.0%) | 0 (0.0%) |
| Food Preparation & Serving | 21 (65.6%) | 11 (34.4%) |
| Cleaning & Maintenance | 9 (100.0%) | 0 (0.0%) |
| Personal Care & Service | 0 (0.0%) | 47 (100.0%) |
| Total (Category) | 74 (46.0%) | 87 (54.0%) |
| Total (Overall) | 275 (58.3%) | 197 (41.7%) |
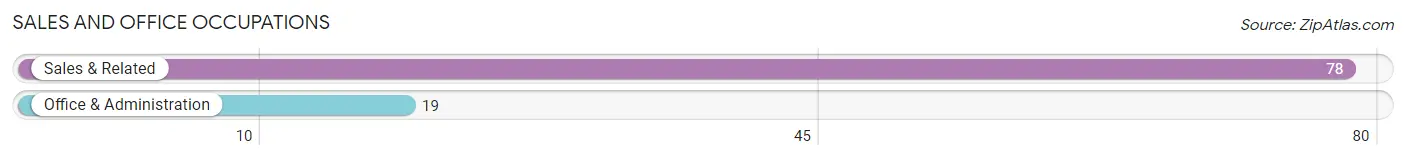
Sales and Office Occupations
The most common Sales and Office occupations in Dubach are Sales & Related (78 | 16.5%), and Office & Administration (19 | 4.0%).
Sales and Office Occupations by Sex
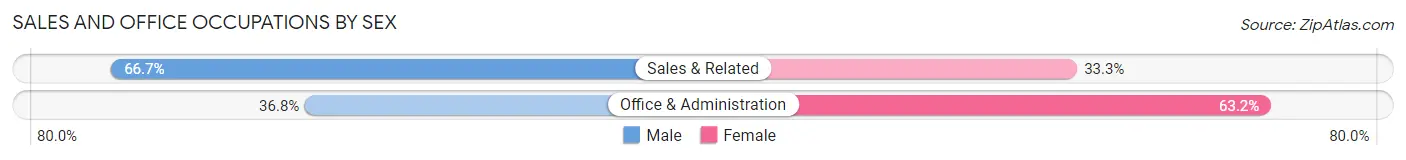
| Occupation | Male | Female |
| Sales & Related | 52 (66.7%) | 26 (33.3%) |
| Office & Administration | 7 (36.8%) | 12 (63.2%) |
| Total (Category) | 59 (60.8%) | 38 (39.2%) |
| Total (Overall) | 275 (58.3%) | 197 (41.7%) |
Natural Resources, Construction and Maintenance Occupations
The most common Natural Resources, Construction and Maintenance occupations in Dubach are Installation, Maintenance & Repair (34 | 7.2%), and Construction & Extraction (19 | 4.0%).

Natural Resources, Construction and Maintenance Occupations by Sex
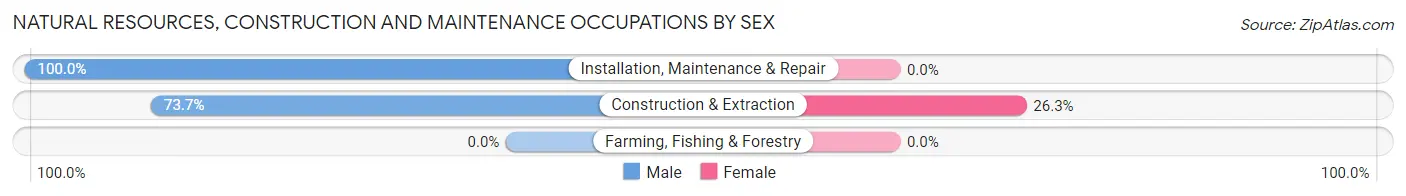
| Occupation | Male | Female |
| Farming, Fishing & Forestry | 0 (0.0%) | 0 (0.0%) |
| Construction & Extraction | 14 (73.7%) | 5 (26.3%) |
| Installation, Maintenance & Repair | 34 (100.0%) | 0 (0.0%) |
| Total (Category) | 48 (90.6%) | 5 (9.4%) |
| Total (Overall) | 275 (58.3%) | 197 (41.7%) |
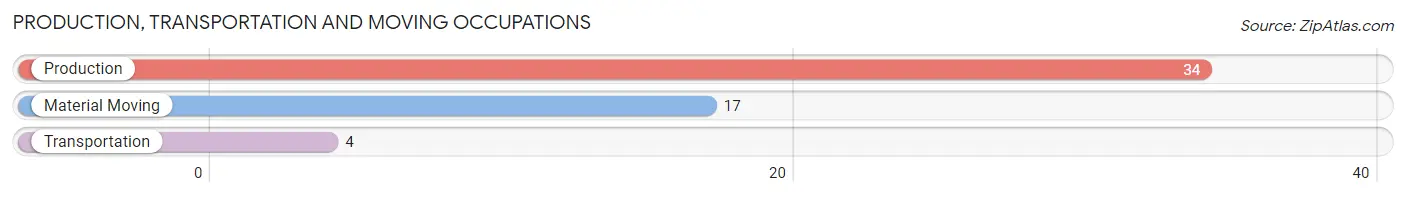
Production, Transportation and Moving Occupations
The most common Production, Transportation and Moving occupations in Dubach are Production (34 | 7.2%), Material Moving (17 | 3.6%), and Transportation (4 | 0.9%).
Production, Transportation and Moving Occupations by Sex
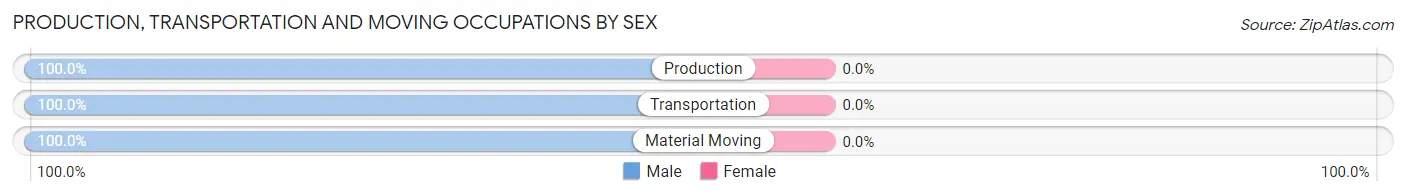
| Occupation | Male | Female |
| Production | 34 (100.0%) | 0 (0.0%) |
| Transportation | 4 (100.0%) | 0 (0.0%) |
| Material Moving | 17 (100.0%) | 0 (0.0%) |
| Total (Category) | 55 (100.0%) | 0 (0.0%) |
| Total (Overall) | 275 (58.3%) | 197 (41.7%) |
Employment Industries by Sex in Dubach
Employment Industries in Dubach
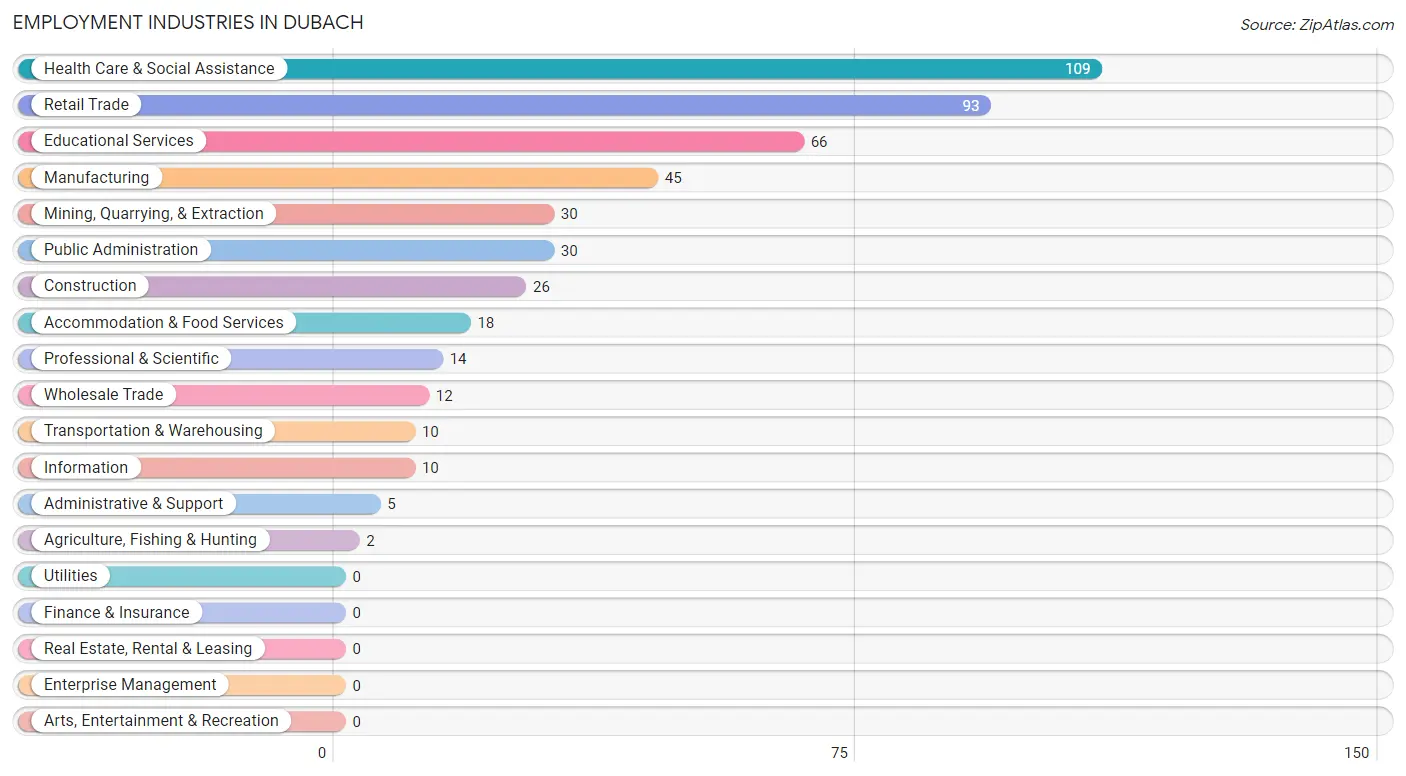
The major employment industries in Dubach include Health Care & Social Assistance (109 | 23.1%), Retail Trade (93 | 19.7%), Educational Services (66 | 14.0%), Manufacturing (45 | 9.5%), and Mining, Quarrying, & Extraction (30 | 6.4%).
Employment Industries by Sex in Dubach
The Dubach industries that see more men than women are Agriculture, Fishing & Hunting (100.0%), Mining, Quarrying, & Extraction (100.0%), and Manufacturing (100.0%), whereas the industries that tend to have a higher number of women are Educational Services (90.9%), Health Care & Social Assistance (89.0%), and Construction (61.5%).

| Industry | Male | Female |
| Agriculture, Fishing & Hunting | 2 (100.0%) | 0 (0.0%) |
| Mining, Quarrying, & Extraction | 30 (100.0%) | 0 (0.0%) |
| Construction | 10 (38.5%) | 16 (61.5%) |
| Manufacturing | 45 (100.0%) | 0 (0.0%) |
| Wholesale Trade | 9 (75.0%) | 3 (25.0%) |
| Retail Trade | 81 (87.1%) | 12 (12.9%) |
| Transportation & Warehousing | 10 (100.0%) | 0 (0.0%) |
| Utilities | 0 (0.0%) | 0 (0.0%) |
| Information | 10 (100.0%) | 0 (0.0%) |
| Finance & Insurance | 0 (0.0%) | 0 (0.0%) |
| Real Estate, Rental & Leasing | 0 (0.0%) | 0 (0.0%) |
| Professional & Scientific | 12 (85.7%) | 2 (14.3%) |
| Enterprise Management | 0 (0.0%) | 0 (0.0%) |
| Administrative & Support | 5 (100.0%) | 0 (0.0%) |
| Educational Services | 6 (9.1%) | 60 (90.9%) |
| Health Care & Social Assistance | 12 (11.0%) | 97 (89.0%) |
| Arts, Entertainment & Recreation | 0 (0.0%) | 0 (0.0%) |
| Accommodation & Food Services | 11 (61.1%) | 7 (38.9%) |
| Public Administration | 30 (100.0%) | 0 (0.0%) |
| Total | 275 (58.3%) | 197 (41.7%) |
Education in Dubach
School Enrollment in Dubach
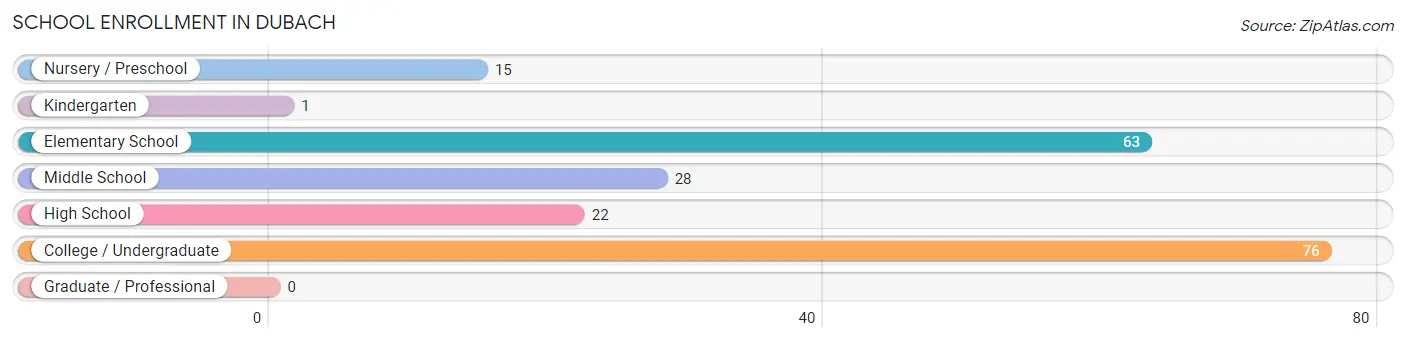
The most common levels of schooling among the 205 students in Dubach are college / undergraduate (76 | 37.1%), elementary school (63 | 30.7%), and middle school (28 | 13.7%).
| School Level | # Students | % Students |
| Nursery / Preschool | 15 | 7.3% |
| Kindergarten | 1 | 0.5% |
| Elementary School | 63 | 30.7% |
| Middle School | 28 | 13.7% |
| High School | 22 | 10.7% |
| College / Undergraduate | 76 | 37.1% |
| Graduate / Professional | 0 | 0.0% |
| Total | 205 | 100.0% |
School Enrollment by Age by Funding Source in Dubach
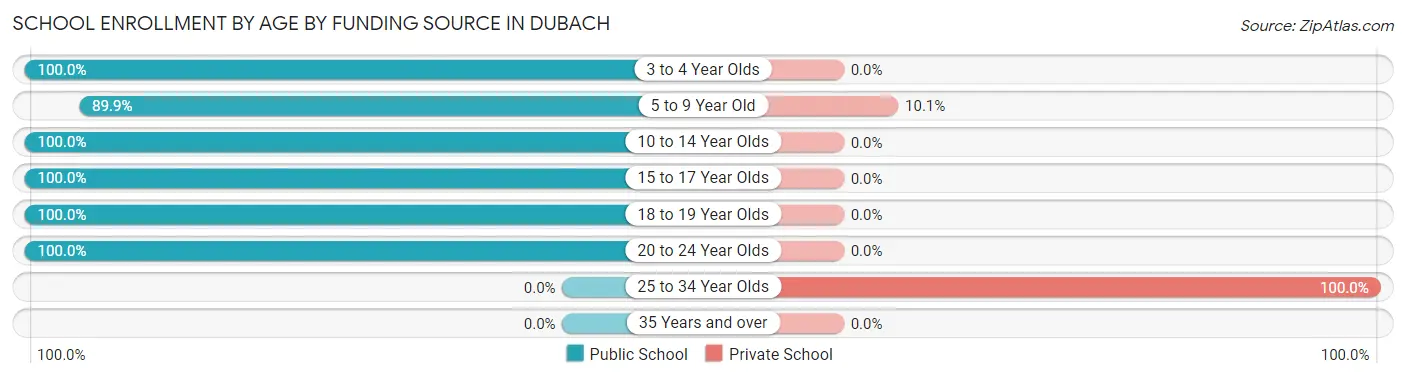
Out of a total of 205 students who are enrolled in schools in Dubach, 15 (7.3%) attend a private institution, while the remaining 190 (92.7%) are enrolled in public schools. The age group of 25 to 34 year olds has the highest likelihood of being enrolled in private schools, with 8 (100.0% in the age bracket) enrolled. Conversely, the age group of 3 to 4 year olds has the lowest likelihood of being enrolled in a private school, with 7 (100.0% in the age bracket) attending a public institution.
| Age Bracket | Public School | Private School |
| 3 to 4 Year Olds | 7 (100.0%) | 0 (0.0%) |
| 5 to 9 Year Old | 62 (89.9%) | 7 (10.1%) |
| 10 to 14 Year Olds | 31 (100.0%) | 0 (0.0%) |
| 15 to 17 Year Olds | 20 (100.0%) | 0 (0.0%) |
| 18 to 19 Year Olds | 33 (100.0%) | 0 (0.0%) |
| 20 to 24 Year Olds | 37 (100.0%) | 0 (0.0%) |
| 25 to 34 Year Olds | 0 (0.0%) | 8 (100.0%) |
| 35 Years and over | 0 (0.0%) | 0 (0.0%) |
| Total | 190 (92.7%) | 15 (7.3%) |
Educational Attainment by Field of Study in Dubach
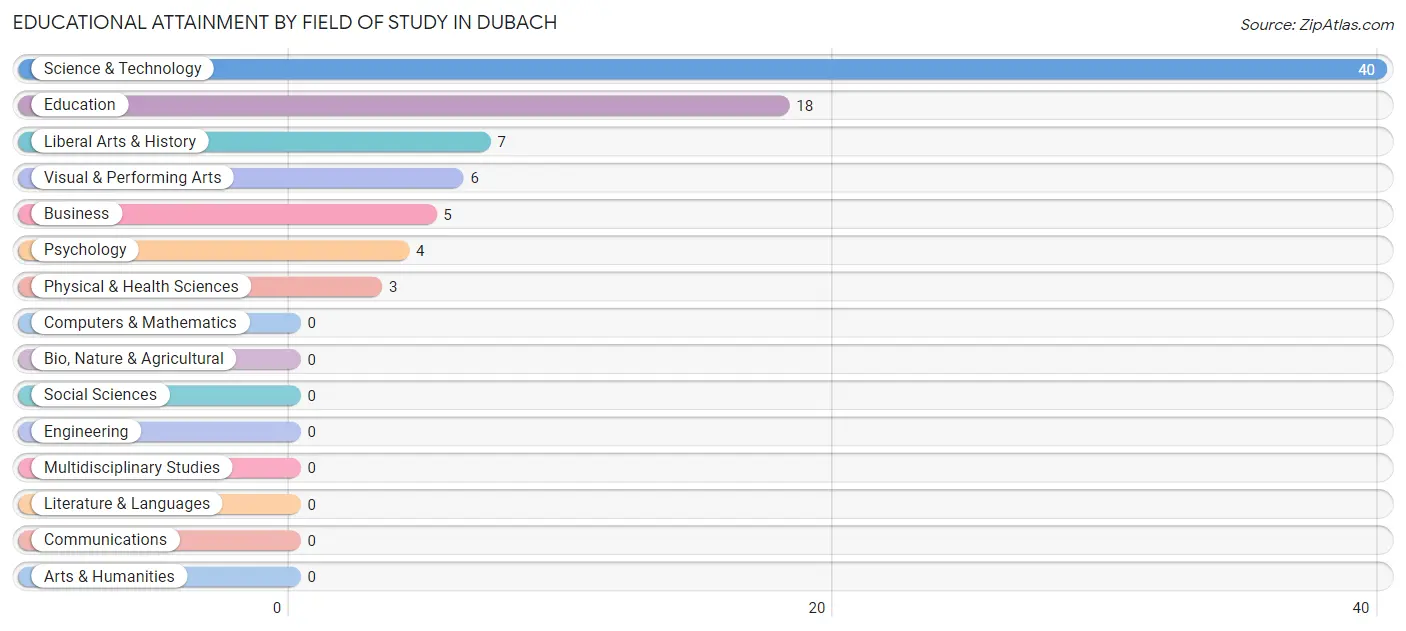
Science & technology (40 | 48.2%), education (18 | 21.7%), liberal arts & history (7 | 8.4%), visual & performing arts (6 | 7.2%), and business (5 | 6.0%) are the most common fields of study among 83 individuals in Dubach who have obtained a bachelor's degree or higher.
| Field of Study | # Graduates | % Graduates |
| Computers & Mathematics | 0 | 0.0% |
| Bio, Nature & Agricultural | 0 | 0.0% |
| Physical & Health Sciences | 3 | 3.6% |
| Psychology | 4 | 4.8% |
| Social Sciences | 0 | 0.0% |
| Engineering | 0 | 0.0% |
| Multidisciplinary Studies | 0 | 0.0% |
| Science & Technology | 40 | 48.2% |
| Business | 5 | 6.0% |
| Education | 18 | 21.7% |
| Literature & Languages | 0 | 0.0% |
| Liberal Arts & History | 7 | 8.4% |
| Visual & Performing Arts | 6 | 7.2% |
| Communications | 0 | 0.0% |
| Arts & Humanities | 0 | 0.0% |
| Total | 83 | 100.0% |
Transportation & Commute in Dubach
Vehicle Availability by Sex in Dubach
The most prevalent vehicle ownership categories in Dubach are males with 2 vehicles (71, accounting for 26.0%) and females with 2 vehicles (75, making up 37.4%).
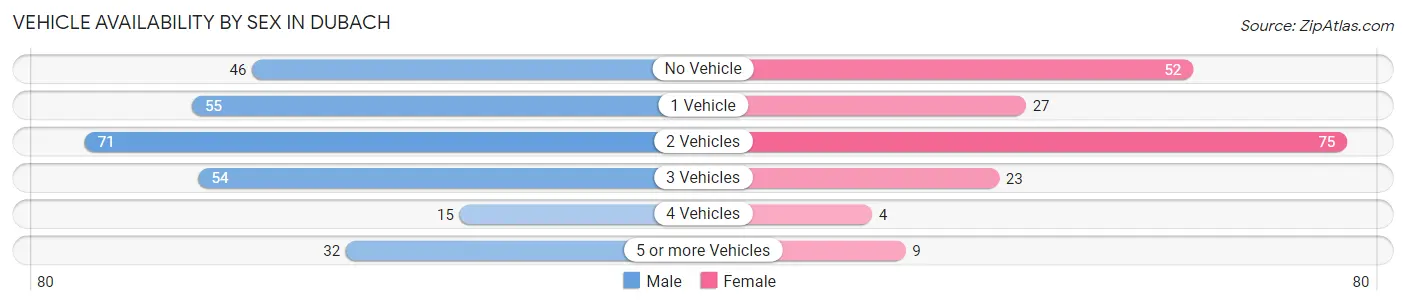
| Vehicles Available | Male | Female |
| No Vehicle | 46 (16.9%) | 52 (27.4%) |
| 1 Vehicle | 55 (20.2%) | 27 (14.2%) |
| 2 Vehicles | 71 (26.0%) | 75 (39.5%) |
| 3 Vehicles | 54 (19.8%) | 23 (12.1%) |
| 4 Vehicles | 15 (5.5%) | 4 (2.1%) |
| 5 or more Vehicles | 32 (11.7%) | 9 (4.7%) |
| Total | 273 (100.0%) | 190 (100.0%) |
Commute Time in Dubach
The most frequently occuring commute durations in Dubach are 15 to 19 minutes (116 commuters, 25.1%), 30 to 34 minutes (79 commuters, 17.1%), and 5 to 9 minutes (71 commuters, 15.3%).
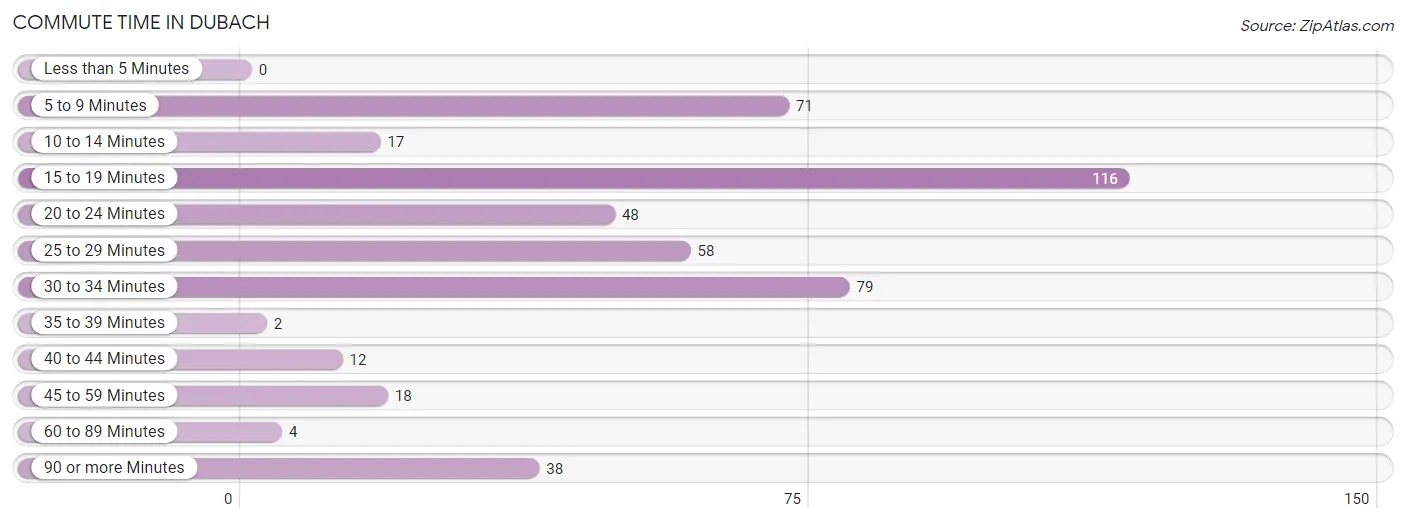
| Commute Time | # Commuters | % Commuters |
| Less than 5 Minutes | 0 | 0.0% |
| 5 to 9 Minutes | 71 | 15.3% |
| 10 to 14 Minutes | 17 | 3.7% |
| 15 to 19 Minutes | 116 | 25.1% |
| 20 to 24 Minutes | 48 | 10.4% |
| 25 to 29 Minutes | 58 | 12.5% |
| 30 to 34 Minutes | 79 | 17.1% |
| 35 to 39 Minutes | 2 | 0.4% |
| 40 to 44 Minutes | 12 | 2.6% |
| 45 to 59 Minutes | 18 | 3.9% |
| 60 to 89 Minutes | 4 | 0.9% |
| 90 or more Minutes | 38 | 8.2% |
Commute Time by Sex in Dubach
The most common commute times in Dubach are 15 to 19 minutes (73 commuters, 26.7%) for males and 30 to 34 minutes (54 commuters, 28.4%) for females.

| Commute Time | Male | Female |
| Less than 5 Minutes | 0 (0.0%) | 0 (0.0%) |
| 5 to 9 Minutes | 71 (26.0%) | 0 (0.0%) |
| 10 to 14 Minutes | 8 (2.9%) | 9 (4.7%) |
| 15 to 19 Minutes | 73 (26.7%) | 43 (22.6%) |
| 20 to 24 Minutes | 19 (7.0%) | 29 (15.3%) |
| 25 to 29 Minutes | 25 (9.2%) | 33 (17.4%) |
| 30 to 34 Minutes | 25 (9.2%) | 54 (28.4%) |
| 35 to 39 Minutes | 0 (0.0%) | 2 (1.1%) |
| 40 to 44 Minutes | 7 (2.6%) | 5 (2.6%) |
| 45 to 59 Minutes | 6 (2.2%) | 12 (6.3%) |
| 60 to 89 Minutes | 4 (1.5%) | 0 (0.0%) |
| 90 or more Minutes | 35 (12.8%) | 3 (1.6%) |
Time of Departure to Work by Sex in Dubach
The most frequent times of departure to work in Dubach are 6:00 AM to 6:29 AM (70, 25.6%) for males and 12:00 PM to 3:59 PM (62, 32.6%) for females.
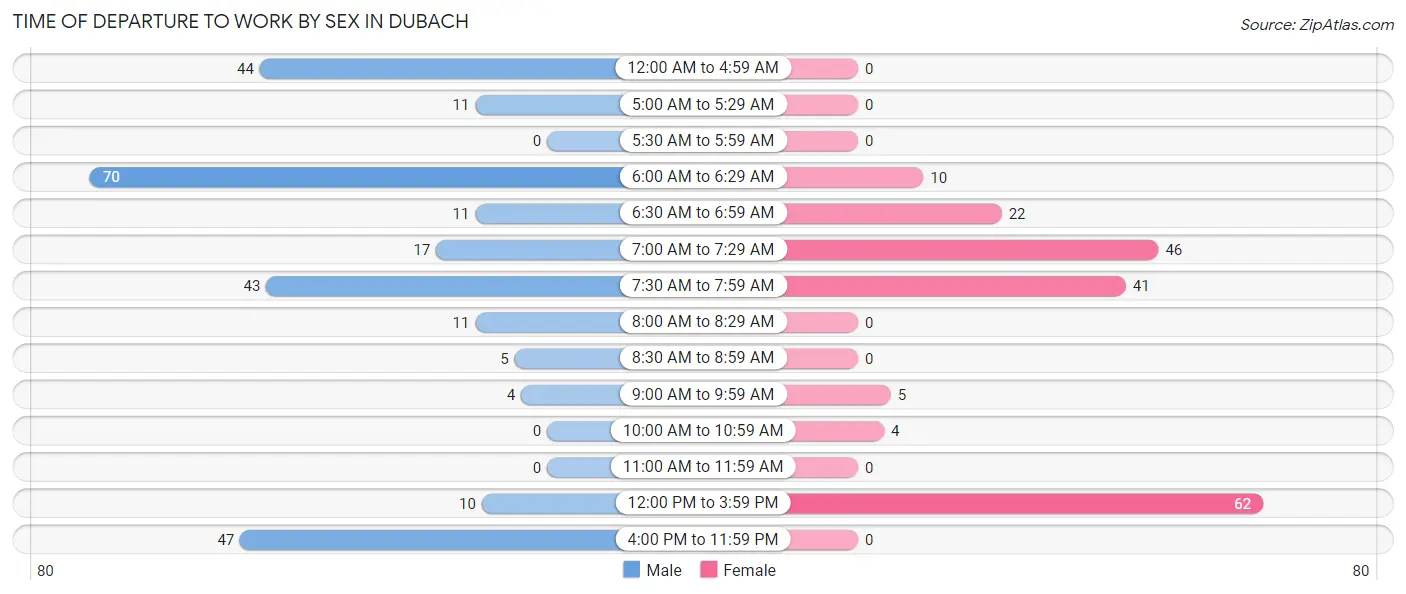
| Time of Departure | Male | Female |
| 12:00 AM to 4:59 AM | 44 (16.1%) | 0 (0.0%) |
| 5:00 AM to 5:29 AM | 11 (4.0%) | 0 (0.0%) |
| 5:30 AM to 5:59 AM | 0 (0.0%) | 0 (0.0%) |
| 6:00 AM to 6:29 AM | 70 (25.6%) | 10 (5.3%) |
| 6:30 AM to 6:59 AM | 11 (4.0%) | 22 (11.6%) |
| 7:00 AM to 7:29 AM | 17 (6.2%) | 46 (24.2%) |
| 7:30 AM to 7:59 AM | 43 (15.8%) | 41 (21.6%) |
| 8:00 AM to 8:29 AM | 11 (4.0%) | 0 (0.0%) |
| 8:30 AM to 8:59 AM | 5 (1.8%) | 0 (0.0%) |
| 9:00 AM to 9:59 AM | 4 (1.5%) | 5 (2.6%) |
| 10:00 AM to 10:59 AM | 0 (0.0%) | 4 (2.1%) |
| 11:00 AM to 11:59 AM | 0 (0.0%) | 0 (0.0%) |
| 12:00 PM to 3:59 PM | 10 (3.7%) | 62 (32.6%) |
| 4:00 PM to 11:59 PM | 47 (17.2%) | 0 (0.0%) |
| Total | 273 (100.0%) | 190 (100.0%) |
Housing Occupancy in Dubach
Occupancy by Ownership in Dubach
Of the total 407 dwellings in Dubach, owner-occupied units account for 264 (64.9%), while renter-occupied units make up 143 (35.1%).
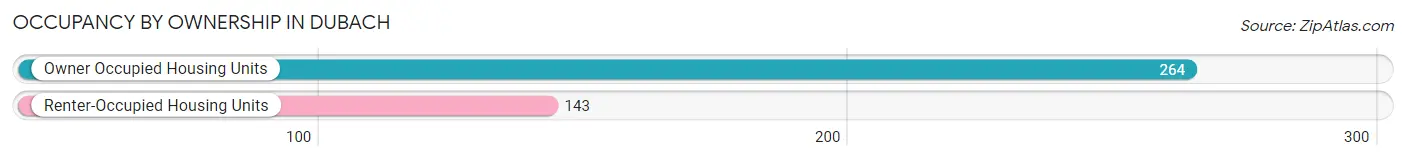
| Occupancy | # Housing Units | % Housing Units |
| Owner Occupied Housing Units | 264 | 64.9% |
| Renter-Occupied Housing Units | 143 | 35.1% |
| Total Occupied Housing Units | 407 | 100.0% |
Occupancy by Household Size in Dubach

| Household Size | # Housing Units | % Housing Units |
| 1-Person Household | 111 | 27.3% |
| 2-Person Household | 169 | 41.5% |
| 3-Person Household | 66 | 16.2% |
| 4+ Person Household | 61 | 15.0% |
| Total Housing Units | 407 | 100.0% |
Occupancy by Ownership by Household Size in Dubach
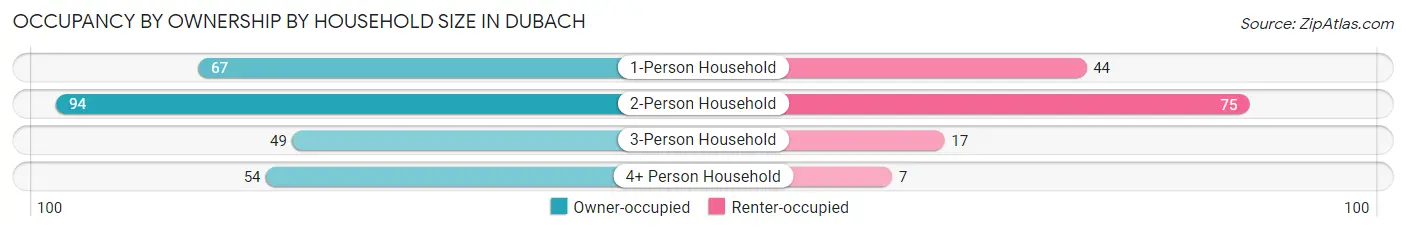
| Household Size | Owner-occupied | Renter-occupied |
| 1-Person Household | 67 (60.4%) | 44 (39.6%) |
| 2-Person Household | 94 (55.6%) | 75 (44.4%) |
| 3-Person Household | 49 (74.2%) | 17 (25.8%) |
| 4+ Person Household | 54 (88.5%) | 7 (11.5%) |
| Total Housing Units | 264 (64.9%) | 143 (35.1%) |
Occupancy by Educational Attainment in Dubach
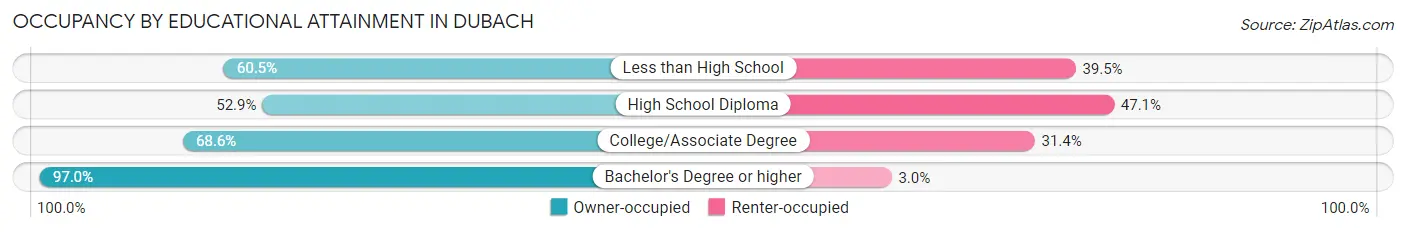
| Household Size | Owner-occupied | Renter-occupied |
| Less than High School | 49 (60.5%) | 32 (39.5%) |
| High School Diploma | 92 (52.9%) | 82 (47.1%) |
| College/Associate Degree | 59 (68.6%) | 27 (31.4%) |
| Bachelor's Degree or higher | 64 (97.0%) | 2 (3.0%) |
Occupancy by Age of Householder in Dubach
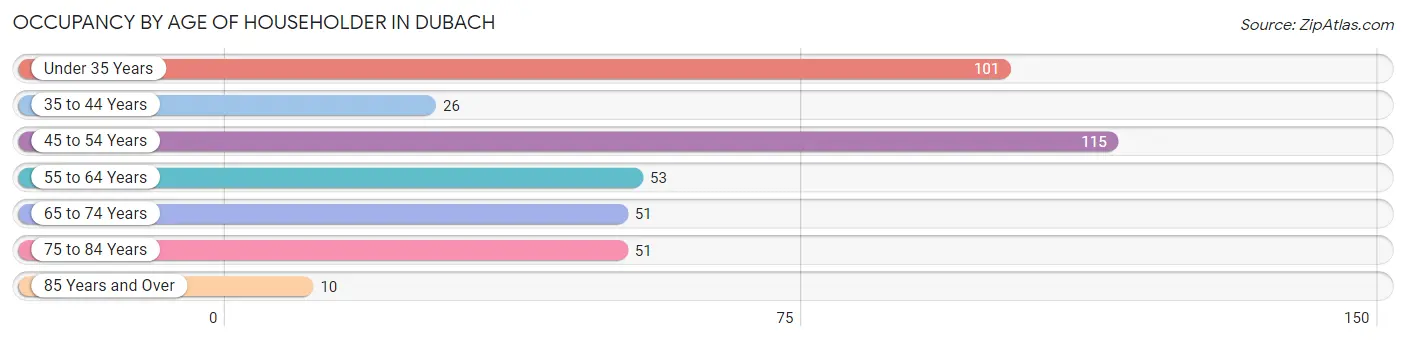
| Age Bracket | # Households | % Households |
| Under 35 Years | 101 | 24.8% |
| 35 to 44 Years | 26 | 6.4% |
| 45 to 54 Years | 115 | 28.3% |
| 55 to 64 Years | 53 | 13.0% |
| 65 to 74 Years | 51 | 12.5% |
| 75 to 84 Years | 51 | 12.5% |
| 85 Years and Over | 10 | 2.5% |
| Total | 407 | 100.0% |
Housing Finances in Dubach
Median Income by Occupancy in Dubach
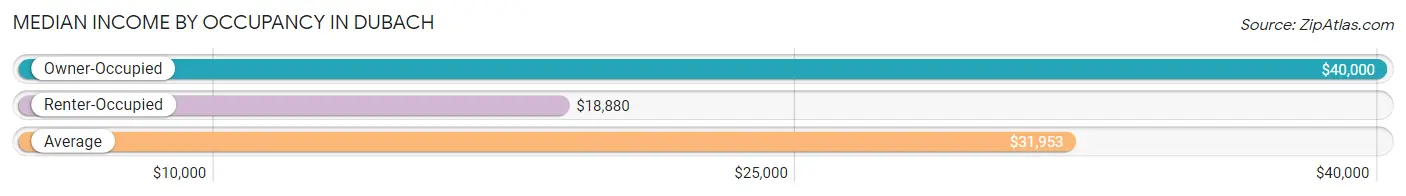
| Occupancy Type | # Households | Median Income |
| Owner-Occupied | 264 (64.9%) | $40,000 |
| Renter-Occupied | 143 (35.1%) | $18,880 |
| Average | 407 (100.0%) | $31,953 |
Occupancy by Householder Income Bracket in Dubach

| Income Bracket | Owner-occupied | Renter-occupied |
| Less than $5,000 | 5 (1.9%) | 0 (0.0%) |
| $5,000 to $9,999 | 19 (7.2%) | 8 (5.6%) |
| $10,000 to $14,999 | 0 (0.0%) | 37 (25.9%) |
| $15,000 to $19,999 | 13 (4.9%) | 48 (33.6%) |
| $20,000 to $24,999 | 33 (12.5%) | 8 (5.6%) |
| $25,000 to $34,999 | 42 (15.9%) | 4 (2.8%) |
| $35,000 to $49,999 | 37 (14.0%) | 5 (3.5%) |
| $50,000 to $74,999 | 45 (17.1%) | 8 (5.6%) |
| $75,000 to $99,999 | 37 (14.0%) | 0 (0.0%) |
| $100,000 to $149,999 | 16 (6.1%) | 22 (15.4%) |
| $150,000 or more | 17 (6.4%) | 3 (2.1%) |
| Total | 264 (100.0%) | 143 (100.0%) |
Monthly Housing Cost Tiers in Dubach
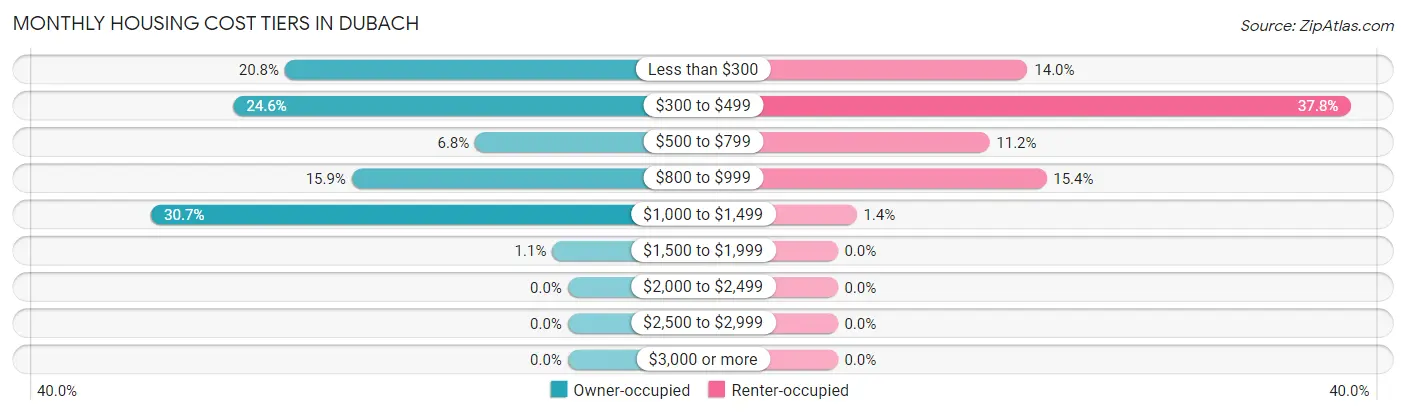
| Monthly Cost | Owner-occupied | Renter-occupied |
| Less than $300 | 55 (20.8%) | 20 (14.0%) |
| $300 to $499 | 65 (24.6%) | 54 (37.8%) |
| $500 to $799 | 18 (6.8%) | 16 (11.2%) |
| $800 to $999 | 42 (15.9%) | 22 (15.4%) |
| $1,000 to $1,499 | 81 (30.7%) | 2 (1.4%) |
| $1,500 to $1,999 | 3 (1.1%) | 0 (0.0%) |
| $2,000 to $2,499 | 0 (0.0%) | 0 (0.0%) |
| $2,500 to $2,999 | 0 (0.0%) | 0 (0.0%) |
| $3,000 or more | 0 (0.0%) | 0 (0.0%) |
| Total | 264 (100.0%) | 143 (100.0%) |
Physical Housing Characteristics in Dubach
Housing Structures in Dubach
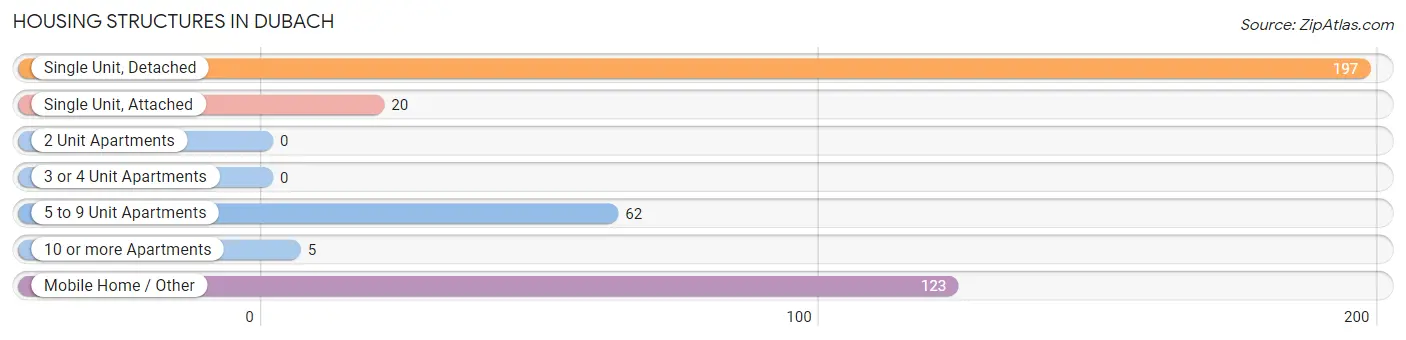
| Structure Type | # Housing Units | % Housing Units |
| Single Unit, Detached | 197 | 48.4% |
| Single Unit, Attached | 20 | 4.9% |
| 2 Unit Apartments | 0 | 0.0% |
| 3 or 4 Unit Apartments | 0 | 0.0% |
| 5 to 9 Unit Apartments | 62 | 15.2% |
| 10 or more Apartments | 5 | 1.2% |
| Mobile Home / Other | 123 | 30.2% |
| Total | 407 | 100.0% |
Housing Structures by Occupancy in Dubach
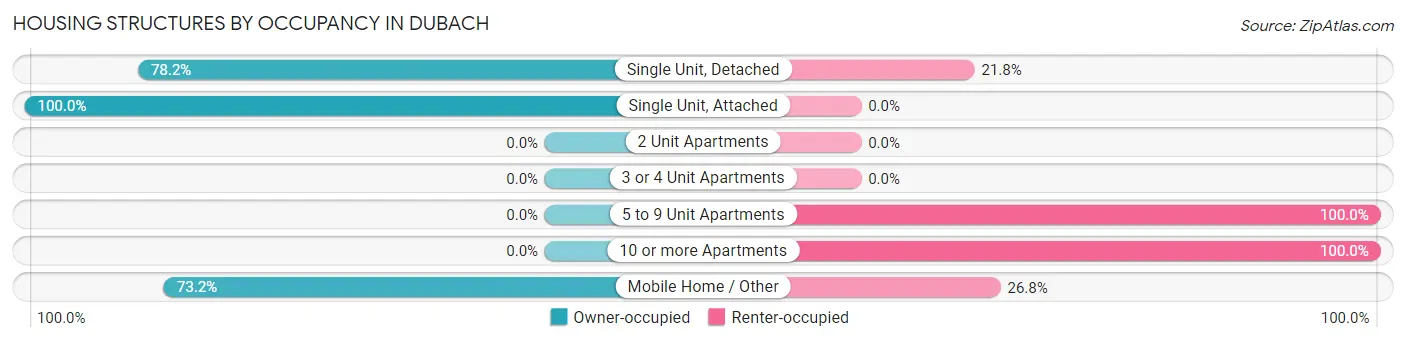
| Structure Type | Owner-occupied | Renter-occupied |
| Single Unit, Detached | 154 (78.2%) | 43 (21.8%) |
| Single Unit, Attached | 20 (100.0%) | 0 (0.0%) |
| 2 Unit Apartments | 0 (0.0%) | 0 (0.0%) |
| 3 or 4 Unit Apartments | 0 (0.0%) | 0 (0.0%) |
| 5 to 9 Unit Apartments | 0 (0.0%) | 62 (100.0%) |
| 10 or more Apartments | 0 (0.0%) | 5 (100.0%) |
| Mobile Home / Other | 90 (73.2%) | 33 (26.8%) |
| Total | 264 (64.9%) | 143 (35.1%) |
Housing Structures by Number of Rooms in Dubach
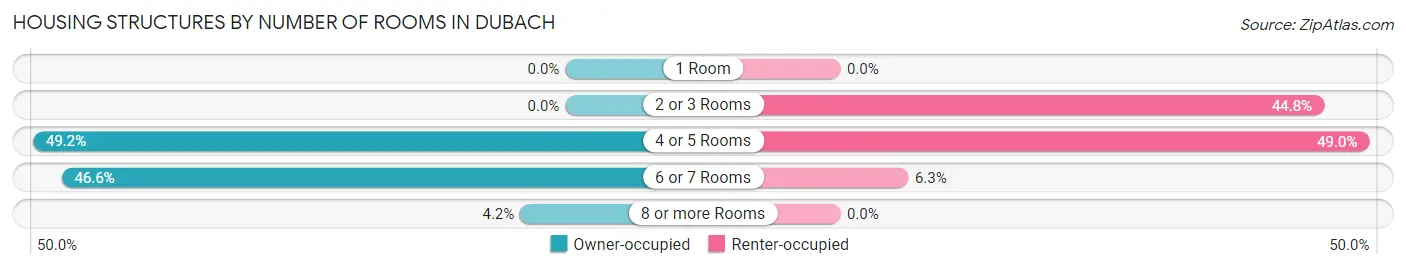
| Number of Rooms | Owner-occupied | Renter-occupied |
| 1 Room | 0 (0.0%) | 0 (0.0%) |
| 2 or 3 Rooms | 0 (0.0%) | 64 (44.8%) |
| 4 or 5 Rooms | 130 (49.2%) | 70 (48.9%) |
| 6 or 7 Rooms | 123 (46.6%) | 9 (6.3%) |
| 8 or more Rooms | 11 (4.2%) | 0 (0.0%) |
| Total | 264 (100.0%) | 143 (100.0%) |
Housing Structure by Heating Type in Dubach
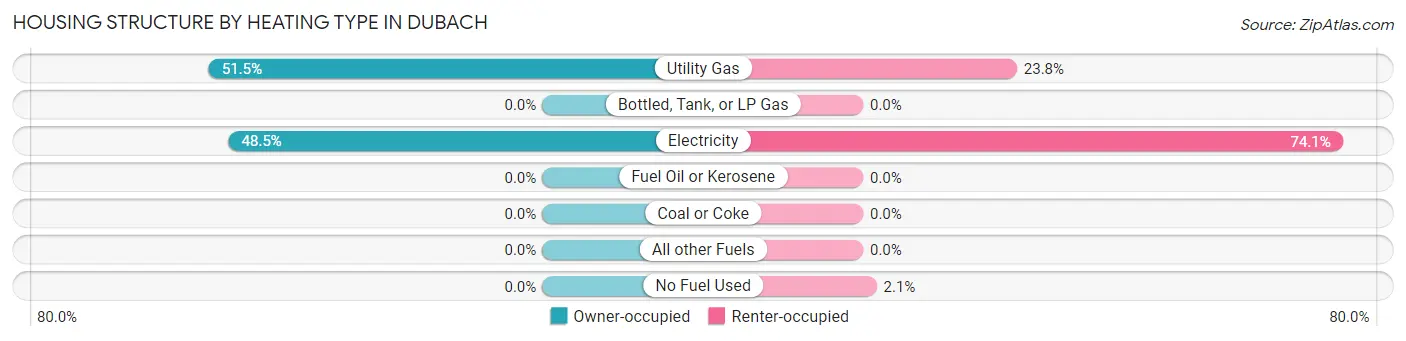
| Heating Type | Owner-occupied | Renter-occupied |
| Utility Gas | 136 (51.5%) | 34 (23.8%) |
| Bottled, Tank, or LP Gas | 0 (0.0%) | 0 (0.0%) |
| Electricity | 128 (48.5%) | 106 (74.1%) |
| Fuel Oil or Kerosene | 0 (0.0%) | 0 (0.0%) |
| Coal or Coke | 0 (0.0%) | 0 (0.0%) |
| All other Fuels | 0 (0.0%) | 0 (0.0%) |
| No Fuel Used | 0 (0.0%) | 3 (2.1%) |
| Total | 264 (100.0%) | 143 (100.0%) |
Household Vehicle Usage in Dubach
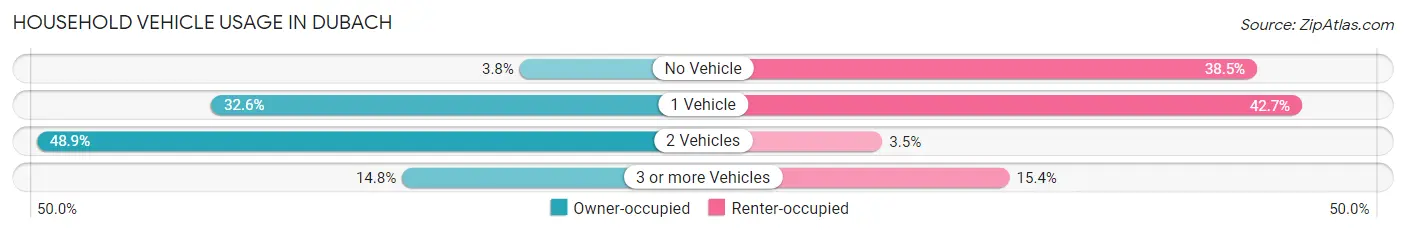
| Vehicles per Household | Owner-occupied | Renter-occupied |
| No Vehicle | 10 (3.8%) | 55 (38.5%) |
| 1 Vehicle | 86 (32.6%) | 61 (42.7%) |
| 2 Vehicles | 129 (48.9%) | 5 (3.5%) |
| 3 or more Vehicles | 39 (14.8%) | 22 (15.4%) |
| Total | 264 (100.0%) | 143 (100.0%) |
Real Estate & Mortgages in Dubach
Real Estate and Mortgage Overview in Dubach
| Characteristic | Without Mortgage | With Mortgage |
| Housing Units | 127 | 137 |
| Median Property Value | $61,800 | $125,300 |
| Median Household Income | $25,893 | $17 |
| Monthly Housing Costs | $319 | $0 |
| Real Estate Taxes | $199 | $40 |
Property Value by Mortgage Status in Dubach
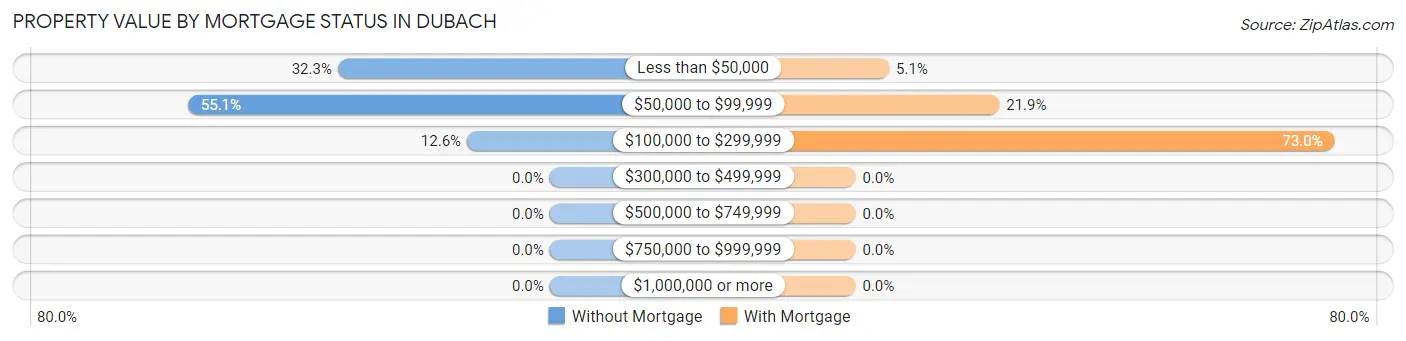
| Property Value | Without Mortgage | With Mortgage |
| Less than $50,000 | 41 (32.3%) | 7 (5.1%) |
| $50,000 to $99,999 | 70 (55.1%) | 30 (21.9%) |
| $100,000 to $299,999 | 16 (12.6%) | 100 (73.0%) |
| $300,000 to $499,999 | 0 (0.0%) | 0 (0.0%) |
| $500,000 to $749,999 | 0 (0.0%) | 0 (0.0%) |
| $750,000 to $999,999 | 0 (0.0%) | 0 (0.0%) |
| $1,000,000 or more | 0 (0.0%) | 0 (0.0%) |
| Total | 127 (100.0%) | 137 (100.0%) |
Household Income by Mortgage Status in Dubach
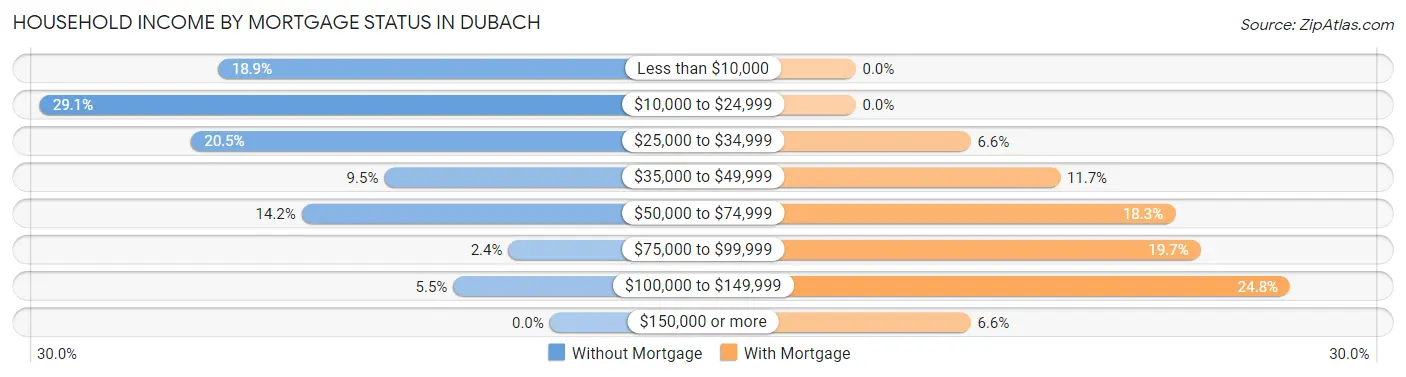
| Household Income | Without Mortgage | With Mortgage |
| Less than $10,000 | 24 (18.9%) | 0 (0.0%) |
| $10,000 to $24,999 | 37 (29.1%) | 0 (0.0%) |
| $25,000 to $34,999 | 26 (20.5%) | 9 (6.6%) |
| $35,000 to $49,999 | 12 (9.5%) | 16 (11.7%) |
| $50,000 to $74,999 | 18 (14.2%) | 25 (18.2%) |
| $75,000 to $99,999 | 3 (2.4%) | 27 (19.7%) |
| $100,000 to $149,999 | 7 (5.5%) | 34 (24.8%) |
| $150,000 or more | 0 (0.0%) | 9 (6.6%) |
| Total | 127 (100.0%) | 137 (100.0%) |
Property Value to Household Income Ratio in Dubach
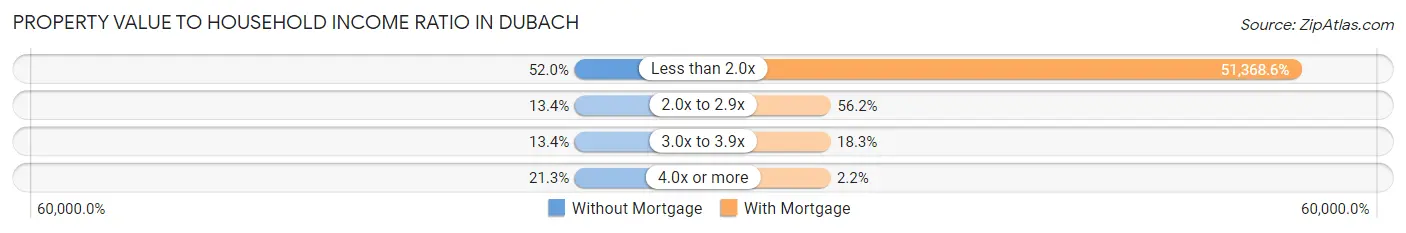
| Value-to-Income Ratio | Without Mortgage | With Mortgage |
| Less than 2.0x | 66 (52.0%) | 70,375 (51,368.6%) |
| 2.0x to 2.9x | 17 (13.4%) | 77 (56.2%) |
| 3.0x to 3.9x | 17 (13.4%) | 25 (18.2%) |
| 4.0x or more | 27 (21.3%) | 3 (2.2%) |
| Total | 127 (100.0%) | 137 (100.0%) |
Real Estate Taxes by Mortgage Status in Dubach
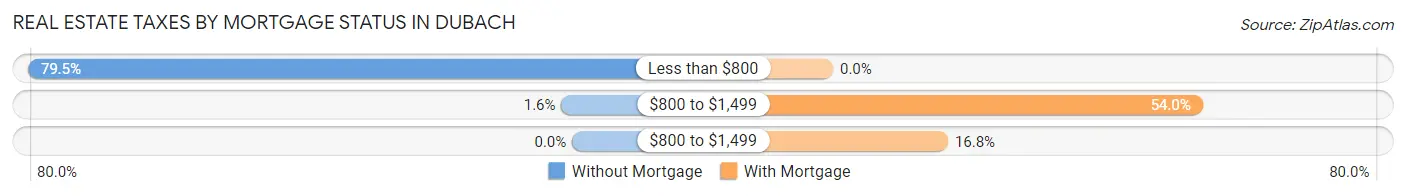
| Property Taxes | Without Mortgage | With Mortgage |
| Less than $800 | 101 (79.5%) | 0 (0.0%) |
| $800 to $1,499 | 2 (1.6%) | 74 (54.0%) |
| $800 to $1,499 | 0 (0.0%) | 23 (16.8%) |
| Total | 127 (100.0%) | 137 (100.0%) |
Health & Disability in Dubach
Health Insurance Coverage by Age in Dubach

| Age Bracket | With Coverage | Without Coverage |
| Under 6 Years | 64 (100.0%) | 0 (0.0%) |
| 6 to 18 Years | 169 (98.3%) | 3 (1.7%) |
| 19 to 25 Years | 210 (100.0%) | 0 (0.0%) |
| 26 to 34 Years | 93 (86.1%) | 15 (13.9%) |
| 35 to 44 Years | 59 (89.4%) | 7 (10.6%) |
| 45 to 54 Years | 171 (95.0%) | 9 (5.0%) |
| 55 to 64 Years | 76 (95.0%) | 4 (5.0%) |
| 65 to 74 Years | 80 (100.0%) | 0 (0.0%) |
| 75 Years and older | 66 (100.0%) | 0 (0.0%) |
| Total | 988 (96.3%) | 38 (3.7%) |
Health Insurance Coverage by Citizenship Status in Dubach
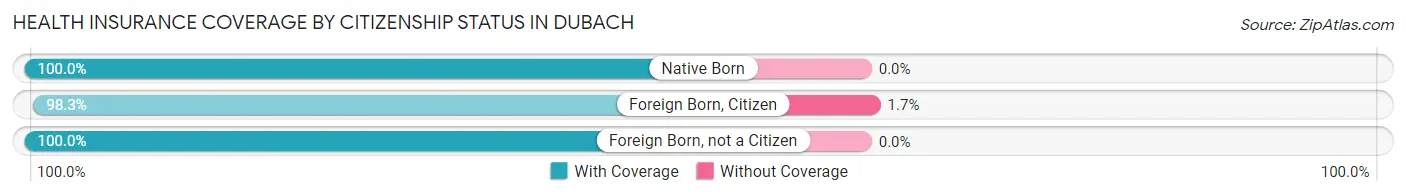
| Citizenship Status | With Coverage | Without Coverage |
| Native Born | 64 (100.0%) | 0 (0.0%) |
| Foreign Born, Citizen | 169 (98.3%) | 3 (1.7%) |
| Foreign Born, not a Citizen | 210 (100.0%) | 0 (0.0%) |
Health Insurance Coverage by Household Income in Dubach
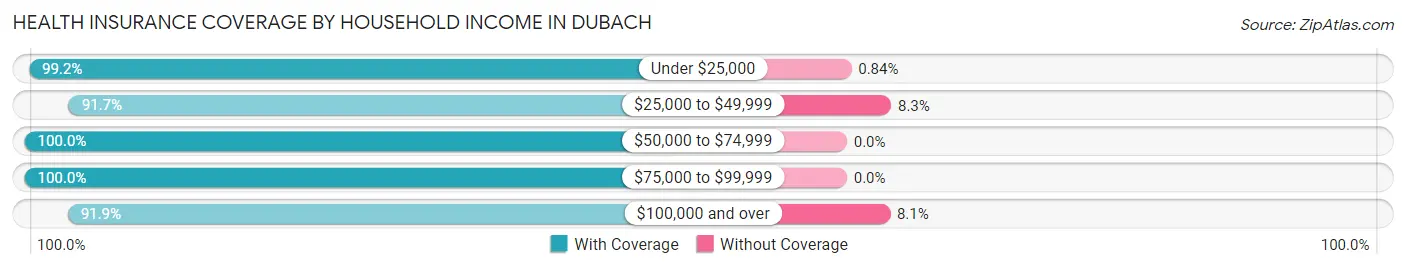
| Household Income | With Coverage | Without Coverage |
| Under $25,000 | 355 (99.2%) | 3 (0.8%) |
| $25,000 to $49,999 | 177 (91.7%) | 16 (8.3%) |
| $50,000 to $74,999 | 159 (100.0%) | 0 (0.0%) |
| $75,000 to $99,999 | 81 (100.0%) | 0 (0.0%) |
| $100,000 and over | 216 (91.9%) | 19 (8.1%) |
Public vs Private Health Insurance Coverage by Age in Dubach
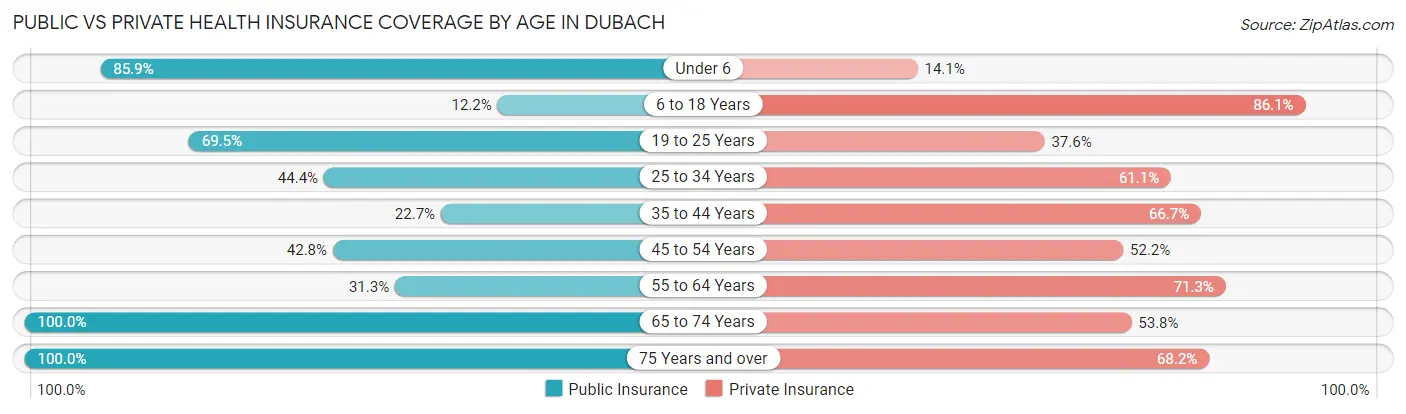
| Age Bracket | Public Insurance | Private Insurance |
| Under 6 | 55 (85.9%) | 9 (14.1%) |
| 6 to 18 Years | 21 (12.2%) | 148 (86.1%) |
| 19 to 25 Years | 146 (69.5%) | 79 (37.6%) |
| 25 to 34 Years | 48 (44.4%) | 66 (61.1%) |
| 35 to 44 Years | 15 (22.7%) | 44 (66.7%) |
| 45 to 54 Years | 77 (42.8%) | 94 (52.2%) |
| 55 to 64 Years | 25 (31.2%) | 57 (71.3%) |
| 65 to 74 Years | 80 (100.0%) | 43 (53.7%) |
| 75 Years and over | 66 (100.0%) | 45 (68.2%) |
| Total | 533 (51.9%) | 585 (57.0%) |
Disability Status by Sex by Age in Dubach
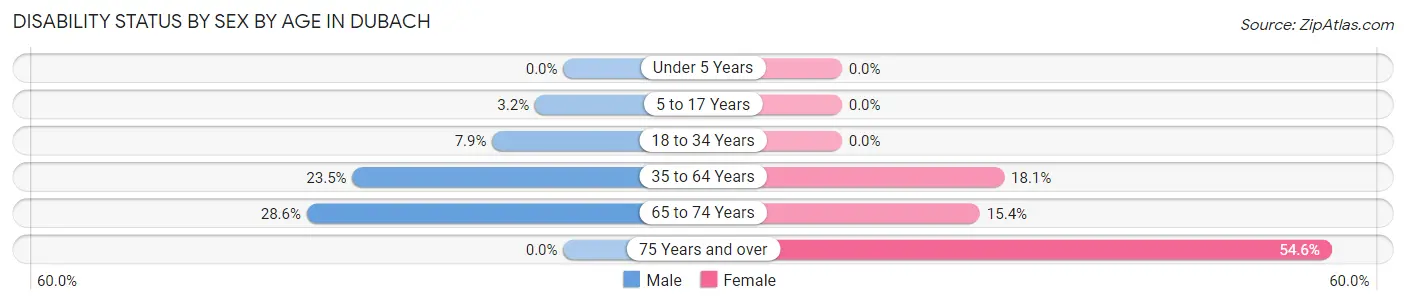
| Age Bracket | Male | Female |
| Under 5 Years | 0 (0.0%) | 0 (0.0%) |
| 5 to 17 Years | 3 (3.2%) | 0 (0.0%) |
| 18 to 34 Years | 14 (7.9%) | 0 (0.0%) |
| 35 to 64 Years | 35 (23.5%) | 32 (18.1%) |
| 65 to 74 Years | 8 (28.6%) | 8 (15.4%) |
| 75 Years and over | 0 (0.0%) | 36 (54.5%) |
Disability Class by Sex by Age in Dubach
Disability Class: Hearing Difficulty
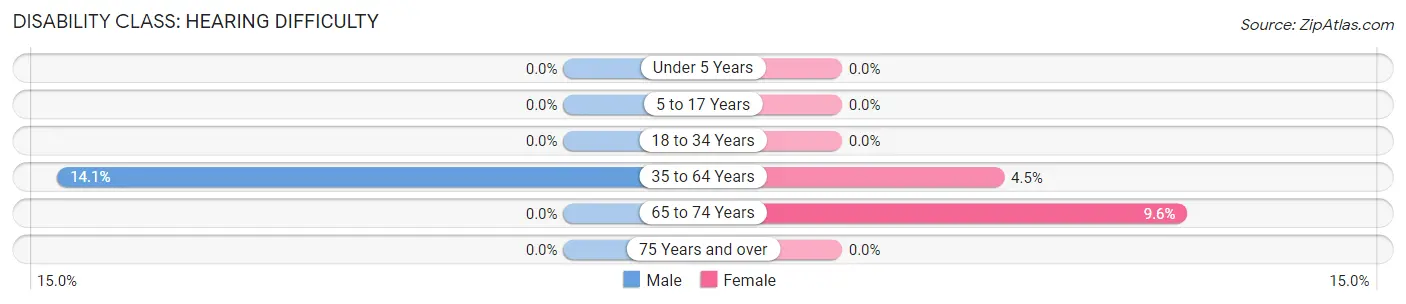
| Age Bracket | Male | Female |
| Under 5 Years | 0 (0.0%) | 0 (0.0%) |
| 5 to 17 Years | 0 (0.0%) | 0 (0.0%) |
| 18 to 34 Years | 0 (0.0%) | 0 (0.0%) |
| 35 to 64 Years | 21 (14.1%) | 8 (4.5%) |
| 65 to 74 Years | 0 (0.0%) | 5 (9.6%) |
| 75 Years and over | 0 (0.0%) | 0 (0.0%) |
Disability Class: Vision Difficulty
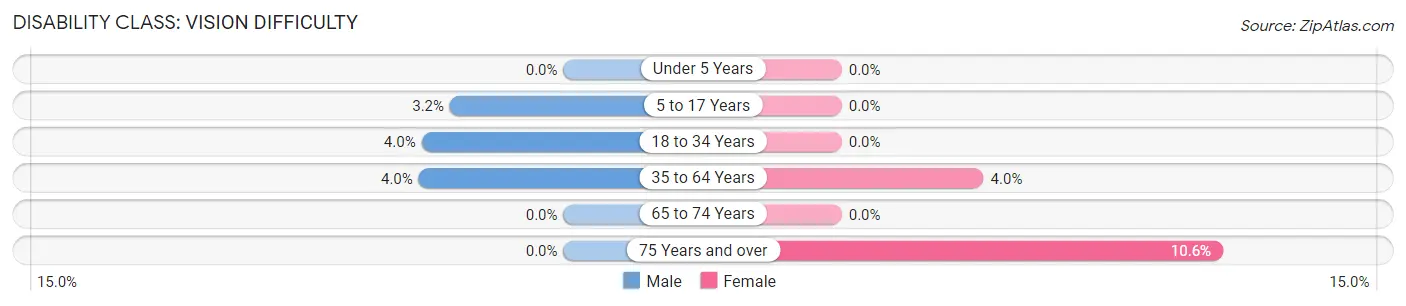
| Age Bracket | Male | Female |
| Under 5 Years | 0 (0.0%) | 0 (0.0%) |
| 5 to 17 Years | 3 (3.2%) | 0 (0.0%) |
| 18 to 34 Years | 7 (4.0%) | 0 (0.0%) |
| 35 to 64 Years | 6 (4.0%) | 7 (4.0%) |
| 65 to 74 Years | 0 (0.0%) | 0 (0.0%) |
| 75 Years and over | 0 (0.0%) | 7 (10.6%) |
Disability Class: Cognitive Difficulty
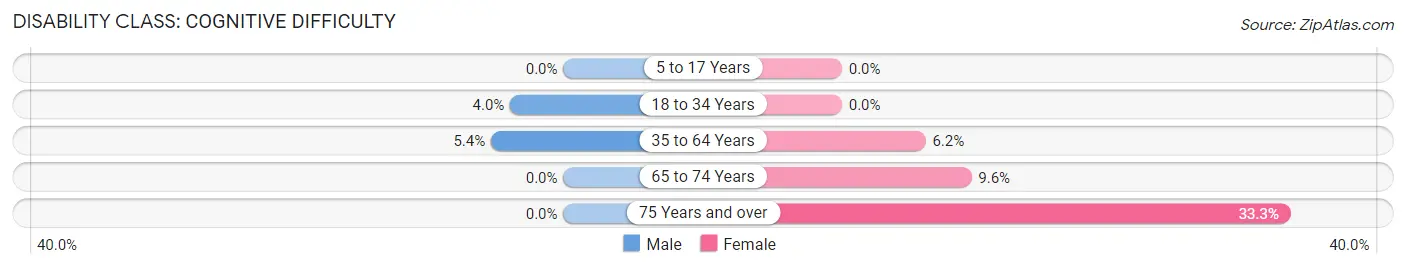
| Age Bracket | Male | Female |
| 5 to 17 Years | 0 (0.0%) | 0 (0.0%) |
| 18 to 34 Years | 7 (4.0%) | 0 (0.0%) |
| 35 to 64 Years | 8 (5.4%) | 11 (6.2%) |
| 65 to 74 Years | 0 (0.0%) | 5 (9.6%) |
| 75 Years and over | 0 (0.0%) | 22 (33.3%) |
Disability Class: Ambulatory Difficulty
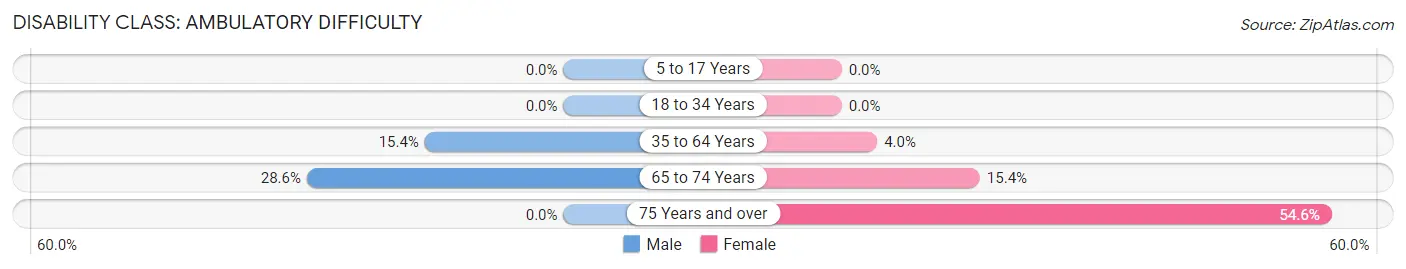
| Age Bracket | Male | Female |
| 5 to 17 Years | 0 (0.0%) | 0 (0.0%) |
| 18 to 34 Years | 0 (0.0%) | 0 (0.0%) |
| 35 to 64 Years | 23 (15.4%) | 7 (4.0%) |
| 65 to 74 Years | 8 (28.6%) | 8 (15.4%) |
| 75 Years and over | 0 (0.0%) | 36 (54.5%) |
Disability Class: Self-Care Difficulty
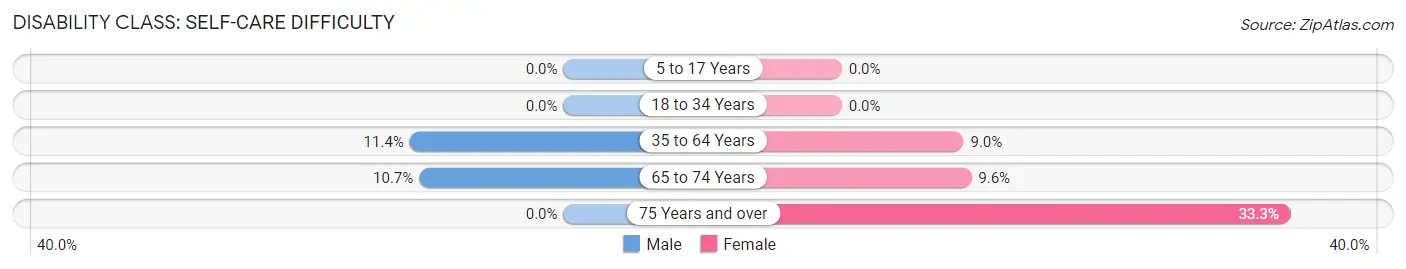
| Age Bracket | Male | Female |
| 5 to 17 Years | 0 (0.0%) | 0 (0.0%) |
| 18 to 34 Years | 0 (0.0%) | 0 (0.0%) |
| 35 to 64 Years | 17 (11.4%) | 16 (9.0%) |
| 65 to 74 Years | 3 (10.7%) | 5 (9.6%) |
| 75 Years and over | 0 (0.0%) | 22 (33.3%) |
Technology Access in Dubach
Computing Device Access in Dubach
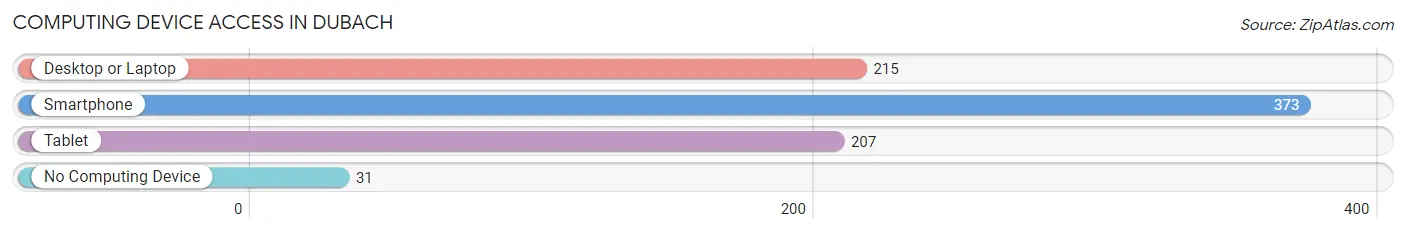
| Device Type | # Households | % Households |
| Desktop or Laptop | 215 | 52.8% |
| Smartphone | 373 | 91.6% |
| Tablet | 207 | 50.9% |
| No Computing Device | 31 | 7.6% |
| Total | 407 | 100.0% |
Internet Access in Dubach
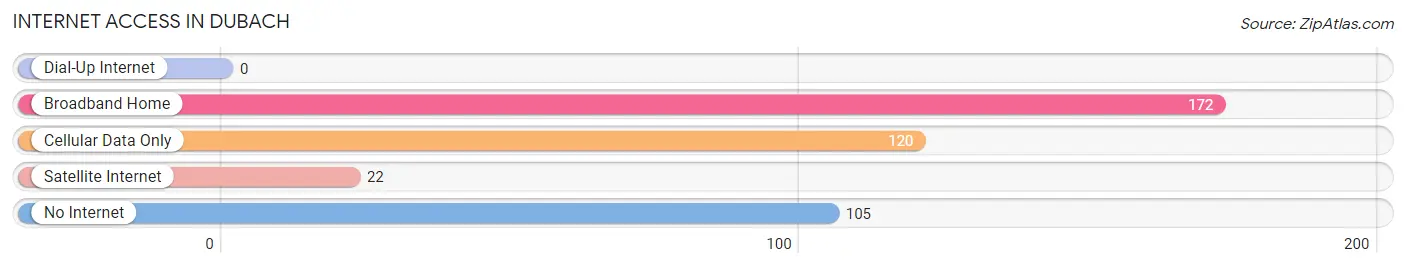
| Internet Type | # Households | % Households |
| Dial-Up Internet | 0 | 0.0% |
| Broadband Home | 172 | 42.3% |
| Cellular Data Only | 120 | 29.5% |
| Satellite Internet | 22 | 5.4% |
| No Internet | 105 | 25.8% |
| Total | 407 | 100.0% |
Dubach Summary
Dubach is a small town located in Lincoln Parish, Louisiana. It is situated in the northern part of the state, approximately 20 miles south of Ruston and 30 miles north of Monroe. The town has a population of 1,717 people, according to the 2010 census.
Geography
Dubach is located in the northern part of Lincoln Parish, Louisiana. It is situated in the rolling hills of the Red River Valley, which is part of the larger Mississippi River Valley. The town is located at an elevation of approximately 300 feet above sea level. The climate in Dubach is humid subtropical, with hot summers and mild winters. The average annual temperature is around 70 degrees Fahrenheit.
History
Dubach was founded in 1883 by a group of settlers from Arkansas. The town was named after a local landowner, John Dubach. The town grew slowly over the years, and by the early 1900s, it had become a thriving agricultural community. The town was incorporated in 1908.
In the early 20th century, Dubach was a major center for cotton production. The town was also home to several sawmills and lumber companies. In the 1950s, the town began to decline as the cotton industry moved away from the area.
Economy
Today, Dubach is a small, rural town with a population of 1,717 people. The town’s economy is largely based on agriculture, with cotton, soybeans, and corn being the main crops. The town is also home to several small businesses, including a grocery store, a hardware store, and a few restaurants.
Demographics
According to the 2010 census, the population of Dubach was 1,717 people. The racial makeup of the town was 94.3% White, 3.2% African American, 0.3% Native American, 0.2% Asian, 0.1% Pacific Islander, 0.7% from other races, and 1.4% from two or more races. The median household income was $30,938, and the median family income was $37,813.
Conclusion
Dubach is a small, rural town located in Lincoln Parish, Louisiana. It has a population of 1,717 people, and the town’s economy is largely based on agriculture. The town has a diverse racial makeup, and the median household income is $30,938. Dubach is a quiet, peaceful town with a rich history and a bright future.
Common Questions
What is the Total Population of Dubach?
Total Population of Dubach is 1,026.
What is the Total Male Population of Dubach?
Total Male Population of Dubach is 458.
What is the Total Female Population of Dubach?
Total Female Population of Dubach is 568.
What is the Ratio of Males per 100 Females in Dubach?
There are 80.63 Males per 100 Females in Dubach.
What is the Ratio of Females per 100 Males in Dubach?
There are 124.02 Females per 100 Males in Dubach.
What is the Median Population Age in Dubach?
Median Population Age in Dubach is 30.4 Years.
What is the Average Family Size in Dubach
Average Family Size in Dubach is 3.3 People.
What is the Average Household Size in Dubach
Average Household Size in Dubach is 2.5 People.
What is Per Capita Income in Dubach?
Per Capita income in Dubach is $22,041.
What is the Median Family Income in Dubach?
Median Family Income in Dubach is $59,167.
What is the Median Household income in Dubach?
Median Household Income in Dubach is $31,953.
What is Inequality or Gini Index in Dubach?
Inequality or Gini Index in Dubach is 0.48.
How Large is the Labor Force in Dubach?
There are 486 People in the Labor Forcein in Dubach.
What is the Percentage of People in the Labor Force in Dubach?
56.2% of People are in the Labor Force in Dubach.
What is the Unemployment Rate in Dubach?
Unemployment Rate in Dubach is 2.9%.