Meraux, LA
Meraux Map
Meraux Overview
7,297
TOTAL POPULATION
3,480
MALE POPULATION
3,817
FEMALE POPULATION
91.17
MALES / 100 FEMALES
109.68
FEMALES / 100 MALES
39.9
MEDIAN AGE
3.6
AVG FAMILY SIZE
3.0
AVG HOUSEHOLD SIZE
$33,226
PER CAPITA INCOME
$85,972
AVG FAMILY INCOME
$70,707
AVG HOUSEHOLD INCOME
27.5%
WAGE / INCOME GAP [ % ]
72.5¢/ $1
WAGE / INCOME GAP [ $ ]
$12,854
FAMILY INCOME DEFICIT
0.43
INEQUALITY / GINI INDEX
3,905
LABOR FORCE [ PEOPLE ]
68.4%
PERCENT IN LABOR FORCE
3.5%
UNEMPLOYMENT RATE
Meraux Zip Codes
Meraux Area Codes
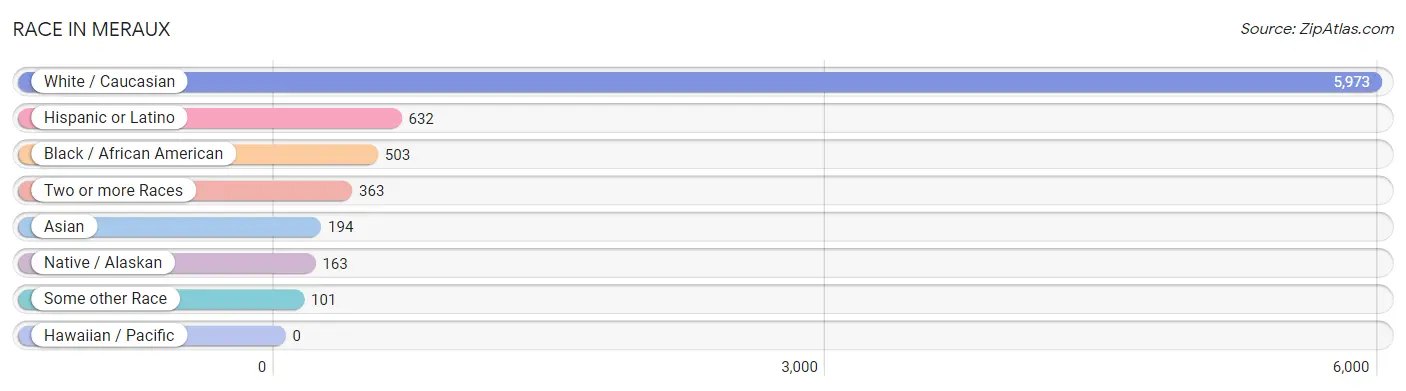
Race in Meraux
The most populous races in Meraux are White / Caucasian (5,973 | 81.9%), Hispanic or Latino (632 | 8.7%), and Black / African American (503 | 6.9%).
| Race | # Population | % Population |
| Asian | 194 | 2.7% |
| Black / African American | 503 | 6.9% |
| Hawaiian / Pacific | 0 | 0.0% |
| Hispanic or Latino | 632 | 8.7% |
| Native / Alaskan | 163 | 2.2% |
| White / Caucasian | 5,973 | 81.9% |
| Two or more Races | 363 | 5.0% |
| Some other Race | 101 | 1.4% |
| Total | 7,297 | 100.0% |
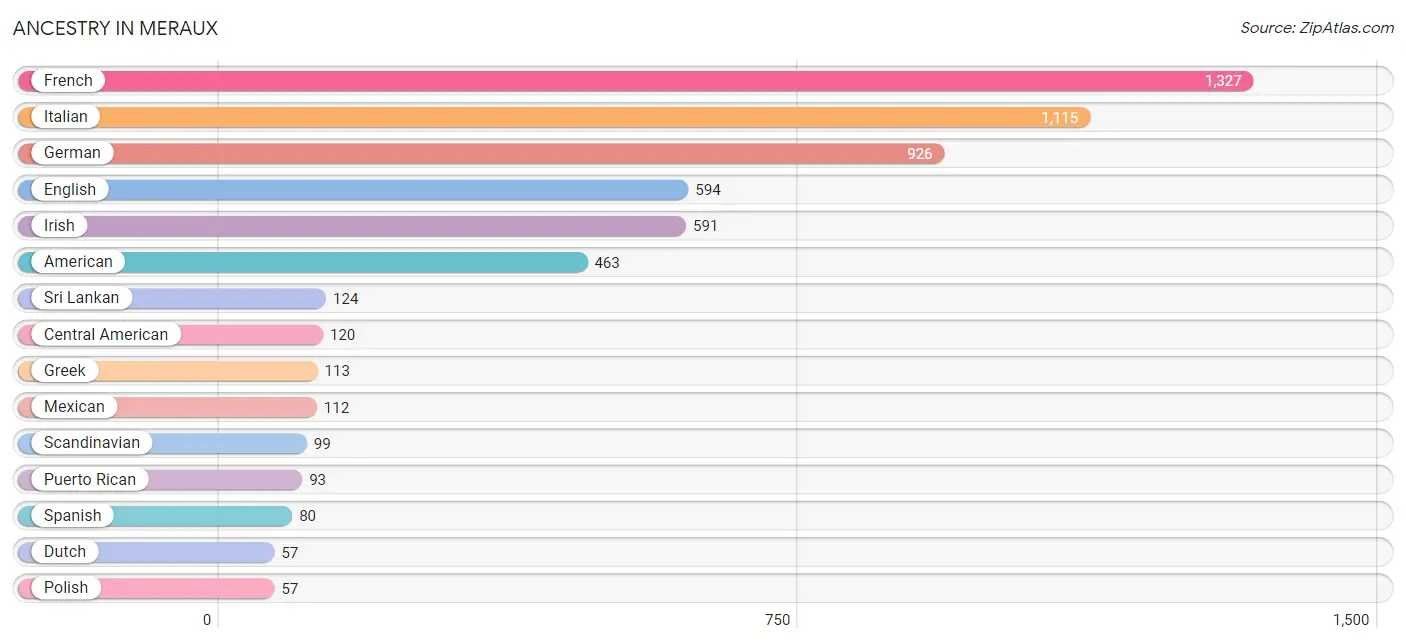
Ancestry in Meraux
The most populous ancestries reported in Meraux are French (1,327 | 18.2%), Italian (1,115 | 15.3%), German (926 | 12.7%), English (594 | 8.1%), and Irish (591 | 8.1%), together accounting for 62.4% of all Meraux residents.
| Ancestry | # Population | % Population |
| African | 7 | 0.1% |
| American | 463 | 6.4% |
| Austrian | 2 | 0.0% |
| Cajun | 25 | 0.3% |
| Central American | 120 | 1.6% |
| Cherokee | 33 | 0.4% |
| Costa Rican | 14 | 0.2% |
| Croatian | 2 | 0.0% |
| Danish | 11 | 0.2% |
| Dutch | 57 | 0.8% |
| English | 594 | 8.1% |
| European | 42 | 0.6% |
| French | 1,327 | 18.2% |
| French Canadian | 24 | 0.3% |
| German | 926 | 12.7% |
| Greek | 113 | 1.5% |
| Guatemalan | 52 | 0.7% |
| Honduran | 28 | 0.4% |
| Houma | 26 | 0.4% |
| Indian (Asian) | 48 | 0.7% |
| Irish | 591 | 8.1% |
| Italian | 1,115 | 15.3% |
| Korean | 20 | 0.3% |
| Mexican | 112 | 1.5% |
| Norwegian | 24 | 0.3% |
| Polish | 57 | 0.8% |
| Puerto Rican | 93 | 1.3% |
| Salvadoran | 26 | 0.4% |
| Scandinavian | 99 | 1.4% |
| Scottish | 32 | 0.4% |
| Spaniard | 54 | 0.7% |
| Spanish | 80 | 1.1% |
| Sri Lankan | 124 | 1.7% |
| Subsaharan African | 7 | 0.1% |
| Swedish | 14 | 0.2% | View All 35 Rows |
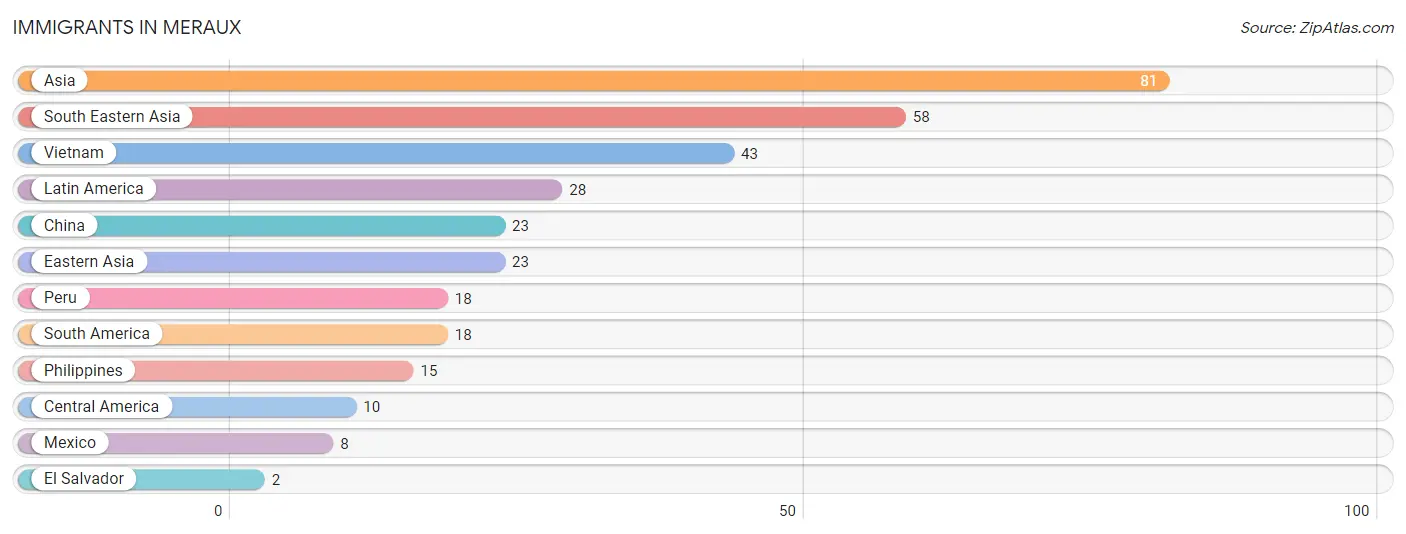
Immigrants in Meraux
The most numerous immigrant groups reported in Meraux came from Asia (81 | 1.1%), South Eastern Asia (58 | 0.8%), Vietnam (43 | 0.6%), Latin America (28 | 0.4%), and China (23 | 0.3%), together accounting for 3.2% of all Meraux residents.
| Immigration Origin | # Population | % Population |
| Asia | 81 | 1.1% |
| Central America | 10 | 0.1% |
| China | 23 | 0.3% |
| Eastern Asia | 23 | 0.3% |
| El Salvador | 2 | 0.0% |
| Latin America | 28 | 0.4% |
| Mexico | 8 | 0.1% |
| Peru | 18 | 0.3% |
| Philippines | 15 | 0.2% |
| South America | 18 | 0.3% |
| South Eastern Asia | 58 | 0.8% |
| Vietnam | 43 | 0.6% | View All 12 Rows |
Sex and Age in Meraux
Sex and Age in Meraux
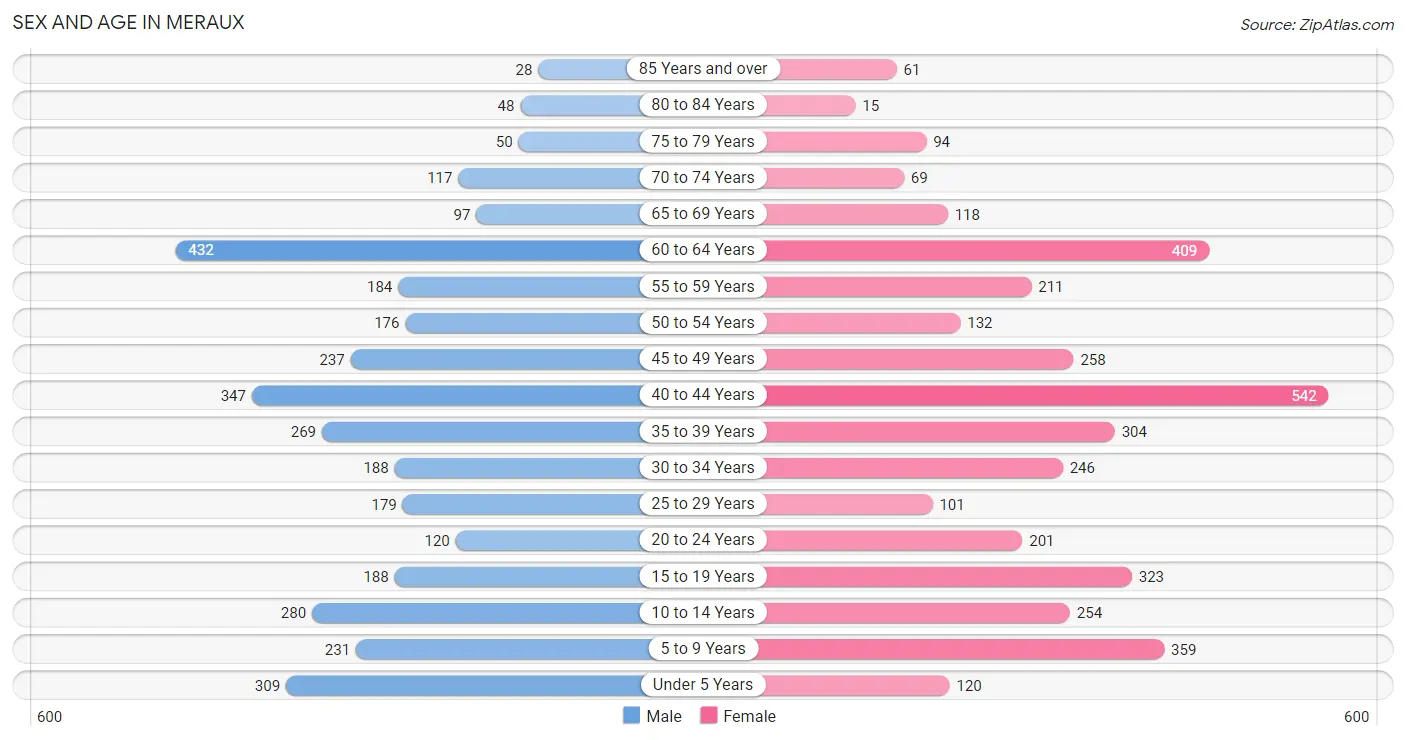
The most populous age groups in Meraux are 60 to 64 Years (432 | 12.4%) for men and 40 to 44 Years (542 | 14.2%) for women.
| Age Bracket | Male | Female |
| Under 5 Years | 309 (8.9%) | 120 (3.1%) |
| 5 to 9 Years | 231 (6.6%) | 359 (9.4%) |
| 10 to 14 Years | 280 (8.1%) | 254 (6.7%) |
| 15 to 19 Years | 188 (5.4%) | 323 (8.5%) |
| 20 to 24 Years | 120 (3.5%) | 201 (5.3%) |
| 25 to 29 Years | 179 (5.1%) | 101 (2.6%) |
| 30 to 34 Years | 188 (5.4%) | 246 (6.4%) |
| 35 to 39 Years | 269 (7.7%) | 304 (8.0%) |
| 40 to 44 Years | 347 (10.0%) | 542 (14.2%) |
| 45 to 49 Years | 237 (6.8%) | 258 (6.8%) |
| 50 to 54 Years | 176 (5.1%) | 132 (3.5%) |
| 55 to 59 Years | 184 (5.3%) | 211 (5.5%) |
| 60 to 64 Years | 432 (12.4%) | 409 (10.7%) |
| 65 to 69 Years | 97 (2.8%) | 118 (3.1%) |
| 70 to 74 Years | 117 (3.4%) | 69 (1.8%) |
| 75 to 79 Years | 50 (1.4%) | 94 (2.5%) |
| 80 to 84 Years | 48 (1.4%) | 15 (0.4%) |
| 85 Years and over | 28 (0.8%) | 61 (1.6%) |
| Total | 3,480 (100.0%) | 3,817 (100.0%) |
Families and Households in Meraux
Median Family Size in Meraux
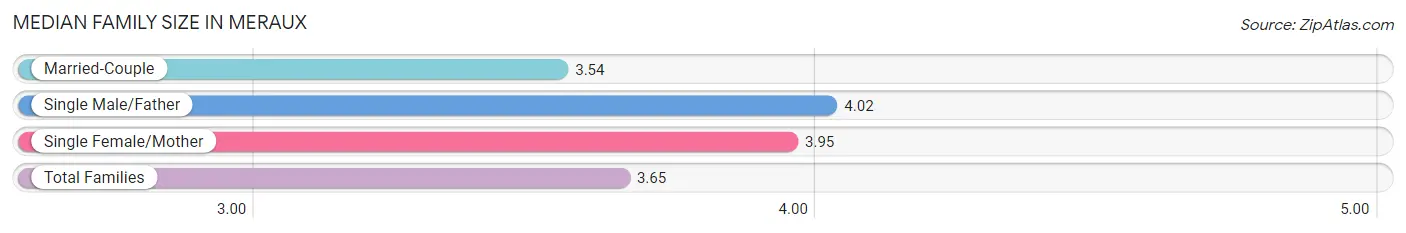
The median family size in Meraux is 3.65 persons per family, with single male/father families (108 | 6.3%) accounting for the largest median family size of 4.02 persons per family. On the other hand, married-couple families (1,249 | 73.0%) represent the smallest median family size with 3.54 persons per family.
| Family Type | # Families | Family Size |
| Married-Couple | 1,249 (73.0%) | 3.54 |
| Single Male/Father | 108 (6.3%) | 4.02 |
| Single Female/Mother | 355 (20.7%) | 3.95 |
| Total Families | 1,712 (100.0%) | 3.65 |
Median Household Size in Meraux
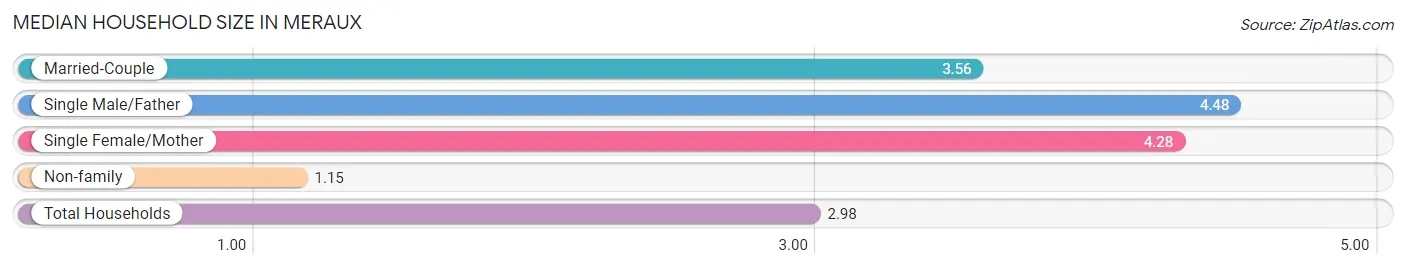
The median household size in Meraux is 2.98 persons per household, with single male/father households (108 | 4.4%) accounting for the largest median household size of 4.48 persons per household. non-family households (733 | 30.0%) represent the smallest median household size with 1.15 persons per household.
| Household Type | # Households | Household Size |
| Married-Couple | 1,249 (51.1%) | 3.56 |
| Single Male/Father | 108 (4.4%) | 4.48 |
| Single Female/Mother | 355 (14.5%) | 4.28 |
| Non-family | 733 (30.0%) | 1.15 |
| Total Households | 2,445 (100.0%) | 2.98 |
Household Size by Marriage Status in Meraux
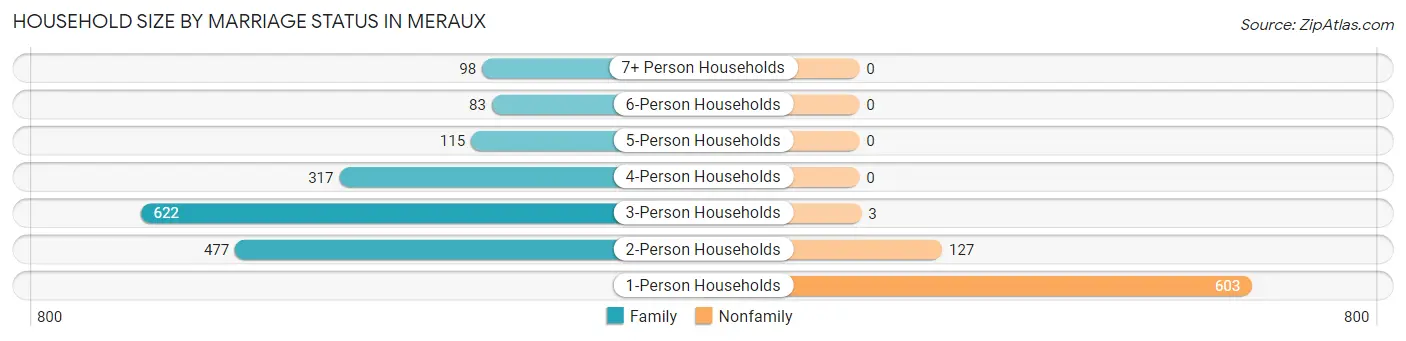
Out of a total of 2,445 households in Meraux, 1,712 (70.0%) are family households, while 733 (30.0%) are nonfamily households. The most numerous type of family households are 3-person households, comprising 622, and the most common type of nonfamily households are 1-person households, comprising 603.
| Household Size | Family Households | Nonfamily Households |
| 1-Person Households | - | 603 (24.7%) |
| 2-Person Households | 477 (19.5%) | 127 (5.2%) |
| 3-Person Households | 622 (25.4%) | 3 (0.1%) |
| 4-Person Households | 317 (13.0%) | 0 (0.0%) |
| 5-Person Households | 115 (4.7%) | 0 (0.0%) |
| 6-Person Households | 83 (3.4%) | 0 (0.0%) |
| 7+ Person Households | 98 (4.0%) | 0 (0.0%) |
| Total | 1,712 (70.0%) | 733 (30.0%) |
Female Fertility in Meraux
Fertility by Age in Meraux
Average fertility rate in Meraux is 34.0 births per 1,000 women. Women in the age bracket of 20 to 34 years have the highest fertility rate with 122.0 births per 1,000 women. Women in the age bracket of 20 to 34 years acount for 100.0% of all women with births.
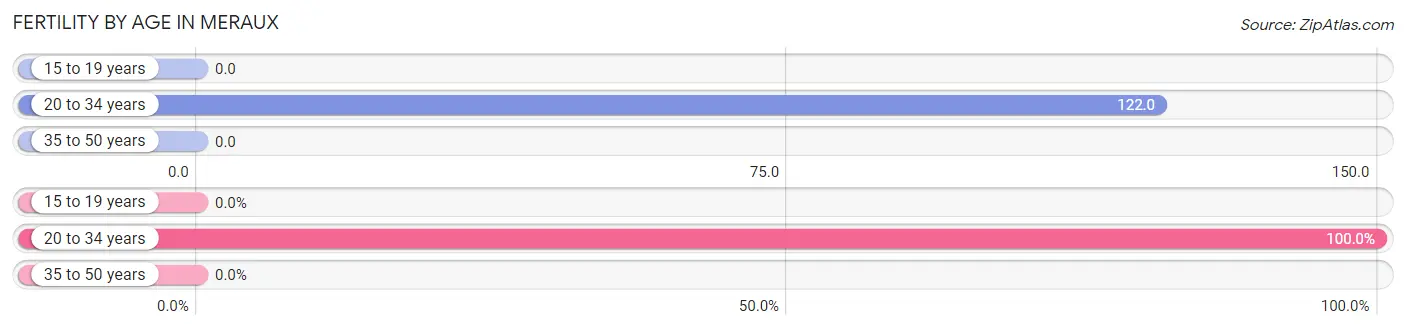
| Age Bracket | Women with Births | Births / 1,000 Women |
| 15 to 19 years | 0 (0.0%) | 0.0 |
| 20 to 34 years | 67 (100.0%) | 122.0 |
| 35 to 50 years | 0 (0.0%) | 0.0 |
| Total | 67 (100.0%) | 34.0 |
Fertility by Age by Marriage Status in Meraux
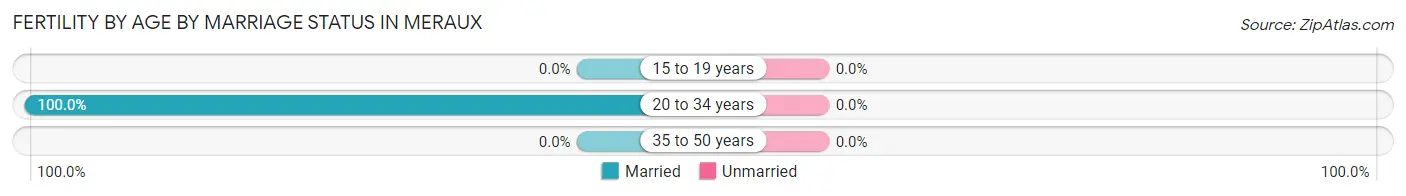
| Age Bracket | Married | Unmarried |
| 15 to 19 years | 0 (0.0%) | 0 (0.0%) |
| 20 to 34 years | 67 (100.0%) | 0 (0.0%) |
| 35 to 50 years | 0 (0.0%) | 0 (0.0%) |
| Total | 67 (100.0%) | 0 (0.0%) |
Fertility by Education in Meraux
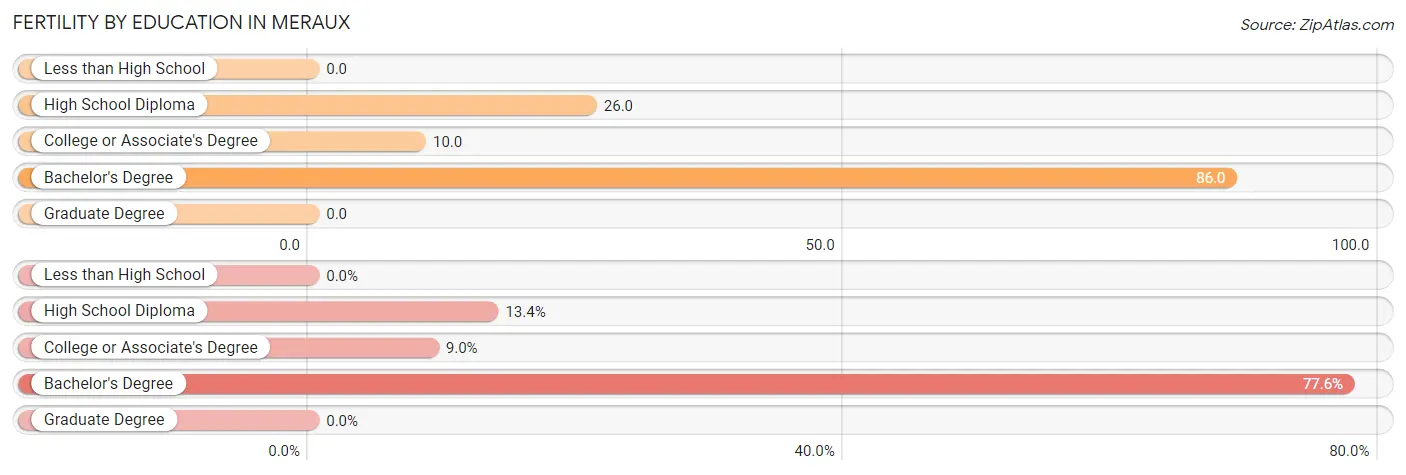
| Educational Attainment | Women with Births | Births / 1,000 Women |
| Less than High School | 0 (0.0%) | 0.0 |
| High School Diploma | 9 (13.4%) | 26.0 |
| College or Associate's Degree | 6 (9.0%) | 10.0 |
| Bachelor's Degree | 52 (77.6%) | 86.0 |
| Graduate Degree | 0 (0.0%) | 0.0 |
| Total | 67 (100.0%) | 34.0 |
Fertility by Education by Marriage Status in Meraux
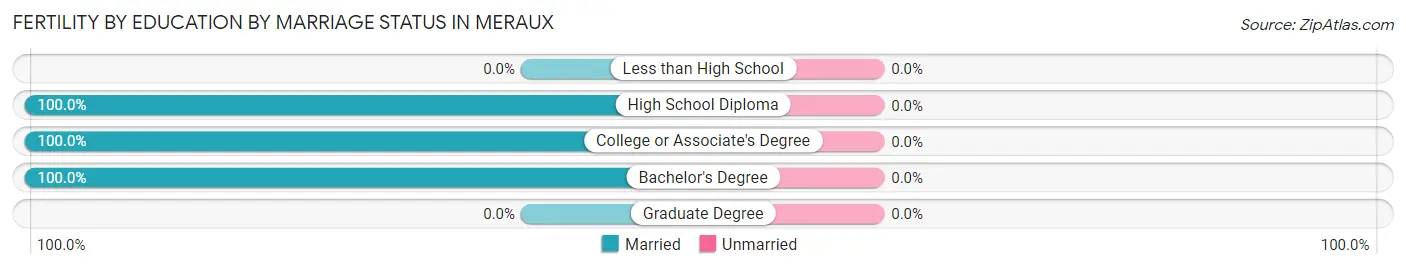
| Educational Attainment | Married | Unmarried |
| Less than High School | 0 (0.0%) | 0 (0.0%) |
| High School Diploma | 9 (100.0%) | 0 (0.0%) |
| College or Associate's Degree | 6 (100.0%) | 0 (0.0%) |
| Bachelor's Degree | 52 (100.0%) | 0 (0.0%) |
| Graduate Degree | 0 (0.0%) | 0 (0.0%) |
| Total | 67 (100.0%) | 0 (0.0%) |
Income in Meraux
Income Overview in Meraux
Per Capita Income in Meraux is $33,226, while median incomes of families and households are $85,972 and $70,707 respectively.
| Characteristic | Number | Measure |
| Per Capita Income | 7,297 | $33,226 |
| Median Family Income | 1,712 | $85,972 |
| Mean Family Income | 1,712 | $104,863 |
| Median Household Income | 2,445 | $70,707 |
| Mean Household Income | 2,445 | $93,653 |
| Income Deficit | 1,712 | $12,854 |
| Wage / Income Gap (%) | 7,297 | 27.46% |
| Wage / Income Gap ($) | 7,297 | 72.54¢ per $1 |
| Gini / Inequality Index | 7,297 | 0.43 |
Earnings by Sex in Meraux
Average Earnings in Meraux are $41,894, $53,000 for men and $38,444 for women, a difference of 27.5%.
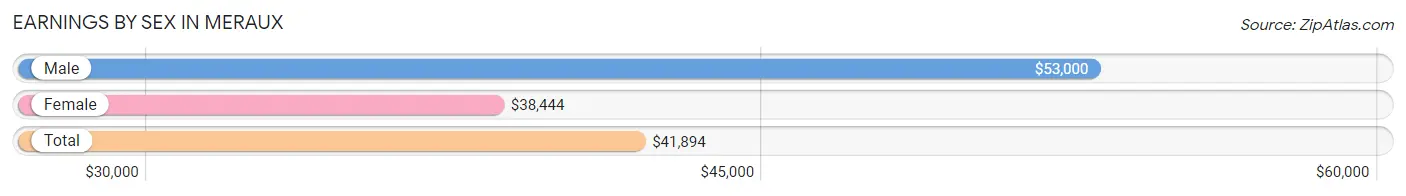
| Sex | Number | Average Earnings |
| Male | 1,994 (48.2%) | $53,000 |
| Female | 2,142 (51.8%) | $38,444 |
| Total | 4,136 (100.0%) | $41,894 |
Earnings by Sex by Income Bracket in Meraux
The most common earnings brackets in Meraux are $100,000+ for men (514 | 25.8%) and $45,000 to $49,999 for women (398 | 18.6%).
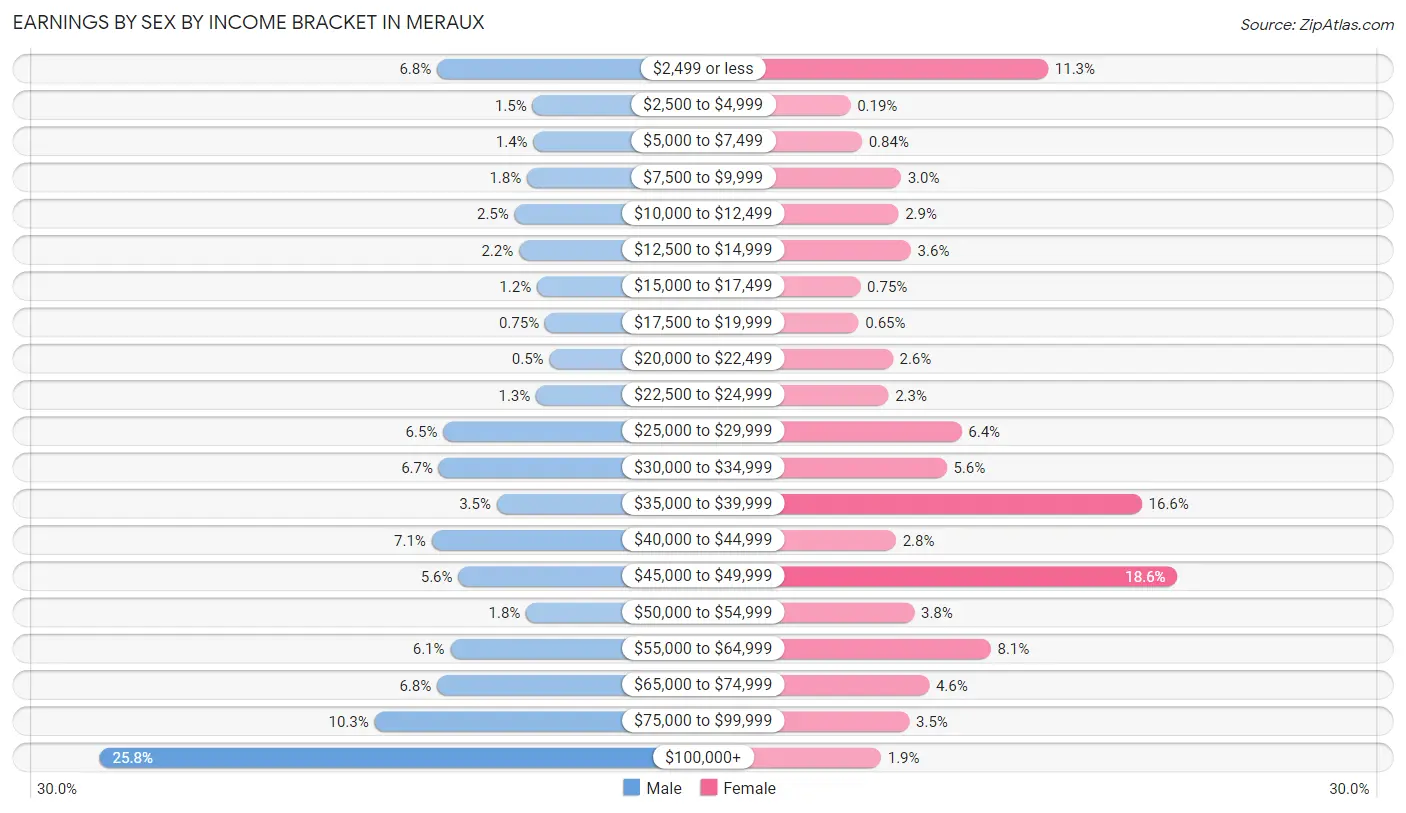
| Income | Male | Female |
| $2,499 or less | 136 (6.8%) | 242 (11.3%) |
| $2,500 to $4,999 | 29 (1.5%) | 4 (0.2%) |
| $5,000 to $7,499 | 28 (1.4%) | 18 (0.8%) |
| $7,500 to $9,999 | 35 (1.8%) | 65 (3.0%) |
| $10,000 to $12,499 | 49 (2.5%) | 62 (2.9%) |
| $12,500 to $14,999 | 44 (2.2%) | 77 (3.6%) |
| $15,000 to $17,499 | 24 (1.2%) | 16 (0.7%) |
| $17,500 to $19,999 | 15 (0.7%) | 14 (0.6%) |
| $20,000 to $22,499 | 10 (0.5%) | 55 (2.6%) |
| $22,500 to $24,999 | 25 (1.3%) | 50 (2.3%) |
| $25,000 to $29,999 | 129 (6.5%) | 138 (6.4%) |
| $30,000 to $34,999 | 134 (6.7%) | 120 (5.6%) |
| $35,000 to $39,999 | 69 (3.5%) | 355 (16.6%) |
| $40,000 to $44,999 | 142 (7.1%) | 59 (2.8%) |
| $45,000 to $49,999 | 112 (5.6%) | 398 (18.6%) |
| $50,000 to $54,999 | 36 (1.8%) | 81 (3.8%) |
| $55,000 to $64,999 | 121 (6.1%) | 173 (8.1%) |
| $65,000 to $74,999 | 136 (6.8%) | 99 (4.6%) |
| $75,000 to $99,999 | 206 (10.3%) | 75 (3.5%) |
| $100,000+ | 514 (25.8%) | 41 (1.9%) |
| Total | 1,994 (100.0%) | 2,142 (100.0%) |
Earnings by Sex by Educational Attainment in Meraux
Average earnings in Meraux are $58,586 for men and $39,689 for women, a difference of 32.3%. Men with an educational attainment of high school diploma enjoy the highest average annual earnings of $95,938, while those with less than high school education earn the least with $42,052. Women with an educational attainment of graduate degree earn the most with the average annual earnings of $53,707, while those with high school diploma education have the smallest earnings of $32,625.
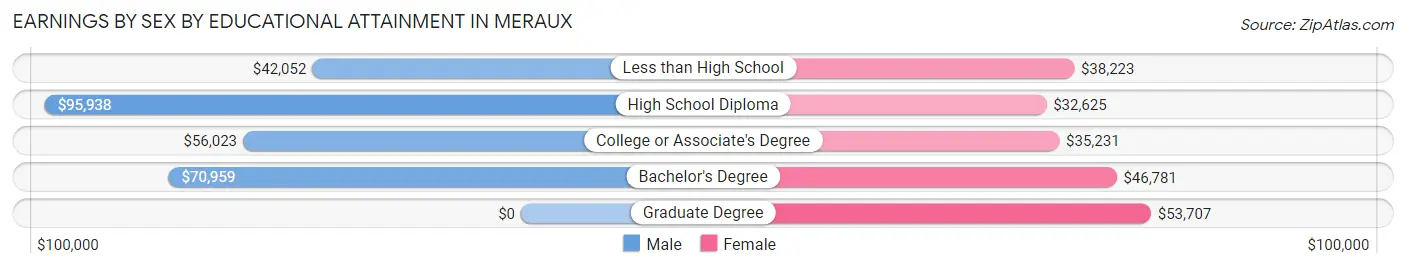
| Educational Attainment | Male Income | Female Income |
| Less than High School | $42,052 | $38,223 |
| High School Diploma | $95,938 | $32,625 |
| College or Associate's Degree | $56,023 | $35,231 |
| Bachelor's Degree | $70,959 | $46,781 |
| Graduate Degree | - | - |
| Total | $58,586 | $39,689 |
Family Income in Meraux
Family Income Brackets in Meraux
According to the Meraux family income data, there are 341 families falling into the $150,000 to $199,999 income range, which is the most common income bracket and makes up 19.9% of all families. Conversely, the $10,000 to $14,999 income bracket is the least frequent group with only 24 families (1.4%) belonging to this category.
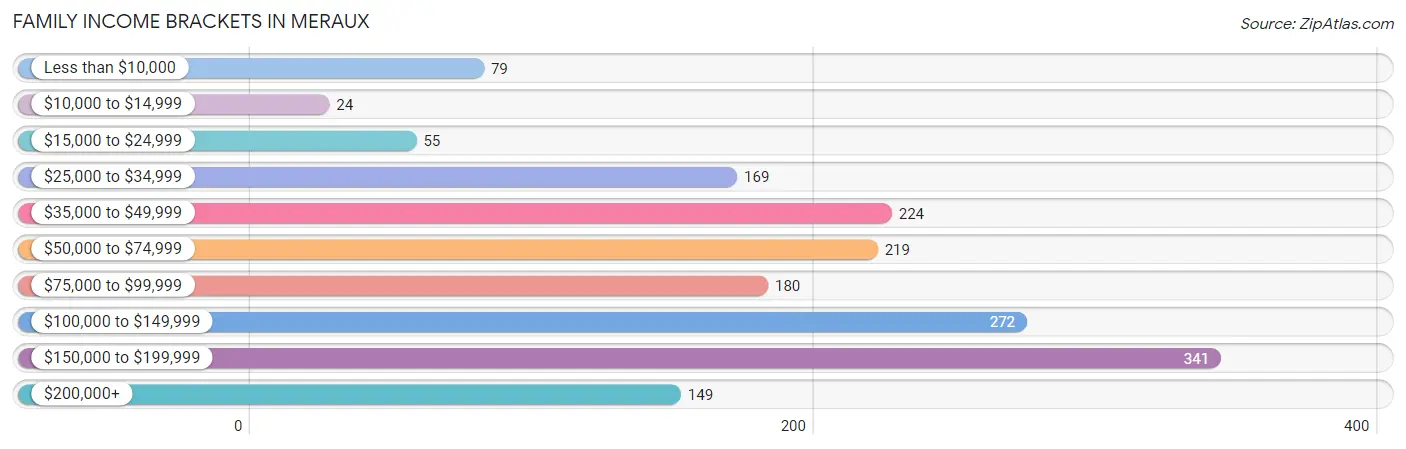
| Income Bracket | # Families | % Families |
| Less than $10,000 | 79 | 4.6% |
| $10,000 to $14,999 | 24 | 1.4% |
| $15,000 to $24,999 | 55 | 3.2% |
| $25,000 to $34,999 | 169 | 9.9% |
| $35,000 to $49,999 | 224 | 13.1% |
| $50,000 to $74,999 | 219 | 12.8% |
| $75,000 to $99,999 | 180 | 10.5% |
| $100,000 to $149,999 | 272 | 15.9% |
| $150,000 to $199,999 | 341 | 19.9% |
| $200,000+ | 149 | 8.7% |
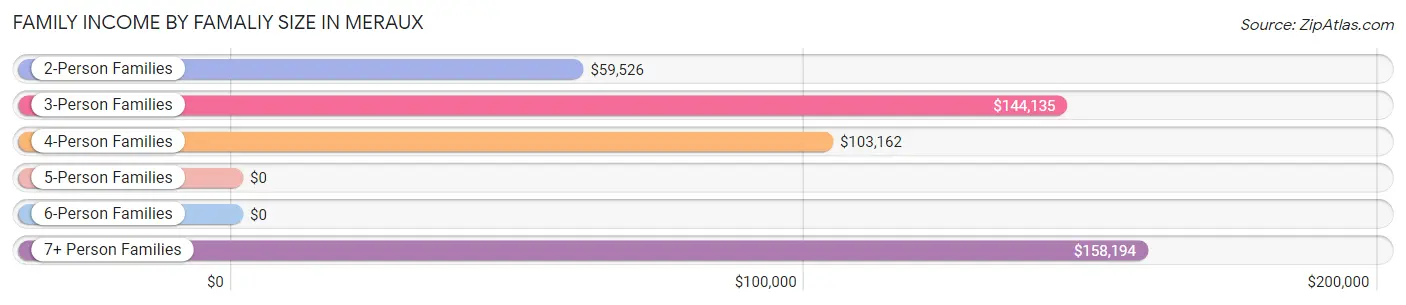
Family Income by Famaliy Size in Meraux
7+ person families (34 | 2.0%) account for the highest median family income in Meraux with $158,194 per family, while 3-person families (545 | 31.8%) have the highest median income of $48,045 per family member.
| Income Bracket | # Families | Median Income |
| 2-Person Families | 563 (32.9%) | $59,526 |
| 3-Person Families | 545 (31.8%) | $144,135 |
| 4-Person Families | 325 (19.0%) | $103,162 |
| 5-Person Families | 115 (6.7%) | $0 |
| 6-Person Families | 130 (7.6%) | $0 |
| 7+ Person Families | 34 (2.0%) | $158,194 |
| Total | 1,712 (100.0%) | $85,972 |
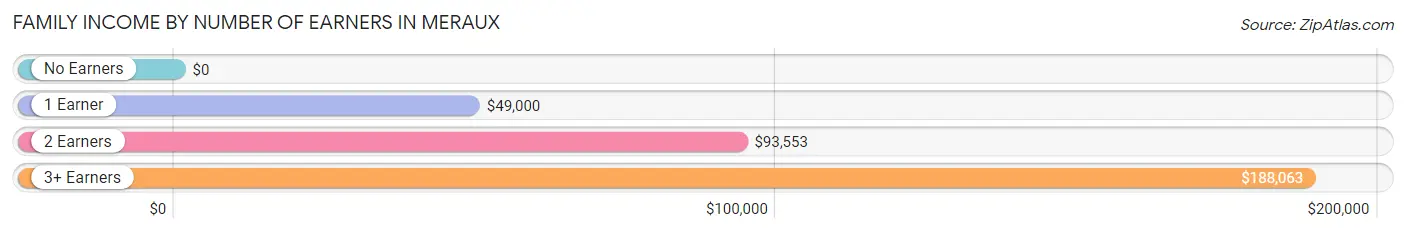
Family Income by Number of Earners in Meraux
| Number of Earners | # Families | Median Income |
| No Earners | 132 (7.7%) | $0 |
| 1 Earner | 502 (29.3%) | $49,000 |
| 2 Earners | 572 (33.4%) | $93,553 |
| 3+ Earners | 506 (29.6%) | $188,063 |
| Total | 1,712 (100.0%) | $85,972 |
Household Income in Meraux
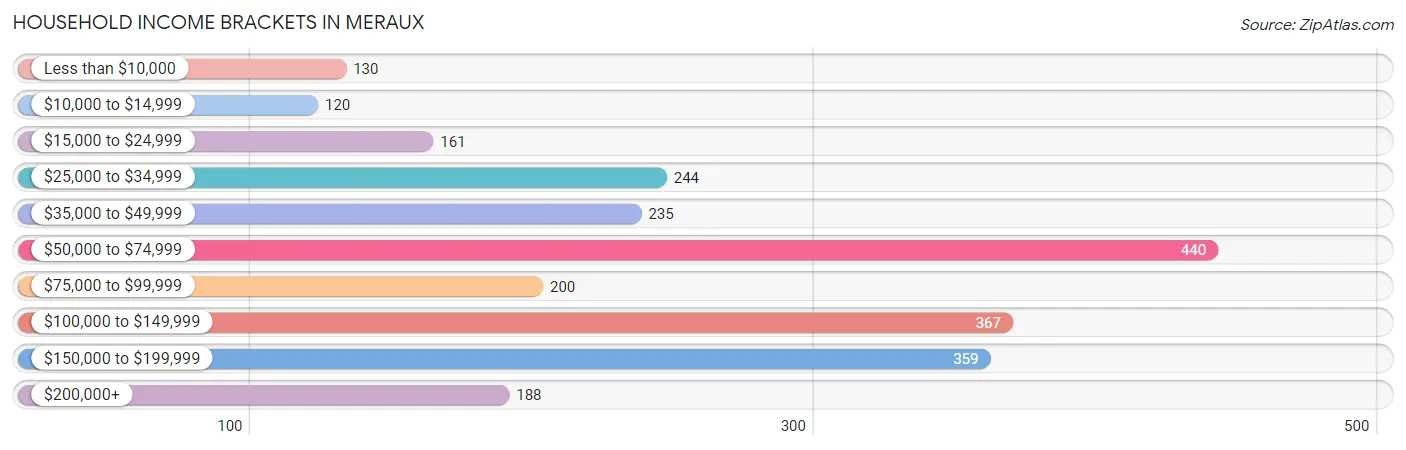
Household Income Brackets in Meraux
With 440 households falling in the category, the $50,000 to $74,999 income range is the most frequent in Meraux, accounting for 18.0% of all households. In contrast, only 120 households (4.9%) fall into the $10,000 to $14,999 income bracket, making it the least populous group.
| Income Bracket | # Households | % Households |
| Less than $10,000 | 130 | 5.3% |
| $10,000 to $14,999 | 120 | 4.9% |
| $15,000 to $24,999 | 161 | 6.6% |
| $25,000 to $34,999 | 244 | 10.0% |
| $35,000 to $49,999 | 235 | 9.6% |
| $50,000 to $74,999 | 440 | 18.0% |
| $75,000 to $99,999 | 200 | 8.2% |
| $100,000 to $149,999 | 367 | 15.0% |
| $150,000 to $199,999 | 359 | 14.7% |
| $200,000+ | 188 | 7.7% |
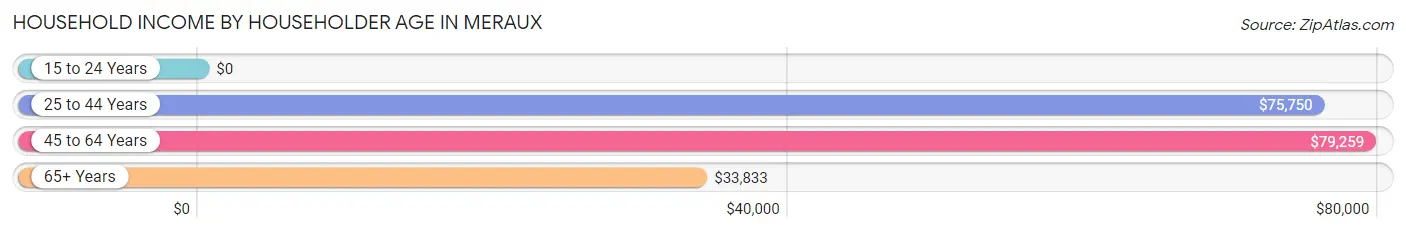
Household Income by Householder Age in Meraux
The median household income in Meraux is $70,707, with the highest median household income of $79,259 found in the 45 to 64 years age bracket for the primary householder. A total of 1,164 households (47.6%) fall into this category. Meanwhile, the 15 to 24 years age bracket for the primary householder has the lowest median household income of $0, with 8 households (0.3%) in this group.
| Income Bracket | # Households | Median Income |
| 15 to 24 Years | 8 (0.3%) | $0 |
| 25 to 44 Years | 837 (34.2%) | $75,750 |
| 45 to 64 Years | 1,164 (47.6%) | $79,259 |
| 65+ Years | 436 (17.8%) | $33,833 |
| Total | 2,445 (100.0%) | $70,707 |
Poverty in Meraux
Income Below Poverty by Sex and Age in Meraux
With 14.8% poverty level for males and 20.1% for females among the residents of Meraux, 16 and 17 year old males and 5 year old females are the most vulnerable to poverty, with 48 males (42.5%) and 34 females (44.2%) in their respective age groups living below the poverty level.
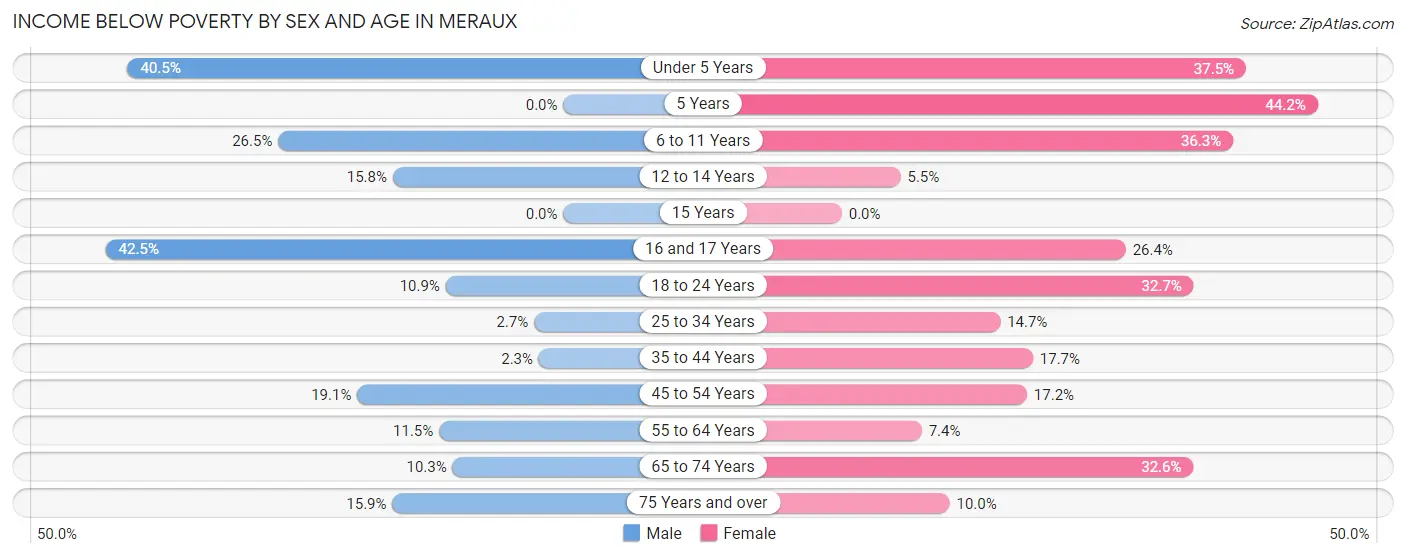
| Age Bracket | Male | Female |
| Under 5 Years | 125 (40.5%) | 45 (37.5%) |
| 5 Years | 0 (0.0%) | 34 (44.2%) |
| 6 to 11 Years | 68 (26.5%) | 126 (36.3%) |
| 12 to 14 Years | 38 (15.8%) | 9 (5.4%) |
| 15 Years | 0 (0.0%) | 0 (0.0%) |
| 16 and 17 Years | 48 (42.5%) | 44 (26.4%) |
| 18 to 24 Years | 19 (10.9%) | 112 (32.7%) |
| 25 to 34 Years | 10 (2.7%) | 51 (14.7%) |
| 35 to 44 Years | 14 (2.3%) | 150 (17.7%) |
| 45 to 54 Years | 79 (19.1%) | 67 (17.2%) |
| 55 to 64 Years | 71 (11.5%) | 46 (7.4%) |
| 65 to 74 Years | 22 (10.3%) | 61 (32.6%) |
| 75 Years and over | 20 (15.9%) | 17 (10.0%) |
| Total | 514 (14.8%) | 762 (20.1%) |
Income Above Poverty by Sex and Age in Meraux
According to the poverty statistics in Meraux, males aged 5 years and females aged 15 years are the age groups that are most secure financially, with 100.0% of males and 100.0% of females in these age groups living above the poverty line.
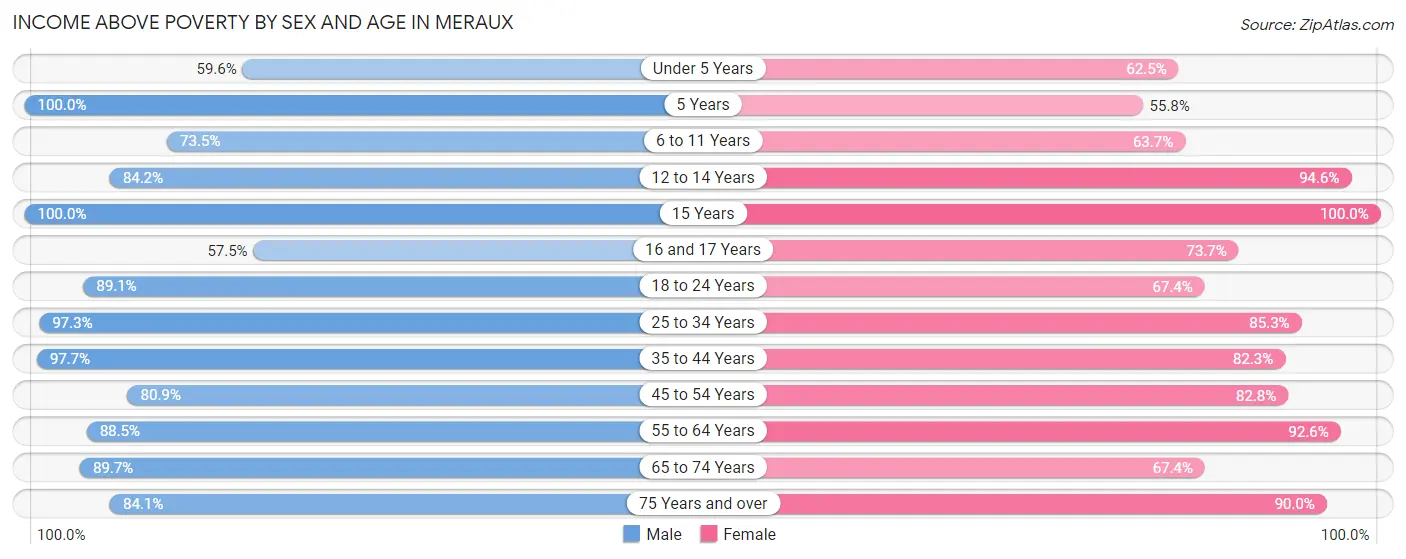
| Age Bracket | Male | Female |
| Under 5 Years | 184 (59.6%) | 75 (62.5%) |
| 5 Years | 14 (100.0%) | 43 (55.8%) |
| 6 to 11 Years | 189 (73.5%) | 221 (63.7%) |
| 12 to 14 Years | 202 (84.2%) | 156 (94.6%) |
| 15 Years | 21 (100.0%) | 14 (100.0%) |
| 16 and 17 Years | 65 (57.5%) | 123 (73.7%) |
| 18 to 24 Years | 155 (89.1%) | 231 (67.3%) |
| 25 to 34 Years | 357 (97.3%) | 296 (85.3%) |
| 35 to 44 Years | 602 (97.7%) | 696 (82.3%) |
| 45 to 54 Years | 334 (80.9%) | 323 (82.8%) |
| 55 to 64 Years | 545 (88.5%) | 574 (92.6%) |
| 65 to 74 Years | 192 (89.7%) | 126 (67.4%) |
| 75 Years and over | 106 (84.1%) | 153 (90.0%) |
| Total | 2,966 (85.2%) | 3,031 (79.9%) |
Income Below Poverty Among Married-Couple Families in Meraux
The poverty statistics for married-couple families in Meraux show that 5.8% or 72 of the total 1,249 families live below the poverty line. Families with 1 or 2 children have the highest poverty rate of 11.4%, comprising of 43 families. On the other hand, families with 5 or more children have the lowest poverty rate of 0.0%, which includes 0 families.
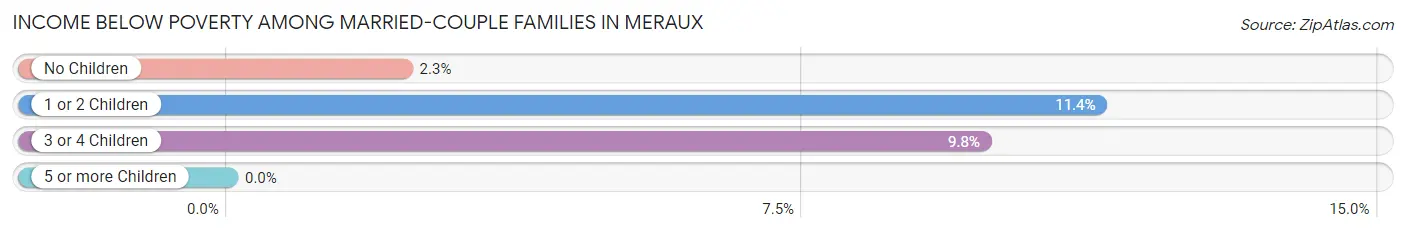
| Children | Above Poverty | Below Poverty |
| No Children | 727 (97.7%) | 17 (2.3%) |
| 1 or 2 Children | 336 (88.6%) | 43 (11.4%) |
| 3 or 4 Children | 110 (90.2%) | 12 (9.8%) |
| 5 or more Children | 4 (100.0%) | 0 (0.0%) |
| Total | 1,177 (94.2%) | 72 (5.8%) |
Income Below Poverty Among Single-Parent Households in Meraux
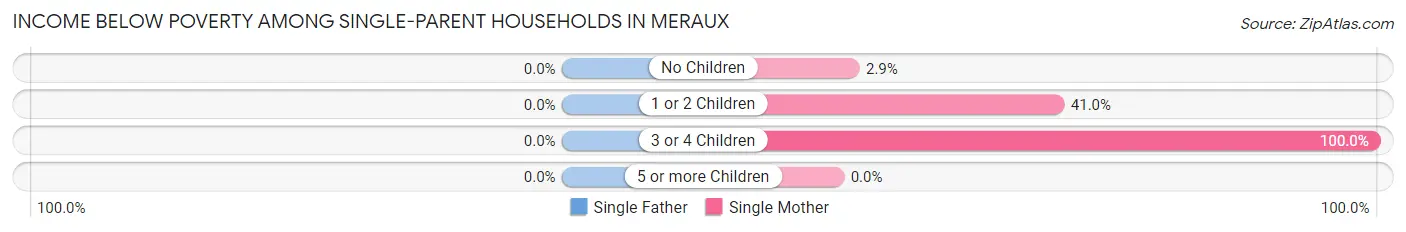
| Children | Single Father | Single Mother |
| No Children | 0 (0.0%) | 3 (2.9%) |
| 1 or 2 Children | 0 (0.0%) | 73 (41.0%) |
| 3 or 4 Children | 0 (0.0%) | 72 (100.0%) |
| 5 or more Children | 0 (0.0%) | 0 (0.0%) |
| Total | 0 (0.0%) | 148 (41.7%) |
Income Below Poverty Among Married-Couple vs Single-Parent Households in Meraux
The poverty data for Meraux shows that 72 of the married-couple family households (5.8%) and 148 of the single-parent households (32.0%) are living below the poverty level. Within the married-couple family households, those with 1 or 2 children have the highest poverty rate, with 43 households (11.4%) falling below the poverty line. Among the single-parent households, those with 3 or 4 children have the highest poverty rate, with 72 household (79.1%) living below poverty.
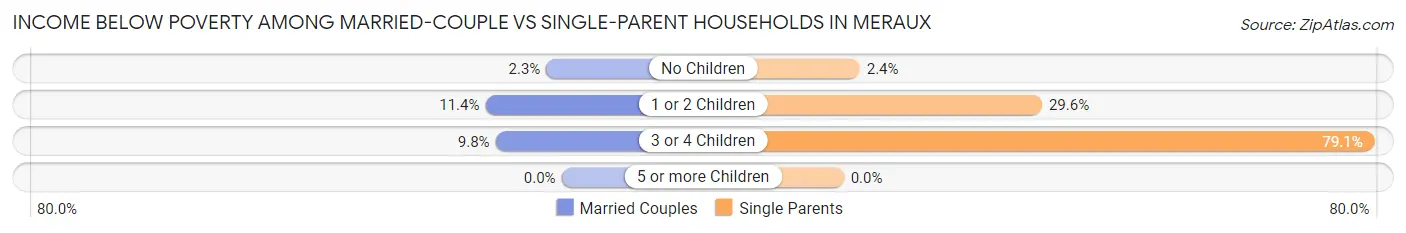
| Children | Married-Couple Families | Single-Parent Households |
| No Children | 17 (2.3%) | 3 (2.4%) |
| 1 or 2 Children | 43 (11.4%) | 73 (29.5%) |
| 3 or 4 Children | 12 (9.8%) | 72 (79.1%) |
| 5 or more Children | 0 (0.0%) | 0 (0.0%) |
| Total | 72 (5.8%) | 148 (32.0%) |
Employment Characteristics in Meraux
Employment by Class of Employer in Meraux
Among the 3,707 employed individuals in Meraux, private company employees (2,322 | 62.6%), local government employees (544 | 14.7%), and not-for-profit organizations (329 | 8.9%) make up the most common classes of employment.
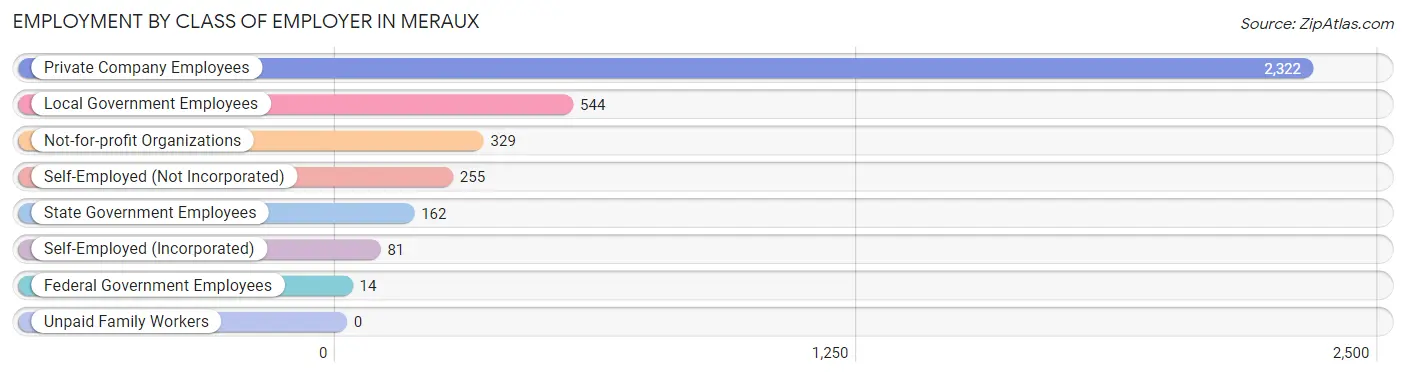
| Employer Class | # Employees | % Employees |
| Private Company Employees | 2,322 | 62.6% |
| Self-Employed (Incorporated) | 81 | 2.2% |
| Self-Employed (Not Incorporated) | 255 | 6.9% |
| Not-for-profit Organizations | 329 | 8.9% |
| Local Government Employees | 544 | 14.7% |
| State Government Employees | 162 | 4.4% |
| Federal Government Employees | 14 | 0.4% |
| Unpaid Family Workers | 0 | 0.0% |
| Total | 3,707 | 100.0% |
Employment Status by Age in Meraux
According to the labor force statistics for Meraux, out of the total population over 16 years of age (5,709), 68.4% or 3,905 individuals are in the labor force, with 3.5% or 137 of them unemployed. The age group with the highest labor force participation rate is 25 to 29 years, with 98.6% or 276 individuals in the labor force. Within the labor force, the 25 to 29 years age range has the highest percentage of unemployed individuals, with 35.1% or 97 of them being unemployed.
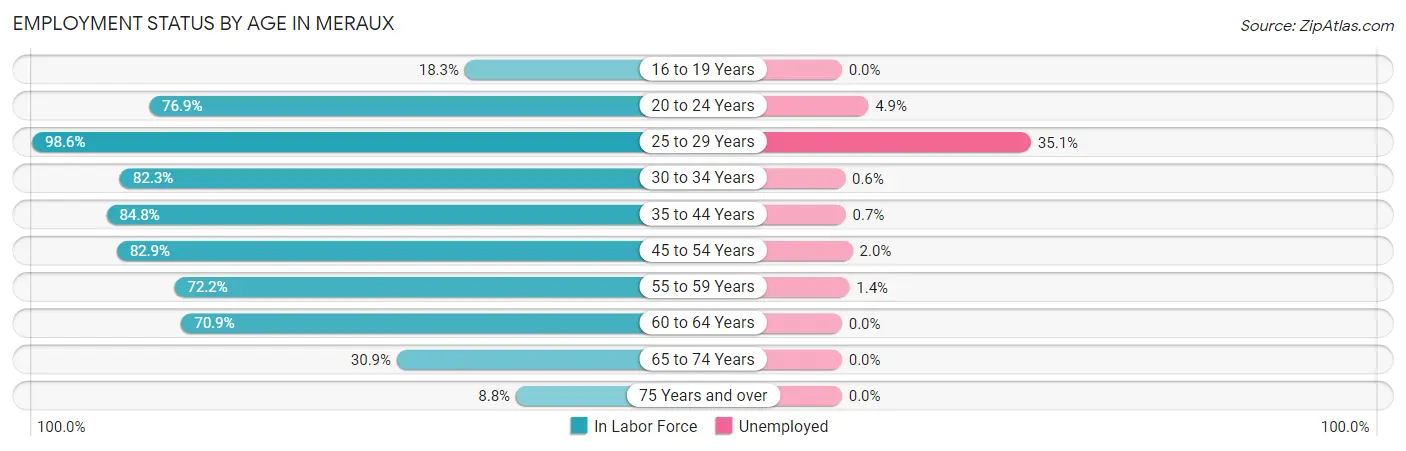
| Age Bracket | In Labor Force | Unemployed |
| 16 to 19 Years | 87 (18.3%) | 0 (0.0%) |
| 20 to 24 Years | 247 (76.9%) | 12 (4.9%) |
| 25 to 29 Years | 276 (98.6%) | 97 (35.1%) |
| 30 to 34 Years | 357 (82.3%) | 2 (0.6%) |
| 35 to 44 Years | 1,240 (84.8%) | 9 (0.7%) |
| 45 to 54 Years | 666 (82.9%) | 13 (2.0%) |
| 55 to 59 Years | 285 (72.2%) | 4 (1.4%) |
| 60 to 64 Years | 596 (70.9%) | 0 (0.0%) |
| 65 to 74 Years | 124 (30.9%) | 0 (0.0%) |
| 75 Years and over | 26 (8.8%) | 0 (0.0%) |
| Total | 3,905 (68.4%) | 137 (3.5%) |
Employment Status by Educational Attainment in Meraux
According to labor force statistics for Meraux, 81.1% of individuals (3,418) out of the total population between 25 and 64 years of age (4,215) are in the labor force, with 3.7% or 126 of them being unemployed. The group with the highest labor force participation rate are those with the educational attainment of bachelor's degree or higher, with 90.8% or 952 individuals in the labor force. Within the labor force, individuals with less than high school education have the highest percentage of unemployment, with 15.0% or 70 of them being unemployed.
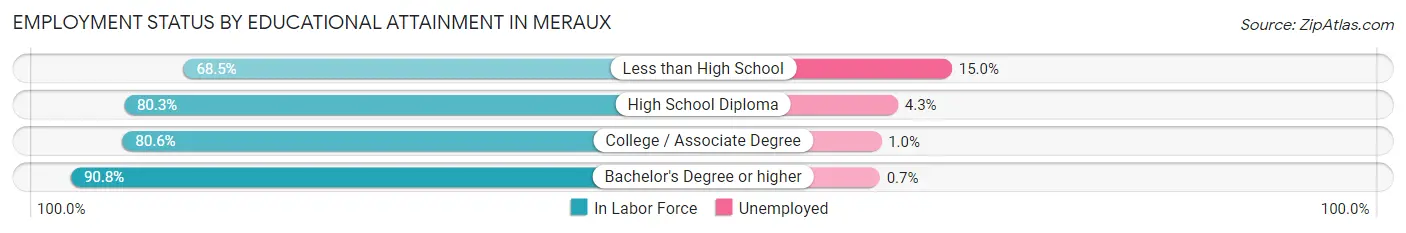
| Educational Attainment | In Labor Force | Unemployed |
| Less than High School | 468 (68.5%) | 102 (15.0%) |
| High School Diploma | 870 (80.3%) | 47 (4.3%) |
| College / Associate Degree | 1,128 (80.6%) | 14 (1.0%) |
| Bachelor's Degree or higher | 952 (90.8%) | 7 (0.7%) |
| Total | 3,418 (81.1%) | 156 (3.7%) |
Employment Occupations by Sex in Meraux
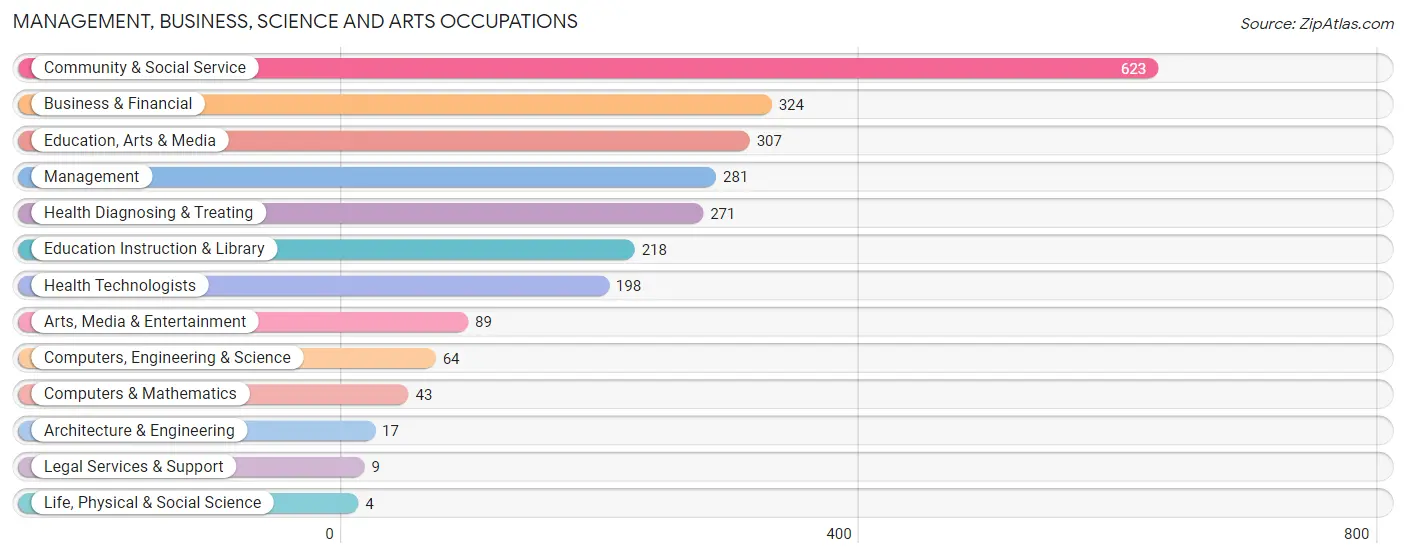
Management, Business, Science and Arts Occupations
The most common Management, Business, Science and Arts occupations in Meraux are Community & Social Service (623 | 16.5%), Business & Financial (324 | 8.6%), Education, Arts & Media (307 | 8.2%), Management (281 | 7.5%), and Health Diagnosing & Treating (271 | 7.2%).
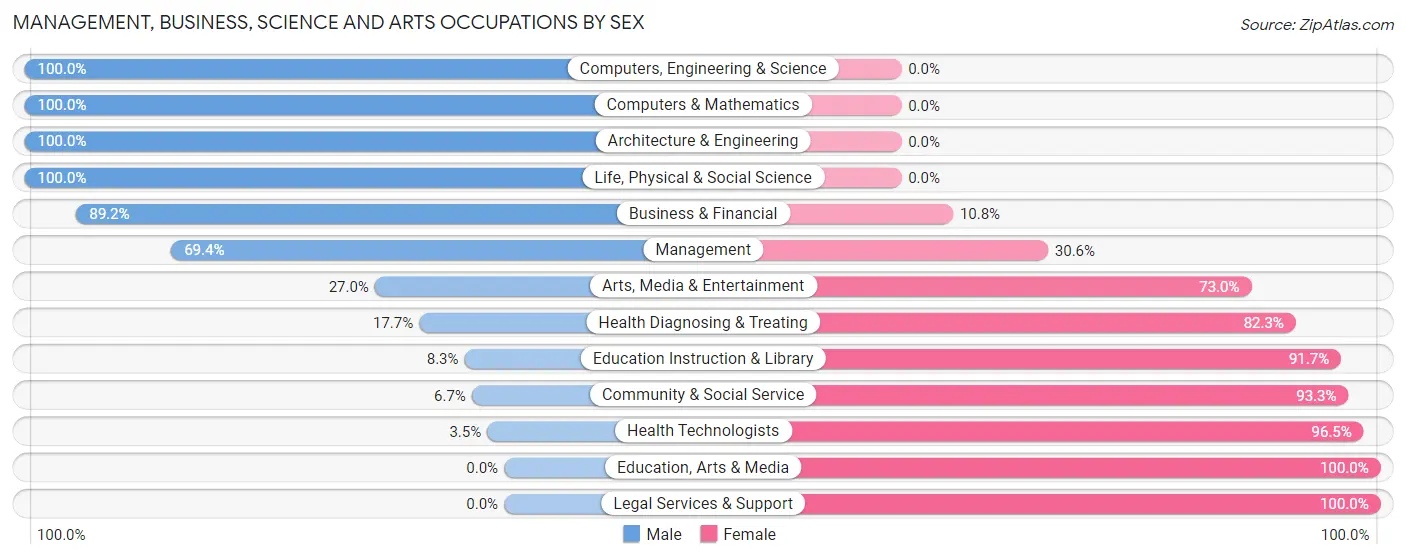
Management, Business, Science and Arts Occupations by Sex
Within the Management, Business, Science and Arts occupations in Meraux, the most male-oriented occupations are Computers, Engineering & Science (100.0%), Computers & Mathematics (100.0%), and Architecture & Engineering (100.0%), while the most female-oriented occupations are Education, Arts & Media (100.0%), Legal Services & Support (100.0%), and Health Technologists (96.5%).
| Occupation | Male | Female |
| Management | 195 (69.4%) | 86 (30.6%) |
| Business & Financial | 289 (89.2%) | 35 (10.8%) |
| Computers, Engineering & Science | 64 (100.0%) | 0 (0.0%) |
| Computers & Mathematics | 43 (100.0%) | 0 (0.0%) |
| Architecture & Engineering | 17 (100.0%) | 0 (0.0%) |
| Life, Physical & Social Science | 4 (100.0%) | 0 (0.0%) |
| Community & Social Service | 42 (6.7%) | 581 (93.3%) |
| Education, Arts & Media | 0 (0.0%) | 307 (100.0%) |
| Legal Services & Support | 0 (0.0%) | 9 (100.0%) |
| Education Instruction & Library | 18 (8.3%) | 200 (91.7%) |
| Arts, Media & Entertainment | 24 (27.0%) | 65 (73.0%) |
| Health Diagnosing & Treating | 48 (17.7%) | 223 (82.3%) |
| Health Technologists | 7 (3.5%) | 191 (96.5%) |
| Total (Category) | 638 (40.8%) | 925 (59.2%) |
| Total (Overall) | 1,781 (47.3%) | 1,986 (52.7%) |
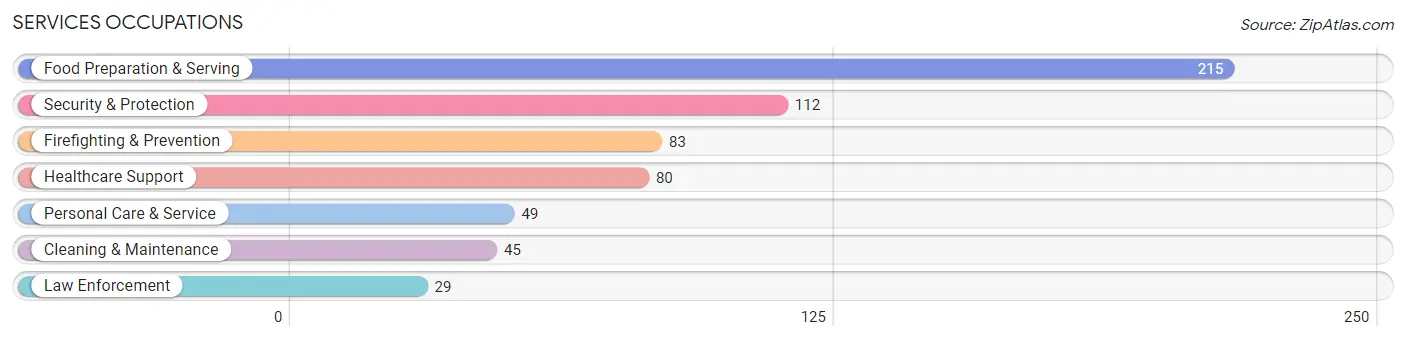
Services Occupations
The most common Services occupations in Meraux are Food Preparation & Serving (215 | 5.7%), Security & Protection (112 | 3.0%), Firefighting & Prevention (83 | 2.2%), Healthcare Support (80 | 2.1%), and Personal Care & Service (49 | 1.3%).
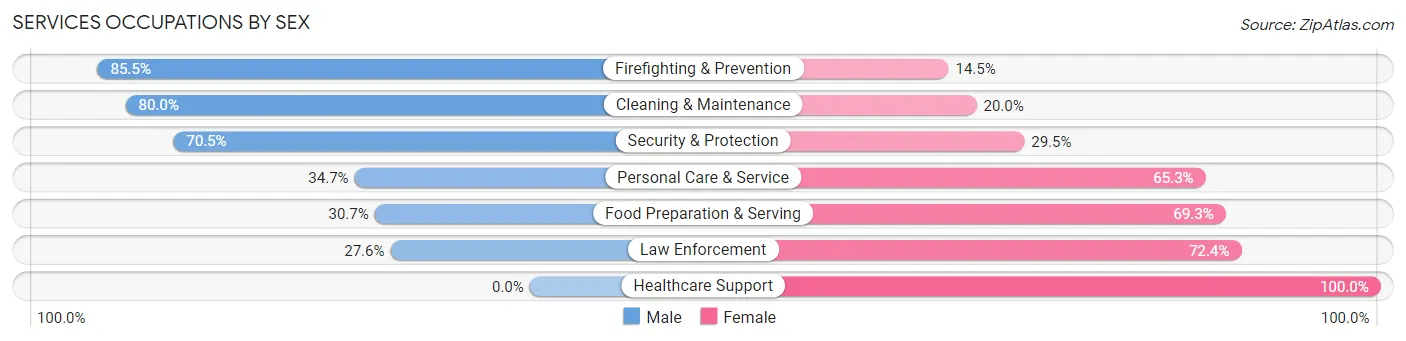
Services Occupations by Sex
Within the Services occupations in Meraux, the most male-oriented occupations are Firefighting & Prevention (85.5%), Cleaning & Maintenance (80.0%), and Security & Protection (70.5%), while the most female-oriented occupations are Healthcare Support (100.0%), Law Enforcement (72.4%), and Food Preparation & Serving (69.3%).
| Occupation | Male | Female |
| Healthcare Support | 0 (0.0%) | 80 (100.0%) |
| Security & Protection | 79 (70.5%) | 33 (29.5%) |
| Firefighting & Prevention | 71 (85.5%) | 12 (14.5%) |
| Law Enforcement | 8 (27.6%) | 21 (72.4%) |
| Food Preparation & Serving | 66 (30.7%) | 149 (69.3%) |
| Cleaning & Maintenance | 36 (80.0%) | 9 (20.0%) |
| Personal Care & Service | 17 (34.7%) | 32 (65.3%) |
| Total (Category) | 198 (39.5%) | 303 (60.5%) |
| Total (Overall) | 1,781 (47.3%) | 1,986 (52.7%) |
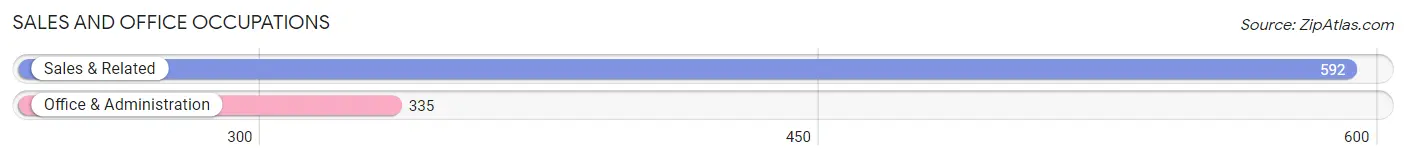
Sales and Office Occupations
The most common Sales and Office occupations in Meraux are Sales & Related (592 | 15.7%), and Office & Administration (335 | 8.9%).
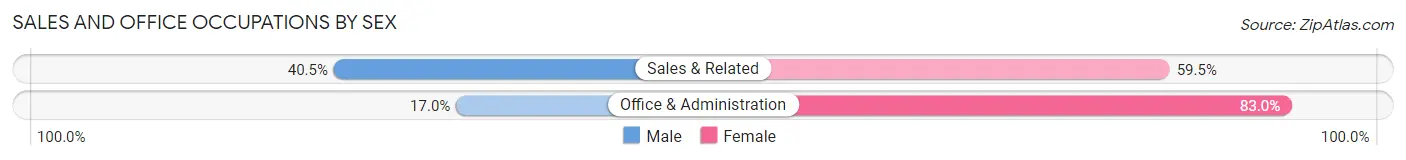
Sales and Office Occupations by Sex
| Occupation | Male | Female |
| Sales & Related | 240 (40.5%) | 352 (59.5%) |
| Office & Administration | 57 (17.0%) | 278 (83.0%) |
| Total (Category) | 297 (32.0%) | 630 (68.0%) |
| Total (Overall) | 1,781 (47.3%) | 1,986 (52.7%) |
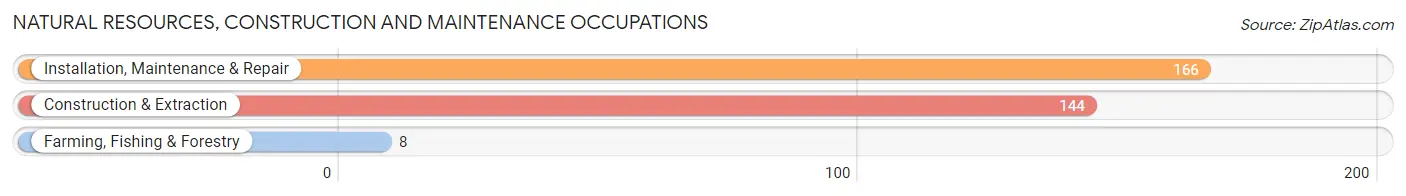
Natural Resources, Construction and Maintenance Occupations
The most common Natural Resources, Construction and Maintenance occupations in Meraux are Installation, Maintenance & Repair (166 | 4.4%), Construction & Extraction (144 | 3.8%), and Farming, Fishing & Forestry (8 | 0.2%).
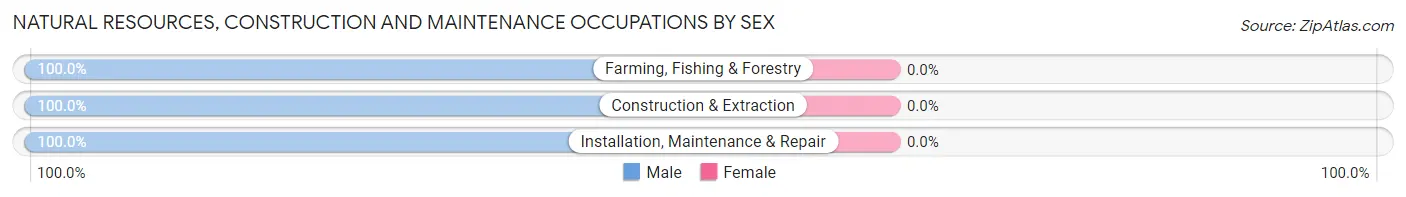
Natural Resources, Construction and Maintenance Occupations by Sex
| Occupation | Male | Female |
| Farming, Fishing & Forestry | 8 (100.0%) | 0 (0.0%) |
| Construction & Extraction | 144 (100.0%) | 0 (0.0%) |
| Installation, Maintenance & Repair | 166 (100.0%) | 0 (0.0%) |
| Total (Category) | 318 (100.0%) | 0 (0.0%) |
| Total (Overall) | 1,781 (47.3%) | 1,986 (52.7%) |
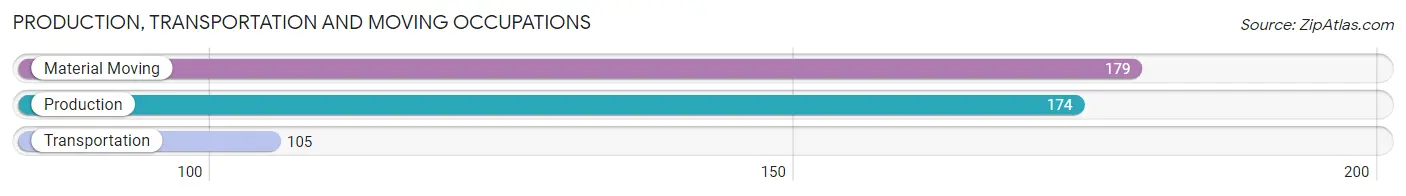
Production, Transportation and Moving Occupations
The most common Production, Transportation and Moving occupations in Meraux are Material Moving (179 | 4.8%), Production (174 | 4.6%), and Transportation (105 | 2.8%).
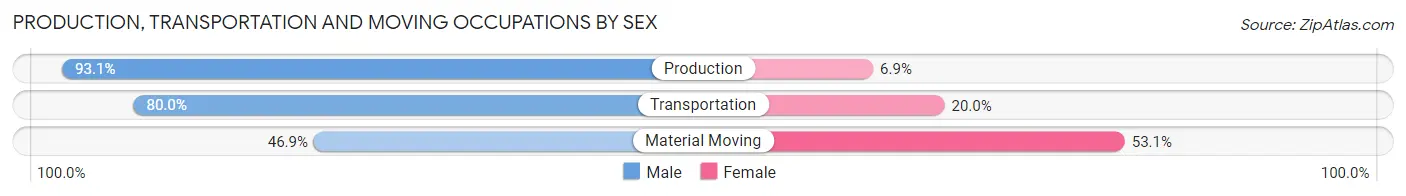
Production, Transportation and Moving Occupations by Sex
| Occupation | Male | Female |
| Production | 162 (93.1%) | 12 (6.9%) |
| Transportation | 84 (80.0%) | 21 (20.0%) |
| Material Moving | 84 (46.9%) | 95 (53.1%) |
| Total (Category) | 330 (72.1%) | 128 (28.0%) |
| Total (Overall) | 1,781 (47.3%) | 1,986 (52.7%) |
Employment Industries by Sex in Meraux
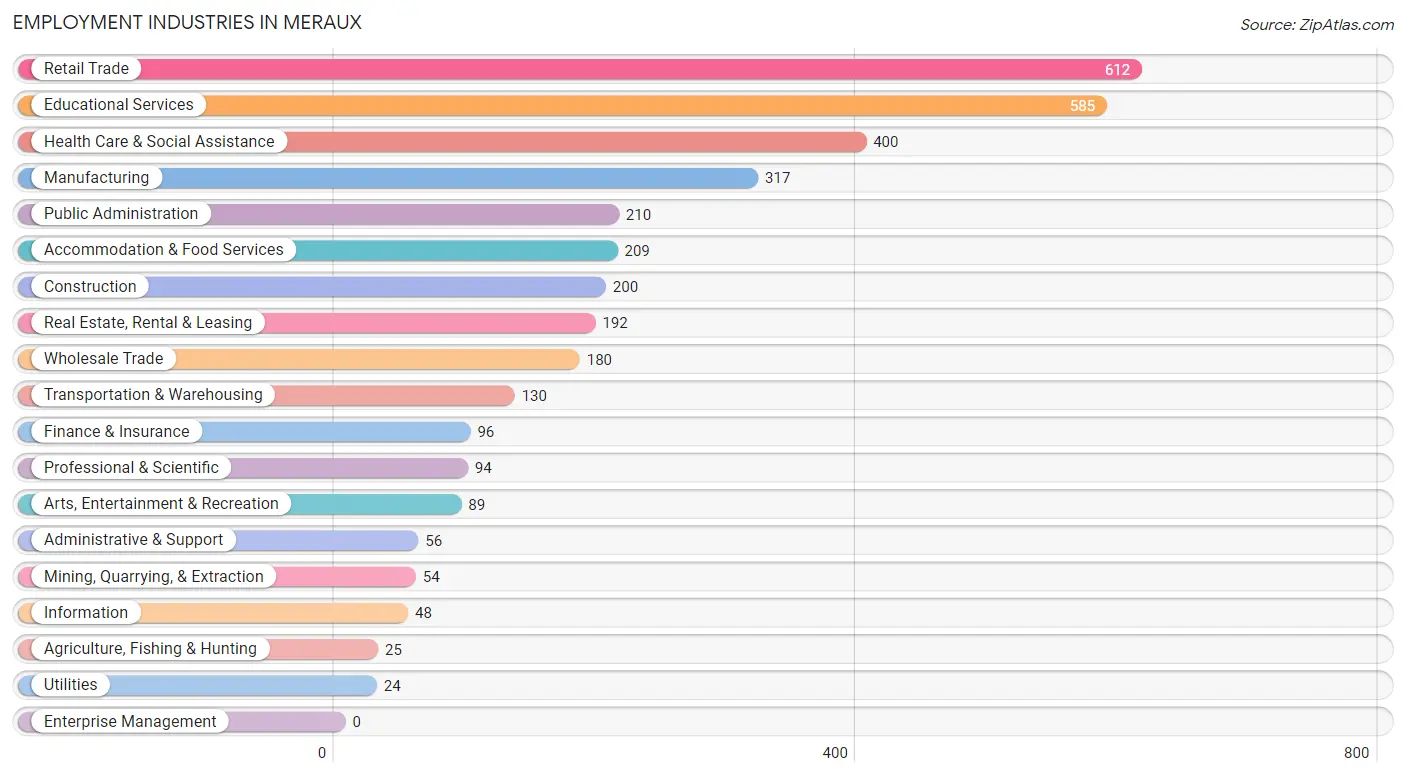
Employment Industries in Meraux
The major employment industries in Meraux include Retail Trade (612 | 16.3%), Educational Services (585 | 15.5%), Health Care & Social Assistance (400 | 10.6%), Manufacturing (317 | 8.4%), and Public Administration (210 | 5.6%).
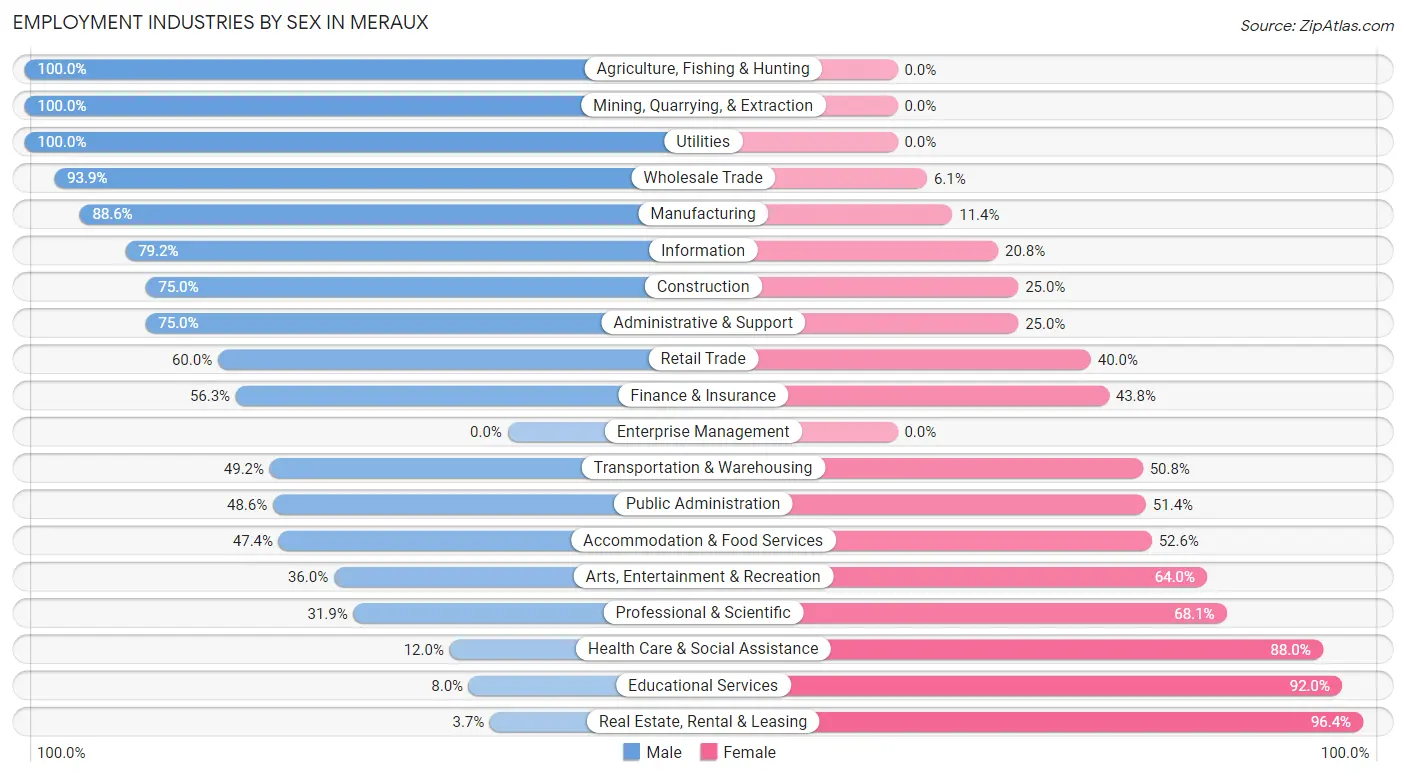
Employment Industries by Sex in Meraux
The Meraux industries that see more men than women are Agriculture, Fishing & Hunting (100.0%), Mining, Quarrying, & Extraction (100.0%), and Utilities (100.0%), whereas the industries that tend to have a higher number of women are Real Estate, Rental & Leasing (96.4%), Educational Services (92.0%), and Health Care & Social Assistance (88.0%).
| Industry | Male | Female |
| Agriculture, Fishing & Hunting | 25 (100.0%) | 0 (0.0%) |
| Mining, Quarrying, & Extraction | 54 (100.0%) | 0 (0.0%) |
| Construction | 150 (75.0%) | 50 (25.0%) |
| Manufacturing | 281 (88.6%) | 36 (11.4%) |
| Wholesale Trade | 169 (93.9%) | 11 (6.1%) |
| Retail Trade | 367 (60.0%) | 245 (40.0%) |
| Transportation & Warehousing | 64 (49.2%) | 66 (50.8%) |
| Utilities | 24 (100.0%) | 0 (0.0%) |
| Information | 38 (79.2%) | 10 (20.8%) |
| Finance & Insurance | 54 (56.2%) | 42 (43.8%) |
| Real Estate, Rental & Leasing | 7 (3.6%) | 185 (96.4%) |
| Professional & Scientific | 30 (31.9%) | 64 (68.1%) |
| Enterprise Management | 0 (0.0%) | 0 (0.0%) |
| Administrative & Support | 42 (75.0%) | 14 (25.0%) |
| Educational Services | 47 (8.0%) | 538 (92.0%) |
| Health Care & Social Assistance | 48 (12.0%) | 352 (88.0%) |
| Arts, Entertainment & Recreation | 32 (36.0%) | 57 (64.0%) |
| Accommodation & Food Services | 99 (47.4%) | 110 (52.6%) |
| Public Administration | 102 (48.6%) | 108 (51.4%) |
| Total | 1,781 (47.3%) | 1,986 (52.7%) |
Education in Meraux
School Enrollment in Meraux
The most common levels of schooling among the 1,942 students in Meraux are elementary school (488 | 25.1%), middle school (476 | 24.5%), and high school (419 | 21.6%).
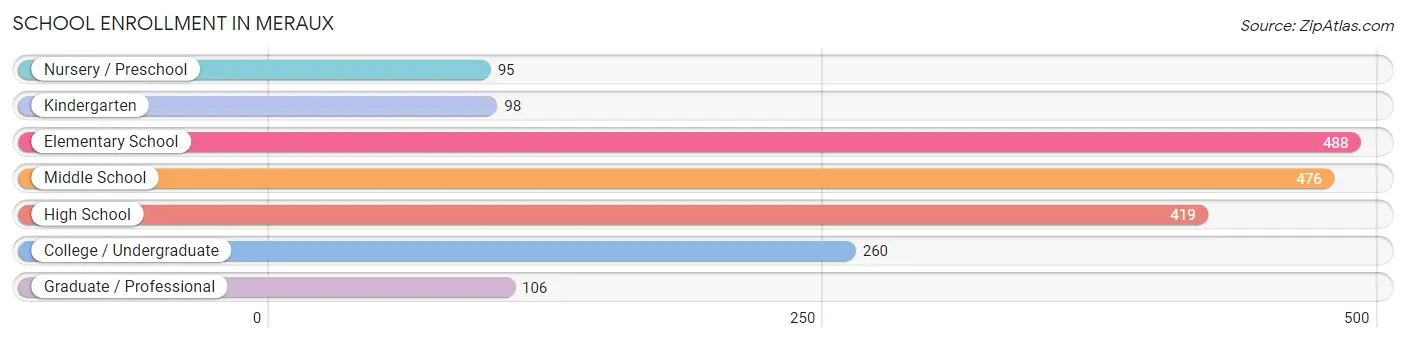
| School Level | # Students | % Students |
| Nursery / Preschool | 95 | 4.9% |
| Kindergarten | 98 | 5.1% |
| Elementary School | 488 | 25.1% |
| Middle School | 476 | 24.5% |
| High School | 419 | 21.6% |
| College / Undergraduate | 260 | 13.4% |
| Graduate / Professional | 106 | 5.5% |
| Total | 1,942 | 100.0% |
School Enrollment by Age by Funding Source in Meraux
Out of a total of 1,942 students who are enrolled in schools in Meraux, 383 (19.7%) attend a private institution, while the remaining 1,559 (80.3%) are enrolled in public schools. The age group of 25 to 34 year olds has the highest likelihood of being enrolled in private schools, with 23 (82.1% in the age bracket) enrolled. Conversely, the age group of 5 to 9 year old has the lowest likelihood of being enrolled in a private school, with 559 (94.8% in the age bracket) attending a public institution.
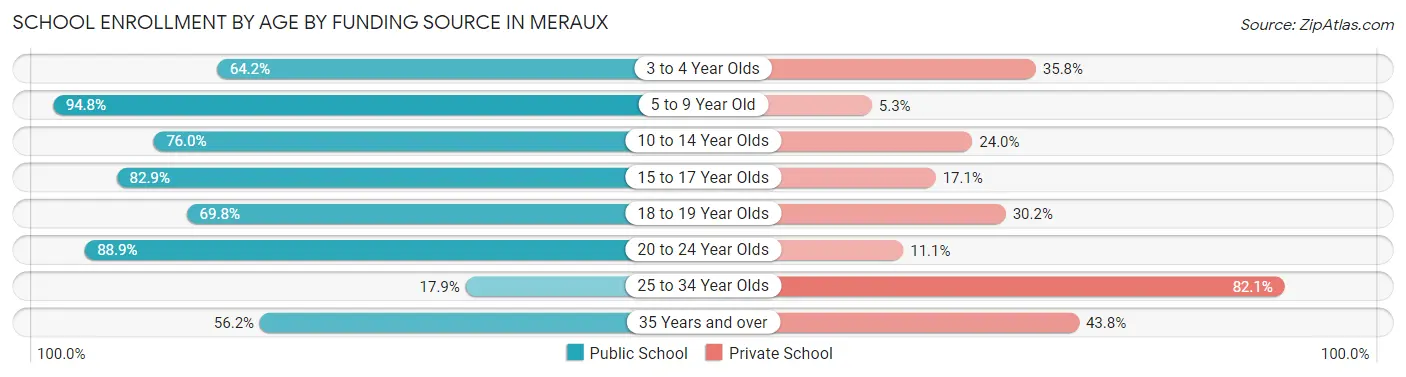
| Age Bracket | Public School | Private School |
| 3 to 4 Year Olds | 52 (64.2%) | 29 (35.8%) |
| 5 to 9 Year Old | 559 (94.8%) | 31 (5.2%) |
| 10 to 14 Year Olds | 406 (76.0%) | 128 (24.0%) |
| 15 to 17 Year Olds | 261 (82.9%) | 54 (17.1%) |
| 18 to 19 Year Olds | 74 (69.8%) | 32 (30.2%) |
| 20 to 24 Year Olds | 112 (88.9%) | 14 (11.1%) |
| 25 to 34 Year Olds | 5 (17.9%) | 23 (82.1%) |
| 35 Years and over | 91 (56.2%) | 71 (43.8%) |
| Total | 1,559 (80.3%) | 383 (19.7%) |
Educational Attainment by Field of Study in Meraux
Education (388 | 33.6%), business (206 | 17.8%), science & technology (161 | 14.0%), social sciences (76 | 6.6%), and physical & health sciences (63 | 5.5%) are the most common fields of study among 1,154 individuals in Meraux who have obtained a bachelor's degree or higher.
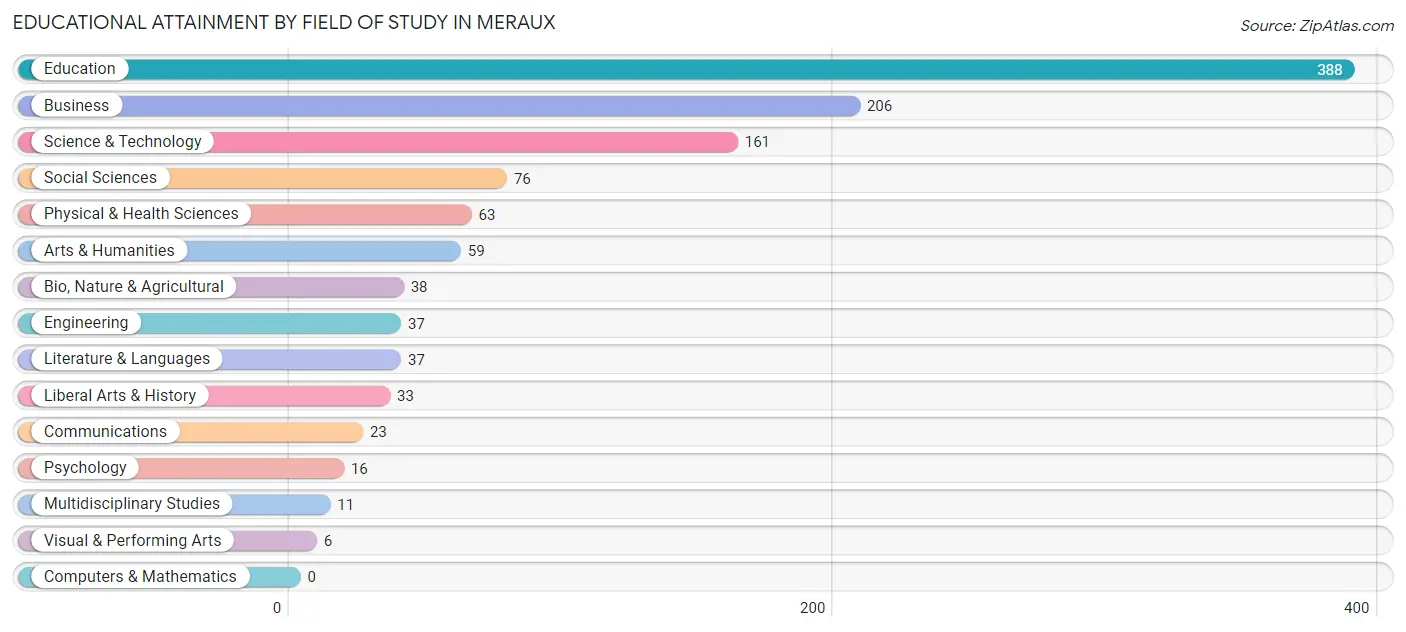
| Field of Study | # Graduates | % Graduates |
| Computers & Mathematics | 0 | 0.0% |
| Bio, Nature & Agricultural | 38 | 3.3% |
| Physical & Health Sciences | 63 | 5.5% |
| Psychology | 16 | 1.4% |
| Social Sciences | 76 | 6.6% |
| Engineering | 37 | 3.2% |
| Multidisciplinary Studies | 11 | 0.9% |
| Science & Technology | 161 | 14.0% |
| Business | 206 | 17.8% |
| Education | 388 | 33.6% |
| Literature & Languages | 37 | 3.2% |
| Liberal Arts & History | 33 | 2.9% |
| Visual & Performing Arts | 6 | 0.5% |
| Communications | 23 | 2.0% |
| Arts & Humanities | 59 | 5.1% |
| Total | 1,154 | 100.0% |
Transportation & Commute in Meraux
Vehicle Availability by Sex in Meraux
The most prevalent vehicle ownership categories in Meraux are males with 2 vehicles (673, accounting for 38.2%) and females with 2 vehicles (426, making up 34.6%).
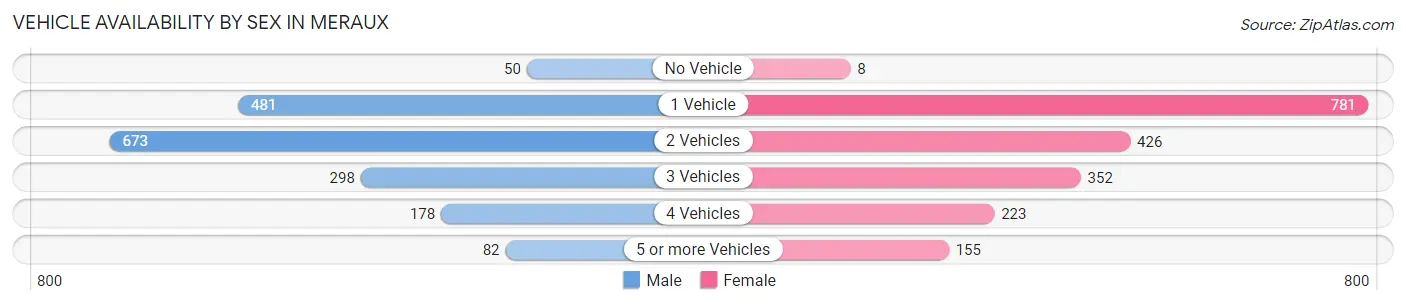
| Vehicles Available | Male | Female |
| No Vehicle | 50 (2.8%) | 8 (0.4%) |
| 1 Vehicle | 481 (27.3%) | 781 (40.2%) |
| 2 Vehicles | 673 (38.2%) | 426 (21.9%) |
| 3 Vehicles | 298 (16.9%) | 352 (18.1%) |
| 4 Vehicles | 178 (10.1%) | 223 (11.5%) |
| 5 or more Vehicles | 82 (4.6%) | 155 (8.0%) |
| Total | 1,762 (100.0%) | 1,945 (100.0%) |
Commute Time in Meraux
The most frequently occuring commute durations in Meraux are 45 to 59 minutes (858 commuters, 23.8%), 20 to 24 minutes (503 commuters, 14.0%), and 15 to 19 minutes (471 commuters, 13.1%).
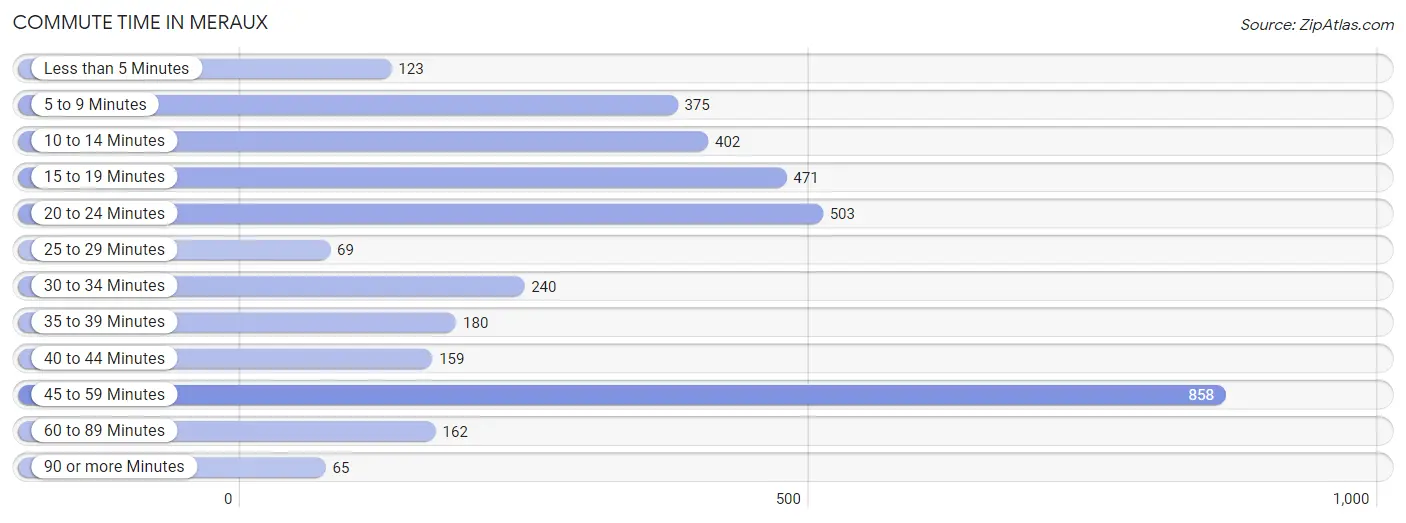
| Commute Time | # Commuters | % Commuters |
| Less than 5 Minutes | 123 | 3.4% |
| 5 to 9 Minutes | 375 | 10.4% |
| 10 to 14 Minutes | 402 | 11.1% |
| 15 to 19 Minutes | 471 | 13.1% |
| 20 to 24 Minutes | 503 | 14.0% |
| 25 to 29 Minutes | 69 | 1.9% |
| 30 to 34 Minutes | 240 | 6.7% |
| 35 to 39 Minutes | 180 | 5.0% |
| 40 to 44 Minutes | 159 | 4.4% |
| 45 to 59 Minutes | 858 | 23.8% |
| 60 to 89 Minutes | 162 | 4.5% |
| 90 or more Minutes | 65 | 1.8% |
Commute Time by Sex in Meraux
The most common commute times in Meraux are 45 to 59 minutes (407 commuters, 23.6%) for males and 45 to 59 minutes (451 commuters, 23.9%) for females.
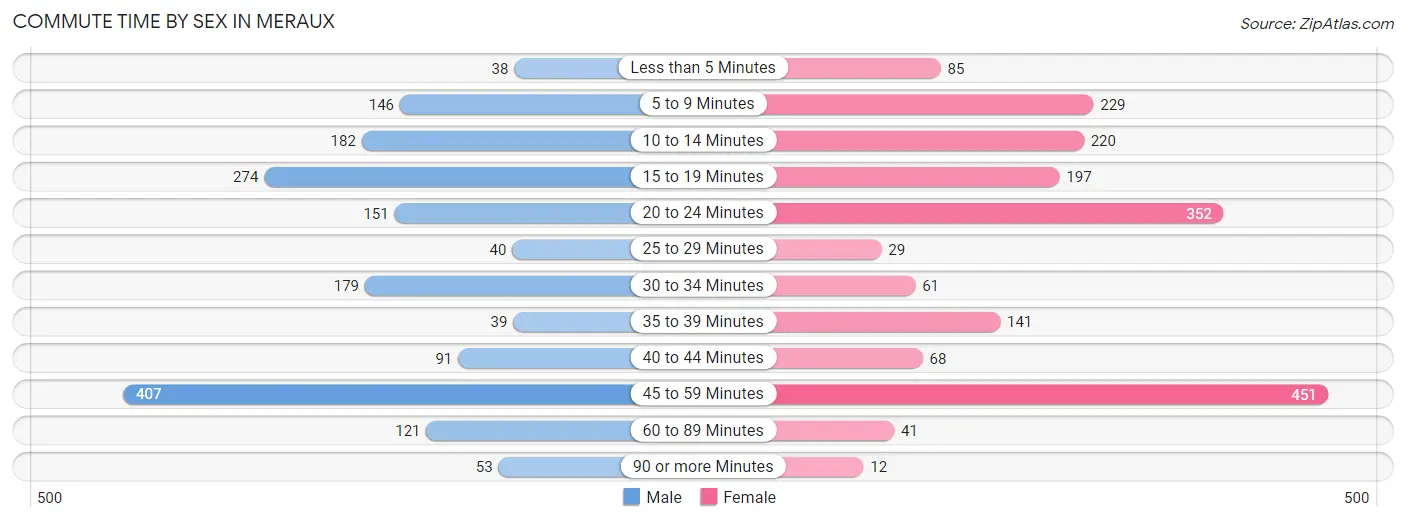
| Commute Time | Male | Female |
| Less than 5 Minutes | 38 (2.2%) | 85 (4.5%) |
| 5 to 9 Minutes | 146 (8.5%) | 229 (12.1%) |
| 10 to 14 Minutes | 182 (10.6%) | 220 (11.7%) |
| 15 to 19 Minutes | 274 (15.9%) | 197 (10.4%) |
| 20 to 24 Minutes | 151 (8.8%) | 352 (18.7%) |
| 25 to 29 Minutes | 40 (2.3%) | 29 (1.5%) |
| 30 to 34 Minutes | 179 (10.4%) | 61 (3.2%) |
| 35 to 39 Minutes | 39 (2.3%) | 141 (7.5%) |
| 40 to 44 Minutes | 91 (5.3%) | 68 (3.6%) |
| 45 to 59 Minutes | 407 (23.6%) | 451 (23.9%) |
| 60 to 89 Minutes | 121 (7.0%) | 41 (2.2%) |
| 90 or more Minutes | 53 (3.1%) | 12 (0.6%) |
Time of Departure to Work by Sex in Meraux
The most frequent times of departure to work in Meraux are 12:00 AM to 4:59 AM (288, 16.7%) for males and 7:30 AM to 7:59 AM (399, 21.2%) for females.
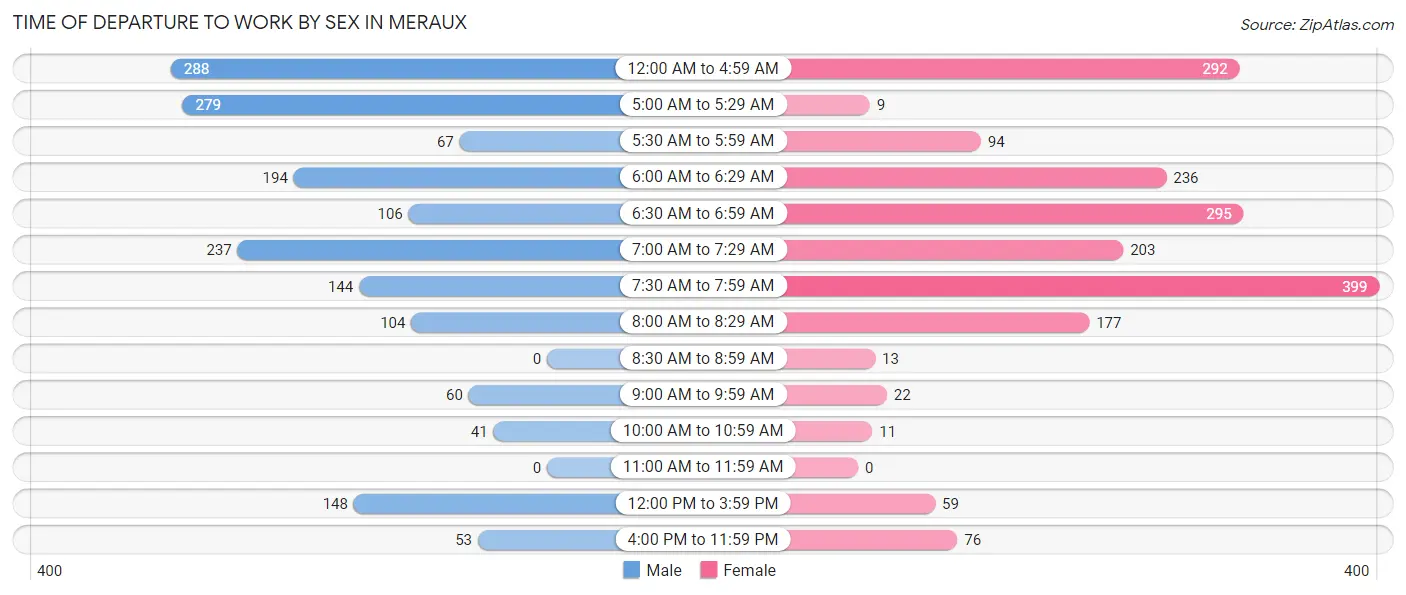
| Time of Departure | Male | Female |
| 12:00 AM to 4:59 AM | 288 (16.7%) | 292 (15.5%) |
| 5:00 AM to 5:29 AM | 279 (16.2%) | 9 (0.5%) |
| 5:30 AM to 5:59 AM | 67 (3.9%) | 94 (5.0%) |
| 6:00 AM to 6:29 AM | 194 (11.3%) | 236 (12.5%) |
| 6:30 AM to 6:59 AM | 106 (6.2%) | 295 (15.6%) |
| 7:00 AM to 7:29 AM | 237 (13.8%) | 203 (10.8%) |
| 7:30 AM to 7:59 AM | 144 (8.4%) | 399 (21.2%) |
| 8:00 AM to 8:29 AM | 104 (6.0%) | 177 (9.4%) |
| 8:30 AM to 8:59 AM | 0 (0.0%) | 13 (0.7%) |
| 9:00 AM to 9:59 AM | 60 (3.5%) | 22 (1.2%) |
| 10:00 AM to 10:59 AM | 41 (2.4%) | 11 (0.6%) |
| 11:00 AM to 11:59 AM | 0 (0.0%) | 0 (0.0%) |
| 12:00 PM to 3:59 PM | 148 (8.6%) | 59 (3.1%) |
| 4:00 PM to 11:59 PM | 53 (3.1%) | 76 (4.0%) |
| Total | 1,721 (100.0%) | 1,886 (100.0%) |
Housing Occupancy in Meraux
Occupancy by Ownership in Meraux
Of the total 2,445 dwellings in Meraux, owner-occupied units account for 2,316 (94.7%), while renter-occupied units make up 129 (5.3%).
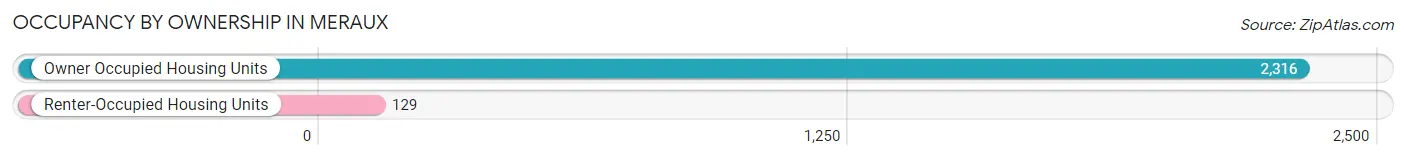
| Occupancy | # Housing Units | % Housing Units |
| Owner Occupied Housing Units | 2,316 | 94.7% |
| Renter-Occupied Housing Units | 129 | 5.3% |
| Total Occupied Housing Units | 2,445 | 100.0% |
Occupancy by Household Size in Meraux
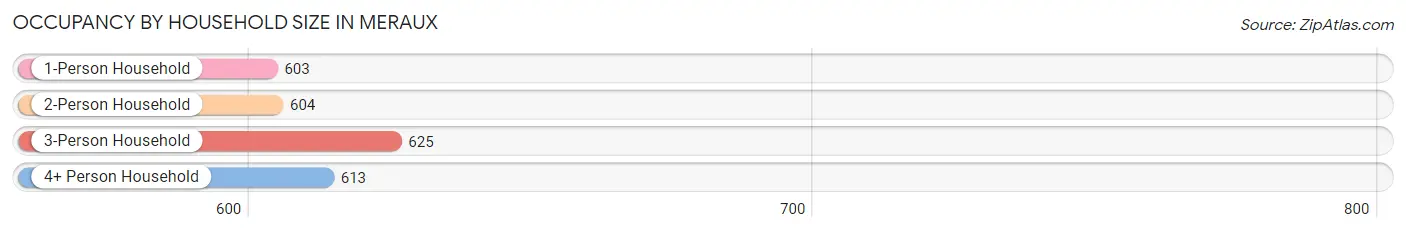
| Household Size | # Housing Units | % Housing Units |
| 1-Person Household | 603 | 24.7% |
| 2-Person Household | 604 | 24.7% |
| 3-Person Household | 625 | 25.6% |
| 4+ Person Household | 613 | 25.1% |
| Total Housing Units | 2,445 | 100.0% |
Occupancy by Ownership by Household Size in Meraux
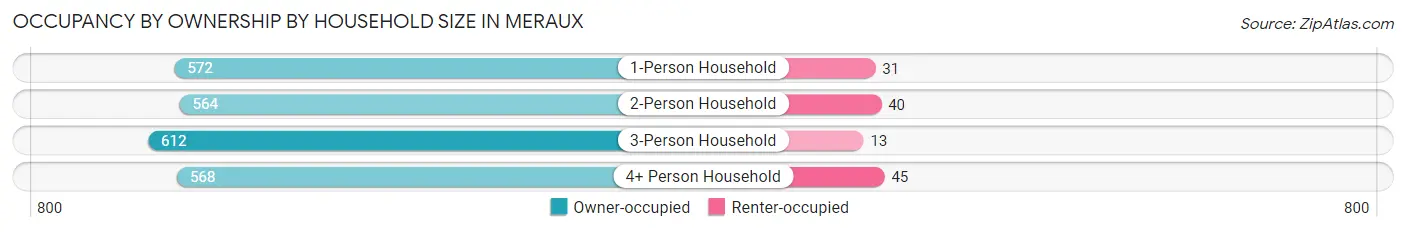
| Household Size | Owner-occupied | Renter-occupied |
| 1-Person Household | 572 (94.9%) | 31 (5.1%) |
| 2-Person Household | 564 (93.4%) | 40 (6.6%) |
| 3-Person Household | 612 (97.9%) | 13 (2.1%) |
| 4+ Person Household | 568 (92.7%) | 45 (7.3%) |
| Total Housing Units | 2,316 (94.7%) | 129 (5.3%) |
Occupancy by Educational Attainment in Meraux
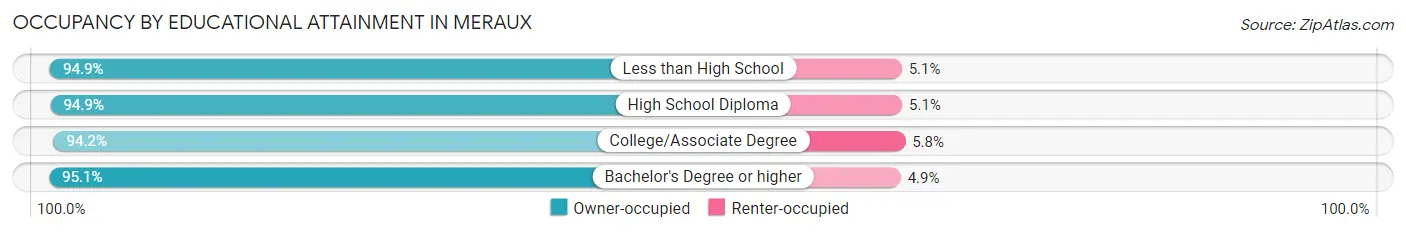
| Household Size | Owner-occupied | Renter-occupied |
| Less than High School | 318 (94.9%) | 17 (5.1%) |
| High School Diploma | 867 (94.9%) | 47 (5.1%) |
| College/Associate Degree | 720 (94.2%) | 44 (5.8%) |
| Bachelor's Degree or higher | 411 (95.1%) | 21 (4.9%) |
Occupancy by Age of Householder in Meraux
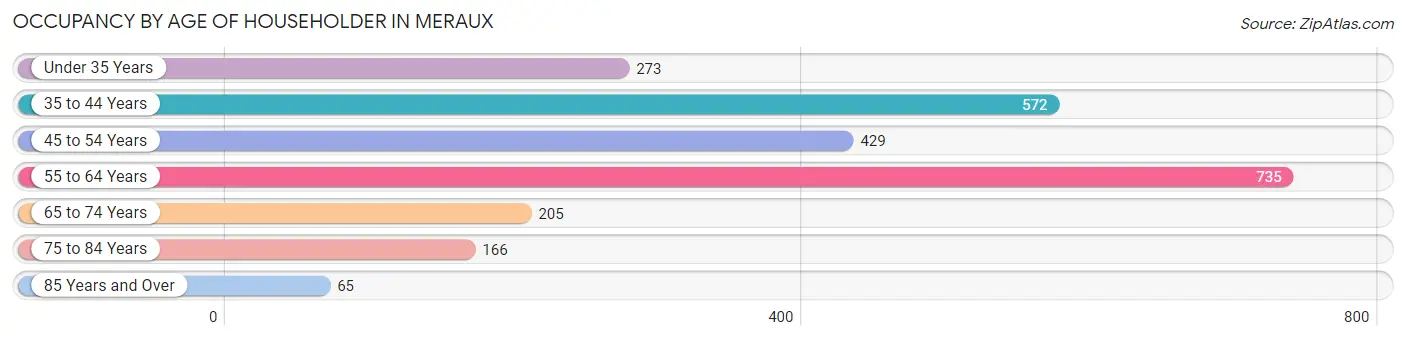
| Age Bracket | # Households | % Households |
| Under 35 Years | 273 | 11.2% |
| 35 to 44 Years | 572 | 23.4% |
| 45 to 54 Years | 429 | 17.5% |
| 55 to 64 Years | 735 | 30.1% |
| 65 to 74 Years | 205 | 8.4% |
| 75 to 84 Years | 166 | 6.8% |
| 85 Years and Over | 65 | 2.7% |
| Total | 2,445 | 100.0% |
Housing Finances in Meraux
Median Income by Occupancy in Meraux
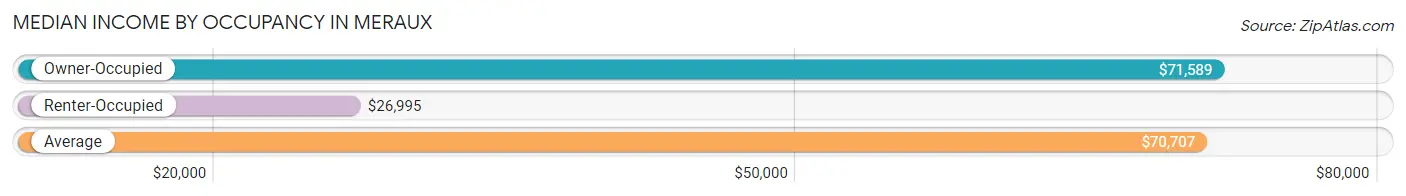
| Occupancy Type | # Households | Median Income |
| Owner-Occupied | 2,316 (94.7%) | $71,589 |
| Renter-Occupied | 129 (5.3%) | $26,995 |
| Average | 2,445 (100.0%) | $70,707 |
Occupancy by Householder Income Bracket in Meraux
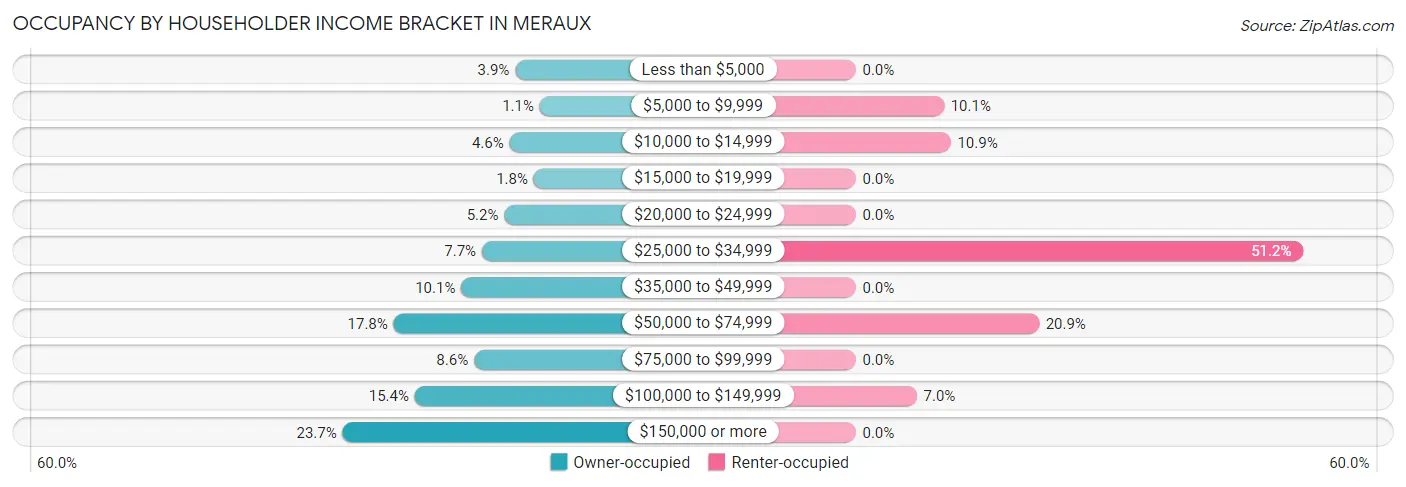
| Income Bracket | Owner-occupied | Renter-occupied |
| Less than $5,000 | 91 (3.9%) | 0 (0.0%) |
| $5,000 to $9,999 | 26 (1.1%) | 13 (10.1%) |
| $10,000 to $14,999 | 106 (4.6%) | 14 (10.8%) |
| $15,000 to $19,999 | 42 (1.8%) | 0 (0.0%) |
| $20,000 to $24,999 | 120 (5.2%) | 0 (0.0%) |
| $25,000 to $34,999 | 179 (7.7%) | 66 (51.2%) |
| $35,000 to $49,999 | 234 (10.1%) | 0 (0.0%) |
| $50,000 to $74,999 | 413 (17.8%) | 27 (20.9%) |
| $75,000 to $99,999 | 200 (8.6%) | 0 (0.0%) |
| $100,000 to $149,999 | 357 (15.4%) | 9 (7.0%) |
| $150,000 or more | 548 (23.7%) | 0 (0.0%) |
| Total | 2,316 (100.0%) | 129 (100.0%) |
Monthly Housing Cost Tiers in Meraux
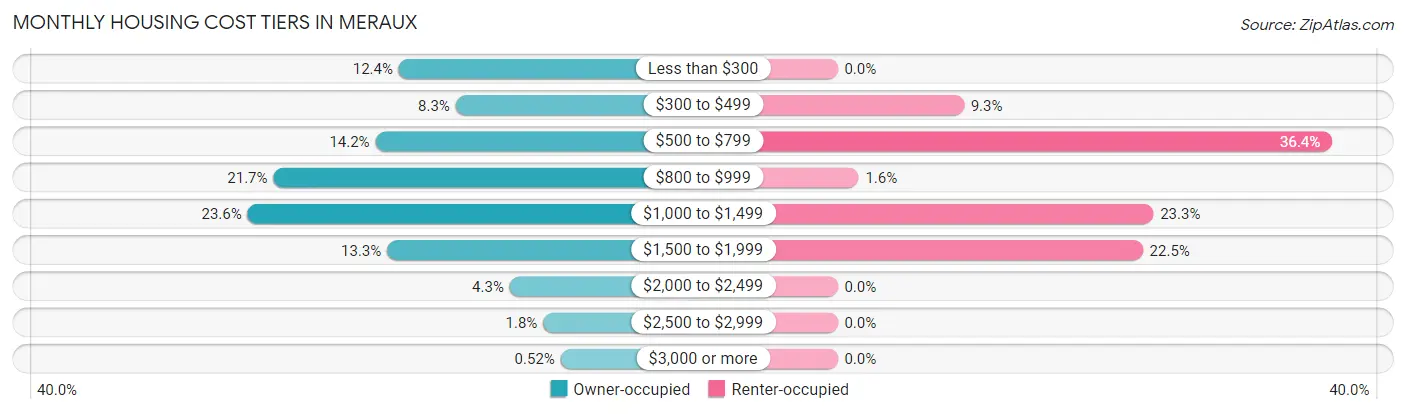
| Monthly Cost | Owner-occupied | Renter-occupied |
| Less than $300 | 288 (12.4%) | 0 (0.0%) |
| $300 to $499 | 191 (8.3%) | 12 (9.3%) |
| $500 to $799 | 328 (14.2%) | 47 (36.4%) |
| $800 to $999 | 502 (21.7%) | 2 (1.5%) |
| $1,000 to $1,499 | 546 (23.6%) | 30 (23.3%) |
| $1,500 to $1,999 | 308 (13.3%) | 29 (22.5%) |
| $2,000 to $2,499 | 99 (4.3%) | 0 (0.0%) |
| $2,500 to $2,999 | 42 (1.8%) | 0 (0.0%) |
| $3,000 or more | 12 (0.5%) | 0 (0.0%) |
| Total | 2,316 (100.0%) | 129 (100.0%) |
Physical Housing Characteristics in Meraux
Housing Structures in Meraux
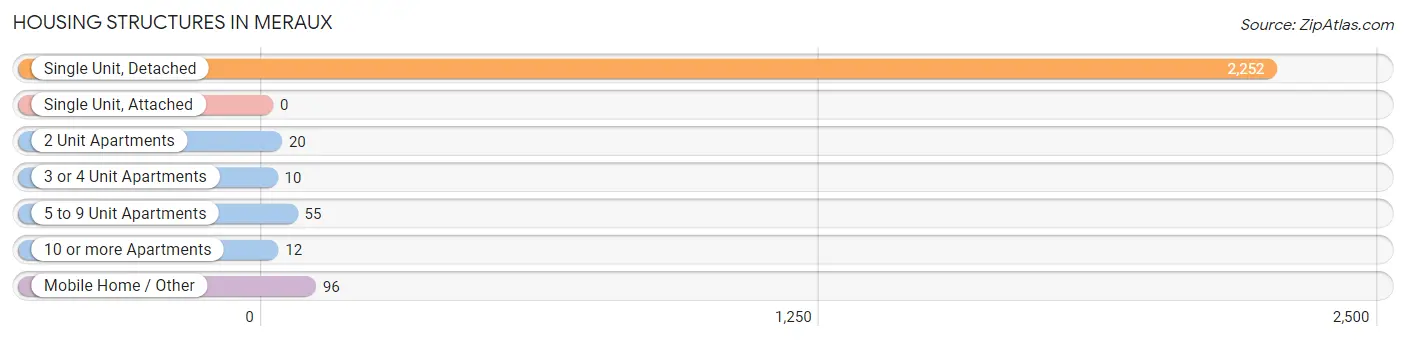
| Structure Type | # Housing Units | % Housing Units |
| Single Unit, Detached | 2,252 | 92.1% |
| Single Unit, Attached | 0 | 0.0% |
| 2 Unit Apartments | 20 | 0.8% |
| 3 or 4 Unit Apartments | 10 | 0.4% |
| 5 to 9 Unit Apartments | 55 | 2.2% |
| 10 or more Apartments | 12 | 0.5% |
| Mobile Home / Other | 96 | 3.9% |
| Total | 2,445 | 100.0% |
Housing Structures by Occupancy in Meraux
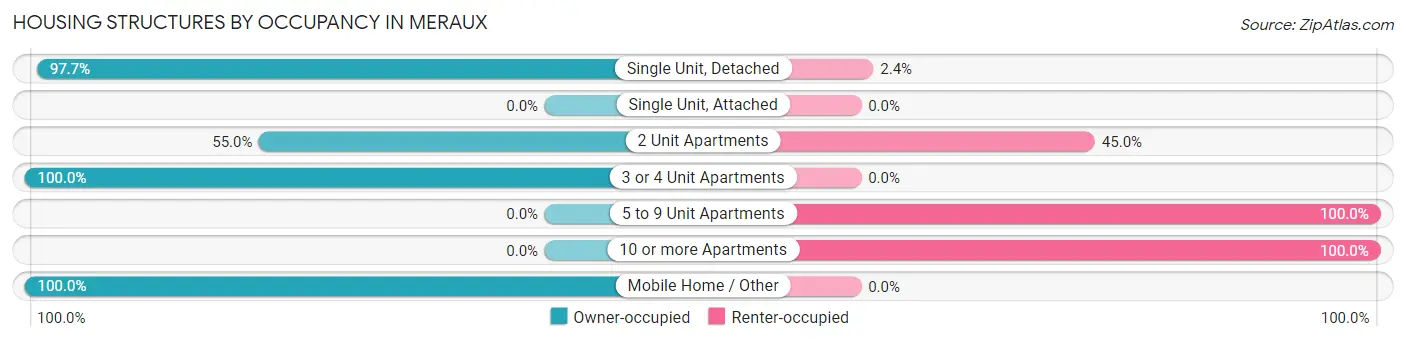
| Structure Type | Owner-occupied | Renter-occupied |
| Single Unit, Detached | 2,199 (97.7%) | 53 (2.4%) |
| Single Unit, Attached | 0 (0.0%) | 0 (0.0%) |
| 2 Unit Apartments | 11 (55.0%) | 9 (45.0%) |
| 3 or 4 Unit Apartments | 10 (100.0%) | 0 (0.0%) |
| 5 to 9 Unit Apartments | 0 (0.0%) | 55 (100.0%) |
| 10 or more Apartments | 0 (0.0%) | 12 (100.0%) |
| Mobile Home / Other | 96 (100.0%) | 0 (0.0%) |
| Total | 2,316 (94.7%) | 129 (5.3%) |
Housing Structures by Number of Rooms in Meraux
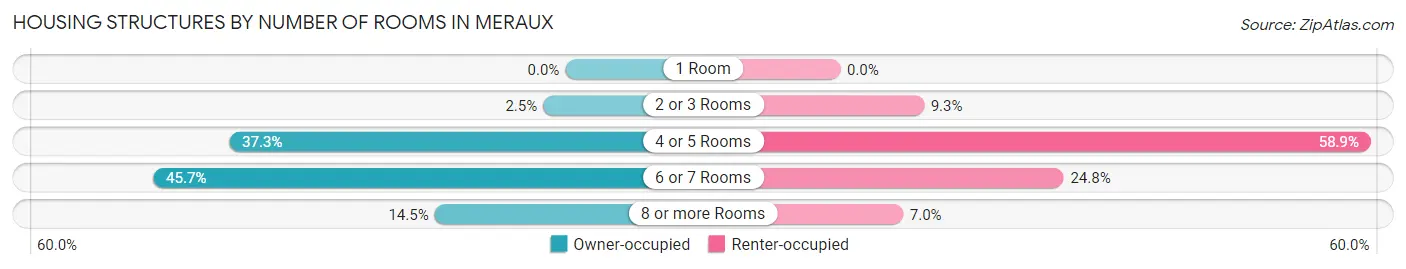
| Number of Rooms | Owner-occupied | Renter-occupied |
| 1 Room | 0 (0.0%) | 0 (0.0%) |
| 2 or 3 Rooms | 57 (2.5%) | 12 (9.3%) |
| 4 or 5 Rooms | 864 (37.3%) | 76 (58.9%) |
| 6 or 7 Rooms | 1,059 (45.7%) | 32 (24.8%) |
| 8 or more Rooms | 336 (14.5%) | 9 (7.0%) |
| Total | 2,316 (100.0%) | 129 (100.0%) |
Housing Structure by Heating Type in Meraux
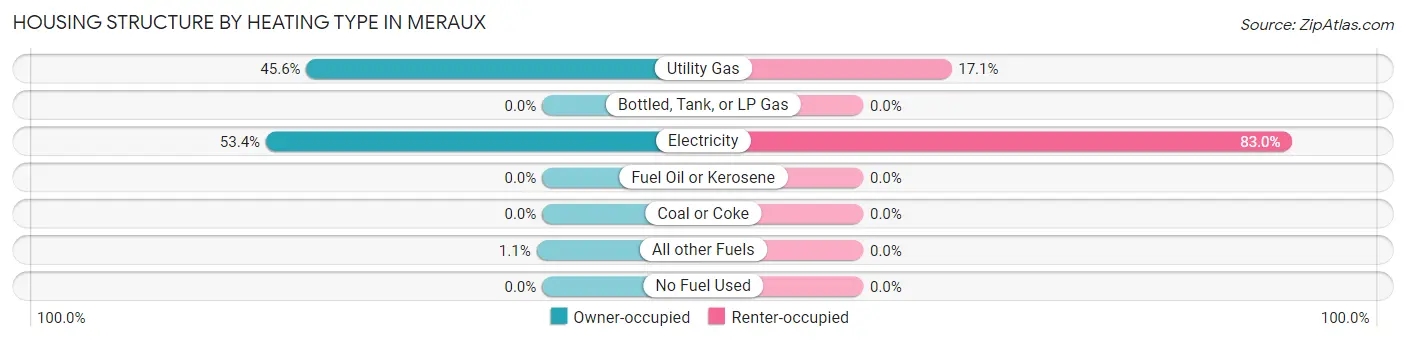
| Heating Type | Owner-occupied | Renter-occupied |
| Utility Gas | 1,055 (45.6%) | 22 (17.1%) |
| Bottled, Tank, or LP Gas | 0 (0.0%) | 0 (0.0%) |
| Electricity | 1,236 (53.4%) | 107 (83.0%) |
| Fuel Oil or Kerosene | 0 (0.0%) | 0 (0.0%) |
| Coal or Coke | 0 (0.0%) | 0 (0.0%) |
| All other Fuels | 25 (1.1%) | 0 (0.0%) |
| No Fuel Used | 0 (0.0%) | 0 (0.0%) |
| Total | 2,316 (100.0%) | 129 (100.0%) |
Household Vehicle Usage in Meraux
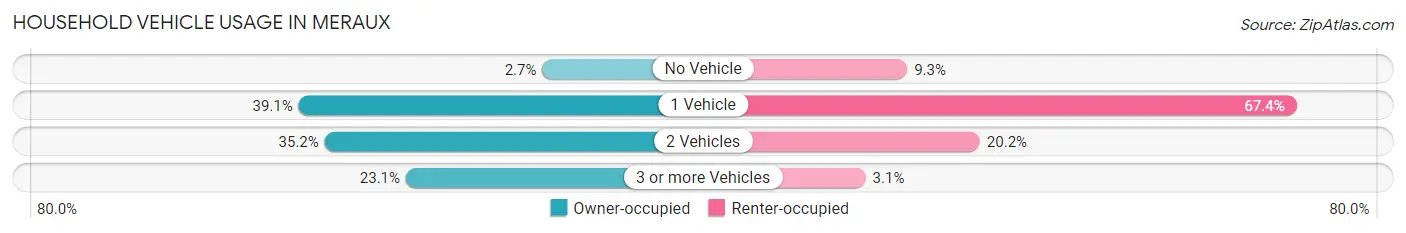
| Vehicles per Household | Owner-occupied | Renter-occupied |
| No Vehicle | 62 (2.7%) | 12 (9.3%) |
| 1 Vehicle | 905 (39.1%) | 87 (67.4%) |
| 2 Vehicles | 815 (35.2%) | 26 (20.2%) |
| 3 or more Vehicles | 534 (23.1%) | 4 (3.1%) |
| Total | 2,316 (100.0%) | 129 (100.0%) |
Real Estate & Mortgages in Meraux
Real Estate and Mortgage Overview in Meraux
| Characteristic | Without Mortgage | With Mortgage |
| Housing Units | 741 | 1,575 |
| Median Property Value | $180,200 | $195,400 |
| Median Household Income | $47,950 | $520 |
| Monthly Housing Costs | $342 | $12 |
| Real Estate Taxes | $1,250 | $151 |
Property Value by Mortgage Status in Meraux
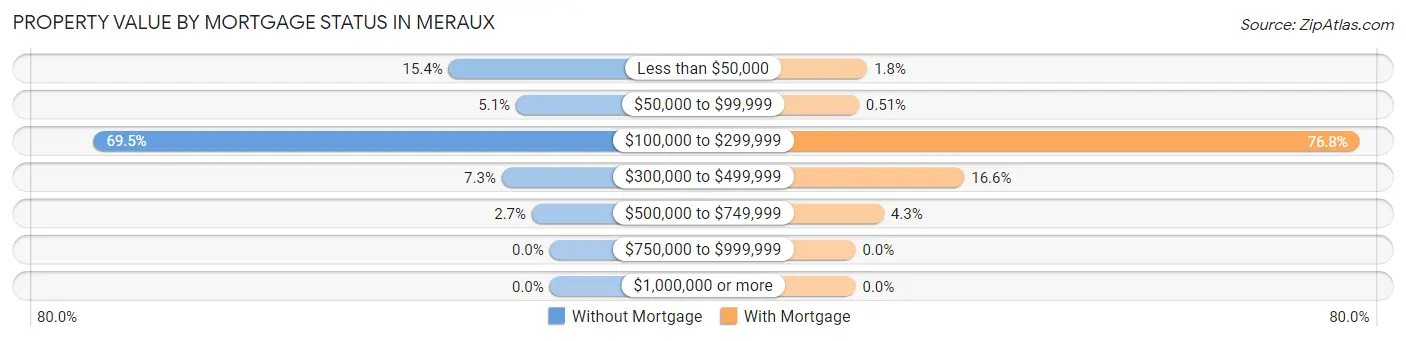
| Property Value | Without Mortgage | With Mortgage |
| Less than $50,000 | 114 (15.4%) | 28 (1.8%) |
| $50,000 to $99,999 | 38 (5.1%) | 8 (0.5%) |
| $100,000 to $299,999 | 515 (69.5%) | 1,210 (76.8%) |
| $300,000 to $499,999 | 54 (7.3%) | 261 (16.6%) |
| $500,000 to $749,999 | 20 (2.7%) | 68 (4.3%) |
| $750,000 to $999,999 | 0 (0.0%) | 0 (0.0%) |
| $1,000,000 or more | 0 (0.0%) | 0 (0.0%) |
| Total | 741 (100.0%) | 1,575 (100.0%) |
Household Income by Mortgage Status in Meraux
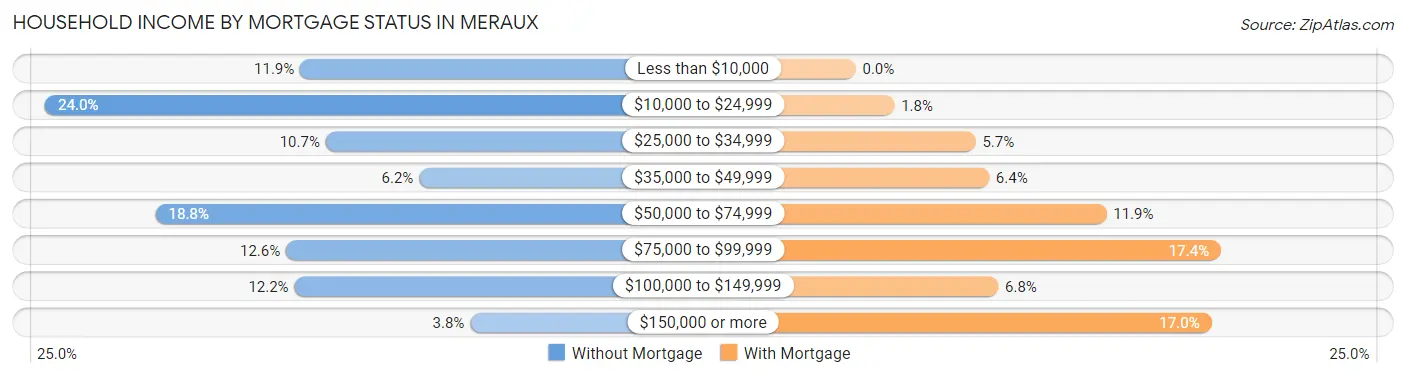
| Household Income | Without Mortgage | With Mortgage |
| Less than $10,000 | 88 (11.9%) | 0 (0.0%) |
| $10,000 to $24,999 | 178 (24.0%) | 29 (1.8%) |
| $25,000 to $34,999 | 79 (10.7%) | 90 (5.7%) |
| $35,000 to $49,999 | 46 (6.2%) | 100 (6.4%) |
| $50,000 to $74,999 | 139 (18.8%) | 188 (11.9%) |
| $75,000 to $99,999 | 93 (12.6%) | 274 (17.4%) |
| $100,000 to $149,999 | 90 (12.1%) | 107 (6.8%) |
| $150,000 or more | 28 (3.8%) | 267 (17.0%) |
| Total | 741 (100.0%) | 1,575 (100.0%) |
Property Value to Household Income Ratio in Meraux
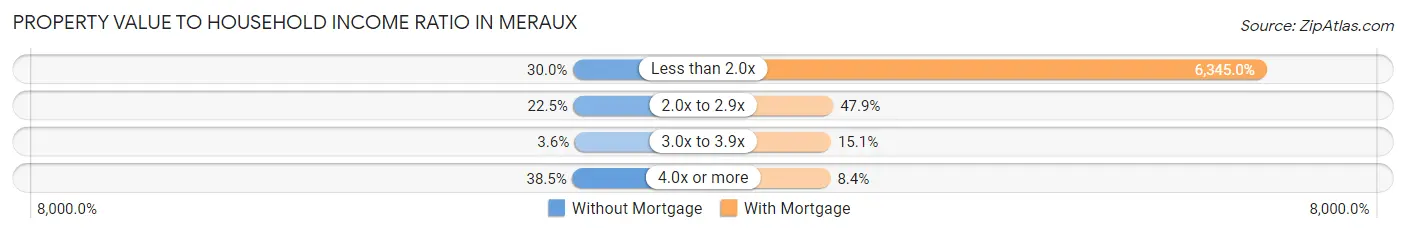
| Value-to-Income Ratio | Without Mortgage | With Mortgage |
| Less than 2.0x | 222 (30.0%) | 99,934 (6,345.0%) |
| 2.0x to 2.9x | 167 (22.5%) | 755 (47.9%) |
| 3.0x to 3.9x | 27 (3.6%) | 238 (15.1%) |
| 4.0x or more | 285 (38.5%) | 133 (8.4%) |
| Total | 741 (100.0%) | 1,575 (100.0%) |
Real Estate Taxes by Mortgage Status in Meraux
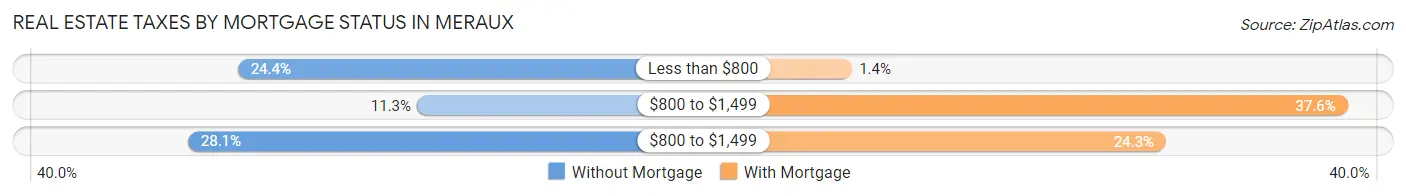
| Property Taxes | Without Mortgage | With Mortgage |
| Less than $800 | 181 (24.4%) | 22 (1.4%) |
| $800 to $1,499 | 84 (11.3%) | 592 (37.6%) |
| $800 to $1,499 | 208 (28.1%) | 383 (24.3%) |
| Total | 741 (100.0%) | 1,575 (100.0%) |
Health & Disability in Meraux
Health Insurance Coverage by Age in Meraux
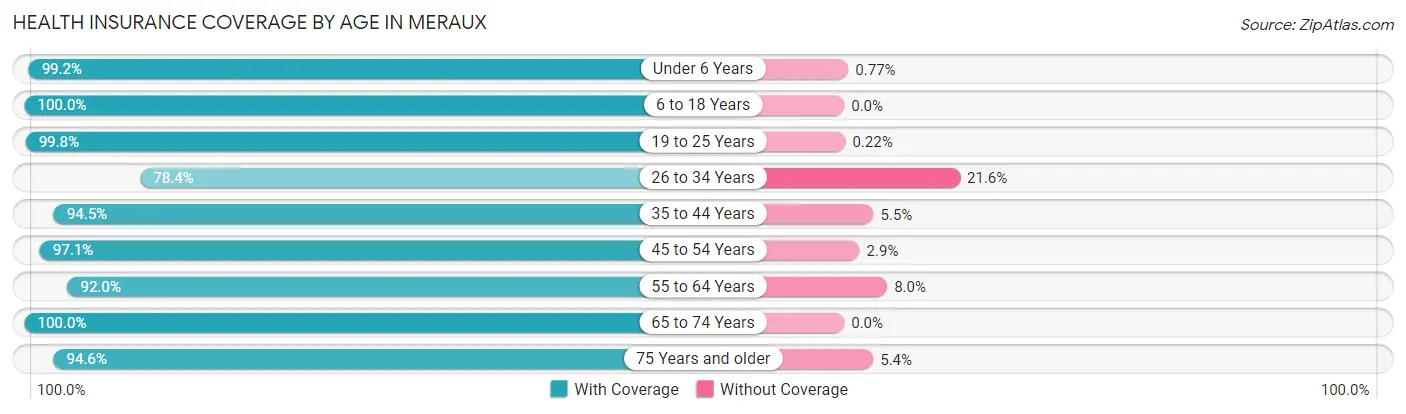
| Age Bracket | With Coverage | Without Coverage |
| Under 6 Years | 516 (99.2%) | 4 (0.8%) |
| 6 to 18 Years | 1,456 (100.0%) | 0 (0.0%) |
| 19 to 25 Years | 446 (99.8%) | 1 (0.2%) |
| 26 to 34 Years | 530 (78.4%) | 146 (21.6%) |
| 35 to 44 Years | 1,382 (94.5%) | 80 (5.5%) |
| 45 to 54 Years | 780 (97.1%) | 23 (2.9%) |
| 55 to 64 Years | 1,137 (92.0%) | 99 (8.0%) |
| 65 to 74 Years | 401 (100.0%) | 0 (0.0%) |
| 75 Years and older | 280 (94.6%) | 16 (5.4%) |
| Total | 6,928 (94.9%) | 369 (5.1%) |
Health Insurance Coverage by Citizenship Status in Meraux
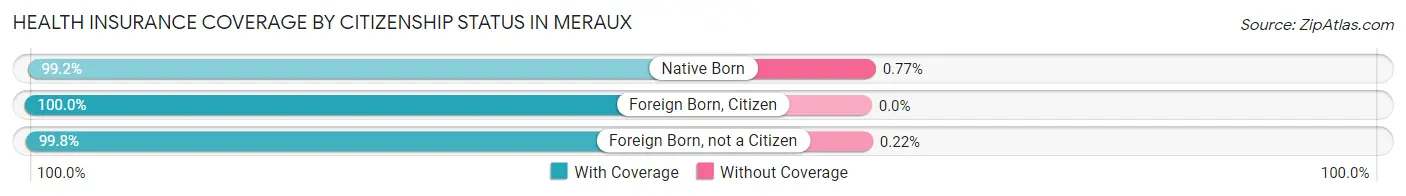
| Citizenship Status | With Coverage | Without Coverage |
| Native Born | 516 (99.2%) | 4 (0.8%) |
| Foreign Born, Citizen | 1,456 (100.0%) | 0 (0.0%) |
| Foreign Born, not a Citizen | 446 (99.8%) | 1 (0.2%) |
Health Insurance Coverage by Household Income in Meraux
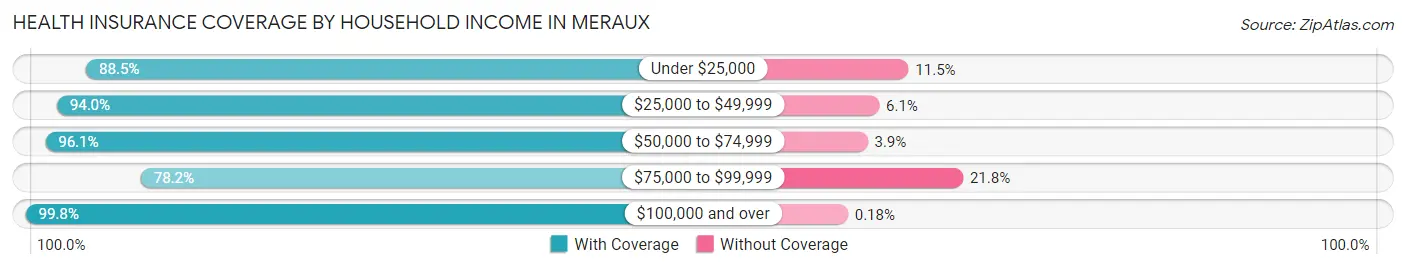
| Household Income | With Coverage | Without Coverage |
| Under $25,000 | 759 (88.5%) | 99 (11.5%) |
| $25,000 to $49,999 | 1,119 (94.0%) | 72 (6.0%) |
| $50,000 to $74,999 | 1,214 (96.1%) | 49 (3.9%) |
| $75,000 to $99,999 | 514 (78.2%) | 143 (21.8%) |
| $100,000 and over | 3,322 (99.8%) | 6 (0.2%) |
Public vs Private Health Insurance Coverage by Age in Meraux
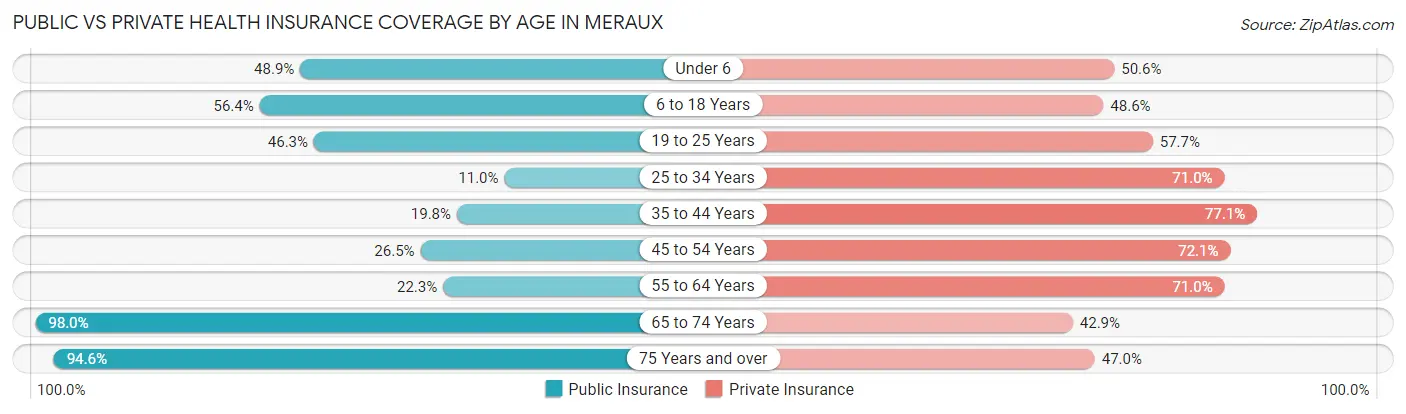
| Age Bracket | Public Insurance | Private Insurance |
| Under 6 | 254 (48.8%) | 263 (50.6%) |
| 6 to 18 Years | 821 (56.4%) | 707 (48.6%) |
| 19 to 25 Years | 207 (46.3%) | 258 (57.7%) |
| 25 to 34 Years | 74 (11.0%) | 480 (71.0%) |
| 35 to 44 Years | 289 (19.8%) | 1,127 (77.1%) |
| 45 to 54 Years | 213 (26.5%) | 579 (72.1%) |
| 55 to 64 Years | 276 (22.3%) | 878 (71.0%) |
| 65 to 74 Years | 393 (98.0%) | 172 (42.9%) |
| 75 Years and over | 280 (94.6%) | 139 (47.0%) |
| Total | 2,807 (38.5%) | 4,603 (63.1%) |
Disability Status by Sex by Age in Meraux
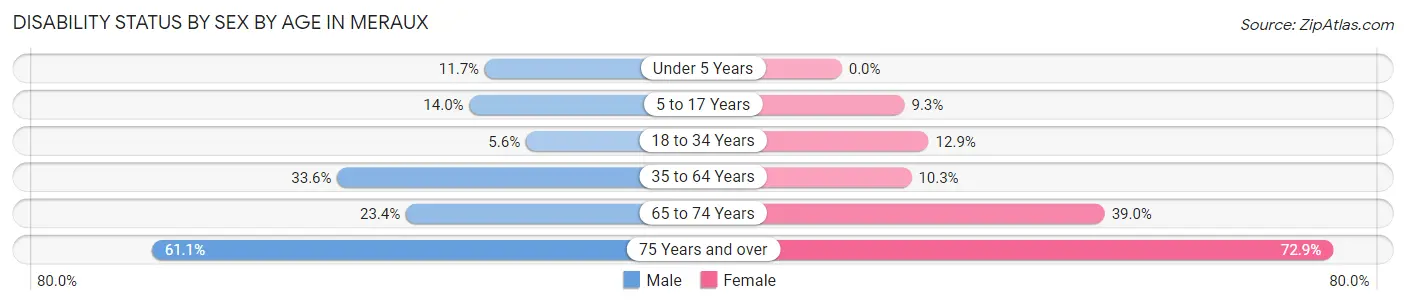
| Age Bracket | Male | Female |
| Under 5 Years | 36 (11.7%) | 0 (0.0%) |
| 5 to 17 Years | 90 (14.0%) | 74 (9.3%) |
| 18 to 34 Years | 30 (5.6%) | 89 (12.9%) |
| 35 to 64 Years | 552 (33.6%) | 192 (10.3%) |
| 65 to 74 Years | 50 (23.4%) | 73 (39.0%) |
| 75 Years and over | 77 (61.1%) | 124 (72.9%) |
Disability Class by Sex by Age in Meraux
Disability Class: Hearing Difficulty
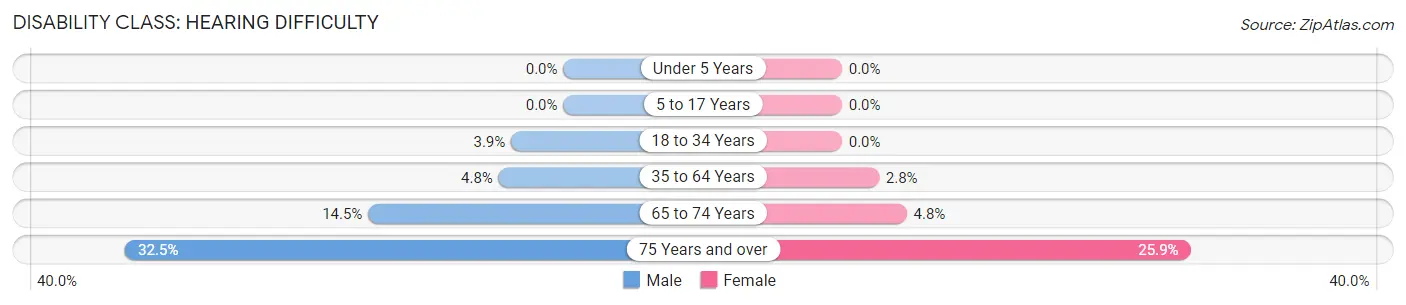
| Age Bracket | Male | Female |
| Under 5 Years | 0 (0.0%) | 0 (0.0%) |
| 5 to 17 Years | 0 (0.0%) | 0 (0.0%) |
| 18 to 34 Years | 21 (3.9%) | 0 (0.0%) |
| 35 to 64 Years | 79 (4.8%) | 51 (2.8%) |
| 65 to 74 Years | 31 (14.5%) | 9 (4.8%) |
| 75 Years and over | 41 (32.5%) | 44 (25.9%) |
Disability Class: Vision Difficulty
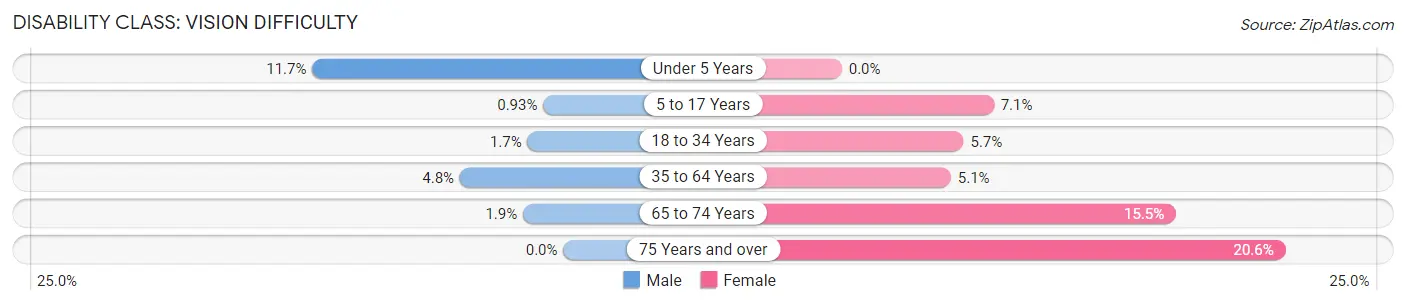
| Age Bracket | Male | Female |
| Under 5 Years | 36 (11.7%) | 0 (0.0%) |
| 5 to 17 Years | 6 (0.9%) | 56 (7.0%) |
| 18 to 34 Years | 9 (1.7%) | 39 (5.7%) |
| 35 to 64 Years | 79 (4.8%) | 94 (5.1%) |
| 65 to 74 Years | 4 (1.9%) | 29 (15.5%) |
| 75 Years and over | 0 (0.0%) | 35 (20.6%) |
Disability Class: Cognitive Difficulty
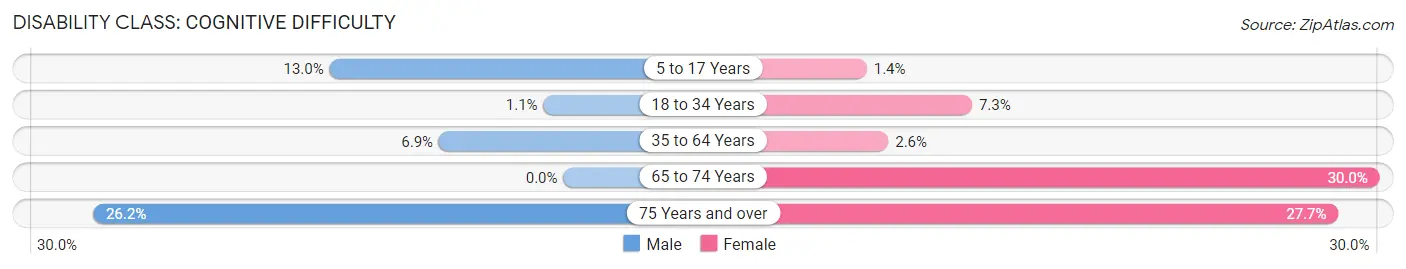
| Age Bracket | Male | Female |
| 5 to 17 Years | 84 (13.0%) | 11 (1.4%) |
| 18 to 34 Years | 6 (1.1%) | 50 (7.2%) |
| 35 to 64 Years | 114 (6.9%) | 48 (2.6%) |
| 65 to 74 Years | 0 (0.0%) | 56 (29.9%) |
| 75 Years and over | 33 (26.2%) | 47 (27.7%) |
Disability Class: Ambulatory Difficulty
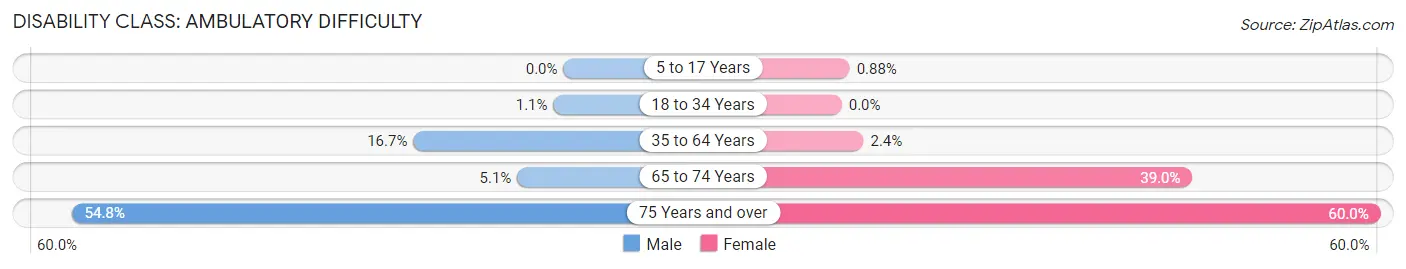
| Age Bracket | Male | Female |
| 5 to 17 Years | 0 (0.0%) | 7 (0.9%) |
| 18 to 34 Years | 6 (1.1%) | 0 (0.0%) |
| 35 to 64 Years | 275 (16.7%) | 45 (2.4%) |
| 65 to 74 Years | 11 (5.1%) | 73 (39.0%) |
| 75 Years and over | 69 (54.8%) | 102 (60.0%) |
Disability Class: Self-Care Difficulty
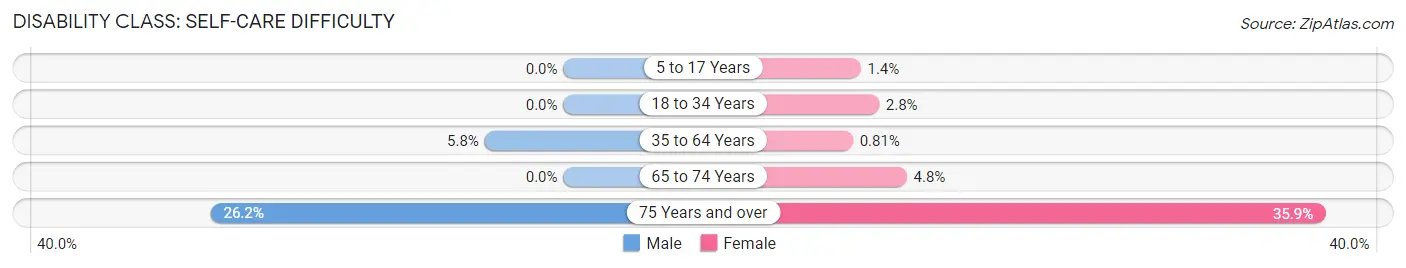
| Age Bracket | Male | Female |
| 5 to 17 Years | 0 (0.0%) | 11 (1.4%) |
| 18 to 34 Years | 0 (0.0%) | 19 (2.8%) |
| 35 to 64 Years | 96 (5.8%) | 15 (0.8%) |
| 65 to 74 Years | 0 (0.0%) | 9 (4.8%) |
| 75 Years and over | 33 (26.2%) | 61 (35.9%) |
Technology Access in Meraux
Computing Device Access in Meraux
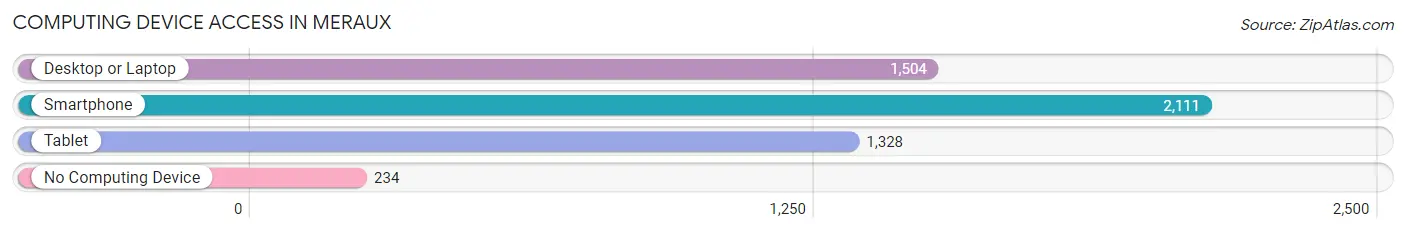
| Device Type | # Households | % Households |
| Desktop or Laptop | 1,504 | 61.5% |
| Smartphone | 2,111 | 86.3% |
| Tablet | 1,328 | 54.3% |
| No Computing Device | 234 | 9.6% |
| Total | 2,445 | 100.0% |
Internet Access in Meraux
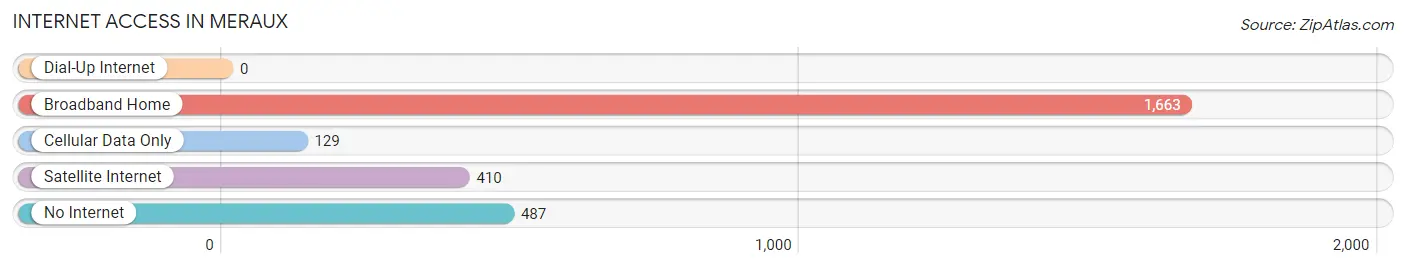
| Internet Type | # Households | % Households |
| Dial-Up Internet | 0 | 0.0% |
| Broadband Home | 1,663 | 68.0% |
| Cellular Data Only | 129 | 5.3% |
| Satellite Internet | 410 | 16.8% |
| No Internet | 487 | 19.9% |
| Total | 2,445 | 100.0% |
Meraux Summary
Meraux is a census-designated place (CDP) located in St. Bernard Parish, Louisiana. It is located about 15 miles southeast of New Orleans and is part of the Greater New Orleans Metropolitan Area. As of the 2010 census, the population of Meraux was 8,445.
History
Meraux was founded in the early 19th century by French-Canadian immigrants who settled in the area. The town was named after the Meraux family, who were prominent landowners in the area. The Meraux family owned a large plantation in the area, which was used to grow sugar cane and other crops. The town was incorporated in 1876 and was home to a number of businesses, including a sugar refinery, a sawmill, and a brickyard.
In the early 20th century, Meraux experienced a period of growth and development. The town was home to a number of businesses, including a bank, a movie theater, and a number of stores. The town also had a number of churches, including the St. Bernard Catholic Church, which was built in 1912.
In 1965, Hurricane Betsy caused extensive damage to Meraux. The town was flooded and many of the buildings were destroyed. After the hurricane, the town was rebuilt and experienced a period of growth and development.
Geography
Meraux is located at 29°51'25"N 89°59'45"W (29.857, -89.996). The town is located in St. Bernard Parish, Louisiana, about 15 miles southeast of New Orleans. The town is bordered by the Mississippi River to the north, the Gulf of Mexico to the south, and the Intracoastal Waterway to the east.
The town has a total area of 4.2 square miles, all of which is land. The town is located at an elevation of 4 feet above sea level.
Economy
The economy of Meraux is largely based on the oil and gas industry. The town is home to a number of oil and gas companies, including Chevron, Shell, and ExxonMobil. The town is also home to a number of other businesses, including restaurants, retail stores, and medical facilities.
Demographics
As of the 2010 census, there were 8,445 people, 3,093 households, and 2,092 families living in Meraux. The population density was 2,019.7 people per square mile. The racial makeup of the town was 79.2% White, 15.2% African American, 0.4% Native American, 0.7% Asian, 0.1% Pacific Islander, 2.2% from other races, and 2.2% from two or more races. Hispanic or Latino of any race were 5.3% of the population.
The median income for a household in Meraux was $45,938, and the median income for a family was $54,938. The per capita income for the town was $20,938. About 11.2% of families and 14.2% of the population were below the poverty line, including 19.2% of those under age 18 and 8.2% of those age 65 or over.
Common Questions
What is the Total Population of Meraux?
Total Population of Meraux is 7,297.
What is the Total Male Population of Meraux?
Total Male Population of Meraux is 3,480.
What is the Total Female Population of Meraux?
Total Female Population of Meraux is 3,817.
What is the Ratio of Males per 100 Females in Meraux?
There are 91.17 Males per 100 Females in Meraux.
What is the Ratio of Females per 100 Males in Meraux?
There are 109.68 Females per 100 Males in Meraux.
What is the Median Population Age in Meraux?
Median Population Age in Meraux is 39.9 Years.
What is the Average Family Size in Meraux
Average Family Size in Meraux is 3.6 People.
What is the Average Household Size in Meraux
Average Household Size in Meraux is 3.0 People.
What is Per Capita Income in Meraux?
Per Capita income in Meraux is $33,226.
What is the Median Family Income in Meraux?
Median Family Income in Meraux is $85,972.
What is the Median Household income in Meraux?
Median Household Income in Meraux is $70,707.
What is Income or Wage Gap in Meraux?
Income or Wage Gap in Meraux is 27.5%.
Women in Meraux earn 72.5 cents for every dollar earned by a man.
What is Family Income Deficit in Meraux?
Family Income Deficit in Meraux is $12,854.
Families that are below poverty line in Meraux earn $12,854 less on average than the poverty threshold level.
What is Inequality or Gini Index in Meraux?
Inequality or Gini Index in Meraux is 0.43.
How Large is the Labor Force in Meraux?
There are 3,905 People in the Labor Forcein in Meraux.
What is the Percentage of People in the Labor Force in Meraux?
68.4% of People are in the Labor Force in Meraux.
What is the Unemployment Rate in Meraux?
Unemployment Rate in Meraux is 3.5%.