Harvey, LA
Harvey Map
Harvey Overview
21,485
TOTAL POPULATION
10,844
MALE POPULATION
10,641
FEMALE POPULATION
101.91
MALES / 100 FEMALES
98.13
FEMALES / 100 MALES
37.5
MEDIAN AGE
3.4
AVG FAMILY SIZE
2.5
AVG HOUSEHOLD SIZE
$25,398
PER CAPITA INCOME
$54,574
AVG FAMILY INCOME
$41,994
AVG HOUSEHOLD INCOME
19.2%
WAGE / INCOME GAP [ % ]
80.8¢/ $1
WAGE / INCOME GAP [ $ ]
$12,075
FAMILY INCOME DEFICIT
0.47
INEQUALITY / GINI INDEX
9,871
LABOR FORCE [ PEOPLE ]
59.8%
PERCENT IN LABOR FORCE
9.5%
UNEMPLOYMENT RATE
Harvey Zip Codes
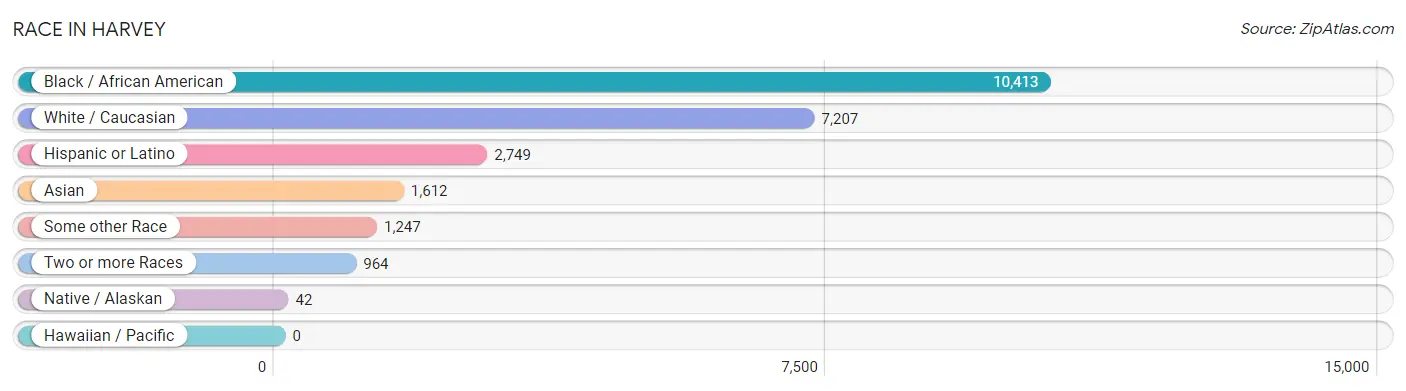
Race in Harvey
The most populous races in Harvey are Black / African American (10,413 | 48.5%), White / Caucasian (7,207 | 33.5%), and Hispanic or Latino (2,749 | 12.8%).
| Race | # Population | % Population |
| Asian | 1,612 | 7.5% |
| Black / African American | 10,413 | 48.5% |
| Hawaiian / Pacific | 0 | 0.0% |
| Hispanic or Latino | 2,749 | 12.8% |
| Native / Alaskan | 42 | 0.2% |
| White / Caucasian | 7,207 | 33.5% |
| Two or more Races | 964 | 4.5% |
| Some other Race | 1,247 | 5.8% |
| Total | 21,485 | 100.0% |
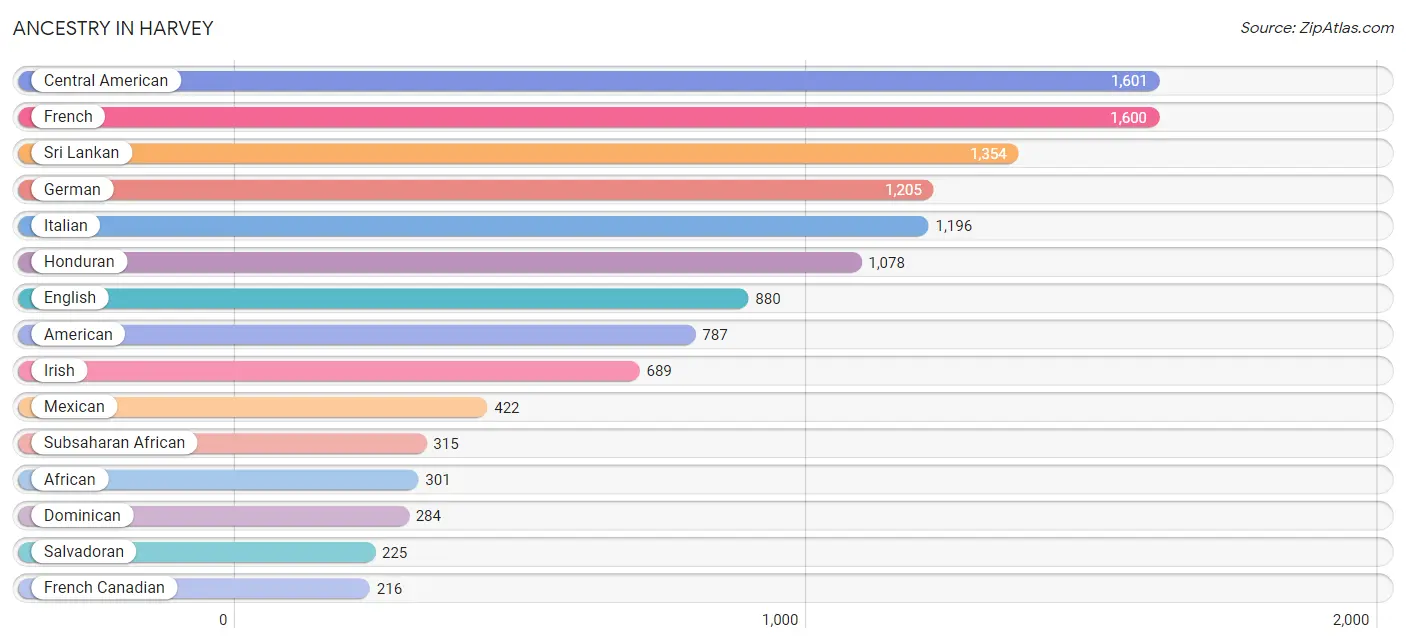
Ancestry in Harvey
The most populous ancestries reported in Harvey are Central American (1,601 | 7.4%), French (1,600 | 7.4%), Sri Lankan (1,354 | 6.3%), German (1,205 | 5.6%), and Italian (1,196 | 5.6%), together accounting for 32.4% of all Harvey residents.
| Ancestry | # Population | % Population |
| African | 301 | 1.4% |
| American | 787 | 3.7% |
| Arab | 182 | 0.9% |
| Bhutanese | 15 | 0.1% |
| British | 139 | 0.6% |
| Central American | 1,601 | 7.4% |
| Costa Rican | 10 | 0.1% |
| Cuban | 124 | 0.6% |
| Czech | 122 | 0.6% |
| Dominican | 284 | 1.3% |
| Dutch | 60 | 0.3% |
| English | 880 | 4.1% |
| European | 139 | 0.6% |
| French | 1,600 | 7.4% |
| French Canadian | 216 | 1.0% |
| German | 1,205 | 5.6% |
| Greek | 44 | 0.2% |
| Guatemalan | 188 | 0.9% |
| Haitian | 98 | 0.5% |
| Honduran | 1,078 | 5.0% |
| Hopi | 11 | 0.1% |
| Houma | 2 | 0.0% |
| Hungarian | 6 | 0.0% |
| Indian (Asian) | 202 | 0.9% |
| Irish | 689 | 3.2% |
| Italian | 1,196 | 5.6% |
| Jamaican | 76 | 0.4% |
| Korean | 49 | 0.2% |
| Lithuanian | 9 | 0.0% |
| Mexican | 422 | 2.0% |
| Mexican American Indian | 7 | 0.0% |
| New Zealander | 6 | 0.0% |
| Nigerian | 14 | 0.1% |
| Norwegian | 28 | 0.1% |
| Pakistani | 18 | 0.1% |
| Palestinian | 153 | 0.7% |
| Polish | 9 | 0.0% |
| Puerto Rican | 24 | 0.1% |
| Salvadoran | 225 | 1.1% |
| Scandinavian | 26 | 0.1% |
| Scotch-Irish | 105 | 0.5% |
| Scottish | 29 | 0.1% |
| South American | 6 | 0.0% |
| Spaniard | 32 | 0.2% |
| Spanish | 117 | 0.5% |
| Spanish American | 29 | 0.1% |
| Sri Lankan | 1,354 | 6.3% |
| Subsaharan African | 315 | 1.5% |
| Swedish | 7 | 0.0% |
| Syrian | 12 | 0.1% |
| Thai | 14 | 0.1% |
| Venezuelan | 6 | 0.0% |
| Welsh | 30 | 0.1% | View All 53 Rows |
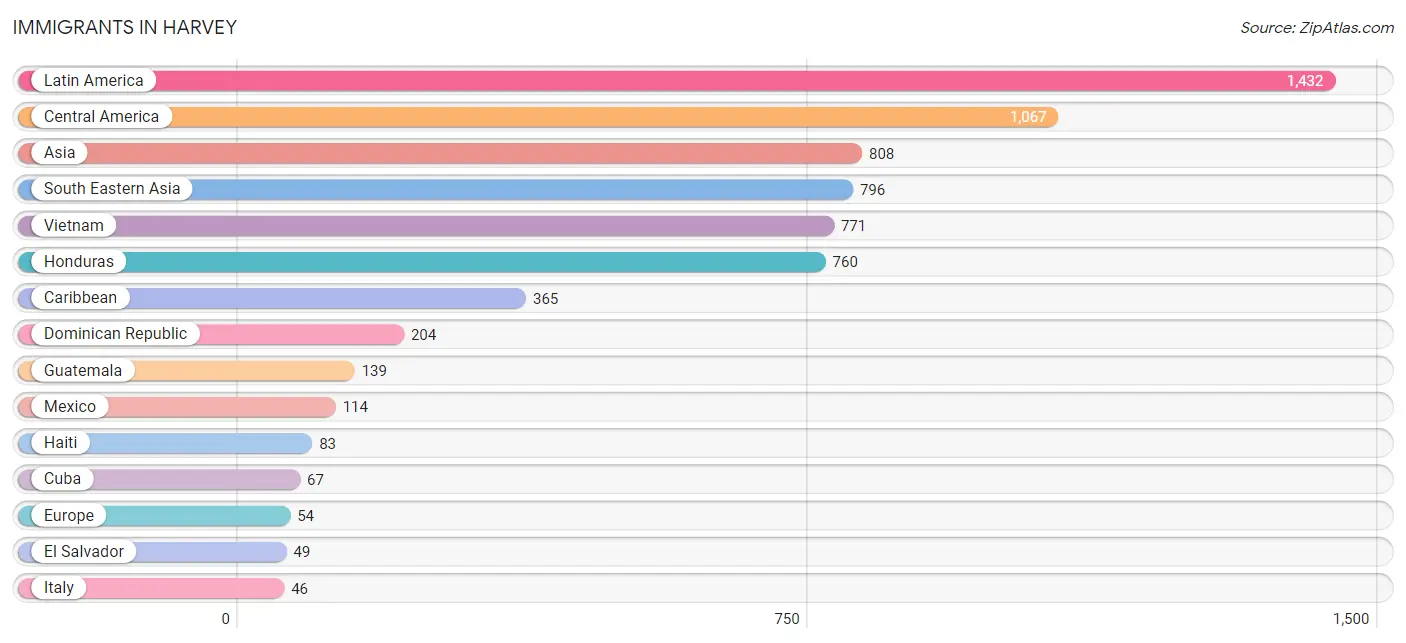
Immigrants in Harvey
The most numerous immigrant groups reported in Harvey came from Latin America (1,432 | 6.7%), Central America (1,067 | 5.0%), Asia (808 | 3.8%), South Eastern Asia (796 | 3.7%), and Vietnam (771 | 3.6%), together accounting for 22.7% of all Harvey residents.
| Immigration Origin | # Population | % Population |
| Africa | 44 | 0.2% |
| Asia | 808 | 3.8% |
| Canada | 11 | 0.1% |
| Caribbean | 365 | 1.7% |
| Central America | 1,067 | 5.0% |
| Cuba | 67 | 0.3% |
| Dominican Republic | 204 | 0.9% |
| El Salvador | 49 | 0.2% |
| Europe | 54 | 0.3% |
| Guatemala | 139 | 0.6% |
| Haiti | 83 | 0.4% |
| Honduras | 760 | 3.5% |
| Italy | 46 | 0.2% |
| Jamaica | 11 | 0.1% |
| Latin America | 1,432 | 6.7% |
| Mexico | 114 | 0.5% |
| Nicaragua | 5 | 0.0% |
| Nigeria | 7 | 0.0% |
| Northern Africa | 11 | 0.1% |
| Northern Europe | 8 | 0.0% |
| Oceania | 6 | 0.0% |
| South Eastern Asia | 796 | 3.7% |
| Southern Europe | 46 | 0.2% |
| Syria | 12 | 0.1% |
| Thailand | 25 | 0.1% |
| Vietnam | 771 | 3.6% |
| Western Africa | 7 | 0.0% |
| Western Asia | 12 | 0.1% | View All 28 Rows |
Sex and Age in Harvey
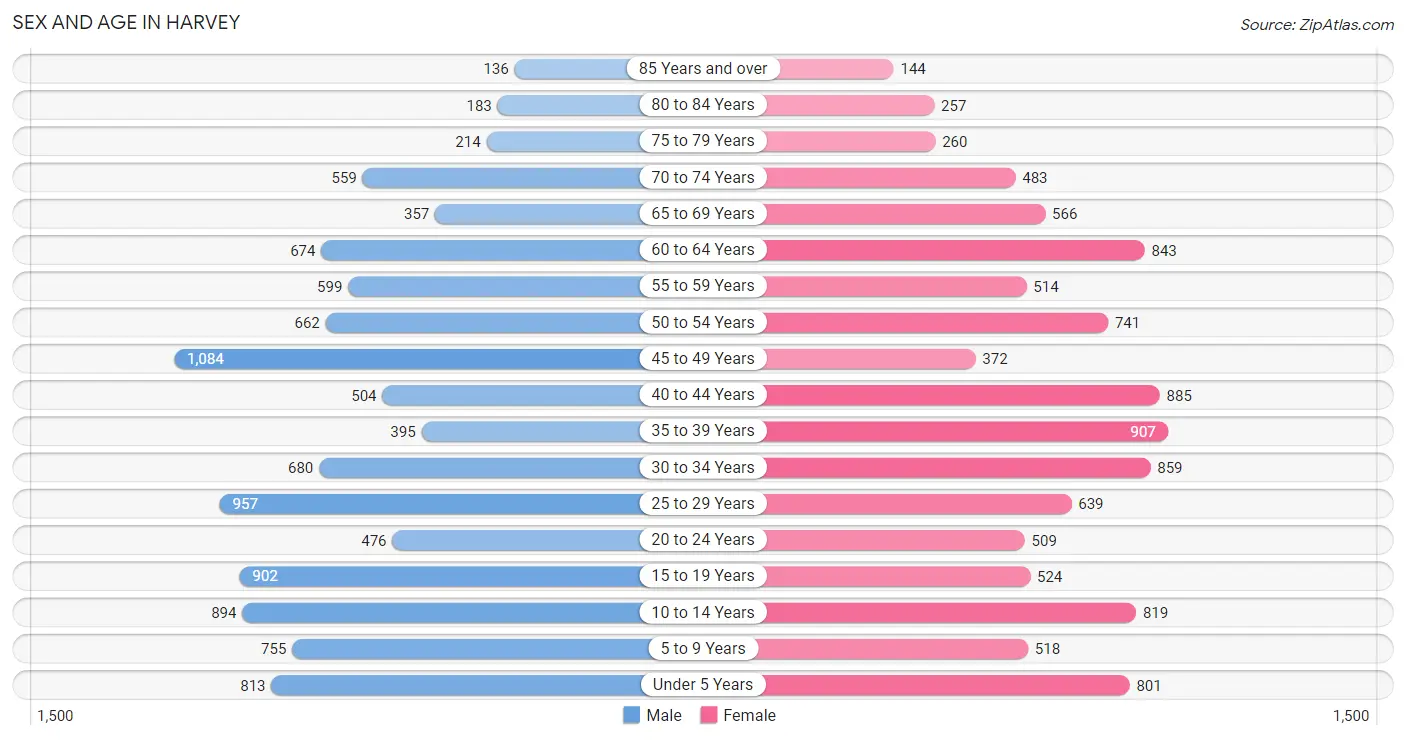
Sex and Age in Harvey
The most populous age groups in Harvey are 45 to 49 Years (1,084 | 10.0%) for men and 35 to 39 Years (907 | 8.5%) for women.
| Age Bracket | Male | Female |
| Under 5 Years | 813 (7.5%) | 801 (7.5%) |
| 5 to 9 Years | 755 (7.0%) | 518 (4.9%) |
| 10 to 14 Years | 894 (8.2%) | 819 (7.7%) |
| 15 to 19 Years | 902 (8.3%) | 524 (4.9%) |
| 20 to 24 Years | 476 (4.4%) | 509 (4.8%) |
| 25 to 29 Years | 957 (8.8%) | 639 (6.0%) |
| 30 to 34 Years | 680 (6.3%) | 859 (8.1%) |
| 35 to 39 Years | 395 (3.6%) | 907 (8.5%) |
| 40 to 44 Years | 504 (4.6%) | 885 (8.3%) |
| 45 to 49 Years | 1,084 (10.0%) | 372 (3.5%) |
| 50 to 54 Years | 662 (6.1%) | 741 (7.0%) |
| 55 to 59 Years | 599 (5.5%) | 514 (4.8%) |
| 60 to 64 Years | 674 (6.2%) | 843 (7.9%) |
| 65 to 69 Years | 357 (3.3%) | 566 (5.3%) |
| 70 to 74 Years | 559 (5.1%) | 483 (4.5%) |
| 75 to 79 Years | 214 (2.0%) | 260 (2.4%) |
| 80 to 84 Years | 183 (1.7%) | 257 (2.4%) |
| 85 Years and over | 136 (1.3%) | 144 (1.3%) |
| Total | 10,844 (100.0%) | 10,641 (100.0%) |
Families and Households in Harvey
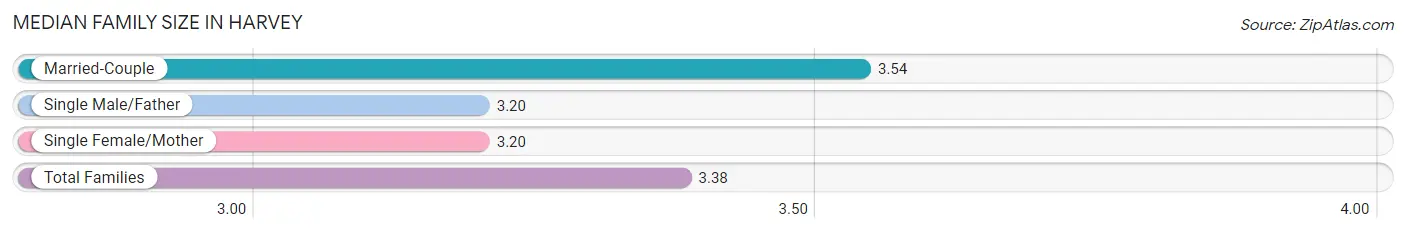
Median Family Size in Harvey
The median family size in Harvey is 3.38 persons per family, with married-couple families (2,610 | 52.9%) accounting for the largest median family size of 3.54 persons per family. On the other hand, single male/father families (416 | 8.4%) represent the smallest median family size with 3.20 persons per family.
| Family Type | # Families | Family Size |
| Married-Couple | 2,610 (52.9%) | 3.54 |
| Single Male/Father | 416 (8.4%) | 3.20 |
| Single Female/Mother | 1,903 (38.6%) | 3.20 |
| Total Families | 4,929 (100.0%) | 3.38 |
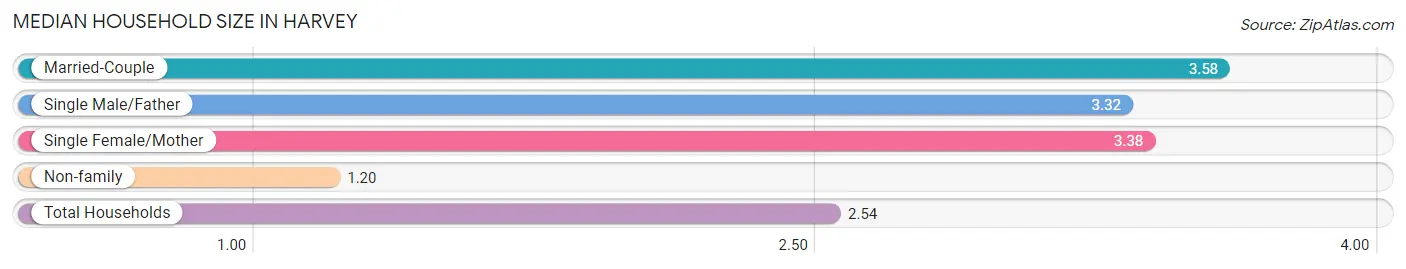
Median Household Size in Harvey
The median household size in Harvey is 2.54 persons per household, with married-couple households (2,610 | 31.1%) accounting for the largest median household size of 3.58 persons per household. non-family households (3,450 | 41.2%) represent the smallest median household size with 1.20 persons per household.
| Household Type | # Households | Household Size |
| Married-Couple | 2,610 (31.1%) | 3.58 |
| Single Male/Father | 416 (5.0%) | 3.32 |
| Single Female/Mother | 1,903 (22.7%) | 3.38 |
| Non-family | 3,450 (41.2%) | 1.20 |
| Total Households | 8,379 (100.0%) | 2.54 |
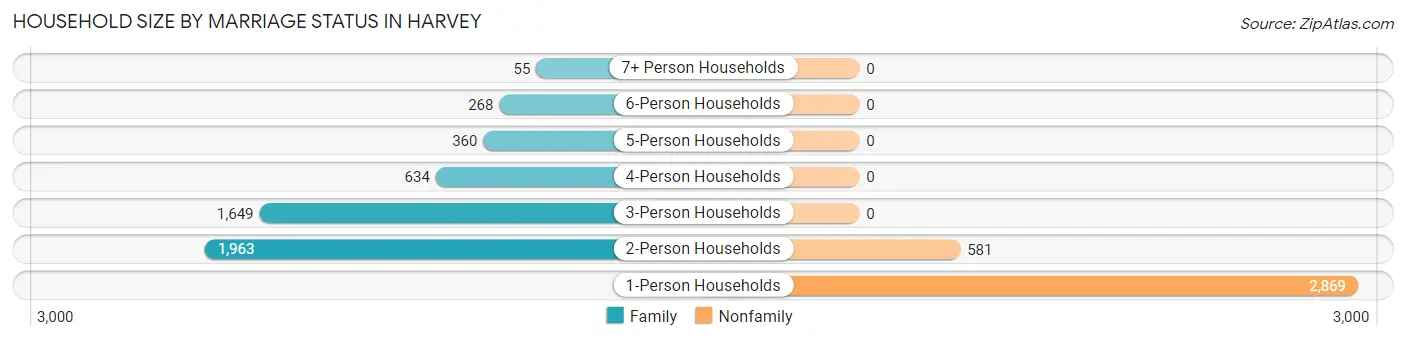
Household Size by Marriage Status in Harvey
Out of a total of 8,379 households in Harvey, 4,929 (58.8%) are family households, while 3,450 (41.2%) are nonfamily households. The most numerous type of family households are 2-person households, comprising 1,963, and the most common type of nonfamily households are 1-person households, comprising 2,869.
| Household Size | Family Households | Nonfamily Households |
| 1-Person Households | - | 2,869 (34.2%) |
| 2-Person Households | 1,963 (23.4%) | 581 (6.9%) |
| 3-Person Households | 1,649 (19.7%) | 0 (0.0%) |
| 4-Person Households | 634 (7.6%) | 0 (0.0%) |
| 5-Person Households | 360 (4.3%) | 0 (0.0%) |
| 6-Person Households | 268 (3.2%) | 0 (0.0%) |
| 7+ Person Households | 55 (0.7%) | 0 (0.0%) |
| Total | 4,929 (58.8%) | 3,450 (41.2%) |
Female Fertility in Harvey
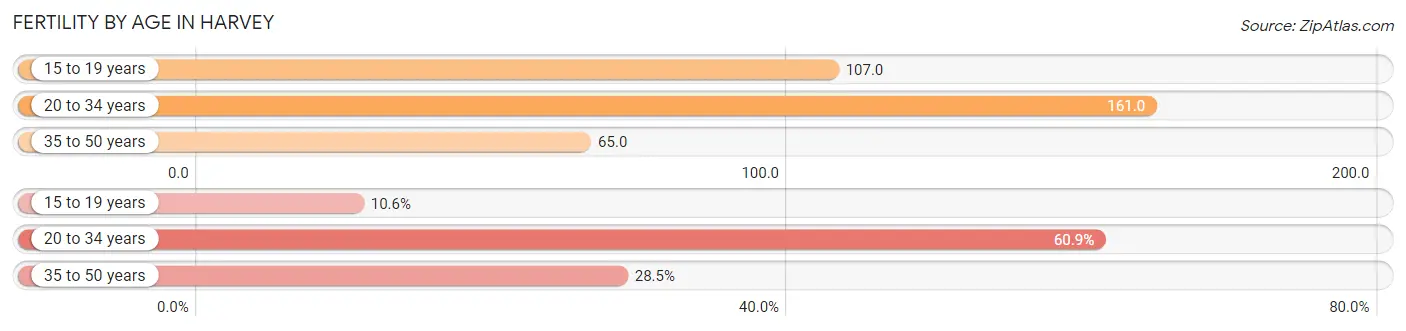
Fertility by Age in Harvey
Average fertility rate in Harvey is 109.0 births per 1,000 women. Women in the age bracket of 20 to 34 years have the highest fertility rate with 161.0 births per 1,000 women. Women in the age bracket of 20 to 34 years acount for 60.9% of all women with births.
| Age Bracket | Women with Births | Births / 1,000 Women |
| 15 to 19 years | 56 (10.6%) | 107.0 |
| 20 to 34 years | 323 (60.9%) | 161.0 |
| 35 to 50 years | 151 (28.5%) | 65.0 |
| Total | 530 (100.0%) | 109.0 |
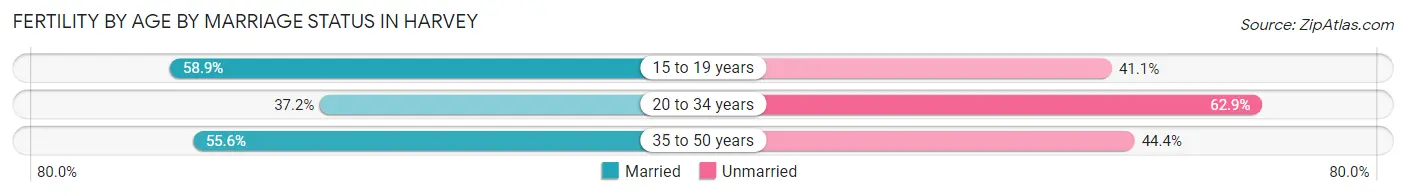
Fertility by Age by Marriage Status in Harvey
44.7% of women with births (530) in Harvey are married. The highest percentage of unmarried women with births falls into 20 to 34 years age bracket with 62.8% of them unmarried at the time of birth, while the lowest percentage of unmarried women with births belong to 15 to 19 years age bracket with 41.1% of them unmarried.
| Age Bracket | Married | Unmarried |
| 15 to 19 years | 33 (58.9%) | 23 (41.1%) |
| 20 to 34 years | 120 (37.1%) | 203 (62.8%) |
| 35 to 50 years | 84 (55.6%) | 67 (44.4%) |
| Total | 237 (44.7%) | 293 (55.3%) |
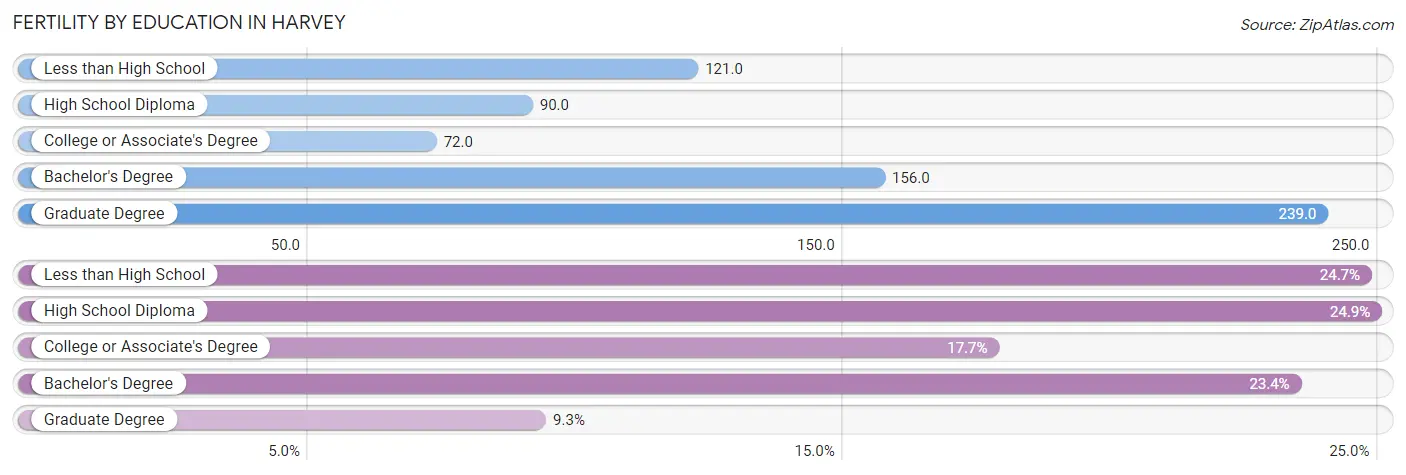
Fertility by Education in Harvey
Average fertility rate in Harvey is 109.0 births per 1,000 women. Women with the education attainment of graduate degree have the highest fertility rate of 239.0 births per 1,000 women, while women with the education attainment of college or associate's degree have the lowest fertility at 72.0 births per 1,000 women. Women with the education attainment of high school diploma represent 24.9% of all women with births.
| Educational Attainment | Women with Births | Births / 1,000 Women |
| Less than High School | 131 (24.7%) | 121.0 |
| High School Diploma | 132 (24.9%) | 90.0 |
| College or Associate's Degree | 94 (17.7%) | 72.0 |
| Bachelor's Degree | 124 (23.4%) | 156.0 |
| Graduate Degree | 49 (9.2%) | 239.0 |
| Total | 530 (100.0%) | 109.0 |
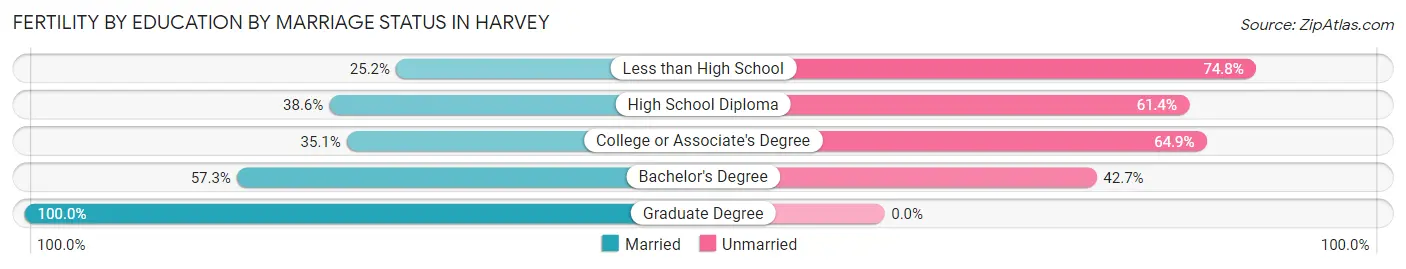
Fertility by Education by Marriage Status in Harvey
55.3% of women with births in Harvey are unmarried. Women with the educational attainment of graduate degree are most likely to be married with 100.0% of them married at childbirth, while women with the educational attainment of less than high school are least likely to be married with 74.8% of them unmarried at childbirth.
| Educational Attainment | Married | Unmarried |
| Less than High School | 33 (25.2%) | 98 (74.8%) |
| High School Diploma | 51 (38.6%) | 81 (61.4%) |
| College or Associate's Degree | 33 (35.1%) | 61 (64.9%) |
| Bachelor's Degree | 71 (57.3%) | 53 (42.7%) |
| Graduate Degree | 49 (100.0%) | 0 (0.0%) |
| Total | 237 (44.7%) | 293 (55.3%) |
Income in Harvey
Income Overview in Harvey
Per Capita Income in Harvey is $25,398, while median incomes of families and households are $54,574 and $41,994 respectively.
| Characteristic | Number | Measure |
| Per Capita Income | 21,485 | $25,398 |
| Median Family Income | 4,929 | $54,574 |
| Mean Family Income | 4,929 | $73,530 |
| Median Household Income | 8,379 | $41,994 |
| Mean Household Income | 8,379 | $60,839 |
| Income Deficit | 4,929 | $12,075 |
| Wage / Income Gap (%) | 21,485 | 19.16% |
| Wage / Income Gap ($) | 21,485 | 80.84¢ per $1 |
| Gini / Inequality Index | 21,485 | 0.47 |
Earnings by Sex in Harvey
Average Earnings in Harvey are $29,817, $34,336 for men and $27,758 for women, a difference of 19.2%.
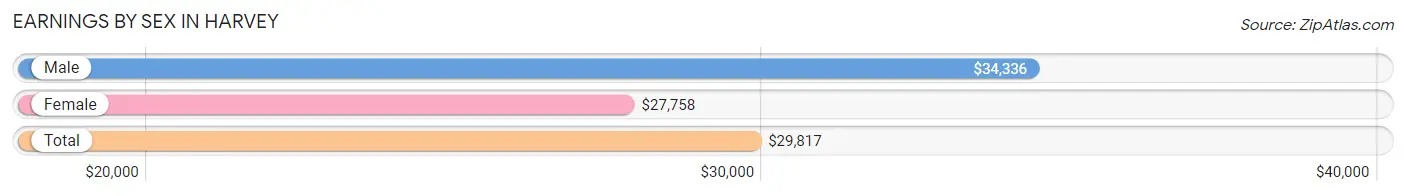
| Sex | Number | Average Earnings |
| Male | 5,196 (50.7%) | $34,336 |
| Female | 5,052 (49.3%) | $27,758 |
| Total | 10,248 (100.0%) | $29,817 |
Earnings by Sex by Income Bracket in Harvey
The most common earnings brackets in Harvey are $100,000+ for men (593 | 11.4%) and $25,000 to $29,999 for women (592 | 11.7%).
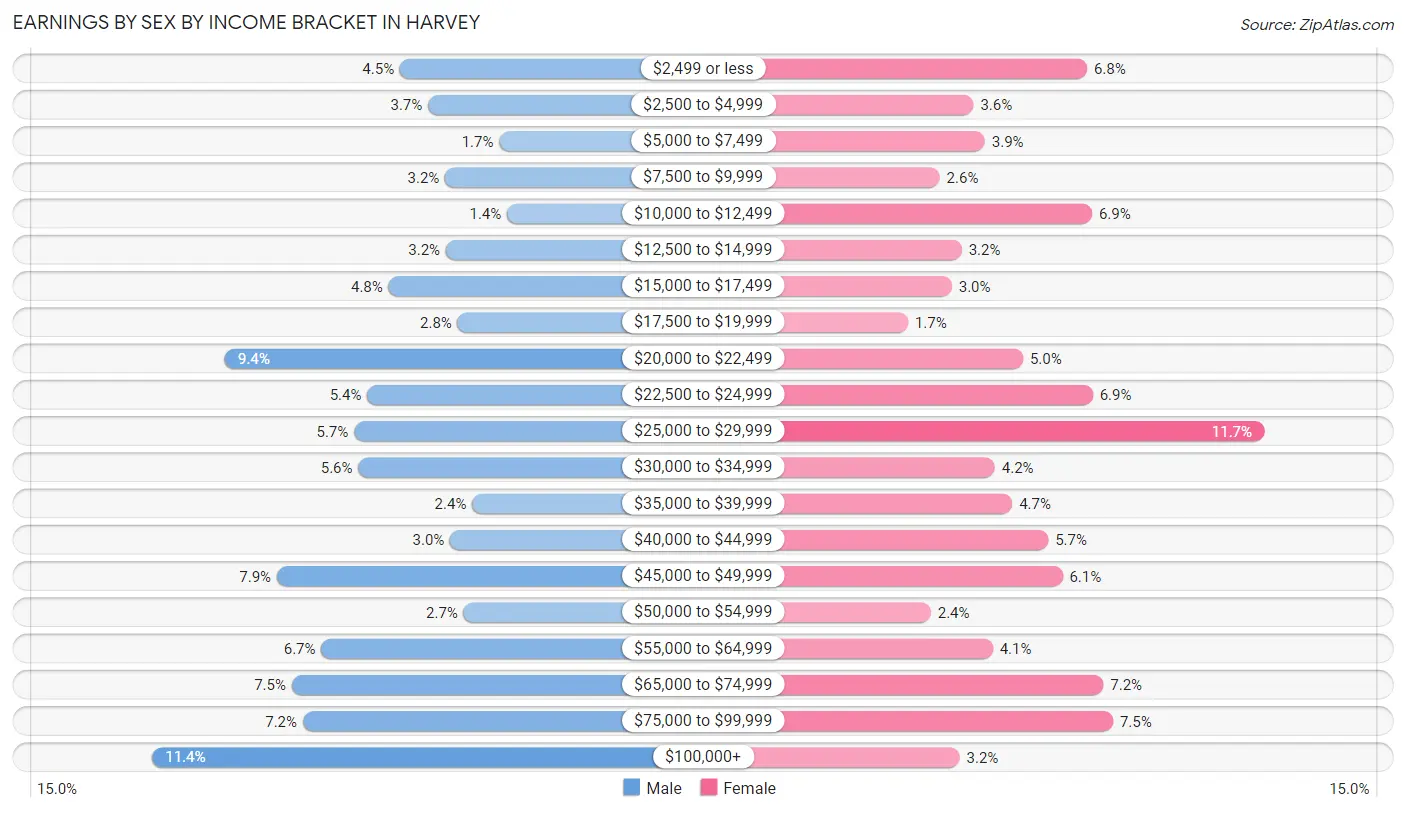
| Income | Male | Female |
| $2,499 or less | 231 (4.4%) | 341 (6.8%) |
| $2,500 to $4,999 | 190 (3.7%) | 180 (3.6%) |
| $5,000 to $7,499 | 86 (1.7%) | 196 (3.9%) |
| $7,500 to $9,999 | 165 (3.2%) | 132 (2.6%) |
| $10,000 to $12,499 | 75 (1.4%) | 348 (6.9%) |
| $12,500 to $14,999 | 164 (3.2%) | 163 (3.2%) |
| $15,000 to $17,499 | 248 (4.8%) | 149 (2.9%) |
| $17,500 to $19,999 | 147 (2.8%) | 87 (1.7%) |
| $20,000 to $22,499 | 487 (9.4%) | 250 (5.0%) |
| $22,500 to $24,999 | 279 (5.4%) | 349 (6.9%) |
| $25,000 to $29,999 | 298 (5.7%) | 592 (11.7%) |
| $30,000 to $34,999 | 292 (5.6%) | 210 (4.2%) |
| $35,000 to $39,999 | 126 (2.4%) | 235 (4.6%) |
| $40,000 to $44,999 | 158 (3.0%) | 286 (5.7%) |
| $45,000 to $49,999 | 411 (7.9%) | 306 (6.1%) |
| $50,000 to $54,999 | 138 (2.7%) | 119 (2.4%) |
| $55,000 to $64,999 | 346 (6.7%) | 207 (4.1%) |
| $65,000 to $74,999 | 389 (7.5%) | 364 (7.2%) |
| $75,000 to $99,999 | 373 (7.2%) | 378 (7.5%) |
| $100,000+ | 593 (11.4%) | 160 (3.2%) |
| Total | 5,196 (100.0%) | 5,052 (100.0%) |
Earnings by Sex by Educational Attainment in Harvey
Average earnings in Harvey are $38,832 for men and $29,293 for women, a difference of 24.6%. Men with an educational attainment of bachelor's degree enjoy the highest average annual earnings of $48,333, while those with high school diploma education earn the least with $33,030. Women with an educational attainment of graduate degree earn the most with the average annual earnings of $63,500, while those with less than high school education have the smallest earnings of $22,404.
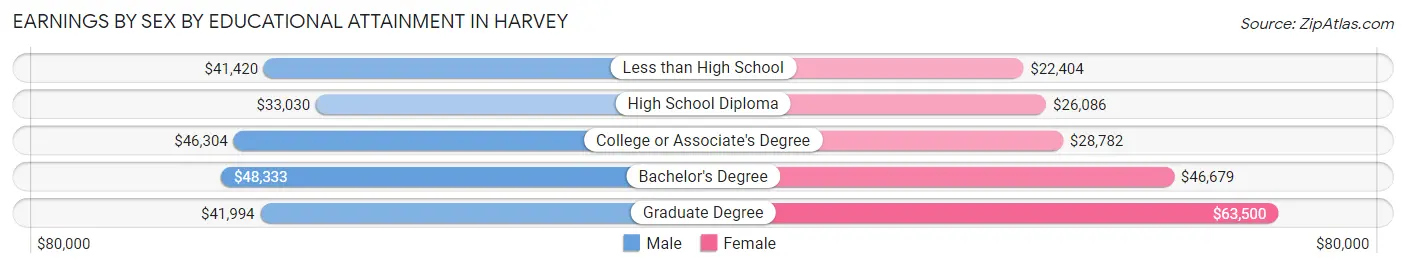
| Educational Attainment | Male Income | Female Income |
| Less than High School | $41,420 | $22,404 |
| High School Diploma | $33,030 | $26,086 |
| College or Associate's Degree | $46,304 | $28,782 |
| Bachelor's Degree | $48,333 | $46,679 |
| Graduate Degree | $41,994 | $63,500 |
| Total | $38,832 | $29,293 |
Family Income in Harvey
Family Income Brackets in Harvey
According to the Harvey family income data, there are 863 families falling into the $100,000 to $149,999 income range, which is the most common income bracket and makes up 17.5% of all families. Conversely, the $200,000+ income bracket is the least frequent group with only 197 families (4.0%) belonging to this category.
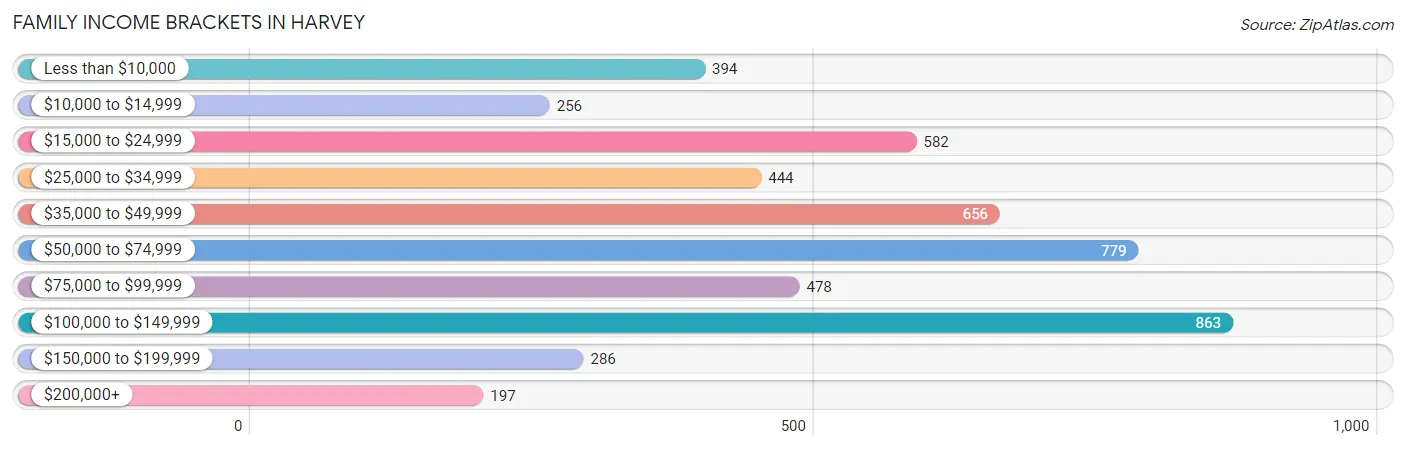
| Income Bracket | # Families | % Families |
| Less than $10,000 | 394 | 8.0% |
| $10,000 to $14,999 | 256 | 5.2% |
| $15,000 to $24,999 | 582 | 11.8% |
| $25,000 to $34,999 | 444 | 9.0% |
| $35,000 to $49,999 | 656 | 13.3% |
| $50,000 to $74,999 | 779 | 15.8% |
| $75,000 to $99,999 | 478 | 9.7% |
| $100,000 to $149,999 | 863 | 17.5% |
| $150,000 to $199,999 | 286 | 5.8% |
| $200,000+ | 197 | 4.0% |
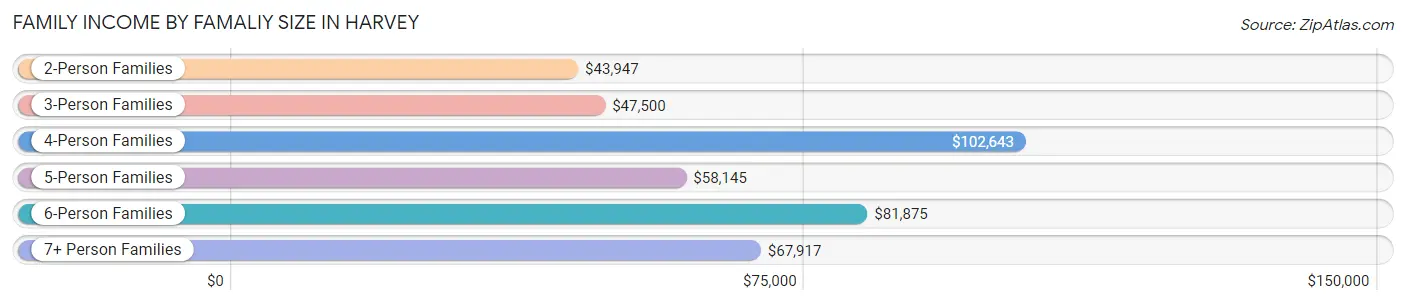
Family Income by Famaliy Size in Harvey
4-person families (592 | 12.0%) account for the highest median family income in Harvey with $102,643 per family, while 4-person families (592 | 12.0%) have the highest median income of $25,661 per family member.
| Income Bracket | # Families | Median Income |
| 2-Person Families | 2,230 (45.2%) | $43,947 |
| 3-Person Families | 1,486 (30.1%) | $47,500 |
| 4-Person Families | 592 (12.0%) | $102,643 |
| 5-Person Families | 303 (6.1%) | $58,145 |
| 6-Person Families | 263 (5.3%) | $81,875 |
| 7+ Person Families | 55 (1.1%) | $67,917 |
| Total | 4,929 (100.0%) | $54,574 |
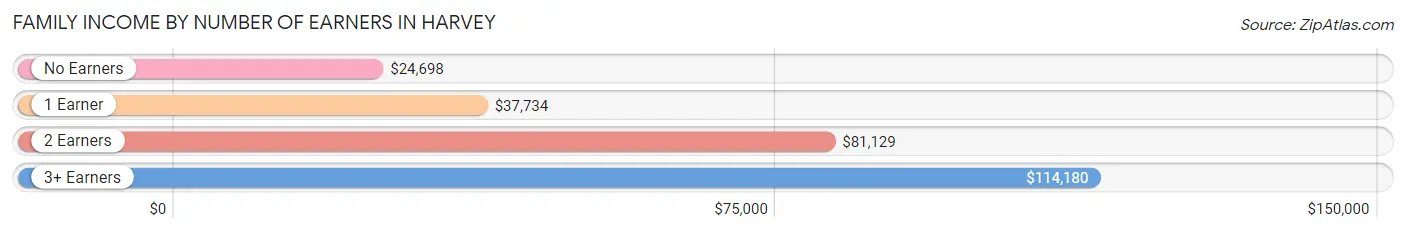
Family Income by Number of Earners in Harvey
The median family income in Harvey is $54,574, with families comprising 3+ earners (439) having the highest median family income of $114,180, while families with no earners (819) have the lowest median family income of $24,698, accounting for 8.9% and 16.6% of families, respectively.
| Number of Earners | # Families | Median Income |
| No Earners | 819 (16.6%) | $24,698 |
| 1 Earner | 2,127 (43.1%) | $37,734 |
| 2 Earners | 1,544 (31.3%) | $81,129 |
| 3+ Earners | 439 (8.9%) | $114,180 |
| Total | 4,929 (100.0%) | $54,574 |
Household Income in Harvey
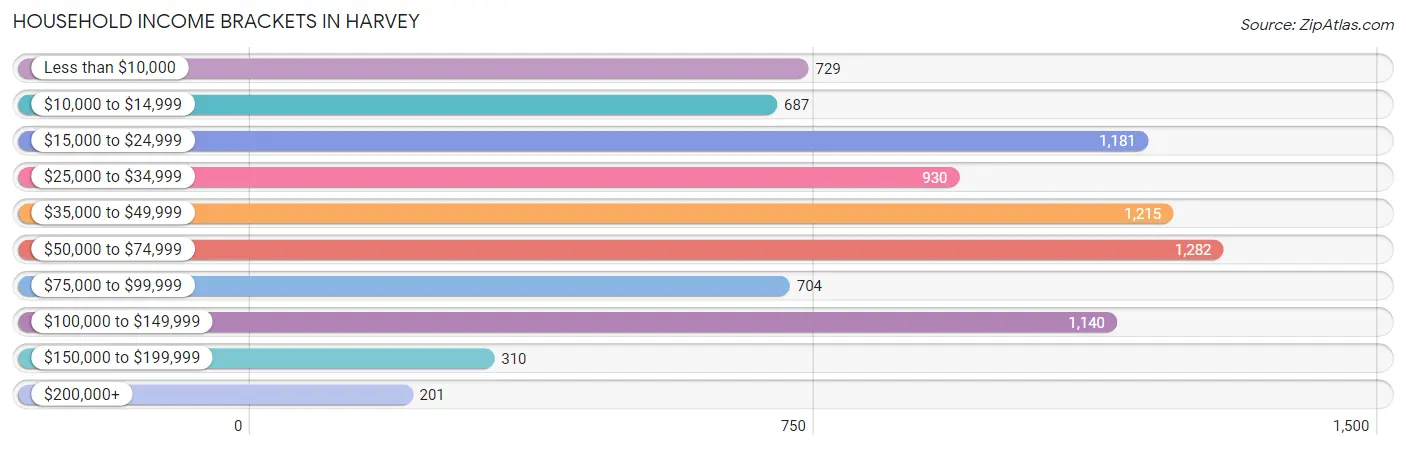
Household Income Brackets in Harvey
With 1,282 households falling in the category, the $50,000 to $74,999 income range is the most frequent in Harvey, accounting for 15.3% of all households. In contrast, only 201 households (2.4%) fall into the $200,000+ income bracket, making it the least populous group.
| Income Bracket | # Households | % Households |
| Less than $10,000 | 729 | 8.7% |
| $10,000 to $14,999 | 687 | 8.2% |
| $15,000 to $24,999 | 1,181 | 14.1% |
| $25,000 to $34,999 | 930 | 11.1% |
| $35,000 to $49,999 | 1,215 | 14.5% |
| $50,000 to $74,999 | 1,282 | 15.3% |
| $75,000 to $99,999 | 704 | 8.4% |
| $100,000 to $149,999 | 1,140 | 13.6% |
| $150,000 to $199,999 | 310 | 3.7% |
| $200,000+ | 201 | 2.4% |
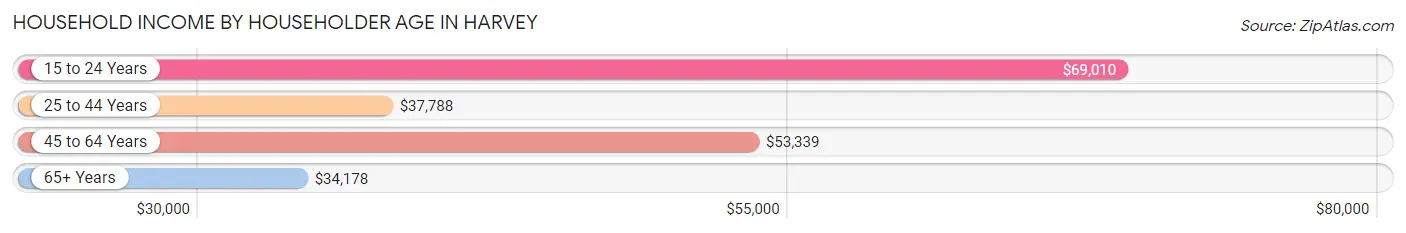
Household Income by Householder Age in Harvey
The median household income in Harvey is $41,994, with the highest median household income of $69,010 found in the 15 to 24 years age bracket for the primary householder. A total of 181 households (2.2%) fall into this category. Meanwhile, the 65+ years age bracket for the primary householder has the lowest median household income of $34,178, with 2,071 households (24.7%) in this group.
| Income Bracket | # Households | Median Income |
| 15 to 24 Years | 181 (2.2%) | $69,010 |
| 25 to 44 Years | 3,188 (38.1%) | $37,788 |
| 45 to 64 Years | 2,939 (35.1%) | $53,339 |
| 65+ Years | 2,071 (24.7%) | $34,178 |
| Total | 8,379 (100.0%) | $41,994 |
Poverty in Harvey
Income Below Poverty by Sex and Age in Harvey
With 22.3% poverty level for males and 27.0% for females among the residents of Harvey, 5 year old males and 15 year old females are the most vulnerable to poverty, with 14 males (46.7%) and 49 females (46.2%) in their respective age groups living below the poverty level.
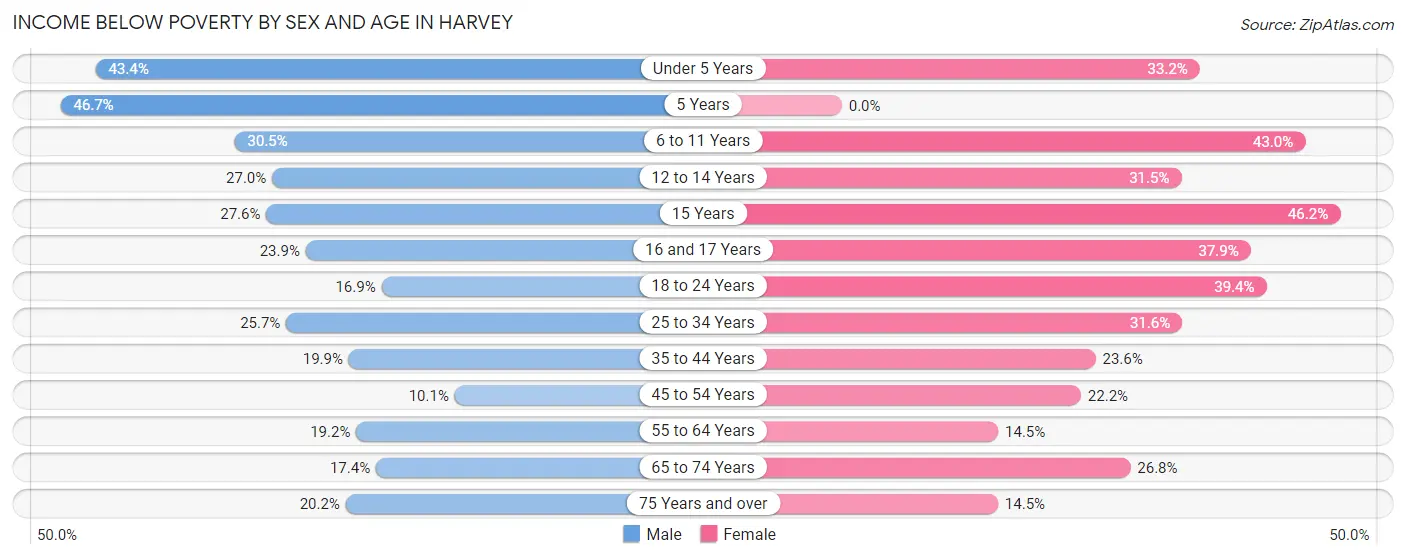
| Age Bracket | Male | Female |
| Under 5 Years | 353 (43.4%) | 266 (33.2%) |
| 5 Years | 14 (46.7%) | 0 (0.0%) |
| 6 to 11 Years | 265 (30.5%) | 273 (43.0%) |
| 12 to 14 Years | 203 (27.0%) | 189 (31.5%) |
| 15 Years | 75 (27.6%) | 49 (46.2%) |
| 16 and 17 Years | 93 (23.9%) | 110 (37.9%) |
| 18 to 24 Years | 121 (16.9%) | 251 (39.4%) |
| 25 to 34 Years | 421 (25.7%) | 473 (31.6%) |
| 35 to 44 Years | 179 (19.9%) | 422 (23.5%) |
| 45 to 54 Years | 176 (10.1%) | 247 (22.2%) |
| 55 to 64 Years | 238 (19.2%) | 194 (14.5%) |
| 65 to 74 Years | 152 (17.4%) | 274 (26.8%) |
| 75 Years and over | 100 (20.2%) | 93 (14.5%) |
| Total | 2,390 (22.3%) | 2,841 (27.0%) |
Income Above Poverty by Sex and Age in Harvey
According to the poverty statistics in Harvey, males aged 45 to 54 years and females aged 5 years are the age groups that are most secure financially, with 89.9% of males and 100.0% of females in these age groups living above the poverty line.
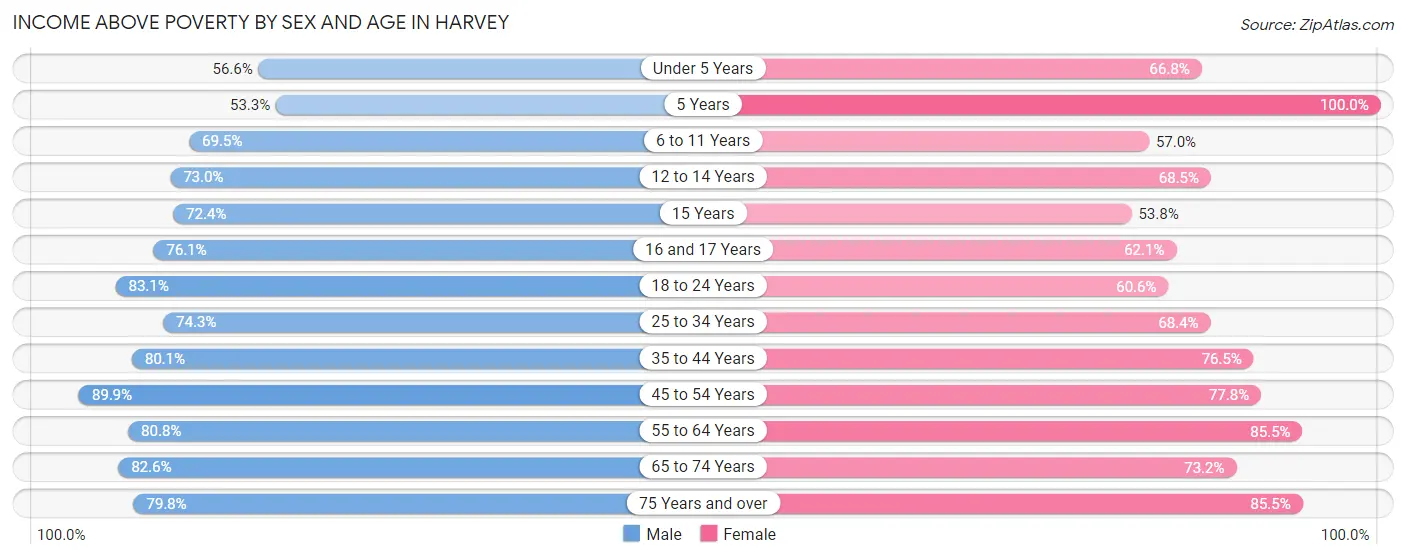
| Age Bracket | Male | Female |
| Under 5 Years | 460 (56.6%) | 535 (66.8%) |
| 5 Years | 16 (53.3%) | 68 (100.0%) |
| 6 to 11 Years | 603 (69.5%) | 362 (57.0%) |
| 12 to 14 Years | 548 (73.0%) | 411 (68.5%) |
| 15 Years | 197 (72.4%) | 57 (53.8%) |
| 16 and 17 Years | 296 (76.1%) | 180 (62.1%) |
| 18 to 24 Years | 596 (83.1%) | 386 (60.6%) |
| 25 to 34 Years | 1,216 (74.3%) | 1,025 (68.4%) |
| 35 to 44 Years | 720 (80.1%) | 1,370 (76.4%) |
| 45 to 54 Years | 1,570 (89.9%) | 866 (77.8%) |
| 55 to 64 Years | 1,000 (80.8%) | 1,143 (85.5%) |
| 65 to 74 Years | 722 (82.6%) | 749 (73.2%) |
| 75 Years and over | 395 (79.8%) | 549 (85.5%) |
| Total | 8,339 (77.7%) | 7,701 (73.1%) |
Income Below Poverty Among Married-Couple Families in Harvey
The poverty statistics for married-couple families in Harvey show that 11.7% or 306 of the total 2,610 families live below the poverty line. Families with 1 or 2 children have the highest poverty rate of 26.0%, comprising of 183 families. On the other hand, families with 5 or more children have the lowest poverty rate of 0.0%, which includes 0 families.
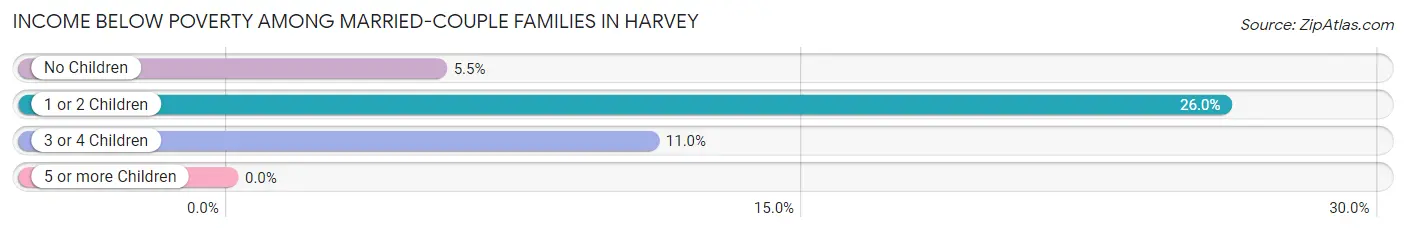
| Children | Above Poverty | Below Poverty |
| No Children | 1,456 (94.6%) | 84 (5.4%) |
| 1 or 2 Children | 522 (74.0%) | 183 (26.0%) |
| 3 or 4 Children | 316 (89.0%) | 39 (11.0%) |
| 5 or more Children | 10 (100.0%) | 0 (0.0%) |
| Total | 2,304 (88.3%) | 306 (11.7%) |
Income Below Poverty Among Single-Parent Households in Harvey
According to the poverty data in Harvey, 24.0% or 100 single-father households and 32.1% or 610 single-mother households are living below the poverty line. Among single-father households, those with 3 or 4 children have the highest poverty rate, with 15 households (100.0%) experiencing poverty. Likewise, among single-mother households, those with 3 or 4 children have the highest poverty rate, with 106 households (58.9%) falling below the poverty line.
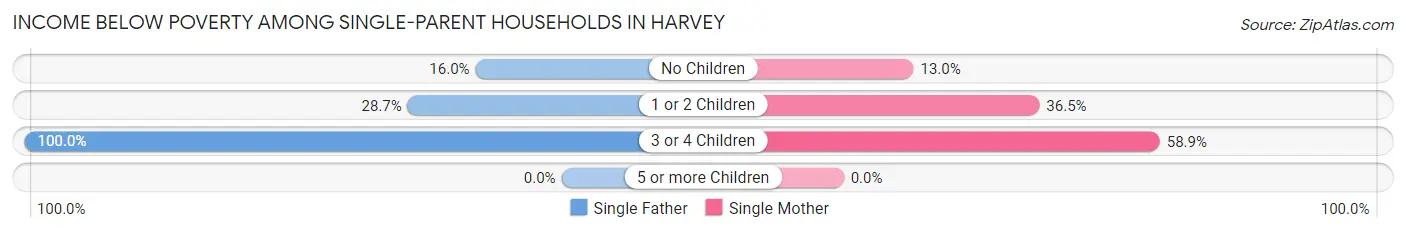
| Children | Single Father | Single Mother |
| No Children | 38 (16.0%) | 69 (13.0%) |
| 1 or 2 Children | 47 (28.7%) | 435 (36.5%) |
| 3 or 4 Children | 15 (100.0%) | 106 (58.9%) |
| 5 or more Children | 0 (0.0%) | 0 (0.0%) |
| Total | 100 (24.0%) | 610 (32.1%) |
Income Below Poverty Among Married-Couple vs Single-Parent Households in Harvey
The poverty data for Harvey shows that 306 of the married-couple family households (11.7%) and 710 of the single-parent households (30.6%) are living below the poverty level. Within the married-couple family households, those with 1 or 2 children have the highest poverty rate, with 183 households (26.0%) falling below the poverty line. Among the single-parent households, those with 3 or 4 children have the highest poverty rate, with 121 household (62.1%) living below poverty.
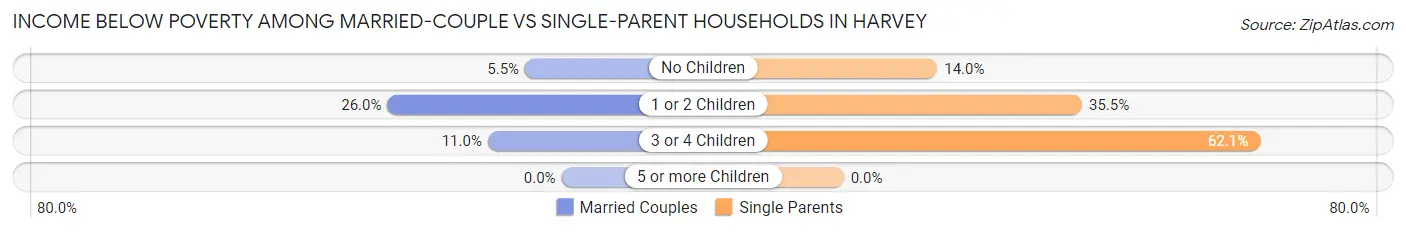
| Children | Married-Couple Families | Single-Parent Households |
| No Children | 84 (5.4%) | 107 (14.0%) |
| 1 or 2 Children | 183 (26.0%) | 482 (35.5%) |
| 3 or 4 Children | 39 (11.0%) | 121 (62.1%) |
| 5 or more Children | 0 (0.0%) | 0 (0.0%) |
| Total | 306 (11.7%) | 710 (30.6%) |
Employment Characteristics in Harvey
Employment by Class of Employer in Harvey
Among the 8,699 employed individuals in Harvey, private company employees (6,303 | 72.5%), self-employed (not incorporated) (501 | 5.8%), and local government employees (477 | 5.5%) make up the most common classes of employment.
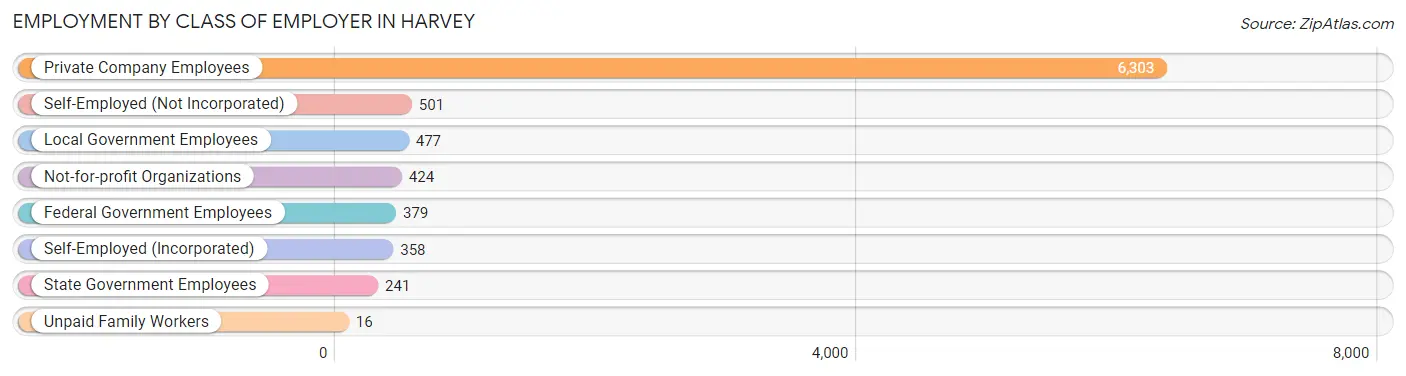
| Employer Class | # Employees | % Employees |
| Private Company Employees | 6,303 | 72.5% |
| Self-Employed (Incorporated) | 358 | 4.1% |
| Self-Employed (Not Incorporated) | 501 | 5.8% |
| Not-for-profit Organizations | 424 | 4.9% |
| Local Government Employees | 477 | 5.5% |
| State Government Employees | 241 | 2.8% |
| Federal Government Employees | 379 | 4.4% |
| Unpaid Family Workers | 16 | 0.2% |
| Total | 8,699 | 100.0% |
Employment Status by Age in Harvey
According to the labor force statistics for Harvey, out of the total population over 16 years of age (16,507), 59.8% or 9,871 individuals are in the labor force, with 9.5% or 938 of them unemployed. The age group with the highest labor force participation rate is 25 to 29 years, with 92.2% or 1,472 individuals in the labor force. Within the labor force, the 16 to 19 years age range has the highest percentage of unemployed individuals, with 28.2% or 35 of them being unemployed.
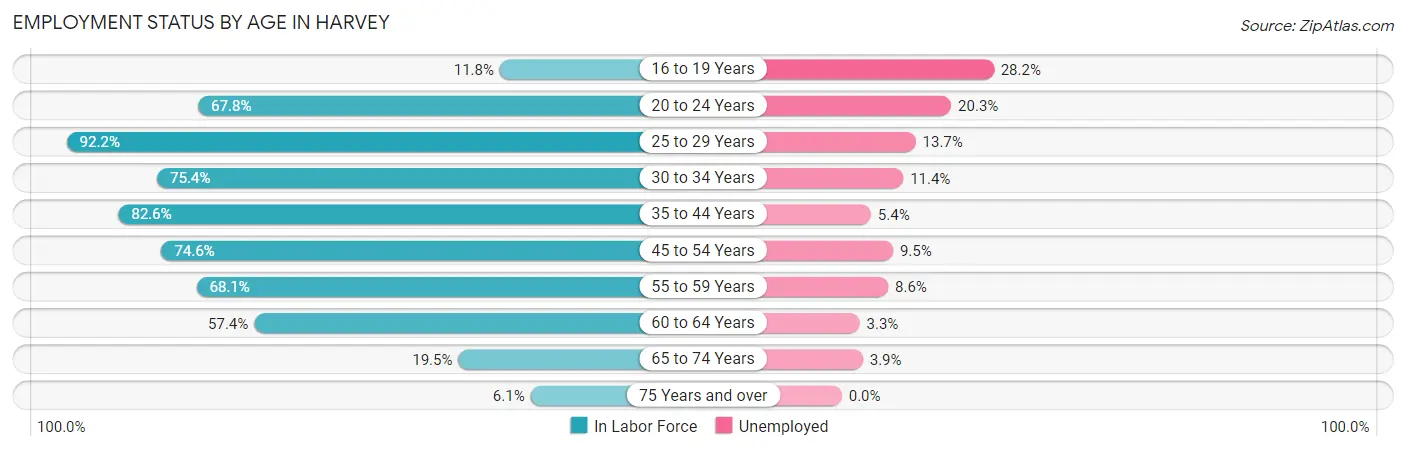
| Age Bracket | In Labor Force | Unemployed |
| 16 to 19 Years | 124 (11.8%) | 35 (28.2%) |
| 20 to 24 Years | 668 (67.8%) | 136 (20.3%) |
| 25 to 29 Years | 1,472 (92.2%) | 202 (13.7%) |
| 30 to 34 Years | 1,160 (75.4%) | 132 (11.4%) |
| 35 to 44 Years | 2,223 (82.6%) | 120 (5.4%) |
| 45 to 54 Years | 2,133 (74.6%) | 203 (9.5%) |
| 55 to 59 Years | 758 (68.1%) | 65 (8.6%) |
| 60 to 64 Years | 871 (57.4%) | 29 (3.3%) |
| 65 to 74 Years | 383 (19.5%) | 15 (3.9%) |
| 75 Years and over | 73 (6.1%) | 0 (0.0%) |
| Total | 9,871 (59.8%) | 938 (9.5%) |
Employment Status by Educational Attainment in Harvey
According to labor force statistics for Harvey, 76.2% of individuals (8,622) out of the total population between 25 and 64 years of age (11,315) are in the labor force, with 8.7% or 750 of them being unemployed. The group with the highest labor force participation rate are those with the educational attainment of bachelor's degree or higher, with 92.8% or 2,002 individuals in the labor force. Within the labor force, individuals with high school diploma education have the highest percentage of unemployment, with 13.3% or 369 of them being unemployed.
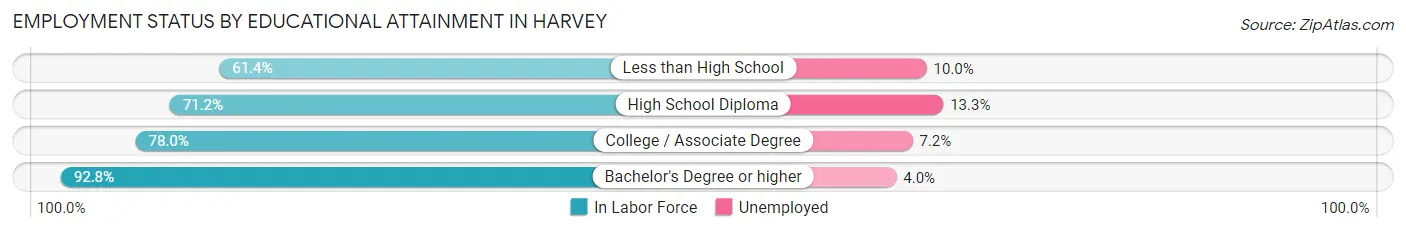
| Educational Attainment | In Labor Force | Unemployed |
| Less than High School | 968 (61.4%) | 158 (10.0%) |
| High School Diploma | 2,775 (71.2%) | 518 (13.3%) |
| College / Associate Degree | 2,874 (78.0%) | 265 (7.2%) |
| Bachelor's Degree or higher | 2,002 (92.8%) | 86 (4.0%) |
| Total | 8,622 (76.2%) | 984 (8.7%) |
Employment Occupations by Sex in Harvey
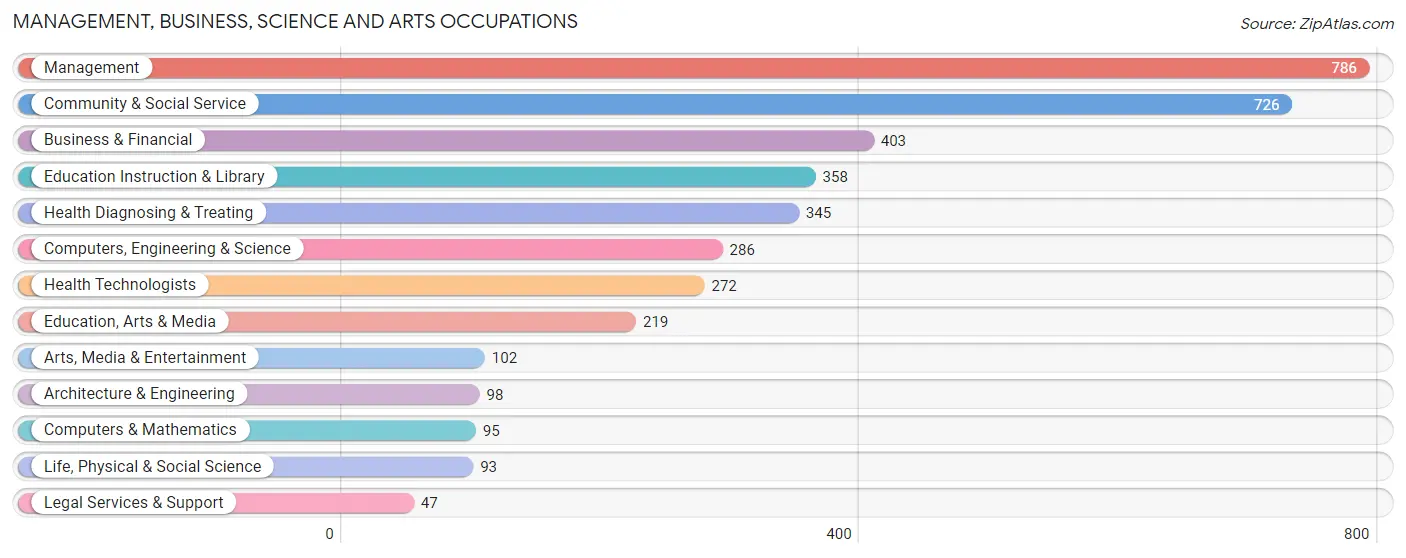
Management, Business, Science and Arts Occupations
The most common Management, Business, Science and Arts occupations in Harvey are Management (786 | 8.9%), Community & Social Service (726 | 8.2%), Business & Financial (403 | 4.5%), Education Instruction & Library (358 | 4.0%), and Health Diagnosing & Treating (345 | 3.9%).
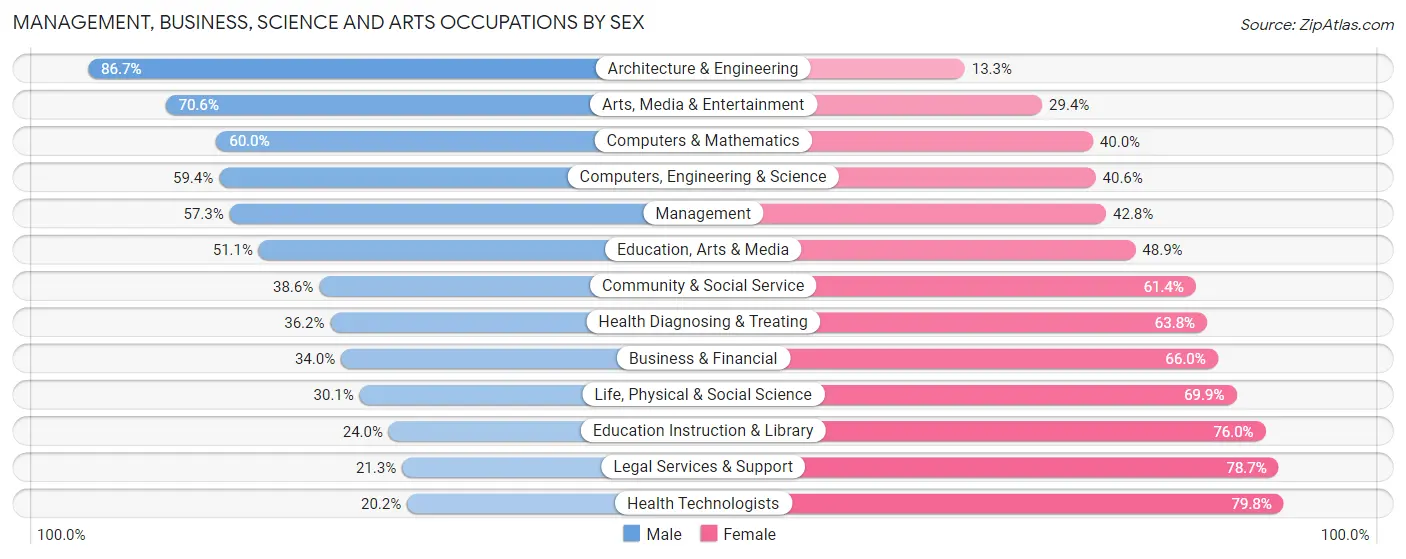
Management, Business, Science and Arts Occupations by Sex
Within the Management, Business, Science and Arts occupations in Harvey, the most male-oriented occupations are Architecture & Engineering (86.7%), Arts, Media & Entertainment (70.6%), and Computers & Mathematics (60.0%), while the most female-oriented occupations are Health Technologists (79.8%), Legal Services & Support (78.7%), and Education Instruction & Library (76.0%).
| Occupation | Male | Female |
| Management | 450 (57.3%) | 336 (42.7%) |
| Business & Financial | 137 (34.0%) | 266 (66.0%) |
| Computers, Engineering & Science | 170 (59.4%) | 116 (40.6%) |
| Computers & Mathematics | 57 (60.0%) | 38 (40.0%) |
| Architecture & Engineering | 85 (86.7%) | 13 (13.3%) |
| Life, Physical & Social Science | 28 (30.1%) | 65 (69.9%) |
| Community & Social Service | 280 (38.6%) | 446 (61.4%) |
| Education, Arts & Media | 112 (51.1%) | 107 (48.9%) |
| Legal Services & Support | 10 (21.3%) | 37 (78.7%) |
| Education Instruction & Library | 86 (24.0%) | 272 (76.0%) |
| Arts, Media & Entertainment | 72 (70.6%) | 30 (29.4%) |
| Health Diagnosing & Treating | 125 (36.2%) | 220 (63.8%) |
| Health Technologists | 55 (20.2%) | 217 (79.8%) |
| Total (Category) | 1,162 (45.6%) | 1,384 (54.4%) |
| Total (Overall) | 4,461 (50.3%) | 4,401 (49.7%) |
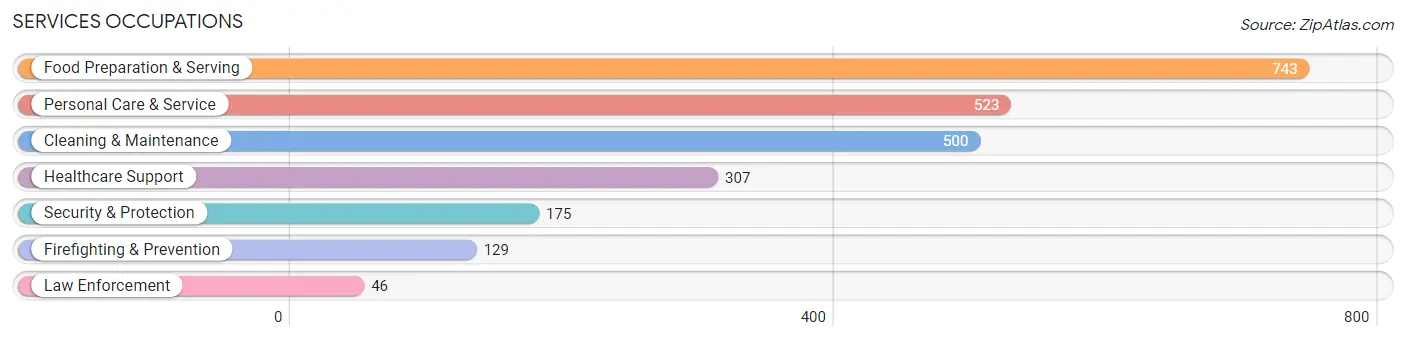
Services Occupations
The most common Services occupations in Harvey are Food Preparation & Serving (743 | 8.4%), Personal Care & Service (523 | 5.9%), Cleaning & Maintenance (500 | 5.6%), Healthcare Support (307 | 3.5%), and Security & Protection (175 | 2.0%).
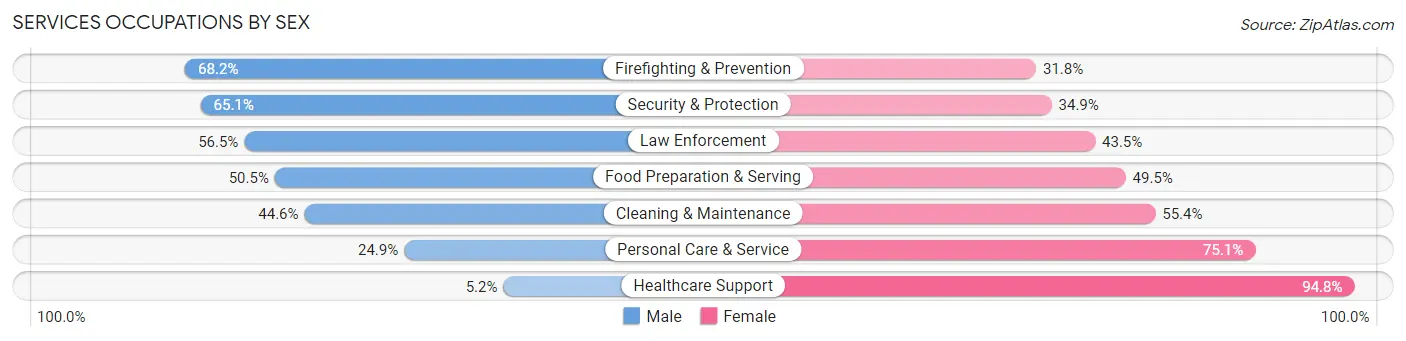
Services Occupations by Sex
Within the Services occupations in Harvey, the most male-oriented occupations are Firefighting & Prevention (68.2%), Security & Protection (65.1%), and Law Enforcement (56.5%), while the most female-oriented occupations are Healthcare Support (94.8%), Personal Care & Service (75.1%), and Cleaning & Maintenance (55.4%).
| Occupation | Male | Female |
| Healthcare Support | 16 (5.2%) | 291 (94.8%) |
| Security & Protection | 114 (65.1%) | 61 (34.9%) |
| Firefighting & Prevention | 88 (68.2%) | 41 (31.8%) |
| Law Enforcement | 26 (56.5%) | 20 (43.5%) |
| Food Preparation & Serving | 375 (50.5%) | 368 (49.5%) |
| Cleaning & Maintenance | 223 (44.6%) | 277 (55.4%) |
| Personal Care & Service | 130 (24.9%) | 393 (75.1%) |
| Total (Category) | 858 (38.2%) | 1,390 (61.8%) |
| Total (Overall) | 4,461 (50.3%) | 4,401 (49.7%) |
Sales and Office Occupations
The most common Sales and Office occupations in Harvey are Office & Administration (1,131 | 12.8%), and Sales & Related (810 | 9.1%).
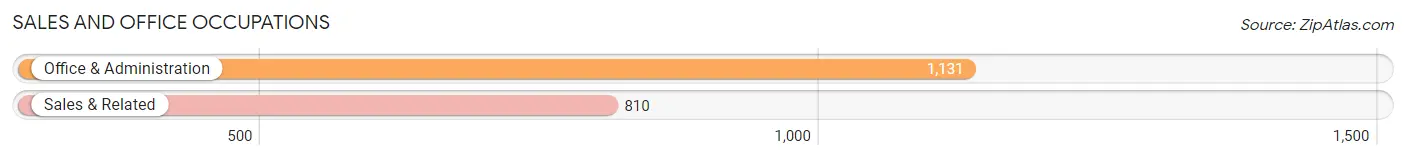
Sales and Office Occupations by Sex
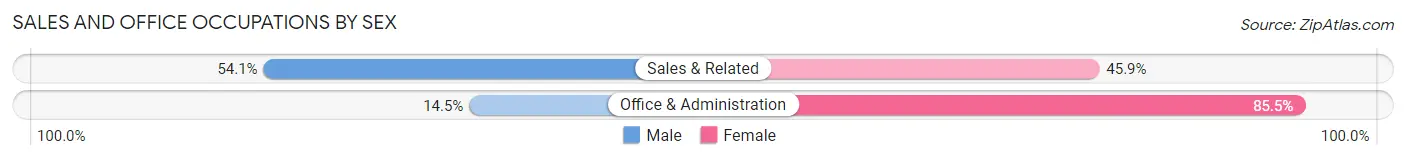
| Occupation | Male | Female |
| Sales & Related | 438 (54.1%) | 372 (45.9%) |
| Office & Administration | 164 (14.5%) | 967 (85.5%) |
| Total (Category) | 602 (31.0%) | 1,339 (69.0%) |
| Total (Overall) | 4,461 (50.3%) | 4,401 (49.7%) |
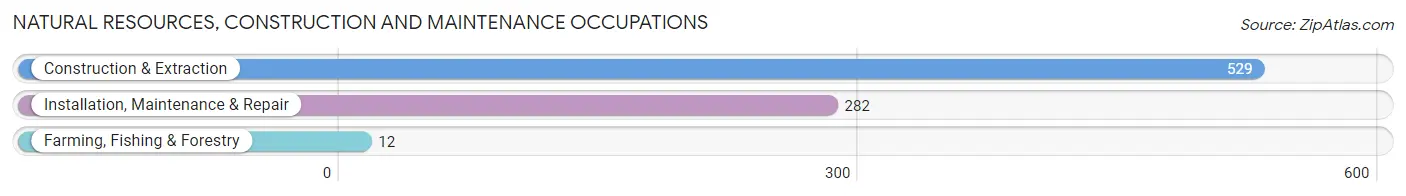
Natural Resources, Construction and Maintenance Occupations
The most common Natural Resources, Construction and Maintenance occupations in Harvey are Construction & Extraction (529 | 6.0%), Installation, Maintenance & Repair (282 | 3.2%), and Farming, Fishing & Forestry (12 | 0.1%).
Natural Resources, Construction and Maintenance Occupations by Sex
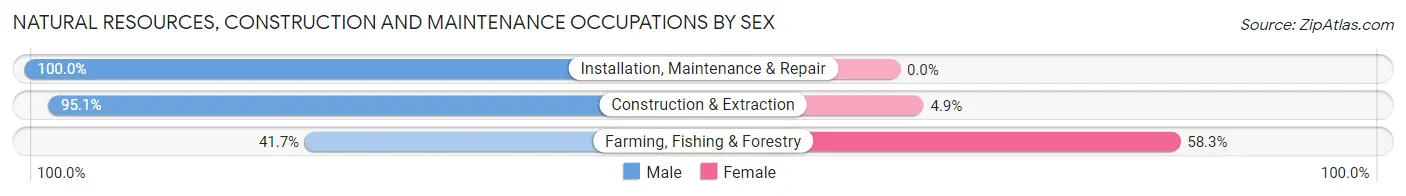
| Occupation | Male | Female |
| Farming, Fishing & Forestry | 5 (41.7%) | 7 (58.3%) |
| Construction & Extraction | 503 (95.1%) | 26 (4.9%) |
| Installation, Maintenance & Repair | 282 (100.0%) | 0 (0.0%) |
| Total (Category) | 790 (96.0%) | 33 (4.0%) |
| Total (Overall) | 4,461 (50.3%) | 4,401 (49.7%) |
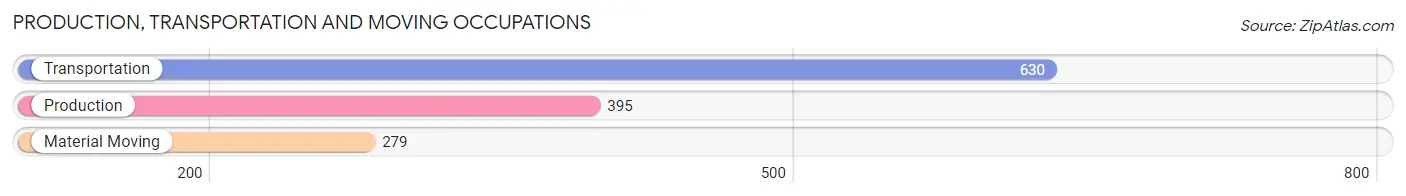
Production, Transportation and Moving Occupations
The most common Production, Transportation and Moving occupations in Harvey are Transportation (630 | 7.1%), Production (395 | 4.5%), and Material Moving (279 | 3.2%).
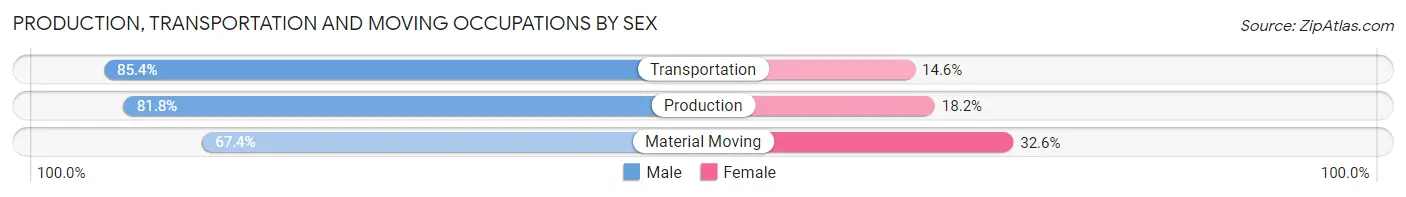
Production, Transportation and Moving Occupations by Sex
| Occupation | Male | Female |
| Production | 323 (81.8%) | 72 (18.2%) |
| Transportation | 538 (85.4%) | 92 (14.6%) |
| Material Moving | 188 (67.4%) | 91 (32.6%) |
| Total (Category) | 1,049 (80.4%) | 255 (19.6%) |
| Total (Overall) | 4,461 (50.3%) | 4,401 (49.7%) |
Employment Industries by Sex in Harvey
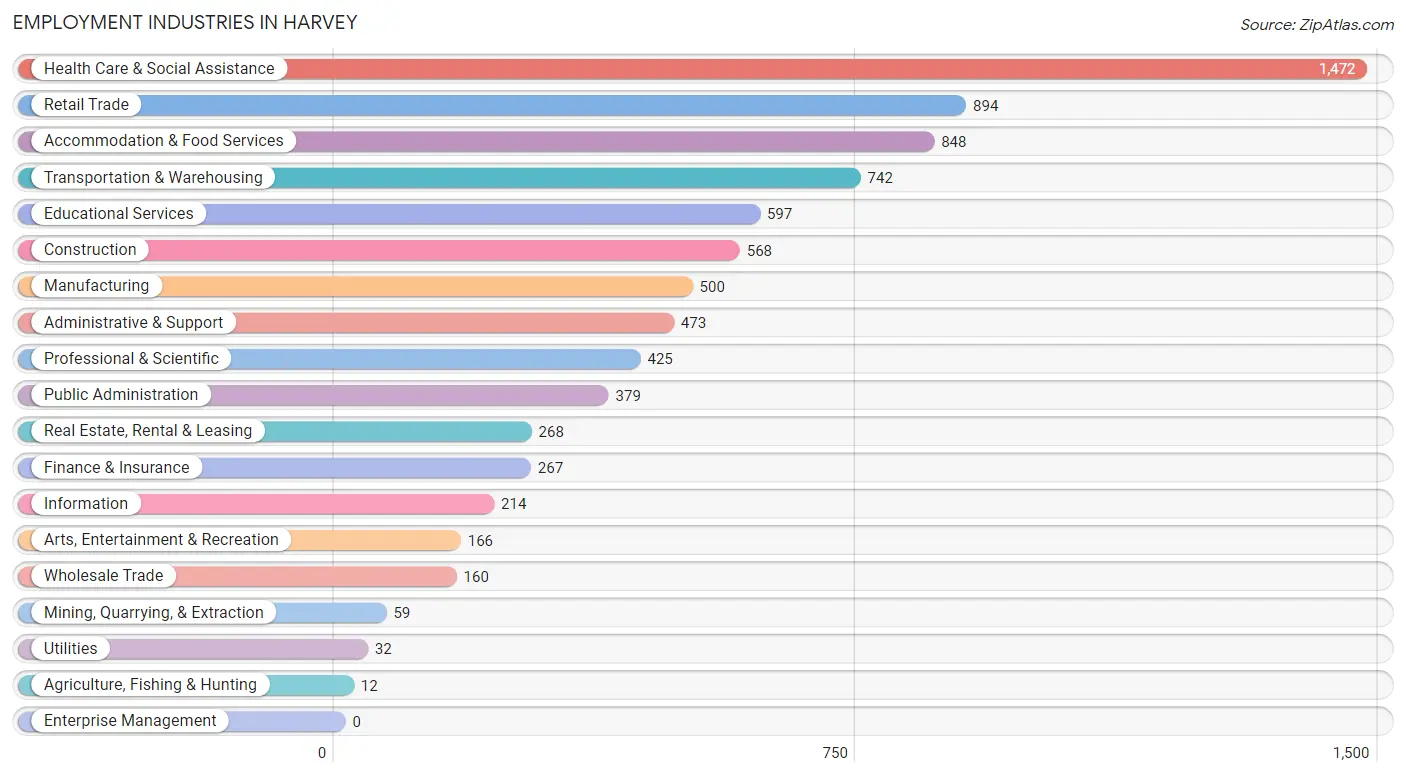
Employment Industries in Harvey
The major employment industries in Harvey include Health Care & Social Assistance (1,472 | 16.6%), Retail Trade (894 | 10.1%), Accommodation & Food Services (848 | 9.6%), Transportation & Warehousing (742 | 8.4%), and Educational Services (597 | 6.7%).
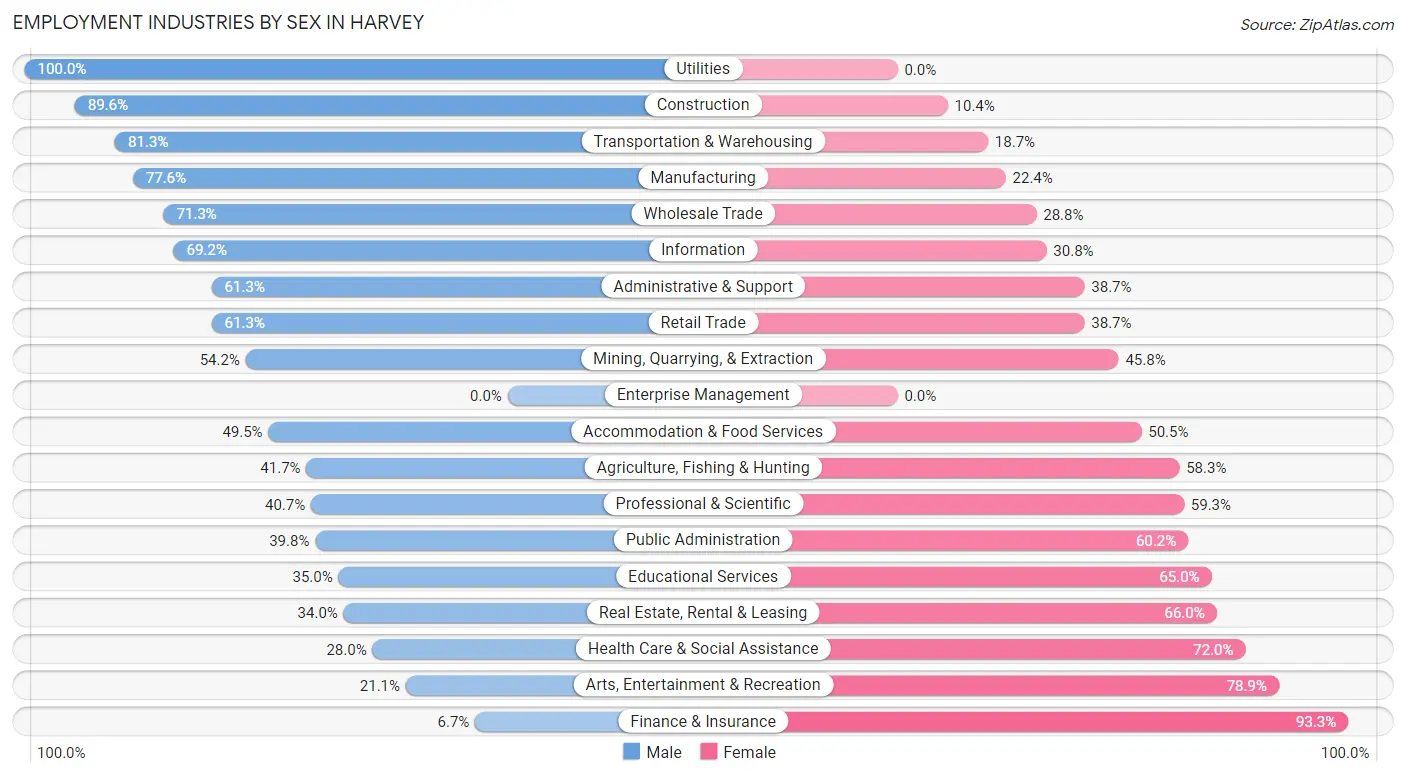
Employment Industries by Sex in Harvey
The Harvey industries that see more men than women are Utilities (100.0%), Construction (89.6%), and Transportation & Warehousing (81.3%), whereas the industries that tend to have a higher number of women are Finance & Insurance (93.3%), Arts, Entertainment & Recreation (78.9%), and Health Care & Social Assistance (72.0%).
| Industry | Male | Female |
| Agriculture, Fishing & Hunting | 5 (41.7%) | 7 (58.3%) |
| Mining, Quarrying, & Extraction | 32 (54.2%) | 27 (45.8%) |
| Construction | 509 (89.6%) | 59 (10.4%) |
| Manufacturing | 388 (77.6%) | 112 (22.4%) |
| Wholesale Trade | 114 (71.3%) | 46 (28.7%) |
| Retail Trade | 548 (61.3%) | 346 (38.7%) |
| Transportation & Warehousing | 603 (81.3%) | 139 (18.7%) |
| Utilities | 32 (100.0%) | 0 (0.0%) |
| Information | 148 (69.2%) | 66 (30.8%) |
| Finance & Insurance | 18 (6.7%) | 249 (93.3%) |
| Real Estate, Rental & Leasing | 91 (34.0%) | 177 (66.0%) |
| Professional & Scientific | 173 (40.7%) | 252 (59.3%) |
| Enterprise Management | 0 (0.0%) | 0 (0.0%) |
| Administrative & Support | 290 (61.3%) | 183 (38.7%) |
| Educational Services | 209 (35.0%) | 388 (65.0%) |
| Health Care & Social Assistance | 412 (28.0%) | 1,060 (72.0%) |
| Arts, Entertainment & Recreation | 35 (21.1%) | 131 (78.9%) |
| Accommodation & Food Services | 420 (49.5%) | 428 (50.5%) |
| Public Administration | 151 (39.8%) | 228 (60.2%) |
| Total | 4,461 (50.3%) | 4,401 (49.7%) |
Education in Harvey
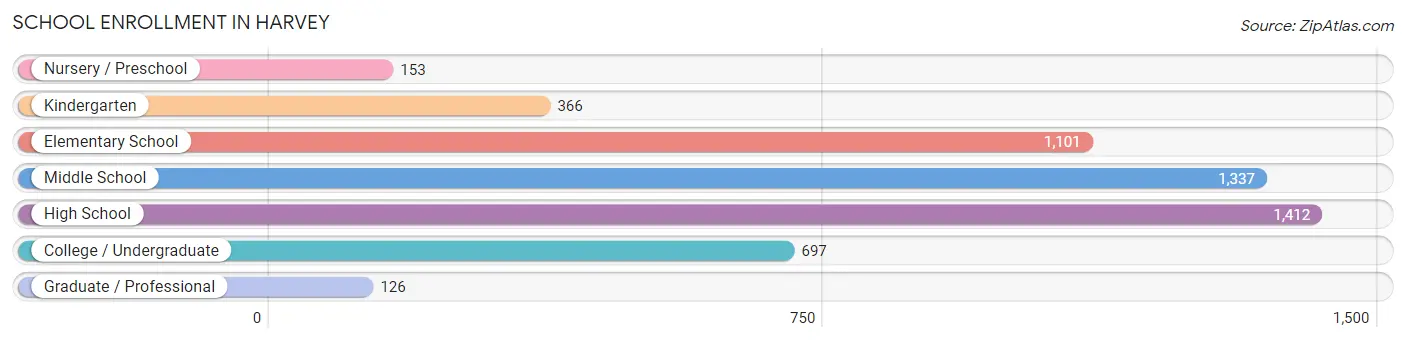
School Enrollment in Harvey
The most common levels of schooling among the 5,192 students in Harvey are high school (1,412 | 27.2%), middle school (1,337 | 25.8%), and elementary school (1,101 | 21.2%).
| School Level | # Students | % Students |
| Nursery / Preschool | 153 | 2.9% |
| Kindergarten | 366 | 7.0% |
| Elementary School | 1,101 | 21.2% |
| Middle School | 1,337 | 25.8% |
| High School | 1,412 | 27.2% |
| College / Undergraduate | 697 | 13.4% |
| Graduate / Professional | 126 | 2.4% |
| Total | 5,192 | 100.0% |
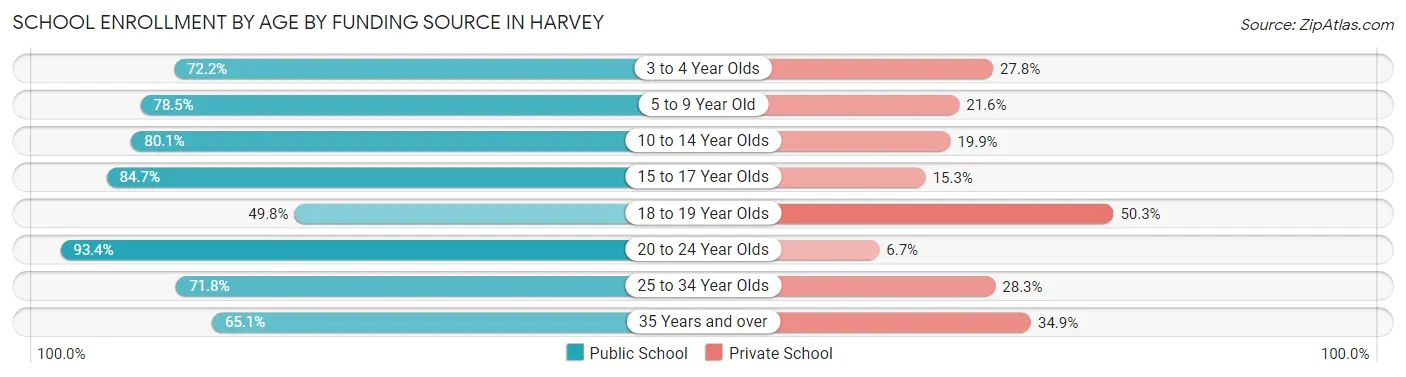
School Enrollment by Age by Funding Source in Harvey
Out of a total of 5,192 students who are enrolled in schools in Harvey, 1,111 (21.4%) attend a private institution, while the remaining 4,081 (78.6%) are enrolled in public schools. The age group of 18 to 19 year olds has the highest likelihood of being enrolled in private schools, with 101 (50.2% in the age bracket) enrolled. Conversely, the age group of 20 to 24 year olds has the lowest likelihood of being enrolled in a private school, with 295 (93.3% in the age bracket) attending a public institution.
| Age Bracket | Public School | Private School |
| 3 to 4 Year Olds | 179 (72.2%) | 69 (27.8%) |
| 5 to 9 Year Old | 961 (78.4%) | 264 (21.5%) |
| 10 to 14 Year Olds | 1,317 (80.1%) | 327 (19.9%) |
| 15 to 17 Year Olds | 837 (84.7%) | 151 (15.3%) |
| 18 to 19 Year Olds | 100 (49.7%) | 101 (50.2%) |
| 20 to 24 Year Olds | 295 (93.3%) | 21 (6.7%) |
| 25 to 34 Year Olds | 226 (71.8%) | 89 (28.2%) |
| 35 Years and over | 166 (65.1%) | 89 (34.9%) |
| Total | 4,081 (78.6%) | 1,111 (21.4%) |
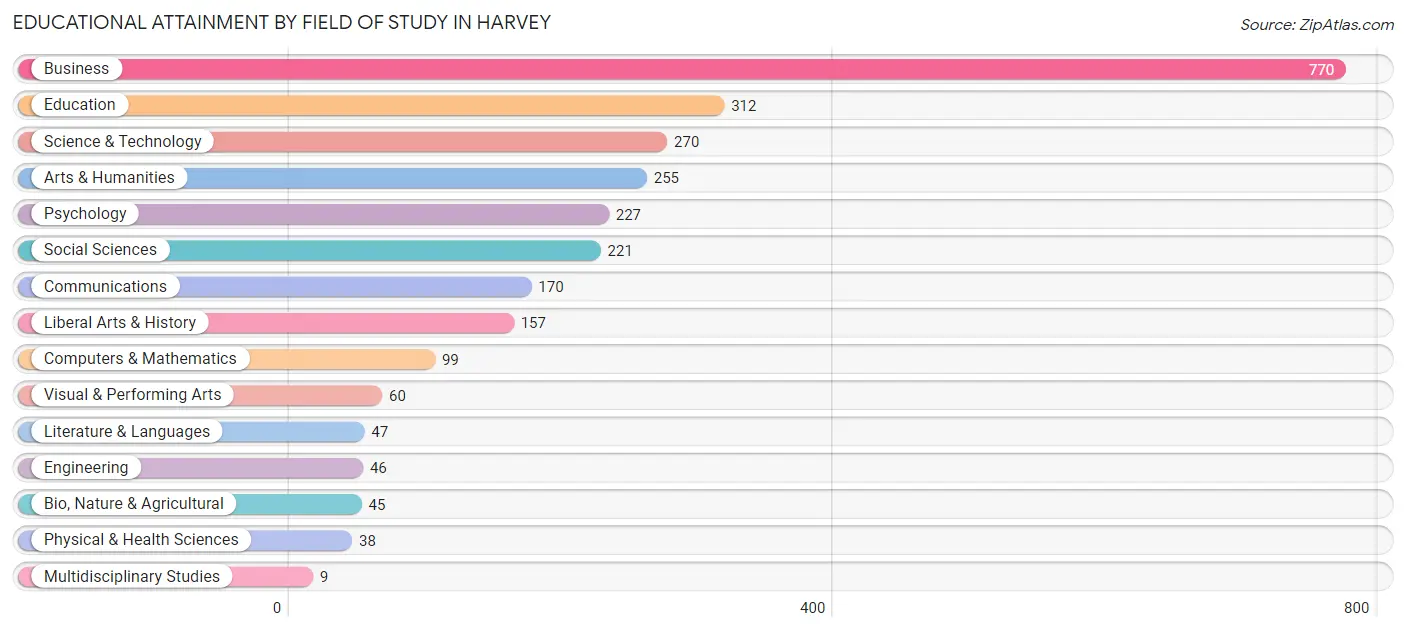
Educational Attainment by Field of Study in Harvey
Business (770 | 28.2%), education (312 | 11.5%), science & technology (270 | 9.9%), arts & humanities (255 | 9.3%), and psychology (227 | 8.3%) are the most common fields of study among 2,726 individuals in Harvey who have obtained a bachelor's degree or higher.
| Field of Study | # Graduates | % Graduates |
| Computers & Mathematics | 99 | 3.6% |
| Bio, Nature & Agricultural | 45 | 1.7% |
| Physical & Health Sciences | 38 | 1.4% |
| Psychology | 227 | 8.3% |
| Social Sciences | 221 | 8.1% |
| Engineering | 46 | 1.7% |
| Multidisciplinary Studies | 9 | 0.3% |
| Science & Technology | 270 | 9.9% |
| Business | 770 | 28.2% |
| Education | 312 | 11.5% |
| Literature & Languages | 47 | 1.7% |
| Liberal Arts & History | 157 | 5.8% |
| Visual & Performing Arts | 60 | 2.2% |
| Communications | 170 | 6.2% |
| Arts & Humanities | 255 | 9.3% |
| Total | 2,726 | 100.0% |
Transportation & Commute in Harvey
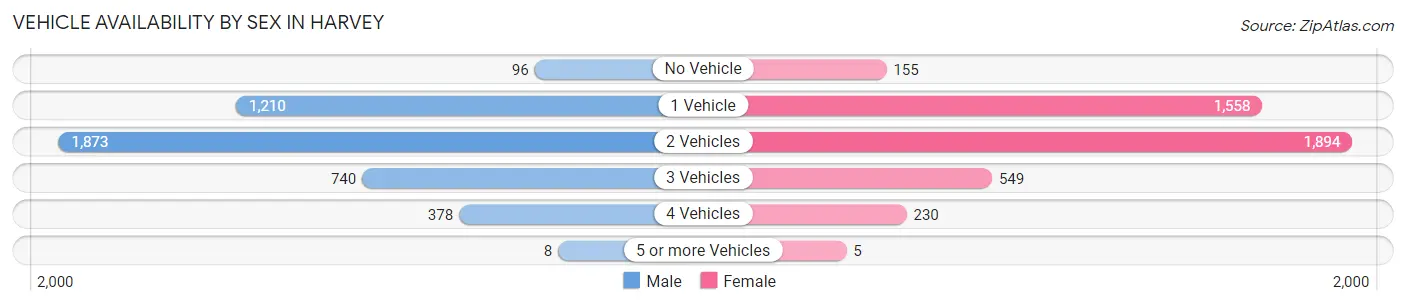
Vehicle Availability by Sex in Harvey
The most prevalent vehicle ownership categories in Harvey are males with 2 vehicles (1,873, accounting for 43.5%) and females with 2 vehicles (1,894, making up 42.7%).
| Vehicles Available | Male | Female |
| No Vehicle | 96 (2.2%) | 155 (3.5%) |
| 1 Vehicle | 1,210 (28.1%) | 1,558 (35.5%) |
| 2 Vehicles | 1,873 (43.5%) | 1,894 (43.1%) |
| 3 Vehicles | 740 (17.2%) | 549 (12.5%) |
| 4 Vehicles | 378 (8.8%) | 230 (5.2%) |
| 5 or more Vehicles | 8 (0.2%) | 5 (0.1%) |
| Total | 4,305 (100.0%) | 4,391 (100.0%) |
Commute Time in Harvey
The most frequently occuring commute durations in Harvey are 30 to 34 minutes (1,380 commuters, 16.2%), 15 to 19 minutes (1,255 commuters, 14.8%), and 20 to 24 minutes (1,246 commuters, 14.7%).
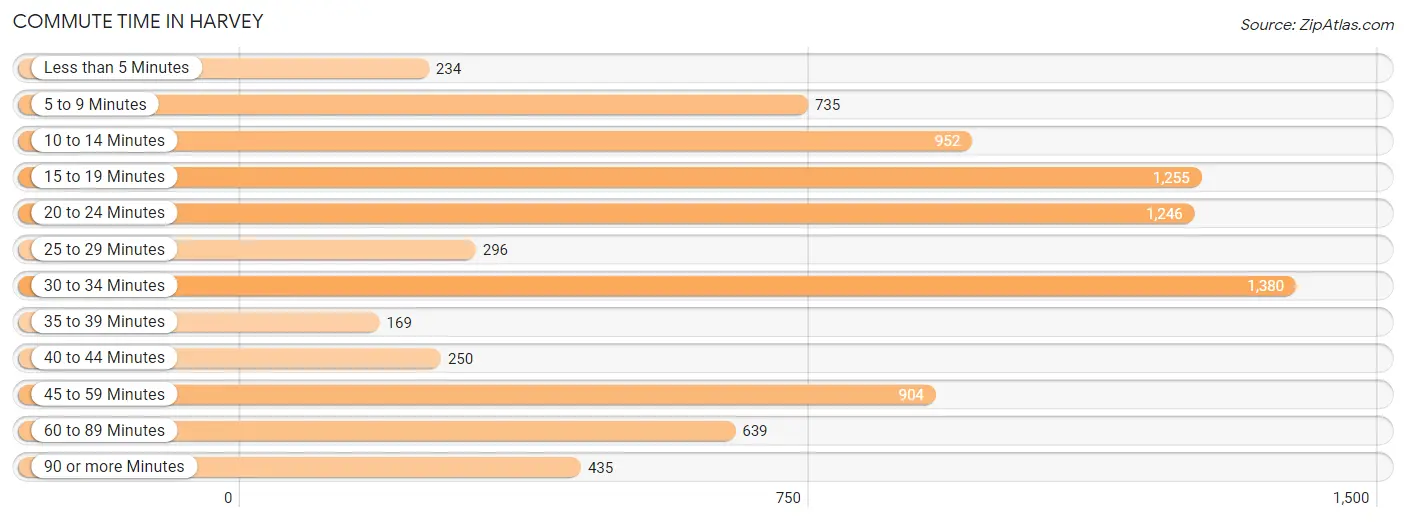
| Commute Time | # Commuters | % Commuters |
| Less than 5 Minutes | 234 | 2.8% |
| 5 to 9 Minutes | 735 | 8.6% |
| 10 to 14 Minutes | 952 | 11.2% |
| 15 to 19 Minutes | 1,255 | 14.8% |
| 20 to 24 Minutes | 1,246 | 14.7% |
| 25 to 29 Minutes | 296 | 3.5% |
| 30 to 34 Minutes | 1,380 | 16.2% |
| 35 to 39 Minutes | 169 | 2.0% |
| 40 to 44 Minutes | 250 | 2.9% |
| 45 to 59 Minutes | 904 | 10.6% |
| 60 to 89 Minutes | 639 | 7.5% |
| 90 or more Minutes | 435 | 5.1% |
Commute Time by Sex in Harvey
The most common commute times in Harvey are 15 to 19 minutes (674 commuters, 16.0%) for males and 30 to 34 minutes (741 commuters, 17.3%) for females.
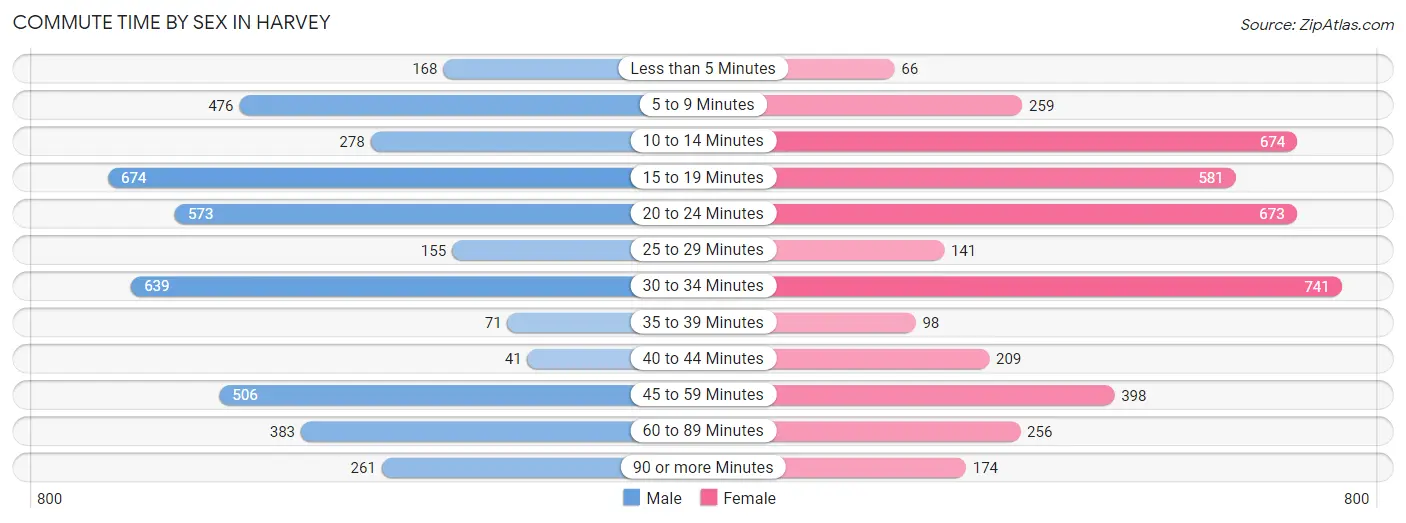
| Commute Time | Male | Female |
| Less than 5 Minutes | 168 (4.0%) | 66 (1.5%) |
| 5 to 9 Minutes | 476 (11.3%) | 259 (6.1%) |
| 10 to 14 Minutes | 278 (6.6%) | 674 (15.8%) |
| 15 to 19 Minutes | 674 (16.0%) | 581 (13.6%) |
| 20 to 24 Minutes | 573 (13.6%) | 673 (15.8%) |
| 25 to 29 Minutes | 155 (3.7%) | 141 (3.3%) |
| 30 to 34 Minutes | 639 (15.1%) | 741 (17.3%) |
| 35 to 39 Minutes | 71 (1.7%) | 98 (2.3%) |
| 40 to 44 Minutes | 41 (1.0%) | 209 (4.9%) |
| 45 to 59 Minutes | 506 (12.0%) | 398 (9.3%) |
| 60 to 89 Minutes | 383 (9.1%) | 256 (6.0%) |
| 90 or more Minutes | 261 (6.2%) | 174 (4.1%) |
Time of Departure to Work by Sex in Harvey
The most frequent times of departure to work in Harvey are 6:00 AM to 6:29 AM (862, 20.4%) for males and 7:00 AM to 7:29 AM (938, 22.0%) for females.
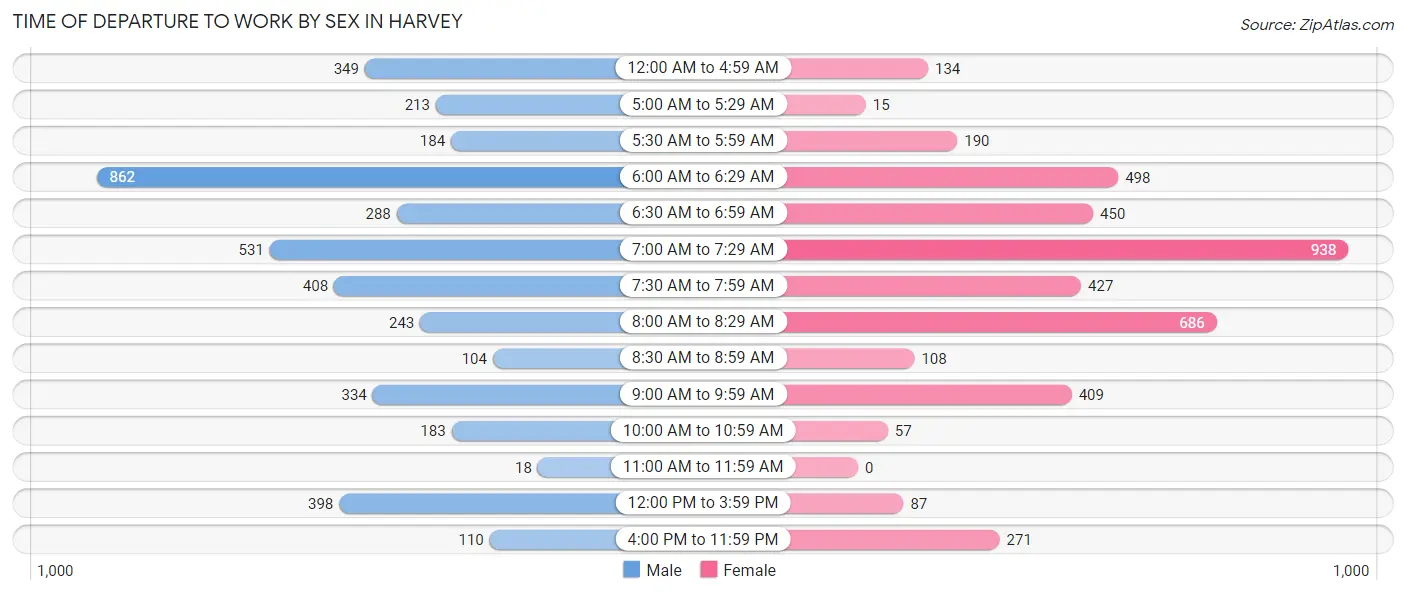
| Time of Departure | Male | Female |
| 12:00 AM to 4:59 AM | 349 (8.3%) | 134 (3.1%) |
| 5:00 AM to 5:29 AM | 213 (5.0%) | 15 (0.4%) |
| 5:30 AM to 5:59 AM | 184 (4.4%) | 190 (4.4%) |
| 6:00 AM to 6:29 AM | 862 (20.4%) | 498 (11.7%) |
| 6:30 AM to 6:59 AM | 288 (6.8%) | 450 (10.5%) |
| 7:00 AM to 7:29 AM | 531 (12.6%) | 938 (22.0%) |
| 7:30 AM to 7:59 AM | 408 (9.7%) | 427 (10.0%) |
| 8:00 AM to 8:29 AM | 243 (5.8%) | 686 (16.1%) |
| 8:30 AM to 8:59 AM | 104 (2.5%) | 108 (2.5%) |
| 9:00 AM to 9:59 AM | 334 (7.9%) | 409 (9.6%) |
| 10:00 AM to 10:59 AM | 183 (4.3%) | 57 (1.3%) |
| 11:00 AM to 11:59 AM | 18 (0.4%) | 0 (0.0%) |
| 12:00 PM to 3:59 PM | 398 (9.4%) | 87 (2.0%) |
| 4:00 PM to 11:59 PM | 110 (2.6%) | 271 (6.4%) |
| Total | 4,225 (100.0%) | 4,270 (100.0%) |
Housing Occupancy in Harvey
Occupancy by Ownership in Harvey
Of the total 8,379 dwellings in Harvey, owner-occupied units account for 4,492 (53.6%), while renter-occupied units make up 3,887 (46.4%).
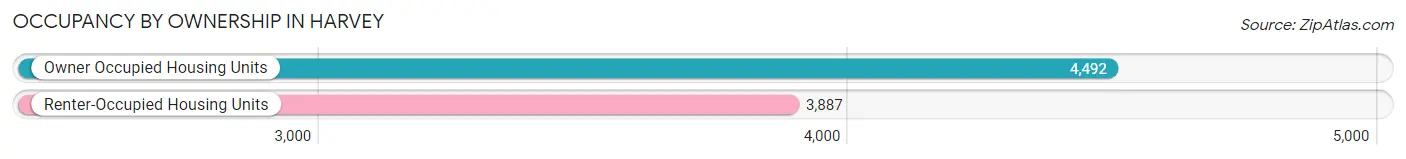
| Occupancy | # Housing Units | % Housing Units |
| Owner Occupied Housing Units | 4,492 | 53.6% |
| Renter-Occupied Housing Units | 3,887 | 46.4% |
| Total Occupied Housing Units | 8,379 | 100.0% |
Occupancy by Household Size in Harvey
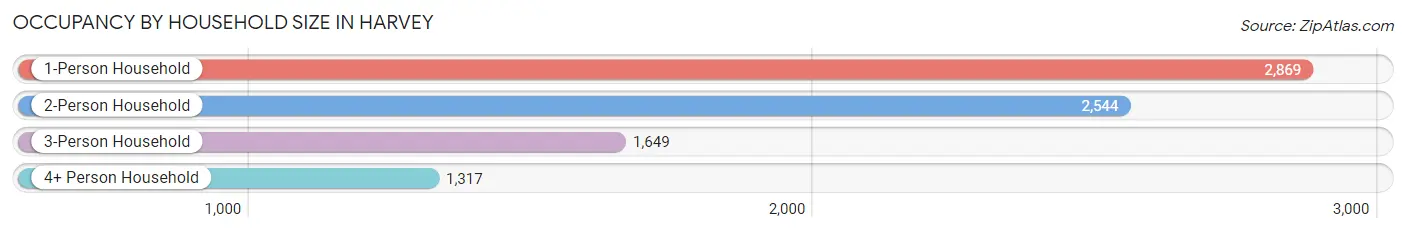
| Household Size | # Housing Units | % Housing Units |
| 1-Person Household | 2,869 | 34.2% |
| 2-Person Household | 2,544 | 30.4% |
| 3-Person Household | 1,649 | 19.7% |
| 4+ Person Household | 1,317 | 15.7% |
| Total Housing Units | 8,379 | 100.0% |
Occupancy by Ownership by Household Size in Harvey
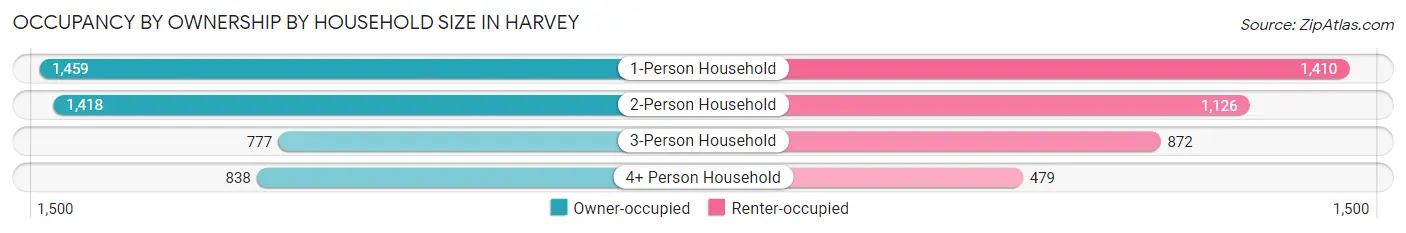
| Household Size | Owner-occupied | Renter-occupied |
| 1-Person Household | 1,459 (50.8%) | 1,410 (49.1%) |
| 2-Person Household | 1,418 (55.7%) | 1,126 (44.3%) |
| 3-Person Household | 777 (47.1%) | 872 (52.9%) |
| 4+ Person Household | 838 (63.6%) | 479 (36.4%) |
| Total Housing Units | 4,492 (53.6%) | 3,887 (46.4%) |
Occupancy by Educational Attainment in Harvey
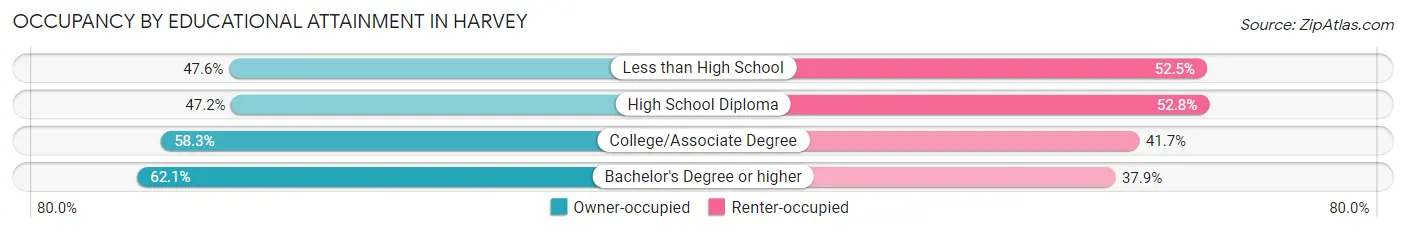
| Household Size | Owner-occupied | Renter-occupied |
| Less than High School | 592 (47.5%) | 653 (52.4%) |
| High School Diploma | 1,355 (47.2%) | 1,516 (52.8%) |
| College/Associate Degree | 1,584 (58.3%) | 1,132 (41.7%) |
| Bachelor's Degree or higher | 961 (62.1%) | 586 (37.9%) |
Occupancy by Age of Householder in Harvey
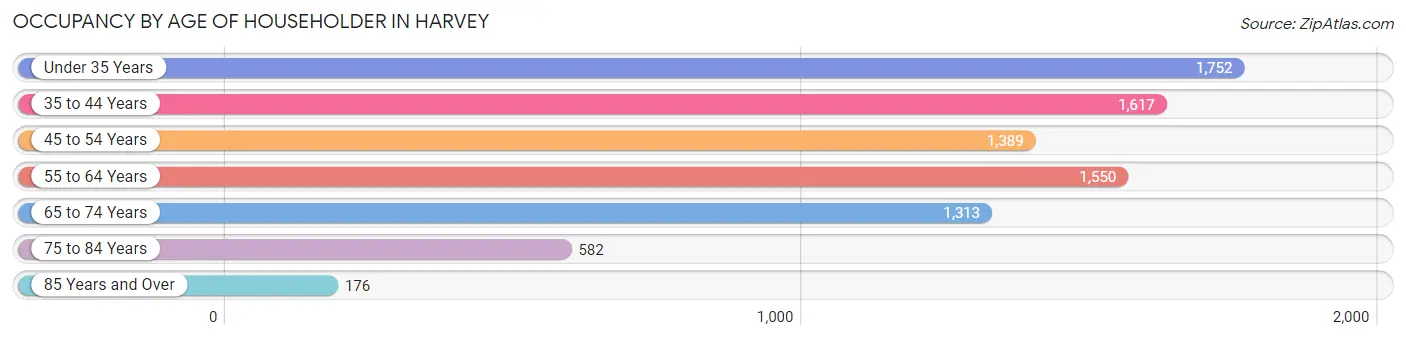
| Age Bracket | # Households | % Households |
| Under 35 Years | 1,752 | 20.9% |
| 35 to 44 Years | 1,617 | 19.3% |
| 45 to 54 Years | 1,389 | 16.6% |
| 55 to 64 Years | 1,550 | 18.5% |
| 65 to 74 Years | 1,313 | 15.7% |
| 75 to 84 Years | 582 | 7.0% |
| 85 Years and Over | 176 | 2.1% |
| Total | 8,379 | 100.0% |
Housing Finances in Harvey
Median Income by Occupancy in Harvey
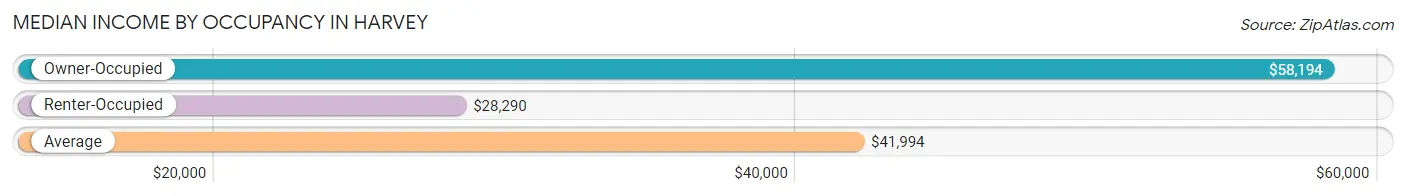
| Occupancy Type | # Households | Median Income |
| Owner-Occupied | 4,492 (53.6%) | $58,194 |
| Renter-Occupied | 3,887 (46.4%) | $28,290 |
| Average | 8,379 (100.0%) | $41,994 |
Occupancy by Householder Income Bracket in Harvey
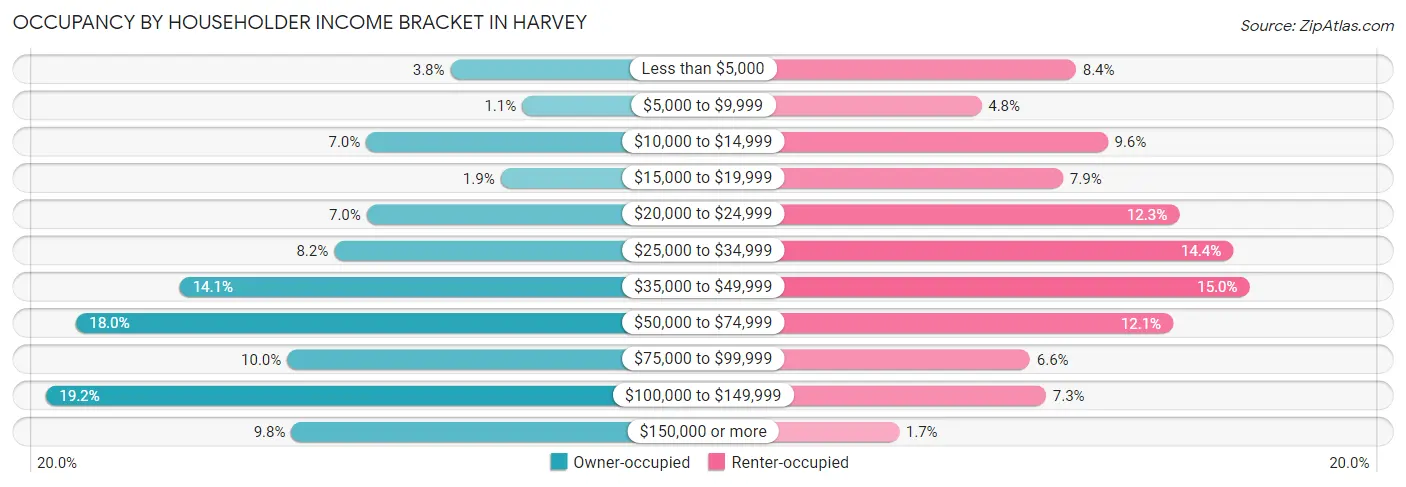
| Income Bracket | Owner-occupied | Renter-occupied |
| Less than $5,000 | 170 (3.8%) | 326 (8.4%) |
| $5,000 to $9,999 | 47 (1.1%) | 186 (4.8%) |
| $10,000 to $14,999 | 314 (7.0%) | 373 (9.6%) |
| $15,000 to $19,999 | 84 (1.9%) | 307 (7.9%) |
| $20,000 to $24,999 | 313 (7.0%) | 479 (12.3%) |
| $25,000 to $34,999 | 369 (8.2%) | 559 (14.4%) |
| $35,000 to $49,999 | 633 (14.1%) | 583 (15.0%) |
| $50,000 to $74,999 | 810 (18.0%) | 470 (12.1%) |
| $75,000 to $99,999 | 449 (10.0%) | 258 (6.6%) |
| $100,000 to $149,999 | 861 (19.2%) | 282 (7.2%) |
| $150,000 or more | 442 (9.8%) | 64 (1.7%) |
| Total | 4,492 (100.0%) | 3,887 (100.0%) |
Monthly Housing Cost Tiers in Harvey
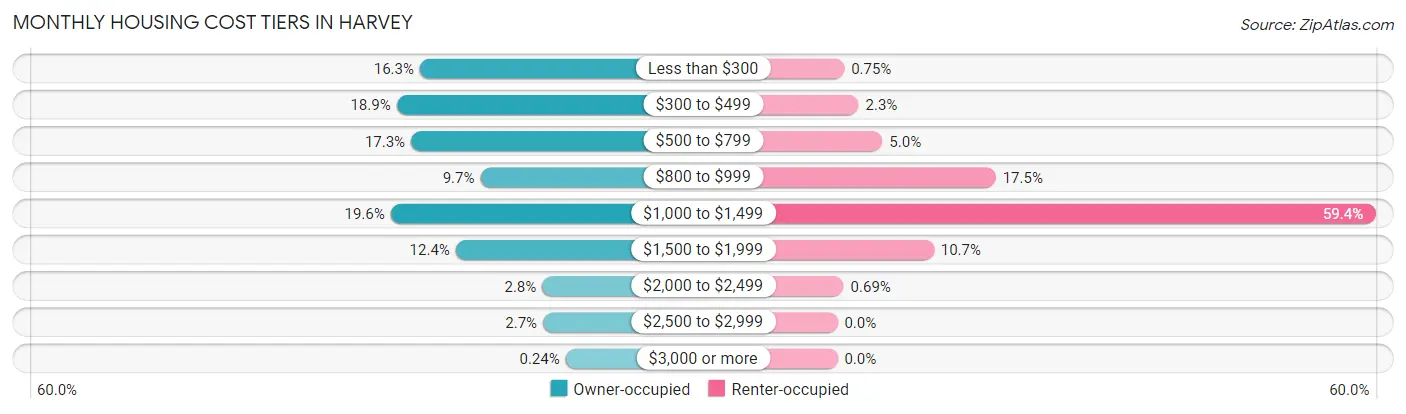
| Monthly Cost | Owner-occupied | Renter-occupied |
| Less than $300 | 734 (16.3%) | 29 (0.7%) |
| $300 to $499 | 850 (18.9%) | 91 (2.3%) |
| $500 to $799 | 778 (17.3%) | 193 (5.0%) |
| $800 to $999 | 434 (9.7%) | 680 (17.5%) |
| $1,000 to $1,499 | 879 (19.6%) | 2,308 (59.4%) |
| $1,500 to $1,999 | 556 (12.4%) | 414 (10.6%) |
| $2,000 to $2,499 | 127 (2.8%) | 27 (0.7%) |
| $2,500 to $2,999 | 123 (2.7%) | 0 (0.0%) |
| $3,000 or more | 11 (0.2%) | 0 (0.0%) |
| Total | 4,492 (100.0%) | 3,887 (100.0%) |
Physical Housing Characteristics in Harvey
Housing Structures in Harvey
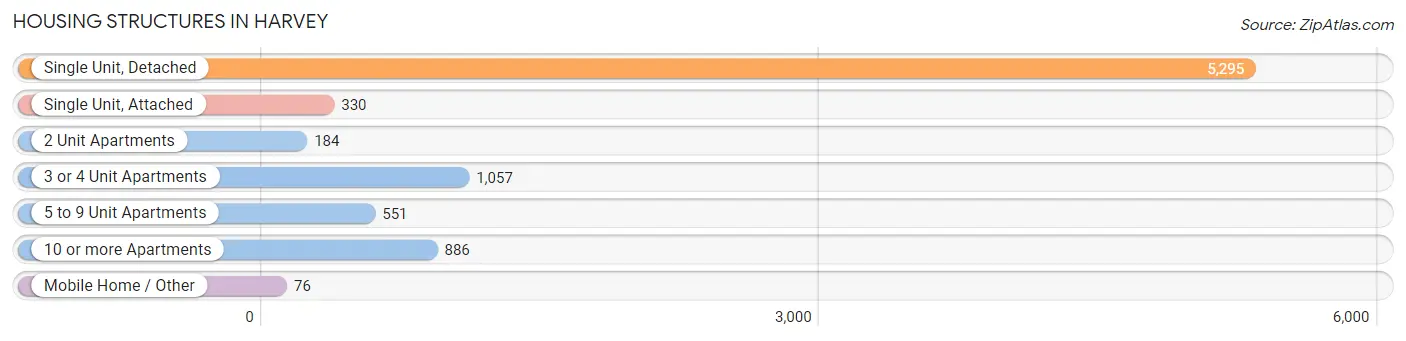
| Structure Type | # Housing Units | % Housing Units |
| Single Unit, Detached | 5,295 | 63.2% |
| Single Unit, Attached | 330 | 3.9% |
| 2 Unit Apartments | 184 | 2.2% |
| 3 or 4 Unit Apartments | 1,057 | 12.6% |
| 5 to 9 Unit Apartments | 551 | 6.6% |
| 10 or more Apartments | 886 | 10.6% |
| Mobile Home / Other | 76 | 0.9% |
| Total | 8,379 | 100.0% |
Housing Structures by Occupancy in Harvey
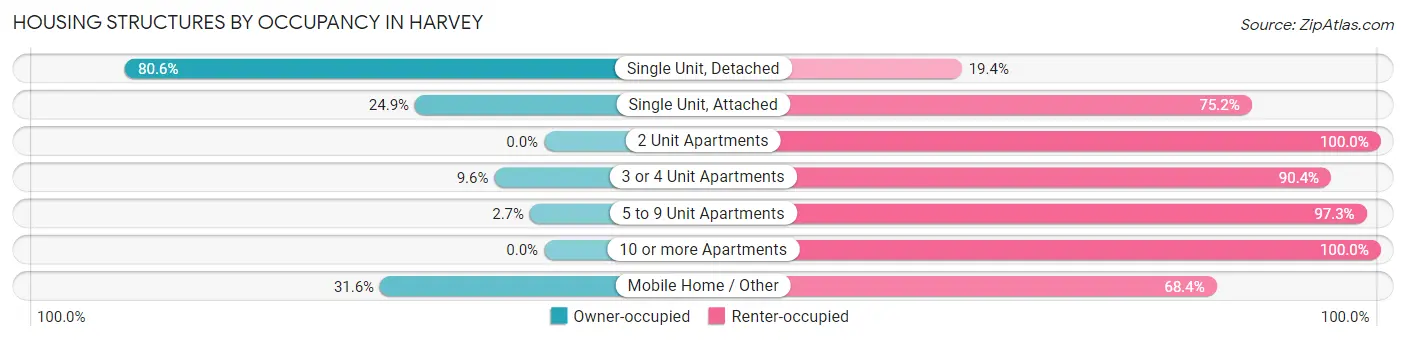
| Structure Type | Owner-occupied | Renter-occupied |
| Single Unit, Detached | 4,270 (80.6%) | 1,025 (19.4%) |
| Single Unit, Attached | 82 (24.8%) | 248 (75.1%) |
| 2 Unit Apartments | 0 (0.0%) | 184 (100.0%) |
| 3 or 4 Unit Apartments | 101 (9.6%) | 956 (90.4%) |
| 5 to 9 Unit Apartments | 15 (2.7%) | 536 (97.3%) |
| 10 or more Apartments | 0 (0.0%) | 886 (100.0%) |
| Mobile Home / Other | 24 (31.6%) | 52 (68.4%) |
| Total | 4,492 (53.6%) | 3,887 (46.4%) |
Housing Structures by Number of Rooms in Harvey
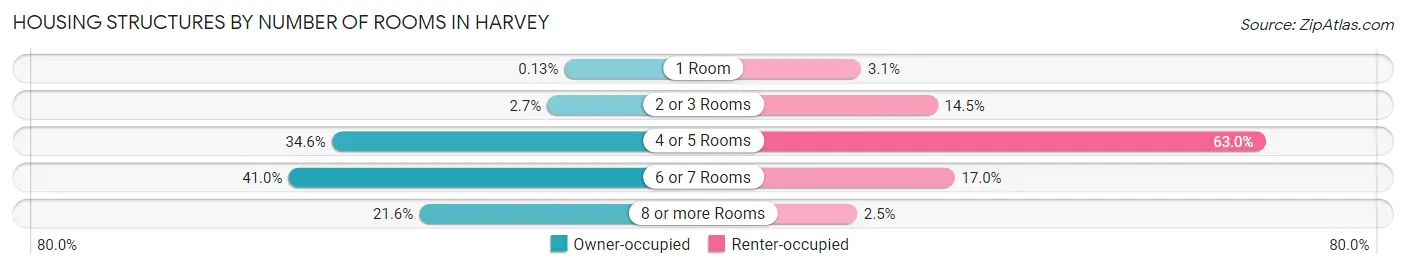
| Number of Rooms | Owner-occupied | Renter-occupied |
| 1 Room | 6 (0.1%) | 122 (3.1%) |
| 2 or 3 Rooms | 121 (2.7%) | 562 (14.5%) |
| 4 or 5 Rooms | 1,553 (34.6%) | 2,447 (62.9%) |
| 6 or 7 Rooms | 1,841 (41.0%) | 659 (17.0%) |
| 8 or more Rooms | 971 (21.6%) | 97 (2.5%) |
| Total | 4,492 (100.0%) | 3,887 (100.0%) |
Housing Structure by Heating Type in Harvey
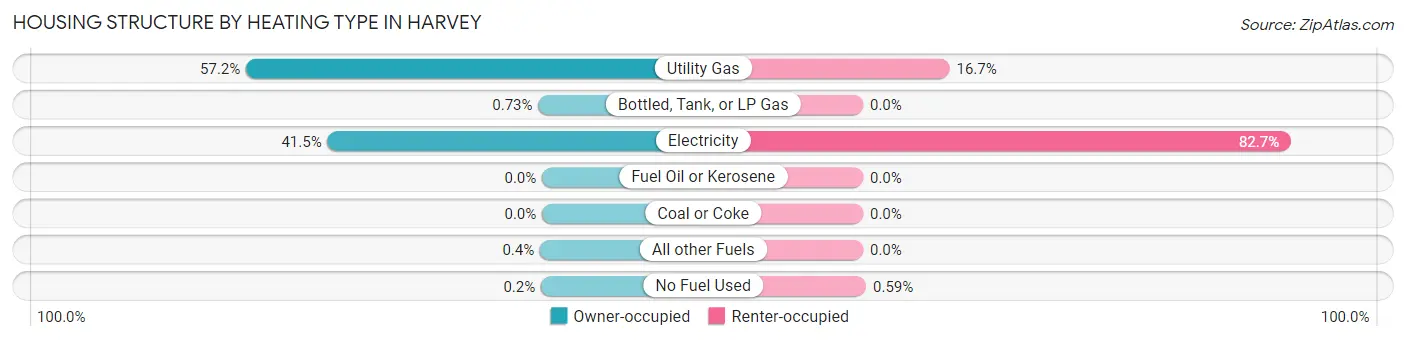
| Heating Type | Owner-occupied | Renter-occupied |
| Utility Gas | 2,569 (57.2%) | 650 (16.7%) |
| Bottled, Tank, or LP Gas | 33 (0.7%) | 0 (0.0%) |
| Electricity | 1,863 (41.5%) | 3,214 (82.7%) |
| Fuel Oil or Kerosene | 0 (0.0%) | 0 (0.0%) |
| Coal or Coke | 0 (0.0%) | 0 (0.0%) |
| All other Fuels | 18 (0.4%) | 0 (0.0%) |
| No Fuel Used | 9 (0.2%) | 23 (0.6%) |
| Total | 4,492 (100.0%) | 3,887 (100.0%) |
Household Vehicle Usage in Harvey
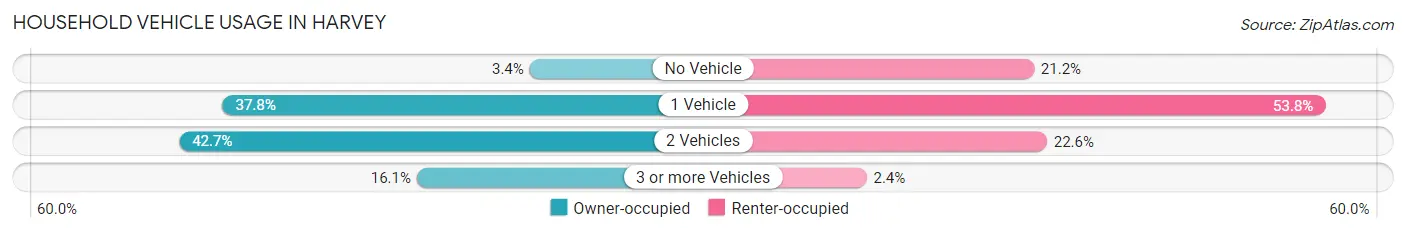
| Vehicles per Household | Owner-occupied | Renter-occupied |
| No Vehicle | 154 (3.4%) | 823 (21.2%) |
| 1 Vehicle | 1,699 (37.8%) | 2,091 (53.8%) |
| 2 Vehicles | 1,917 (42.7%) | 879 (22.6%) |
| 3 or more Vehicles | 722 (16.1%) | 94 (2.4%) |
| Total | 4,492 (100.0%) | 3,887 (100.0%) |
Real Estate & Mortgages in Harvey
Real Estate and Mortgage Overview in Harvey
| Characteristic | Without Mortgage | With Mortgage |
| Housing Units | 2,234 | 2,258 |
| Median Property Value | $160,100 | $179,900 |
| Median Household Income | $48,013 | $276 |
| Monthly Housing Costs | $374 | $11 |
| Real Estate Taxes | $545 | $357 |
Property Value by Mortgage Status in Harvey
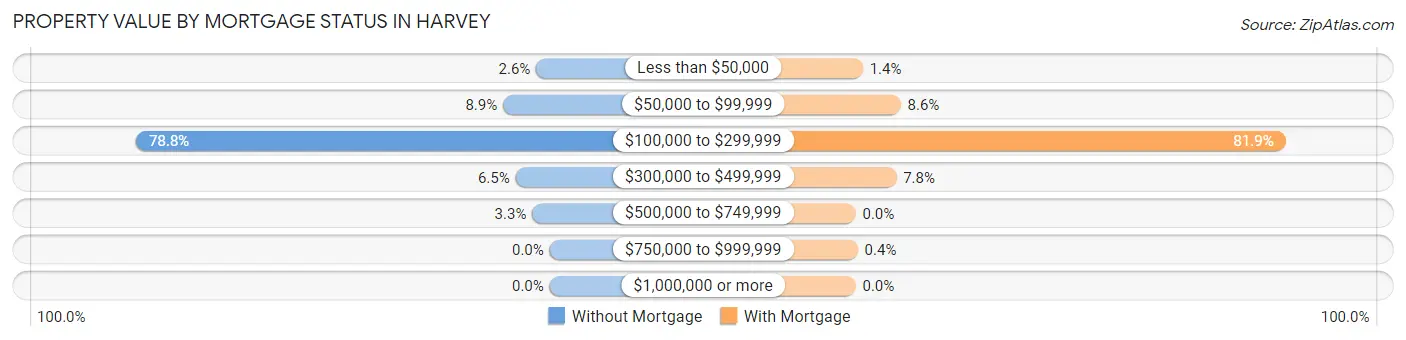
| Property Value | Without Mortgage | With Mortgage |
| Less than $50,000 | 57 (2.5%) | 31 (1.4%) |
| $50,000 to $99,999 | 198 (8.9%) | 194 (8.6%) |
| $100,000 to $299,999 | 1,760 (78.8%) | 1,849 (81.9%) |
| $300,000 to $499,999 | 145 (6.5%) | 175 (7.7%) |
| $500,000 to $749,999 | 74 (3.3%) | 0 (0.0%) |
| $750,000 to $999,999 | 0 (0.0%) | 9 (0.4%) |
| $1,000,000 or more | 0 (0.0%) | 0 (0.0%) |
| Total | 2,234 (100.0%) | 2,258 (100.0%) |
Household Income by Mortgage Status in Harvey
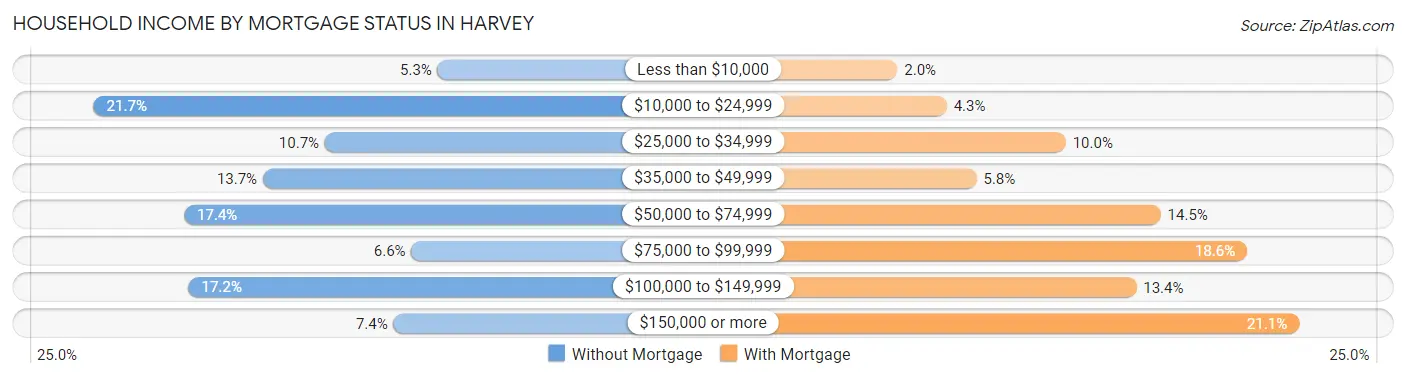
| Household Income | Without Mortgage | With Mortgage |
| Less than $10,000 | 119 (5.3%) | 45 (2.0%) |
| $10,000 to $24,999 | 485 (21.7%) | 98 (4.3%) |
| $25,000 to $34,999 | 239 (10.7%) | 226 (10.0%) |
| $35,000 to $49,999 | 305 (13.7%) | 130 (5.8%) |
| $50,000 to $74,999 | 389 (17.4%) | 328 (14.5%) |
| $75,000 to $99,999 | 147 (6.6%) | 421 (18.6%) |
| $100,000 to $149,999 | 384 (17.2%) | 302 (13.4%) |
| $150,000 or more | 166 (7.4%) | 477 (21.1%) |
| Total | 2,234 (100.0%) | 2,258 (100.0%) |
Property Value to Household Income Ratio in Harvey
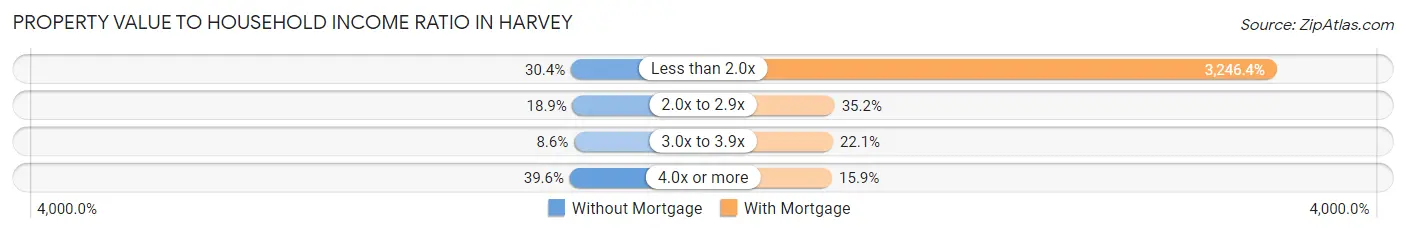
| Value-to-Income Ratio | Without Mortgage | With Mortgage |
| Less than 2.0x | 679 (30.4%) | 73,303 (3,246.4%) |
| 2.0x to 2.9x | 423 (18.9%) | 794 (35.2%) |
| 3.0x to 3.9x | 193 (8.6%) | 498 (22.1%) |
| 4.0x or more | 884 (39.6%) | 358 (15.9%) |
| Total | 2,234 (100.0%) | 2,258 (100.0%) |
Real Estate Taxes by Mortgage Status in Harvey
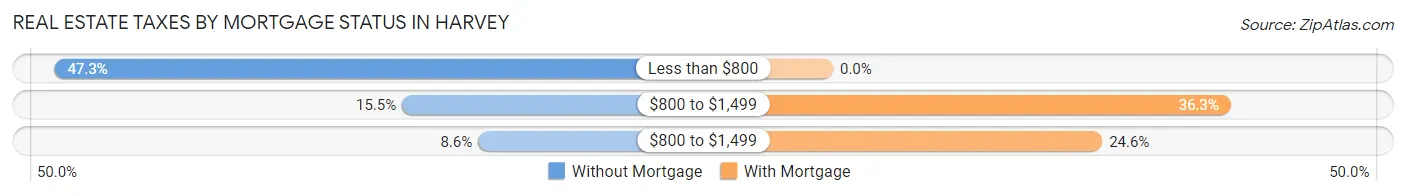
| Property Taxes | Without Mortgage | With Mortgage |
| Less than $800 | 1,056 (47.3%) | 0 (0.0%) |
| $800 to $1,499 | 347 (15.5%) | 820 (36.3%) |
| $800 to $1,499 | 192 (8.6%) | 555 (24.6%) |
| Total | 2,234 (100.0%) | 2,258 (100.0%) |
Health & Disability in Harvey
Health Insurance Coverage by Age in Harvey
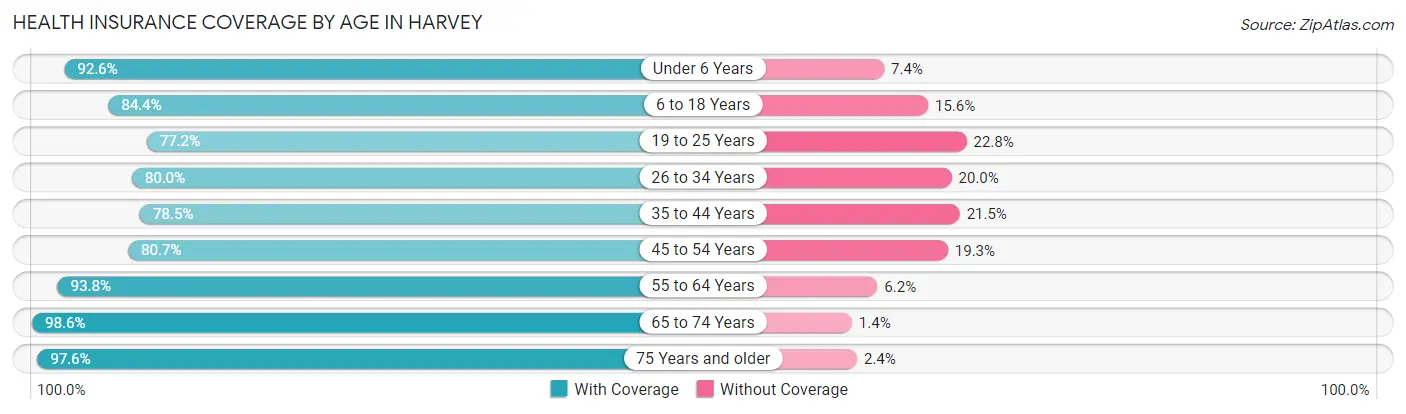
| Age Bracket | With Coverage | Without Coverage |
| Under 6 Years | 1,585 (92.6%) | 127 (7.4%) |
| 6 to 18 Years | 3,533 (84.4%) | 654 (15.6%) |
| 19 to 25 Years | 989 (77.2%) | 292 (22.8%) |
| 26 to 34 Years | 2,310 (80.0%) | 578 (20.0%) |
| 35 to 44 Years | 2,112 (78.5%) | 579 (21.5%) |
| 45 to 54 Years | 2,307 (80.7%) | 552 (19.3%) |
| 55 to 64 Years | 2,416 (93.8%) | 159 (6.2%) |
| 65 to 74 Years | 1,870 (98.6%) | 27 (1.4%) |
| 75 Years and older | 1,110 (97.6%) | 27 (2.4%) |
| Total | 18,232 (85.9%) | 2,995 (14.1%) |
Health Insurance Coverage by Citizenship Status in Harvey
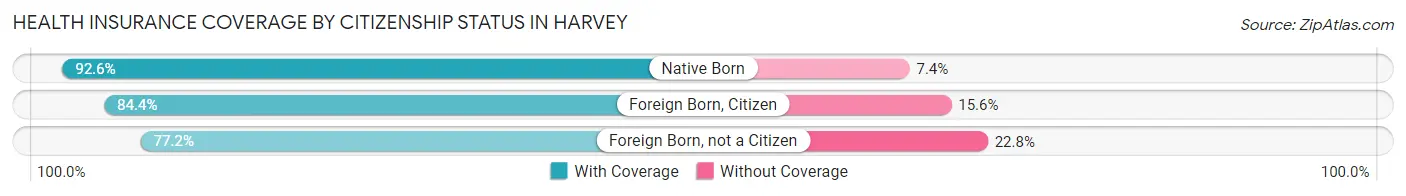
| Citizenship Status | With Coverage | Without Coverage |
| Native Born | 1,585 (92.6%) | 127 (7.4%) |
| Foreign Born, Citizen | 3,533 (84.4%) | 654 (15.6%) |
| Foreign Born, not a Citizen | 989 (77.2%) | 292 (22.8%) |
Health Insurance Coverage by Household Income in Harvey
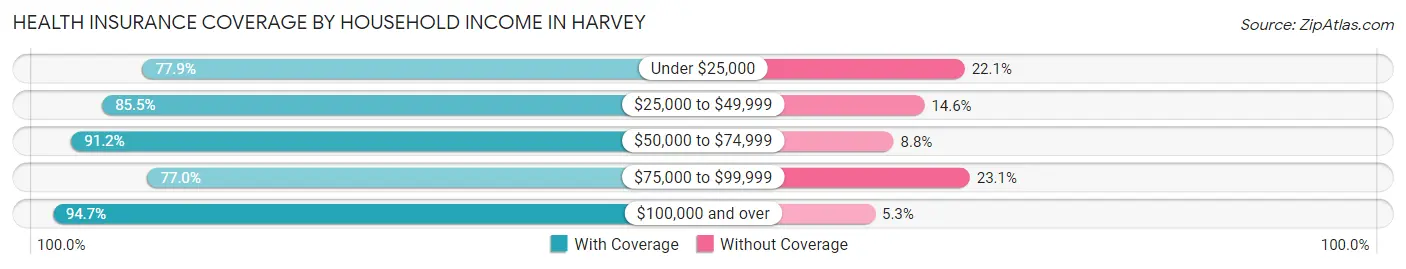
| Household Income | With Coverage | Without Coverage |
| Under $25,000 | 4,269 (77.9%) | 1,211 (22.1%) |
| $25,000 to $49,999 | 3,830 (85.5%) | 652 (14.5%) |
| $50,000 to $74,999 | 3,414 (91.2%) | 328 (8.8%) |
| $75,000 to $99,999 | 1,749 (76.9%) | 524 (23.1%) |
| $100,000 and over | 4,946 (94.7%) | 276 (5.3%) |
Public vs Private Health Insurance Coverage by Age in Harvey
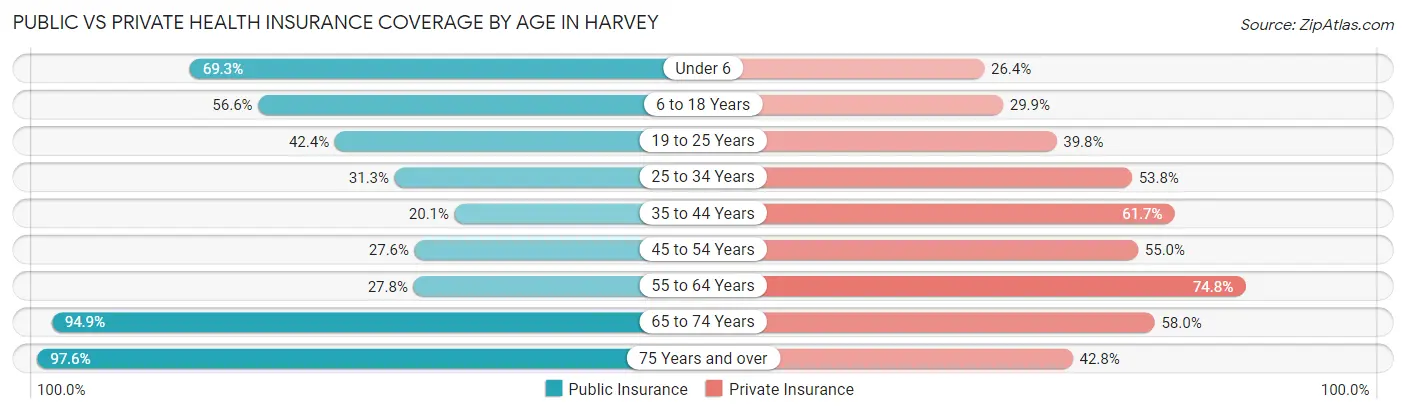
| Age Bracket | Public Insurance | Private Insurance |
| Under 6 | 1,187 (69.3%) | 452 (26.4%) |
| 6 to 18 Years | 2,370 (56.6%) | 1,251 (29.9%) |
| 19 to 25 Years | 543 (42.4%) | 510 (39.8%) |
| 25 to 34 Years | 903 (31.3%) | 1,554 (53.8%) |
| 35 to 44 Years | 542 (20.1%) | 1,661 (61.7%) |
| 45 to 54 Years | 788 (27.6%) | 1,571 (54.9%) |
| 55 to 64 Years | 715 (27.8%) | 1,927 (74.8%) |
| 65 to 74 Years | 1,801 (94.9%) | 1,101 (58.0%) |
| 75 Years and over | 1,110 (97.6%) | 487 (42.8%) |
| Total | 9,959 (46.9%) | 10,514 (49.5%) |
Disability Status by Sex by Age in Harvey
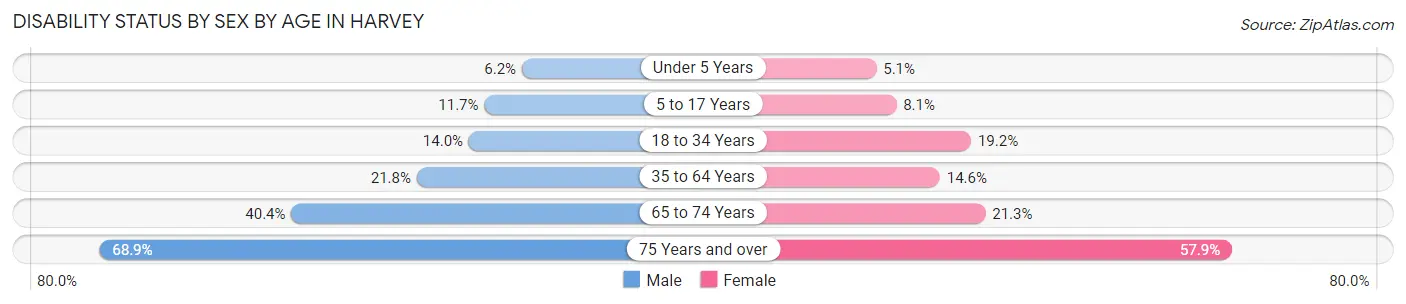
| Age Bracket | Male | Female |
| Under 5 Years | 50 (6.1%) | 41 (5.1%) |
| 5 to 17 Years | 271 (11.7%) | 140 (8.1%) |
| 18 to 34 Years | 326 (14.0%) | 400 (19.2%) |
| 35 to 64 Years | 845 (21.8%) | 617 (14.5%) |
| 65 to 74 Years | 353 (40.4%) | 218 (21.3%) |
| 75 Years and over | 341 (68.9%) | 372 (57.9%) |
Disability Class by Sex by Age in Harvey
Disability Class: Hearing Difficulty
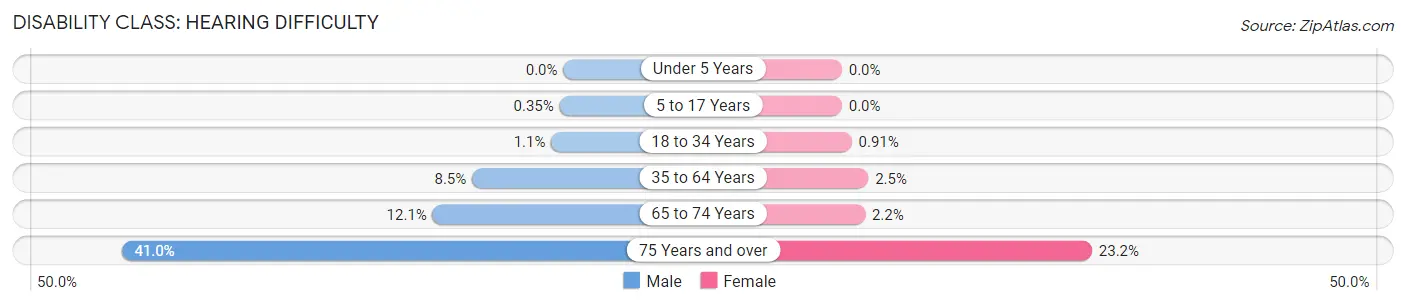
| Age Bracket | Male | Female |
| Under 5 Years | 0 (0.0%) | 0 (0.0%) |
| 5 to 17 Years | 8 (0.4%) | 0 (0.0%) |
| 18 to 34 Years | 26 (1.1%) | 19 (0.9%) |
| 35 to 64 Years | 329 (8.5%) | 104 (2.5%) |
| 65 to 74 Years | 106 (12.1%) | 22 (2.1%) |
| 75 Years and over | 203 (41.0%) | 149 (23.2%) |
Disability Class: Vision Difficulty
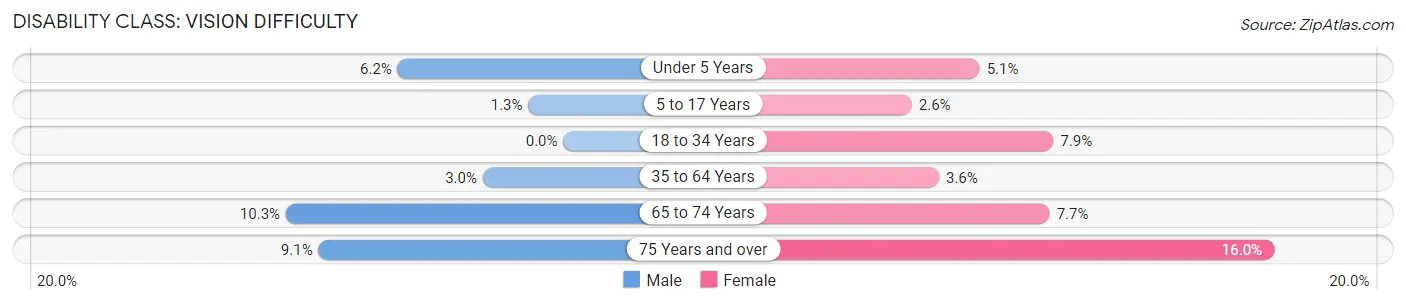
| Age Bracket | Male | Female |
| Under 5 Years | 50 (6.1%) | 41 (5.1%) |
| 5 to 17 Years | 30 (1.3%) | 45 (2.6%) |
| 18 to 34 Years | 0 (0.0%) | 164 (7.9%) |
| 35 to 64 Years | 116 (3.0%) | 153 (3.6%) |
| 65 to 74 Years | 90 (10.3%) | 79 (7.7%) |
| 75 Years and over | 45 (9.1%) | 103 (16.0%) |
Disability Class: Cognitive Difficulty
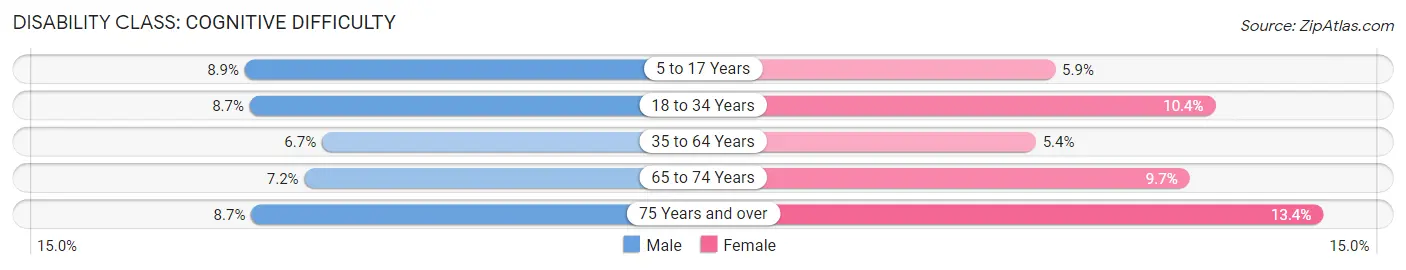
| Age Bracket | Male | Female |
| 5 to 17 Years | 205 (8.9%) | 103 (5.9%) |
| 18 to 34 Years | 203 (8.7%) | 217 (10.4%) |
| 35 to 64 Years | 261 (6.7%) | 229 (5.4%) |
| 65 to 74 Years | 63 (7.2%) | 99 (9.7%) |
| 75 Years and over | 43 (8.7%) | 86 (13.4%) |
Disability Class: Ambulatory Difficulty
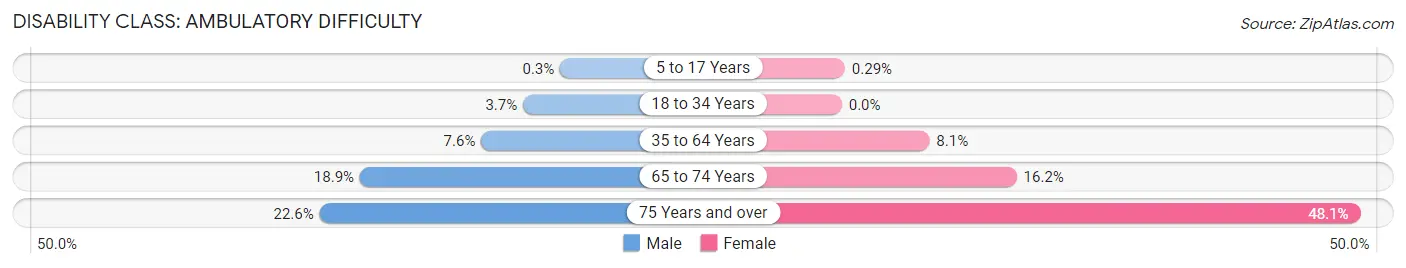
| Age Bracket | Male | Female |
| 5 to 17 Years | 7 (0.3%) | 5 (0.3%) |
| 18 to 34 Years | 87 (3.7%) | 0 (0.0%) |
| 35 to 64 Years | 296 (7.6%) | 345 (8.1%) |
| 65 to 74 Years | 165 (18.9%) | 166 (16.2%) |
| 75 Years and over | 112 (22.6%) | 309 (48.1%) |
Disability Class: Self-Care Difficulty
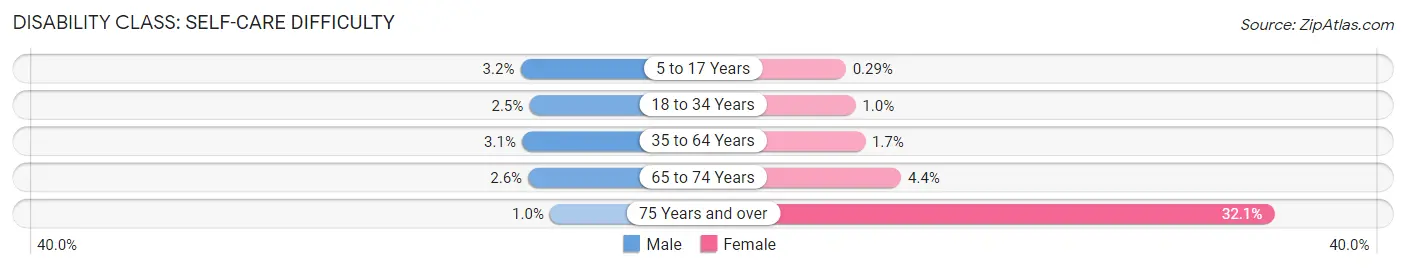
| Age Bracket | Male | Female |
| 5 to 17 Years | 74 (3.2%) | 5 (0.3%) |
| 18 to 34 Years | 59 (2.5%) | 21 (1.0%) |
| 35 to 64 Years | 120 (3.1%) | 73 (1.7%) |
| 65 to 74 Years | 23 (2.6%) | 45 (4.4%) |
| 75 Years and over | 5 (1.0%) | 206 (32.1%) |
Technology Access in Harvey
Computing Device Access in Harvey
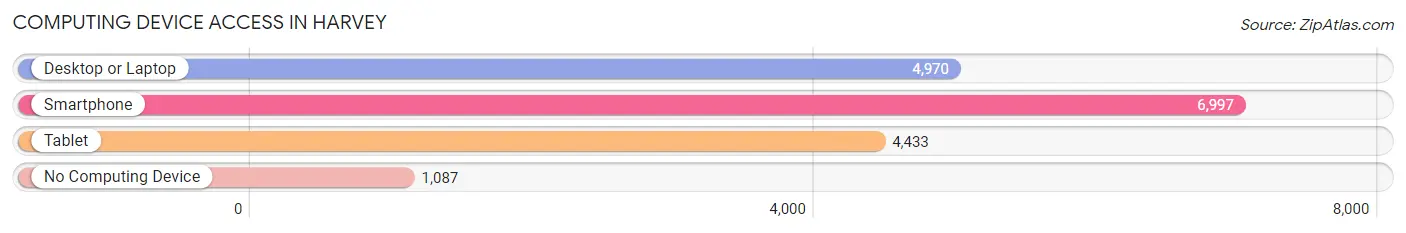
| Device Type | # Households | % Households |
| Desktop or Laptop | 4,970 | 59.3% |
| Smartphone | 6,997 | 83.5% |
| Tablet | 4,433 | 52.9% |
| No Computing Device | 1,087 | 13.0% |
| Total | 8,379 | 100.0% |
Internet Access in Harvey
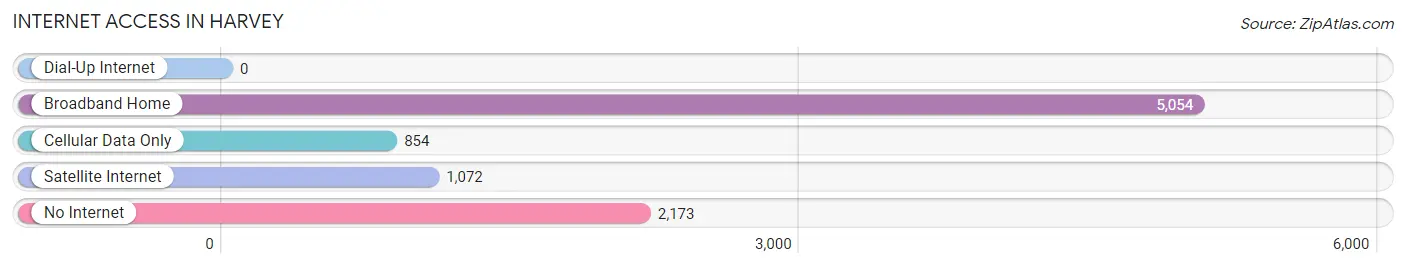
| Internet Type | # Households | % Households |
| Dial-Up Internet | 0 | 0.0% |
| Broadband Home | 5,054 | 60.3% |
| Cellular Data Only | 854 | 10.2% |
| Satellite Internet | 1,072 | 12.8% |
| No Internet | 2,173 | 25.9% |
| Total | 8,379 | 100.0% |
Harvey Summary
Harvey is a census-designated place (CDP) located in Jefferson Parish, Louisiana. It is a suburb of New Orleans and is located on the West Bank of the Mississippi River. The population of Harvey was 20,348 at the 2010 census.
History
Harvey was founded in 1855 by William Harvey, a former slave who had purchased his freedom. He purchased a large tract of land and built a home on the property. The area was originally known as Harvey's Settlement, and the name was later changed to Harvey.
The area was largely rural until the 1950s, when the population began to grow rapidly. The growth was spurred by the construction of the Harvey Canal, which provided access to the Mississippi River and allowed for the development of the area.
Geography
Harvey is located at 29°54'25" North, 90°7'25" West (29.906833, -90.123611). It is bordered by the cities of Gretna and Marrero to the north, Westwego to the east, and Belle Chasse to the south.
The Harvey Canal runs through the center of the community, providing access to the Mississippi River. The canal is lined with a variety of businesses, including restaurants, marinas, and boat launches.
Economy
Harvey is home to a variety of businesses, including retail stores, restaurants, and industrial plants. The largest employer in the area is the Avondale Shipyard, which employs over 4,000 people. Other major employers include the U.S. Navy, the U.S. Coast Guard, and the Louisiana National Guard.
The area is also home to a number of small businesses, including restaurants, convenience stores, and auto repair shops.
Demographics
As of the 2010 census, the population of Harvey was 20,348. The racial makeup of the community was 57.3% African American, 37.2% White, 2.2% Asian, 0.7% Native American, and 0.6% from other races.
The median household income in Harvey was $37,945, and the median family income was $45,945. The per capita income was $19,945.
Conclusion
Harvey is a census-designated place located in Jefferson Parish, Louisiana. It is a suburb of New Orleans and is located on the West Bank of the Mississippi River. The population of Harvey was 20,348 at the 2010 census. The area was founded in 1855 by William Harvey, a former slave who had purchased his freedom. The area was largely rural until the 1950s, when the population began to grow rapidly. The growth was spurred by the construction of the Harvey Canal, which provided access to the Mississippi River and allowed for the development of the area. Harvey is home to a variety of businesses, including retail stores, restaurants, and industrial plants. The largest employer in the area is the Avondale Shipyard. As of the 2010 census, the population of Harvey was 20,348. The racial makeup of the community was 57.3% African American, 37.2% White, 2.2% Asian, 0.7% Native American, and 0.6% from other races. The median household income in Harvey was $37,945, and the median family income was $45,945. The per capita income was $19,945.
Common Questions
What is the Total Population of Harvey?
Total Population of Harvey is 21,485.
What is the Total Male Population of Harvey?
Total Male Population of Harvey is 10,844.
What is the Total Female Population of Harvey?
Total Female Population of Harvey is 10,641.
What is the Ratio of Males per 100 Females in Harvey?
There are 101.91 Males per 100 Females in Harvey.
What is the Ratio of Females per 100 Males in Harvey?
There are 98.13 Females per 100 Males in Harvey.
What is the Median Population Age in Harvey?
Median Population Age in Harvey is 37.5 Years.
What is the Average Family Size in Harvey
Average Family Size in Harvey is 3.4 People.
What is the Average Household Size in Harvey
Average Household Size in Harvey is 2.5 People.
What is Per Capita Income in Harvey?
Per Capita income in Harvey is $25,398.
What is the Median Family Income in Harvey?
Median Family Income in Harvey is $54,574.
What is the Median Household income in Harvey?
Median Household Income in Harvey is $41,994.
What is Income or Wage Gap in Harvey?
Income or Wage Gap in Harvey is 19.2%.
Women in Harvey earn 80.8 cents for every dollar earned by a man.
What is Family Income Deficit in Harvey?
Family Income Deficit in Harvey is $12,075.
Families that are below poverty line in Harvey earn $12,075 less on average than the poverty threshold level.
What is Inequality or Gini Index in Harvey?
Inequality or Gini Index in Harvey is 0.47.
How Large is the Labor Force in Harvey?
There are 9,871 People in the Labor Forcein in Harvey.
What is the Percentage of People in the Labor Force in Harvey?
59.8% of People are in the Labor Force in Harvey.
What is the Unemployment Rate in Harvey?
Unemployment Rate in Harvey is 9.5%.