Old Jefferson, LA
Old Jefferson Map
Old Jefferson Overview
8,162
TOTAL POPULATION
4,156
MALE POPULATION
4,006
FEMALE POPULATION
103.74
MALES / 100 FEMALES
96.39
FEMALES / 100 MALES
35.7
MEDIAN AGE
3.2
AVG FAMILY SIZE
2.2
AVG HOUSEHOLD SIZE
$53,503
PER CAPITA INCOME
$89,360
AVG FAMILY INCOME
$88,137
AVG HOUSEHOLD INCOME
52.3%
WAGE / INCOME GAP [ % ]
47.7¢/ $1
WAGE / INCOME GAP [ $ ]
0.41
INEQUALITY / GINI INDEX
4,554
LABOR FORCE [ PEOPLE ]
68.6%
PERCENT IN LABOR FORCE
4.3%
UNEMPLOYMENT RATE
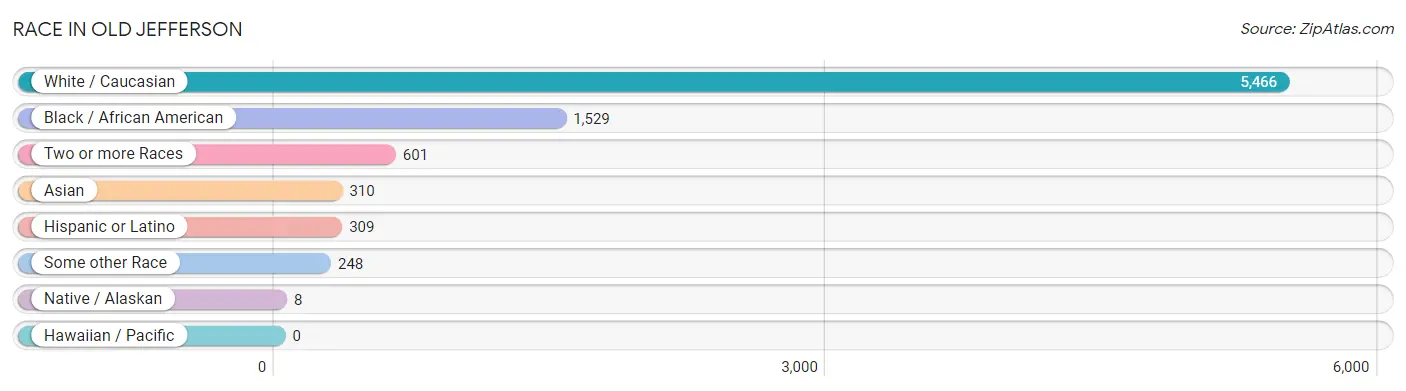
Race in Old Jefferson
The most populous races in Old Jefferson are White / Caucasian (5,466 | 67.0%), Black / African American (1,529 | 18.7%), and Two or more Races (601 | 7.4%).
| Race | # Population | % Population |
| Asian | 310 | 3.8% |
| Black / African American | 1,529 | 18.7% |
| Hawaiian / Pacific | 0 | 0.0% |
| Hispanic or Latino | 309 | 3.8% |
| Native / Alaskan | 8 | 0.1% |
| White / Caucasian | 5,466 | 67.0% |
| Two or more Races | 601 | 7.4% |
| Some other Race | 248 | 3.0% |
| Total | 8,162 | 100.0% |
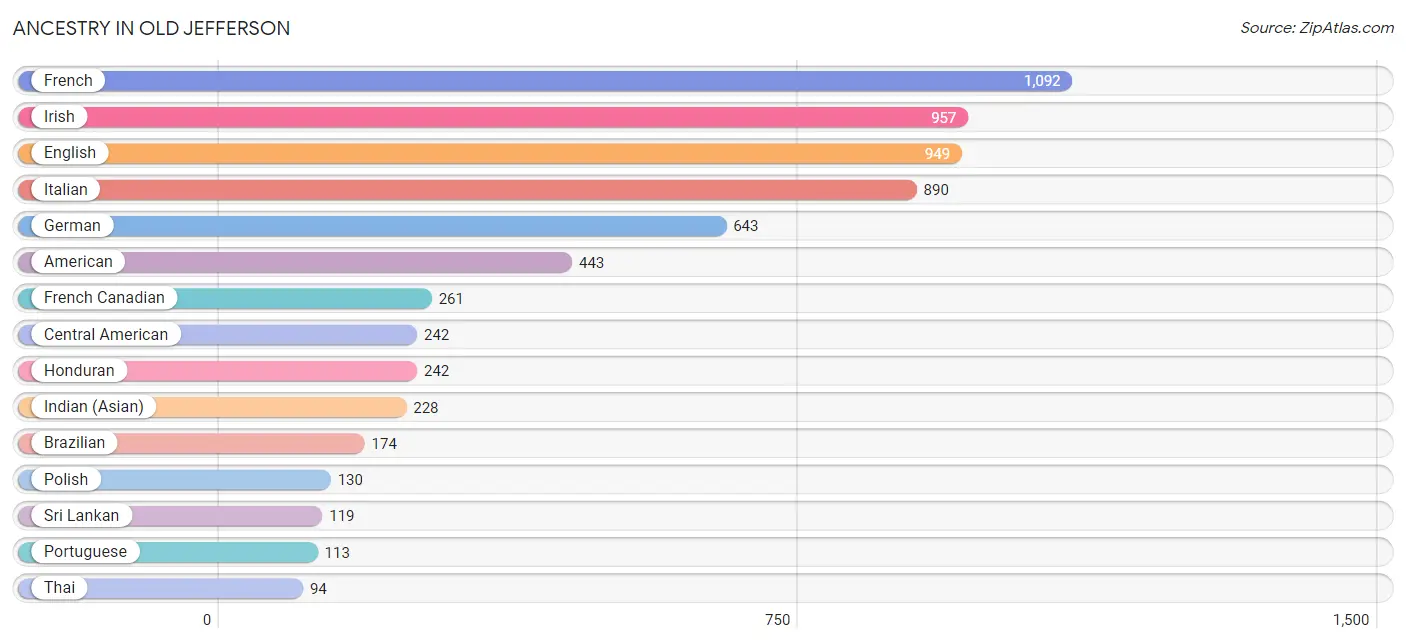
Ancestry in Old Jefferson
The most populous ancestries reported in Old Jefferson are French (1,092 | 13.4%), Irish (957 | 11.7%), English (949 | 11.6%), Italian (890 | 10.9%), and German (643 | 7.9%), together accounting for 55.5% of all Old Jefferson residents.
| Ancestry | # Population | % Population |
| African | 37 | 0.4% |
| American | 443 | 5.4% |
| Arab | 9 | 0.1% |
| Austrian | 40 | 0.5% |
| Bhutanese | 40 | 0.5% |
| Brazilian | 174 | 2.1% |
| Cajun | 46 | 0.6% |
| Central American | 242 | 3.0% |
| Cherokee | 29 | 0.4% |
| Choctaw | 39 | 0.5% |
| English | 949 | 11.6% |
| European | 17 | 0.2% |
| French | 1,092 | 13.4% |
| French Canadian | 261 | 3.2% |
| German | 643 | 7.9% |
| Greek | 82 | 1.0% |
| Honduran | 242 | 3.0% |
| Hungarian | 25 | 0.3% |
| Indian (Asian) | 228 | 2.8% |
| Irish | 957 | 11.7% |
| Italian | 890 | 10.9% |
| Korean | 21 | 0.3% |
| Laotian | 75 | 0.9% |
| Mexican | 35 | 0.4% |
| Palestinian | 9 | 0.1% |
| Polish | 130 | 1.6% |
| Portuguese | 113 | 1.4% |
| Puerto Rican | 17 | 0.2% |
| Scotch-Irish | 16 | 0.2% |
| Scottish | 53 | 0.6% |
| Spanish | 15 | 0.2% |
| Sri Lankan | 119 | 1.5% |
| Subsaharan African | 37 | 0.4% |
| Swiss | 34 | 0.4% |
| Thai | 94 | 1.1% |
| Turkish | 26 | 0.3% |
| Welsh | 32 | 0.4% | View All 37 Rows |
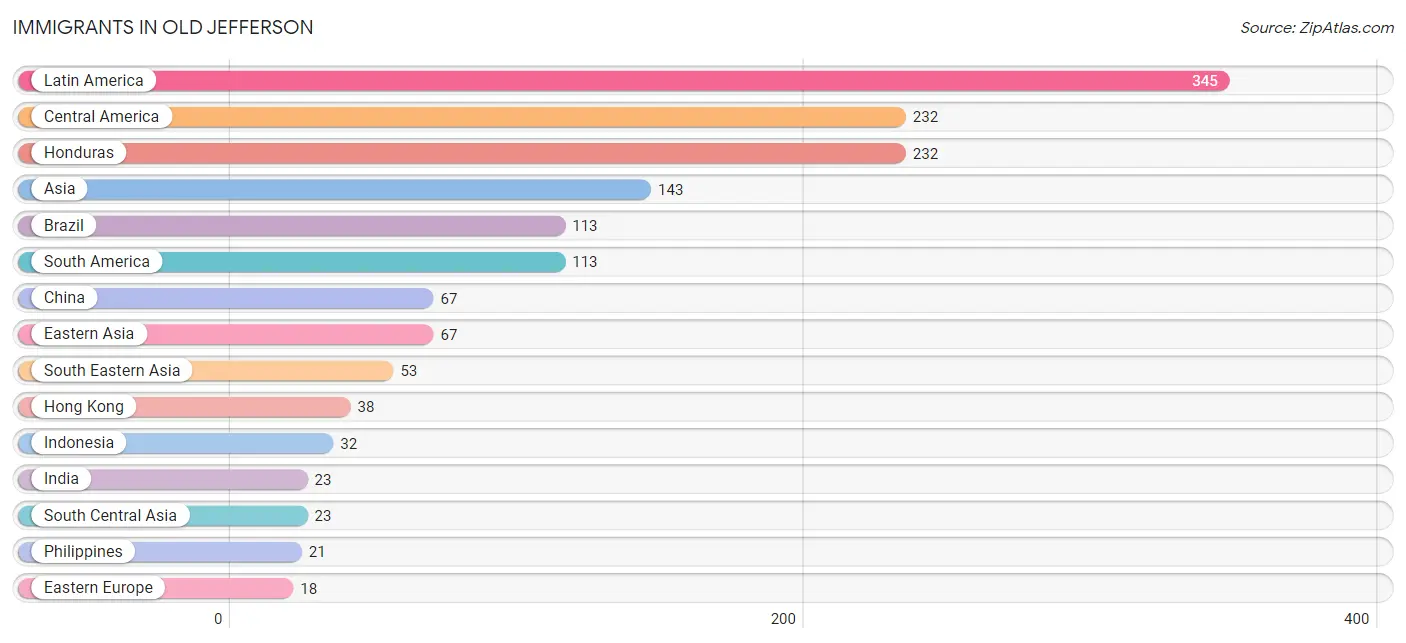
Immigrants in Old Jefferson
The most numerous immigrant groups reported in Old Jefferson came from Latin America (345 | 4.2%), Central America (232 | 2.8%), Honduras (232 | 2.8%), Asia (143 | 1.8%), and Brazil (113 | 1.4%), together accounting for 13.0% of all Old Jefferson residents.
| Immigration Origin | # Population | % Population |
| Asia | 143 | 1.8% |
| Brazil | 113 | 1.4% |
| Central America | 232 | 2.8% |
| China | 67 | 0.8% |
| Eastern Asia | 67 | 0.8% |
| Eastern Europe | 18 | 0.2% |
| Europe | 18 | 0.2% |
| Honduras | 232 | 2.8% |
| Hong Kong | 38 | 0.5% |
| Hungary | 18 | 0.2% |
| India | 23 | 0.3% |
| Indonesia | 32 | 0.4% |
| Latin America | 345 | 4.2% |
| Philippines | 21 | 0.3% |
| South America | 113 | 1.4% |
| South Central Asia | 23 | 0.3% |
| South Eastern Asia | 53 | 0.6% | View All 17 Rows |
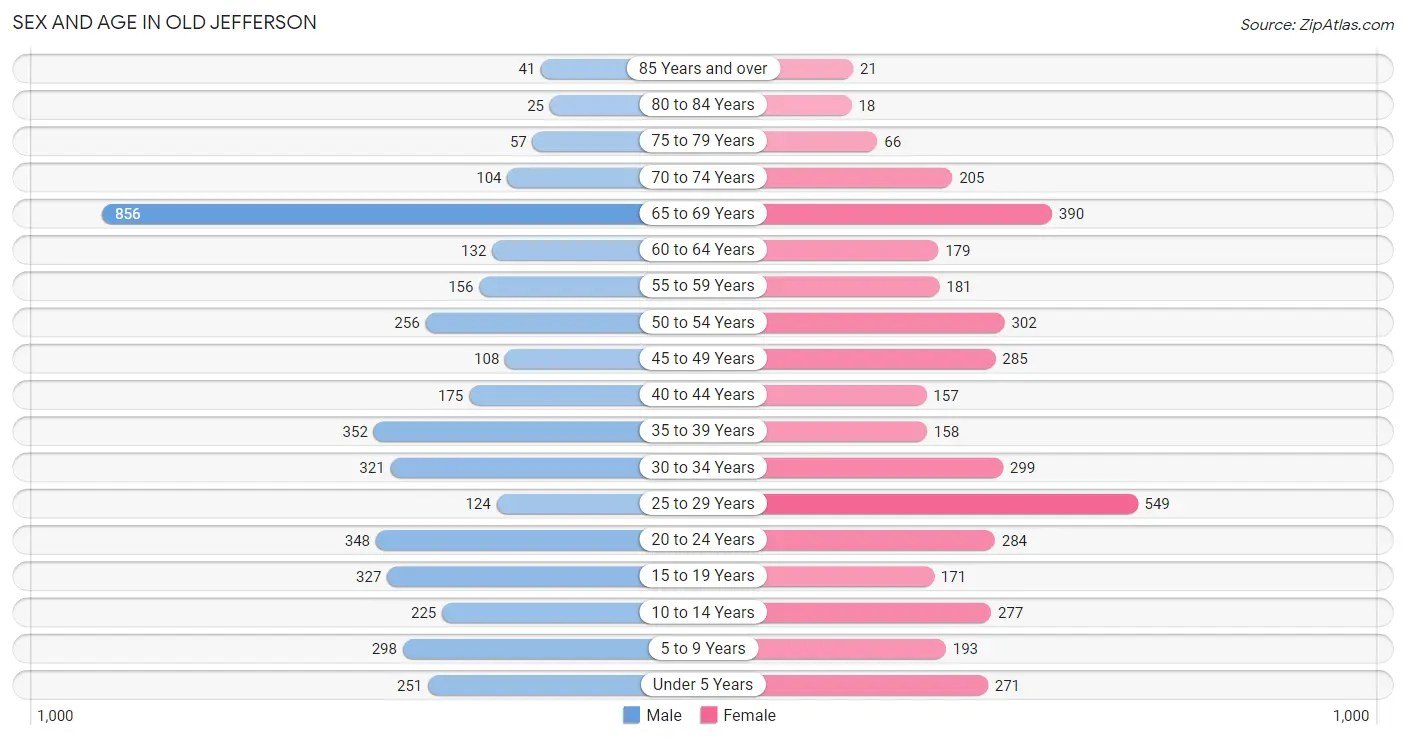
Sex and Age in Old Jefferson
Sex and Age in Old Jefferson
The most populous age groups in Old Jefferson are 65 to 69 Years (856 | 20.6%) for men and 25 to 29 Years (549 | 13.7%) for women.
| Age Bracket | Male | Female |
| Under 5 Years | 251 (6.0%) | 271 (6.8%) |
| 5 to 9 Years | 298 (7.2%) | 193 (4.8%) |
| 10 to 14 Years | 225 (5.4%) | 277 (6.9%) |
| 15 to 19 Years | 327 (7.9%) | 171 (4.3%) |
| 20 to 24 Years | 348 (8.4%) | 284 (7.1%) |
| 25 to 29 Years | 124 (3.0%) | 549 (13.7%) |
| 30 to 34 Years | 321 (7.7%) | 299 (7.5%) |
| 35 to 39 Years | 352 (8.5%) | 158 (3.9%) |
| 40 to 44 Years | 175 (4.2%) | 157 (3.9%) |
| 45 to 49 Years | 108 (2.6%) | 285 (7.1%) |
| 50 to 54 Years | 256 (6.2%) | 302 (7.5%) |
| 55 to 59 Years | 156 (3.7%) | 181 (4.5%) |
| 60 to 64 Years | 132 (3.2%) | 179 (4.5%) |
| 65 to 69 Years | 856 (20.6%) | 390 (9.7%) |
| 70 to 74 Years | 104 (2.5%) | 205 (5.1%) |
| 75 to 79 Years | 57 (1.4%) | 66 (1.7%) |
| 80 to 84 Years | 25 (0.6%) | 18 (0.4%) |
| 85 Years and over | 41 (1.0%) | 21 (0.5%) |
| Total | 4,156 (100.0%) | 4,006 (100.0%) |
Families and Households in Old Jefferson
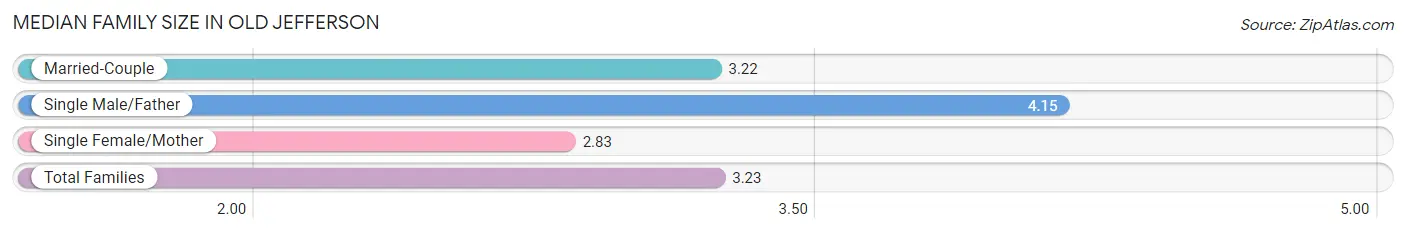
Median Family Size in Old Jefferson
The median family size in Old Jefferson is 3.23 persons per family, with single male/father families (169 | 9.4%) accounting for the largest median family size of 4.15 persons per family. On the other hand, single female/mother families (377 | 20.9%) represent the smallest median family size with 2.83 persons per family.
| Family Type | # Families | Family Size |
| Married-Couple | 1,254 (69.7%) | 3.22 |
| Single Male/Father | 169 (9.4%) | 4.15 |
| Single Female/Mother | 377 (20.9%) | 2.83 |
| Total Families | 1,800 (100.0%) | 3.23 |
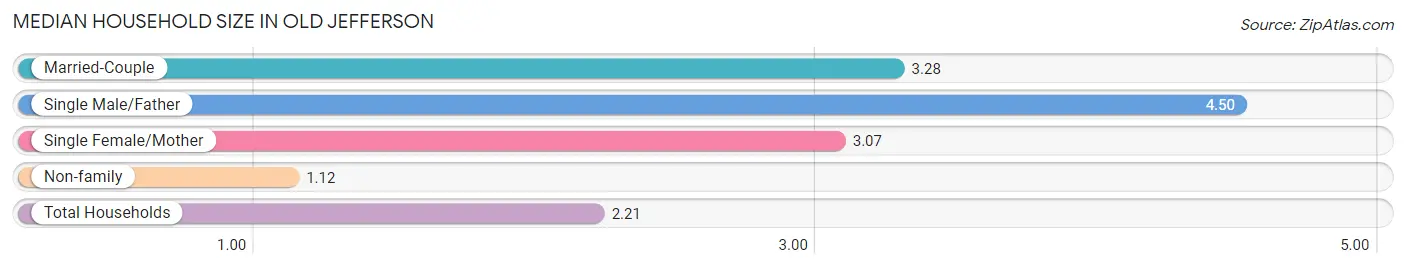
Median Household Size in Old Jefferson
The median household size in Old Jefferson is 2.21 persons per household, with single male/father households (169 | 4.6%) accounting for the largest median household size of 4.5 persons per household. non-family households (1,895 | 51.3%) represent the smallest median household size with 1.12 persons per household.
| Household Type | # Households | Household Size |
| Married-Couple | 1,254 (33.9%) | 3.28 |
| Single Male/Father | 169 (4.6%) | 4.50 |
| Single Female/Mother | 377 (10.2%) | 3.07 |
| Non-family | 1,895 (51.3%) | 1.12 |
| Total Households | 3,695 (100.0%) | 2.21 |
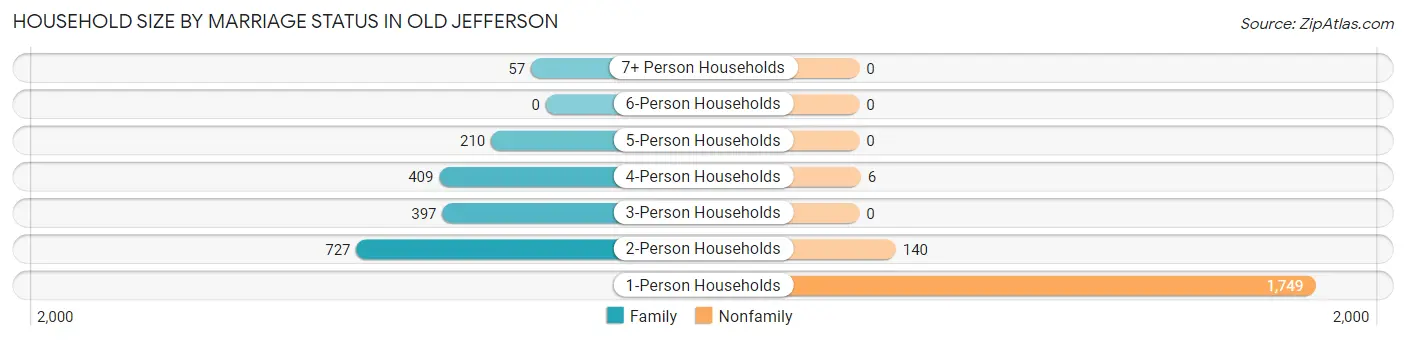
Household Size by Marriage Status in Old Jefferson
Out of a total of 3,695 households in Old Jefferson, 1,800 (48.7%) are family households, while 1,895 (51.3%) are nonfamily households. The most numerous type of family households are 2-person households, comprising 727, and the most common type of nonfamily households are 1-person households, comprising 1,749.
| Household Size | Family Households | Nonfamily Households |
| 1-Person Households | - | 1,749 (47.3%) |
| 2-Person Households | 727 (19.7%) | 140 (3.8%) |
| 3-Person Households | 397 (10.7%) | 0 (0.0%) |
| 4-Person Households | 409 (11.1%) | 6 (0.2%) |
| 5-Person Households | 210 (5.7%) | 0 (0.0%) |
| 6-Person Households | 0 (0.0%) | 0 (0.0%) |
| 7+ Person Households | 57 (1.5%) | 0 (0.0%) |
| Total | 1,800 (48.7%) | 1,895 (51.3%) |
Female Fertility in Old Jefferson
Fertility by Age in Old Jefferson
Average fertility rate in Old Jefferson is 51.0 births per 1,000 women. Women in the age bracket of 20 to 34 years have the highest fertility rate with 66.0 births per 1,000 women. Women in the age bracket of 20 to 34 years acount for 75.0% of all women with births.
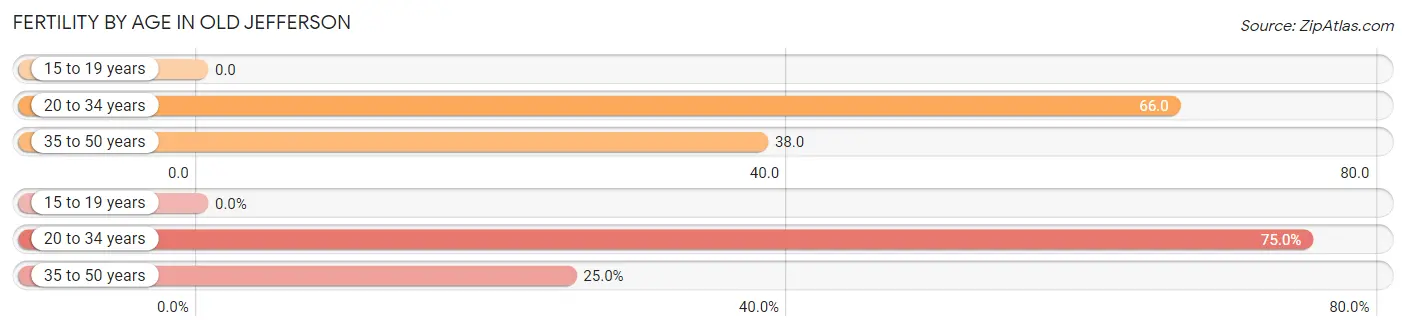
| Age Bracket | Women with Births | Births / 1,000 Women |
| 15 to 19 years | 0 (0.0%) | 0.0 |
| 20 to 34 years | 75 (75.0%) | 66.0 |
| 35 to 50 years | 25 (25.0%) | 38.0 |
| Total | 100 (100.0%) | 51.0 |
Fertility by Age by Marriage Status in Old Jefferson
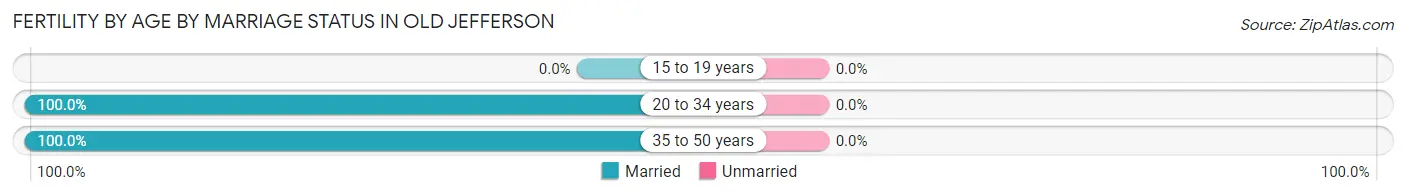
| Age Bracket | Married | Unmarried |
| 15 to 19 years | 0 (0.0%) | 0 (0.0%) |
| 20 to 34 years | 75 (100.0%) | 0 (0.0%) |
| 35 to 50 years | 25 (100.0%) | 0 (0.0%) |
| Total | 100 (100.0%) | 0 (0.0%) |
Fertility by Education in Old Jefferson
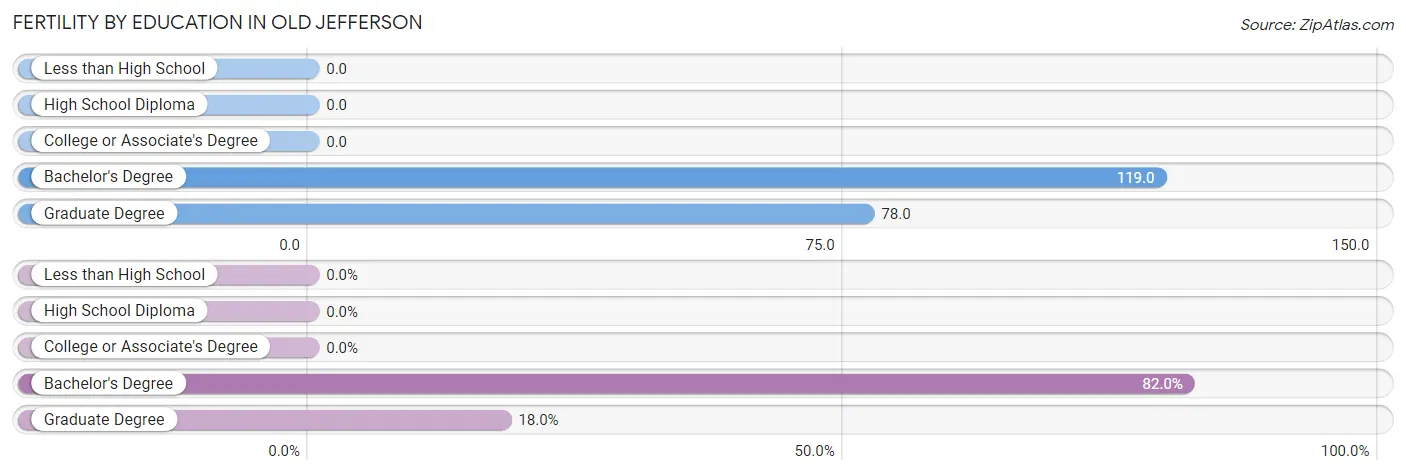
| Educational Attainment | Women with Births | Births / 1,000 Women |
| Less than High School | 0 (0.0%) | 0.0 |
| High School Diploma | 0 (0.0%) | 0.0 |
| College or Associate's Degree | 0 (0.0%) | 0.0 |
| Bachelor's Degree | 82 (82.0%) | 119.0 |
| Graduate Degree | 18 (18.0%) | 78.0 |
| Total | 100 (100.0%) | 51.0 |
Fertility by Education by Marriage Status in Old Jefferson
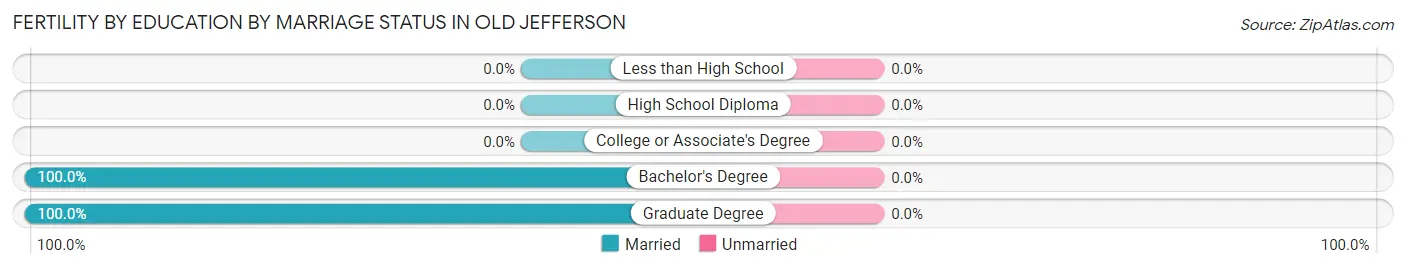
| Educational Attainment | Married | Unmarried |
| Less than High School | 0 (0.0%) | 0 (0.0%) |
| High School Diploma | 0 (0.0%) | 0 (0.0%) |
| College or Associate's Degree | 0 (0.0%) | 0 (0.0%) |
| Bachelor's Degree | 82 (100.0%) | 0 (0.0%) |
| Graduate Degree | 18 (100.0%) | 0 (0.0%) |
| Total | 100 (100.0%) | 0 (0.0%) |
Income in Old Jefferson
Income Overview in Old Jefferson
Per Capita Income in Old Jefferson is $53,503, while median incomes of families and households are $89,360 and $88,137 respectively.
| Characteristic | Number | Measure |
| Per Capita Income | 8,162 | $53,503 |
| Median Family Income | 1,800 | $89,360 |
| Mean Family Income | 1,800 | $109,250 |
| Median Household Income | 3,695 | $88,137 |
| Mean Household Income | 3,695 | $117,916 |
| Income Deficit | 1,800 | $0 |
| Wage / Income Gap (%) | 8,162 | 52.29% |
| Wage / Income Gap ($) | 8,162 | 47.71¢ per $1 |
| Gini / Inequality Index | 8,162 | 0.41 |
Earnings by Sex in Old Jefferson
Average Earnings in Old Jefferson are $56,241, $78,343 for men and $37,380 for women, a difference of 52.3%.
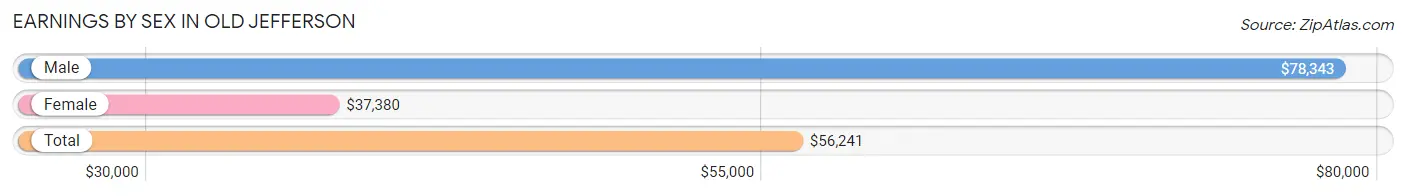
| Sex | Number | Average Earnings |
| Male | 2,526 (54.0%) | $78,343 |
| Female | 2,152 (46.0%) | $37,380 |
| Total | 4,678 (100.0%) | $56,241 |
Earnings by Sex by Income Bracket in Old Jefferson
The most common earnings brackets in Old Jefferson are $100,000+ for men (890 | 35.2%) and $30,000 to $34,999 for women (300 | 13.9%).
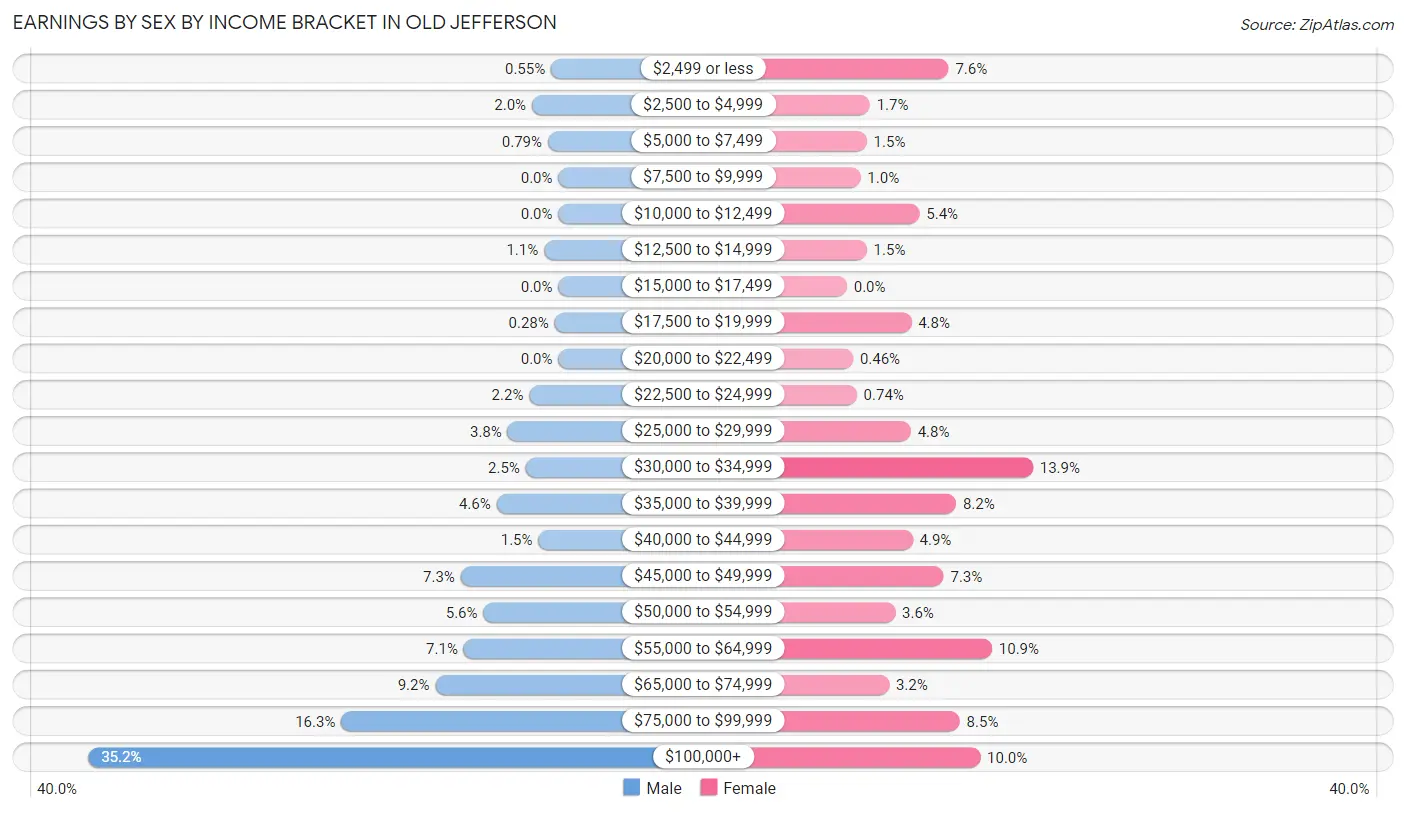
| Income | Male | Female |
| $2,499 or less | 14 (0.5%) | 164 (7.6%) |
| $2,500 to $4,999 | 50 (2.0%) | 37 (1.7%) |
| $5,000 to $7,499 | 20 (0.8%) | 32 (1.5%) |
| $7,500 to $9,999 | 0 (0.0%) | 22 (1.0%) |
| $10,000 to $12,499 | 0 (0.0%) | 117 (5.4%) |
| $12,500 to $14,999 | 27 (1.1%) | 32 (1.5%) |
| $15,000 to $17,499 | 0 (0.0%) | 0 (0.0%) |
| $17,500 to $19,999 | 7 (0.3%) | 104 (4.8%) |
| $20,000 to $22,499 | 0 (0.0%) | 10 (0.5%) |
| $22,500 to $24,999 | 55 (2.2%) | 16 (0.7%) |
| $25,000 to $29,999 | 96 (3.8%) | 103 (4.8%) |
| $30,000 to $34,999 | 62 (2.5%) | 300 (13.9%) |
| $35,000 to $39,999 | 117 (4.6%) | 176 (8.2%) |
| $40,000 to $44,999 | 38 (1.5%) | 106 (4.9%) |
| $45,000 to $49,999 | 185 (7.3%) | 156 (7.2%) |
| $50,000 to $54,999 | 142 (5.6%) | 78 (3.6%) |
| $55,000 to $64,999 | 179 (7.1%) | 234 (10.9%) |
| $65,000 to $74,999 | 233 (9.2%) | 68 (3.2%) |
| $75,000 to $99,999 | 411 (16.3%) | 182 (8.5%) |
| $100,000+ | 890 (35.2%) | 215 (10.0%) |
| Total | 2,526 (100.0%) | 2,152 (100.0%) |
Earnings by Sex by Educational Attainment in Old Jefferson
Average earnings in Old Jefferson are $81,021 for men and $40,098 for women, a difference of 50.5%. Men with an educational attainment of bachelor's degree enjoy the highest average annual earnings of $135,330, while those with high school diploma education earn the least with $38,285. Women with an educational attainment of bachelor's degree earn the most with the average annual earnings of $55,530, while those with high school diploma education have the smallest earnings of $35,278.
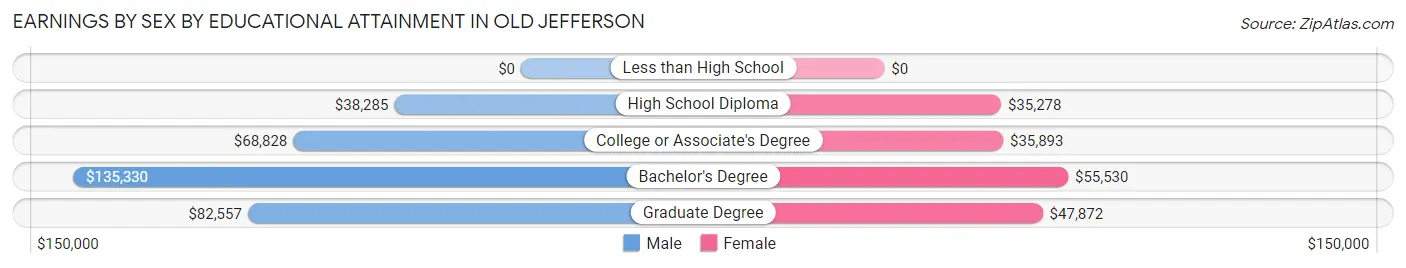
| Educational Attainment | Male Income | Female Income |
| Less than High School | - | - |
| High School Diploma | $38,285 | $35,278 |
| College or Associate's Degree | $68,828 | $35,893 |
| Bachelor's Degree | $135,330 | $55,530 |
| Graduate Degree | $82,557 | $47,872 |
| Total | $81,021 | $40,098 |
Family Income in Old Jefferson
Family Income Brackets in Old Jefferson
According to the Old Jefferson family income data, there are 385 families falling into the $100,000 to $149,999 income range, which is the most common income bracket and makes up 21.4% of all families. Conversely, the $10,000 to $14,999 income bracket is the least frequent group with only 16 families (0.9%) belonging to this category.
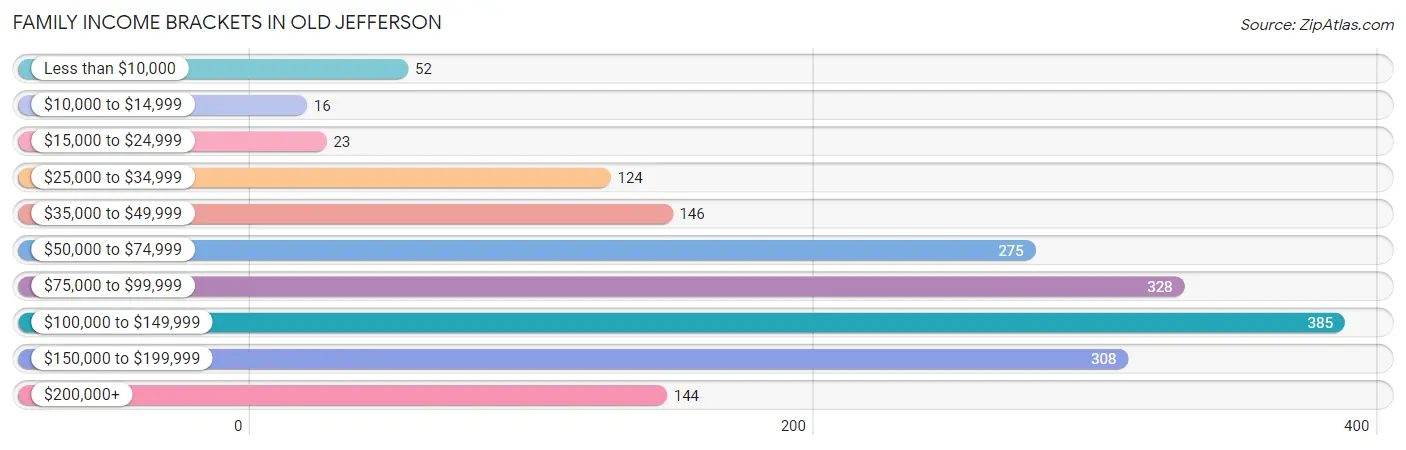
| Income Bracket | # Families | % Families |
| Less than $10,000 | 52 | 2.9% |
| $10,000 to $14,999 | 16 | 0.9% |
| $15,000 to $24,999 | 23 | 1.3% |
| $25,000 to $34,999 | 124 | 6.9% |
| $35,000 to $49,999 | 146 | 8.1% |
| $50,000 to $74,999 | 275 | 15.3% |
| $75,000 to $99,999 | 328 | 18.2% |
| $100,000 to $149,999 | 385 | 21.4% |
| $150,000 to $199,999 | 308 | 17.1% |
| $200,000+ | 144 | 8.0% |
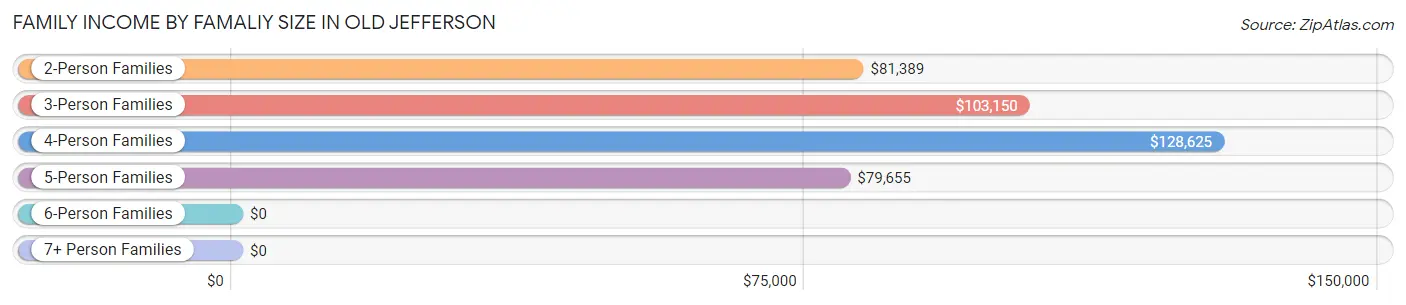
Family Income by Famaliy Size in Old Jefferson
4-person families (362 | 20.1%) account for the highest median family income in Old Jefferson with $128,625 per family, while 2-person families (862 | 47.9%) have the highest median income of $40,694 per family member.
| Income Bracket | # Families | Median Income |
| 2-Person Families | 862 (47.9%) | $81,389 |
| 3-Person Families | 309 (17.2%) | $103,150 |
| 4-Person Families | 362 (20.1%) | $128,625 |
| 5-Person Families | 210 (11.7%) | $79,655 |
| 6-Person Families | 0 (0.0%) | $0 |
| 7+ Person Families | 57 (3.2%) | $0 |
| Total | 1,800 (100.0%) | $89,360 |
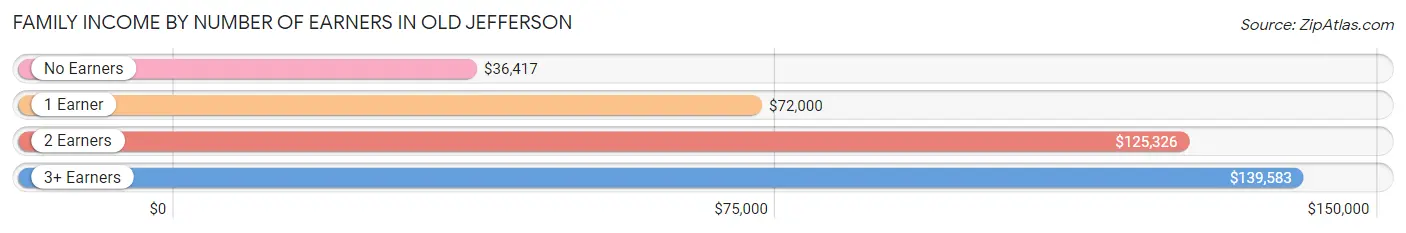
Family Income by Number of Earners in Old Jefferson
The median family income in Old Jefferson is $89,360, with families comprising 3+ earners (123) having the highest median family income of $139,583, while families with no earners (161) have the lowest median family income of $36,417, accounting for 6.8% and 8.9% of families, respectively.
| Number of Earners | # Families | Median Income |
| No Earners | 161 (8.9%) | $36,417 |
| 1 Earner | 582 (32.3%) | $72,000 |
| 2 Earners | 934 (51.9%) | $125,326 |
| 3+ Earners | 123 (6.8%) | $139,583 |
| Total | 1,800 (100.0%) | $89,360 |
Household Income in Old Jefferson
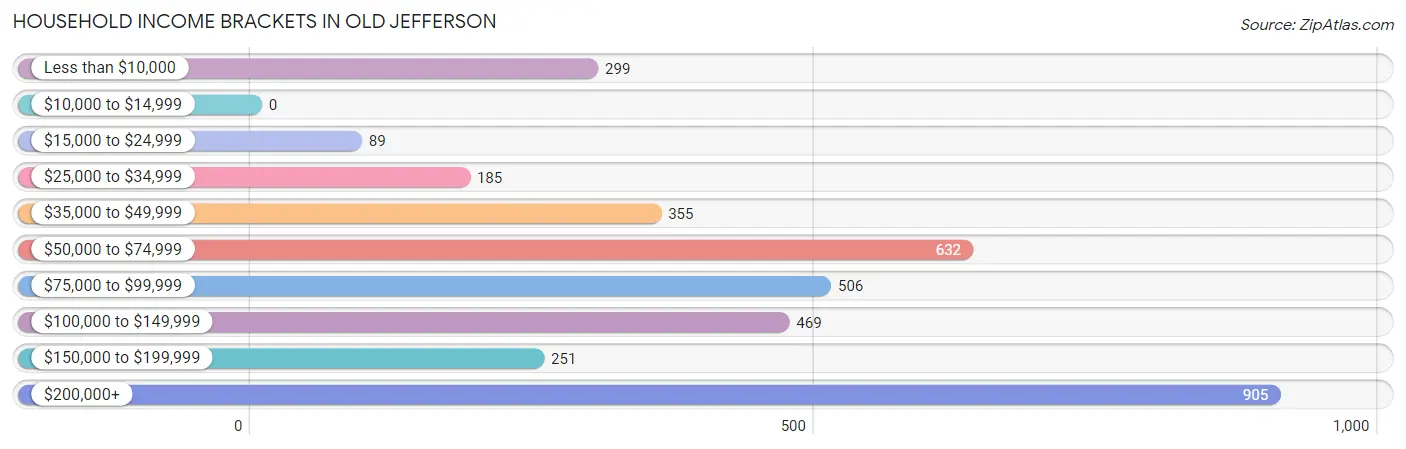
Household Income Brackets in Old Jefferson
With 905 households falling in the category, the $200,000+ income range is the most frequent in Old Jefferson, accounting for 24.5% of all households.
| Income Bracket | # Households | % Households |
| Less than $10,000 | 299 | 8.1% |
| $10,000 to $14,999 | 0 | 0.0% |
| $15,000 to $24,999 | 89 | 2.4% |
| $25,000 to $34,999 | 185 | 5.0% |
| $35,000 to $49,999 | 355 | 9.6% |
| $50,000 to $74,999 | 632 | 17.1% |
| $75,000 to $99,999 | 506 | 13.7% |
| $100,000 to $149,999 | 469 | 12.7% |
| $150,000 to $199,999 | 251 | 6.8% |
| $200,000+ | 905 | 24.5% |
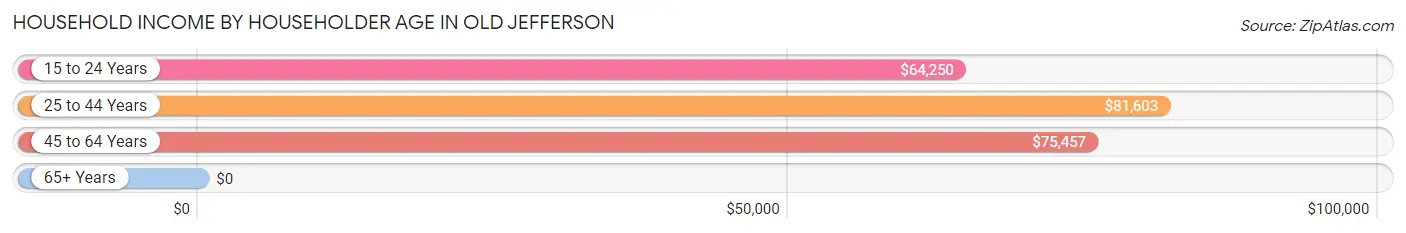
Household Income by Householder Age in Old Jefferson
The median household income in Old Jefferson is $88,137, with the highest median household income of $81,603 found in the 25 to 44 years age bracket for the primary householder. A total of 1,207 households (32.7%) fall into this category. Meanwhile, the 65+ years age bracket for the primary householder has the lowest median household income of $0, with 1,427 households (38.6%) in this group.
| Income Bracket | # Households | Median Income |
| 15 to 24 Years | 134 (3.6%) | $64,250 |
| 25 to 44 Years | 1,207 (32.7%) | $81,603 |
| 45 to 64 Years | 927 (25.1%) | $75,457 |
| 65+ Years | 1,427 (38.6%) | $0 |
| Total | 3,695 (100.0%) | $88,137 |
Poverty in Old Jefferson
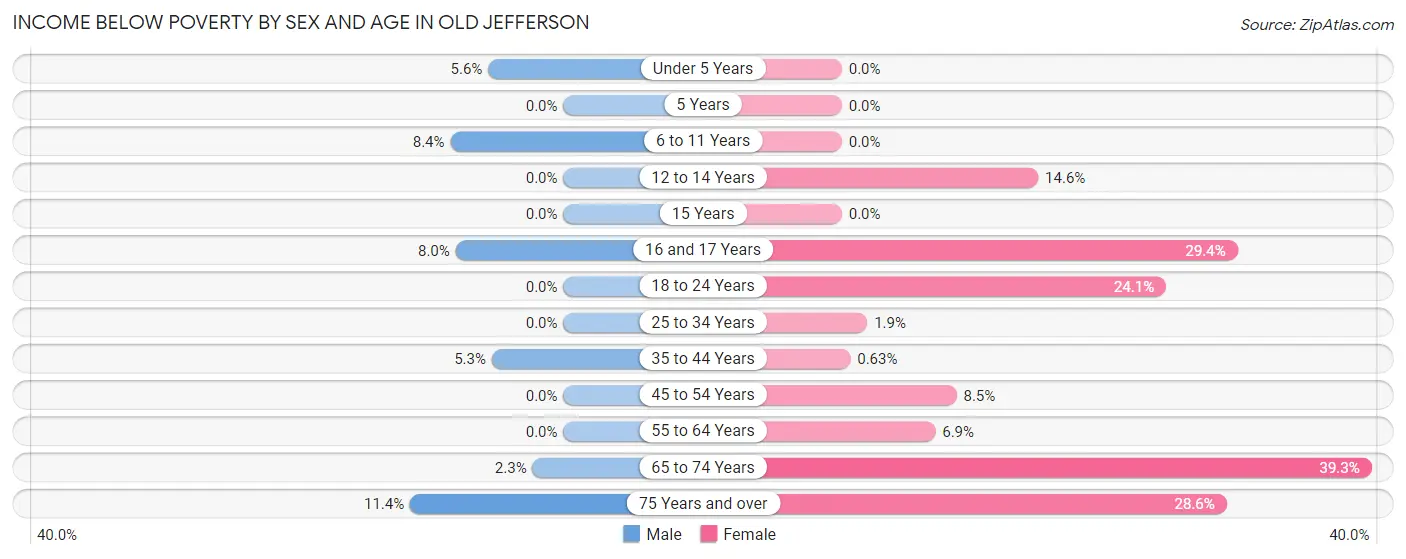
Income Below Poverty by Sex and Age in Old Jefferson
With 2.8% poverty level for males and 12.6% for females among the residents of Old Jefferson, 75 year old and over males and 65 to 74 year old females are the most vulnerable to poverty, with 14 males (11.4%) and 234 females (39.3%) in their respective age groups living below the poverty level.
| Age Bracket | Male | Female |
| Under 5 Years | 14 (5.6%) | 0 (0.0%) |
| 5 Years | 0 (0.0%) | 0 (0.0%) |
| 6 to 11 Years | 24 (8.4%) | 0 (0.0%) |
| 12 to 14 Years | 0 (0.0%) | 28 (14.6%) |
| 15 Years | 0 (0.0%) | 0 (0.0%) |
| 16 and 17 Years | 16 (8.0%) | 47 (29.4%) |
| 18 to 24 Years | 0 (0.0%) | 71 (24.1%) |
| 25 to 34 Years | 0 (0.0%) | 16 (1.9%) |
| 35 to 44 Years | 28 (5.3%) | 2 (0.6%) |
| 45 to 54 Years | 0 (0.0%) | 50 (8.5%) |
| 55 to 64 Years | 0 (0.0%) | 25 (6.9%) |
| 65 to 74 Years | 22 (2.3%) | 234 (39.3%) |
| 75 Years and over | 14 (11.4%) | 30 (28.6%) |
| Total | 118 (2.8%) | 503 (12.6%) |
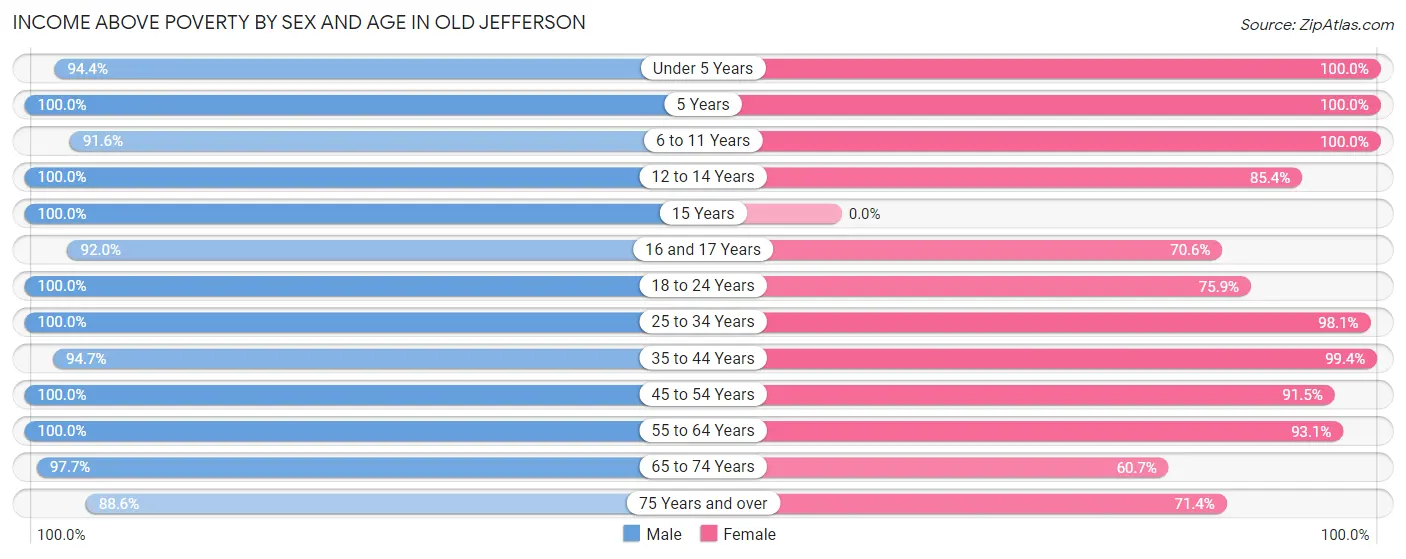
Income Above Poverty by Sex and Age in Old Jefferson
According to the poverty statistics in Old Jefferson, males aged 5 years and females aged under 5 years are the age groups that are most secure financially, with 100.0% of males and 100.0% of females in these age groups living above the poverty line.
| Age Bracket | Male | Female |
| Under 5 Years | 237 (94.4%) | 271 (100.0%) |
| 5 Years | 69 (100.0%) | 64 (100.0%) |
| 6 to 11 Years | 262 (91.6%) | 214 (100.0%) |
| 12 to 14 Years | 168 (100.0%) | 164 (85.4%) |
| 15 Years | 8 (100.0%) | 0 (0.0%) |
| 16 and 17 Years | 184 (92.0%) | 113 (70.6%) |
| 18 to 24 Years | 467 (100.0%) | 224 (75.9%) |
| 25 to 34 Years | 445 (100.0%) | 832 (98.1%) |
| 35 to 44 Years | 499 (94.7%) | 313 (99.4%) |
| 45 to 54 Years | 364 (100.0%) | 537 (91.5%) |
| 55 to 64 Years | 288 (100.0%) | 335 (93.1%) |
| 65 to 74 Years | 938 (97.7%) | 361 (60.7%) |
| 75 Years and over | 109 (88.6%) | 75 (71.4%) |
| Total | 4,038 (97.2%) | 3,503 (87.4%) |
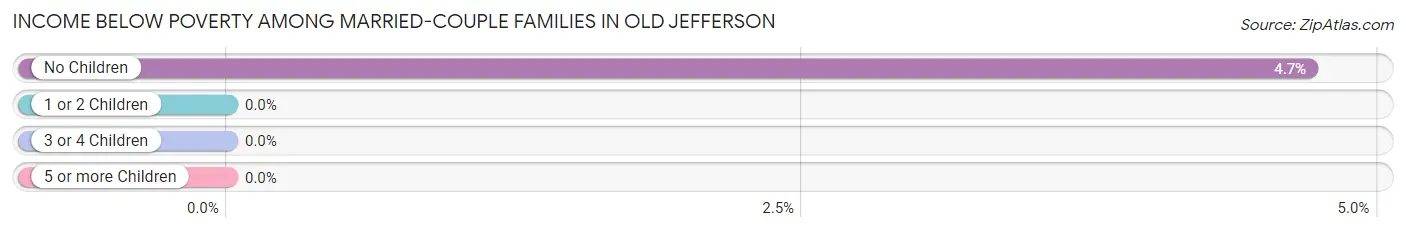
Income Below Poverty Among Married-Couple Families in Old Jefferson
The poverty statistics for married-couple families in Old Jefferson show that 2.3% or 29 of the total 1,254 families live below the poverty line. Families with no children have the highest poverty rate of 4.7%, comprising of 29 families. On the other hand, families with 1 or 2 children have the lowest poverty rate of 0.0%, which includes 0 families.
| Children | Above Poverty | Below Poverty |
| No Children | 588 (95.3%) | 29 (4.7%) |
| 1 or 2 Children | 533 (100.0%) | 0 (0.0%) |
| 3 or 4 Children | 104 (100.0%) | 0 (0.0%) |
| 5 or more Children | 0 (0.0%) | 0 (0.0%) |
| Total | 1,225 (97.7%) | 29 (2.3%) |
Income Below Poverty Among Single-Parent Households in Old Jefferson
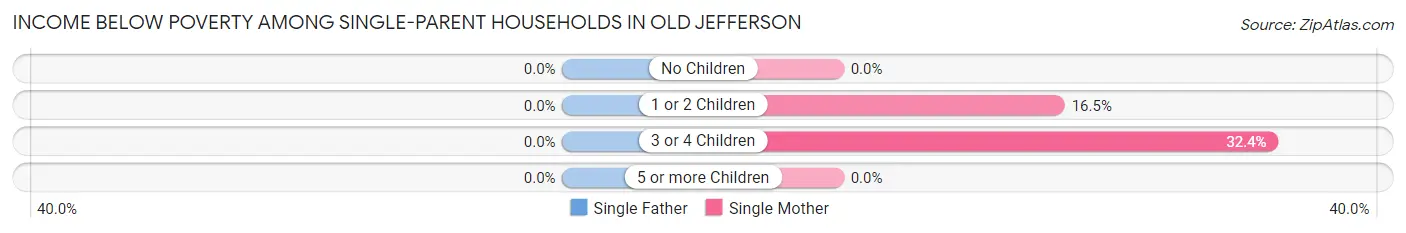
| Children | Single Father | Single Mother |
| No Children | 0 (0.0%) | 0 (0.0%) |
| 1 or 2 Children | 0 (0.0%) | 28 (16.5%) |
| 3 or 4 Children | 0 (0.0%) | 23 (32.4%) |
| 5 or more Children | 0 (0.0%) | 0 (0.0%) |
| Total | 0 (0.0%) | 51 (13.5%) |
Income Below Poverty Among Married-Couple vs Single-Parent Households in Old Jefferson
The poverty data for Old Jefferson shows that 29 of the married-couple family households (2.3%) and 51 of the single-parent households (9.3%) are living below the poverty level. Within the married-couple family households, those with no children have the highest poverty rate, with 29 households (4.7%) falling below the poverty line. Among the single-parent households, those with 3 or 4 children have the highest poverty rate, with 23 household (19.8%) living below poverty.
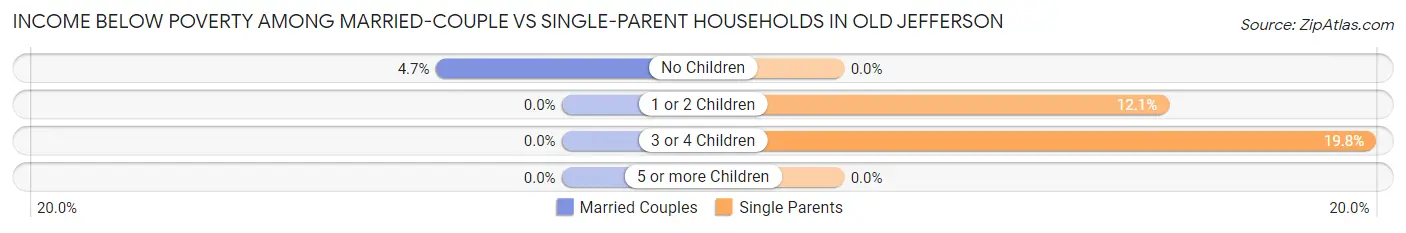
| Children | Married-Couple Families | Single-Parent Households |
| No Children | 29 (4.7%) | 0 (0.0%) |
| 1 or 2 Children | 0 (0.0%) | 28 (12.1%) |
| 3 or 4 Children | 0 (0.0%) | 23 (19.8%) |
| 5 or more Children | 0 (0.0%) | 0 (0.0%) |
| Total | 29 (2.3%) | 51 (9.3%) |
Employment Characteristics in Old Jefferson
Employment by Class of Employer in Old Jefferson
Among the 4,291 employed individuals in Old Jefferson, private company employees (3,137 | 73.1%), state government employees (310 | 7.2%), and self-employed (not incorporated) (300 | 7.0%) make up the most common classes of employment.
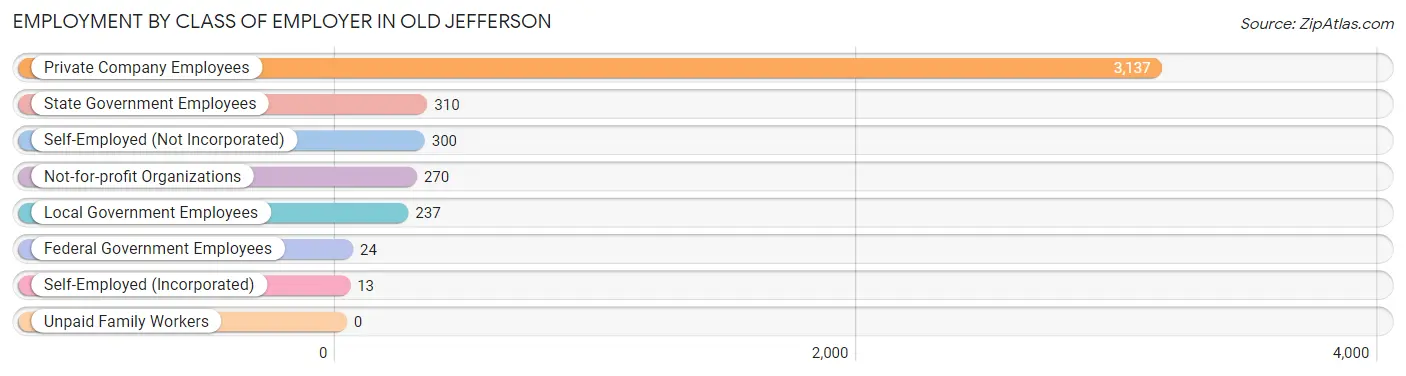
| Employer Class | # Employees | % Employees |
| Private Company Employees | 3,137 | 73.1% |
| Self-Employed (Incorporated) | 13 | 0.3% |
| Self-Employed (Not Incorporated) | 300 | 7.0% |
| Not-for-profit Organizations | 270 | 6.3% |
| Local Government Employees | 237 | 5.5% |
| State Government Employees | 310 | 7.2% |
| Federal Government Employees | 24 | 0.6% |
| Unpaid Family Workers | 0 | 0.0% |
| Total | 4,291 | 100.0% |
Employment Status by Age in Old Jefferson
According to the labor force statistics for Old Jefferson, out of the total population over 16 years of age (6,639), 68.6% or 4,554 individuals are in the labor force, with 4.3% or 196 of them unemployed. The age group with the highest labor force participation rate is 25 to 29 years, with 92.0% or 619 individuals in the labor force. Within the labor force, the 20 to 24 years age range has the highest percentage of unemployed individuals, with 22.7% or 74 of them being unemployed.
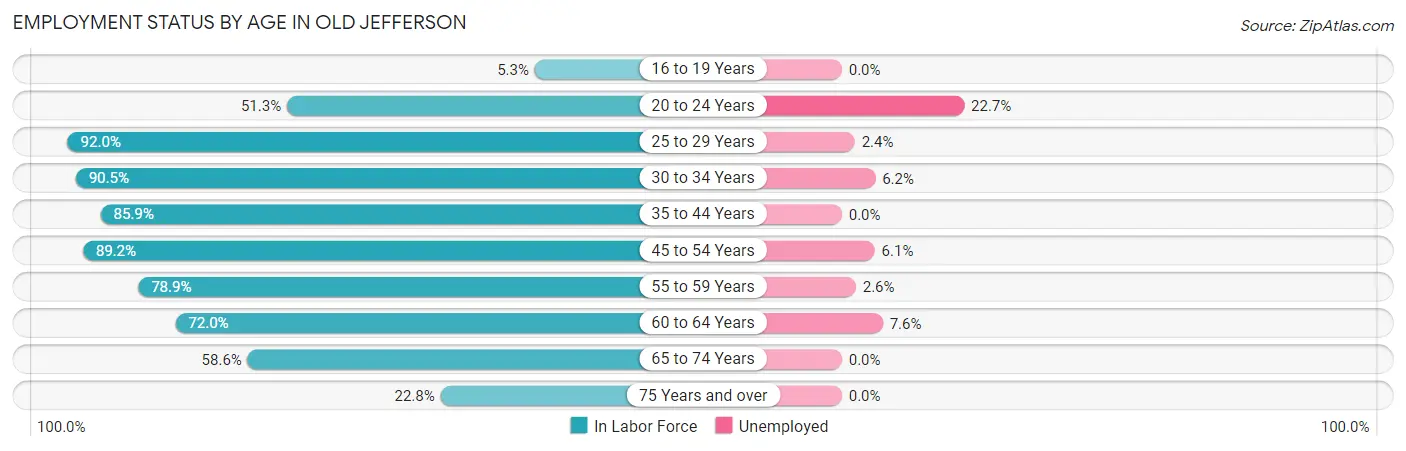
| Age Bracket | In Labor Force | Unemployed |
| 16 to 19 Years | 26 (5.3%) | 0 (0.0%) |
| 20 to 24 Years | 324 (51.3%) | 74 (22.7%) |
| 25 to 29 Years | 619 (92.0%) | 15 (2.4%) |
| 30 to 34 Years | 561 (90.5%) | 35 (6.2%) |
| 35 to 44 Years | 723 (85.9%) | 0 (0.0%) |
| 45 to 54 Years | 848 (89.2%) | 52 (6.1%) |
| 55 to 59 Years | 266 (78.9%) | 7 (2.6%) |
| 60 to 64 Years | 224 (72.0%) | 17 (7.6%) |
| 65 to 74 Years | 911 (58.6%) | 0 (0.0%) |
| 75 Years and over | 52 (22.8%) | 0 (0.0%) |
| Total | 4,554 (68.6%) | 196 (4.3%) |
Employment Status by Educational Attainment in Old Jefferson
According to labor force statistics for Old Jefferson, 86.8% of individuals (3,241) out of the total population between 25 and 64 years of age (3,734) are in the labor force, with 3.9% or 126 of them being unemployed. The group with the highest labor force participation rate are those with the educational attainment of bachelor's degree or higher, with 93.8% or 1,890 individuals in the labor force. Within the labor force, individuals with bachelor's degree or higher education have the highest percentage of unemployment, with 5.7% or 108 of them being unemployed.
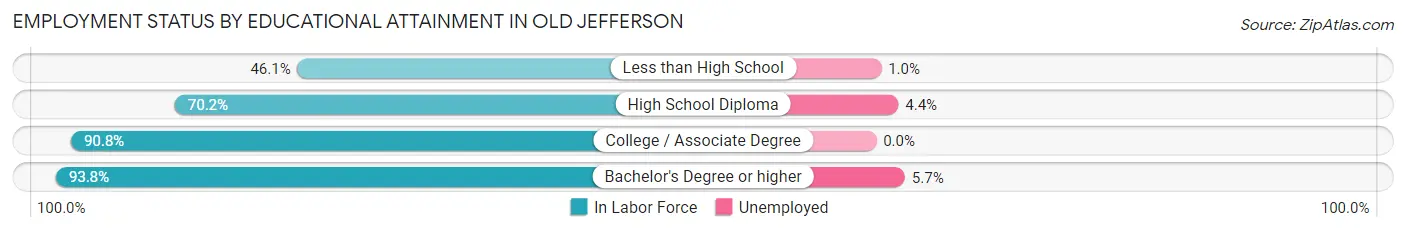
| Educational Attainment | In Labor Force | Unemployed |
| Less than High School | 101 (46.1%) | 2 (1.0%) |
| High School Diploma | 384 (70.2%) | 24 (4.4%) |
| College / Associate Degree | 865 (90.8%) | 0 (0.0%) |
| Bachelor's Degree or higher | 1,890 (93.8%) | 115 (5.7%) |
| Total | 3,241 (86.8%) | 146 (3.9%) |
Employment Occupations by Sex in Old Jefferson
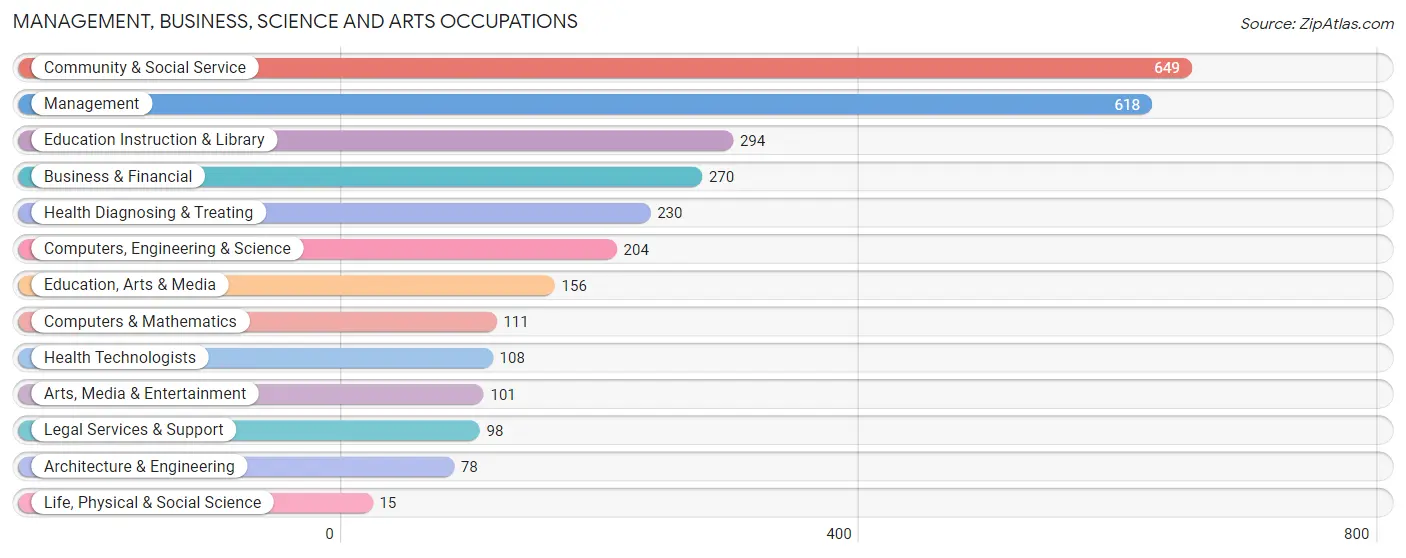
Management, Business, Science and Arts Occupations
The most common Management, Business, Science and Arts occupations in Old Jefferson are Community & Social Service (649 | 15.0%), Management (618 | 14.2%), Education Instruction & Library (294 | 6.8%), Business & Financial (270 | 6.2%), and Health Diagnosing & Treating (230 | 5.3%).
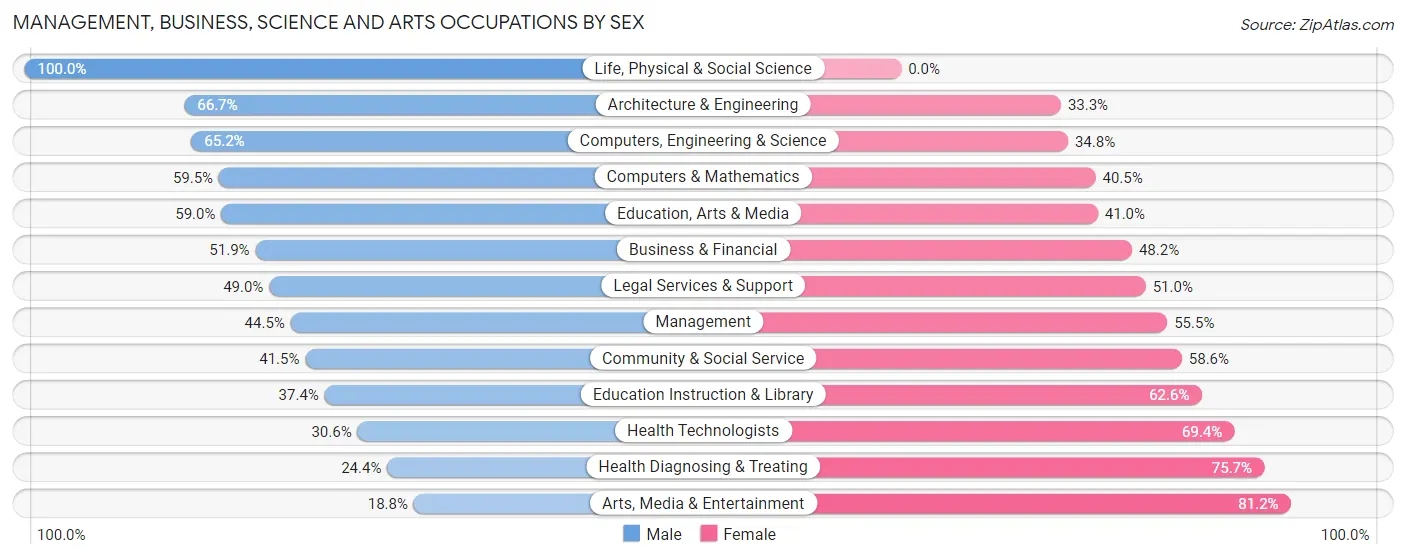
Management, Business, Science and Arts Occupations by Sex
Within the Management, Business, Science and Arts occupations in Old Jefferson, the most male-oriented occupations are Life, Physical & Social Science (100.0%), Architecture & Engineering (66.7%), and Computers, Engineering & Science (65.2%), while the most female-oriented occupations are Arts, Media & Entertainment (81.2%), Health Diagnosing & Treating (75.6%), and Health Technologists (69.4%).
| Occupation | Male | Female |
| Management | 275 (44.5%) | 343 (55.5%) |
| Business & Financial | 140 (51.8%) | 130 (48.1%) |
| Computers, Engineering & Science | 133 (65.2%) | 71 (34.8%) |
| Computers & Mathematics | 66 (59.5%) | 45 (40.5%) |
| Architecture & Engineering | 52 (66.7%) | 26 (33.3%) |
| Life, Physical & Social Science | 15 (100.0%) | 0 (0.0%) |
| Community & Social Service | 269 (41.4%) | 380 (58.6%) |
| Education, Arts & Media | 92 (59.0%) | 64 (41.0%) |
| Legal Services & Support | 48 (49.0%) | 50 (51.0%) |
| Education Instruction & Library | 110 (37.4%) | 184 (62.6%) |
| Arts, Media & Entertainment | 19 (18.8%) | 82 (81.2%) |
| Health Diagnosing & Treating | 56 (24.3%) | 174 (75.6%) |
| Health Technologists | 33 (30.6%) | 75 (69.4%) |
| Total (Category) | 873 (44.3%) | 1,098 (55.7%) |
| Total (Overall) | 2,385 (55.0%) | 1,952 (45.0%) |
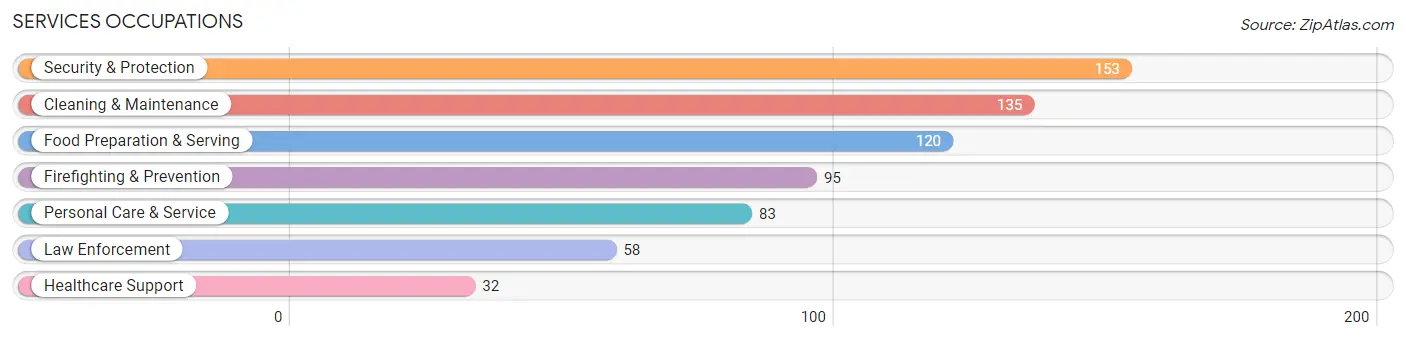
Services Occupations
The most common Services occupations in Old Jefferson are Security & Protection (153 | 3.5%), Cleaning & Maintenance (135 | 3.1%), Food Preparation & Serving (120 | 2.8%), Firefighting & Prevention (95 | 2.2%), and Personal Care & Service (83 | 1.9%).
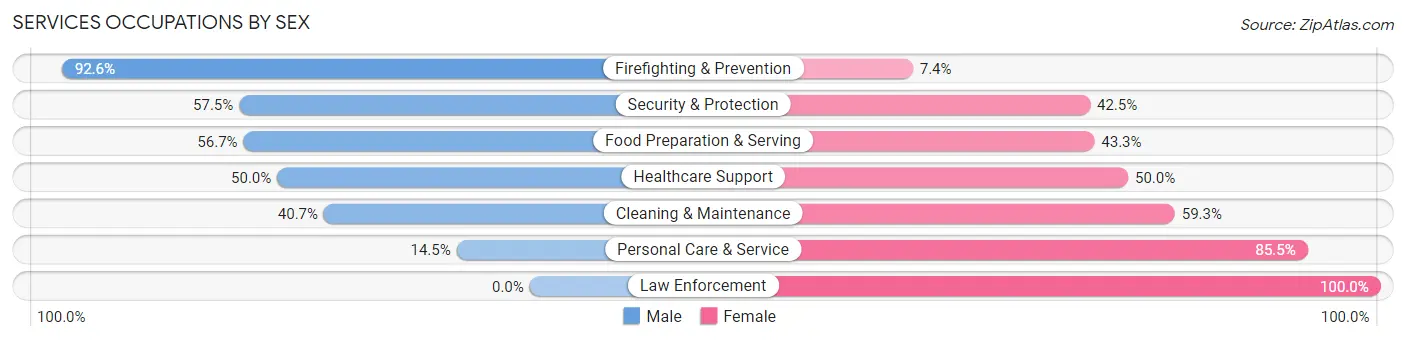
Services Occupations by Sex
Within the Services occupations in Old Jefferson, the most male-oriented occupations are Firefighting & Prevention (92.6%), Security & Protection (57.5%), and Food Preparation & Serving (56.7%), while the most female-oriented occupations are Law Enforcement (100.0%), Personal Care & Service (85.5%), and Cleaning & Maintenance (59.3%).
| Occupation | Male | Female |
| Healthcare Support | 16 (50.0%) | 16 (50.0%) |
| Security & Protection | 88 (57.5%) | 65 (42.5%) |
| Firefighting & Prevention | 88 (92.6%) | 7 (7.4%) |
| Law Enforcement | 0 (0.0%) | 58 (100.0%) |
| Food Preparation & Serving | 68 (56.7%) | 52 (43.3%) |
| Cleaning & Maintenance | 55 (40.7%) | 80 (59.3%) |
| Personal Care & Service | 12 (14.5%) | 71 (85.5%) |
| Total (Category) | 239 (45.7%) | 284 (54.3%) |
| Total (Overall) | 2,385 (55.0%) | 1,952 (45.0%) |
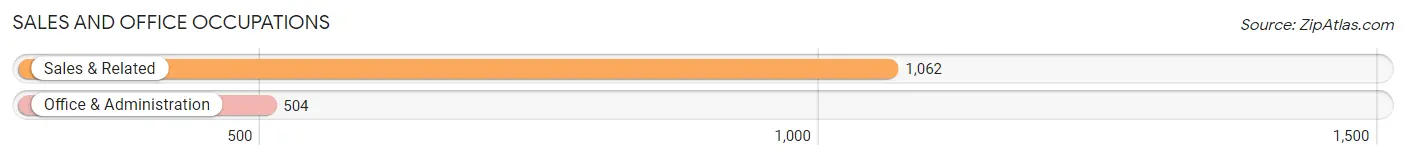
Sales and Office Occupations
The most common Sales and Office occupations in Old Jefferson are Sales & Related (1,062 | 24.5%), and Office & Administration (504 | 11.6%).
Sales and Office Occupations by Sex
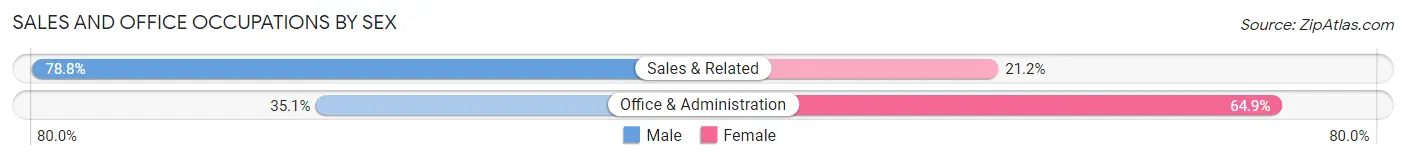
| Occupation | Male | Female |
| Sales & Related | 837 (78.8%) | 225 (21.2%) |
| Office & Administration | 177 (35.1%) | 327 (64.9%) |
| Total (Category) | 1,014 (64.7%) | 552 (35.2%) |
| Total (Overall) | 2,385 (55.0%) | 1,952 (45.0%) |
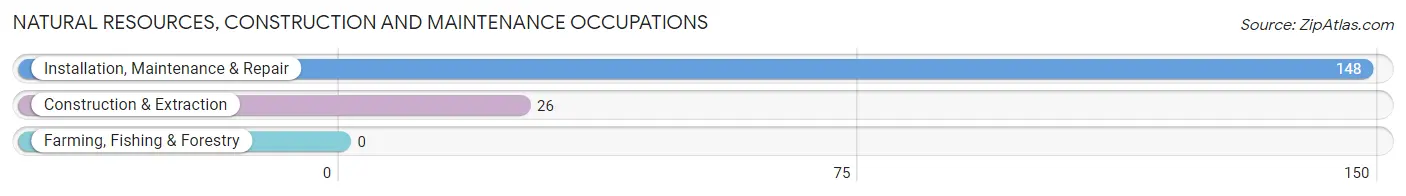
Natural Resources, Construction and Maintenance Occupations
The most common Natural Resources, Construction and Maintenance occupations in Old Jefferson are Installation, Maintenance & Repair (148 | 3.4%), and Construction & Extraction (26 | 0.6%).
Natural Resources, Construction and Maintenance Occupations by Sex
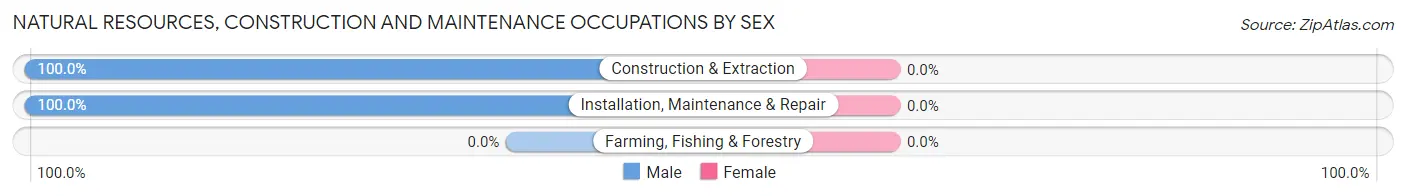
| Occupation | Male | Female |
| Farming, Fishing & Forestry | 0 (0.0%) | 0 (0.0%) |
| Construction & Extraction | 26 (100.0%) | 0 (0.0%) |
| Installation, Maintenance & Repair | 148 (100.0%) | 0 (0.0%) |
| Total (Category) | 174 (100.0%) | 0 (0.0%) |
| Total (Overall) | 2,385 (55.0%) | 1,952 (45.0%) |
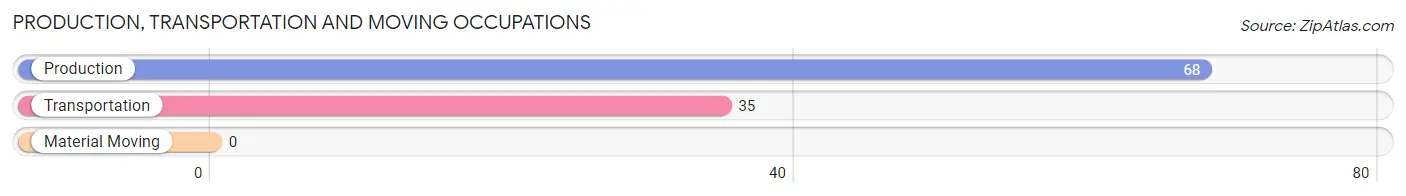
Production, Transportation and Moving Occupations
The most common Production, Transportation and Moving occupations in Old Jefferson are Production (68 | 1.6%), and Transportation (35 | 0.8%).
Production, Transportation and Moving Occupations by Sex
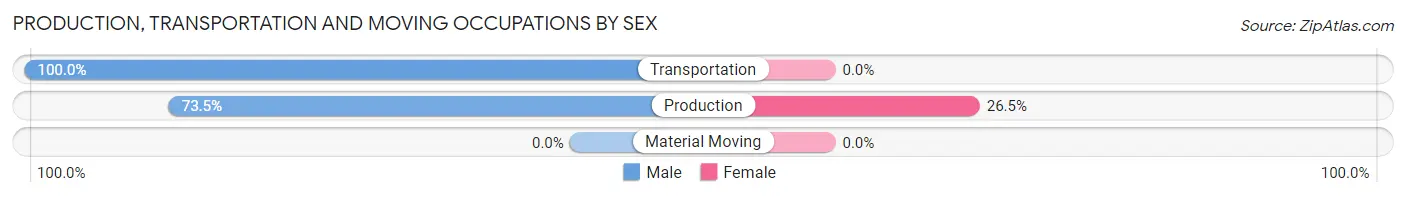
| Occupation | Male | Female |
| Production | 50 (73.5%) | 18 (26.5%) |
| Transportation | 35 (100.0%) | 0 (0.0%) |
| Material Moving | 0 (0.0%) | 0 (0.0%) |
| Total (Category) | 85 (82.5%) | 18 (17.5%) |
| Total (Overall) | 2,385 (55.0%) | 1,952 (45.0%) |
Employment Industries by Sex in Old Jefferson
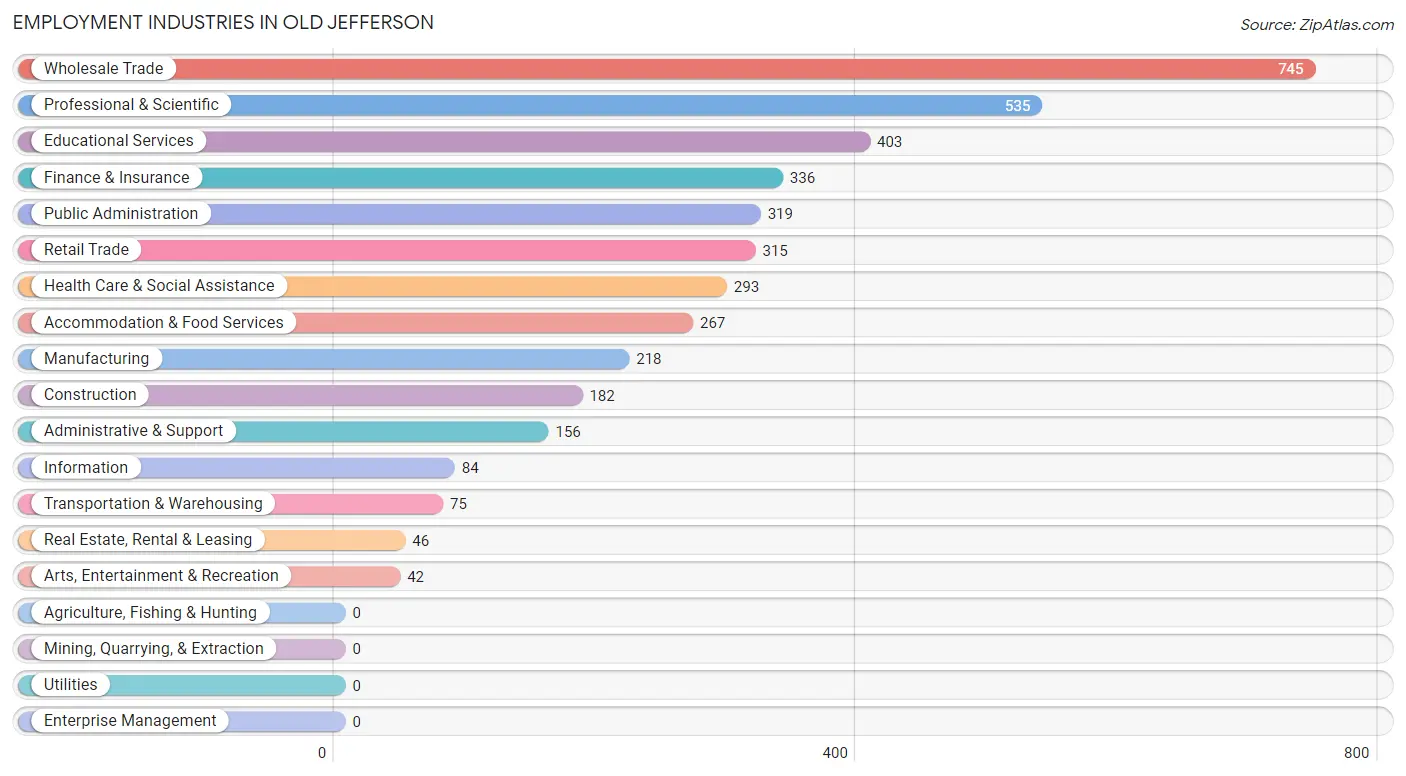
Employment Industries in Old Jefferson
The major employment industries in Old Jefferson include Wholesale Trade (745 | 17.2%), Professional & Scientific (535 | 12.3%), Educational Services (403 | 9.3%), Finance & Insurance (336 | 7.7%), and Public Administration (319 | 7.4%).
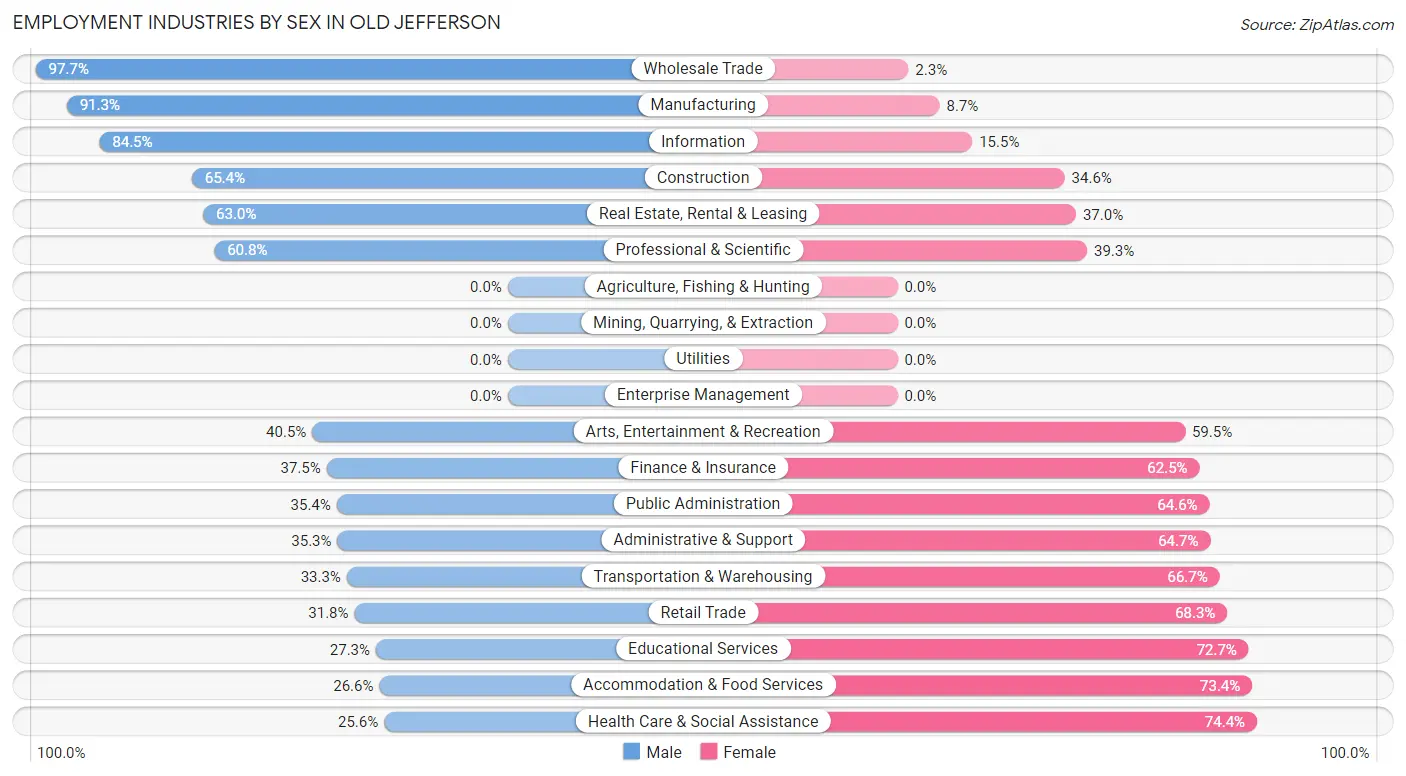
Employment Industries by Sex in Old Jefferson
The Old Jefferson industries that see more men than women are Wholesale Trade (97.7%), Manufacturing (91.3%), and Information (84.5%), whereas the industries that tend to have a higher number of women are Health Care & Social Assistance (74.4%), Accommodation & Food Services (73.4%), and Educational Services (72.7%).
| Industry | Male | Female |
| Agriculture, Fishing & Hunting | 0 (0.0%) | 0 (0.0%) |
| Mining, Quarrying, & Extraction | 0 (0.0%) | 0 (0.0%) |
| Construction | 119 (65.4%) | 63 (34.6%) |
| Manufacturing | 199 (91.3%) | 19 (8.7%) |
| Wholesale Trade | 728 (97.7%) | 17 (2.3%) |
| Retail Trade | 100 (31.8%) | 215 (68.2%) |
| Transportation & Warehousing | 25 (33.3%) | 50 (66.7%) |
| Utilities | 0 (0.0%) | 0 (0.0%) |
| Information | 71 (84.5%) | 13 (15.5%) |
| Finance & Insurance | 126 (37.5%) | 210 (62.5%) |
| Real Estate, Rental & Leasing | 29 (63.0%) | 17 (37.0%) |
| Professional & Scientific | 325 (60.8%) | 210 (39.3%) |
| Enterprise Management | 0 (0.0%) | 0 (0.0%) |
| Administrative & Support | 55 (35.3%) | 101 (64.7%) |
| Educational Services | 110 (27.3%) | 293 (72.7%) |
| Health Care & Social Assistance | 75 (25.6%) | 218 (74.4%) |
| Arts, Entertainment & Recreation | 17 (40.5%) | 25 (59.5%) |
| Accommodation & Food Services | 71 (26.6%) | 196 (73.4%) |
| Public Administration | 113 (35.4%) | 206 (64.6%) |
| Total | 2,385 (55.0%) | 1,952 (45.0%) |
Education in Old Jefferson
School Enrollment in Old Jefferson
The most common levels of schooling among the 2,015 students in Old Jefferson are college / undergraduate (486 | 24.1%), middle school (425 | 21.1%), and high school (390 | 19.4%).
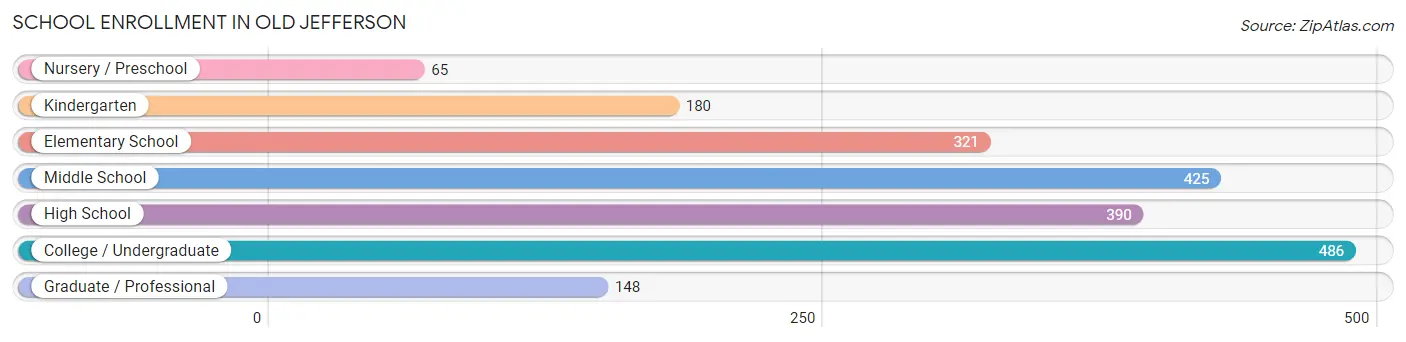
| School Level | # Students | % Students |
| Nursery / Preschool | 65 | 3.2% |
| Kindergarten | 180 | 8.9% |
| Elementary School | 321 | 15.9% |
| Middle School | 425 | 21.1% |
| High School | 390 | 19.4% |
| College / Undergraduate | 486 | 24.1% |
| Graduate / Professional | 148 | 7.3% |
| Total | 2,015 | 100.0% |
School Enrollment by Age by Funding Source in Old Jefferson
Out of a total of 2,015 students who are enrolled in schools in Old Jefferson, 556 (27.6%) attend a private institution, while the remaining 1,459 (72.4%) are enrolled in public schools. The age group of 35 years and over has the highest likelihood of being enrolled in private schools, with 23 (67.6% in the age bracket) enrolled. Conversely, the age group of 3 to 4 year olds has the lowest likelihood of being enrolled in a private school, with 23 (100.0% in the age bracket) attending a public institution.
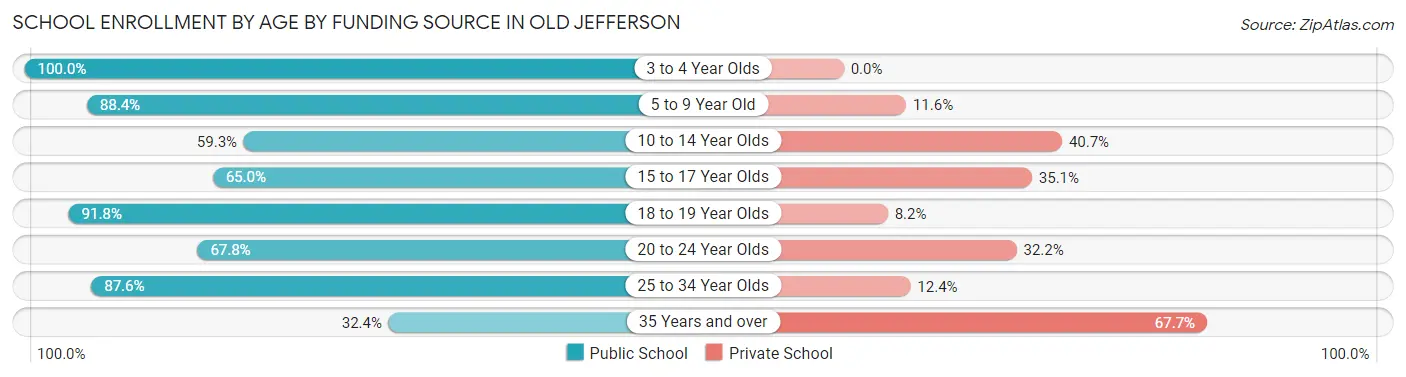
| Age Bracket | Public School | Private School |
| 3 to 4 Year Olds | 23 (100.0%) | 0 (0.0%) |
| 5 to 9 Year Old | 434 (88.4%) | 57 (11.6%) |
| 10 to 14 Year Olds | 289 (59.3%) | 198 (40.7%) |
| 15 to 17 Year Olds | 239 (64.9%) | 129 (35.0%) |
| 18 to 19 Year Olds | 56 (91.8%) | 5 (8.2%) |
| 20 to 24 Year Olds | 259 (67.8%) | 123 (32.2%) |
| 25 to 34 Year Olds | 148 (87.6%) | 21 (12.4%) |
| 35 Years and over | 11 (32.4%) | 23 (67.6%) |
| Total | 1,459 (72.4%) | 556 (27.6%) |
Educational Attainment by Field of Study in Old Jefferson
Science & technology (936 | 31.4%), business (678 | 22.7%), education (283 | 9.5%), arts & humanities (259 | 8.7%), and physical & health sciences (142 | 4.8%) are the most common fields of study among 2,982 individuals in Old Jefferson who have obtained a bachelor's degree or higher.
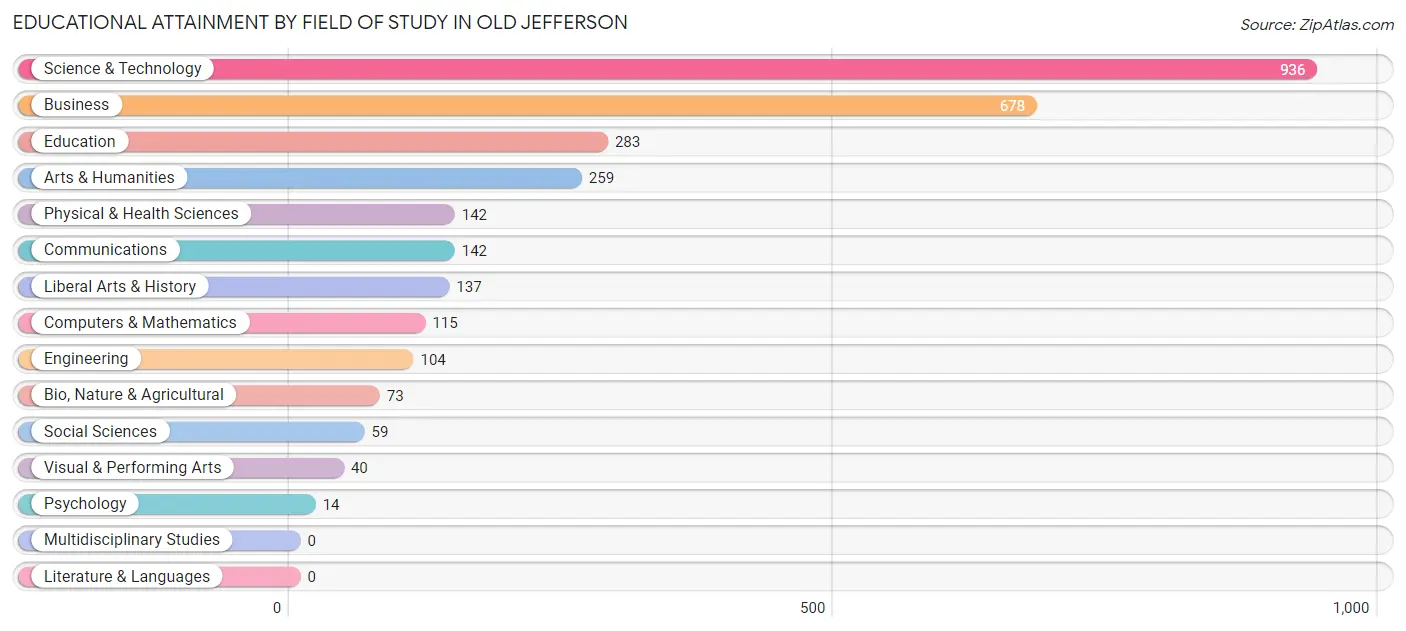
| Field of Study | # Graduates | % Graduates |
| Computers & Mathematics | 115 | 3.9% |
| Bio, Nature & Agricultural | 73 | 2.5% |
| Physical & Health Sciences | 142 | 4.8% |
| Psychology | 14 | 0.5% |
| Social Sciences | 59 | 2.0% |
| Engineering | 104 | 3.5% |
| Multidisciplinary Studies | 0 | 0.0% |
| Science & Technology | 936 | 31.4% |
| Business | 678 | 22.7% |
| Education | 283 | 9.5% |
| Literature & Languages | 0 | 0.0% |
| Liberal Arts & History | 137 | 4.6% |
| Visual & Performing Arts | 40 | 1.3% |
| Communications | 142 | 4.8% |
| Arts & Humanities | 259 | 8.7% |
| Total | 2,982 | 100.0% |
Transportation & Commute in Old Jefferson
Vehicle Availability by Sex in Old Jefferson
The most prevalent vehicle ownership categories in Old Jefferson are males with 2 vehicles (1,728, accounting for 72.1%) and females with 2 vehicles (620, making up 91.3%).
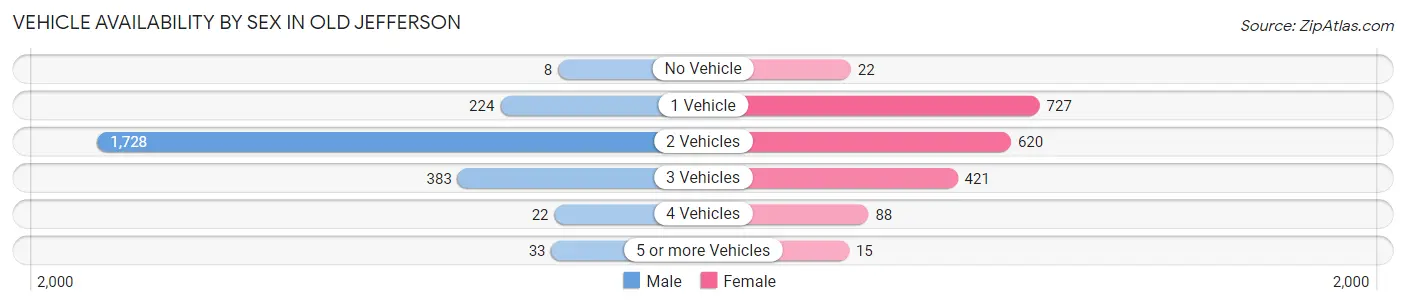
| Vehicles Available | Male | Female |
| No Vehicle | 8 (0.3%) | 22 (1.2%) |
| 1 Vehicle | 224 (9.3%) | 727 (38.4%) |
| 2 Vehicles | 1,728 (72.1%) | 620 (32.8%) |
| 3 Vehicles | 383 (16.0%) | 421 (22.2%) |
| 4 Vehicles | 22 (0.9%) | 88 (4.6%) |
| 5 or more Vehicles | 33 (1.4%) | 15 (0.8%) |
| Total | 2,398 (100.0%) | 1,893 (100.0%) |
Commute Time in Old Jefferson
The most frequently occuring commute durations in Old Jefferson are 5 to 9 minutes (1,030 commuters, 25.7%), 30 to 34 minutes (743 commuters, 18.5%), and 15 to 19 minutes (457 commuters, 11.4%).
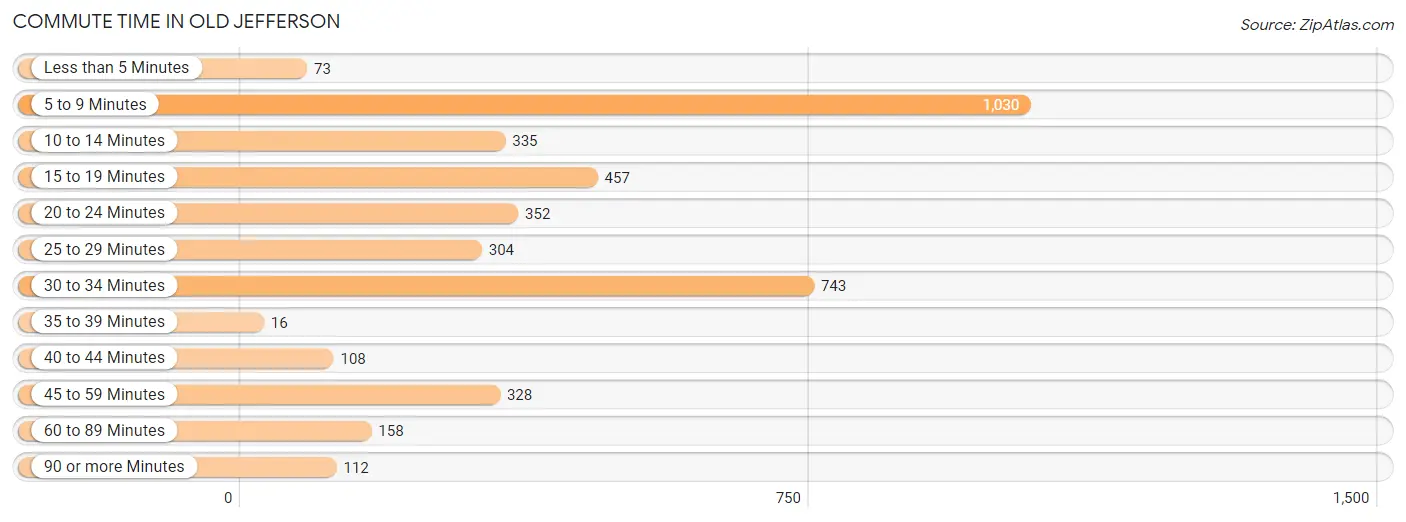
| Commute Time | # Commuters | % Commuters |
| Less than 5 Minutes | 73 | 1.8% |
| 5 to 9 Minutes | 1,030 | 25.7% |
| 10 to 14 Minutes | 335 | 8.3% |
| 15 to 19 Minutes | 457 | 11.4% |
| 20 to 24 Minutes | 352 | 8.8% |
| 25 to 29 Minutes | 304 | 7.6% |
| 30 to 34 Minutes | 743 | 18.5% |
| 35 to 39 Minutes | 16 | 0.4% |
| 40 to 44 Minutes | 108 | 2.7% |
| 45 to 59 Minutes | 328 | 8.2% |
| 60 to 89 Minutes | 158 | 3.9% |
| 90 or more Minutes | 112 | 2.8% |
Commute Time by Sex in Old Jefferson
The most common commute times in Old Jefferson are 5 to 9 minutes (964 commuters, 42.4%) for males and 30 to 34 minutes (402 commuters, 23.1%) for females.
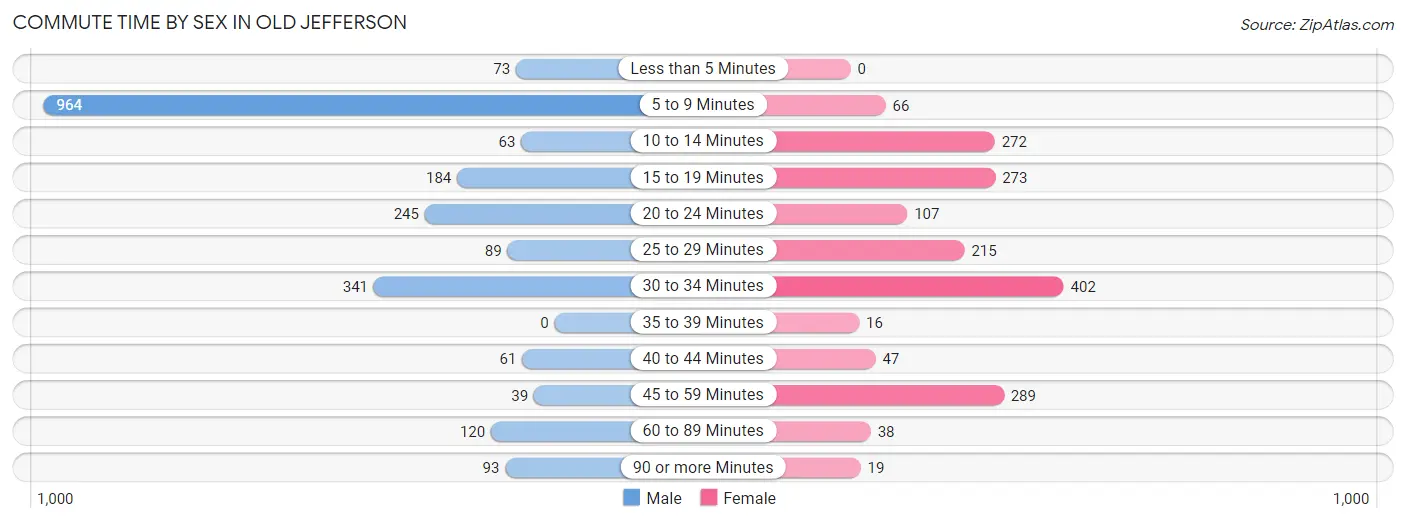
| Commute Time | Male | Female |
| Less than 5 Minutes | 73 (3.2%) | 0 (0.0%) |
| 5 to 9 Minutes | 964 (42.4%) | 66 (3.8%) |
| 10 to 14 Minutes | 63 (2.8%) | 272 (15.6%) |
| 15 to 19 Minutes | 184 (8.1%) | 273 (15.7%) |
| 20 to 24 Minutes | 245 (10.8%) | 107 (6.1%) |
| 25 to 29 Minutes | 89 (3.9%) | 215 (12.3%) |
| 30 to 34 Minutes | 341 (15.0%) | 402 (23.1%) |
| 35 to 39 Minutes | 0 (0.0%) | 16 (0.9%) |
| 40 to 44 Minutes | 61 (2.7%) | 47 (2.7%) |
| 45 to 59 Minutes | 39 (1.7%) | 289 (16.6%) |
| 60 to 89 Minutes | 120 (5.3%) | 38 (2.2%) |
| 90 or more Minutes | 93 (4.1%) | 19 (1.1%) |
Time of Departure to Work by Sex in Old Jefferson
The most frequent times of departure to work in Old Jefferson are 12:00 AM to 4:59 AM (785, 34.5%) for males and 7:00 AM to 7:29 AM (513, 29.4%) for females.
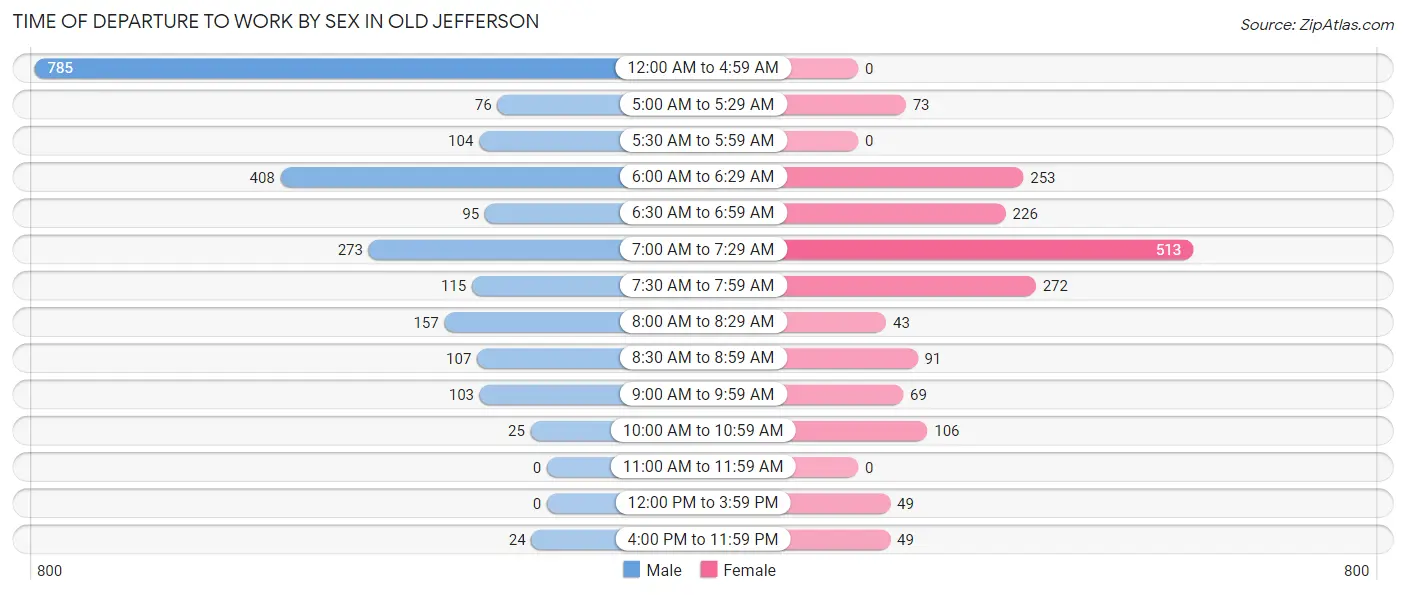
| Time of Departure | Male | Female |
| 12:00 AM to 4:59 AM | 785 (34.5%) | 0 (0.0%) |
| 5:00 AM to 5:29 AM | 76 (3.4%) | 73 (4.2%) |
| 5:30 AM to 5:59 AM | 104 (4.6%) | 0 (0.0%) |
| 6:00 AM to 6:29 AM | 408 (18.0%) | 253 (14.5%) |
| 6:30 AM to 6:59 AM | 95 (4.2%) | 226 (13.0%) |
| 7:00 AM to 7:29 AM | 273 (12.0%) | 513 (29.4%) |
| 7:30 AM to 7:59 AM | 115 (5.1%) | 272 (15.6%) |
| 8:00 AM to 8:29 AM | 157 (6.9%) | 43 (2.5%) |
| 8:30 AM to 8:59 AM | 107 (4.7%) | 91 (5.2%) |
| 9:00 AM to 9:59 AM | 103 (4.5%) | 69 (4.0%) |
| 10:00 AM to 10:59 AM | 25 (1.1%) | 106 (6.1%) |
| 11:00 AM to 11:59 AM | 0 (0.0%) | 0 (0.0%) |
| 12:00 PM to 3:59 PM | 0 (0.0%) | 49 (2.8%) |
| 4:00 PM to 11:59 PM | 24 (1.1%) | 49 (2.8%) |
| Total | 2,272 (100.0%) | 1,744 (100.0%) |
Housing Occupancy in Old Jefferson
Occupancy by Ownership in Old Jefferson
Of the total 3,695 dwellings in Old Jefferson, owner-occupied units account for 2,777 (75.2%), while renter-occupied units make up 918 (24.8%).
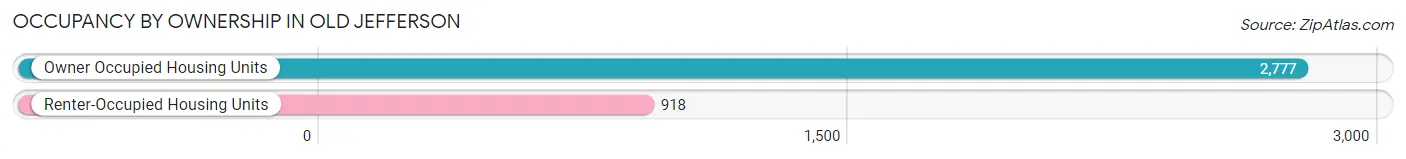
| Occupancy | # Housing Units | % Housing Units |
| Owner Occupied Housing Units | 2,777 | 75.2% |
| Renter-Occupied Housing Units | 918 | 24.8% |
| Total Occupied Housing Units | 3,695 | 100.0% |
Occupancy by Household Size in Old Jefferson
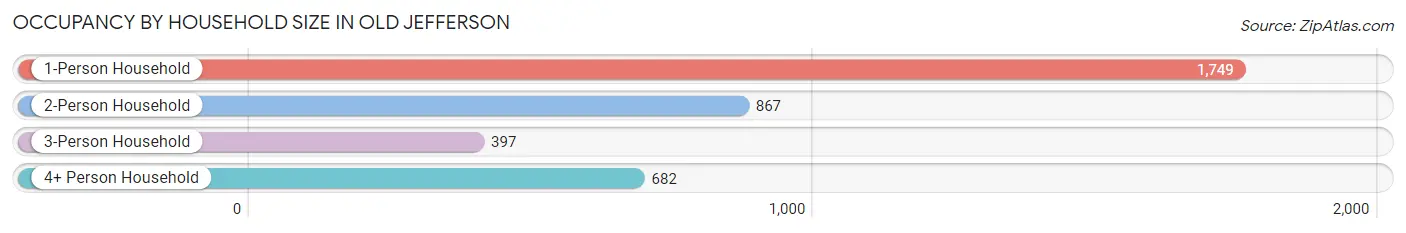
| Household Size | # Housing Units | % Housing Units |
| 1-Person Household | 1,749 | 47.3% |
| 2-Person Household | 867 | 23.5% |
| 3-Person Household | 397 | 10.7% |
| 4+ Person Household | 682 | 18.5% |
| Total Housing Units | 3,695 | 100.0% |
Occupancy by Ownership by Household Size in Old Jefferson
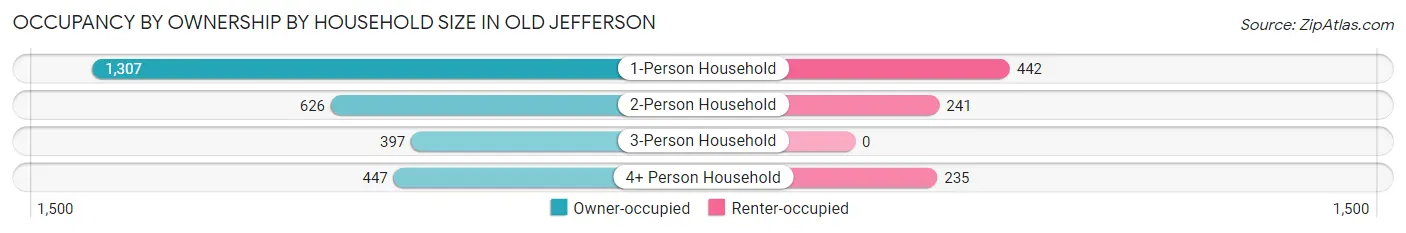
| Household Size | Owner-occupied | Renter-occupied |
| 1-Person Household | 1,307 (74.7%) | 442 (25.3%) |
| 2-Person Household | 626 (72.2%) | 241 (27.8%) |
| 3-Person Household | 397 (100.0%) | 0 (0.0%) |
| 4+ Person Household | 447 (65.5%) | 235 (34.5%) |
| Total Housing Units | 2,777 (75.2%) | 918 (24.8%) |
Occupancy by Educational Attainment in Old Jefferson
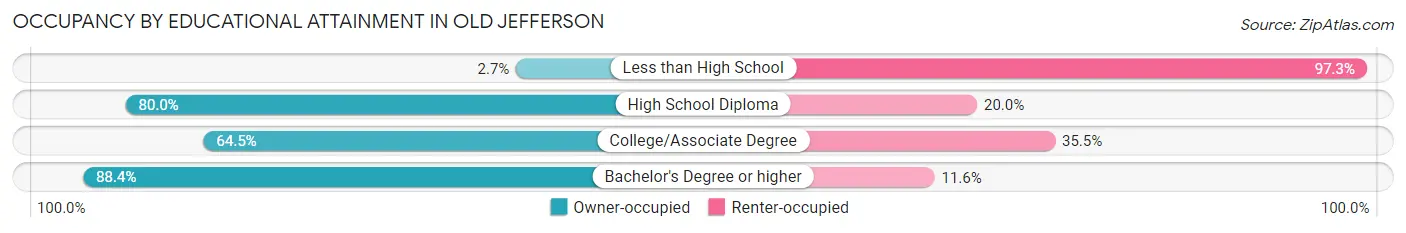
| Household Size | Owner-occupied | Renter-occupied |
| Less than High School | 8 (2.7%) | 285 (97.3%) |
| High School Diploma | 384 (80.0%) | 96 (20.0%) |
| College/Associate Degree | 537 (64.5%) | 295 (35.5%) |
| Bachelor's Degree or higher | 1,848 (88.4%) | 242 (11.6%) |
Occupancy by Age of Householder in Old Jefferson
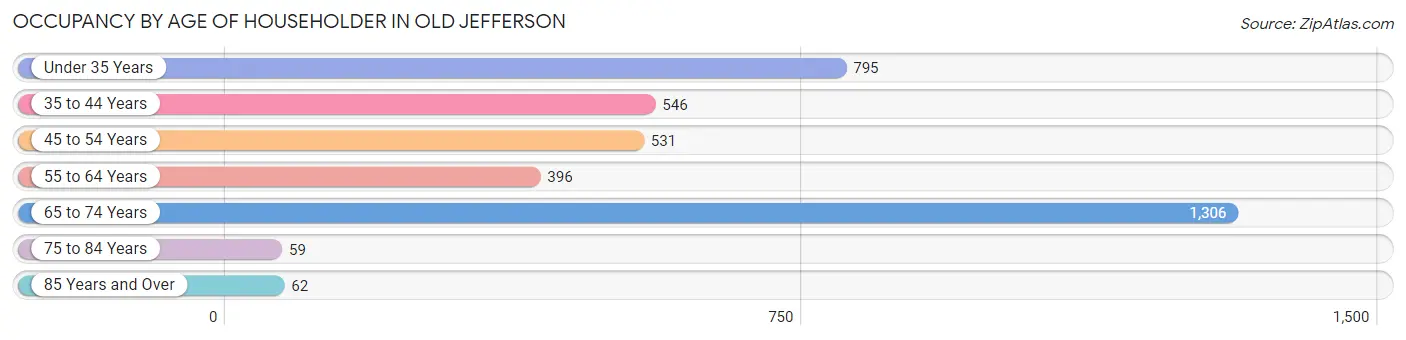
| Age Bracket | # Households | % Households |
| Under 35 Years | 795 | 21.5% |
| 35 to 44 Years | 546 | 14.8% |
| 45 to 54 Years | 531 | 14.4% |
| 55 to 64 Years | 396 | 10.7% |
| 65 to 74 Years | 1,306 | 35.3% |
| 75 to 84 Years | 59 | 1.6% |
| 85 Years and Over | 62 | 1.7% |
| Total | 3,695 | 100.0% |
Housing Finances in Old Jefferson
Median Income by Occupancy in Old Jefferson
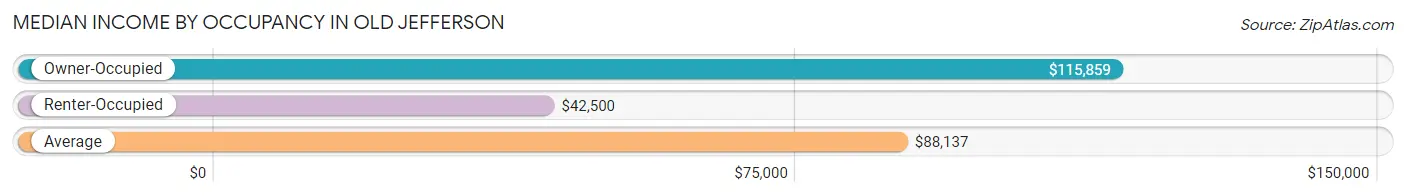
| Occupancy Type | # Households | Median Income |
| Owner-Occupied | 2,777 (75.2%) | $115,859 |
| Renter-Occupied | 918 (24.8%) | $42,500 |
| Average | 3,695 (100.0%) | $88,137 |
Occupancy by Householder Income Bracket in Old Jefferson
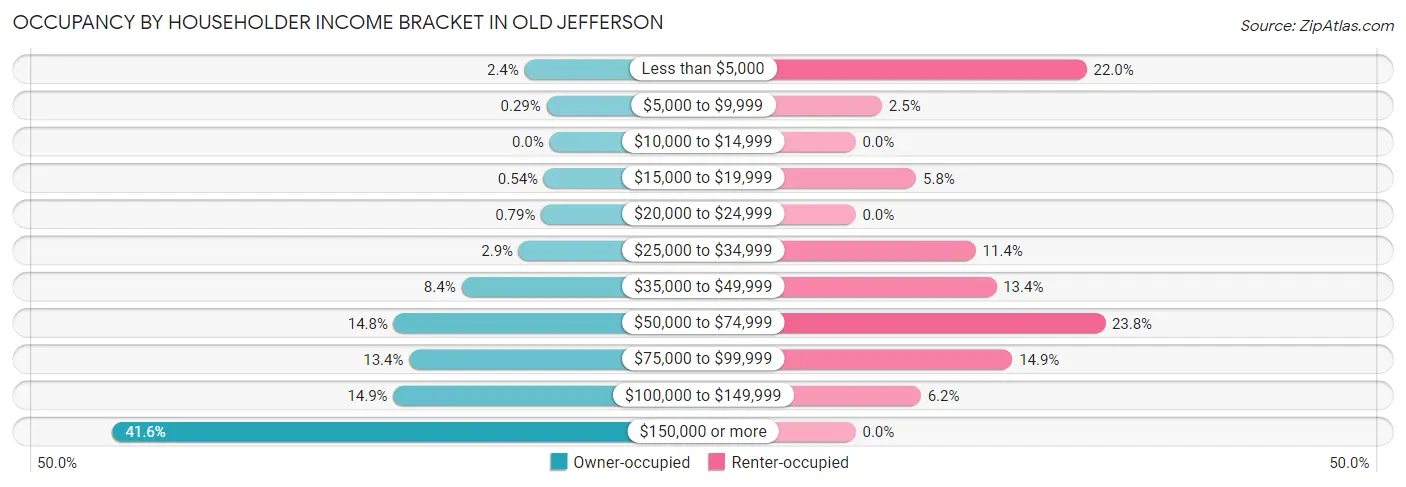
| Income Bracket | Owner-occupied | Renter-occupied |
| Less than $5,000 | 66 (2.4%) | 202 (22.0%) |
| $5,000 to $9,999 | 8 (0.3%) | 23 (2.5%) |
| $10,000 to $14,999 | 0 (0.0%) | 0 (0.0%) |
| $15,000 to $19,999 | 15 (0.5%) | 53 (5.8%) |
| $20,000 to $24,999 | 22 (0.8%) | 0 (0.0%) |
| $25,000 to $34,999 | 81 (2.9%) | 105 (11.4%) |
| $35,000 to $49,999 | 233 (8.4%) | 123 (13.4%) |
| $50,000 to $74,999 | 412 (14.8%) | 218 (23.7%) |
| $75,000 to $99,999 | 371 (13.4%) | 137 (14.9%) |
| $100,000 to $149,999 | 413 (14.9%) | 57 (6.2%) |
| $150,000 or more | 1,156 (41.6%) | 0 (0.0%) |
| Total | 2,777 (100.0%) | 918 (100.0%) |
Monthly Housing Cost Tiers in Old Jefferson
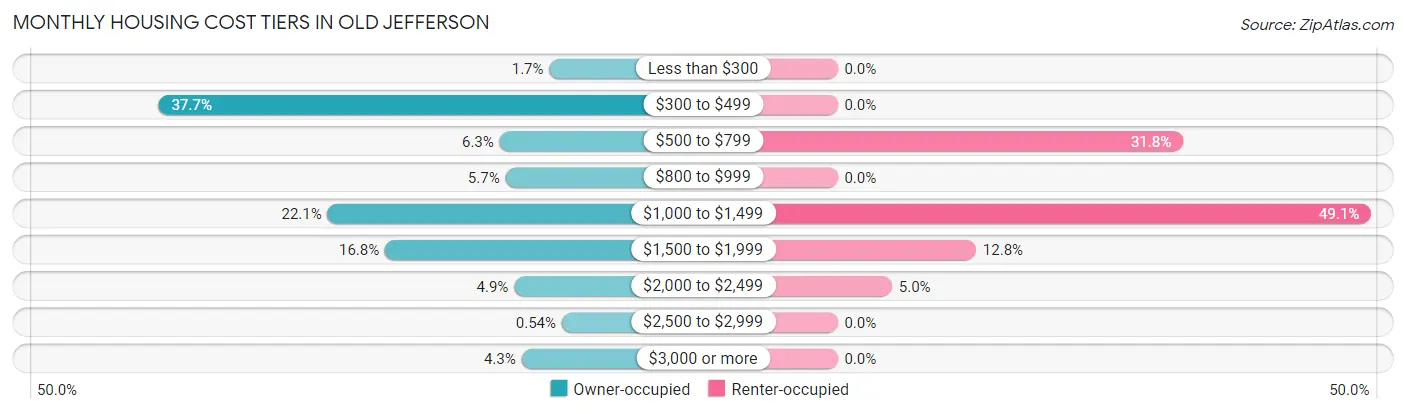
| Monthly Cost | Owner-occupied | Renter-occupied |
| Less than $300 | 47 (1.7%) | 0 (0.0%) |
| $300 to $499 | 1,046 (37.7%) | 0 (0.0%) |
| $500 to $799 | 174 (6.3%) | 292 (31.8%) |
| $800 to $999 | 159 (5.7%) | 0 (0.0%) |
| $1,000 to $1,499 | 614 (22.1%) | 451 (49.1%) |
| $1,500 to $1,999 | 467 (16.8%) | 117 (12.8%) |
| $2,000 to $2,499 | 137 (4.9%) | 46 (5.0%) |
| $2,500 to $2,999 | 15 (0.5%) | 0 (0.0%) |
| $3,000 or more | 118 (4.3%) | 0 (0.0%) |
| Total | 2,777 (100.0%) | 918 (100.0%) |
Physical Housing Characteristics in Old Jefferson
Housing Structures in Old Jefferson
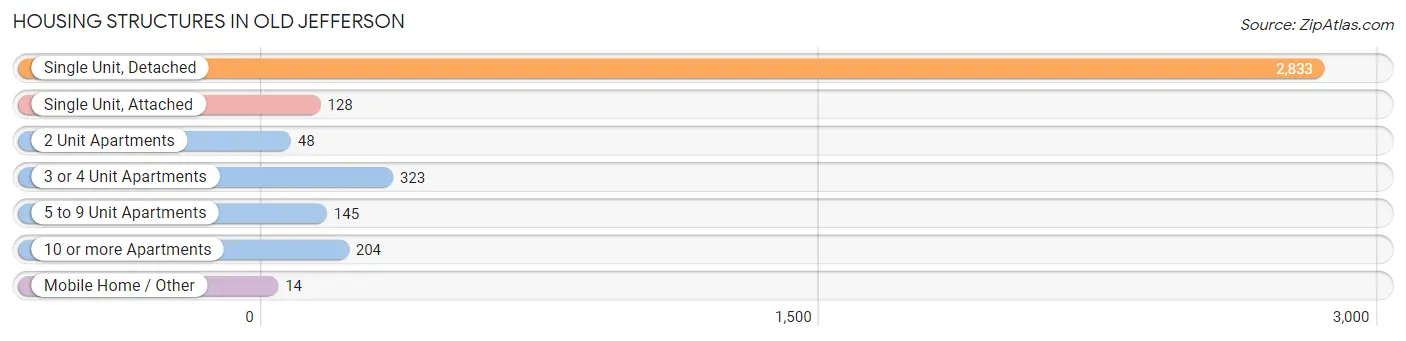
| Structure Type | # Housing Units | % Housing Units |
| Single Unit, Detached | 2,833 | 76.7% |
| Single Unit, Attached | 128 | 3.5% |
| 2 Unit Apartments | 48 | 1.3% |
| 3 or 4 Unit Apartments | 323 | 8.7% |
| 5 to 9 Unit Apartments | 145 | 3.9% |
| 10 or more Apartments | 204 | 5.5% |
| Mobile Home / Other | 14 | 0.4% |
| Total | 3,695 | 100.0% |
Housing Structures by Occupancy in Old Jefferson
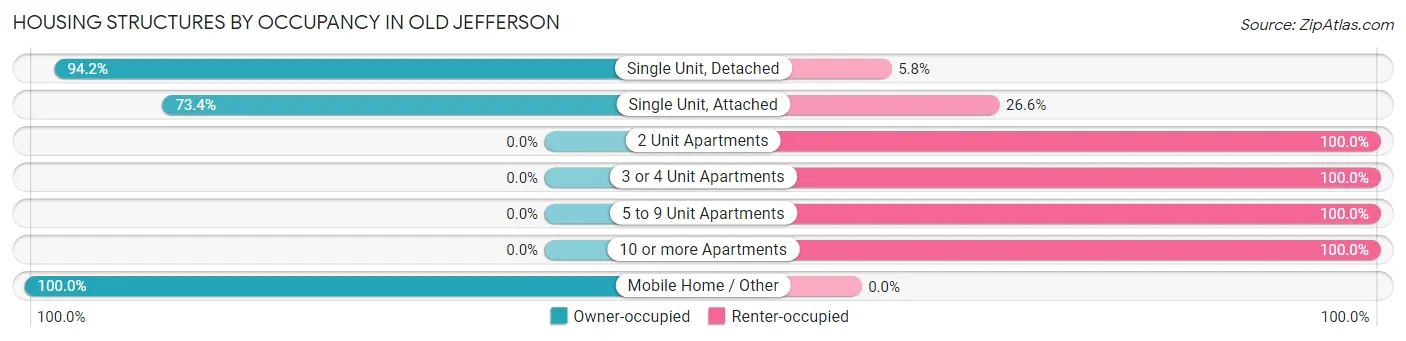
| Structure Type | Owner-occupied | Renter-occupied |
| Single Unit, Detached | 2,669 (94.2%) | 164 (5.8%) |
| Single Unit, Attached | 94 (73.4%) | 34 (26.6%) |
| 2 Unit Apartments | 0 (0.0%) | 48 (100.0%) |
| 3 or 4 Unit Apartments | 0 (0.0%) | 323 (100.0%) |
| 5 to 9 Unit Apartments | 0 (0.0%) | 145 (100.0%) |
| 10 or more Apartments | 0 (0.0%) | 204 (100.0%) |
| Mobile Home / Other | 14 (100.0%) | 0 (0.0%) |
| Total | 2,777 (75.2%) | 918 (24.8%) |
Housing Structures by Number of Rooms in Old Jefferson
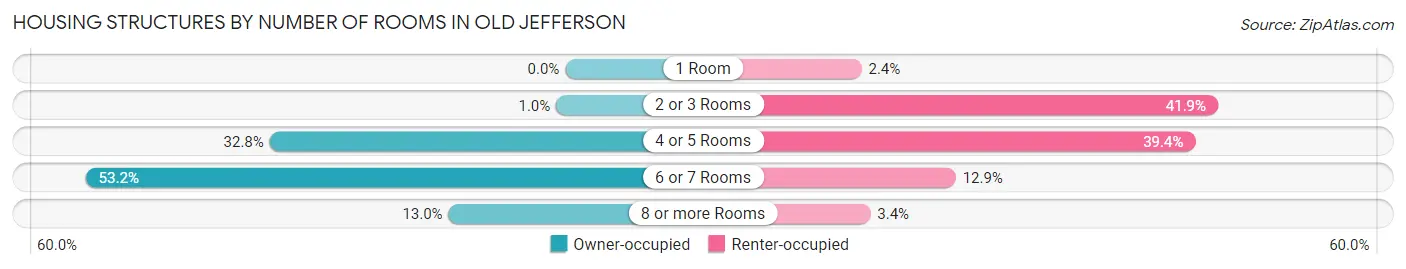
| Number of Rooms | Owner-occupied | Renter-occupied |
| 1 Room | 0 (0.0%) | 22 (2.4%) |
| 2 or 3 Rooms | 28 (1.0%) | 385 (41.9%) |
| 4 or 5 Rooms | 911 (32.8%) | 362 (39.4%) |
| 6 or 7 Rooms | 1,478 (53.2%) | 118 (12.9%) |
| 8 or more Rooms | 360 (13.0%) | 31 (3.4%) |
| Total | 2,777 (100.0%) | 918 (100.0%) |
Housing Structure by Heating Type in Old Jefferson
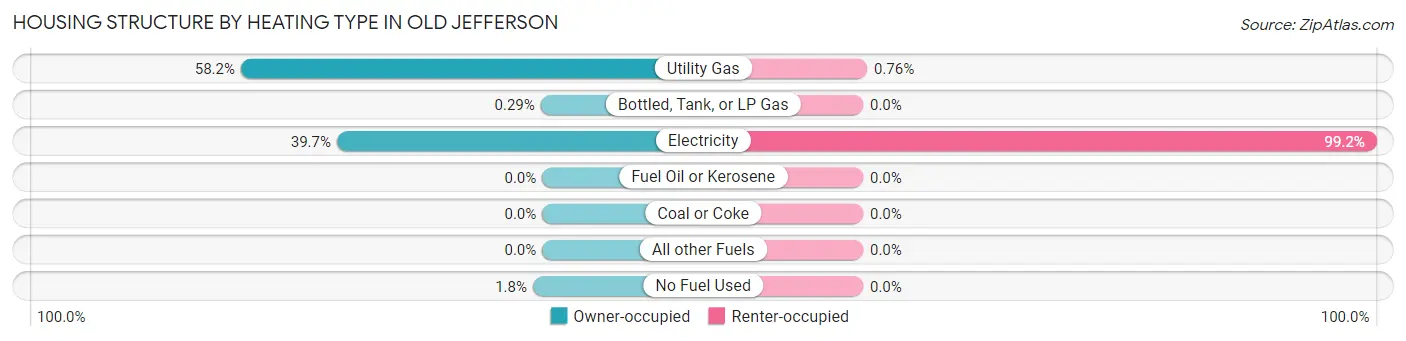
| Heating Type | Owner-occupied | Renter-occupied |
| Utility Gas | 1,617 (58.2%) | 7 (0.8%) |
| Bottled, Tank, or LP Gas | 8 (0.3%) | 0 (0.0%) |
| Electricity | 1,102 (39.7%) | 911 (99.2%) |
| Fuel Oil or Kerosene | 0 (0.0%) | 0 (0.0%) |
| Coal or Coke | 0 (0.0%) | 0 (0.0%) |
| All other Fuels | 0 (0.0%) | 0 (0.0%) |
| No Fuel Used | 50 (1.8%) | 0 (0.0%) |
| Total | 2,777 (100.0%) | 918 (100.0%) |
Household Vehicle Usage in Old Jefferson
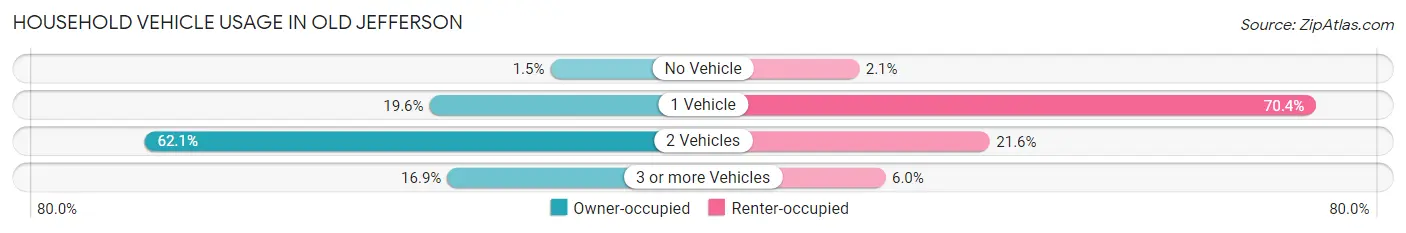
| Vehicles per Household | Owner-occupied | Renter-occupied |
| No Vehicle | 41 (1.5%) | 19 (2.1%) |
| 1 Vehicle | 543 (19.6%) | 646 (70.4%) |
| 2 Vehicles | 1,724 (62.1%) | 198 (21.6%) |
| 3 or more Vehicles | 469 (16.9%) | 55 (6.0%) |
| Total | 2,777 (100.0%) | 918 (100.0%) |
Real Estate & Mortgages in Old Jefferson
Real Estate and Mortgage Overview in Old Jefferson
| Characteristic | Without Mortgage | With Mortgage |
| Housing Units | 1,359 | 1,418 |
| Median Property Value | $191,100 | $253,700 |
| Median Household Income | $245,405 | $341 |
| Monthly Housing Costs | $454 | $118 |
| Real Estate Taxes | $1,231 | $44 |
Property Value by Mortgage Status in Old Jefferson
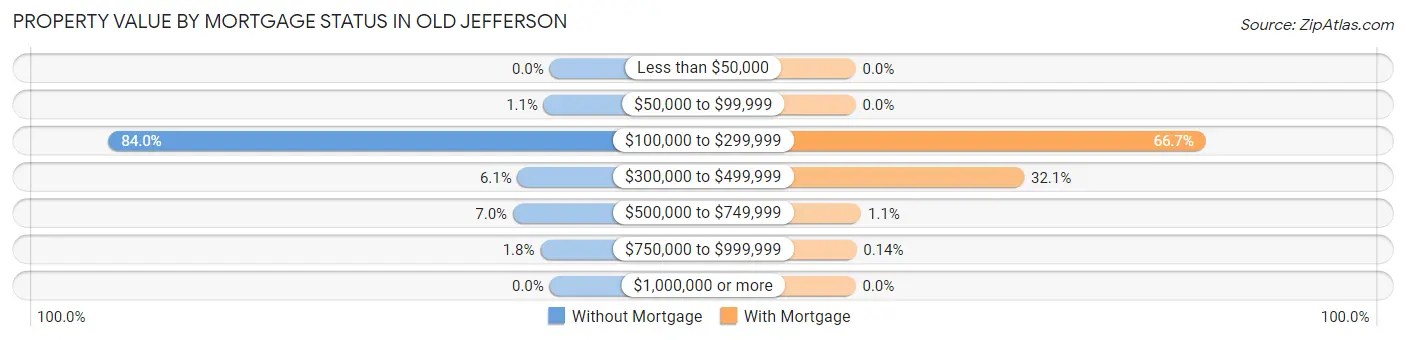
| Property Value | Without Mortgage | With Mortgage |
| Less than $50,000 | 0 (0.0%) | 0 (0.0%) |
| $50,000 to $99,999 | 15 (1.1%) | 0 (0.0%) |
| $100,000 to $299,999 | 1,142 (84.0%) | 946 (66.7%) |
| $300,000 to $499,999 | 83 (6.1%) | 455 (32.1%) |
| $500,000 to $749,999 | 95 (7.0%) | 15 (1.1%) |
| $750,000 to $999,999 | 24 (1.8%) | 2 (0.1%) |
| $1,000,000 or more | 0 (0.0%) | 0 (0.0%) |
| Total | 1,359 (100.0%) | 1,418 (100.0%) |
Household Income by Mortgage Status in Old Jefferson
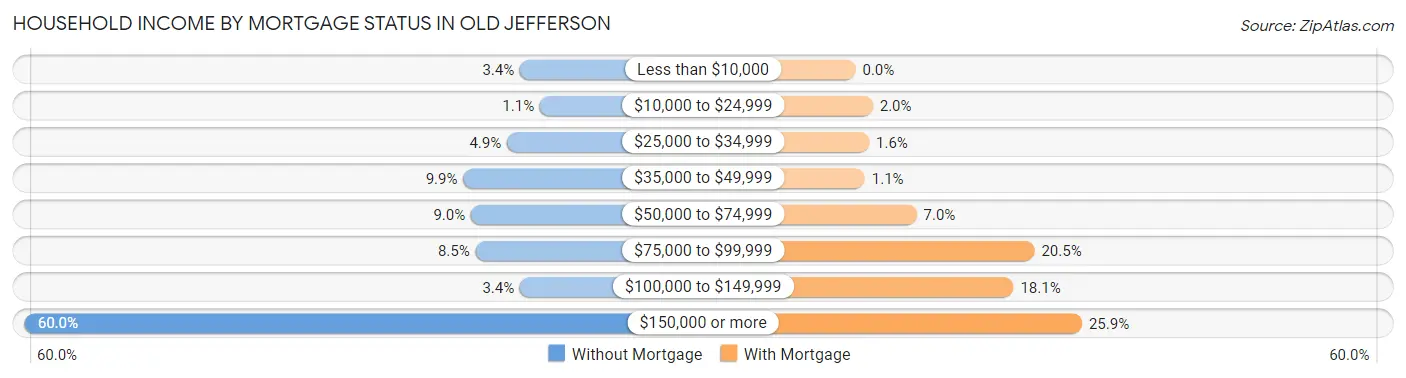
| Household Income | Without Mortgage | With Mortgage |
| Less than $10,000 | 46 (3.4%) | 0 (0.0%) |
| $10,000 to $24,999 | 15 (1.1%) | 28 (2.0%) |
| $25,000 to $34,999 | 66 (4.9%) | 22 (1.5%) |
| $35,000 to $49,999 | 134 (9.9%) | 15 (1.1%) |
| $50,000 to $74,999 | 122 (9.0%) | 99 (7.0%) |
| $75,000 to $99,999 | 115 (8.5%) | 290 (20.4%) |
| $100,000 to $149,999 | 46 (3.4%) | 256 (18.0%) |
| $150,000 or more | 815 (60.0%) | 367 (25.9%) |
| Total | 1,359 (100.0%) | 1,418 (100.0%) |
Property Value to Household Income Ratio in Old Jefferson
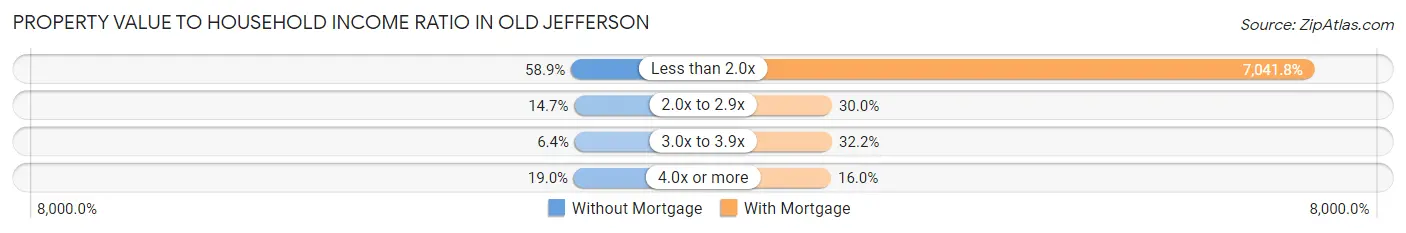
| Value-to-Income Ratio | Without Mortgage | With Mortgage |
| Less than 2.0x | 800 (58.9%) | 99,853 (7,041.8%) |
| 2.0x to 2.9x | 200 (14.7%) | 425 (30.0%) |
| 3.0x to 3.9x | 87 (6.4%) | 457 (32.2%) |
| 4.0x or more | 258 (19.0%) | 227 (16.0%) |
| Total | 1,359 (100.0%) | 1,418 (100.0%) |
Real Estate Taxes by Mortgage Status in Old Jefferson
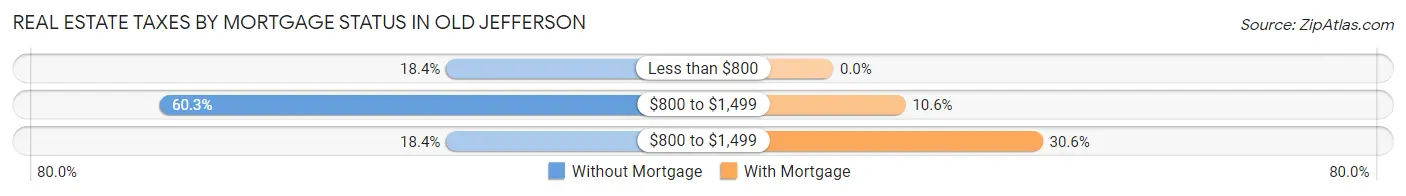
| Property Taxes | Without Mortgage | With Mortgage |
| Less than $800 | 250 (18.4%) | 0 (0.0%) |
| $800 to $1,499 | 820 (60.3%) | 150 (10.6%) |
| $800 to $1,499 | 250 (18.4%) | 434 (30.6%) |
| Total | 1,359 (100.0%) | 1,418 (100.0%) |
Health & Disability in Old Jefferson
Health Insurance Coverage by Age in Old Jefferson
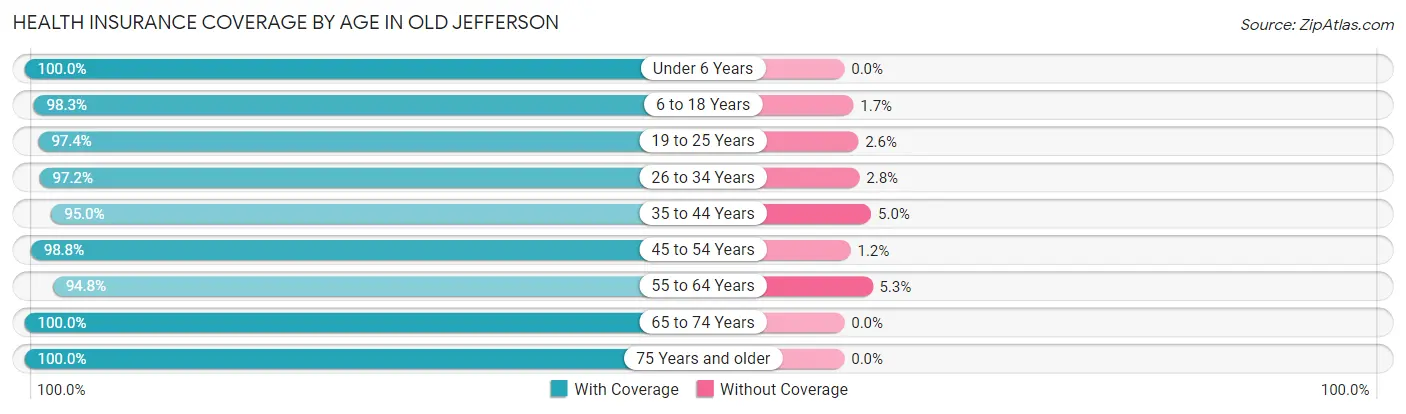
| Age Bracket | With Coverage | Without Coverage |
| Under 6 Years | 655 (100.0%) | 0 (0.0%) |
| 6 to 18 Years | 1,218 (98.3%) | 21 (1.7%) |
| 19 to 25 Years | 753 (97.4%) | 20 (2.6%) |
| 26 to 34 Years | 1,212 (97.2%) | 35 (2.8%) |
| 35 to 44 Years | 800 (95.0%) | 42 (5.0%) |
| 45 to 54 Years | 940 (98.8%) | 11 (1.2%) |
| 55 to 64 Years | 614 (94.8%) | 34 (5.2%) |
| 65 to 74 Years | 1,555 (100.0%) | 0 (0.0%) |
| 75 Years and older | 228 (100.0%) | 0 (0.0%) |
| Total | 7,975 (98.0%) | 163 (2.0%) |
Health Insurance Coverage by Citizenship Status in Old Jefferson
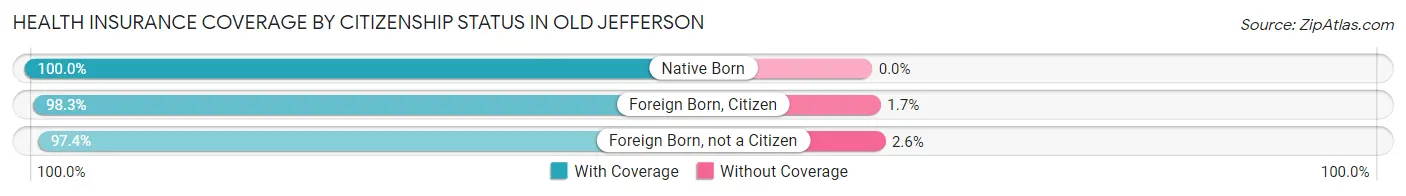
| Citizenship Status | With Coverage | Without Coverage |
| Native Born | 655 (100.0%) | 0 (0.0%) |
| Foreign Born, Citizen | 1,218 (98.3%) | 21 (1.7%) |
| Foreign Born, not a Citizen | 753 (97.4%) | 20 (2.6%) |
Health Insurance Coverage by Household Income in Old Jefferson
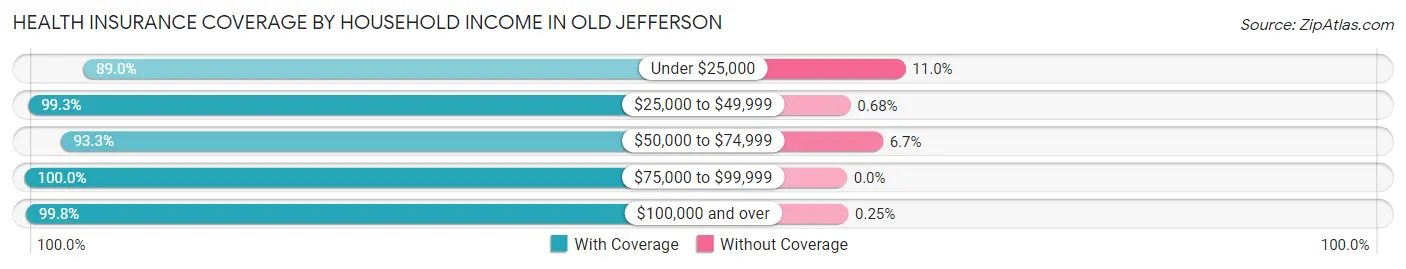
| Household Income | With Coverage | Without Coverage |
| Under $25,000 | 446 (89.0%) | 55 (11.0%) |
| $25,000 to $49,999 | 1,027 (99.3%) | 7 (0.7%) |
| $50,000 to $74,999 | 1,261 (93.3%) | 91 (6.7%) |
| $75,000 to $99,999 | 1,277 (100.0%) | 0 (0.0%) |
| $100,000 and over | 3,955 (99.8%) | 10 (0.3%) |
Public vs Private Health Insurance Coverage by Age in Old Jefferson
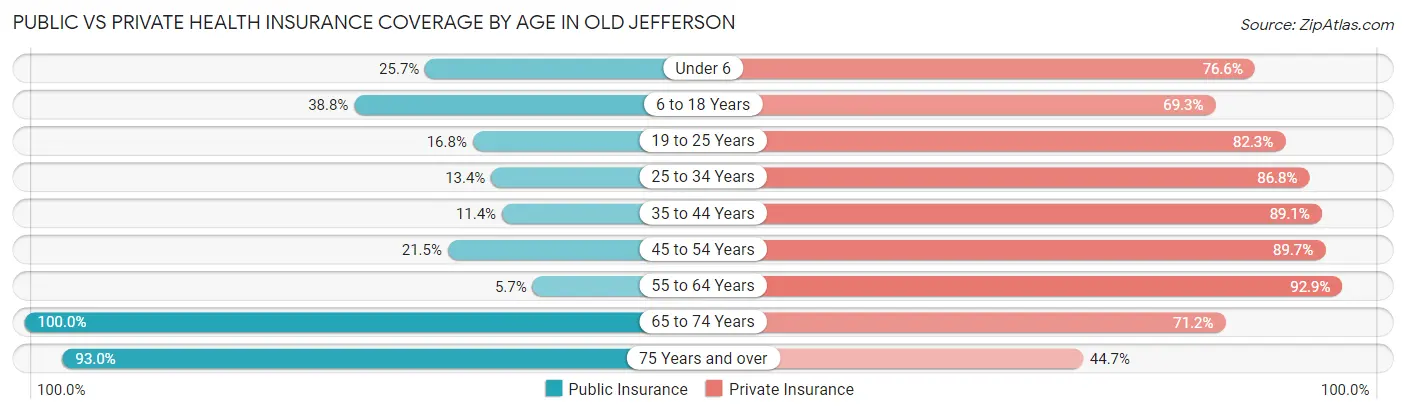
| Age Bracket | Public Insurance | Private Insurance |
| Under 6 | 168 (25.7%) | 502 (76.6%) |
| 6 to 18 Years | 481 (38.8%) | 859 (69.3%) |
| 19 to 25 Years | 130 (16.8%) | 636 (82.3%) |
| 25 to 34 Years | 167 (13.4%) | 1,082 (86.8%) |
| 35 to 44 Years | 96 (11.4%) | 750 (89.1%) |
| 45 to 54 Years | 204 (21.4%) | 853 (89.7%) |
| 55 to 64 Years | 37 (5.7%) | 602 (92.9%) |
| 65 to 74 Years | 1,555 (100.0%) | 1,107 (71.2%) |
| 75 Years and over | 212 (93.0%) | 102 (44.7%) |
| Total | 3,050 (37.5%) | 6,493 (79.8%) |
Disability Status by Sex by Age in Old Jefferson
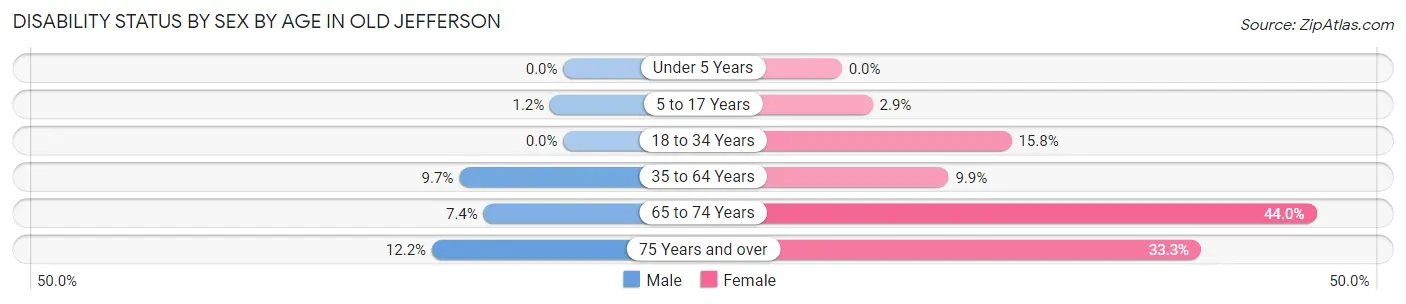
| Age Bracket | Male | Female |
| Under 5 Years | 0 (0.0%) | 0 (0.0%) |
| 5 to 17 Years | 9 (1.2%) | 18 (2.9%) |
| 18 to 34 Years | 0 (0.0%) | 180 (15.8%) |
| 35 to 64 Years | 114 (9.7%) | 125 (9.9%) |
| 65 to 74 Years | 71 (7.4%) | 262 (44.0%) |
| 75 Years and over | 15 (12.2%) | 35 (33.3%) |
Disability Class by Sex by Age in Old Jefferson
Disability Class: Hearing Difficulty
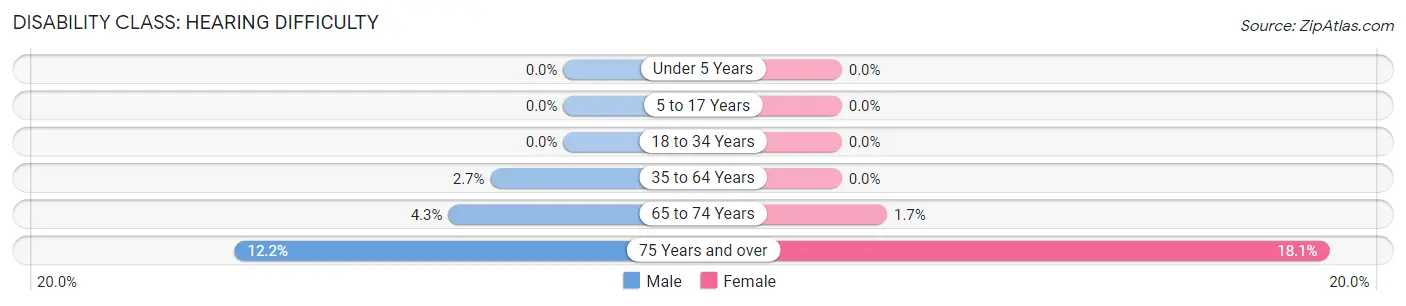
| Age Bracket | Male | Female |
| Under 5 Years | 0 (0.0%) | 0 (0.0%) |
| 5 to 17 Years | 0 (0.0%) | 0 (0.0%) |
| 18 to 34 Years | 0 (0.0%) | 0 (0.0%) |
| 35 to 64 Years | 32 (2.7%) | 0 (0.0%) |
| 65 to 74 Years | 41 (4.3%) | 10 (1.7%) |
| 75 Years and over | 15 (12.2%) | 19 (18.1%) |
Disability Class: Vision Difficulty
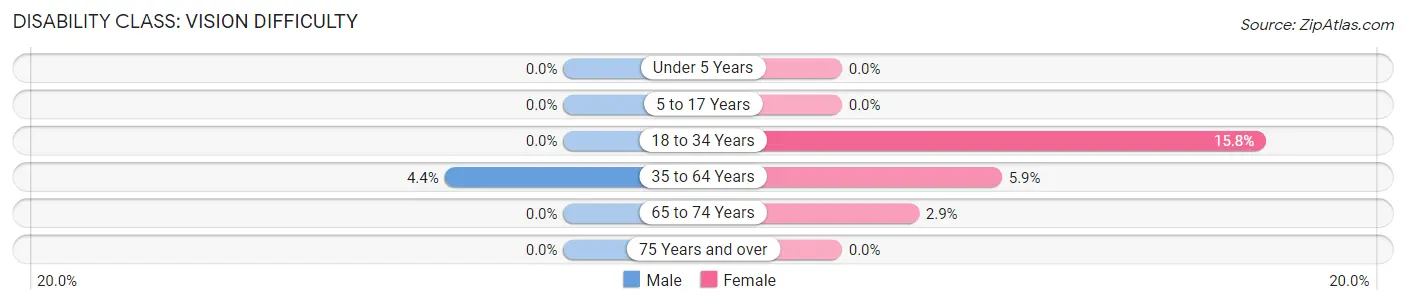
| Age Bracket | Male | Female |
| Under 5 Years | 0 (0.0%) | 0 (0.0%) |
| 5 to 17 Years | 0 (0.0%) | 0 (0.0%) |
| 18 to 34 Years | 0 (0.0%) | 180 (15.8%) |
| 35 to 64 Years | 52 (4.4%) | 75 (5.9%) |
| 65 to 74 Years | 0 (0.0%) | 17 (2.9%) |
| 75 Years and over | 0 (0.0%) | 0 (0.0%) |
Disability Class: Cognitive Difficulty
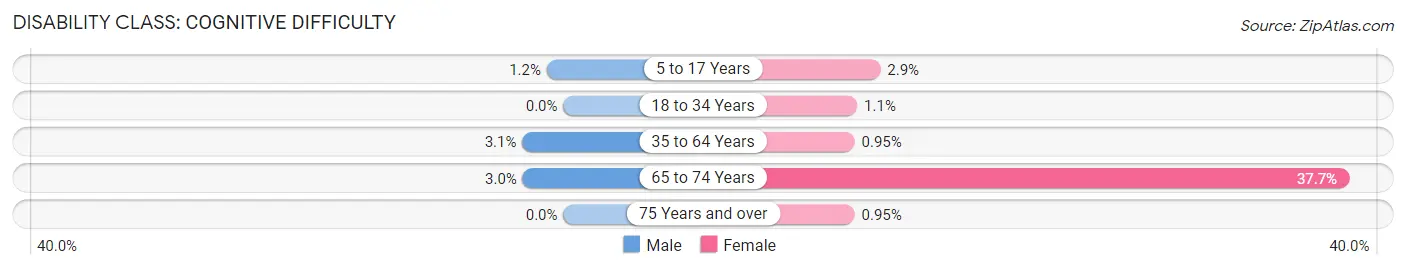
| Age Bracket | Male | Female |
| 5 to 17 Years | 9 (1.2%) | 18 (2.9%) |
| 18 to 34 Years | 0 (0.0%) | 13 (1.1%) |
| 35 to 64 Years | 36 (3.0%) | 12 (0.9%) |
| 65 to 74 Years | 29 (3.0%) | 224 (37.7%) |
| 75 Years and over | 0 (0.0%) | 1 (0.9%) |
Disability Class: Ambulatory Difficulty
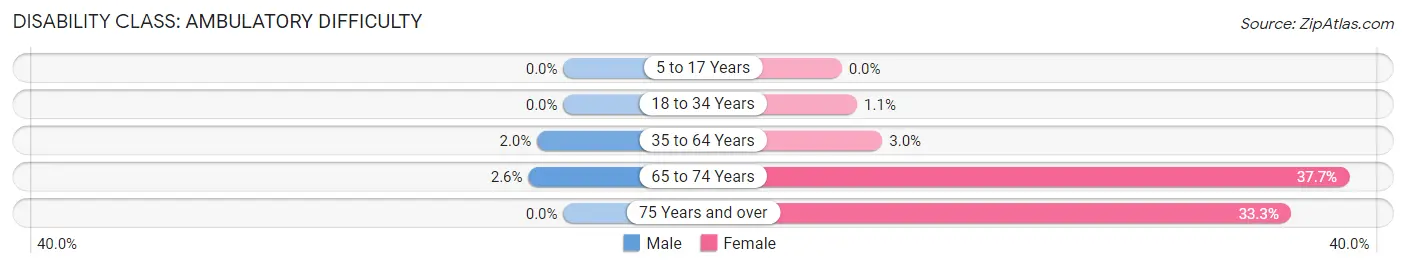
| Age Bracket | Male | Female |
| 5 to 17 Years | 0 (0.0%) | 0 (0.0%) |
| 18 to 34 Years | 0 (0.0%) | 13 (1.1%) |
| 35 to 64 Years | 23 (1.9%) | 38 (3.0%) |
| 65 to 74 Years | 25 (2.6%) | 224 (37.7%) |
| 75 Years and over | 0 (0.0%) | 35 (33.3%) |
Disability Class: Self-Care Difficulty
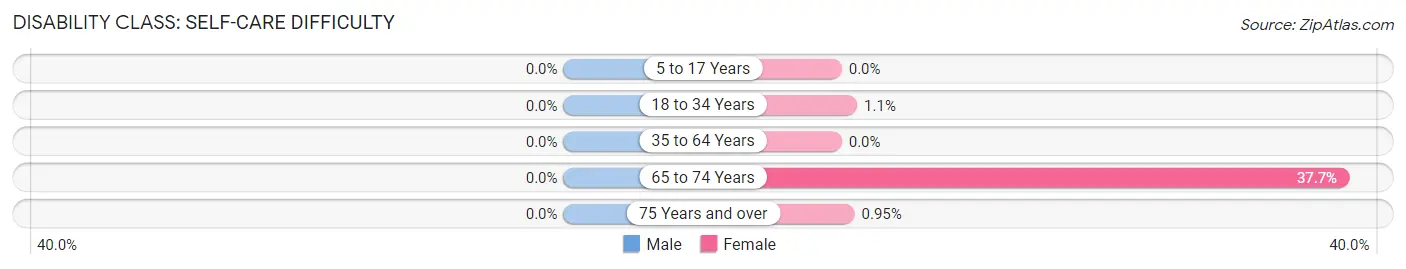
| Age Bracket | Male | Female |
| 5 to 17 Years | 0 (0.0%) | 0 (0.0%) |
| 18 to 34 Years | 0 (0.0%) | 13 (1.1%) |
| 35 to 64 Years | 0 (0.0%) | 0 (0.0%) |
| 65 to 74 Years | 0 (0.0%) | 224 (37.7%) |
| 75 Years and over | 0 (0.0%) | 1 (0.9%) |
Technology Access in Old Jefferson
Computing Device Access in Old Jefferson
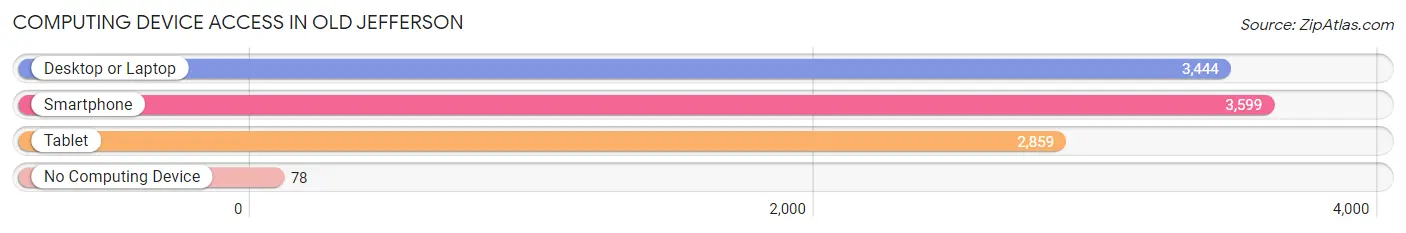
| Device Type | # Households | % Households |
| Desktop or Laptop | 3,444 | 93.2% |
| Smartphone | 3,599 | 97.4% |
| Tablet | 2,859 | 77.4% |
| No Computing Device | 78 | 2.1% |
| Total | 3,695 | 100.0% |
Internet Access in Old Jefferson
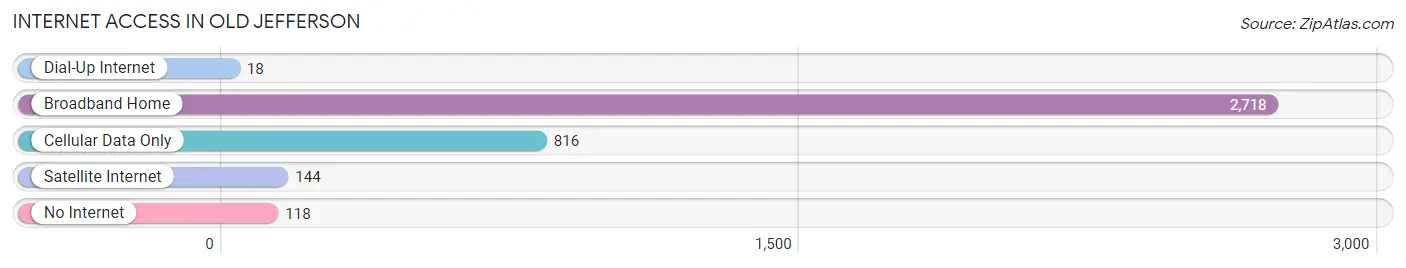
| Internet Type | # Households | % Households |
| Dial-Up Internet | 18 | 0.5% |
| Broadband Home | 2,718 | 73.6% |
| Cellular Data Only | 816 | 22.1% |
| Satellite Internet | 144 | 3.9% |
| No Internet | 118 | 3.2% |
| Total | 3,695 | 100.0% |
Old Jefferson Summary
Jefferson, Louisiana is a small town located in the southeastern part of the state, just outside of New Orleans. It is part of the Greater New Orleans Metropolitan Area and is home to a population of just over 11,000 people. The town was founded in 1836 and is named after Thomas Jefferson, the third President of the United States.
Geography
Jefferson is located in the southeastern part of Louisiana, just outside of New Orleans. It is situated on the banks of the Mississippi River and is bordered by the cities of Metairie, Harahan, and River Ridge. The town is located in Jefferson Parish and is part of the Greater New Orleans Metropolitan Area. The town covers an area of 4.2 square miles and has an elevation of 4 feet above sea level.
History
Jefferson was founded in 1836 and was named after Thomas Jefferson, the third President of the United States. The town was originally a small farming community and was home to a few hundred people. In the late 19th century, the town began to grow as the railroad was built through the area. This allowed for the transportation of goods and people to and from the town.
In the early 20th century, Jefferson began to experience a population boom as people moved to the area to take advantage of the booming economy. The town was also home to a number of industries, including a sugar refinery, a cotton mill, and a brickyard.
In the late 20th century, Jefferson began to experience a decline in population as people moved away from the area. This was due to the decline of the local economy and the rise of suburbanization. However, in recent years, the town has seen a resurgence in population as people have moved back to the area.
Economy
The economy of Jefferson is largely based on the service industry. The town is home to a number of restaurants, bars, and other businesses that cater to the needs of the local population. The town is also home to a number of retail stores, including a Walmart Supercenter.
The town is also home to a number of manufacturing companies, including a sugar refinery, a cotton mill, and a brickyard. These companies provide jobs for the local population and help to keep the economy of the town afloat.
Demographics
As of the 2010 census, the population of Jefferson was 11,095. The town has a population that is largely white (77.3%) and African American (20.2%). The median household income in the town is $41,945 and the median age is 38.
Conclusion
Jefferson, Louisiana is a small town located in the southeastern part of the state, just outside of New Orleans. It is part of the Greater New Orleans Metropolitan Area and is home to a population of just over 11,000 people. The town was founded in 1836 and is named after Thomas Jefferson, the third President of the United States. The town is largely based on the service industry and is home to a number of manufacturing companies. The population of the town is largely white and African American and the median household income is $41,945.
Common Questions
What is the Total Population of Old Jefferson?
Total Population of Old Jefferson is 8,162.
What is the Total Male Population of Old Jefferson?
Total Male Population of Old Jefferson is 4,156.
What is the Total Female Population of Old Jefferson?
Total Female Population of Old Jefferson is 4,006.
What is the Ratio of Males per 100 Females in Old Jefferson?
There are 103.74 Males per 100 Females in Old Jefferson.
What is the Ratio of Females per 100 Males in Old Jefferson?
There are 96.39 Females per 100 Males in Old Jefferson.
What is the Median Population Age in Old Jefferson?
Median Population Age in Old Jefferson is 35.7 Years.
What is the Average Family Size in Old Jefferson
Average Family Size in Old Jefferson is 3.2 People.
What is the Average Household Size in Old Jefferson
Average Household Size in Old Jefferson is 2.2 People.
What is Per Capita Income in Old Jefferson?
Per Capita income in Old Jefferson is $53,503.
What is the Median Family Income in Old Jefferson?
Median Family Income in Old Jefferson is $89,360.
What is the Median Household income in Old Jefferson?
Median Household Income in Old Jefferson is $88,137.
What is Income or Wage Gap in Old Jefferson?
Income or Wage Gap in Old Jefferson is 52.3%.
Women in Old Jefferson earn 47.7 cents for every dollar earned by a man.
What is Inequality or Gini Index in Old Jefferson?
Inequality or Gini Index in Old Jefferson is 0.41.
How Large is the Labor Force in Old Jefferson?
There are 4,554 People in the Labor Forcein in Old Jefferson.
What is the Percentage of People in the Labor Force in Old Jefferson?
68.6% of People are in the Labor Force in Old Jefferson.
What is the Unemployment Rate in Old Jefferson?
Unemployment Rate in Old Jefferson is 4.3%.