Cities with the Highest Poverty Level Among Seniors Over the Age of 75 in Louisiana
RELATED REPORTS & OPTIONS
Highest Poverty | Seniors 75+
Louisiana
Compare Cities
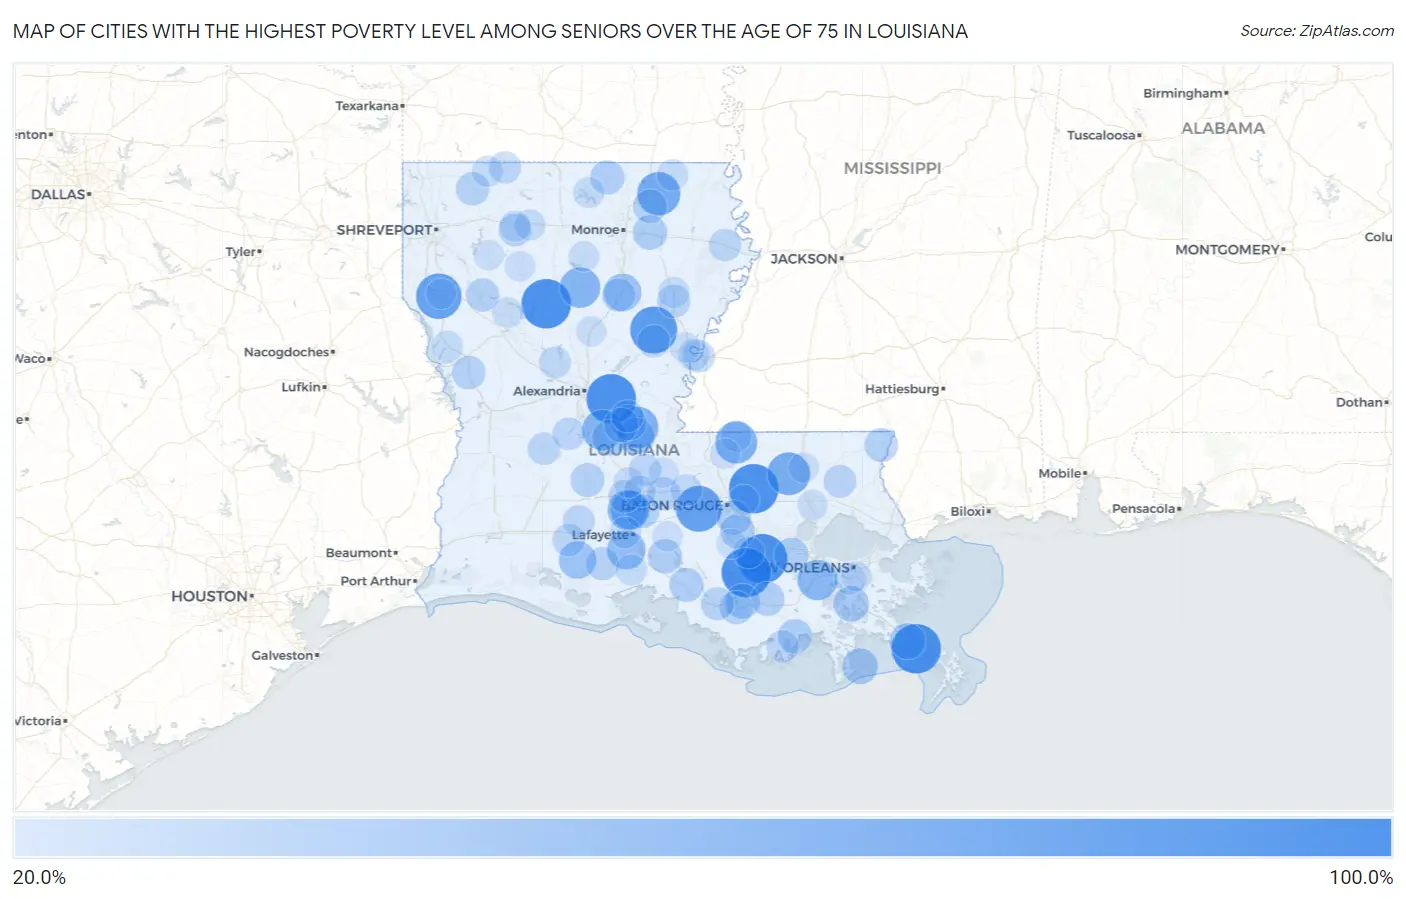
Map of Cities with the Highest Poverty Level Among Seniors Over the Age of 75 in Louisiana
0.0%
100.0%
Cities with the Highest Poverty Level Among Seniors Over the Age of 75 in Louisiana
| City | Senior Poverty | vs State | vs National | |
| 1. | Watson | 100.0% | 14.7%(+85.3)#1 | 11.1%(+88.9)#15 |
| 2. | Buras | 100.0% | 14.7%(+85.3)#2 | 11.1%(+88.9)#35 |
| 3. | Welcome | 100.0% | 14.7%(+85.3)#3 | 11.1%(+88.9)#44 |
| 4. | Center Point | 100.0% | 14.7%(+85.3)#4 | 11.1%(+88.9)#46 |
| 5. | Napoleonville | 100.0% | 14.7%(+85.3)#5 | 11.1%(+88.9)#99 |
| 6. | Calvin | 100.0% | 14.7%(+85.3)#6 | 11.1%(+88.9)#191 |
| 7. | Harrisonburg | 90.9% | 14.7%(+76.2)#7 | 11.1%(+79.8)#419 |
| 8. | Grosse Tete | 86.2% | 14.7%(+71.5)#8 | 11.1%(+75.1)#440 |
| 9. | Centerville | 85.8% | 14.7%(+71.1)#9 | 11.1%(+74.7)#443 |
| 10. | South Mansfield | 85.2% | 14.7%(+70.6)#10 | 11.1%(+74.2)#450 |
| 11. | Mer Rouge | 76.7% | 14.7%(+62.0)#11 | 11.1%(+65.6)#533 |
| 12. | Montpelier | 75.0% | 14.7%(+60.3)#12 | 11.1%(+63.9)#551 |
| 13. | Wilson | 71.4% | 14.7%(+56.8)#13 | 11.1%(+60.4)#605 |
| 14. | Moreauville | 70.6% | 14.7%(+55.9)#14 | 11.1%(+59.5)#613 |
| 15. | Cheneyville | 67.3% | 14.7%(+52.6)#15 | 11.1%(+56.2)#657 |
| 16. | Good Pine | 66.7% | 14.7%(+52.0)#16 | 11.1%(+55.6)#676 |
| 17. | Sikes | 66.7% | 14.7%(+52.0)#17 | 11.1%(+55.6)#681 |
| 18. | Boutte | 65.6% | 14.7%(+50.9)#18 | 11.1%(+54.5)#718 |
| 19. | Sunset | 64.3% | 14.7%(+49.6)#19 | 11.1%(+53.2)#728 |
| 20. | Grand Coteau | 61.1% | 14.7%(+46.4)#20 | 11.1%(+50.0)#813 |
| 21. | Milton | 59.7% | 14.7%(+45.1)#21 | 11.1%(+48.7)#871 |
| 22. | Grayson | 55.6% | 14.7%(+40.9)#22 | 11.1%(+44.5)#997 |
| 23. | Gueydan | 55.3% | 14.7%(+40.6)#23 | 11.1%(+44.2)#1,018 |
| 24. | Plaucheville | 52.2% | 14.7%(+37.5)#24 | 11.1%(+41.1)#1,118 |
| 25. | Empire | 50.0% | 14.7%(+35.3)#25 | 11.1%(+38.9)#1,188 |
| 26. | Grand Isle | 49.2% | 14.7%(+34.5)#26 | 11.1%(+38.1)#1,327 |
| 27. | Bunkie | 49.1% | 14.7%(+34.5)#27 | 11.1%(+38.1)#1,328 |
| 28. | Mansura | 48.8% | 14.7%(+34.2)#28 | 11.1%(+37.8)#1,340 |
| 29. | Lafitte | 48.1% | 14.7%(+33.5)#29 | 11.1%(+37.1)#1,364 |
| 30. | Bayou L Ourse | 45.9% | 14.7%(+31.2)#30 | 11.1%(+34.8)#1,502 |
| 31. | Hessmer | 45.3% | 14.7%(+30.6)#31 | 11.1%(+34.2)#1,540 |
| 32. | Start | 44.8% | 14.7%(+30.1)#32 | 11.1%(+33.7)#1,566 |
| 33. | Gardere | 44.7% | 14.7%(+30.1)#33 | 11.1%(+33.7)#1,568 |
| 34. | St Gabriel | 44.7% | 14.7%(+30.1)#34 | 11.1%(+33.7)#1,569 |
| 35. | Garyville | 44.5% | 14.7%(+29.9)#35 | 11.1%(+33.5)#1,579 |
| 36. | Chauvin | 44.5% | 14.7%(+29.8)#36 | 11.1%(+33.4)#1,580 |
| 37. | Marion | 43.6% | 14.7%(+28.9)#37 | 11.1%(+32.5)#1,638 |
| 38. | Loreauville | 43.5% | 14.7%(+28.9)#38 | 11.1%(+32.5)#1,640 |
| 39. | Baldwin | 43.0% | 14.7%(+28.3)#39 | 11.1%(+31.9)#1,672 |
| 40. | Schriever | 42.9% | 14.7%(+28.2)#40 | 11.1%(+31.8)#1,675 |
| 41. | Mamou | 42.5% | 14.7%(+27.8)#41 | 11.1%(+31.4)#1,727 |
| 42. | Arnaudville | 41.9% | 14.7%(+27.3)#42 | 11.1%(+30.9)#1,767 |
| 43. | Varnado | 41.7% | 14.7%(+27.0)#43 | 11.1%(+30.6)#1,790 |
| 44. | Collinston | 41.7% | 14.7%(+27.0)#44 | 11.1%(+30.6)#1,793 |
| 45. | Florien | 41.3% | 14.7%(+26.6)#45 | 11.1%(+30.2)#1,819 |
| 46. | Coushatta | 40.8% | 14.7%(+26.1)#46 | 11.1%(+29.7)#1,851 |
| 47. | Amelia | 40.7% | 14.7%(+26.1)#47 | 11.1%(+29.7)#1,852 |
| 48. | Cotton Valley | 40.7% | 14.7%(+26.1)#48 | 11.1%(+29.7)#1,853 |
| 49. | Wisner | 40.4% | 14.7%(+25.7)#49 | 11.1%(+29.3)#1,878 |
| 50. | Kaplan | 40.0% | 14.7%(+25.3)#50 | 11.1%(+28.9)#1,895 |
| 51. | Clarks | 40.0% | 14.7%(+25.3)#51 | 11.1%(+28.9)#1,905 |
| 52. | Opelousas | 39.7% | 14.7%(+25.1)#52 | 11.1%(+28.7)#1,972 |
| 53. | Krotz Springs | 39.7% | 14.7%(+25.1)#53 | 11.1%(+28.7)#1,973 |
| 54. | Bayou Vista | 39.3% | 14.7%(+24.6)#54 | 11.1%(+28.2)#2,005 |
| 55. | Folsom | 39.1% | 14.7%(+24.5)#55 | 11.1%(+28.1)#2,014 |
| 56. | Mount Lebanon | 38.9% | 14.7%(+24.2)#56 | 11.1%(+27.8)#2,042 |
| 57. | Vidalia | 37.5% | 14.7%(+22.9)#57 | 11.1%(+26.5)#2,156 |
| 58. | Wallace Ridge | 37.5% | 14.7%(+22.8)#58 | 11.1%(+26.4)#2,163 |
| 59. | Mermentau | 37.5% | 14.7%(+22.8)#59 | 11.1%(+26.4)#2,164 |
| 60. | Elizabeth | 37.5% | 14.7%(+22.8)#60 | 11.1%(+26.4)#2,168 |
| 61. | Palmetto | 37.5% | 14.7%(+22.8)#61 | 11.1%(+26.4)#2,179 |
| 62. | Mcnary | 37.5% | 14.7%(+22.8)#62 | 11.1%(+26.4)#2,180 |
| 63. | Tallulah | 37.4% | 14.7%(+22.7)#63 | 11.1%(+26.3)#2,196 |
| 64. | Dulac | 36.8% | 14.7%(+22.2)#64 | 11.1%(+25.8)#2,237 |
| 65. | Marksville | 36.8% | 14.7%(+22.1)#65 | 11.1%(+25.7)#2,243 |
| 66. | Haynesville | 36.4% | 14.7%(+21.8)#66 | 11.1%(+25.4)#2,265 |
| 67. | Iota | 36.4% | 14.7%(+21.7)#67 | 11.1%(+25.3)#2,269 |
| 68. | Livonia | 35.5% | 14.7%(+20.9)#68 | 11.1%(+24.5)#2,360 |
| 69. | Colfax | 35.5% | 14.7%(+20.8)#69 | 11.1%(+24.4)#2,363 |
| 70. | Donaldsonville | 34.9% | 14.7%(+20.2)#70 | 11.1%(+23.8)#2,425 |
| 71. | Port Barre | 34.6% | 14.7%(+19.9)#71 | 11.1%(+23.5)#2,450 |
| 72. | Marrero | 34.4% | 14.7%(+19.7)#72 | 11.1%(+23.3)#2,472 |
| 73. | Scott | 34.2% | 14.7%(+19.5)#73 | 11.1%(+23.1)#2,495 |
| 74. | Minorca | 34.0% | 14.7%(+19.3)#74 | 11.1%(+22.9)#2,512 |
| 75. | Bonita | 33.3% | 14.7%(+18.7)#75 | 11.1%(+22.3)#2,650 |
| 76. | Shongaloo | 33.3% | 14.7%(+18.7)#76 | 11.1%(+22.3)#2,694 |
| 77. | Marthaville | 33.3% | 14.7%(+18.7)#77 | 11.1%(+22.3)#2,728 |
| 78. | Gilbert | 32.8% | 14.7%(+18.1)#78 | 11.1%(+21.7)#2,766 |
| 79. | Zwolle | 32.7% | 14.7%(+18.0)#79 | 11.1%(+21.6)#2,768 |
| 80. | Erath | 32.4% | 14.7%(+17.8)#80 | 11.1%(+21.4)#2,787 |
| 81. | Farmerville | 32.4% | 14.7%(+17.7)#81 | 11.1%(+21.3)#2,796 |
| 82. | Arcadia | 32.3% | 14.7%(+17.6)#82 | 11.1%(+21.2)#2,810 |
| 83. | Gibsland | 32.3% | 14.7%(+17.6)#83 | 11.1%(+21.2)#2,814 |
| 84. | Norwood | 32.1% | 14.7%(+17.5)#84 | 11.1%(+21.1)#2,829 |
| 85. | Campti | 31.8% | 14.7%(+17.1)#85 | 11.1%(+20.8)#2,857 |
| 86. | Chatham | 31.8% | 14.7%(+17.1)#86 | 11.1%(+20.8)#2,860 |
| 87. | Washington | 31.3% | 14.7%(+16.7)#87 | 11.1%(+20.3)#2,917 |
| 88. | Monticello | 31.0% | 14.7%(+16.3)#88 | 11.1%(+19.9)#2,966 |
| 89. | Melville | 30.8% | 14.7%(+16.1)#89 | 11.1%(+19.7)#2,988 |
| 90. | Lucky | 30.8% | 14.7%(+16.1)#90 | 11.1%(+19.7)#3,002 |
| 91. | Ferriday | 30.7% | 14.7%(+16.0)#91 | 11.1%(+19.6)#3,012 |
| 92. | Catahoula | 30.2% | 14.7%(+15.5)#92 | 11.1%(+19.1)#3,081 |
| 93. | Ringgold | 30.0% | 14.7%(+15.3)#93 | 11.1%(+18.9)#3,102 |
| 94. | Georgetown | 30.0% | 14.7%(+15.3)#94 | 11.1%(+18.9)#3,136 |
| 95. | Ponchatoula | 30.0% | 14.7%(+15.3)#95 | 11.1%(+18.9)#3,151 |
| 96. | Amite City | 29.9% | 14.7%(+15.2)#96 | 11.1%(+18.8)#3,158 |
| 97. | Jackson | 29.9% | 14.7%(+15.2)#97 | 11.1%(+18.8)#3,159 |
| 98. | Gretna | 29.7% | 14.7%(+15.0)#98 | 11.1%(+18.6)#3,186 |
| 99. | Mansfield | 29.4% | 14.7%(+14.7)#99 | 11.1%(+18.3)#3,218 |
| 100. | White Castle | 29.2% | 14.7%(+14.5)#100 | 11.1%(+18.1)#3,261 |
Common Questions
What are the Top 10 Cities with the Highest Poverty Level Among Seniors Over the Age of 75 in Louisiana?
Top 10 Cities with the Highest Poverty Level Among Seniors Over the Age of 75 in Louisiana are:
#1
100.0%
#2
100.0%
#3
100.0%
#4
100.0%
#5
100.0%
#6
100.0%
#7
90.9%
#8
86.2%
#9
85.2%
#10
76.7%
What city has the Highest Poverty Level Among Seniors Over the Age of 75 in Louisiana?
Watson has the Highest Poverty Level Among Seniors Over the Age of 75 in Louisiana with 100.0%.
What is the Poverty Level Among Seniors Over the Age of 75 in the State of Louisiana?
Poverty Level Among Seniors Over the Age of 75 in Louisiana is 14.7%.
What is the Poverty Level Among Seniors Over the Age of 75 in the United States?
Poverty Level Among Seniors Over the Age of 75 in the United States is 11.1%.