Riviera Beach, FL
Riviera Beach Map
Riviera Beach Overview
37,668
TOTAL POPULATION
18,194
MALE POPULATION
19,474
FEMALE POPULATION
93.43
MALES / 100 FEMALES
107.04
FEMALES / 100 MALES
38.7
MEDIAN AGE
3.6
AVG FAMILY SIZE
2.8
AVG HOUSEHOLD SIZE
$32,353
PER CAPITA INCOME
$71,098
AVG FAMILY INCOME
$57,851
AVG HOUSEHOLD INCOME
3.9%
WAGE / INCOME GAP [ % ]
96.1¢/ $1
WAGE / INCOME GAP [ $ ]
$12,533
FAMILY INCOME DEFICIT
0.52
INEQUALITY / GINI INDEX
18,341
LABOR FORCE [ PEOPLE ]
61.6%
PERCENT IN LABOR FORCE
9.2%
UNEMPLOYMENT RATE
Riviera Beach Area Codes
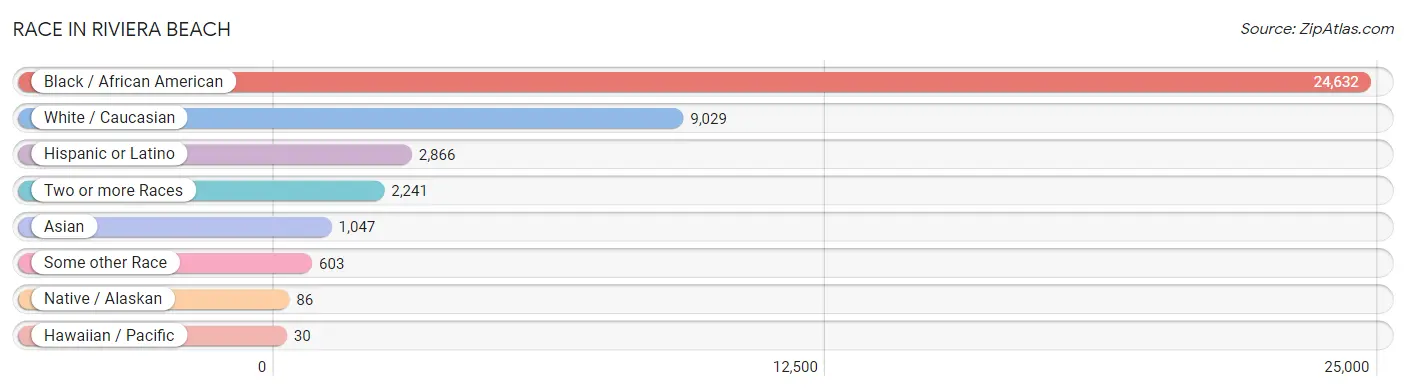
Race in Riviera Beach
The most populous races in Riviera Beach are Black / African American (24,632 | 65.4%), White / Caucasian (9,029 | 24.0%), and Hispanic or Latino (2,866 | 7.6%).
| Race | # Population | % Population |
| Asian | 1,047 | 2.8% |
| Black / African American | 24,632 | 65.4% |
| Hawaiian / Pacific | 30 | 0.1% |
| Hispanic or Latino | 2,866 | 7.6% |
| Native / Alaskan | 86 | 0.2% |
| White / Caucasian | 9,029 | 24.0% |
| Two or more Races | 2,241 | 5.9% |
| Some other Race | 603 | 1.6% |
| Total | 37,668 | 100.0% |
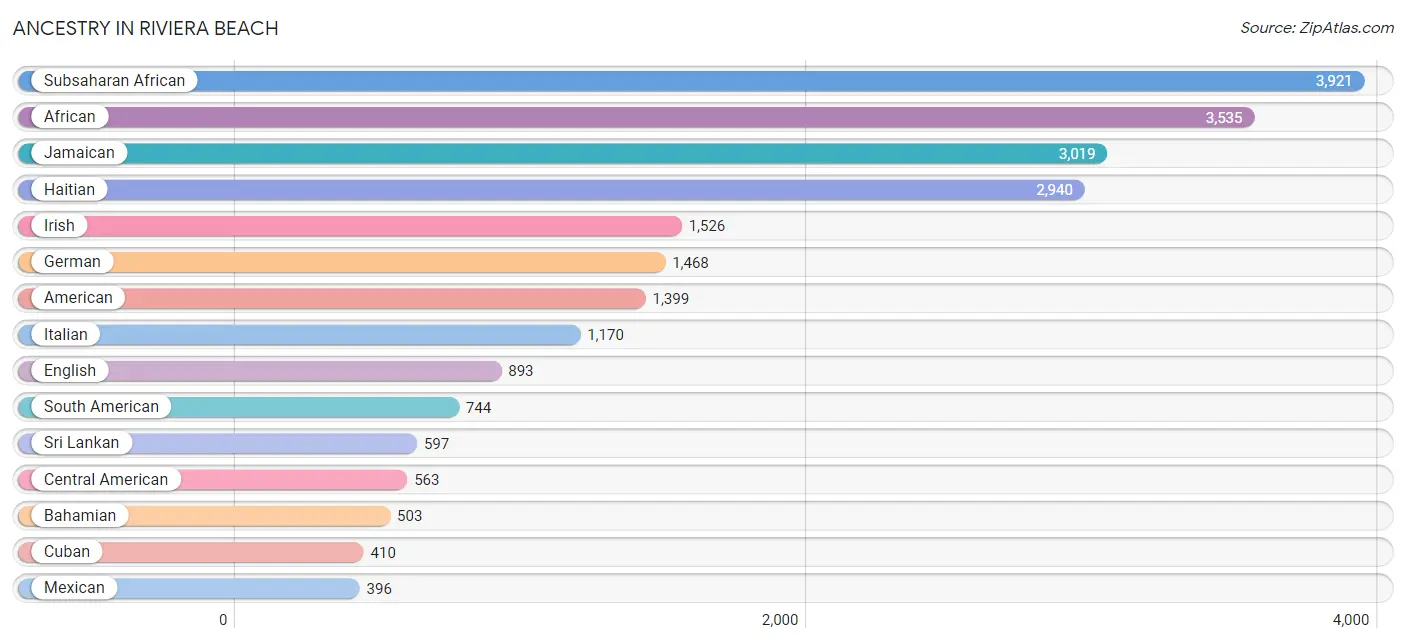
Ancestry in Riviera Beach
The most populous ancestries reported in Riviera Beach are Subsaharan African (3,921 | 10.4%), African (3,535 | 9.4%), Jamaican (3,019 | 8.0%), Haitian (2,940 | 7.8%), and Irish (1,526 | 4.1%), together accounting for 39.7% of all Riviera Beach residents.
| Ancestry | # Population | % Population |
| African | 3,535 | 9.4% |
| Albanian | 6 | 0.0% |
| American | 1,399 | 3.7% |
| Arab | 34 | 0.1% |
| Argentinean | 42 | 0.1% |
| Armenian | 7 | 0.0% |
| Austrian | 118 | 0.3% |
| Bahamian | 503 | 1.3% |
| Barbadian | 34 | 0.1% |
| Bhutanese | 11 | 0.0% |
| Brazilian | 29 | 0.1% |
| British | 107 | 0.3% |
| British West Indian | 9 | 0.0% |
| Burmese | 4 | 0.0% |
| Canadian | 142 | 0.4% |
| Central American | 563 | 1.5% |
| Central American Indian | 2 | 0.0% |
| Cherokee | 29 | 0.1% |
| Colombian | 267 | 0.7% |
| Costa Rican | 62 | 0.2% |
| Croatian | 4 | 0.0% |
| Cuban | 410 | 1.1% |
| Czech | 43 | 0.1% |
| Czechoslovakian | 18 | 0.1% |
| Danish | 16 | 0.0% |
| Delaware | 40 | 0.1% |
| Dominican | 327 | 0.9% |
| Dutch | 47 | 0.1% |
| Dutch West Indian | 9 | 0.0% |
| Eastern European | 232 | 0.6% |
| Ecuadorian | 41 | 0.1% |
| English | 893 | 2.4% |
| Estonian | 2 | 0.0% |
| European | 175 | 0.5% |
| Filipino | 25 | 0.1% |
| Finnish | 7 | 0.0% |
| French | 274 | 0.7% |
| French Canadian | 198 | 0.5% |
| German | 1,468 | 3.9% |
| Ghanaian | 6 | 0.0% |
| Greek | 119 | 0.3% |
| Guamanian / Chamorro | 30 | 0.1% |
| Guatemalan | 234 | 0.6% |
| Guyanese | 50 | 0.1% |
| Haitian | 2,940 | 7.8% |
| Honduran | 11 | 0.0% |
| Hungarian | 45 | 0.1% |
| Indian (Asian) | 56 | 0.2% |
| Iranian | 63 | 0.2% |
| Irish | 1,526 | 4.1% |
| Italian | 1,170 | 3.1% |
| Jamaican | 3,019 | 8.0% |
| Jordanian | 9 | 0.0% |
| Korean | 119 | 0.3% |
| Latvian | 9 | 0.0% |
| Lebanese | 13 | 0.0% |
| Lithuanian | 45 | 0.1% |
| Lumbee | 34 | 0.1% |
| Luxembourger | 6 | 0.0% |
| Mexican | 396 | 1.1% |
| Mexican American Indian | 24 | 0.1% |
| Nicaraguan | 72 | 0.2% |
| Nigerian | 320 | 0.9% |
| Northern European | 8 | 0.0% |
| Norwegian | 73 | 0.2% |
| Palestinian | 12 | 0.0% |
| Panamanian | 100 | 0.3% |
| Peruvian | 56 | 0.2% |
| Polish | 319 | 0.9% |
| Portuguese | 29 | 0.1% |
| Puerto Rican | 312 | 0.8% |
| Romanian | 216 | 0.6% |
| Russian | 315 | 0.8% |
| Salvadoran | 84 | 0.2% |
| Scandinavian | 50 | 0.1% |
| Scotch-Irish | 28 | 0.1% |
| Scottish | 282 | 0.7% |
| Seminole | 8 | 0.0% |
| Slovak | 23 | 0.1% |
| Slovene | 10 | 0.0% |
| Somali | 66 | 0.2% |
| South American | 744 | 2.0% |
| South American Indian | 19 | 0.1% |
| Spaniard | 16 | 0.0% |
| Spanish | 8 | 0.0% |
| Sri Lankan | 597 | 1.6% |
| Subsaharan African | 3,921 | 10.4% |
| Swedish | 74 | 0.2% |
| Swiss | 13 | 0.0% |
| Thai | 306 | 0.8% |
| Trinidadian and Tobagonian | 80 | 0.2% |
| Turkish | 26 | 0.1% |
| U.S. Virgin Islander | 33 | 0.1% |
| Ukrainian | 14 | 0.0% |
| Venezuelan | 338 | 0.9% |
| Welsh | 151 | 0.4% |
| West Indian | 42 | 0.1% |
| Yugoslavian | 6 | 0.0% | View All 98 Rows |
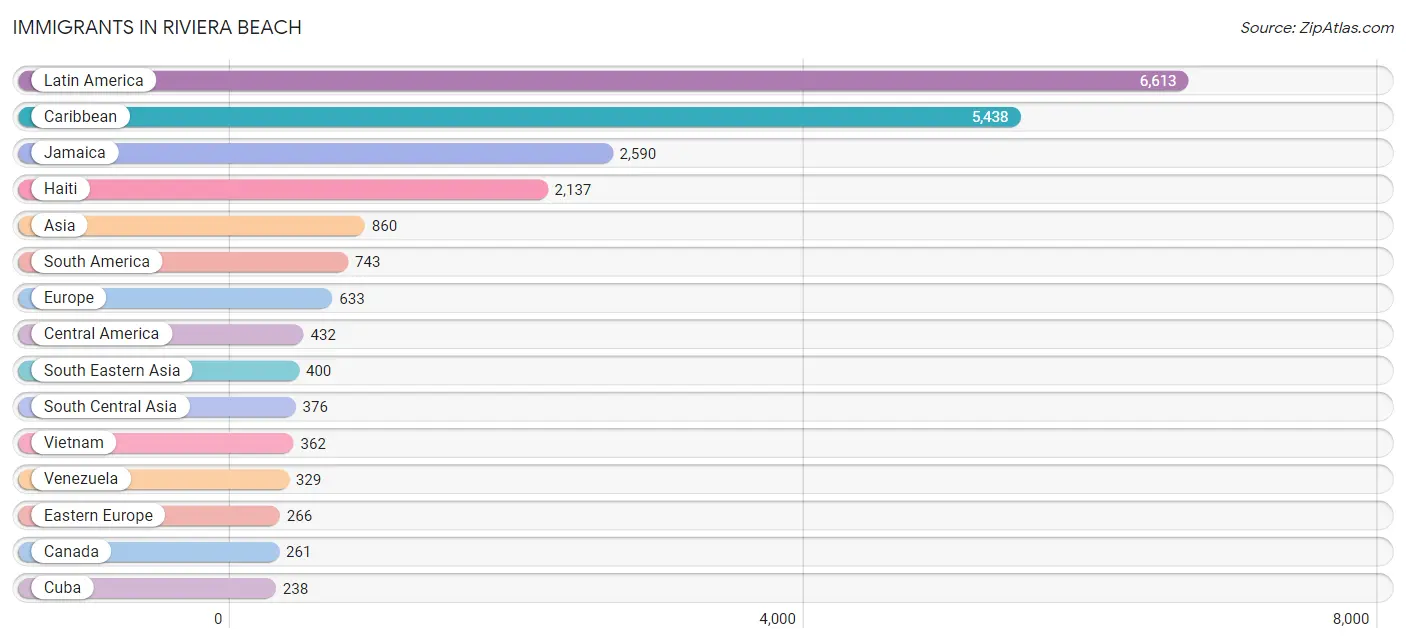
Immigrants in Riviera Beach
The most numerous immigrant groups reported in Riviera Beach came from Latin America (6,613 | 17.6%), Caribbean (5,438 | 14.4%), Jamaica (2,590 | 6.9%), Haiti (2,137 | 5.7%), and Asia (860 | 2.3%), together accounting for 46.8% of all Riviera Beach residents.
| Immigration Origin | # Population | % Population |
| Argentina | 48 | 0.1% |
| Asia | 860 | 2.3% |
| Austria | 7 | 0.0% |
| Bahamas | 146 | 0.4% |
| Barbados | 34 | 0.1% |
| Belarus | 44 | 0.1% |
| Brazil | 18 | 0.1% |
| Canada | 261 | 0.7% |
| Caribbean | 5,438 | 14.4% |
| Central America | 432 | 1.1% |
| China | 13 | 0.0% |
| Colombia | 211 | 0.6% |
| Costa Rica | 20 | 0.1% |
| Cuba | 238 | 0.6% |
| Dominican Republic | 160 | 0.4% |
| Eastern Asia | 18 | 0.1% |
| Eastern Europe | 266 | 0.7% |
| Ecuador | 26 | 0.1% |
| El Salvador | 56 | 0.2% |
| England | 74 | 0.2% |
| Europe | 633 | 1.7% |
| France | 30 | 0.1% |
| Germany | 68 | 0.2% |
| Greece | 11 | 0.0% |
| Guatemala | 99 | 0.3% |
| Guyana | 64 | 0.2% |
| Haiti | 2,137 | 5.7% |
| Honduras | 11 | 0.0% |
| Hungary | 24 | 0.1% |
| India | 167 | 0.4% |
| Iran | 87 | 0.2% |
| Ireland | 124 | 0.3% |
| Italy | 17 | 0.1% |
| Jamaica | 2,590 | 6.9% |
| Japan | 5 | 0.0% |
| Jordan | 9 | 0.0% |
| Latin America | 6,613 | 17.6% |
| Mexico | 170 | 0.4% |
| Moldova | 135 | 0.4% |
| Nicaragua | 76 | 0.2% |
| Northern Europe | 234 | 0.6% |
| Pakistan | 122 | 0.3% |
| Peru | 35 | 0.1% |
| Philippines | 38 | 0.1% |
| Poland | 8 | 0.0% |
| Russia | 18 | 0.1% |
| South America | 743 | 2.0% |
| South Central Asia | 376 | 1.0% |
| South Eastern Asia | 400 | 1.1% |
| Southern Europe | 28 | 0.1% |
| St. Vincent and the Grenadines | 27 | 0.1% |
| Trinidad and Tobago | 88 | 0.2% |
| Venezuela | 329 | 0.9% |
| Vietnam | 362 | 1.0% |
| West Indies | 9 | 0.0% |
| Western Asia | 9 | 0.0% |
| Western Europe | 105 | 0.3% | View All 57 Rows |
Sex and Age in Riviera Beach
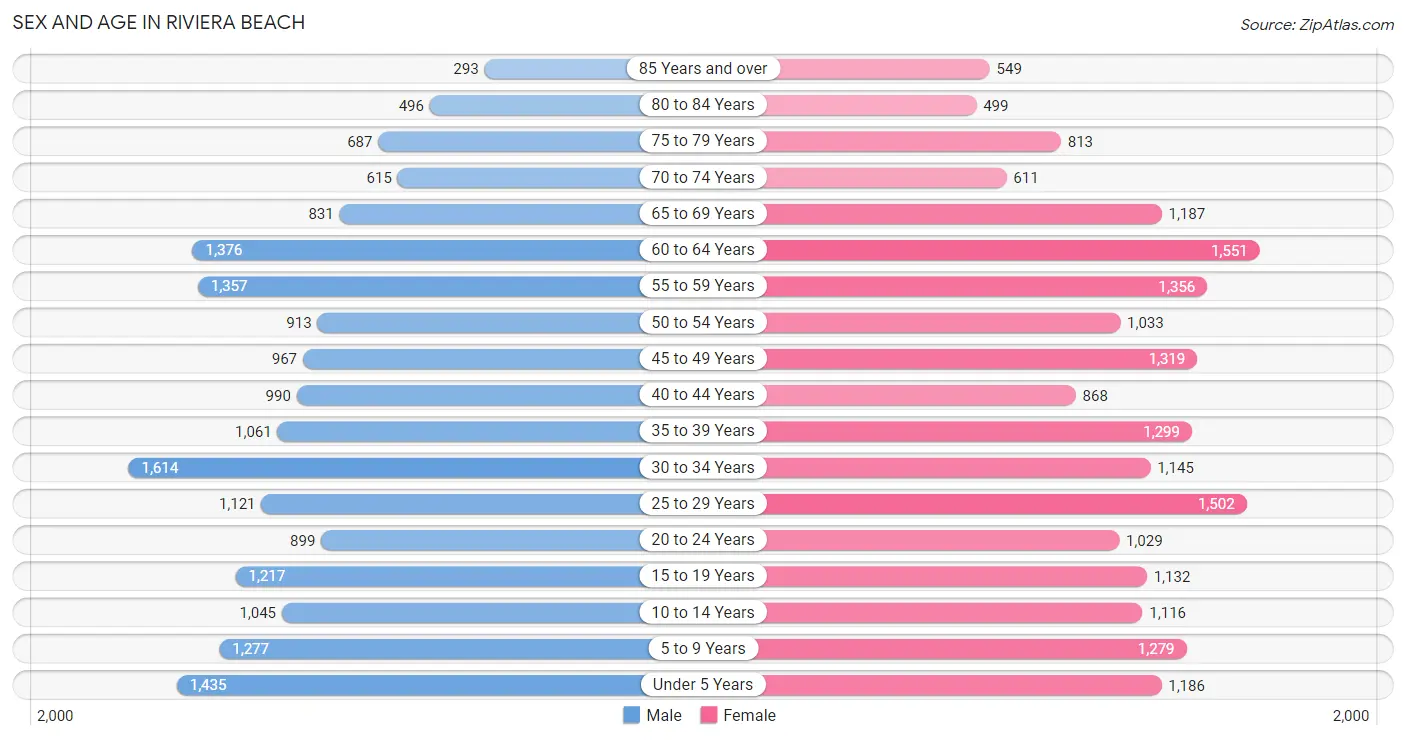
Sex and Age in Riviera Beach
The most populous age groups in Riviera Beach are 30 to 34 Years (1,614 | 8.9%) for men and 60 to 64 Years (1,551 | 8.0%) for women.
| Age Bracket | Male | Female |
| Under 5 Years | 1,435 (7.9%) | 1,186 (6.1%) |
| 5 to 9 Years | 1,277 (7.0%) | 1,279 (6.6%) |
| 10 to 14 Years | 1,045 (5.7%) | 1,116 (5.7%) |
| 15 to 19 Years | 1,217 (6.7%) | 1,132 (5.8%) |
| 20 to 24 Years | 899 (4.9%) | 1,029 (5.3%) |
| 25 to 29 Years | 1,121 (6.2%) | 1,502 (7.7%) |
| 30 to 34 Years | 1,614 (8.9%) | 1,145 (5.9%) |
| 35 to 39 Years | 1,061 (5.8%) | 1,299 (6.7%) |
| 40 to 44 Years | 990 (5.4%) | 868 (4.5%) |
| 45 to 49 Years | 967 (5.3%) | 1,319 (6.8%) |
| 50 to 54 Years | 913 (5.0%) | 1,033 (5.3%) |
| 55 to 59 Years | 1,357 (7.5%) | 1,356 (7.0%) |
| 60 to 64 Years | 1,376 (7.6%) | 1,551 (8.0%) |
| 65 to 69 Years | 831 (4.6%) | 1,187 (6.1%) |
| 70 to 74 Years | 615 (3.4%) | 611 (3.1%) |
| 75 to 79 Years | 687 (3.8%) | 813 (4.2%) |
| 80 to 84 Years | 496 (2.7%) | 499 (2.6%) |
| 85 Years and over | 293 (1.6%) | 549 (2.8%) |
| Total | 18,194 (100.0%) | 19,474 (100.0%) |
Families and Households in Riviera Beach
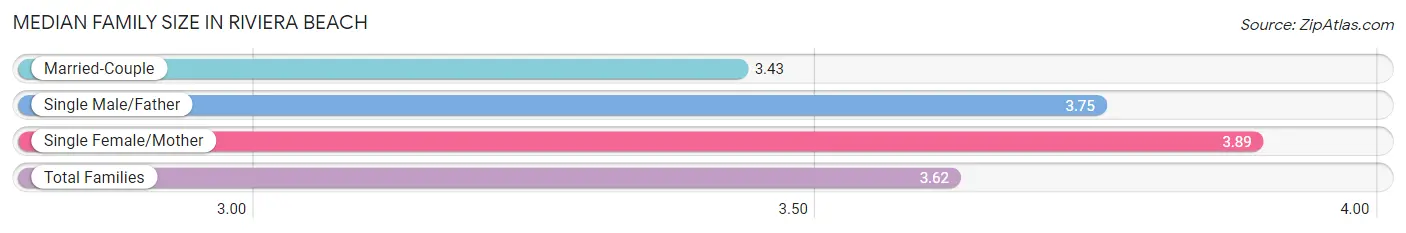
Median Family Size in Riviera Beach
The median family size in Riviera Beach is 3.62 persons per family, with single female/mother families (2,920 | 35.3%) accounting for the largest median family size of 3.89 persons per family. On the other hand, married-couple families (4,644 | 56.1%) represent the smallest median family size with 3.43 persons per family.
| Family Type | # Families | Family Size |
| Married-Couple | 4,644 (56.1%) | 3.43 |
| Single Male/Father | 711 (8.6%) | 3.75 |
| Single Female/Mother | 2,920 (35.3%) | 3.89 |
| Total Families | 8,275 (100.0%) | 3.62 |
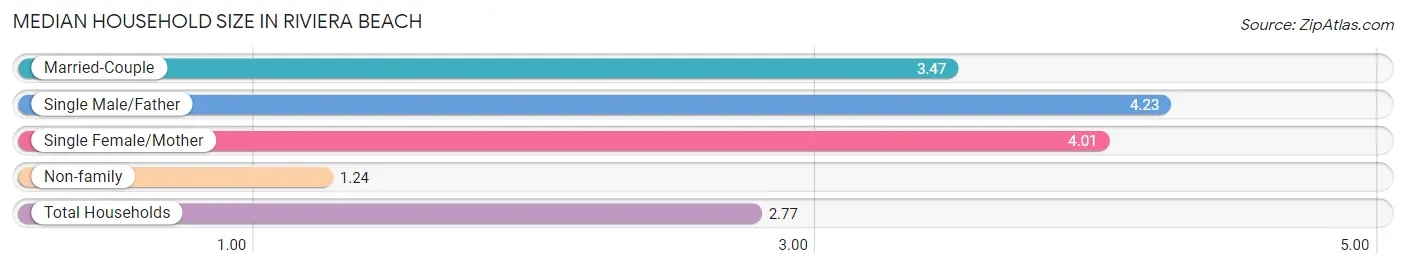
Median Household Size in Riviera Beach
The median household size in Riviera Beach is 2.77 persons per household, with single male/father households (711 | 5.3%) accounting for the largest median household size of 4.23 persons per household. non-family households (5,141 | 38.3%) represent the smallest median household size with 1.24 persons per household.
| Household Type | # Households | Household Size |
| Married-Couple | 4,644 (34.6%) | 3.47 |
| Single Male/Father | 711 (5.3%) | 4.23 |
| Single Female/Mother | 2,920 (21.8%) | 4.01 |
| Non-family | 5,141 (38.3%) | 1.24 |
| Total Households | 13,416 (100.0%) | 2.77 |
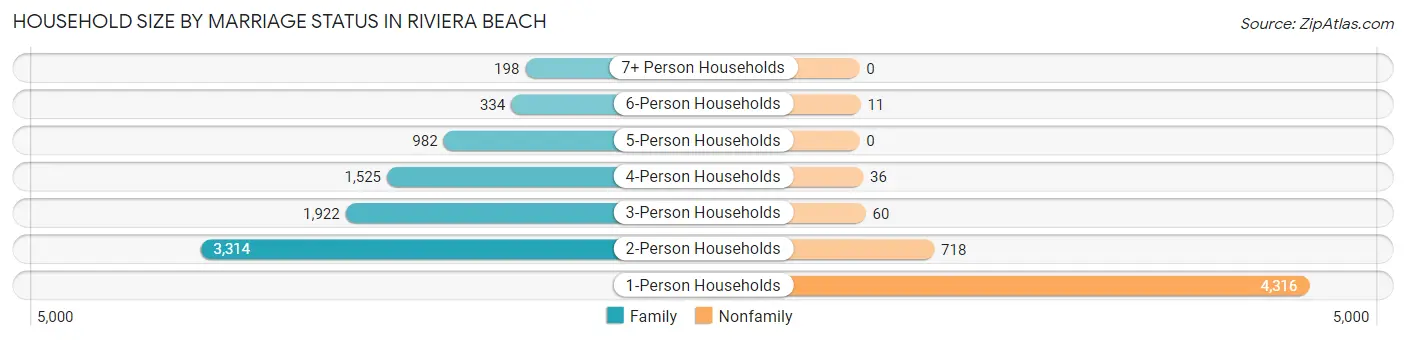
Household Size by Marriage Status in Riviera Beach
Out of a total of 13,416 households in Riviera Beach, 8,275 (61.7%) are family households, while 5,141 (38.3%) are nonfamily households. The most numerous type of family households are 2-person households, comprising 3,314, and the most common type of nonfamily households are 1-person households, comprising 4,316.
| Household Size | Family Households | Nonfamily Households |
| 1-Person Households | - | 4,316 (32.2%) |
| 2-Person Households | 3,314 (24.7%) | 718 (5.3%) |
| 3-Person Households | 1,922 (14.3%) | 60 (0.4%) |
| 4-Person Households | 1,525 (11.4%) | 36 (0.3%) |
| 5-Person Households | 982 (7.3%) | 0 (0.0%) |
| 6-Person Households | 334 (2.5%) | 11 (0.1%) |
| 7+ Person Households | 198 (1.5%) | 0 (0.0%) |
| Total | 8,275 (61.7%) | 5,141 (38.3%) |
Female Fertility in Riviera Beach
Fertility by Age in Riviera Beach
Average fertility rate in Riviera Beach is 80.0 births per 1,000 women. Women in the age bracket of 20 to 34 years have the highest fertility rate with 137.0 births per 1,000 women. Women in the age bracket of 20 to 34 years acount for 74.3% of all women with births.
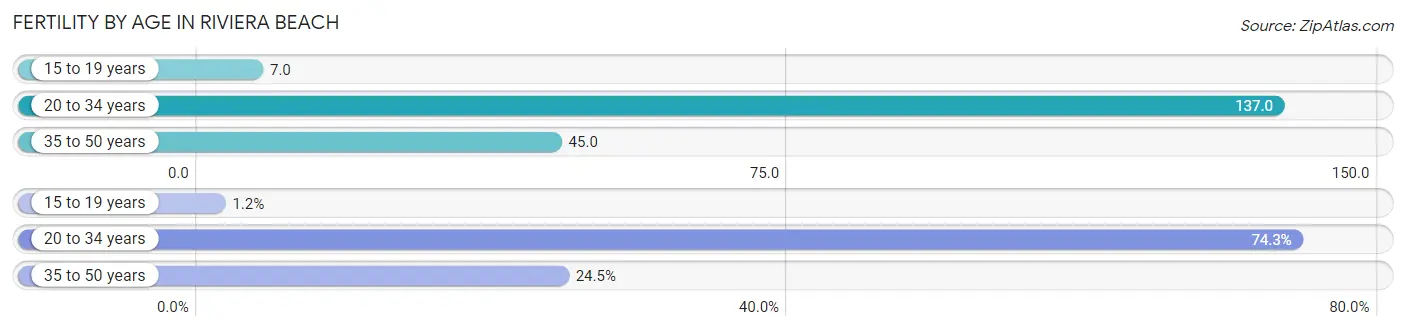
| Age Bracket | Women with Births | Births / 1,000 Women |
| 15 to 19 years | 8 (1.2%) | 7.0 |
| 20 to 34 years | 504 (74.3%) | 137.0 |
| 35 to 50 years | 166 (24.5%) | 45.0 |
| Total | 678 (100.0%) | 80.0 |
Fertility by Age by Marriage Status in Riviera Beach
40.0% of women with births (678) in Riviera Beach are married. The highest percentage of unmarried women with births falls into 15 to 19 years age bracket with 100.0% of them unmarried at the time of birth, while the lowest percentage of unmarried women with births belong to 35 to 50 years age bracket with 33.7% of them unmarried.
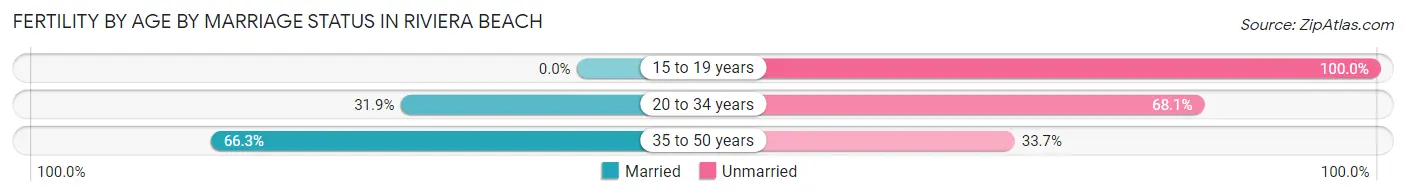
| Age Bracket | Married | Unmarried |
| 15 to 19 years | 0 (0.0%) | 8 (100.0%) |
| 20 to 34 years | 161 (31.9%) | 343 (68.1%) |
| 35 to 50 years | 110 (66.3%) | 56 (33.7%) |
| Total | 271 (40.0%) | 407 (60.0%) |
Fertility by Education in Riviera Beach
Average fertility rate in Riviera Beach is 80.0 births per 1,000 women. Women with the education attainment of bachelor's degree have the highest fertility rate of 130.0 births per 1,000 women, while women with the education attainment of less than high school have the lowest fertility at 46.0 births per 1,000 women. Women with the education attainment of college or associate's degree represent 33.9% of all women with births.
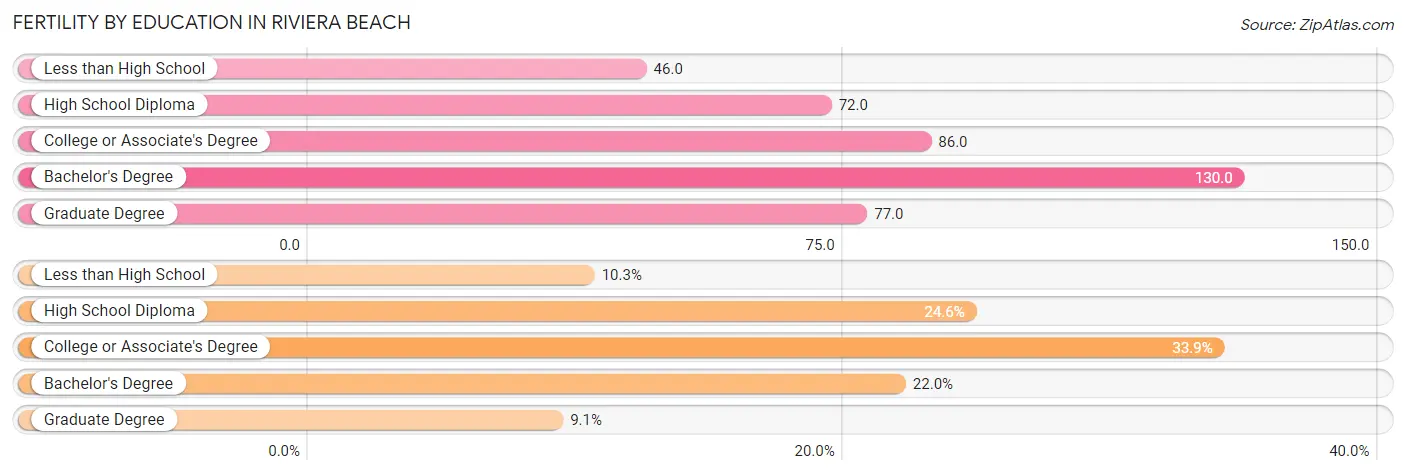
| Educational Attainment | Women with Births | Births / 1,000 Women |
| Less than High School | 70 (10.3%) | 46.0 |
| High School Diploma | 167 (24.6%) | 72.0 |
| College or Associate's Degree | 230 (33.9%) | 86.0 |
| Bachelor's Degree | 149 (22.0%) | 130.0 |
| Graduate Degree | 62 (9.1%) | 77.0 |
| Total | 678 (100.0%) | 80.0 |
Fertility by Education by Marriage Status in Riviera Beach
60.0% of women with births in Riviera Beach are unmarried. Women with the educational attainment of graduate degree are most likely to be married with 100.0% of them married at childbirth, while women with the educational attainment of high school diploma are least likely to be married with 91.0% of them unmarried at childbirth.
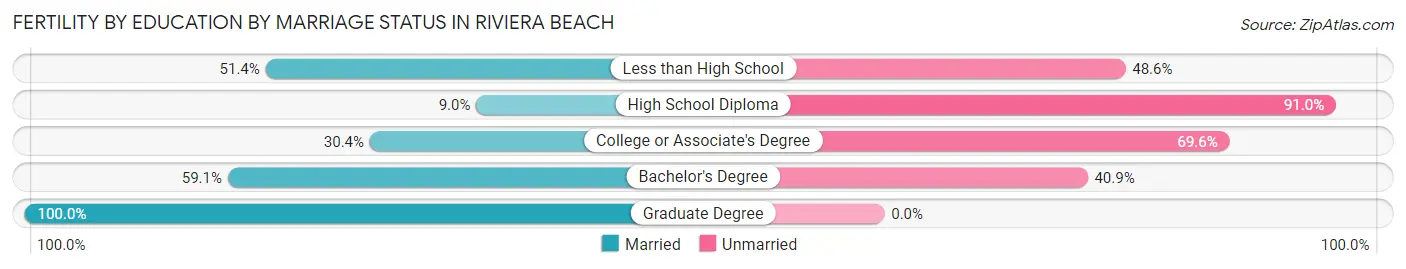
| Educational Attainment | Married | Unmarried |
| Less than High School | 36 (51.4%) | 34 (48.6%) |
| High School Diploma | 15 (9.0%) | 152 (91.0%) |
| College or Associate's Degree | 70 (30.4%) | 160 (69.6%) |
| Bachelor's Degree | 88 (59.1%) | 61 (40.9%) |
| Graduate Degree | 62 (100.0%) | 0 (0.0%) |
| Total | 271 (40.0%) | 407 (60.0%) |
Income in Riviera Beach
Income Overview in Riviera Beach
Per Capita Income in Riviera Beach is $32,353, while median incomes of families and households are $71,098 and $57,851 respectively.
| Characteristic | Number | Measure |
| Per Capita Income | 37,668 | $32,353 |
| Median Family Income | 8,275 | $71,098 |
| Mean Family Income | 8,275 | $100,390 |
| Median Household Income | 13,416 | $57,851 |
| Mean Household Income | 13,416 | $84,528 |
| Income Deficit | 8,275 | $12,533 |
| Wage / Income Gap (%) | 37,668 | 3.85% |
| Wage / Income Gap ($) | 37,668 | 96.15¢ per $1 |
| Gini / Inequality Index | 37,668 | 0.52 |
Earnings by Sex in Riviera Beach
Average Earnings in Riviera Beach are $34,200, $34,616 for men and $33,282 for women, a difference of 3.8%.
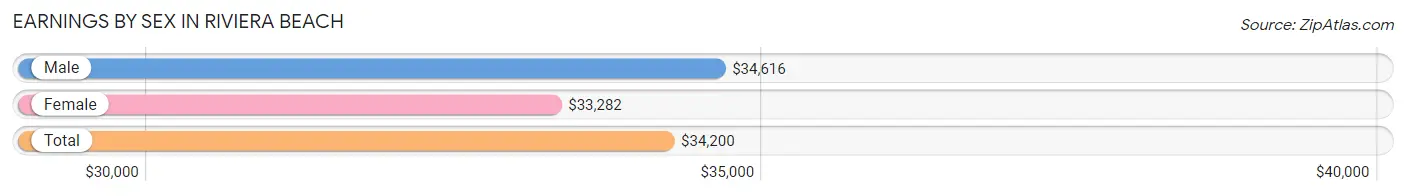
| Sex | Number | Average Earnings |
| Male | 8,816 (48.7%) | $34,616 |
| Female | 9,277 (51.3%) | $33,282 |
| Total | 18,093 (100.0%) | $34,200 |
Earnings by Sex by Income Bracket in Riviera Beach
The most common earnings brackets in Riviera Beach are $30,000 to $34,999 for men (854 | 9.7%) and $55,000 to $64,999 for women (771 | 8.3%).
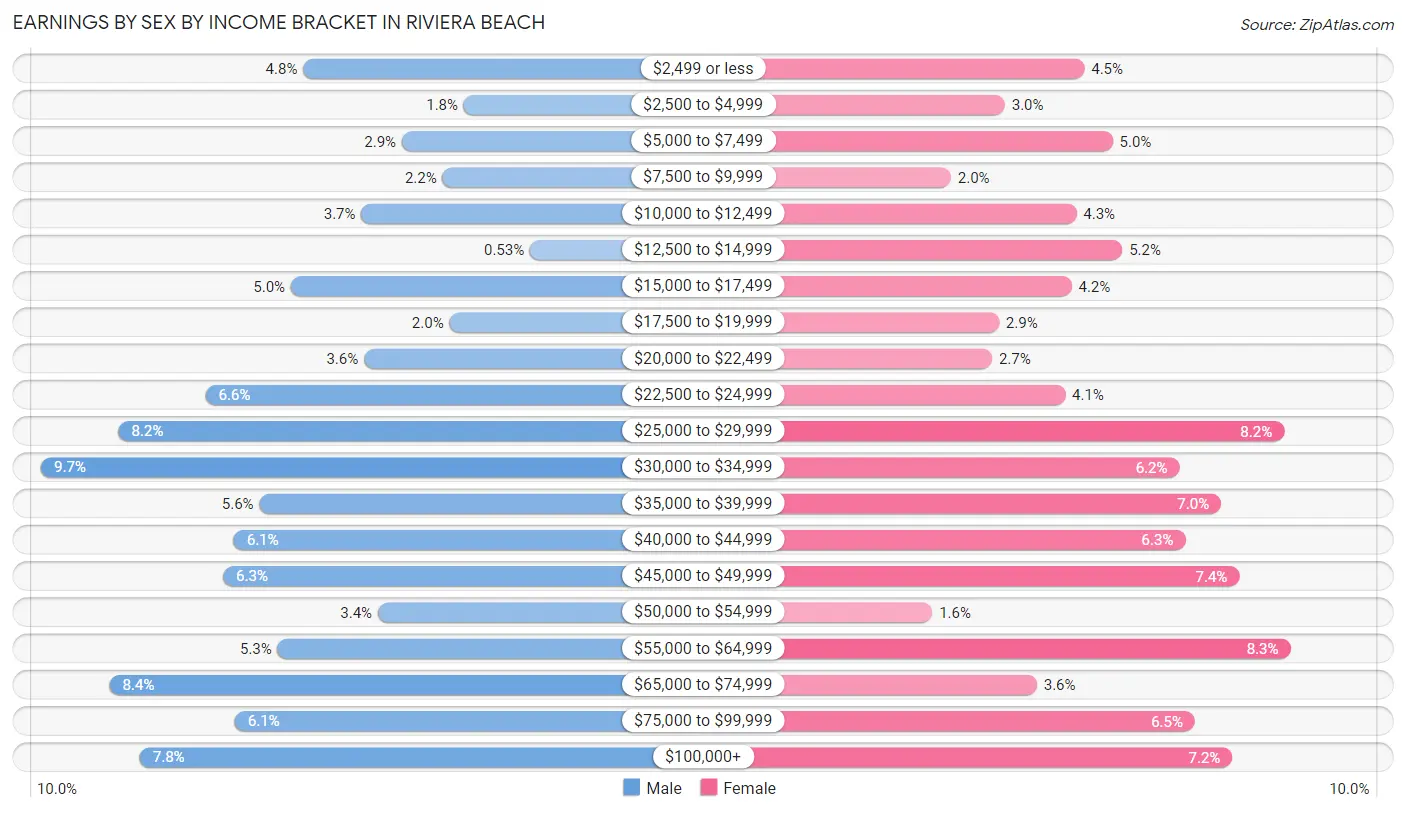
| Income | Male | Female |
| $2,499 or less | 421 (4.8%) | 413 (4.4%) |
| $2,500 to $4,999 | 156 (1.8%) | 275 (3.0%) |
| $5,000 to $7,499 | 258 (2.9%) | 462 (5.0%) |
| $7,500 to $9,999 | 191 (2.2%) | 181 (1.9%) |
| $10,000 to $12,499 | 325 (3.7%) | 399 (4.3%) |
| $12,500 to $14,999 | 47 (0.5%) | 479 (5.2%) |
| $15,000 to $17,499 | 442 (5.0%) | 391 (4.2%) |
| $17,500 to $19,999 | 180 (2.0%) | 264 (2.9%) |
| $20,000 to $22,499 | 321 (3.6%) | 252 (2.7%) |
| $22,500 to $24,999 | 583 (6.6%) | 379 (4.1%) |
| $25,000 to $29,999 | 726 (8.2%) | 760 (8.2%) |
| $30,000 to $34,999 | 854 (9.7%) | 578 (6.2%) |
| $35,000 to $39,999 | 494 (5.6%) | 650 (7.0%) |
| $40,000 to $44,999 | 536 (6.1%) | 588 (6.3%) |
| $45,000 to $49,999 | 554 (6.3%) | 682 (7.3%) |
| $50,000 to $54,999 | 298 (3.4%) | 148 (1.6%) |
| $55,000 to $64,999 | 464 (5.3%) | 771 (8.3%) |
| $65,000 to $74,999 | 741 (8.4%) | 330 (3.6%) |
| $75,000 to $99,999 | 534 (6.1%) | 605 (6.5%) |
| $100,000+ | 691 (7.8%) | 670 (7.2%) |
| Total | 8,816 (100.0%) | 9,277 (100.0%) |
Earnings by Sex by Educational Attainment in Riviera Beach
Average earnings in Riviera Beach are $37,760 for men and $37,434 for women, a difference of 0.9%. Men with an educational attainment of graduate degree enjoy the highest average annual earnings of $64,516, while those with less than high school education earn the least with $29,375. Women with an educational attainment of graduate degree earn the most with the average annual earnings of $62,165, while those with less than high school education have the smallest earnings of $16,423.
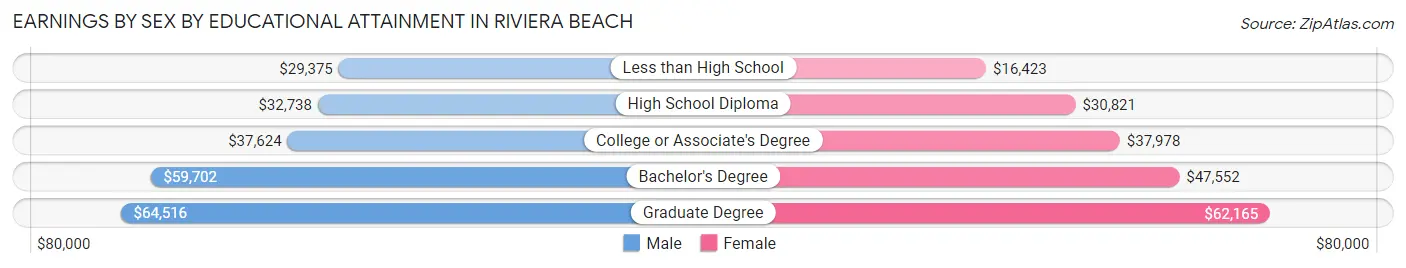
| Educational Attainment | Male Income | Female Income |
| Less than High School | $29,375 | $16,423 |
| High School Diploma | $32,738 | $30,821 |
| College or Associate's Degree | $37,624 | $37,978 |
| Bachelor's Degree | $59,702 | $47,552 |
| Graduate Degree | $64,516 | $62,165 |
| Total | $37,760 | $37,434 |
Family Income in Riviera Beach
Family Income Brackets in Riviera Beach
According to the Riviera Beach family income data, there are 1,647 families falling into the $50,000 to $74,999 income range, which is the most common income bracket and makes up 19.9% of all families. Conversely, the $10,000 to $14,999 income bracket is the least frequent group with only 223 families (2.7%) belonging to this category.
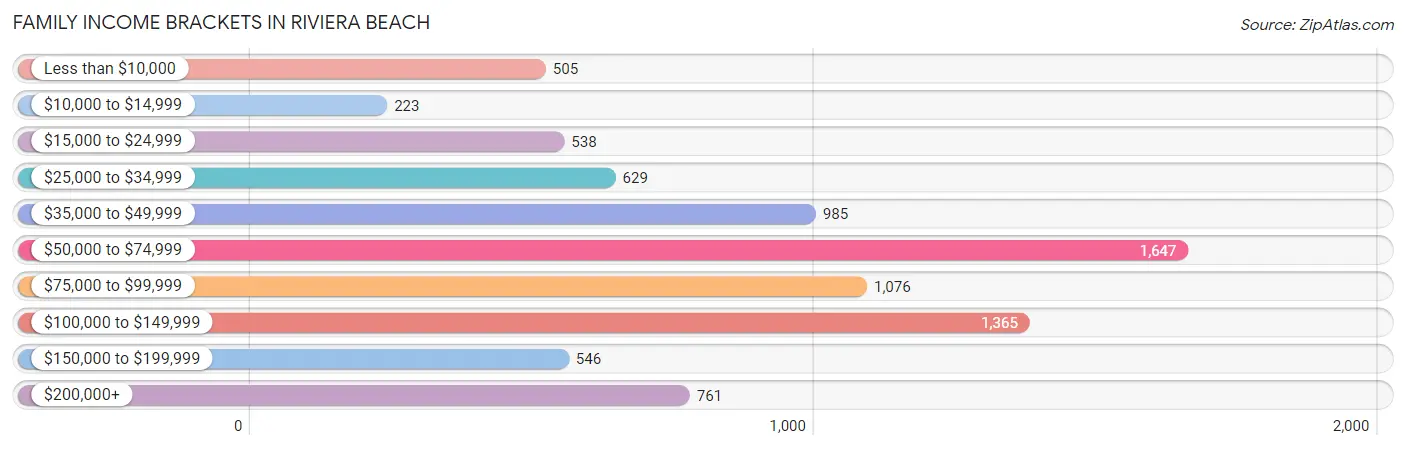
| Income Bracket | # Families | % Families |
| Less than $10,000 | 505 | 6.1% |
| $10,000 to $14,999 | 223 | 2.7% |
| $15,000 to $24,999 | 538 | 6.5% |
| $25,000 to $34,999 | 629 | 7.6% |
| $35,000 to $49,999 | 985 | 11.9% |
| $50,000 to $74,999 | 1,647 | 19.9% |
| $75,000 to $99,999 | 1,076 | 13.0% |
| $100,000 to $149,999 | 1,365 | 16.5% |
| $150,000 to $199,999 | 546 | 6.6% |
| $200,000+ | 761 | 9.2% |
Family Income by Famaliy Size in Riviera Beach
7+ person families (190 | 2.3%) account for the highest median family income in Riviera Beach with $153,229 per family, while 2-person families (3,622 | 43.8%) have the highest median income of $35,768 per family member.
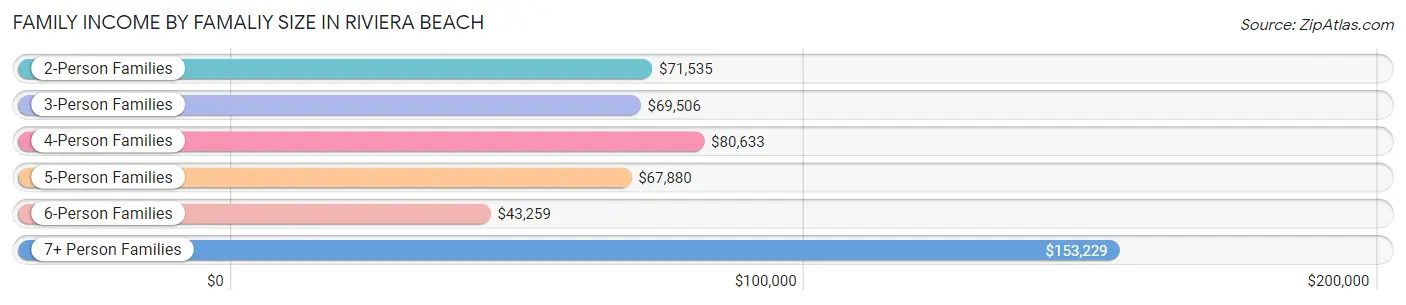
| Income Bracket | # Families | Median Income |
| 2-Person Families | 3,622 (43.8%) | $71,535 |
| 3-Person Families | 1,863 (22.5%) | $69,506 |
| 4-Person Families | 1,375 (16.6%) | $80,633 |
| 5-Person Families | 968 (11.7%) | $67,880 |
| 6-Person Families | 257 (3.1%) | $43,259 |
| 7+ Person Families | 190 (2.3%) | $153,229 |
| Total | 8,275 (100.0%) | $71,098 |
Family Income by Number of Earners in Riviera Beach
The median family income in Riviera Beach is $71,098, with families comprising 3+ earners (1,190) having the highest median family income of $118,403, while families with no earners (1,392) have the lowest median family income of $39,800, accounting for 14.4% and 16.8% of families, respectively.
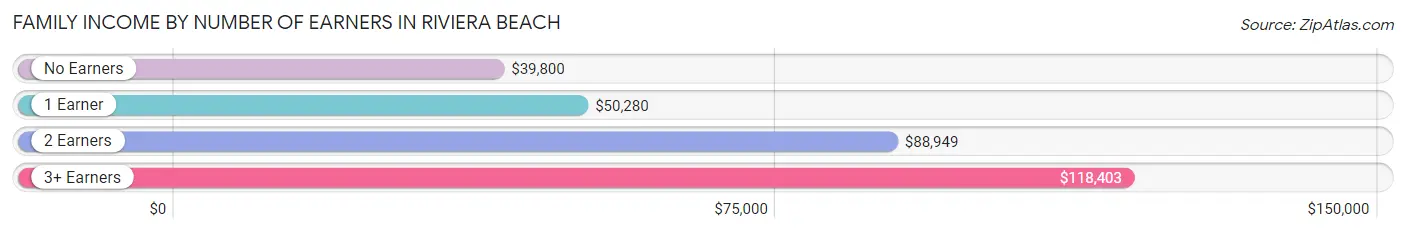
| Number of Earners | # Families | Median Income |
| No Earners | 1,392 (16.8%) | $39,800 |
| 1 Earner | 2,961 (35.8%) | $50,280 |
| 2 Earners | 2,732 (33.0%) | $88,949 |
| 3+ Earners | 1,190 (14.4%) | $118,403 |
| Total | 8,275 (100.0%) | $71,098 |
Household Income in Riviera Beach
Household Income Brackets in Riviera Beach
With 2,576 households falling in the category, the $50,000 to $74,999 income range is the most frequent in Riviera Beach, accounting for 19.2% of all households. In contrast, only 631 households (4.7%) fall into the $10,000 to $14,999 income bracket, making it the least populous group.
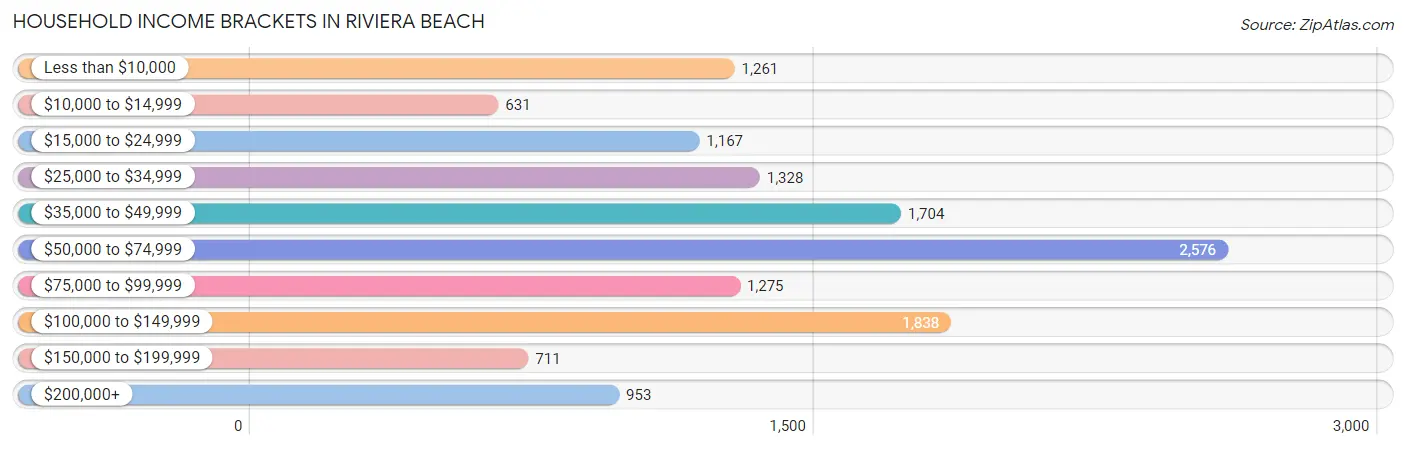
| Income Bracket | # Households | % Households |
| Less than $10,000 | 1,261 | 9.4% |
| $10,000 to $14,999 | 631 | 4.7% |
| $15,000 to $24,999 | 1,167 | 8.7% |
| $25,000 to $34,999 | 1,328 | 9.9% |
| $35,000 to $49,999 | 1,704 | 12.7% |
| $50,000 to $74,999 | 2,576 | 19.2% |
| $75,000 to $99,999 | 1,275 | 9.5% |
| $100,000 to $149,999 | 1,838 | 13.7% |
| $150,000 to $199,999 | 711 | 5.3% |
| $200,000+ | 953 | 7.1% |
Household Income by Householder Age in Riviera Beach
The median household income in Riviera Beach is $57,851, with the highest median household income of $62,364 found in the 45 to 64 years age bracket for the primary householder. A total of 5,328 households (39.7%) fall into this category. Meanwhile, the 15 to 24 years age bracket for the primary householder has the lowest median household income of $29,211, with 258 households (1.9%) in this group.
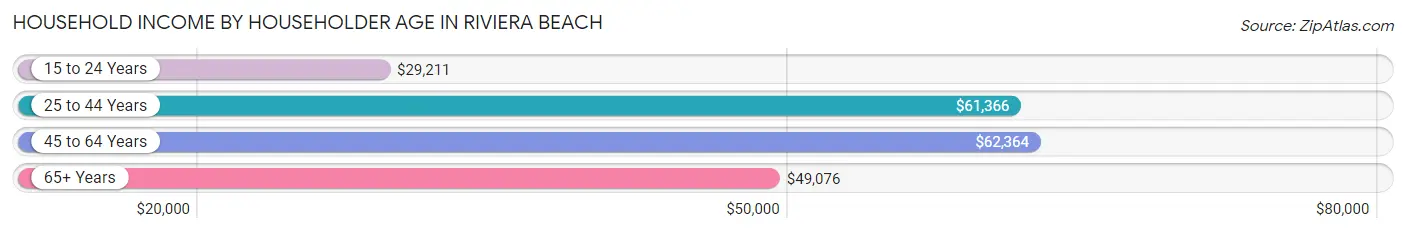
| Income Bracket | # Households | Median Income |
| 15 to 24 Years | 258 (1.9%) | $29,211 |
| 25 to 44 Years | 3,693 (27.5%) | $61,366 |
| 45 to 64 Years | 5,328 (39.7%) | $62,364 |
| 65+ Years | 4,137 (30.8%) | $49,076 |
| Total | 13,416 (100.0%) | $57,851 |
Poverty in Riviera Beach
Income Below Poverty by Sex and Age in Riviera Beach
With 18.4% poverty level for males and 21.5% for females among the residents of Riviera Beach, under 5 year old males and 5 year old females are the most vulnerable to poverty, with 450 males (33.3%) and 157 females (61.6%) in their respective age groups living below the poverty level.
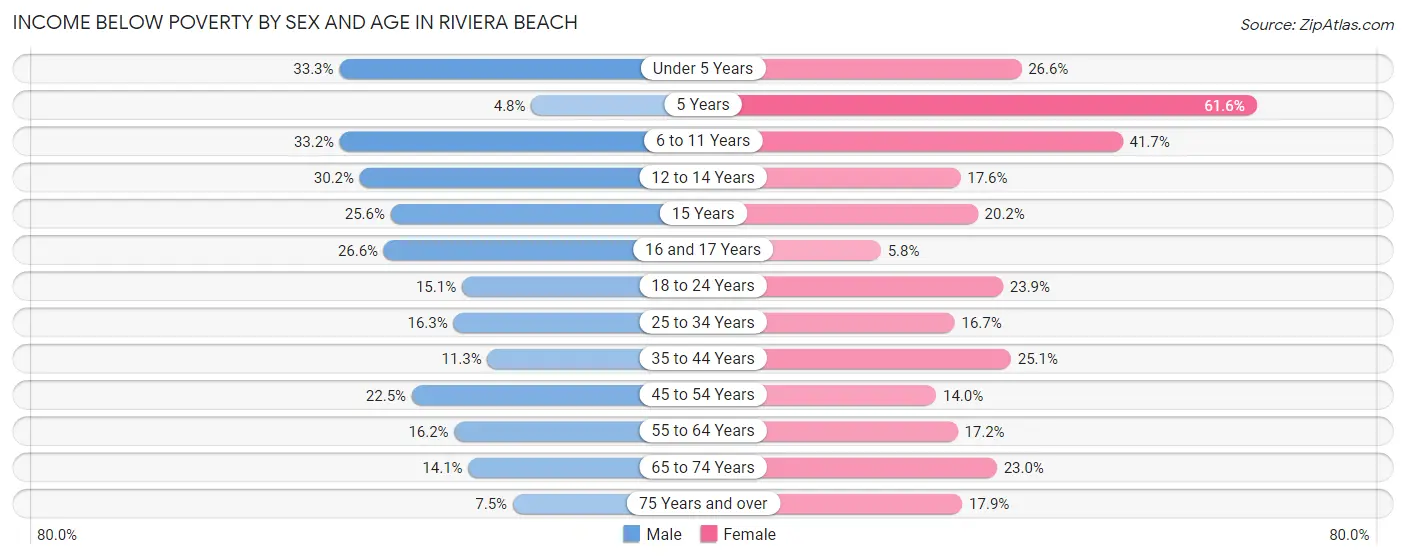
| Age Bracket | Male | Female |
| Under 5 Years | 450 (33.3%) | 316 (26.6%) |
| 5 Years | 20 (4.8%) | 157 (61.6%) |
| 6 to 11 Years | 400 (33.2%) | 554 (41.7%) |
| 12 to 14 Years | 191 (30.2%) | 138 (17.6%) |
| 15 Years | 52 (25.6%) | 71 (20.2%) |
| 16 and 17 Years | 138 (26.6%) | 19 (5.8%) |
| 18 to 24 Years | 209 (15.0%) | 354 (23.9%) |
| 25 to 34 Years | 446 (16.3%) | 443 (16.7%) |
| 35 to 44 Years | 230 (11.3%) | 544 (25.1%) |
| 45 to 54 Years | 417 (22.5%) | 328 (14.0%) |
| 55 to 64 Years | 438 (16.2%) | 498 (17.2%) |
| 65 to 74 Years | 193 (14.1%) | 408 (23.0%) |
| 75 Years and over | 106 (7.5%) | 324 (17.9%) |
| Total | 3,290 (18.4%) | 4,154 (21.5%) |
Income Above Poverty by Sex and Age in Riviera Beach
According to the poverty statistics in Riviera Beach, males aged 5 years and females aged 16 and 17 years are the age groups that are most secure financially, with 95.3% of males and 94.2% of females in these age groups living above the poverty line.
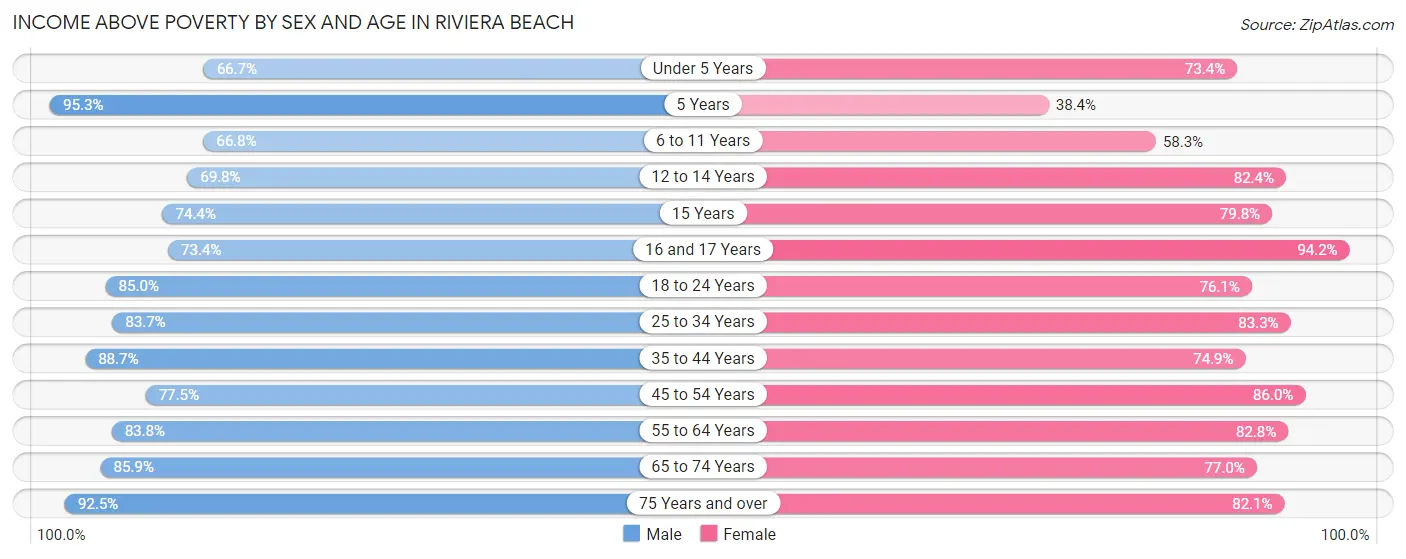
| Age Bracket | Male | Female |
| Under 5 Years | 903 (66.7%) | 870 (73.4%) |
| 5 Years | 401 (95.3%) | 98 (38.4%) |
| 6 to 11 Years | 806 (66.8%) | 775 (58.3%) |
| 12 to 14 Years | 441 (69.8%) | 646 (82.4%) |
| 15 Years | 151 (74.4%) | 281 (79.8%) |
| 16 and 17 Years | 380 (73.4%) | 310 (94.2%) |
| 18 to 24 Years | 1,180 (85.0%) | 1,126 (76.1%) |
| 25 to 34 Years | 2,289 (83.7%) | 2,204 (83.3%) |
| 35 to 44 Years | 1,812 (88.7%) | 1,623 (74.9%) |
| 45 to 54 Years | 1,437 (77.5%) | 2,015 (86.0%) |
| 55 to 64 Years | 2,270 (83.8%) | 2,402 (82.8%) |
| 65 to 74 Years | 1,176 (85.9%) | 1,366 (77.0%) |
| 75 Years and over | 1,309 (92.5%) | 1,489 (82.1%) |
| Total | 14,555 (81.6%) | 15,205 (78.5%) |
Income Below Poverty Among Married-Couple Families in Riviera Beach
The poverty statistics for married-couple families in Riviera Beach show that 8.3% or 386 of the total 4,644 families live below the poverty line. Families with 5 or more children have the highest poverty rate of 84.2%, comprising of 32 families. On the other hand, families with no children have the lowest poverty rate of 5.8%, which includes 162 families.
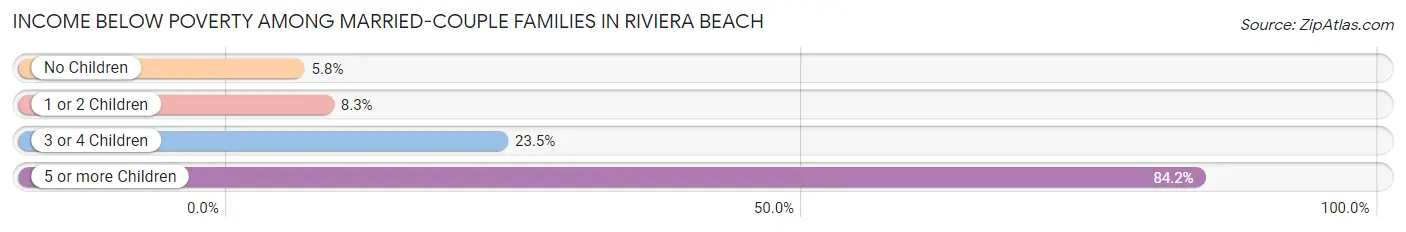
| Children | Above Poverty | Below Poverty |
| No Children | 2,629 (94.2%) | 162 (5.8%) |
| 1 or 2 Children | 1,418 (91.7%) | 129 (8.3%) |
| 3 or 4 Children | 205 (76.5%) | 63 (23.5%) |
| 5 or more Children | 6 (15.8%) | 32 (84.2%) |
| Total | 4,258 (91.7%) | 386 (8.3%) |
Income Below Poverty Among Single-Parent Households in Riviera Beach
According to the poverty data in Riviera Beach, 16.0% or 114 single-father households and 26.5% or 773 single-mother households are living below the poverty line. Among single-father households, those with 3 or 4 children have the highest poverty rate, with 37 households (23.1%) experiencing poverty. Likewise, among single-mother households, those with 3 or 4 children have the highest poverty rate, with 164 households (42.5%) falling below the poverty line.
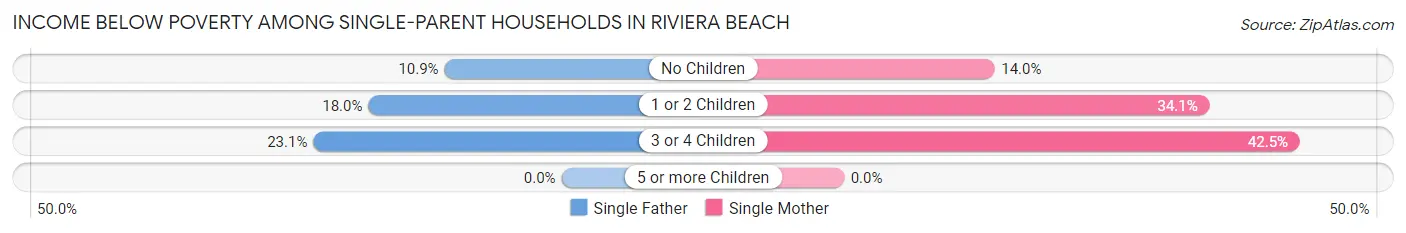
| Children | Single Father | Single Mother |
| No Children | 34 (10.9%) | 178 (14.0%) |
| 1 or 2 Children | 43 (18.0%) | 431 (34.1%) |
| 3 or 4 Children | 37 (23.1%) | 164 (42.5%) |
| 5 or more Children | 0 (0.0%) | 0 (0.0%) |
| Total | 114 (16.0%) | 773 (26.5%) |
Income Below Poverty Among Married-Couple vs Single-Parent Households in Riviera Beach
The poverty data for Riviera Beach shows that 386 of the married-couple family households (8.3%) and 887 of the single-parent households (24.4%) are living below the poverty level. Within the married-couple family households, those with 5 or more children have the highest poverty rate, with 32 households (84.2%) falling below the poverty line. Among the single-parent households, those with 3 or 4 children have the highest poverty rate, with 201 household (36.8%) living below poverty.
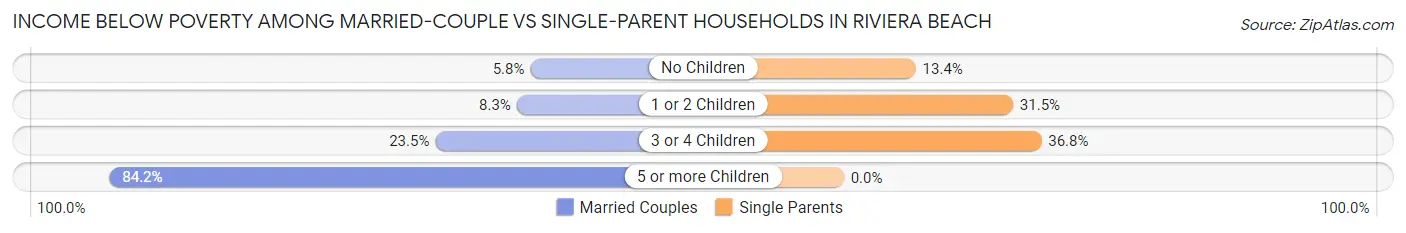
| Children | Married-Couple Families | Single-Parent Households |
| No Children | 162 (5.8%) | 212 (13.4%) |
| 1 or 2 Children | 129 (8.3%) | 474 (31.5%) |
| 3 or 4 Children | 63 (23.5%) | 201 (36.8%) |
| 5 or more Children | 32 (84.2%) | 0 (0.0%) |
| Total | 386 (8.3%) | 887 (24.4%) |
Employment Characteristics in Riviera Beach
Employment by Class of Employer in Riviera Beach
Among the 16,412 employed individuals in Riviera Beach, private company employees (11,875 | 72.4%), local government employees (1,331 | 8.1%), and self-employed (incorporated) (969 | 5.9%) make up the most common classes of employment.
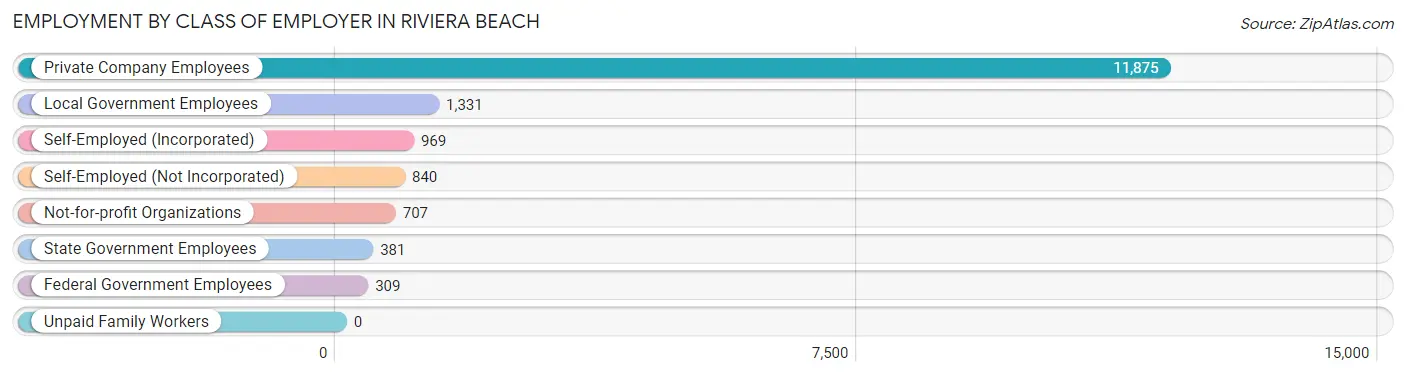
| Employer Class | # Employees | % Employees |
| Private Company Employees | 11,875 | 72.4% |
| Self-Employed (Incorporated) | 969 | 5.9% |
| Self-Employed (Not Incorporated) | 840 | 5.1% |
| Not-for-profit Organizations | 707 | 4.3% |
| Local Government Employees | 1,331 | 8.1% |
| State Government Employees | 381 | 2.3% |
| Federal Government Employees | 309 | 1.9% |
| Unpaid Family Workers | 0 | 0.0% |
| Total | 16,412 | 100.0% |
Employment Status by Age in Riviera Beach
According to the labor force statistics for Riviera Beach, out of the total population over 16 years of age (29,775), 61.6% or 18,341 individuals are in the labor force, with 9.2% or 1,687 of them unemployed. The age group with the highest labor force participation rate is 35 to 44 years, with 88.8% or 3,746 individuals in the labor force. Within the labor force, the 20 to 24 years age range has the highest percentage of unemployed individuals, with 20.5% or 310 of them being unemployed.
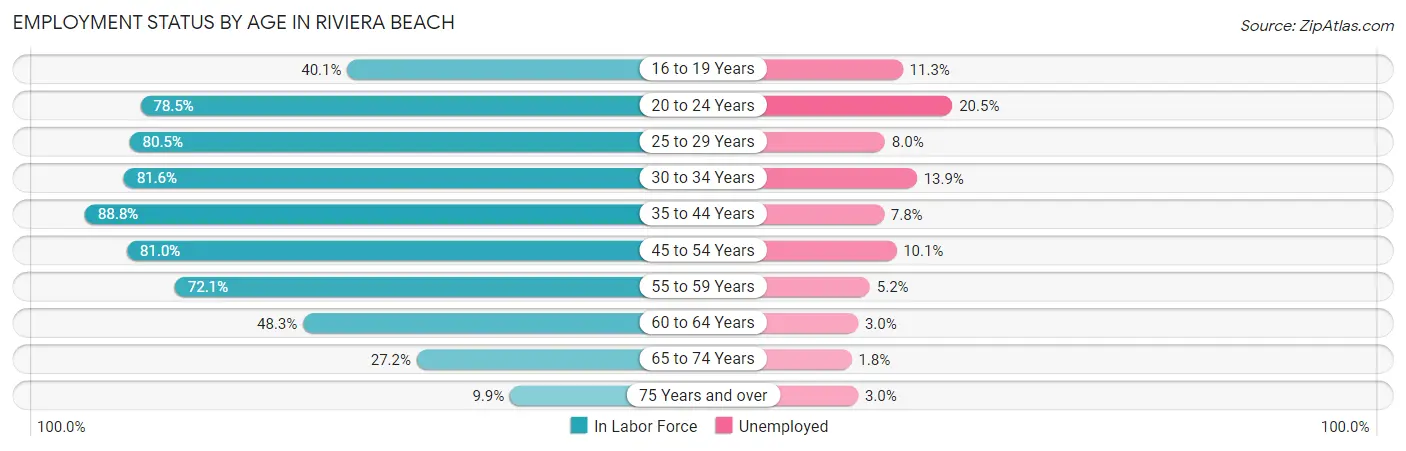
| Age Bracket | In Labor Force | Unemployed |
| 16 to 19 Years | 719 (40.1%) | 81 (11.3%) |
| 20 to 24 Years | 1,513 (78.5%) | 310 (20.5%) |
| 25 to 29 Years | 2,112 (80.5%) | 169 (8.0%) |
| 30 to 34 Years | 2,251 (81.6%) | 313 (13.9%) |
| 35 to 44 Years | 3,746 (88.8%) | 292 (7.8%) |
| 45 to 54 Years | 3,428 (81.0%) | 346 (10.1%) |
| 55 to 59 Years | 1,956 (72.1%) | 102 (5.2%) |
| 60 to 64 Years | 1,414 (48.3%) | 42 (3.0%) |
| 65 to 74 Years | 882 (27.2%) | 16 (1.8%) |
| 75 Years and over | 330 (9.9%) | 10 (3.0%) |
| Total | 18,341 (61.6%) | 1,687 (9.2%) |
Employment Status by Educational Attainment in Riviera Beach
According to labor force statistics for Riviera Beach, 76.5% of individuals (14,896) out of the total population between 25 and 64 years of age (19,472) are in the labor force, with 8.5% or 1,266 of them being unemployed. The group with the highest labor force participation rate are those with the educational attainment of bachelor's degree or higher, with 85.0% or 4,302 individuals in the labor force. Within the labor force, individuals with less than high school education have the highest percentage of unemployment, with 21.0% or 311 of them being unemployed.
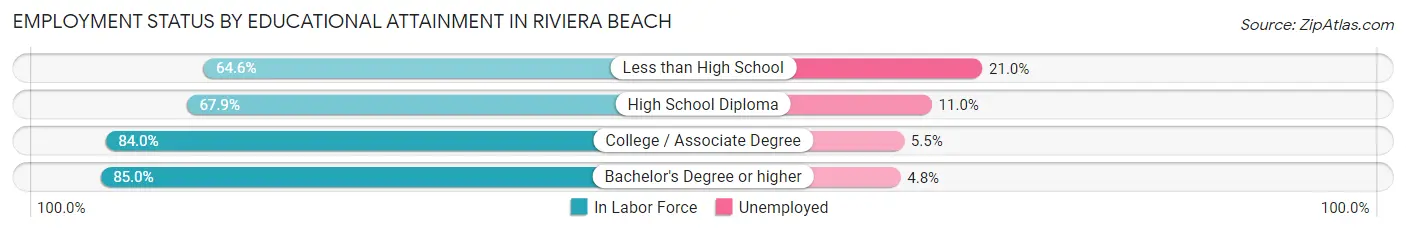
| Educational Attainment | In Labor Force | Unemployed |
| Less than High School | 1,483 (64.6%) | 482 (21.0%) |
| High School Diploma | 4,454 (67.9%) | 722 (11.0%) |
| College / Associate Degree | 4,667 (84.0%) | 306 (5.5%) |
| Bachelor's Degree or higher | 4,302 (85.0%) | 243 (4.8%) |
| Total | 14,896 (76.5%) | 1,655 (8.5%) |
Employment Occupations by Sex in Riviera Beach
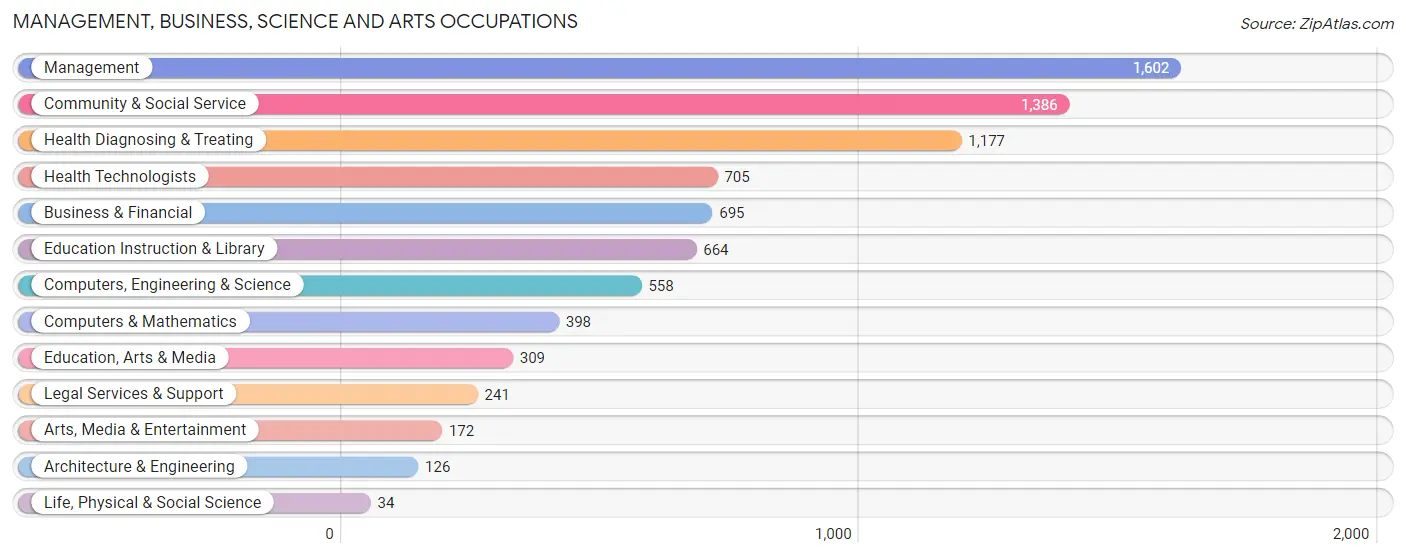
Management, Business, Science and Arts Occupations
The most common Management, Business, Science and Arts occupations in Riviera Beach are Management (1,602 | 9.6%), Community & Social Service (1,386 | 8.3%), Health Diagnosing & Treating (1,177 | 7.1%), Health Technologists (705 | 4.2%), and Business & Financial (695 | 4.2%).
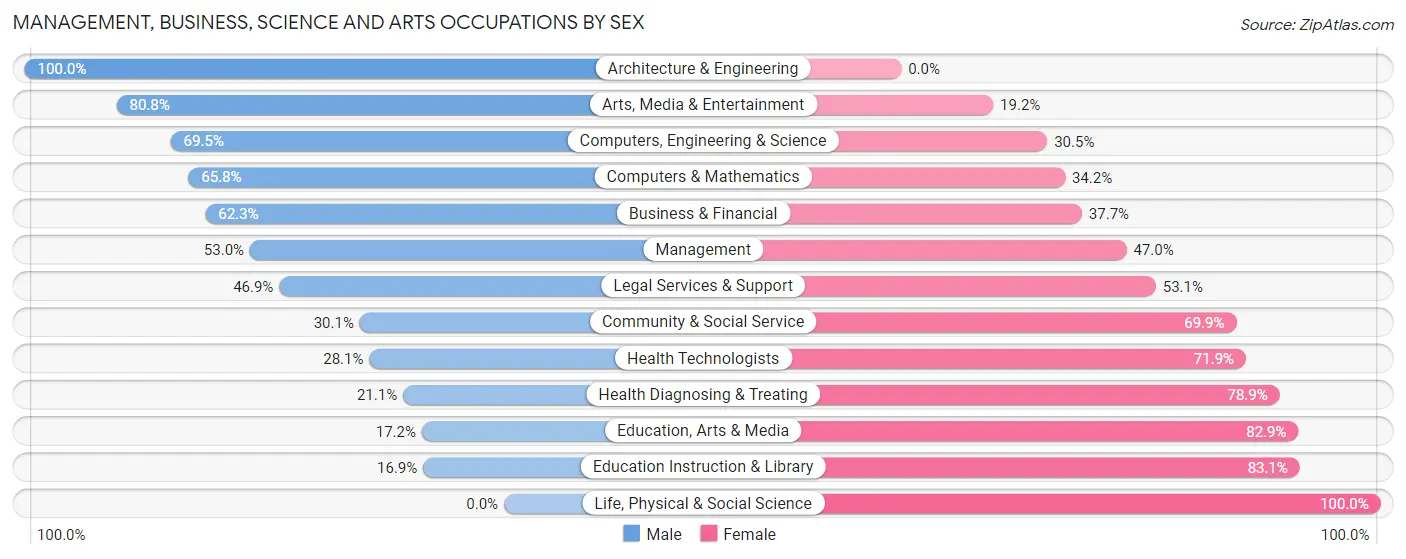
Management, Business, Science and Arts Occupations by Sex
Within the Management, Business, Science and Arts occupations in Riviera Beach, the most male-oriented occupations are Architecture & Engineering (100.0%), Arts, Media & Entertainment (80.8%), and Computers, Engineering & Science (69.5%), while the most female-oriented occupations are Life, Physical & Social Science (100.0%), Education Instruction & Library (83.1%), and Education, Arts & Media (82.9%).
| Occupation | Male | Female |
| Management | 849 (53.0%) | 753 (47.0%) |
| Business & Financial | 433 (62.3%) | 262 (37.7%) |
| Computers, Engineering & Science | 388 (69.5%) | 170 (30.5%) |
| Computers & Mathematics | 262 (65.8%) | 136 (34.2%) |
| Architecture & Engineering | 126 (100.0%) | 0 (0.0%) |
| Life, Physical & Social Science | 0 (0.0%) | 34 (100.0%) |
| Community & Social Service | 417 (30.1%) | 969 (69.9%) |
| Education, Arts & Media | 53 (17.2%) | 256 (82.9%) |
| Legal Services & Support | 113 (46.9%) | 128 (53.1%) |
| Education Instruction & Library | 112 (16.9%) | 552 (83.1%) |
| Arts, Media & Entertainment | 139 (80.8%) | 33 (19.2%) |
| Health Diagnosing & Treating | 248 (21.1%) | 929 (78.9%) |
| Health Technologists | 198 (28.1%) | 507 (71.9%) |
| Total (Category) | 2,335 (43.1%) | 3,083 (56.9%) |
| Total (Overall) | 8,004 (48.0%) | 8,655 (51.9%) |
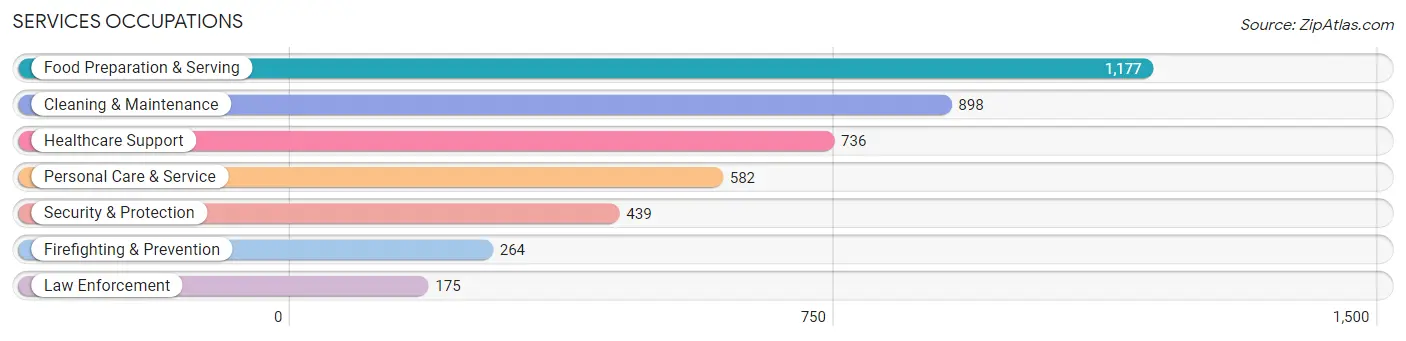
Services Occupations
The most common Services occupations in Riviera Beach are Food Preparation & Serving (1,177 | 7.1%), Cleaning & Maintenance (898 | 5.4%), Healthcare Support (736 | 4.4%), Personal Care & Service (582 | 3.5%), and Security & Protection (439 | 2.6%).
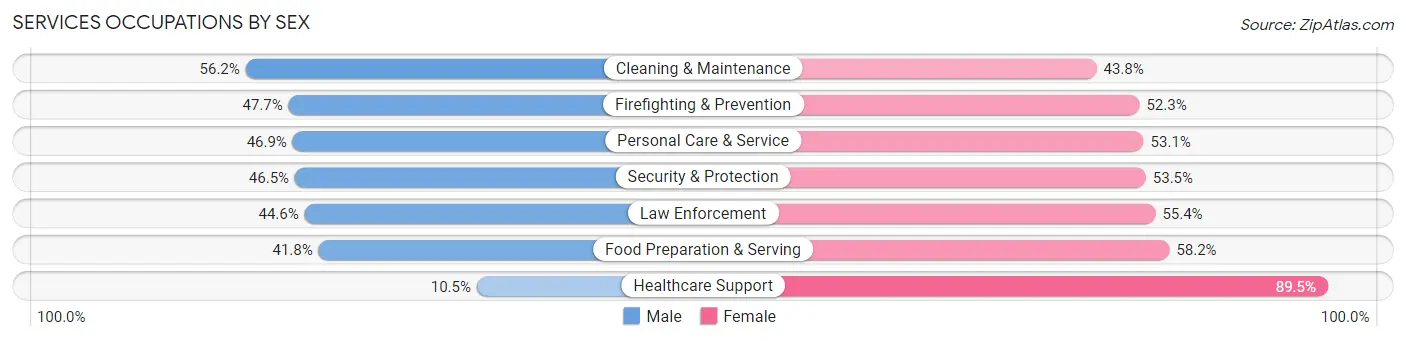
Services Occupations by Sex
Within the Services occupations in Riviera Beach, the most male-oriented occupations are Cleaning & Maintenance (56.2%), Firefighting & Prevention (47.7%), and Personal Care & Service (46.9%), while the most female-oriented occupations are Healthcare Support (89.5%), Food Preparation & Serving (58.2%), and Law Enforcement (55.4%).
| Occupation | Male | Female |
| Healthcare Support | 77 (10.5%) | 659 (89.5%) |
| Security & Protection | 204 (46.5%) | 235 (53.5%) |
| Firefighting & Prevention | 126 (47.7%) | 138 (52.3%) |
| Law Enforcement | 78 (44.6%) | 97 (55.4%) |
| Food Preparation & Serving | 492 (41.8%) | 685 (58.2%) |
| Cleaning & Maintenance | 505 (56.2%) | 393 (43.8%) |
| Personal Care & Service | 273 (46.9%) | 309 (53.1%) |
| Total (Category) | 1,551 (40.5%) | 2,281 (59.5%) |
| Total (Overall) | 8,004 (48.0%) | 8,655 (51.9%) |
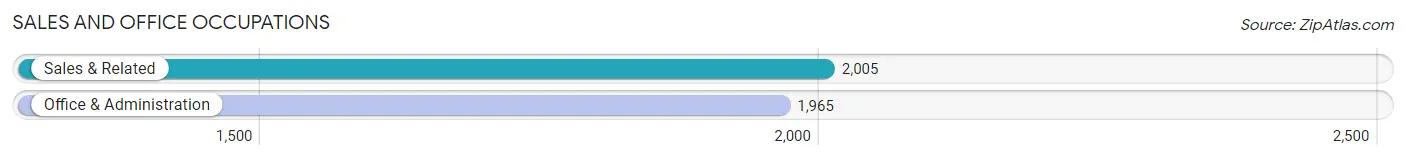
Sales and Office Occupations
The most common Sales and Office occupations in Riviera Beach are Sales & Related (2,005 | 12.0%), and Office & Administration (1,965 | 11.8%).
Sales and Office Occupations by Sex
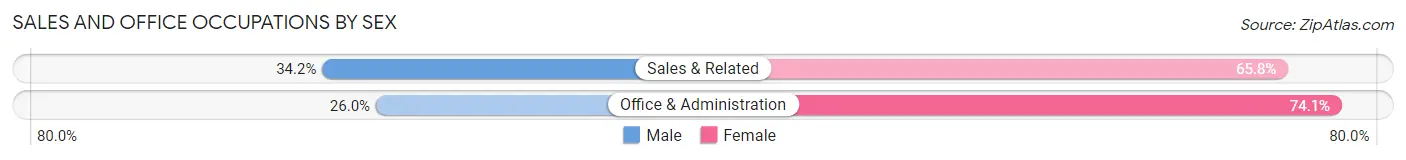
| Occupation | Male | Female |
| Sales & Related | 686 (34.2%) | 1,319 (65.8%) |
| Office & Administration | 510 (26.0%) | 1,455 (74.1%) |
| Total (Category) | 1,196 (30.1%) | 2,774 (69.9%) |
| Total (Overall) | 8,004 (48.0%) | 8,655 (51.9%) |
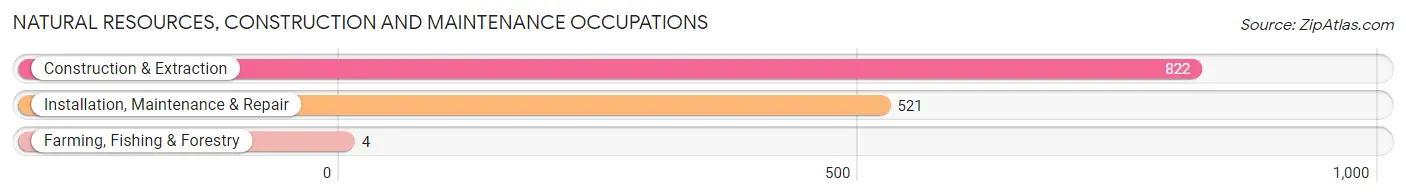
Natural Resources, Construction and Maintenance Occupations
The most common Natural Resources, Construction and Maintenance occupations in Riviera Beach are Construction & Extraction (822 | 4.9%), Installation, Maintenance & Repair (521 | 3.1%), and Farming, Fishing & Forestry (4 | 0.0%).
Natural Resources, Construction and Maintenance Occupations by Sex
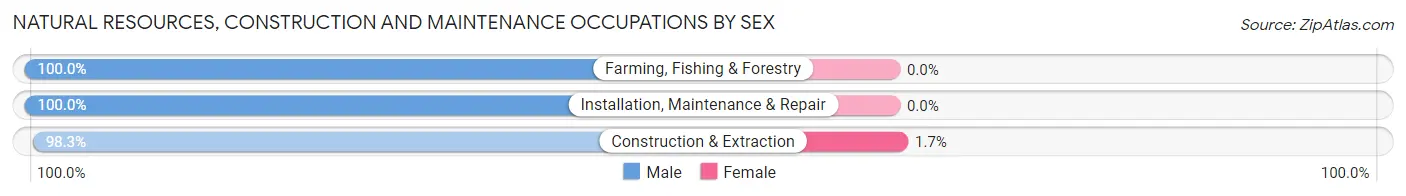
| Occupation | Male | Female |
| Farming, Fishing & Forestry | 4 (100.0%) | 0 (0.0%) |
| Construction & Extraction | 808 (98.3%) | 14 (1.7%) |
| Installation, Maintenance & Repair | 521 (100.0%) | 0 (0.0%) |
| Total (Category) | 1,333 (99.0%) | 14 (1.0%) |
| Total (Overall) | 8,004 (48.0%) | 8,655 (51.9%) |
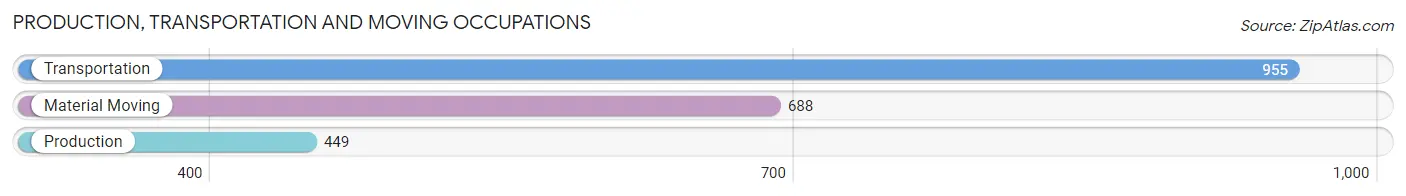
Production, Transportation and Moving Occupations
The most common Production, Transportation and Moving occupations in Riviera Beach are Transportation (955 | 5.7%), Material Moving (688 | 4.1%), and Production (449 | 2.7%).
Production, Transportation and Moving Occupations by Sex
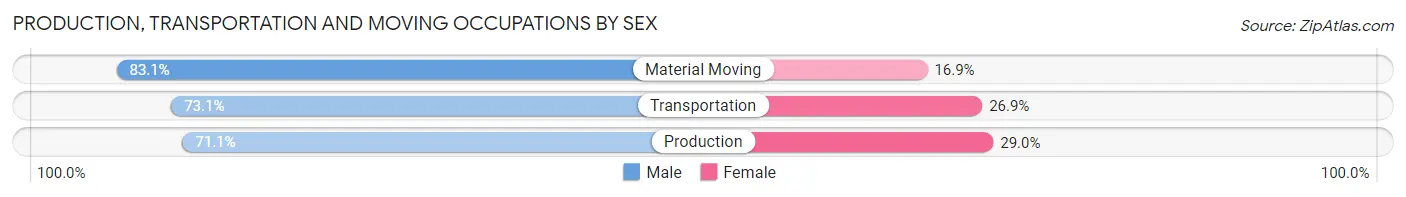
| Occupation | Male | Female |
| Production | 319 (71.1%) | 130 (28.9%) |
| Transportation | 698 (73.1%) | 257 (26.9%) |
| Material Moving | 572 (83.1%) | 116 (16.9%) |
| Total (Category) | 1,589 (76.0%) | 503 (24.0%) |
| Total (Overall) | 8,004 (48.0%) | 8,655 (51.9%) |
Employment Industries by Sex in Riviera Beach
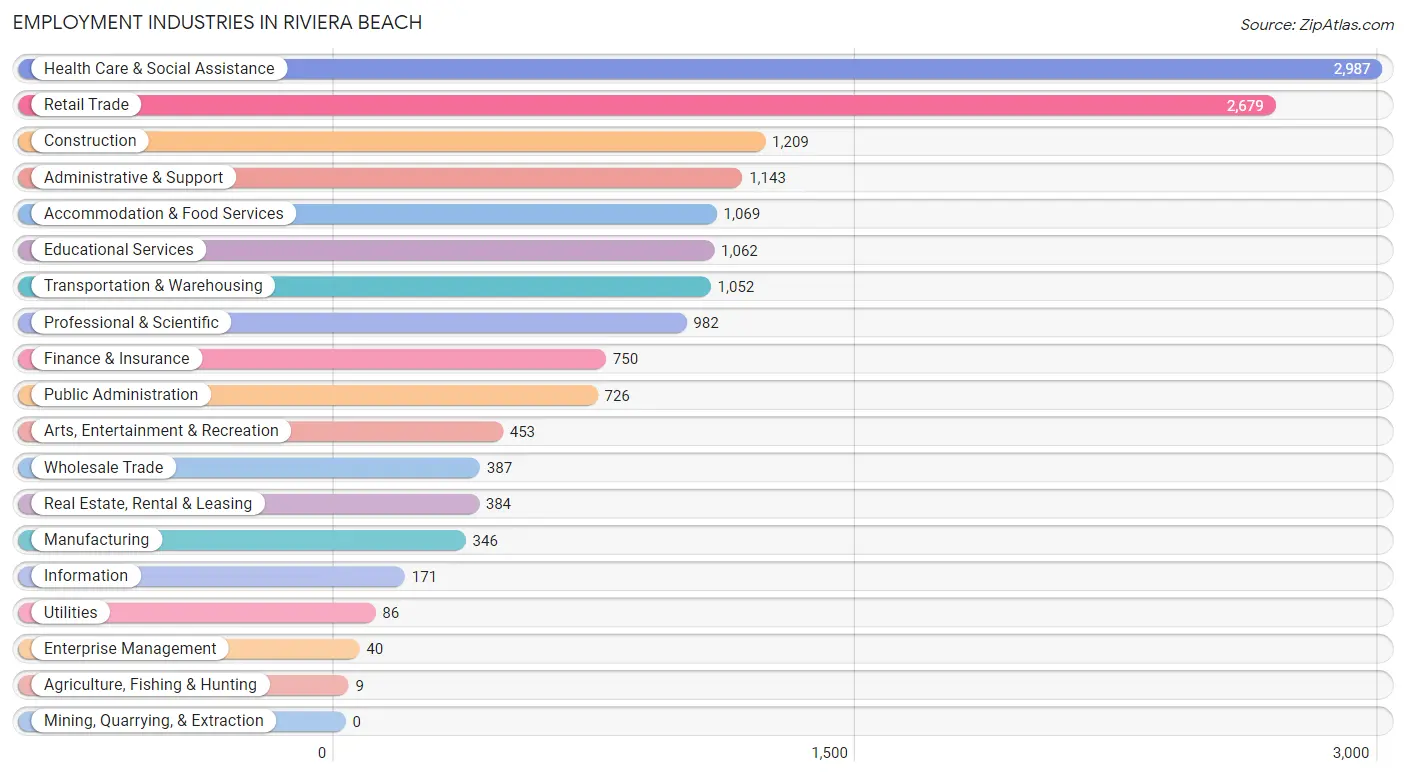
Employment Industries in Riviera Beach
The major employment industries in Riviera Beach include Health Care & Social Assistance (2,987 | 17.9%), Retail Trade (2,679 | 16.1%), Construction (1,209 | 7.3%), Administrative & Support (1,143 | 6.9%), and Accommodation & Food Services (1,069 | 6.4%).
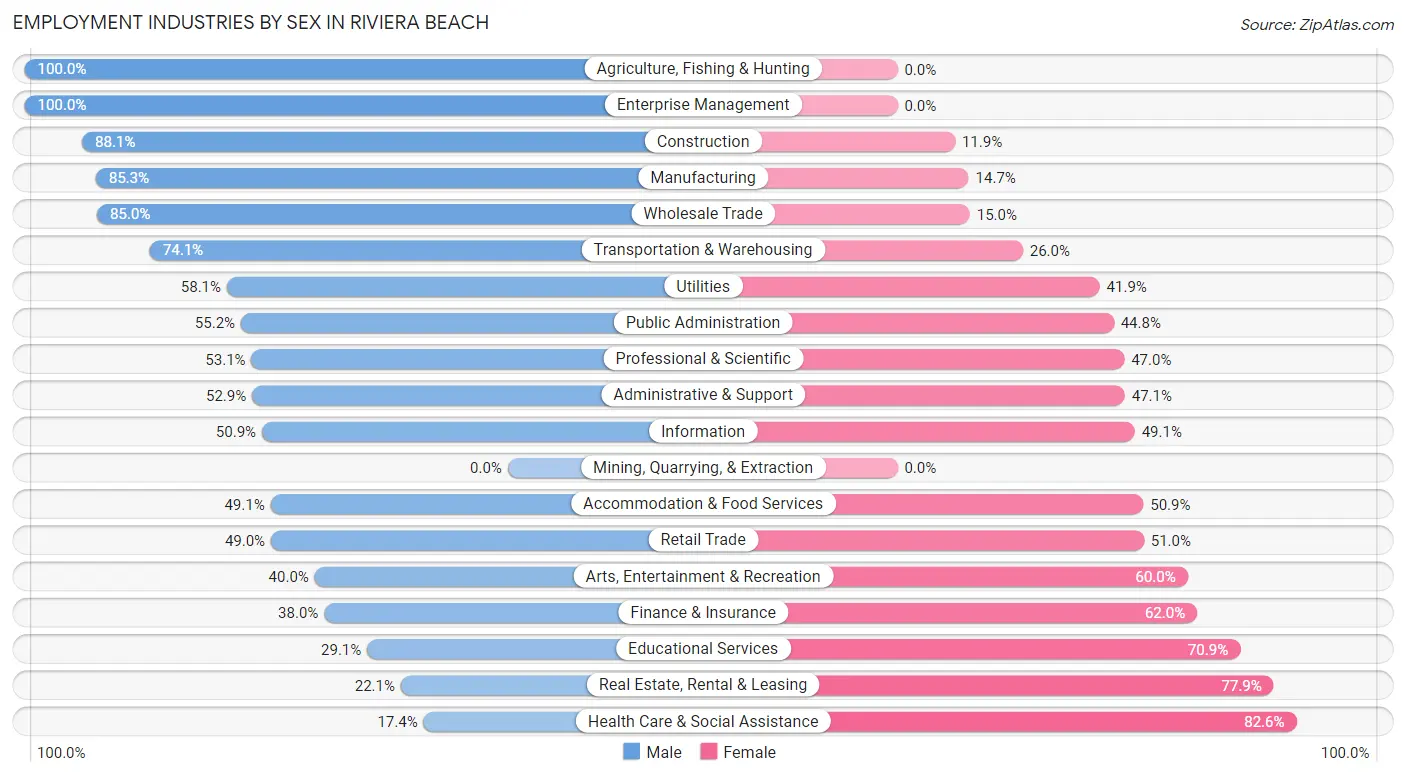
Employment Industries by Sex in Riviera Beach
The Riviera Beach industries that see more men than women are Agriculture, Fishing & Hunting (100.0%), Enterprise Management (100.0%), and Construction (88.1%), whereas the industries that tend to have a higher number of women are Health Care & Social Assistance (82.6%), Real Estate, Rental & Leasing (77.9%), and Educational Services (70.9%).
| Industry | Male | Female |
| Agriculture, Fishing & Hunting | 9 (100.0%) | 0 (0.0%) |
| Mining, Quarrying, & Extraction | 0 (0.0%) | 0 (0.0%) |
| Construction | 1,065 (88.1%) | 144 (11.9%) |
| Manufacturing | 295 (85.3%) | 51 (14.7%) |
| Wholesale Trade | 329 (85.0%) | 58 (15.0%) |
| Retail Trade | 1,313 (49.0%) | 1,366 (51.0%) |
| Transportation & Warehousing | 779 (74.1%) | 273 (26.0%) |
| Utilities | 50 (58.1%) | 36 (41.9%) |
| Information | 87 (50.9%) | 84 (49.1%) |
| Finance & Insurance | 285 (38.0%) | 465 (62.0%) |
| Real Estate, Rental & Leasing | 85 (22.1%) | 299 (77.9%) |
| Professional & Scientific | 521 (53.0%) | 461 (46.9%) |
| Enterprise Management | 40 (100.0%) | 0 (0.0%) |
| Administrative & Support | 605 (52.9%) | 538 (47.1%) |
| Educational Services | 309 (29.1%) | 753 (70.9%) |
| Health Care & Social Assistance | 521 (17.4%) | 2,466 (82.6%) |
| Arts, Entertainment & Recreation | 181 (40.0%) | 272 (60.0%) |
| Accommodation & Food Services | 525 (49.1%) | 544 (50.9%) |
| Public Administration | 401 (55.2%) | 325 (44.8%) |
| Total | 8,004 (48.0%) | 8,655 (51.9%) |
Education in Riviera Beach
School Enrollment in Riviera Beach
The most common levels of schooling among the 9,057 students in Riviera Beach are high school (2,107 | 23.3%), elementary school (1,855 | 20.5%), and middle school (1,789 | 19.8%).
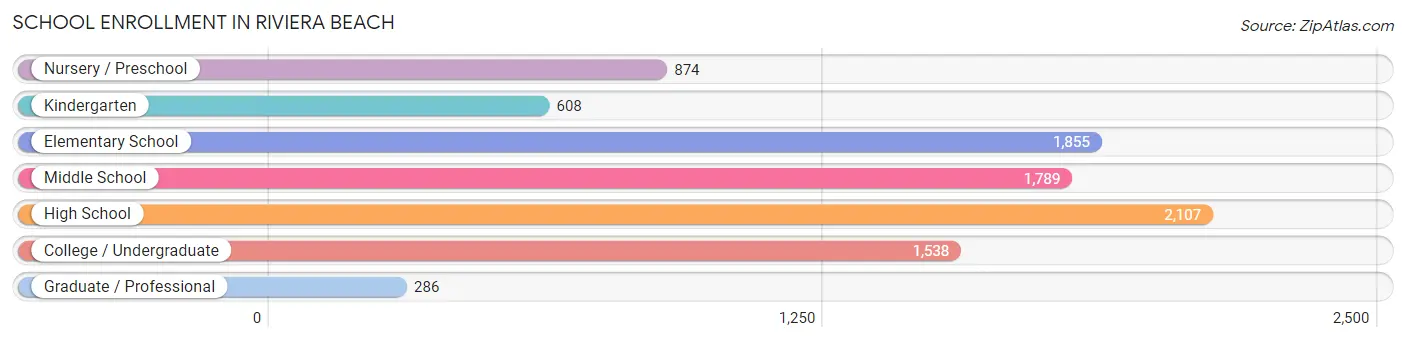
| School Level | # Students | % Students |
| Nursery / Preschool | 874 | 9.7% |
| Kindergarten | 608 | 6.7% |
| Elementary School | 1,855 | 20.5% |
| Middle School | 1,789 | 19.8% |
| High School | 2,107 | 23.3% |
| College / Undergraduate | 1,538 | 17.0% |
| Graduate / Professional | 286 | 3.2% |
| Total | 9,057 | 100.0% |
School Enrollment by Age by Funding Source in Riviera Beach
Out of a total of 9,057 students who are enrolled in schools in Riviera Beach, 1,485 (16.4%) attend a private institution, while the remaining 7,572 (83.6%) are enrolled in public schools. The age group of 25 to 34 year olds has the highest likelihood of being enrolled in private schools, with 249 (39.8% in the age bracket) enrolled. Conversely, the age group of 18 to 19 year olds has the lowest likelihood of being enrolled in a private school, with 603 (93.8% in the age bracket) attending a public institution.
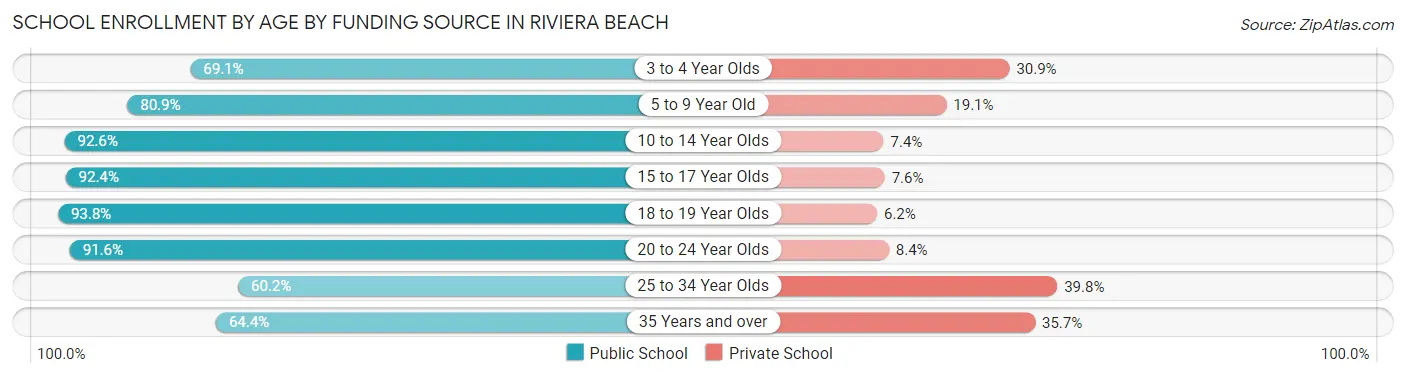
| Age Bracket | Public School | Private School |
| 3 to 4 Year Olds | 488 (69.1%) | 218 (30.9%) |
| 5 to 9 Year Old | 2,008 (80.9%) | 475 (19.1%) |
| 10 to 14 Year Olds | 1,966 (92.6%) | 158 (7.4%) |
| 15 to 17 Year Olds | 1,221 (92.4%) | 101 (7.6%) |
| 18 to 19 Year Olds | 603 (93.8%) | 40 (6.2%) |
| 20 to 24 Year Olds | 555 (91.6%) | 51 (8.4%) |
| 25 to 34 Year Olds | 377 (60.2%) | 249 (39.8%) |
| 35 Years and over | 352 (64.3%) | 195 (35.6%) |
| Total | 7,572 (83.6%) | 1,485 (16.4%) |
Educational Attainment by Field of Study in Riviera Beach
Business (1,762 | 23.7%), science & technology (911 | 12.2%), education (766 | 10.3%), social sciences (709 | 9.5%), and engineering (619 | 8.3%) are the most common fields of study among 7,439 individuals in Riviera Beach who have obtained a bachelor's degree or higher.
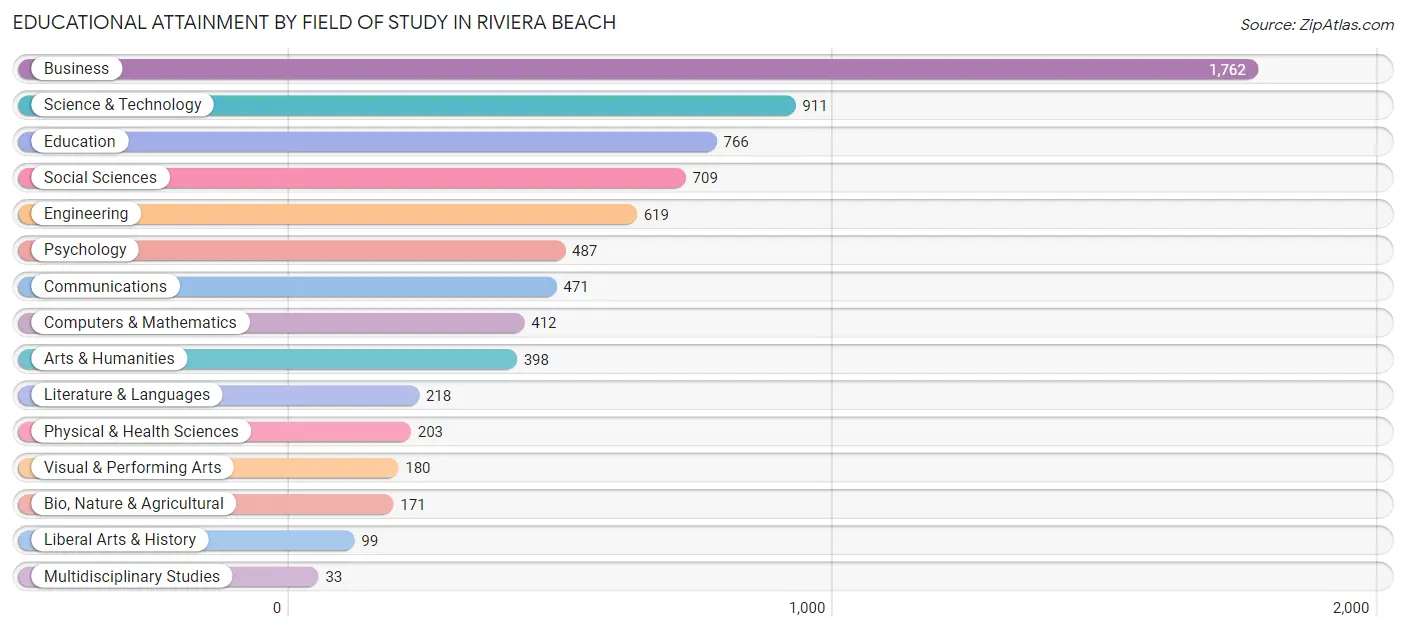
| Field of Study | # Graduates | % Graduates |
| Computers & Mathematics | 412 | 5.5% |
| Bio, Nature & Agricultural | 171 | 2.3% |
| Physical & Health Sciences | 203 | 2.7% |
| Psychology | 487 | 6.6% |
| Social Sciences | 709 | 9.5% |
| Engineering | 619 | 8.3% |
| Multidisciplinary Studies | 33 | 0.4% |
| Science & Technology | 911 | 12.2% |
| Business | 1,762 | 23.7% |
| Education | 766 | 10.3% |
| Literature & Languages | 218 | 2.9% |
| Liberal Arts & History | 99 | 1.3% |
| Visual & Performing Arts | 180 | 2.4% |
| Communications | 471 | 6.3% |
| Arts & Humanities | 398 | 5.3% |
| Total | 7,439 | 100.0% |
Transportation & Commute in Riviera Beach
Vehicle Availability by Sex in Riviera Beach
The most prevalent vehicle ownership categories in Riviera Beach are males with 2 vehicles (3,720, accounting for 46.8%) and females with 2 vehicles (3,351, making up 44.2%).
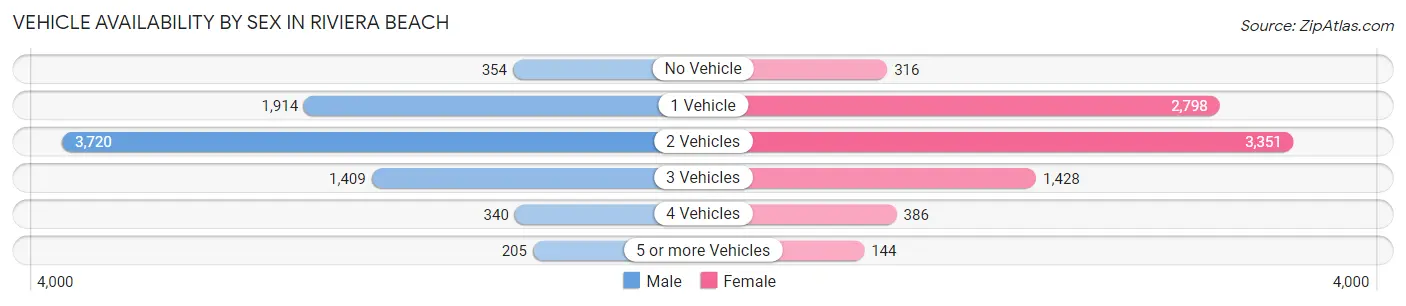
| Vehicles Available | Male | Female |
| No Vehicle | 354 (4.5%) | 316 (3.7%) |
| 1 Vehicle | 1,914 (24.1%) | 2,798 (33.2%) |
| 2 Vehicles | 3,720 (46.8%) | 3,351 (39.8%) |
| 3 Vehicles | 1,409 (17.7%) | 1,428 (17.0%) |
| 4 Vehicles | 340 (4.3%) | 386 (4.6%) |
| 5 or more Vehicles | 205 (2.6%) | 144 (1.7%) |
| Total | 7,942 (100.0%) | 8,423 (100.0%) |
Commute Time in Riviera Beach
The most frequently occuring commute durations in Riviera Beach are 15 to 19 minutes (2,931 commuters, 19.5%), 10 to 14 minutes (2,342 commuters, 15.6%), and 20 to 24 minutes (2,290 commuters, 15.2%).
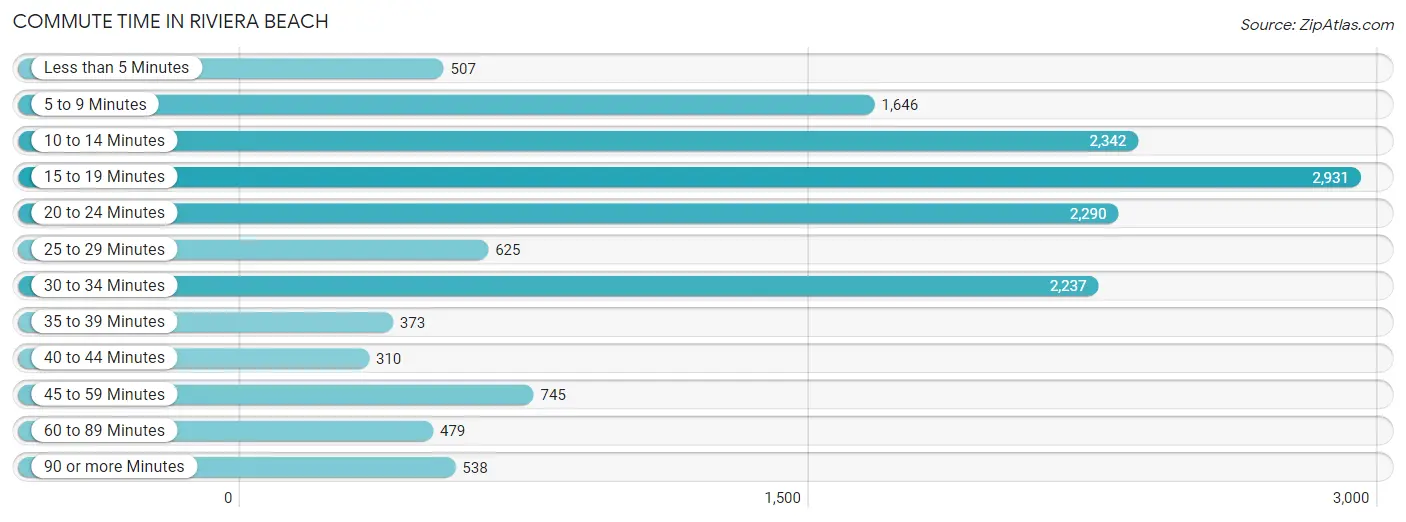
| Commute Time | # Commuters | % Commuters |
| Less than 5 Minutes | 507 | 3.4% |
| 5 to 9 Minutes | 1,646 | 11.0% |
| 10 to 14 Minutes | 2,342 | 15.6% |
| 15 to 19 Minutes | 2,931 | 19.5% |
| 20 to 24 Minutes | 2,290 | 15.2% |
| 25 to 29 Minutes | 625 | 4.2% |
| 30 to 34 Minutes | 2,237 | 14.9% |
| 35 to 39 Minutes | 373 | 2.5% |
| 40 to 44 Minutes | 310 | 2.1% |
| 45 to 59 Minutes | 745 | 5.0% |
| 60 to 89 Minutes | 479 | 3.2% |
| 90 or more Minutes | 538 | 3.6% |
Commute Time by Sex in Riviera Beach
The most common commute times in Riviera Beach are 30 to 34 minutes (1,290 commuters, 17.6%) for males and 15 to 19 minutes (1,654 commuters, 21.5%) for females.
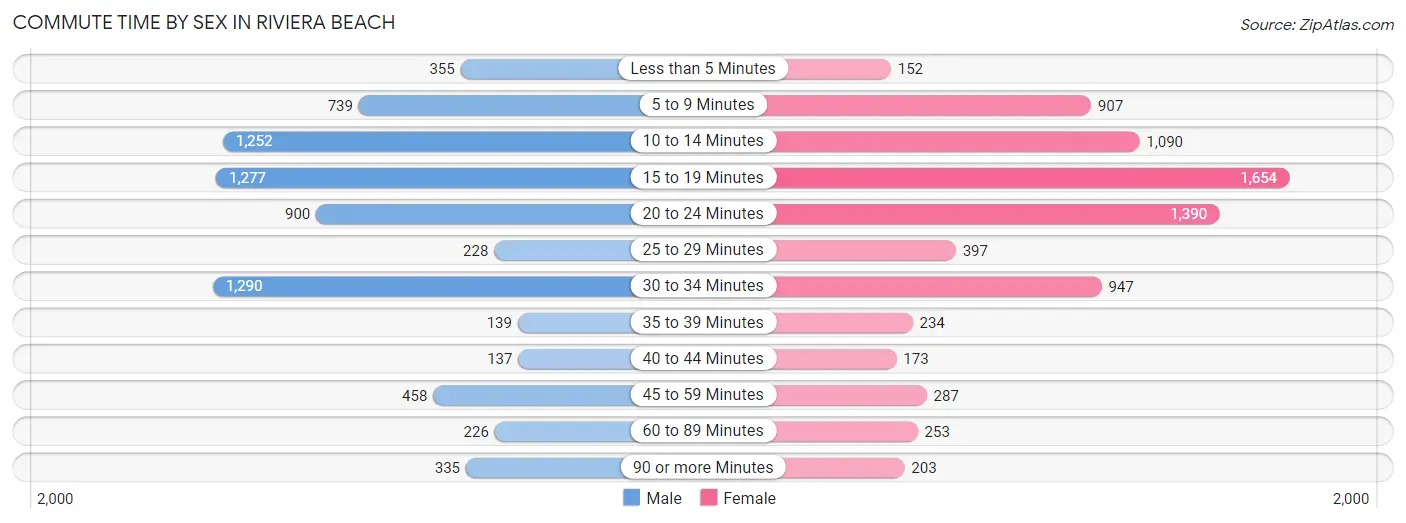
| Commute Time | Male | Female |
| Less than 5 Minutes | 355 (4.8%) | 152 (2.0%) |
| 5 to 9 Minutes | 739 (10.1%) | 907 (11.8%) |
| 10 to 14 Minutes | 1,252 (17.1%) | 1,090 (14.2%) |
| 15 to 19 Minutes | 1,277 (17.4%) | 1,654 (21.5%) |
| 20 to 24 Minutes | 900 (12.3%) | 1,390 (18.1%) |
| 25 to 29 Minutes | 228 (3.1%) | 397 (5.2%) |
| 30 to 34 Minutes | 1,290 (17.6%) | 947 (12.3%) |
| 35 to 39 Minutes | 139 (1.9%) | 234 (3.0%) |
| 40 to 44 Minutes | 137 (1.9%) | 173 (2.2%) |
| 45 to 59 Minutes | 458 (6.2%) | 287 (3.7%) |
| 60 to 89 Minutes | 226 (3.1%) | 253 (3.3%) |
| 90 or more Minutes | 335 (4.6%) | 203 (2.6%) |
Time of Departure to Work by Sex in Riviera Beach
The most frequent times of departure to work in Riviera Beach are 7:00 AM to 7:29 AM (1,006, 13.7%) for males and 7:00 AM to 7:29 AM (1,072, 14.0%) for females.
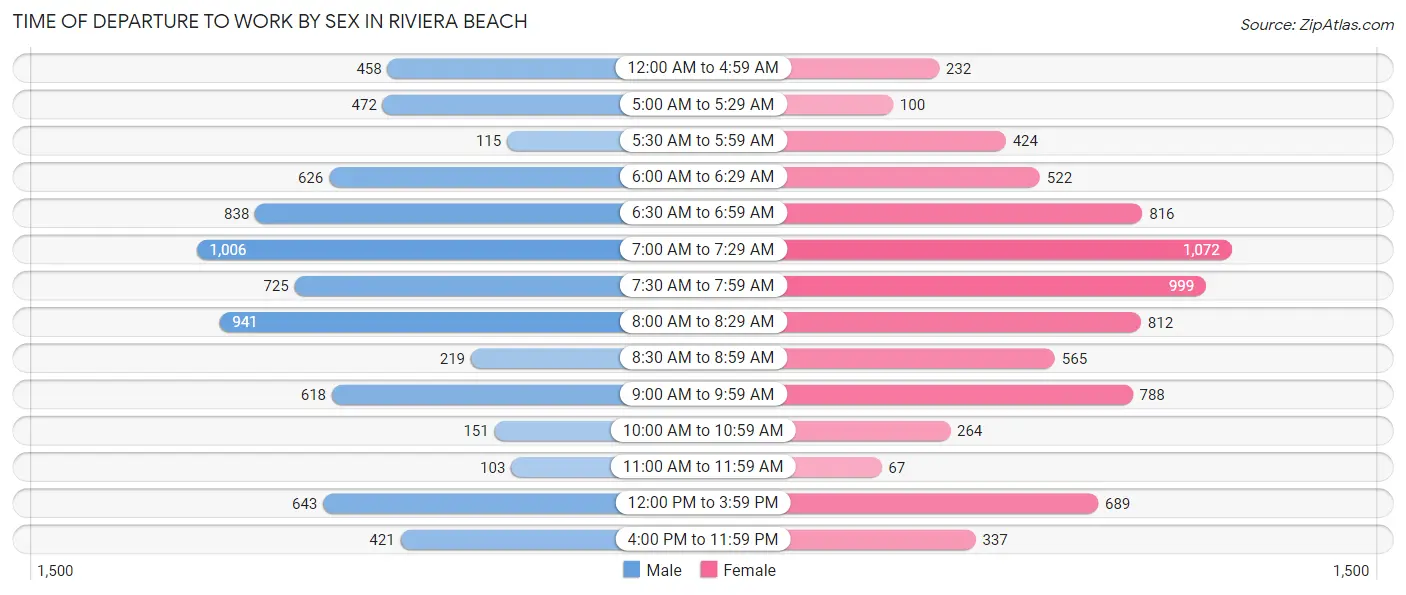
| Time of Departure | Male | Female |
| 12:00 AM to 4:59 AM | 458 (6.2%) | 232 (3.0%) |
| 5:00 AM to 5:29 AM | 472 (6.4%) | 100 (1.3%) |
| 5:30 AM to 5:59 AM | 115 (1.6%) | 424 (5.5%) |
| 6:00 AM to 6:29 AM | 626 (8.5%) | 522 (6.8%) |
| 6:30 AM to 6:59 AM | 838 (11.4%) | 816 (10.6%) |
| 7:00 AM to 7:29 AM | 1,006 (13.7%) | 1,072 (14.0%) |
| 7:30 AM to 7:59 AM | 725 (9.9%) | 999 (13.0%) |
| 8:00 AM to 8:29 AM | 941 (12.8%) | 812 (10.6%) |
| 8:30 AM to 8:59 AM | 219 (3.0%) | 565 (7.3%) |
| 9:00 AM to 9:59 AM | 618 (8.4%) | 788 (10.2%) |
| 10:00 AM to 10:59 AM | 151 (2.1%) | 264 (3.4%) |
| 11:00 AM to 11:59 AM | 103 (1.4%) | 67 (0.9%) |
| 12:00 PM to 3:59 PM | 643 (8.8%) | 689 (9.0%) |
| 4:00 PM to 11:59 PM | 421 (5.7%) | 337 (4.4%) |
| Total | 7,336 (100.0%) | 7,687 (100.0%) |
Housing Occupancy in Riviera Beach
Occupancy by Ownership in Riviera Beach
Of the total 13,416 dwellings in Riviera Beach, owner-occupied units account for 7,641 (57.0%), while renter-occupied units make up 5,775 (43.0%).
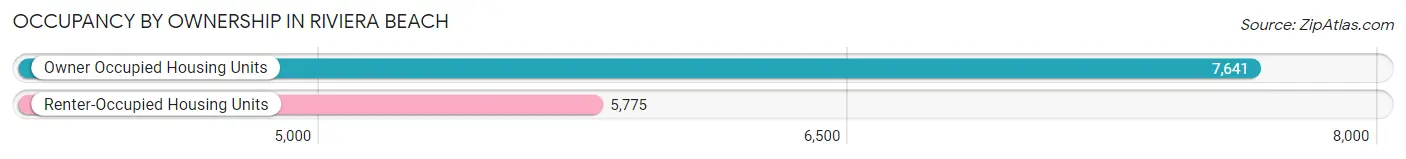
| Occupancy | # Housing Units | % Housing Units |
| Owner Occupied Housing Units | 7,641 | 57.0% |
| Renter-Occupied Housing Units | 5,775 | 43.0% |
| Total Occupied Housing Units | 13,416 | 100.0% |
Occupancy by Household Size in Riviera Beach
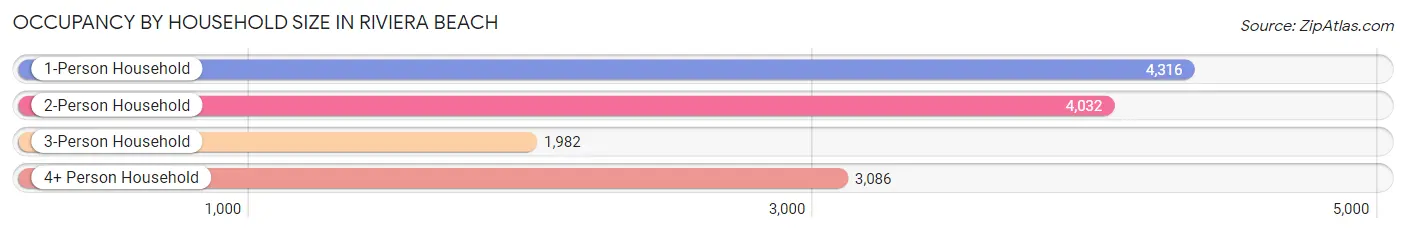
| Household Size | # Housing Units | % Housing Units |
| 1-Person Household | 4,316 | 32.2% |
| 2-Person Household | 4,032 | 30.0% |
| 3-Person Household | 1,982 | 14.8% |
| 4+ Person Household | 3,086 | 23.0% |
| Total Housing Units | 13,416 | 100.0% |
Occupancy by Ownership by Household Size in Riviera Beach
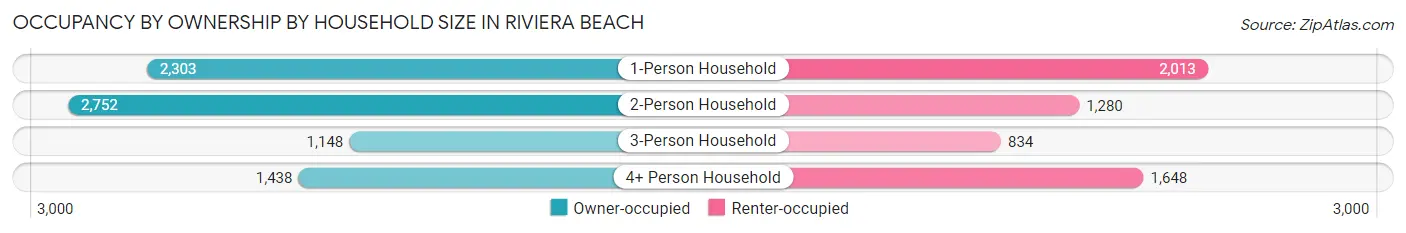
| Household Size | Owner-occupied | Renter-occupied |
| 1-Person Household | 2,303 (53.4%) | 2,013 (46.6%) |
| 2-Person Household | 2,752 (68.2%) | 1,280 (31.8%) |
| 3-Person Household | 1,148 (57.9%) | 834 (42.1%) |
| 4+ Person Household | 1,438 (46.6%) | 1,648 (53.4%) |
| Total Housing Units | 7,641 (57.0%) | 5,775 (43.0%) |
Occupancy by Educational Attainment in Riviera Beach
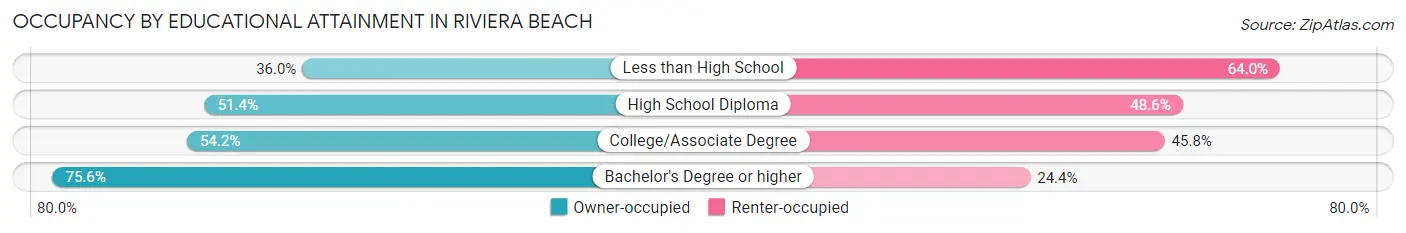
| Household Size | Owner-occupied | Renter-occupied |
| Less than High School | 610 (36.0%) | 1,086 (64.0%) |
| High School Diploma | 2,161 (51.4%) | 2,042 (48.6%) |
| College/Associate Degree | 2,060 (54.2%) | 1,738 (45.8%) |
| Bachelor's Degree or higher | 2,810 (75.6%) | 909 (24.4%) |
Occupancy by Age of Householder in Riviera Beach
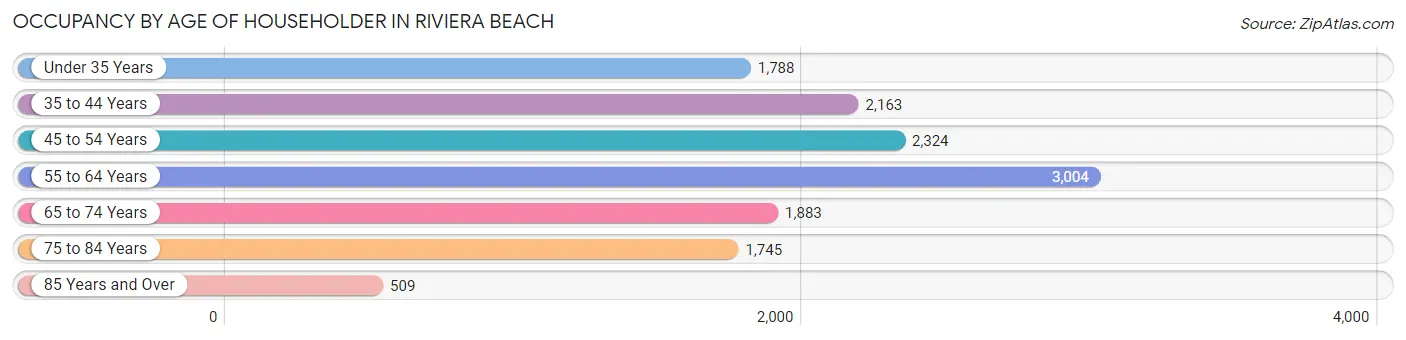
| Age Bracket | # Households | % Households |
| Under 35 Years | 1,788 | 13.3% |
| 35 to 44 Years | 2,163 | 16.1% |
| 45 to 54 Years | 2,324 | 17.3% |
| 55 to 64 Years | 3,004 | 22.4% |
| 65 to 74 Years | 1,883 | 14.0% |
| 75 to 84 Years | 1,745 | 13.0% |
| 85 Years and Over | 509 | 3.8% |
| Total | 13,416 | 100.0% |
Housing Finances in Riviera Beach
Median Income by Occupancy in Riviera Beach
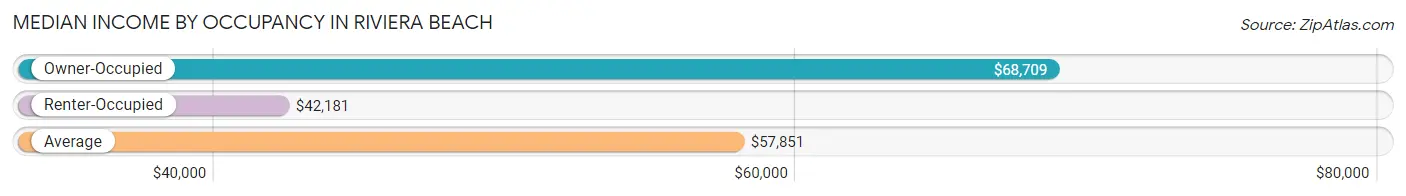
| Occupancy Type | # Households | Median Income |
| Owner-Occupied | 7,641 (57.0%) | $68,709 |
| Renter-Occupied | 5,775 (43.0%) | $42,181 |
| Average | 13,416 (100.0%) | $57,851 |
Occupancy by Householder Income Bracket in Riviera Beach
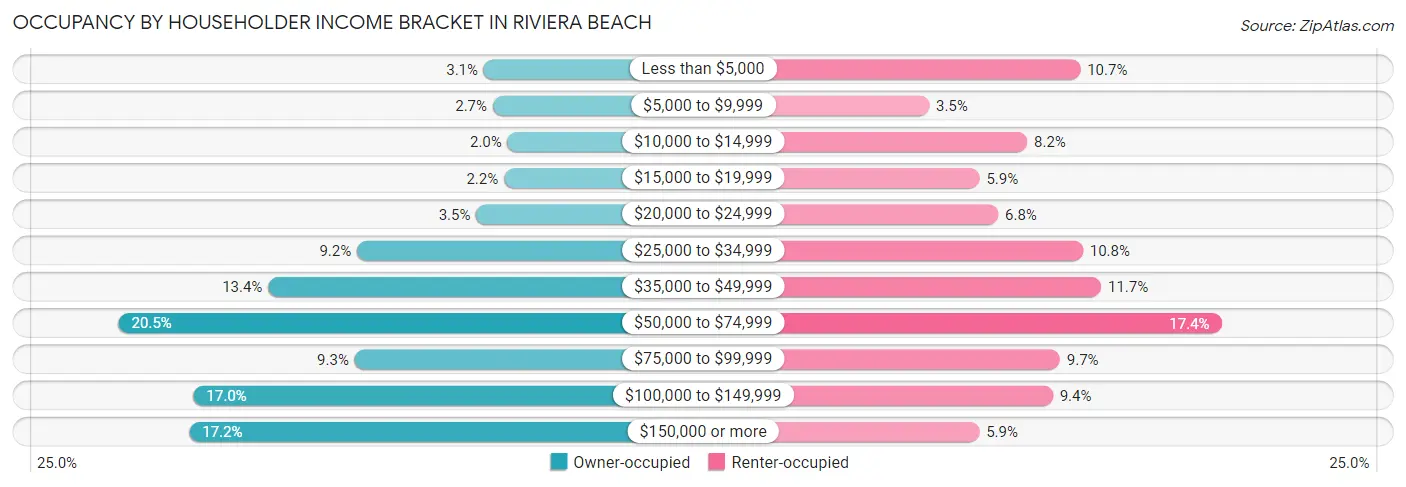
| Income Bracket | Owner-occupied | Renter-occupied |
| Less than $5,000 | 239 (3.1%) | 618 (10.7%) |
| $5,000 to $9,999 | 206 (2.7%) | 202 (3.5%) |
| $10,000 to $14,999 | 153 (2.0%) | 472 (8.2%) |
| $15,000 to $19,999 | 166 (2.2%) | 341 (5.9%) |
| $20,000 to $24,999 | 267 (3.5%) | 392 (6.8%) |
| $25,000 to $34,999 | 701 (9.2%) | 625 (10.8%) |
| $35,000 to $49,999 | 1,024 (13.4%) | 675 (11.7%) |
| $50,000 to $74,999 | 1,569 (20.5%) | 1,006 (17.4%) |
| $75,000 to $99,999 | 709 (9.3%) | 562 (9.7%) |
| $100,000 to $149,999 | 1,296 (17.0%) | 542 (9.4%) |
| $150,000 or more | 1,311 (17.2%) | 340 (5.9%) |
| Total | 7,641 (100.0%) | 5,775 (100.0%) |
Monthly Housing Cost Tiers in Riviera Beach
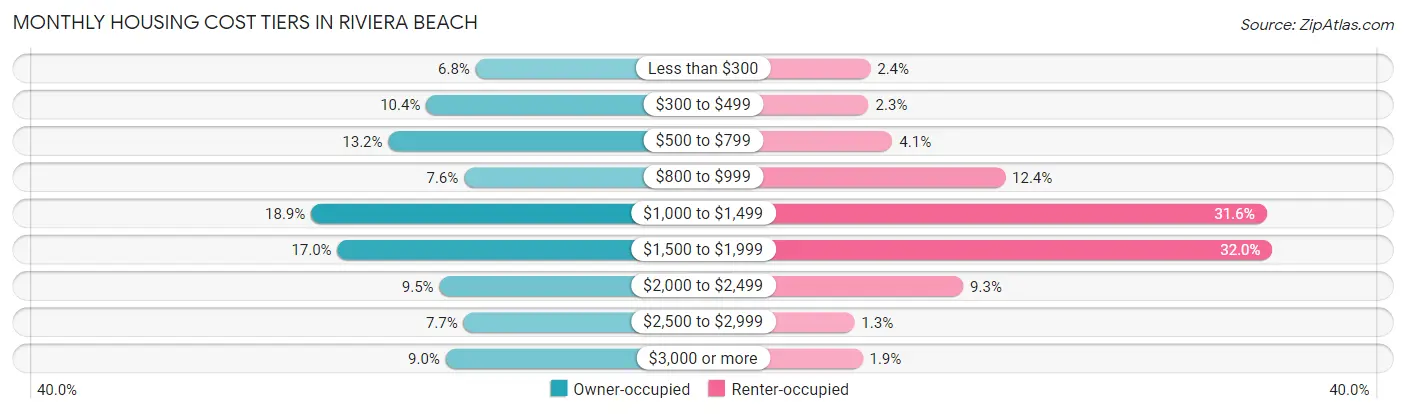
| Monthly Cost | Owner-occupied | Renter-occupied |
| Less than $300 | 518 (6.8%) | 140 (2.4%) |
| $300 to $499 | 796 (10.4%) | 133 (2.3%) |
| $500 to $799 | 1,009 (13.2%) | 234 (4.1%) |
| $800 to $999 | 583 (7.6%) | 713 (12.3%) |
| $1,000 to $1,499 | 1,444 (18.9%) | 1,825 (31.6%) |
| $1,500 to $1,999 | 1,296 (17.0%) | 1,850 (32.0%) |
| $2,000 to $2,499 | 722 (9.5%) | 535 (9.3%) |
| $2,500 to $2,999 | 586 (7.7%) | 72 (1.3%) |
| $3,000 or more | 687 (9.0%) | 107 (1.8%) |
| Total | 7,641 (100.0%) | 5,775 (100.0%) |
Physical Housing Characteristics in Riviera Beach
Housing Structures in Riviera Beach
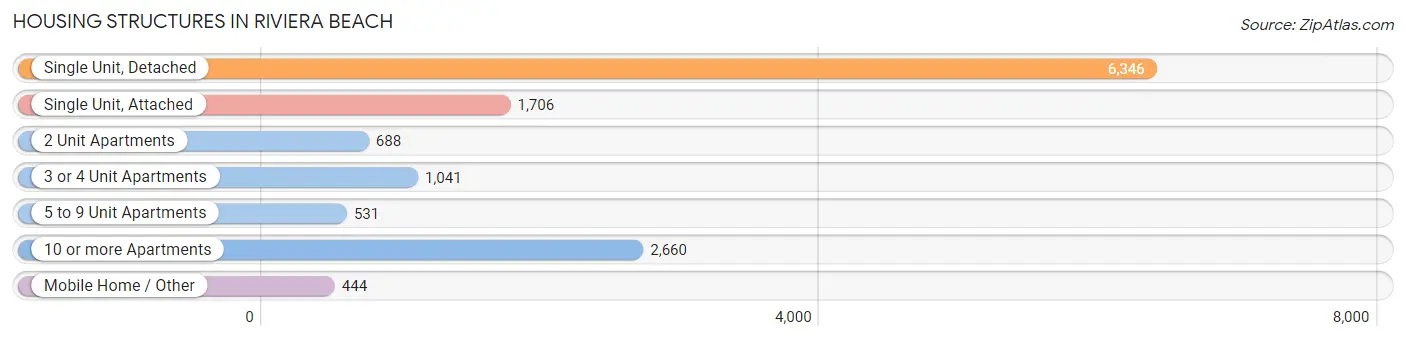
| Structure Type | # Housing Units | % Housing Units |
| Single Unit, Detached | 6,346 | 47.3% |
| Single Unit, Attached | 1,706 | 12.7% |
| 2 Unit Apartments | 688 | 5.1% |
| 3 or 4 Unit Apartments | 1,041 | 7.8% |
| 5 to 9 Unit Apartments | 531 | 4.0% |
| 10 or more Apartments | 2,660 | 19.8% |
| Mobile Home / Other | 444 | 3.3% |
| Total | 13,416 | 100.0% |
Housing Structures by Occupancy in Riviera Beach
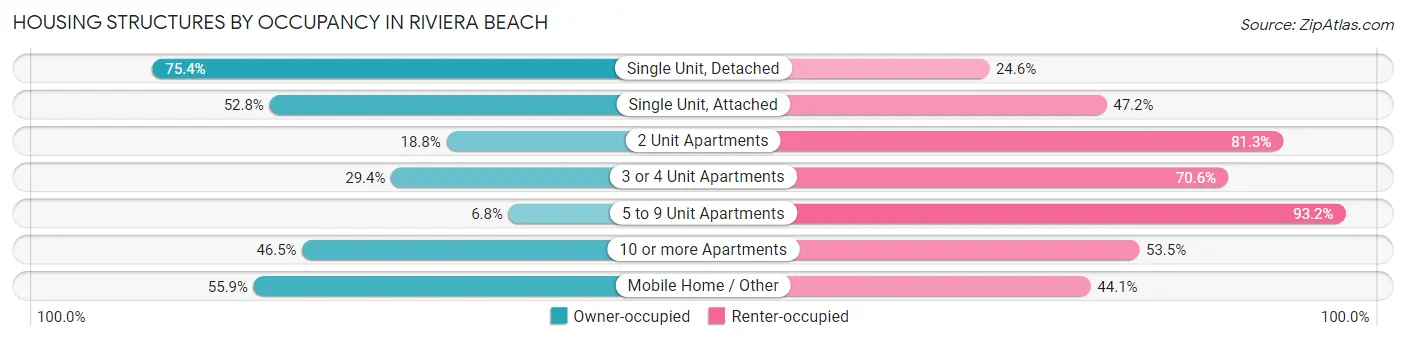
| Structure Type | Owner-occupied | Renter-occupied |
| Single Unit, Detached | 4,784 (75.4%) | 1,562 (24.6%) |
| Single Unit, Attached | 901 (52.8%) | 805 (47.2%) |
| 2 Unit Apartments | 129 (18.8%) | 559 (81.2%) |
| 3 or 4 Unit Apartments | 306 (29.4%) | 735 (70.6%) |
| 5 to 9 Unit Apartments | 36 (6.8%) | 495 (93.2%) |
| 10 or more Apartments | 1,237 (46.5%) | 1,423 (53.5%) |
| Mobile Home / Other | 248 (55.9%) | 196 (44.1%) |
| Total | 7,641 (57.0%) | 5,775 (43.0%) |
Housing Structures by Number of Rooms in Riviera Beach
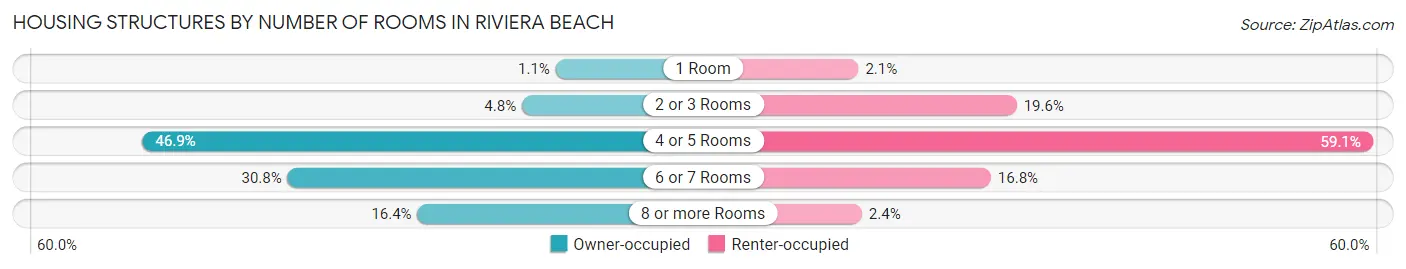
| Number of Rooms | Owner-occupied | Renter-occupied |
| 1 Room | 81 (1.1%) | 119 (2.1%) |
| 2 or 3 Rooms | 367 (4.8%) | 1,133 (19.6%) |
| 4 or 5 Rooms | 3,585 (46.9%) | 3,414 (59.1%) |
| 6 or 7 Rooms | 2,355 (30.8%) | 968 (16.8%) |
| 8 or more Rooms | 1,253 (16.4%) | 141 (2.4%) |
| Total | 7,641 (100.0%) | 5,775 (100.0%) |
Housing Structure by Heating Type in Riviera Beach
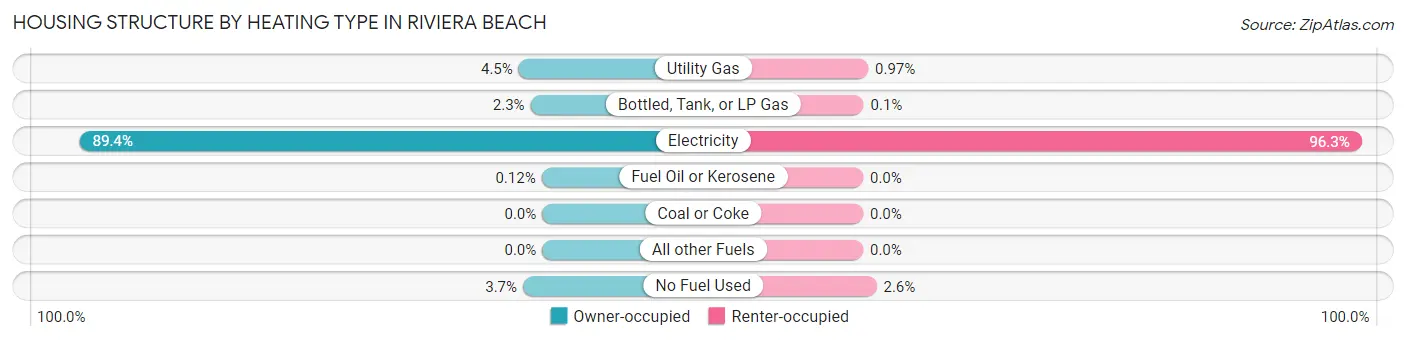
| Heating Type | Owner-occupied | Renter-occupied |
| Utility Gas | 347 (4.5%) | 56 (1.0%) |
| Bottled, Tank, or LP Gas | 172 (2.2%) | 6 (0.1%) |
| Electricity | 6,829 (89.4%) | 5,562 (96.3%) |
| Fuel Oil or Kerosene | 9 (0.1%) | 0 (0.0%) |
| Coal or Coke | 0 (0.0%) | 0 (0.0%) |
| All other Fuels | 0 (0.0%) | 0 (0.0%) |
| No Fuel Used | 284 (3.7%) | 151 (2.6%) |
| Total | 7,641 (100.0%) | 5,775 (100.0%) |
Household Vehicle Usage in Riviera Beach
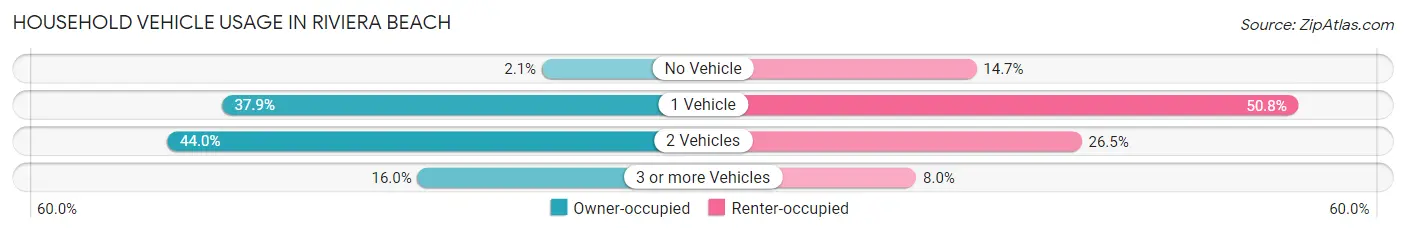
| Vehicles per Household | Owner-occupied | Renter-occupied |
| No Vehicle | 157 (2.1%) | 850 (14.7%) |
| 1 Vehicle | 2,899 (37.9%) | 2,934 (50.8%) |
| 2 Vehicles | 3,364 (44.0%) | 1,531 (26.5%) |
| 3 or more Vehicles | 1,221 (16.0%) | 460 (8.0%) |
| Total | 7,641 (100.0%) | 5,775 (100.0%) |
Real Estate & Mortgages in Riviera Beach
Real Estate and Mortgage Overview in Riviera Beach
| Characteristic | Without Mortgage | With Mortgage |
| Housing Units | 3,459 | 4,182 |
| Median Property Value | $275,300 | $285,700 |
| Median Household Income | $59,009 | $868 |
| Monthly Housing Costs | $631 | $472 |
| Real Estate Taxes | $2,416 | $97 |
Property Value by Mortgage Status in Riviera Beach
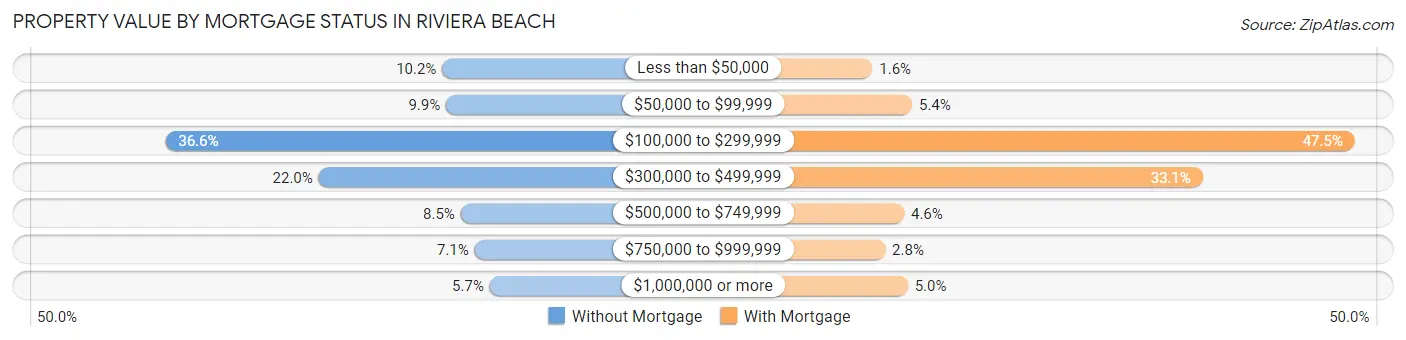
| Property Value | Without Mortgage | With Mortgage |
| Less than $50,000 | 354 (10.2%) | 67 (1.6%) |
| $50,000 to $99,999 | 341 (9.9%) | 225 (5.4%) |
| $100,000 to $299,999 | 1,266 (36.6%) | 1,988 (47.5%) |
| $300,000 to $499,999 | 761 (22.0%) | 1,383 (33.1%) |
| $500,000 to $749,999 | 293 (8.5%) | 193 (4.6%) |
| $750,000 to $999,999 | 247 (7.1%) | 118 (2.8%) |
| $1,000,000 or more | 197 (5.7%) | 208 (5.0%) |
| Total | 3,459 (100.0%) | 4,182 (100.0%) |
Household Income by Mortgage Status in Riviera Beach
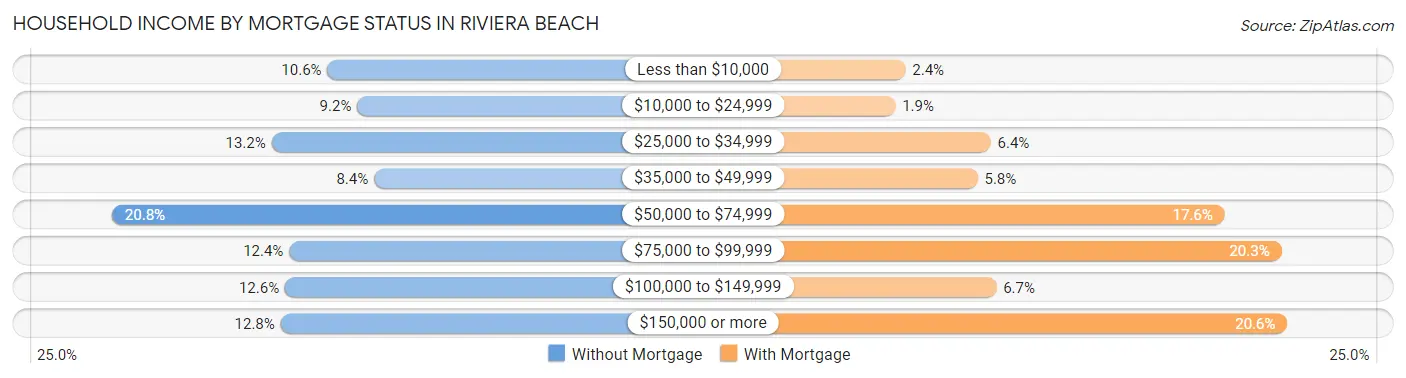
| Household Income | Without Mortgage | With Mortgage |
| Less than $10,000 | 366 (10.6%) | 99 (2.4%) |
| $10,000 to $24,999 | 317 (9.2%) | 79 (1.9%) |
| $25,000 to $34,999 | 458 (13.2%) | 269 (6.4%) |
| $35,000 to $49,999 | 289 (8.4%) | 243 (5.8%) |
| $50,000 to $74,999 | 721 (20.8%) | 735 (17.6%) |
| $75,000 to $99,999 | 429 (12.4%) | 848 (20.3%) |
| $100,000 to $149,999 | 436 (12.6%) | 280 (6.7%) |
| $150,000 or more | 443 (12.8%) | 860 (20.6%) |
| Total | 3,459 (100.0%) | 4,182 (100.0%) |
Property Value to Household Income Ratio in Riviera Beach
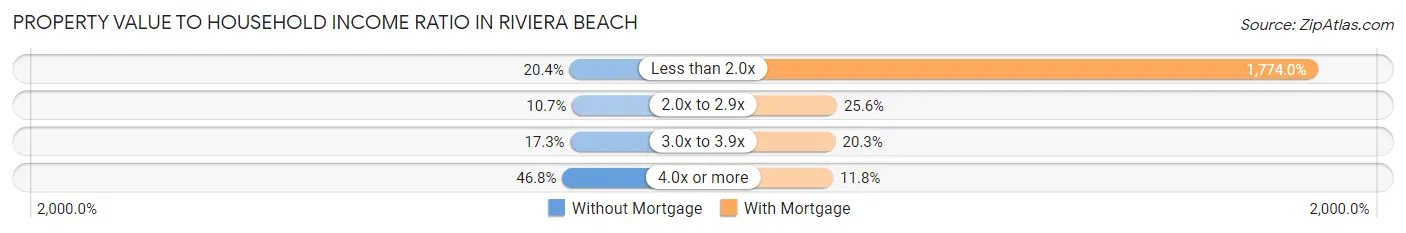
| Value-to-Income Ratio | Without Mortgage | With Mortgage |
| Less than 2.0x | 705 (20.4%) | 74,189 (1,774.0%) |
| 2.0x to 2.9x | 369 (10.7%) | 1,070 (25.6%) |
| 3.0x to 3.9x | 599 (17.3%) | 849 (20.3%) |
| 4.0x or more | 1,618 (46.8%) | 492 (11.8%) |
| Total | 3,459 (100.0%) | 4,182 (100.0%) |
Real Estate Taxes by Mortgage Status in Riviera Beach
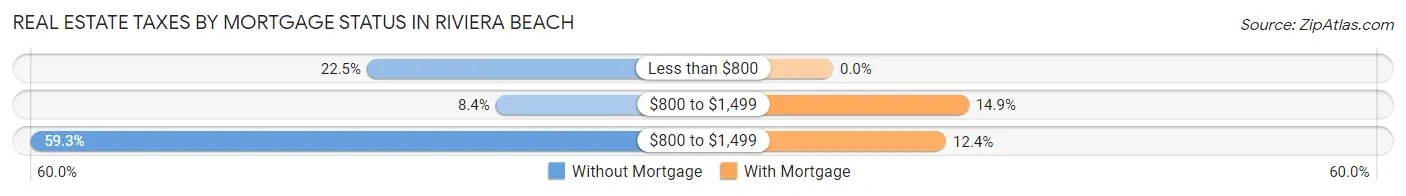
| Property Taxes | Without Mortgage | With Mortgage |
| Less than $800 | 778 (22.5%) | 0 (0.0%) |
| $800 to $1,499 | 290 (8.4%) | 622 (14.9%) |
| $800 to $1,499 | 2,050 (59.3%) | 518 (12.4%) |
| Total | 3,459 (100.0%) | 4,182 (100.0%) |
Health & Disability in Riviera Beach
Health Insurance Coverage by Age in Riviera Beach
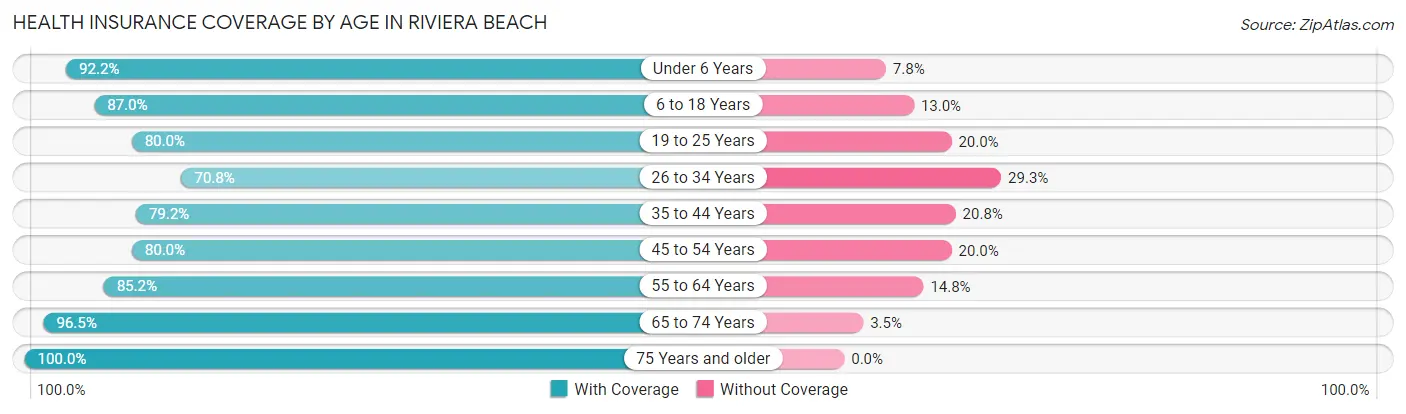
| Age Bracket | With Coverage | Without Coverage |
| Under 6 Years | 3,041 (92.2%) | 256 (7.8%) |
| 6 to 18 Years | 5,142 (87.0%) | 768 (13.0%) |
| 19 to 25 Years | 2,331 (80.0%) | 582 (20.0%) |
| 26 to 34 Years | 3,446 (70.8%) | 1,425 (29.2%) |
| 35 to 44 Years | 3,335 (79.2%) | 874 (20.8%) |
| 45 to 54 Years | 3,357 (80.0%) | 840 (20.0%) |
| 55 to 64 Years | 4,780 (85.2%) | 828 (14.8%) |
| 65 to 74 Years | 3,032 (96.5%) | 111 (3.5%) |
| 75 Years and older | 3,228 (100.0%) | 0 (0.0%) |
| Total | 31,692 (84.8%) | 5,684 (15.2%) |
Health Insurance Coverage by Citizenship Status in Riviera Beach
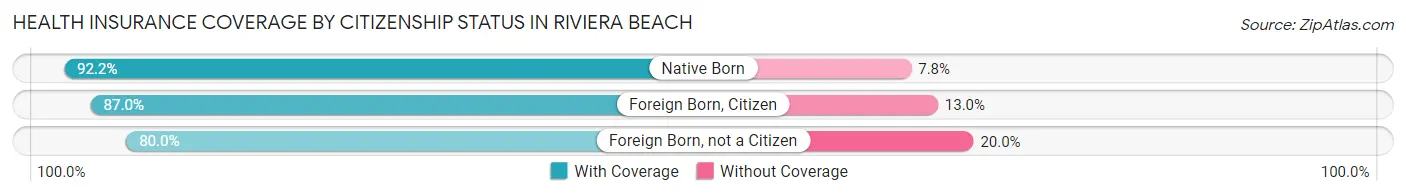
| Citizenship Status | With Coverage | Without Coverage |
| Native Born | 3,041 (92.2%) | 256 (7.8%) |
| Foreign Born, Citizen | 5,142 (87.0%) | 768 (13.0%) |
| Foreign Born, not a Citizen | 2,331 (80.0%) | 582 (20.0%) |
Health Insurance Coverage by Household Income in Riviera Beach
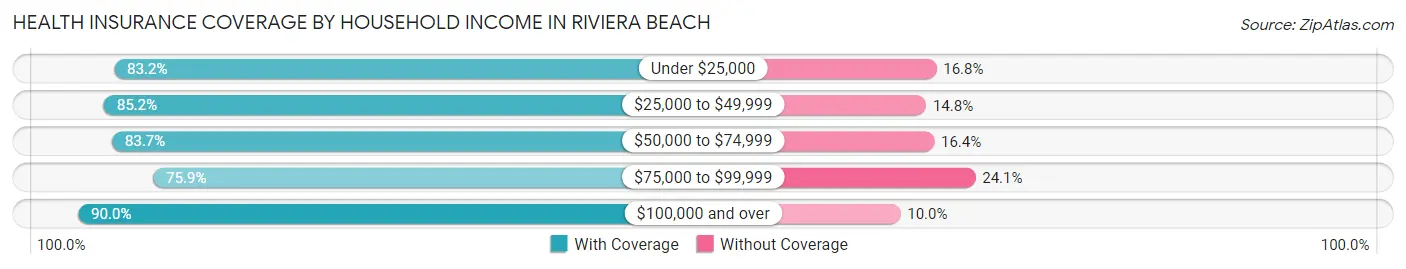
| Household Income | With Coverage | Without Coverage |
| Under $25,000 | 5,492 (83.2%) | 1,106 (16.8%) |
| $25,000 to $49,999 | 5,998 (85.2%) | 1,045 (14.8%) |
| $50,000 to $74,999 | 6,346 (83.7%) | 1,240 (16.4%) |
| $75,000 to $99,999 | 2,986 (75.9%) | 947 (24.1%) |
| $100,000 and over | 10,809 (90.0%) | 1,205 (10.0%) |
Public vs Private Health Insurance Coverage by Age in Riviera Beach
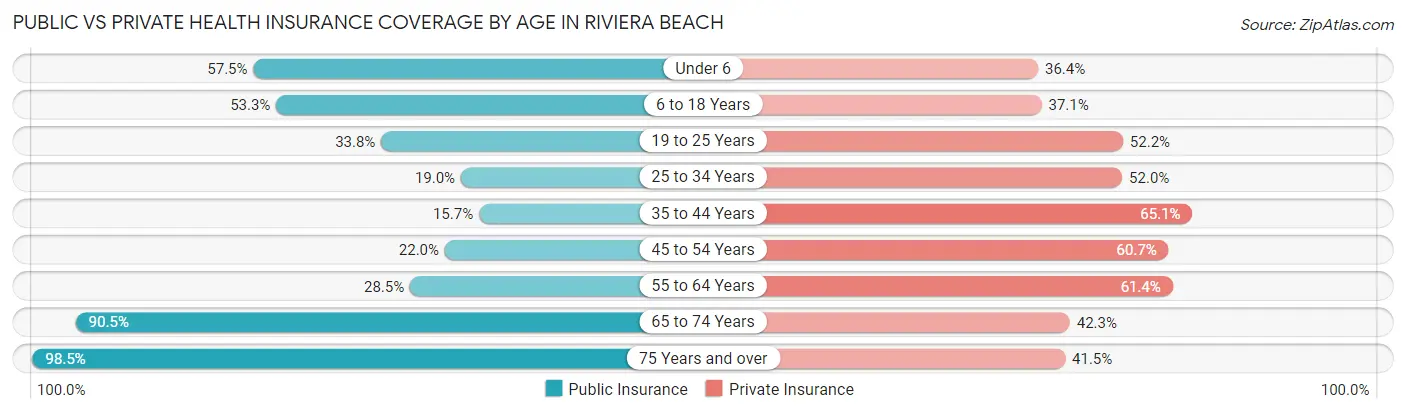
| Age Bracket | Public Insurance | Private Insurance |
| Under 6 | 1,897 (57.5%) | 1,201 (36.4%) |
| 6 to 18 Years | 3,150 (53.3%) | 2,191 (37.1%) |
| 19 to 25 Years | 985 (33.8%) | 1,520 (52.2%) |
| 25 to 34 Years | 926 (19.0%) | 2,535 (52.0%) |
| 35 to 44 Years | 659 (15.7%) | 2,739 (65.1%) |
| 45 to 54 Years | 923 (22.0%) | 2,546 (60.7%) |
| 55 to 64 Years | 1,596 (28.5%) | 3,444 (61.4%) |
| 65 to 74 Years | 2,845 (90.5%) | 1,330 (42.3%) |
| 75 Years and over | 3,181 (98.5%) | 1,338 (41.4%) |
| Total | 16,162 (43.2%) | 18,844 (50.4%) |
Disability Status by Sex by Age in Riviera Beach
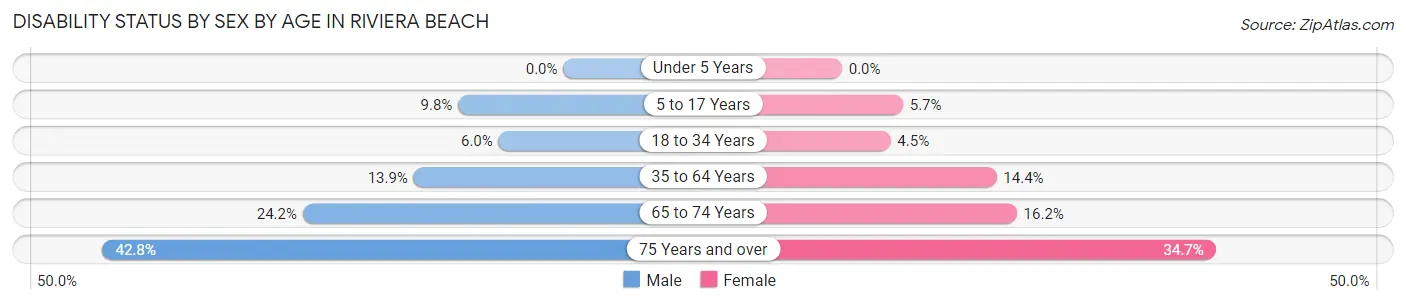
| Age Bracket | Male | Female |
| Under 5 Years | 0 (0.0%) | 0 (0.0%) |
| 5 to 17 Years | 297 (9.8%) | 174 (5.7%) |
| 18 to 34 Years | 248 (6.0%) | 186 (4.5%) |
| 35 to 64 Years | 917 (13.9%) | 1,063 (14.3%) |
| 65 to 74 Years | 331 (24.2%) | 288 (16.2%) |
| 75 Years and over | 605 (42.8%) | 629 (34.7%) |
Disability Class by Sex by Age in Riviera Beach
Disability Class: Hearing Difficulty
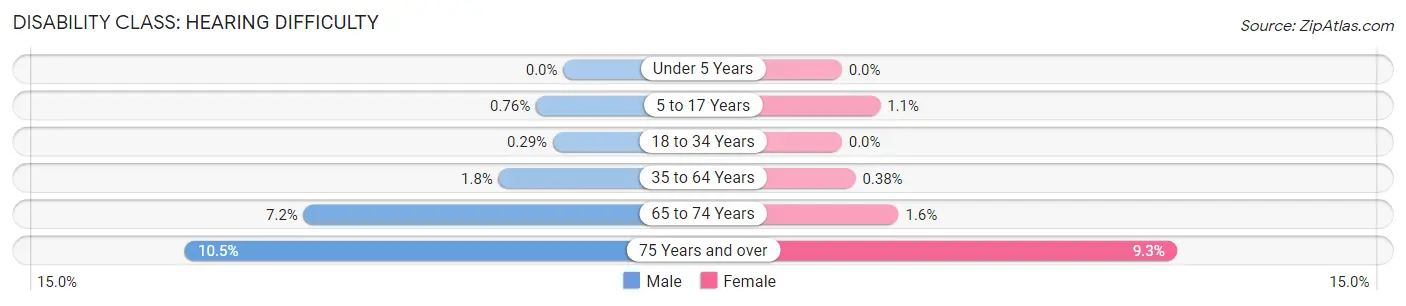
| Age Bracket | Male | Female |
| Under 5 Years | 0 (0.0%) | 0 (0.0%) |
| 5 to 17 Years | 23 (0.8%) | 33 (1.1%) |
| 18 to 34 Years | 12 (0.3%) | 0 (0.0%) |
| 35 to 64 Years | 119 (1.8%) | 28 (0.4%) |
| 65 to 74 Years | 99 (7.2%) | 28 (1.6%) |
| 75 Years and over | 149 (10.5%) | 169 (9.3%) |
Disability Class: Vision Difficulty
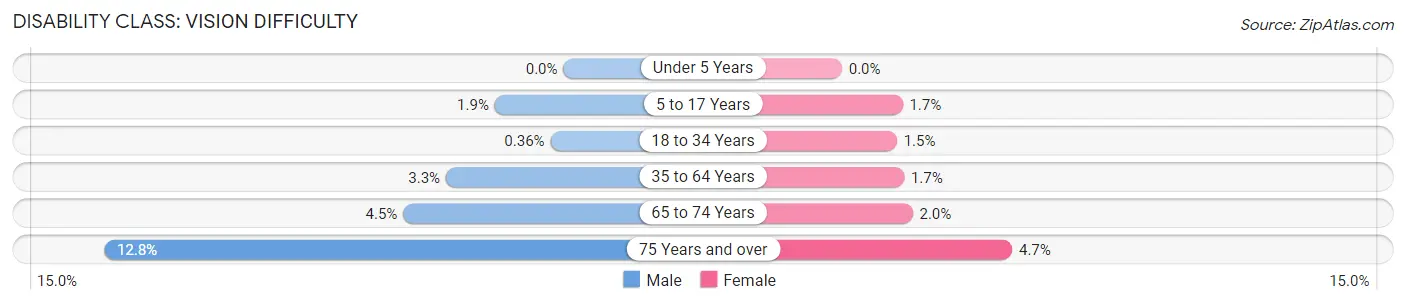
| Age Bracket | Male | Female |
| Under 5 Years | 0 (0.0%) | 0 (0.0%) |
| 5 to 17 Years | 58 (1.9%) | 52 (1.7%) |
| 18 to 34 Years | 15 (0.4%) | 63 (1.5%) |
| 35 to 64 Years | 216 (3.3%) | 128 (1.7%) |
| 65 to 74 Years | 61 (4.5%) | 35 (2.0%) |
| 75 Years and over | 181 (12.8%) | 86 (4.7%) |
Disability Class: Cognitive Difficulty
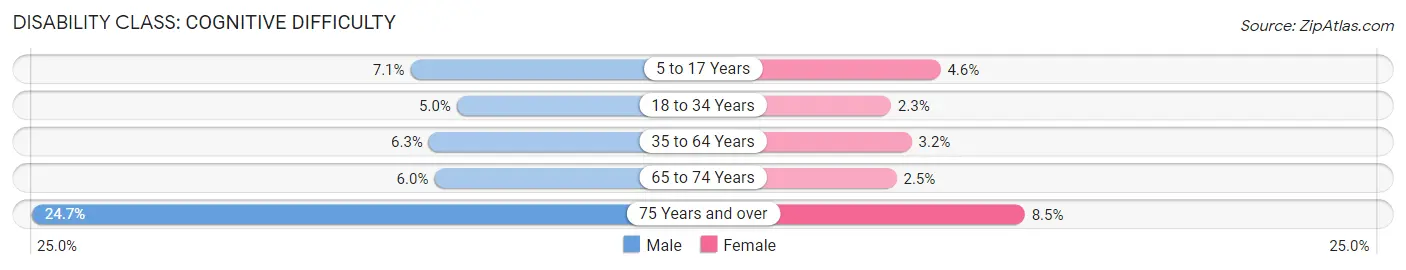
| Age Bracket | Male | Female |
| 5 to 17 Years | 216 (7.1%) | 141 (4.6%) |
| 18 to 34 Years | 204 (5.0%) | 94 (2.3%) |
| 35 to 64 Years | 413 (6.2%) | 240 (3.2%) |
| 65 to 74 Years | 82 (6.0%) | 45 (2.5%) |
| 75 Years and over | 349 (24.7%) | 154 (8.5%) |
Disability Class: Ambulatory Difficulty
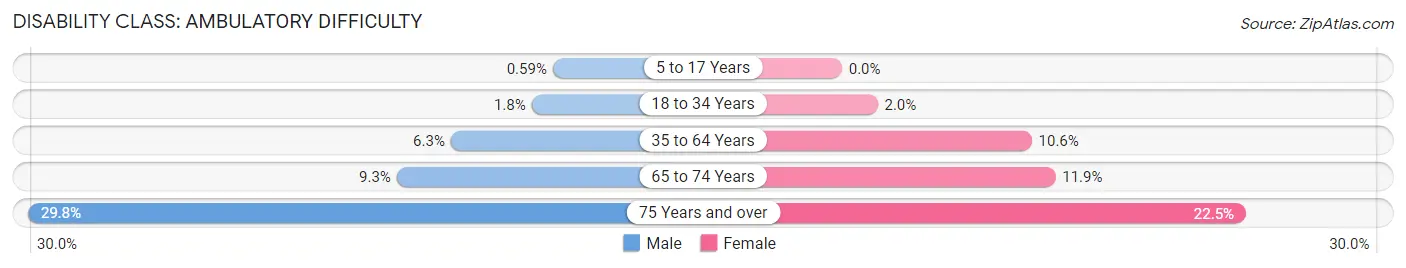
| Age Bracket | Male | Female |
| 5 to 17 Years | 18 (0.6%) | 0 (0.0%) |
| 18 to 34 Years | 73 (1.8%) | 82 (2.0%) |
| 35 to 64 Years | 414 (6.3%) | 783 (10.6%) |
| 65 to 74 Years | 127 (9.3%) | 211 (11.9%) |
| 75 Years and over | 422 (29.8%) | 408 (22.5%) |
Disability Class: Self-Care Difficulty
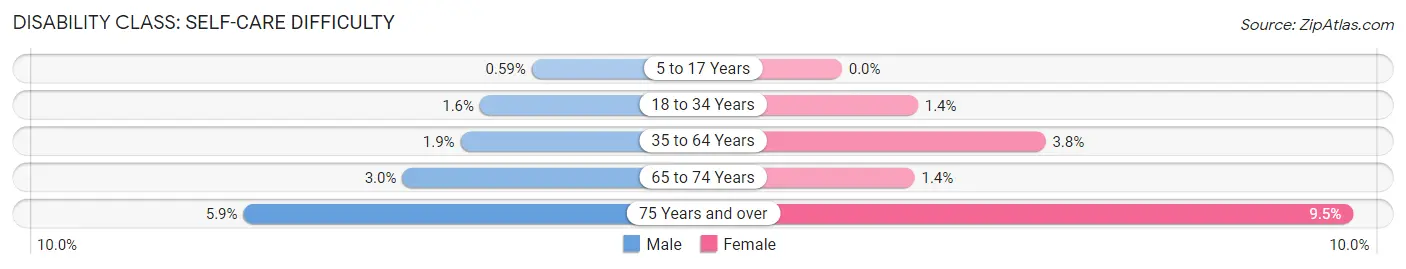
| Age Bracket | Male | Female |
| 5 to 17 Years | 18 (0.6%) | 0 (0.0%) |
| 18 to 34 Years | 64 (1.5%) | 58 (1.4%) |
| 35 to 64 Years | 126 (1.9%) | 280 (3.8%) |
| 65 to 74 Years | 41 (3.0%) | 24 (1.3%) |
| 75 Years and over | 84 (5.9%) | 172 (9.5%) |
Technology Access in Riviera Beach
Computing Device Access in Riviera Beach
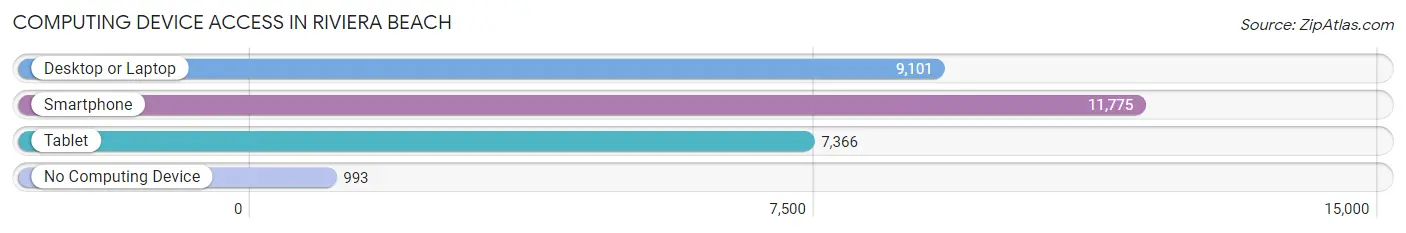
| Device Type | # Households | % Households |
| Desktop or Laptop | 9,101 | 67.8% |
| Smartphone | 11,775 | 87.8% |
| Tablet | 7,366 | 54.9% |
| No Computing Device | 993 | 7.4% |
| Total | 13,416 | 100.0% |
Internet Access in Riviera Beach
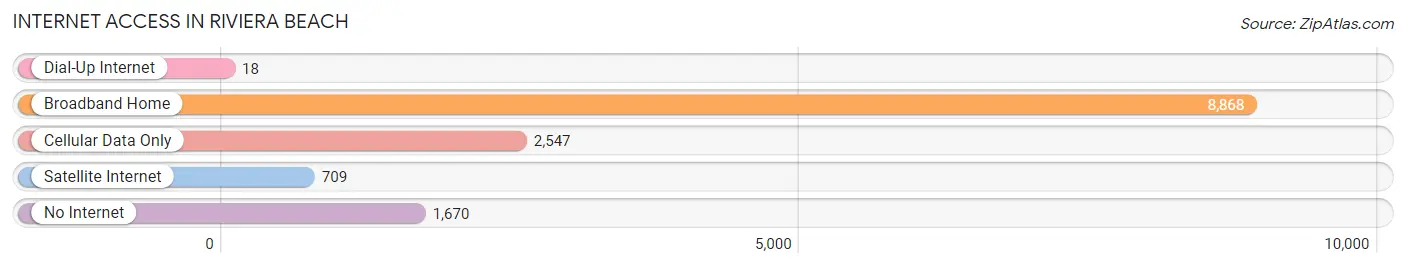
| Internet Type | # Households | % Households |
| Dial-Up Internet | 18 | 0.1% |
| Broadband Home | 8,868 | 66.1% |
| Cellular Data Only | 2,547 | 19.0% |
| Satellite Internet | 709 | 5.3% |
| No Internet | 1,670 | 12.4% |
| Total | 13,416 | 100.0% |
Riviera Beach Summary
Riviera Beach is a city located in Palm Beach County, Florida, United States. It is located on the east coast of Florida, just north of West Palm Beach. The city has a population of 32,488 as of the 2010 census.
History
Riviera Beach was originally known as the Town of Riviera, and was incorporated in 1922. The town was named after the French Riviera, and was developed as a resort community. The town was annexed by the City of West Palm Beach in 1959, and the name was changed to Riviera Beach.
In the late 1960s, the city began to experience rapid growth due to the development of the Port of Palm Beach. The port was developed to provide a deep-water port for the import and export of goods. The port also provided jobs for many of the city's residents.
In the 1970s, the city began to experience a decline in population due to the decline of the port and the rise of crime. The city was also affected by the recession of the 1980s. In the 1990s, the city began to experience a resurgence in population and economic growth.
Geography
Riviera Beach is located in Palm Beach County, Florida, on the east coast of Florida. The city is located just north of West Palm Beach, and is bordered by the cities of Lake Park, North Palm Beach, and Palm Beach Gardens. The city has a total area of 8.3 square miles, of which 8.2 square miles is land and 0.1 square miles is water.
The city is located on the Intracoastal Waterway, and is home to several marinas and boat ramps. The city is also home to several parks, including the Riviera Beach Marina, the Riviera Beach Nature Preserve, and the Riviera Beach Municipal Beach.
Economy
Riviera Beach has a diverse economy, with a mix of industries including tourism, manufacturing, and retail. The city is home to several large employers, including the Port of Palm Beach, the Riviera Beach Marina, and the Riviera Beach Municipal Beach.
The city is also home to several small businesses, including restaurants, bars, and shops. The city is also home to several large shopping centers, including the Riviera Beach Mall and the Riviera Beach Town Center.
Demographics
As of the 2010 census, the city had a population of 32,488. The racial makeup of the city was 57.2% African American, 28.3% White, 8.2% Hispanic or Latino, 2.2% Asian, and 0.7% Native American.
The median household income in the city was $30,945, and the median family income was $37,945. The per capita income in the city was $17,845. The poverty rate in the city was 28.3%.
Conclusion
Riviera Beach is a city located in Palm Beach County, Florida, United States. It is located on the east coast of Florida, just north of West Palm Beach. The city has a population of 32,488 as of the 2010 census. The city has a diverse economy, with a mix of industries including tourism, manufacturing, and retail. The racial makeup of the city was 57.2% African American, 28.3% White, 8.2% Hispanic or Latino, 2.2% Asian, and 0.7% Native American. The median household income in the city was $30,945, and the median family income was $37,945. The per capita income in the city was $17,845. The poverty rate in the city was 28.3%. Riviera Beach is a vibrant city with a rich history and a bright future.
Common Questions
What is the Total Population of Riviera Beach?
Total Population of Riviera Beach is 37,668.
What is the Total Male Population of Riviera Beach?
Total Male Population of Riviera Beach is 18,194.
What is the Total Female Population of Riviera Beach?
Total Female Population of Riviera Beach is 19,474.
What is the Ratio of Males per 100 Females in Riviera Beach?
There are 93.43 Males per 100 Females in Riviera Beach.
What is the Ratio of Females per 100 Males in Riviera Beach?
There are 107.04 Females per 100 Males in Riviera Beach.
What is the Median Population Age in Riviera Beach?
Median Population Age in Riviera Beach is 38.7 Years.
What is the Average Family Size in Riviera Beach
Average Family Size in Riviera Beach is 3.6 People.
What is the Average Household Size in Riviera Beach
Average Household Size in Riviera Beach is 2.8 People.
What is Per Capita Income in Riviera Beach?
Per Capita income in Riviera Beach is $32,353.
What is the Median Family Income in Riviera Beach?
Median Family Income in Riviera Beach is $71,098.
What is the Median Household income in Riviera Beach?
Median Household Income in Riviera Beach is $57,851.
What is Income or Wage Gap in Riviera Beach?
Income or Wage Gap in Riviera Beach is 3.9%.
Women in Riviera Beach earn 96.1 cents for every dollar earned by a man.
What is Family Income Deficit in Riviera Beach?
Family Income Deficit in Riviera Beach is $12,533.
Families that are below poverty line in Riviera Beach earn $12,533 less on average than the poverty threshold level.
What is Inequality or Gini Index in Riviera Beach?
Inequality or Gini Index in Riviera Beach is 0.52.
How Large is the Labor Force in Riviera Beach?
There are 18,341 People in the Labor Forcein in Riviera Beach.
What is the Percentage of People in the Labor Force in Riviera Beach?
61.6% of People are in the Labor Force in Riviera Beach.
What is the Unemployment Rate in Riviera Beach?
Unemployment Rate in Riviera Beach is 9.2%.