Micco, FL
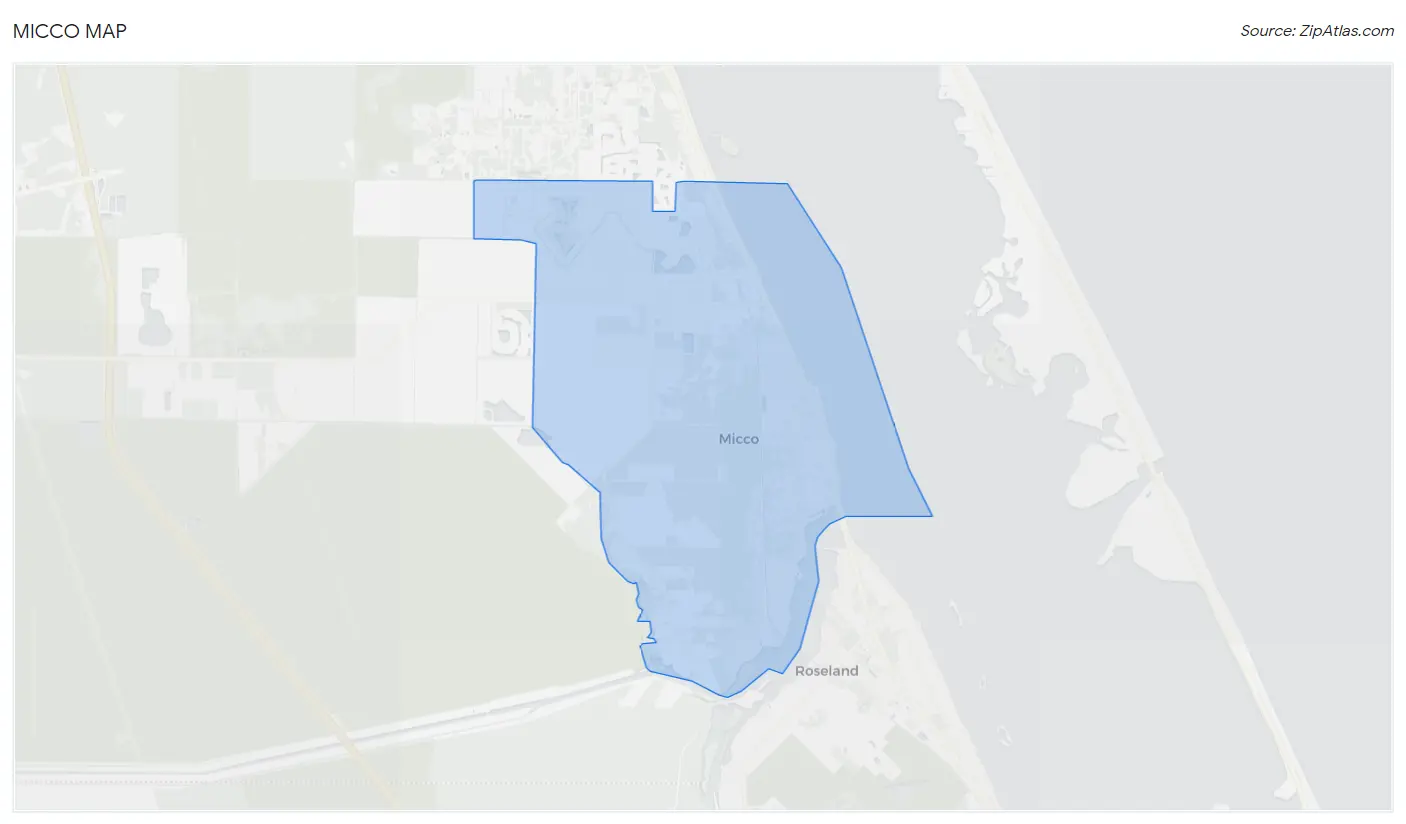
Micco Map
Micco Overview
9,164
TOTAL POPULATION
4,339
MALE POPULATION
4,825
FEMALE POPULATION
89.93
MALES / 100 FEMALES
111.20
FEMALES / 100 MALES
67.3
MEDIAN AGE
2.4
AVG FAMILY SIZE
1.8
AVG HOUSEHOLD SIZE
$34,982
PER CAPITA INCOME
$58,342
AVG FAMILY INCOME
$46,434
AVG HOUSEHOLD INCOME
16.6%
WAGE / INCOME GAP [ % ]
83.4¢/ $1
WAGE / INCOME GAP [ $ ]
0.42
INEQUALITY / GINI INDEX
2,669
LABOR FORCE [ PEOPLE ]
30.5%
PERCENT IN LABOR FORCE
5.7%
UNEMPLOYMENT RATE
Micco Area Codes
Race in Micco
The most populous races in Micco are White / Caucasian (8,695 | 94.9%), Hispanic or Latino (327 | 3.6%), and Some other Race (235 | 2.6%).
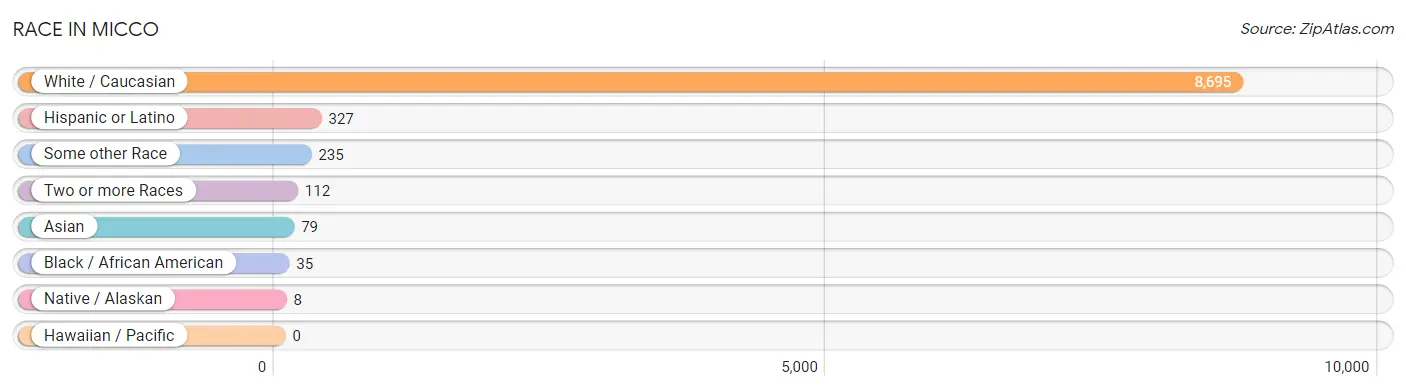
| Race | # Population | % Population |
| Asian | 79 | 0.9% |
| Black / African American | 35 | 0.4% |
| Hawaiian / Pacific | 0 | 0.0% |
| Hispanic or Latino | 327 | 3.6% |
| Native / Alaskan | 8 | 0.1% |
| White / Caucasian | 8,695 | 94.9% |
| Two or more Races | 112 | 1.2% |
| Some other Race | 235 | 2.6% |
| Total | 9,164 | 100.0% |
Ancestry in Micco
The most populous ancestries reported in Micco are Irish (1,909 | 20.8%), German (1,900 | 20.7%), English (1,440 | 15.7%), American (1,124 | 12.3%), and Italian (650 | 7.1%), together accounting for 76.6% of all Micco residents.
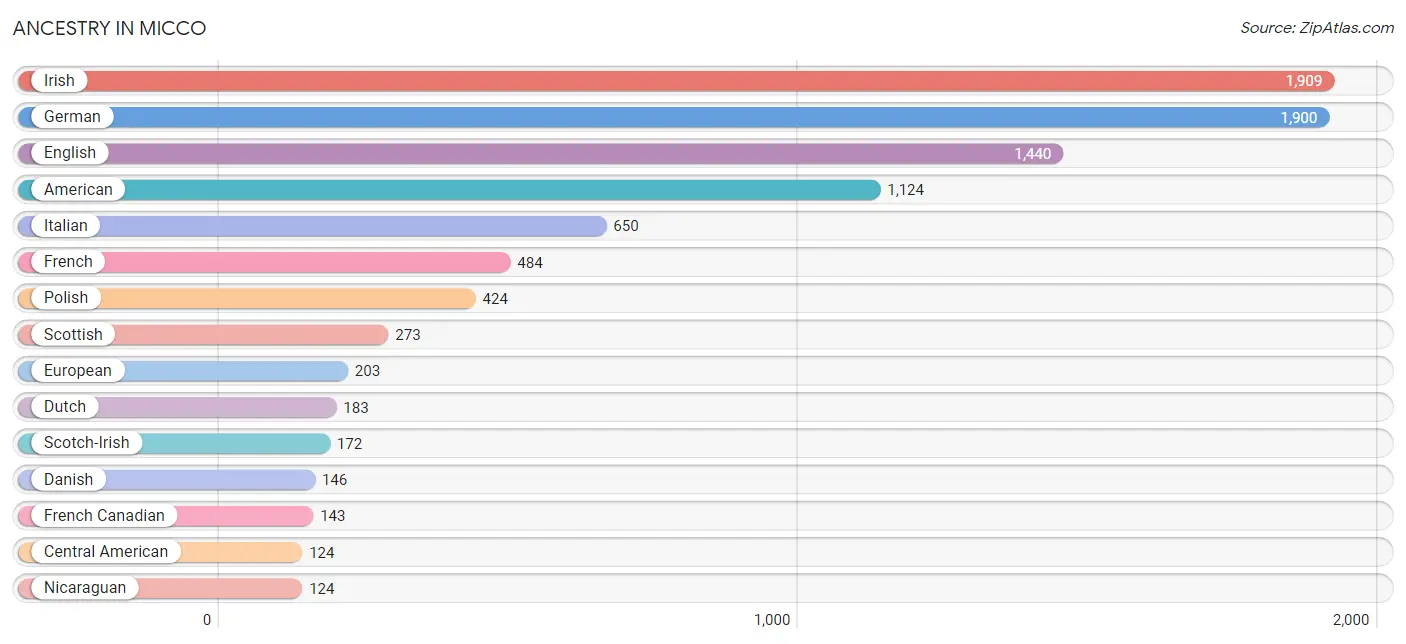
| Ancestry | # Population | % Population |
| African | 100 | 1.1% |
| American | 1,124 | 12.3% |
| Arab | 38 | 0.4% |
| Bhutanese | 5 | 0.1% |
| British | 65 | 0.7% |
| Burmese | 11 | 0.1% |
| Canadian | 106 | 1.2% |
| Central American | 124 | 1.3% |
| Colombian | 99 | 1.1% |
| Creek | 8 | 0.1% |
| Czech | 32 | 0.4% |
| Danish | 146 | 1.6% |
| Dutch | 183 | 2.0% |
| Eastern European | 18 | 0.2% |
| Egyptian | 18 | 0.2% |
| English | 1,440 | 15.7% |
| European | 203 | 2.2% |
| French | 484 | 5.3% |
| French Canadian | 143 | 1.6% |
| German | 1,900 | 20.7% |
| Greek | 68 | 0.7% |
| Hungarian | 78 | 0.9% |
| Indian (Asian) | 5 | 0.1% |
| Irish | 1,909 | 20.8% |
| Italian | 650 | 7.1% |
| Latvian | 13 | 0.1% |
| Lebanese | 20 | 0.2% |
| Lithuanian | 17 | 0.2% |
| Malaysian | 17 | 0.2% |
| Nicaraguan | 124 | 1.3% |
| Norwegian | 38 | 0.4% |
| Okinawan | 41 | 0.4% |
| Pennsylvania German | 20 | 0.2% |
| Polish | 424 | 4.6% |
| Portuguese | 72 | 0.8% |
| Puerto Rican | 104 | 1.1% |
| Romanian | 44 | 0.5% |
| Russian | 20 | 0.2% |
| Scotch-Irish | 172 | 1.9% |
| Scottish | 273 | 3.0% |
| Slovak | 16 | 0.2% |
| South American | 99 | 1.1% |
| Subsaharan African | 100 | 1.1% |
| Swedish | 111 | 1.2% |
| Swiss | 23 | 0.3% |
| Ukrainian | 65 | 0.7% |
| Welsh | 28 | 0.3% | View All 47 Rows |
Immigrants in Micco
The most numerous immigrant groups reported in Micco came from Europe (132 | 1.4%), Latin America (98 | 1.1%), Asia (74 | 0.8%), South Eastern Asia (58 | 0.6%), and Colombia (57 | 0.6%), together accounting for 4.6% of all Micco residents.
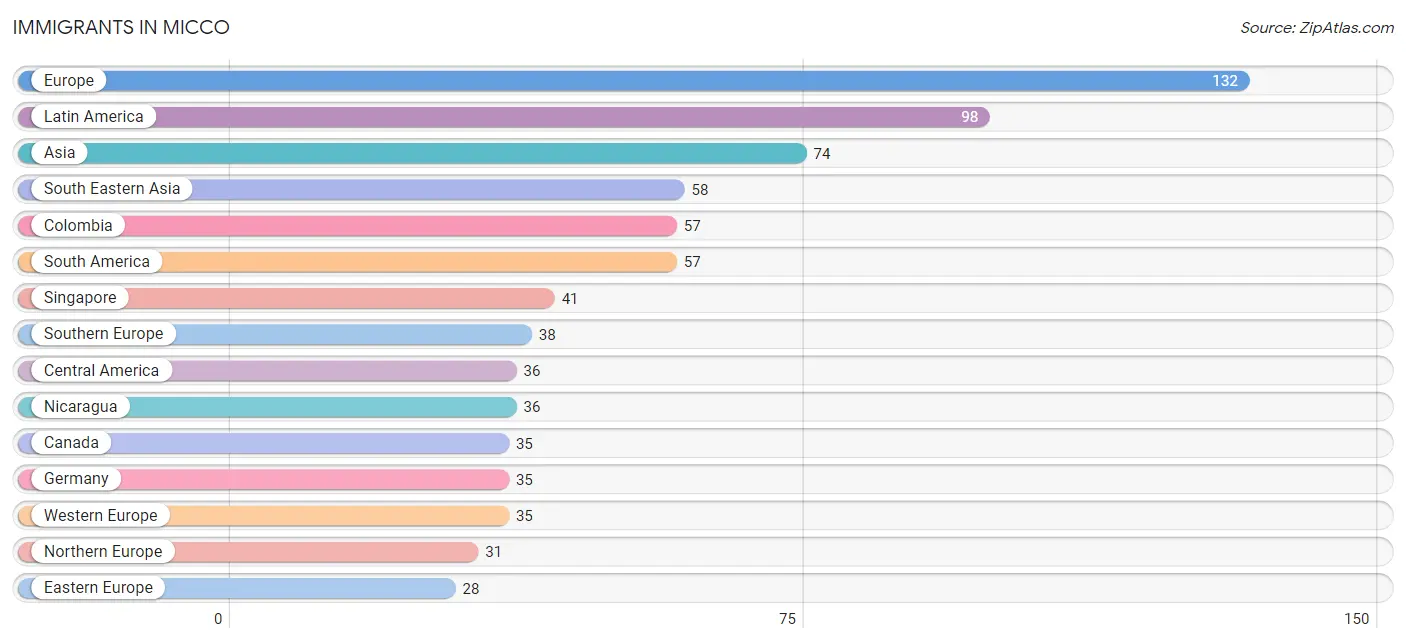
| Immigration Origin | # Population | % Population |
| Africa | 18 | 0.2% |
| Asia | 74 | 0.8% |
| Canada | 35 | 0.4% |
| Caribbean | 5 | 0.1% |
| Central America | 36 | 0.4% |
| Colombia | 57 | 0.6% |
| Czechoslovakia | 13 | 0.1% |
| Eastern Asia | 16 | 0.2% |
| Eastern Europe | 28 | 0.3% |
| Egypt | 18 | 0.2% |
| Europe | 132 | 1.4% |
| Germany | 35 | 0.4% |
| Greece | 11 | 0.1% |
| Jamaica | 5 | 0.1% |
| Japan | 5 | 0.1% |
| Korea | 11 | 0.1% |
| Laos | 17 | 0.2% |
| Latin America | 98 | 1.1% |
| Nicaragua | 36 | 0.4% |
| Northern Africa | 18 | 0.2% |
| Northern Europe | 31 | 0.3% |
| Poland | 15 | 0.2% |
| Portugal | 27 | 0.3% |
| Singapore | 41 | 0.4% |
| South America | 57 | 0.6% |
| South Eastern Asia | 58 | 0.6% |
| Southern Europe | 38 | 0.4% |
| Western Europe | 35 | 0.4% | View All 28 Rows |
Sex and Age in Micco
Sex and Age in Micco
The most populous age groups in Micco are 70 to 74 Years (744 | 17.2%) for men and 65 to 69 Years (789 | 16.4%) for women.
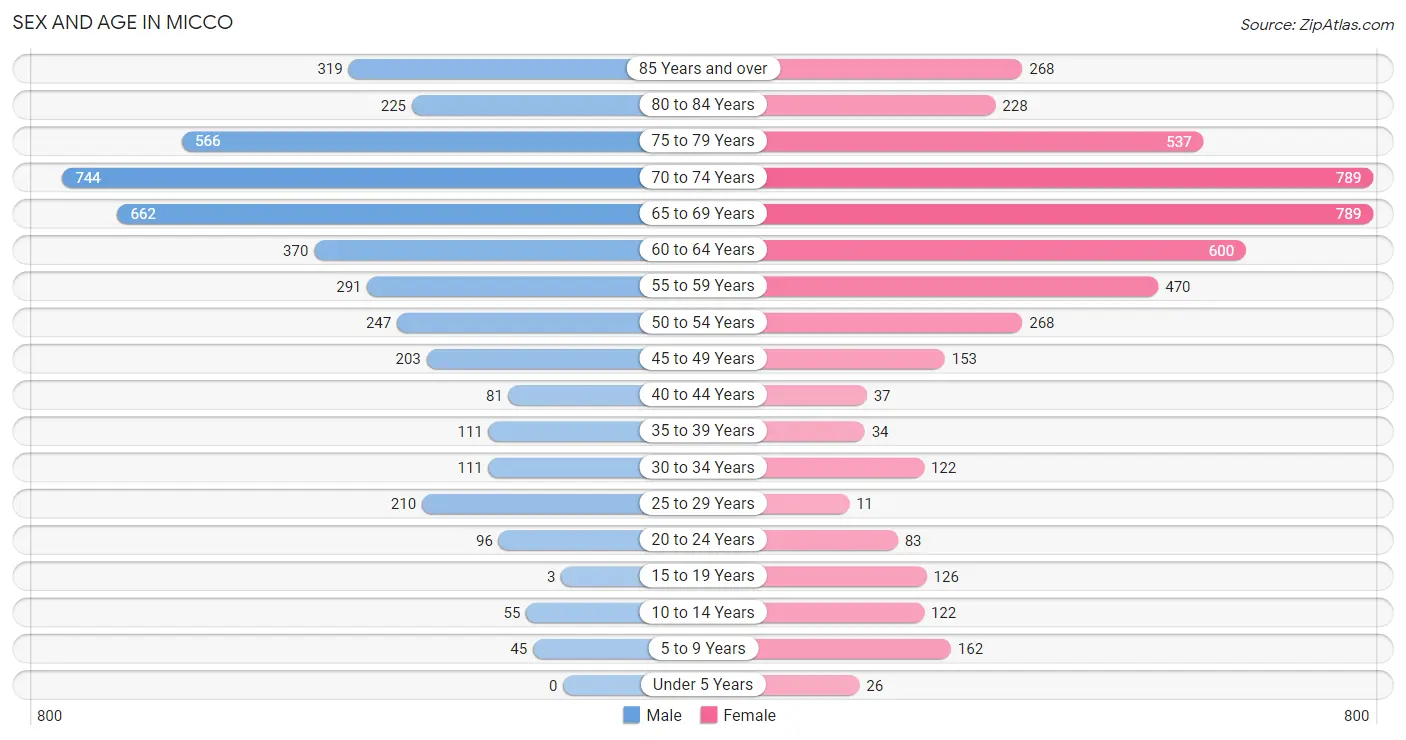
| Age Bracket | Male | Female |
| Under 5 Years | 0 (0.0%) | 26 (0.5%) |
| 5 to 9 Years | 45 (1.0%) | 162 (3.4%) |
| 10 to 14 Years | 55 (1.3%) | 122 (2.5%) |
| 15 to 19 Years | 3 (0.1%) | 126 (2.6%) |
| 20 to 24 Years | 96 (2.2%) | 83 (1.7%) |
| 25 to 29 Years | 210 (4.8%) | 11 (0.2%) |
| 30 to 34 Years | 111 (2.6%) | 122 (2.5%) |
| 35 to 39 Years | 111 (2.6%) | 34 (0.7%) |
| 40 to 44 Years | 81 (1.9%) | 37 (0.8%) |
| 45 to 49 Years | 203 (4.7%) | 153 (3.2%) |
| 50 to 54 Years | 247 (5.7%) | 268 (5.6%) |
| 55 to 59 Years | 291 (6.7%) | 470 (9.7%) |
| 60 to 64 Years | 370 (8.5%) | 600 (12.4%) |
| 65 to 69 Years | 662 (15.3%) | 789 (16.4%) |
| 70 to 74 Years | 744 (17.2%) | 789 (16.4%) |
| 75 to 79 Years | 566 (13.0%) | 537 (11.1%) |
| 80 to 84 Years | 225 (5.2%) | 228 (4.7%) |
| 85 Years and over | 319 (7.3%) | 268 (5.6%) |
| Total | 4,339 (100.0%) | 4,825 (100.0%) |
Families and Households in Micco
Median Family Size in Micco
The median family size in Micco is 2.39 persons per family, with single male/father families (146 | 5.2%) accounting for the largest median family size of 3.05 persons per family. On the other hand, married-couple families (2,308 | 82.1%) represent the smallest median family size with 2.25 persons per family.
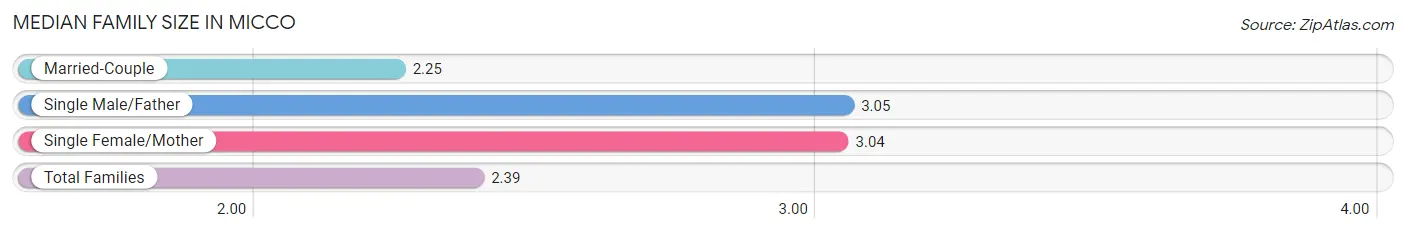
| Family Type | # Families | Family Size |
| Married-Couple | 2,308 (82.1%) | 2.25 |
| Single Male/Father | 146 (5.2%) | 3.05 |
| Single Female/Mother | 358 (12.7%) | 3.04 |
| Total Families | 2,812 (100.0%) | 2.39 |
Median Household Size in Micco
The median household size in Micco is 1.83 persons per household, with single female/mother households (358 | 7.2%) accounting for the largest median household size of 3.07 persons per household. non-family households (2,185 | 43.7%) represent the smallest median household size with 1.07 persons per household.
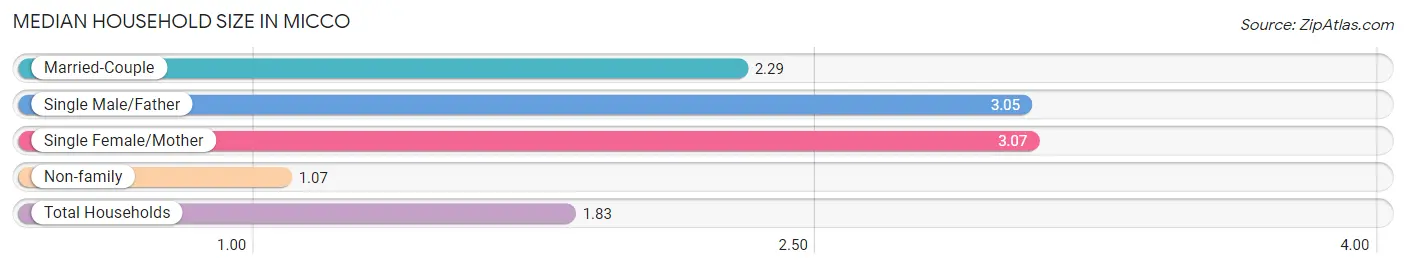
| Household Type | # Households | Household Size |
| Married-Couple | 2,308 (46.2%) | 2.29 |
| Single Male/Father | 146 (2.9%) | 3.05 |
| Single Female/Mother | 358 (7.2%) | 3.07 |
| Non-family | 2,185 (43.7%) | 1.07 |
| Total Households | 4,997 (100.0%) | 1.83 |
Household Size by Marriage Status in Micco
Out of a total of 4,997 households in Micco, 2,812 (56.3%) are family households, while 2,185 (43.7%) are nonfamily households. The most numerous type of family households are 2-person households, comprising 2,317, and the most common type of nonfamily households are 1-person households, comprising 2,056.
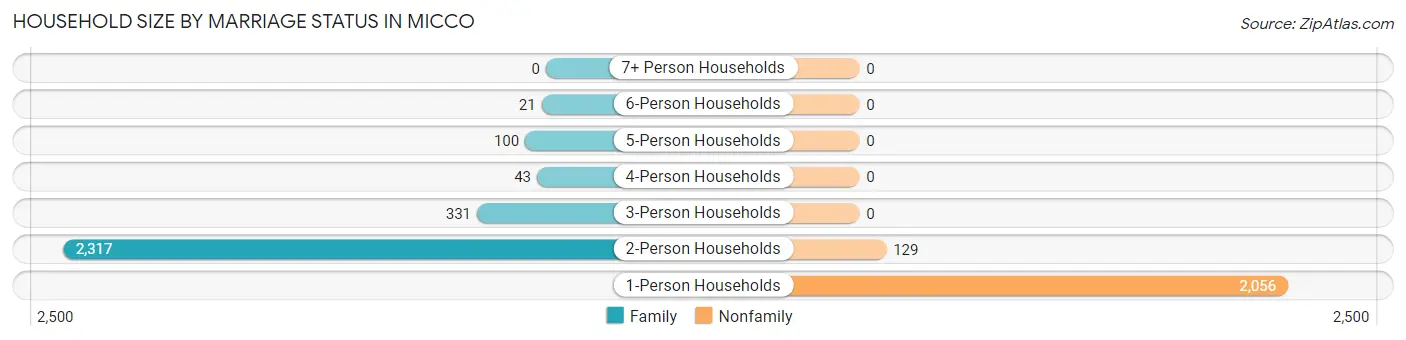
| Household Size | Family Households | Nonfamily Households |
| 1-Person Households | - | 2,056 (41.1%) |
| 2-Person Households | 2,317 (46.4%) | 129 (2.6%) |
| 3-Person Households | 331 (6.6%) | 0 (0.0%) |
| 4-Person Households | 43 (0.9%) | 0 (0.0%) |
| 5-Person Households | 100 (2.0%) | 0 (0.0%) |
| 6-Person Households | 21 (0.4%) | 0 (0.0%) |
| 7+ Person Households | 0 (0.0%) | 0 (0.0%) |
| Total | 2,812 (56.3%) | 2,185 (43.7%) |
Female Fertility in Micco
Fertility by Age in Micco
| Age Bracket | Women with Births | Births / 1,000 Women |
| 15 to 19 years | 0 (0.0%) | 0.0 |
| 20 to 34 years | 0 (0.0%) | 0.0 |
| 35 to 50 years | 0 (0.0%) | 0.0 |
| Total | 0 (0.0%) | 0.0 |
Fertility by Age by Marriage Status in Micco
| Age Bracket | Married | Unmarried |
| 15 to 19 years | 0 (0.0%) | 0 (0.0%) |
| 20 to 34 years | 0 (0.0%) | 0 (0.0%) |
| 35 to 50 years | 0 (0.0%) | 0 (0.0%) |
| Total | 0 (0.0%) | 0 (0.0%) |
Fertility by Education in Micco
| Educational Attainment | Women with Births | Births / 1,000 Women |
| Less than High School | 0 (0.0%) | 0.0 |
| High School Diploma | 0 (0.0%) | 0.0 |
| College or Associate's Degree | 0 (0.0%) | 0.0 |
| Bachelor's Degree | 0 (0.0%) | 0.0 |
| Graduate Degree | 0 (0.0%) | 0.0 |
| Total | 0 (0.0%) | 0.0 |
Fertility by Education by Marriage Status in Micco
| Educational Attainment | Married | Unmarried |
| Less than High School | 0 (0.0%) | 0 (0.0%) |
| High School Diploma | 0 (0.0%) | 0 (0.0%) |
| College or Associate's Degree | 0 (0.0%) | 0 (0.0%) |
| Bachelor's Degree | 0 (0.0%) | 0 (0.0%) |
| Graduate Degree | 0 (0.0%) | 0 (0.0%) |
| Total | 0 (0.0%) | 0 (0.0%) |
Income in Micco
Income Overview in Micco
Per Capita Income in Micco is $34,982, while median incomes of families and households are $58,342 and $46,434 respectively.
| Characteristic | Number | Measure |
| Per Capita Income | 9,164 | $34,982 |
| Median Family Income | 2,812 | $58,342 |
| Mean Family Income | 2,812 | $81,448 |
| Median Household Income | 4,997 | $46,434 |
| Mean Household Income | 4,997 | $62,795 |
| Income Deficit | 2,812 | $0 |
| Wage / Income Gap (%) | 9,164 | 16.64% |
| Wage / Income Gap ($) | 9,164 | 83.36¢ per $1 |
| Gini / Inequality Index | 9,164 | 0.42 |
Earnings by Sex in Micco
Average Earnings in Micco are $29,915, $28,511 for men and $34,202 for women, a difference of 16.6%.
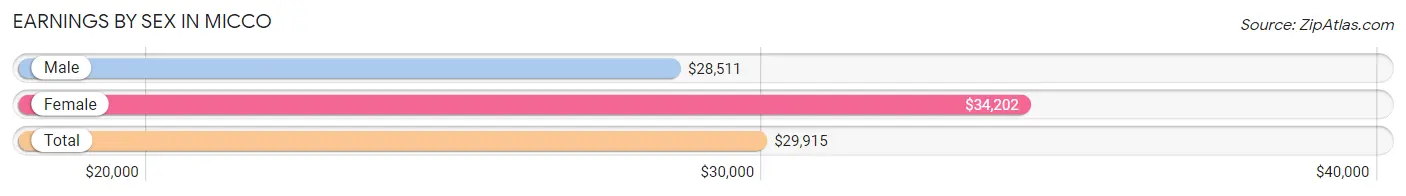
| Sex | Number | Average Earnings |
| Male | 1,462 (50.8%) | $28,511 |
| Female | 1,417 (49.2%) | $34,202 |
| Total | 2,879 (100.0%) | $29,915 |
Earnings by Sex by Income Bracket in Micco
The most common earnings brackets in Micco are $100,000+ for men (264 | 18.1%) and $75,000 to $99,999 for women (246 | 17.4%).
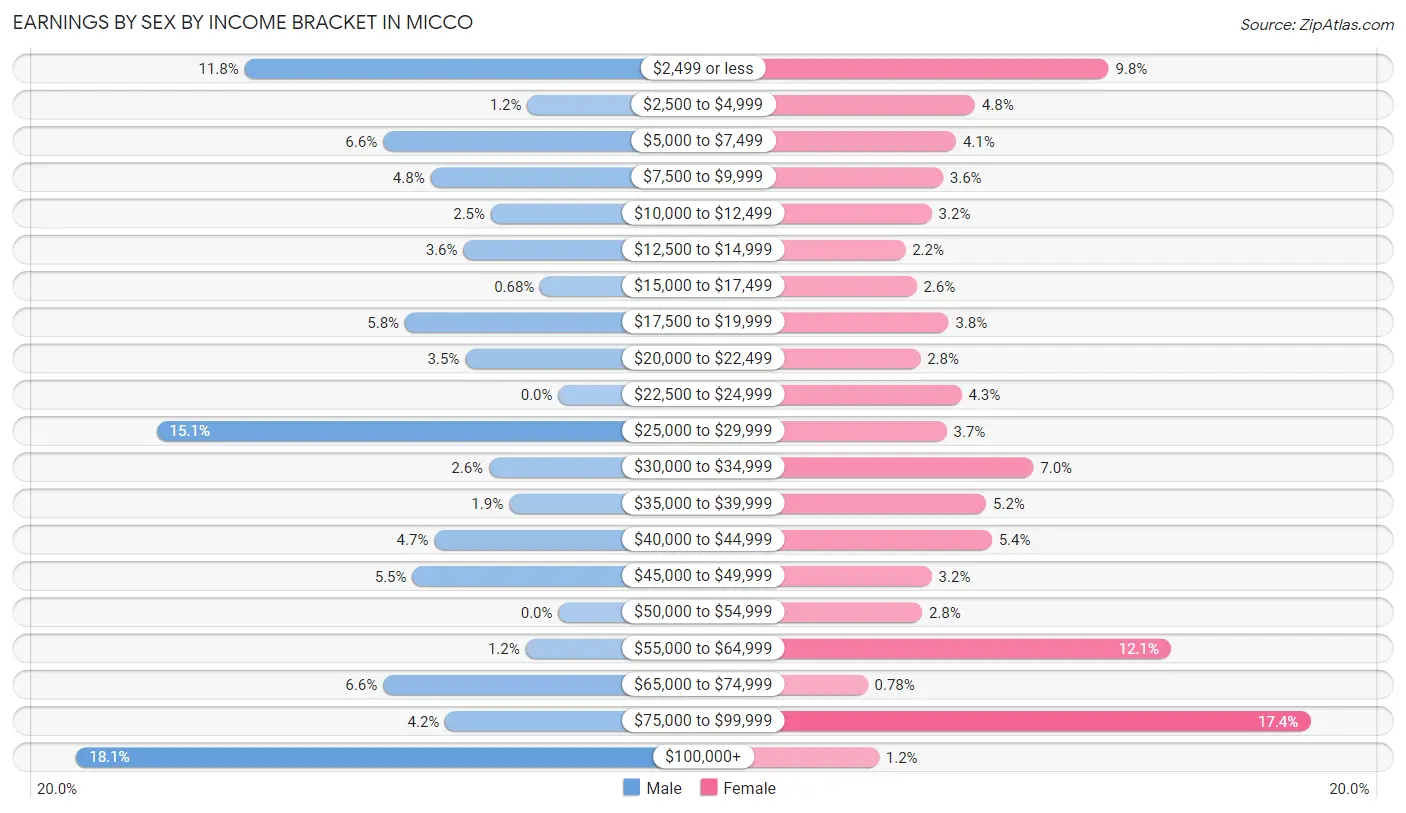
| Income | Male | Female |
| $2,499 or less | 172 (11.8%) | 139 (9.8%) |
| $2,500 to $4,999 | 17 (1.2%) | 68 (4.8%) |
| $5,000 to $7,499 | 96 (6.6%) | 58 (4.1%) |
| $7,500 to $9,999 | 70 (4.8%) | 51 (3.6%) |
| $10,000 to $12,499 | 37 (2.5%) | 45 (3.2%) |
| $12,500 to $14,999 | 52 (3.6%) | 31 (2.2%) |
| $15,000 to $17,499 | 10 (0.7%) | 37 (2.6%) |
| $17,500 to $19,999 | 84 (5.8%) | 54 (3.8%) |
| $20,000 to $22,499 | 51 (3.5%) | 39 (2.8%) |
| $22,500 to $24,999 | 0 (0.0%) | 61 (4.3%) |
| $25,000 to $29,999 | 220 (15.0%) | 53 (3.7%) |
| $30,000 to $34,999 | 38 (2.6%) | 99 (7.0%) |
| $35,000 to $39,999 | 27 (1.8%) | 74 (5.2%) |
| $40,000 to $44,999 | 68 (4.6%) | 77 (5.4%) |
| $45,000 to $49,999 | 80 (5.5%) | 45 (3.2%) |
| $50,000 to $54,999 | 0 (0.0%) | 40 (2.8%) |
| $55,000 to $64,999 | 18 (1.2%) | 172 (12.1%) |
| $65,000 to $74,999 | 96 (6.6%) | 11 (0.8%) |
| $75,000 to $99,999 | 62 (4.2%) | 246 (17.4%) |
| $100,000+ | 264 (18.1%) | 17 (1.2%) |
| Total | 1,462 (100.0%) | 1,417 (100.0%) |
Earnings by Sex by Educational Attainment in Micco
Average earnings in Micco are $28,941 for men and $38,514 for women, a difference of 24.9%. Men with an educational attainment of college or associate's degree enjoy the highest average annual earnings of $43,403, while those with less than high school education earn the least with $2,499. Women with an educational attainment of bachelor's degree earn the most with the average annual earnings of $61,740, while those with high school diploma education have the smallest earnings of $20,929.
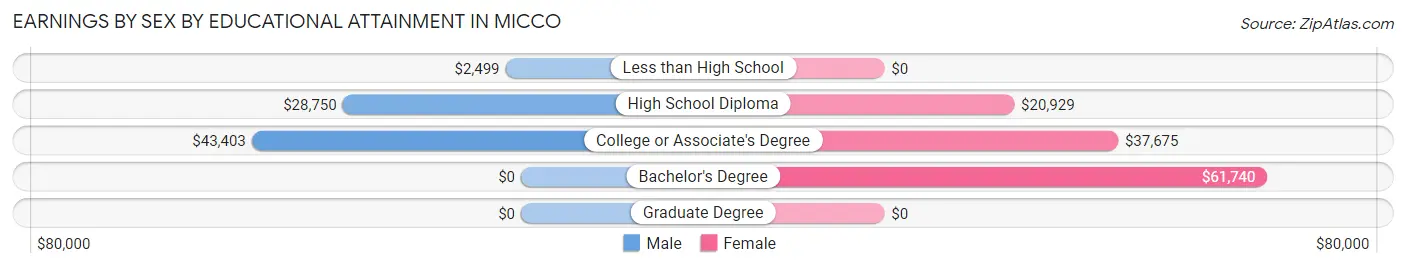
| Educational Attainment | Male Income | Female Income |
| Less than High School | $2,499 | $0 |
| High School Diploma | $28,750 | $20,929 |
| College or Associate's Degree | $43,403 | $37,675 |
| Bachelor's Degree | - | - |
| Graduate Degree | - | - |
| Total | $28,941 | $38,514 |
Family Income in Micco
Family Income Brackets in Micco
According to the Micco family income data, there are 745 families falling into the $35,000 to $49,999 income range, which is the most common income bracket and makes up 26.5% of all families. Conversely, the $10,000 to $14,999 income bracket is the least frequent group with only 42 families (1.5%) belonging to this category.
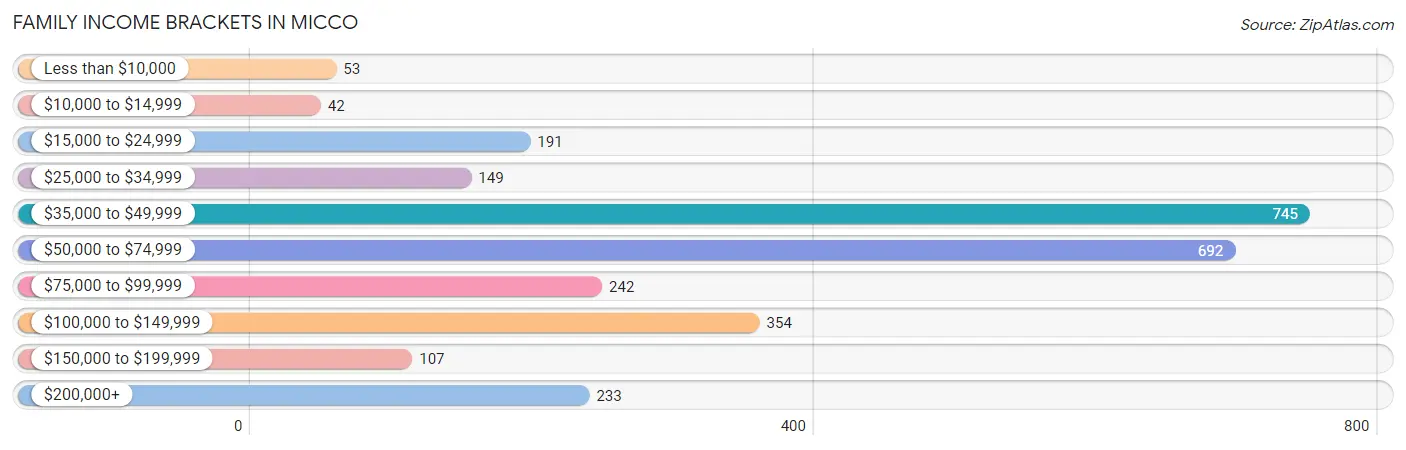
| Income Bracket | # Families | % Families |
| Less than $10,000 | 53 | 1.9% |
| $10,000 to $14,999 | 42 | 1.5% |
| $15,000 to $24,999 | 191 | 6.8% |
| $25,000 to $34,999 | 149 | 5.3% |
| $35,000 to $49,999 | 745 | 26.5% |
| $50,000 to $74,999 | 692 | 24.6% |
| $75,000 to $99,999 | 242 | 8.6% |
| $100,000 to $149,999 | 354 | 12.6% |
| $150,000 to $199,999 | 107 | 3.8% |
| $200,000+ | 233 | 8.3% |
Family Income by Famaliy Size in Micco
3-person families (320 | 11.4%) account for the highest median family income in Micco with $59,375 per family, while 2-person families (2,328 | 82.8%) have the highest median income of $26,888 per family member.
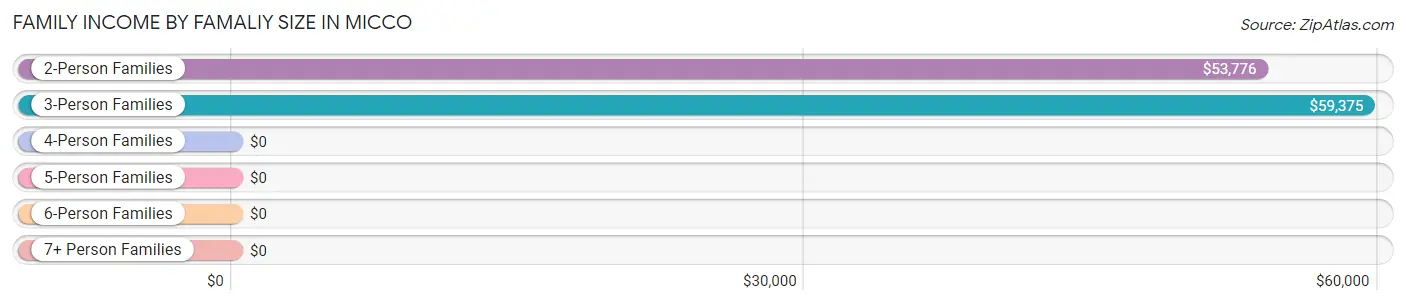
| Income Bracket | # Families | Median Income |
| 2-Person Families | 2,328 (82.8%) | $53,776 |
| 3-Person Families | 320 (11.4%) | $59,375 |
| 4-Person Families | 107 (3.8%) | $0 |
| 5-Person Families | 36 (1.3%) | $0 |
| 6-Person Families | 21 (0.7%) | $0 |
| 7+ Person Families | 0 (0.0%) | $0 |
| Total | 2,812 (100.0%) | $58,342 |
Family Income by Number of Earners in Micco
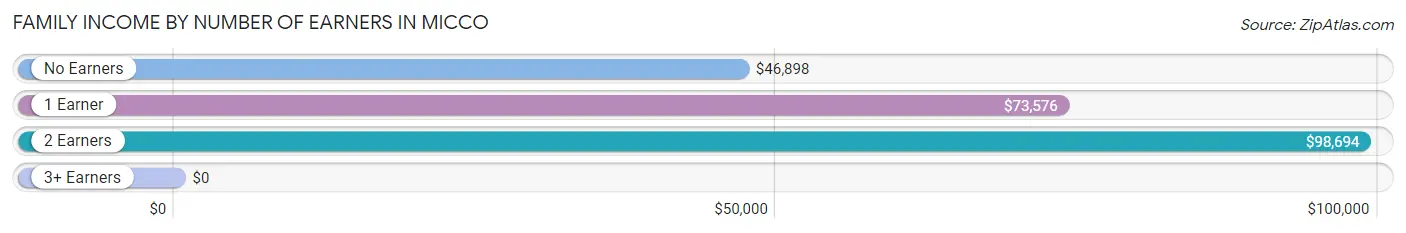
| Number of Earners | # Families | Median Income |
| No Earners | 1,625 (57.8%) | $46,898 |
| 1 Earner | 461 (16.4%) | $73,576 |
| 2 Earners | 645 (22.9%) | $98,694 |
| 3+ Earners | 81 (2.9%) | $0 |
| Total | 2,812 (100.0%) | $58,342 |
Household Income in Micco
Household Income Brackets in Micco
With 1,114 households falling in the category, the $35,000 to $49,999 income range is the most frequent in Micco, accounting for 22.3% of all households. In contrast, only 170 households (3.4%) fall into the $150,000 to $199,999 income bracket, making it the least populous group.
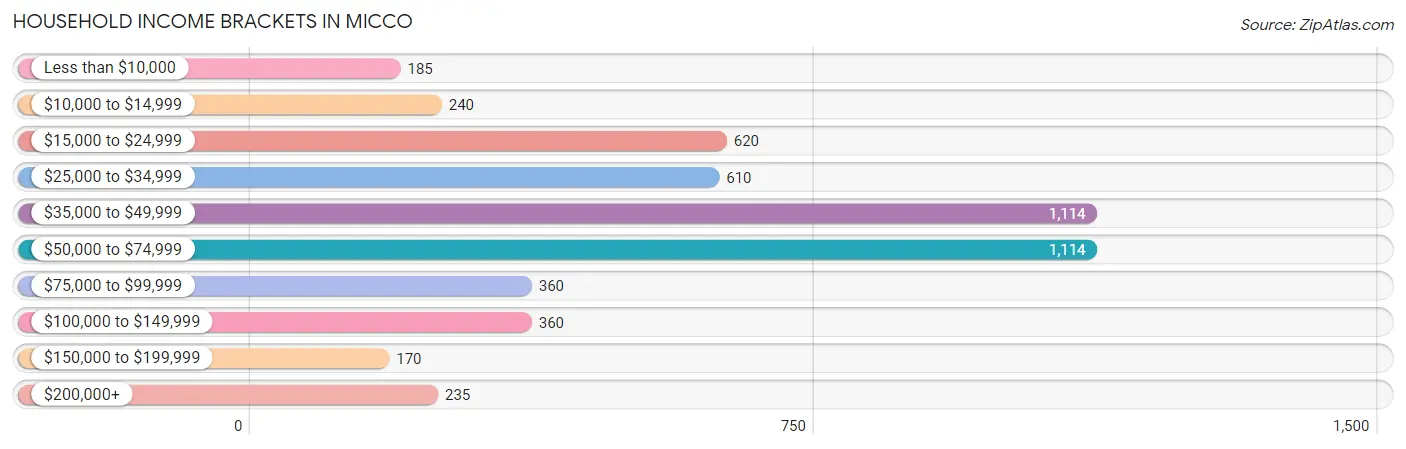
| Income Bracket | # Households | % Households |
| Less than $10,000 | 185 | 3.7% |
| $10,000 to $14,999 | 240 | 4.8% |
| $15,000 to $24,999 | 620 | 12.4% |
| $25,000 to $34,999 | 610 | 12.2% |
| $35,000 to $49,999 | 1,114 | 22.3% |
| $50,000 to $74,999 | 1,114 | 22.3% |
| $75,000 to $99,999 | 360 | 7.2% |
| $100,000 to $149,999 | 360 | 7.2% |
| $150,000 to $199,999 | 170 | 3.4% |
| $200,000+ | 235 | 4.7% |
Household Income by Householder Age in Micco
The median household income in Micco is $46,434, with the highest median household income of $65,903 found in the 25 to 44 years age bracket for the primary householder. A total of 198 households (4.0%) fall into this category. Meanwhile, the 15 to 24 years age bracket for the primary householder has the lowest median household income of $0, with 30 households (0.6%) in this group.
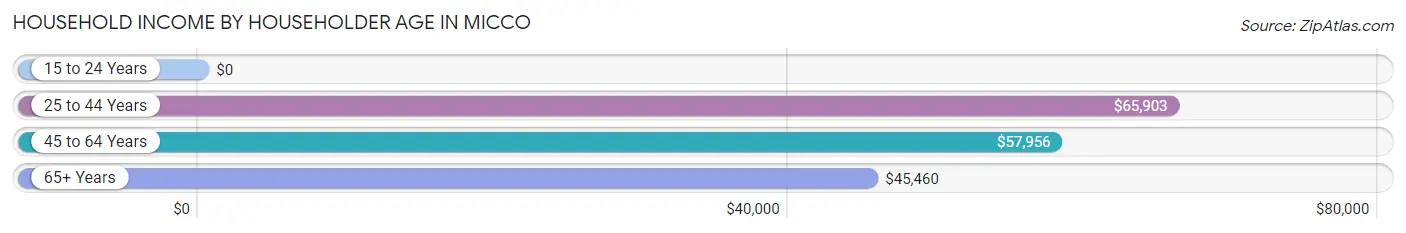
| Income Bracket | # Households | Median Income |
| 15 to 24 Years | 30 (0.6%) | $0 |
| 25 to 44 Years | 198 (4.0%) | $65,903 |
| 45 to 64 Years | 1,293 (25.9%) | $57,956 |
| 65+ Years | 3,476 (69.6%) | $45,460 |
| Total | 4,997 (100.0%) | $46,434 |
Poverty in Micco
Income Below Poverty by Sex and Age in Micco
With 9.8% poverty level for males and 7.7% for females among the residents of Micco, 15 year old males and 55 to 64 year old females are the most vulnerable to poverty, with 3 males (100.0%) and 155 females (14.5%) in their respective age groups living below the poverty level.
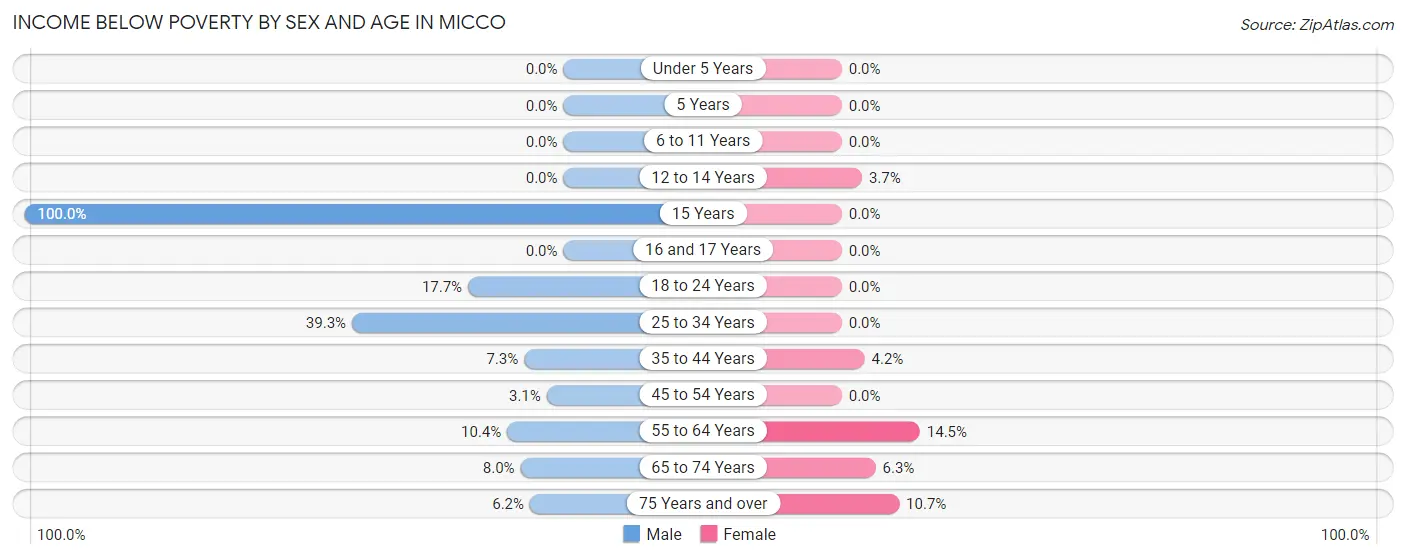
| Age Bracket | Male | Female |
| Under 5 Years | 0 (0.0%) | 0 (0.0%) |
| 5 Years | 0 (0.0%) | 0 (0.0%) |
| 6 to 11 Years | 0 (0.0%) | 0 (0.0%) |
| 12 to 14 Years | 0 (0.0%) | 4 (3.7%) |
| 15 Years | 3 (100.0%) | 0 (0.0%) |
| 16 and 17 Years | 0 (0.0%) | 0 (0.0%) |
| 18 to 24 Years | 17 (17.7%) | 0 (0.0%) |
| 25 to 34 Years | 126 (39.3%) | 0 (0.0%) |
| 35 to 44 Years | 14 (7.3%) | 3 (4.2%) |
| 45 to 54 Years | 14 (3.1%) | 0 (0.0%) |
| 55 to 64 Years | 69 (10.4%) | 155 (14.5%) |
| 65 to 74 Years | 112 (8.0%) | 99 (6.3%) |
| 75 Years and over | 69 (6.2%) | 110 (10.6%) |
| Total | 424 (9.8%) | 371 (7.7%) |
Income Above Poverty by Sex and Age in Micco
According to the poverty statistics in Micco, males aged 6 to 11 years and females aged under 5 years are the age groups that are most secure financially, with 100.0% of males and 100.0% of females in these age groups living above the poverty line.
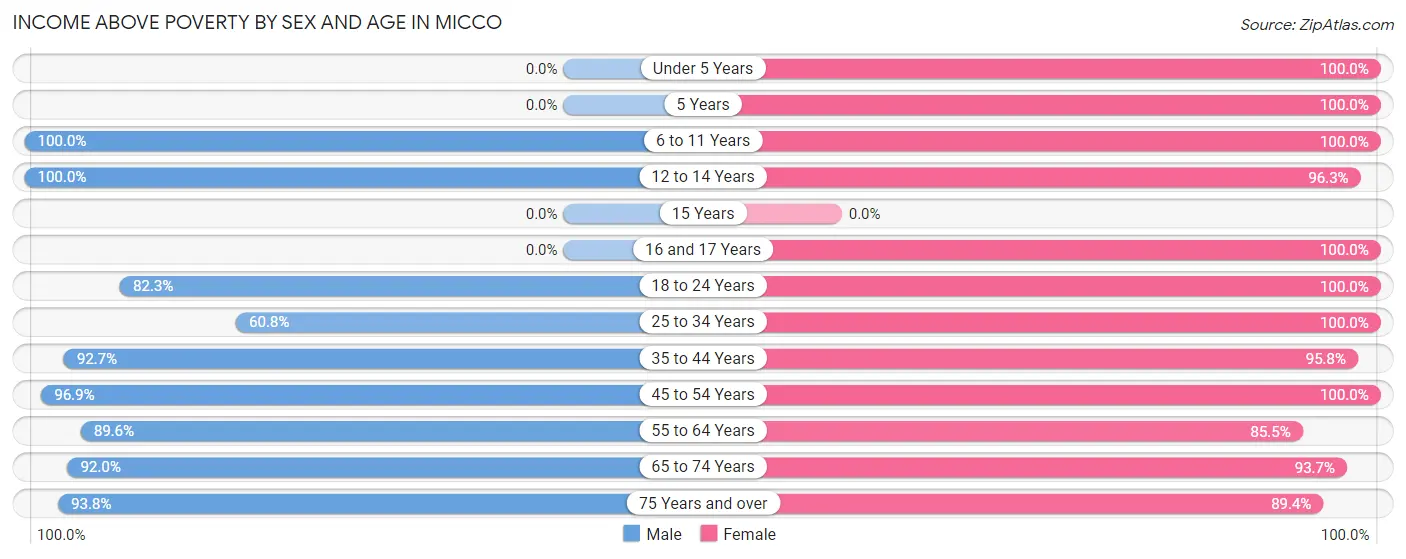
| Age Bracket | Male | Female |
| Under 5 Years | 0 (0.0%) | 26 (100.0%) |
| 5 Years | 0 (0.0%) | 30 (100.0%) |
| 6 to 11 Years | 71 (100.0%) | 147 (100.0%) |
| 12 to 14 Years | 29 (100.0%) | 103 (96.3%) |
| 15 Years | 0 (0.0%) | 0 (0.0%) |
| 16 and 17 Years | 0 (0.0%) | 80 (100.0%) |
| 18 to 24 Years | 79 (82.3%) | 129 (100.0%) |
| 25 to 34 Years | 195 (60.8%) | 133 (100.0%) |
| 35 to 44 Years | 178 (92.7%) | 68 (95.8%) |
| 45 to 54 Years | 436 (96.9%) | 421 (100.0%) |
| 55 to 64 Years | 592 (89.6%) | 915 (85.5%) |
| 65 to 74 Years | 1,294 (92.0%) | 1,479 (93.7%) |
| 75 Years and over | 1,041 (93.8%) | 923 (89.3%) |
| Total | 3,915 (90.2%) | 4,454 (92.3%) |
Income Below Poverty Among Married-Couple Families in Micco
The poverty statistics for married-couple families in Micco show that 5.2% or 120 of the total 2,308 families live below the poverty line. Families with no children have the highest poverty rate of 5.3%, comprising of 116 families. On the other hand, families with 3 or 4 children have the lowest poverty rate of 0.0%, which includes 0 families.
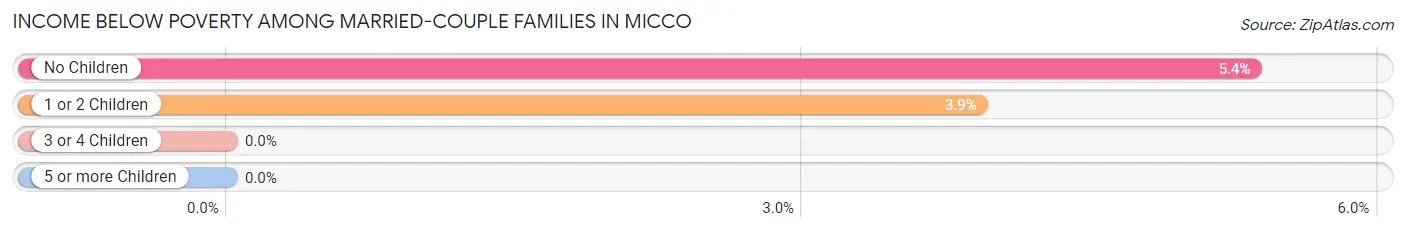
| Children | Above Poverty | Below Poverty |
| No Children | 2,054 (94.7%) | 116 (5.3%) |
| 1 or 2 Children | 98 (96.1%) | 4 (3.9%) |
| 3 or 4 Children | 36 (100.0%) | 0 (0.0%) |
| 5 or more Children | 0 (0.0%) | 0 (0.0%) |
| Total | 2,188 (94.8%) | 120 (5.2%) |
Income Below Poverty Among Single-Parent Households in Micco
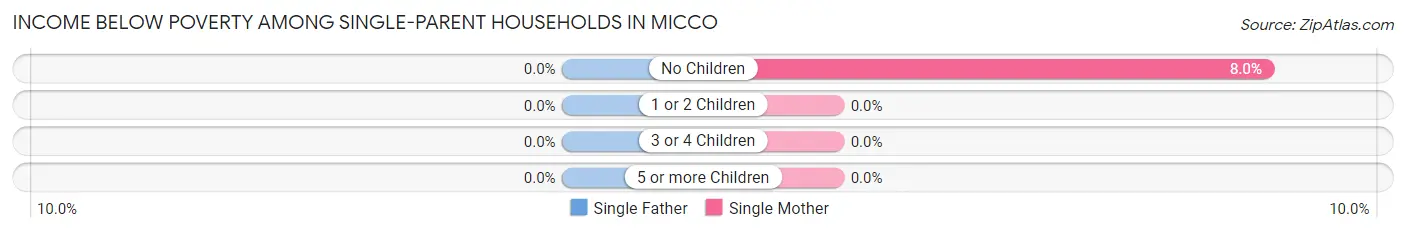
| Children | Single Father | Single Mother |
| No Children | 0 (0.0%) | 27 (8.0%) |
| 1 or 2 Children | 0 (0.0%) | 0 (0.0%) |
| 3 or 4 Children | 0 (0.0%) | 0 (0.0%) |
| 5 or more Children | 0 (0.0%) | 0 (0.0%) |
| Total | 0 (0.0%) | 27 (7.5%) |
Income Below Poverty Among Married-Couple vs Single-Parent Households in Micco
The poverty data for Micco shows that 120 of the married-couple family households (5.2%) and 27 of the single-parent households (5.4%) are living below the poverty level. Within the married-couple family households, those with no children have the highest poverty rate, with 116 households (5.3%) falling below the poverty line. Among the single-parent households, those with no children have the highest poverty rate, with 27 household (6.3%) living below poverty.
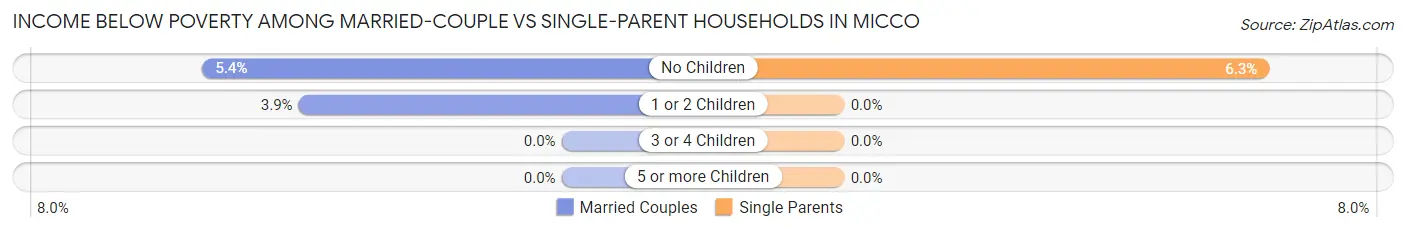
| Children | Married-Couple Families | Single-Parent Households |
| No Children | 116 (5.3%) | 27 (6.3%) |
| 1 or 2 Children | 4 (3.9%) | 0 (0.0%) |
| 3 or 4 Children | 0 (0.0%) | 0 (0.0%) |
| 5 or more Children | 0 (0.0%) | 0 (0.0%) |
| Total | 120 (5.2%) | 27 (5.4%) |
Employment Characteristics in Micco
Employment by Class of Employer in Micco
Among the 2,483 employed individuals in Micco, private company employees (1,912 | 77.0%), self-employed (not incorporated) (198 | 8.0%), and self-employed (incorporated) (107 | 4.3%) make up the most common classes of employment.
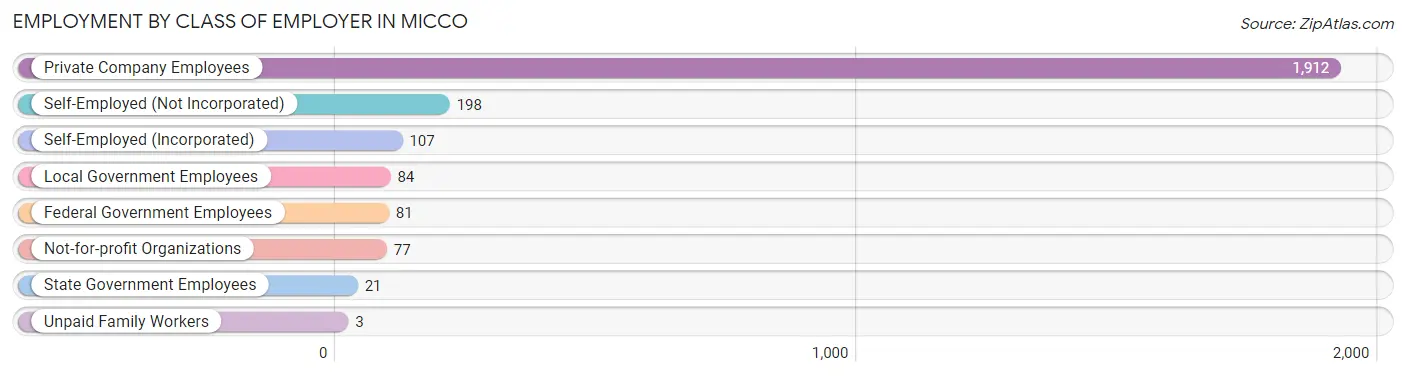
| Employer Class | # Employees | % Employees |
| Private Company Employees | 1,912 | 77.0% |
| Self-Employed (Incorporated) | 107 | 4.3% |
| Self-Employed (Not Incorporated) | 198 | 8.0% |
| Not-for-profit Organizations | 77 | 3.1% |
| Local Government Employees | 84 | 3.4% |
| State Government Employees | 21 | 0.9% |
| Federal Government Employees | 81 | 3.3% |
| Unpaid Family Workers | 3 | 0.1% |
| Total | 2,483 | 100.0% |
Employment Status by Age in Micco
According to the labor force statistics for Micco, out of the total population over 16 years of age (8,751), 30.5% or 2,669 individuals are in the labor force, with 5.7% or 152 of them unemployed. The age group with the highest labor force participation rate is 35 to 44 years, with 82.1% or 216 individuals in the labor force. Within the labor force, the 16 to 19 years age range has the highest percentage of unemployed individuals, with 63.9% or 46 of them being unemployed.
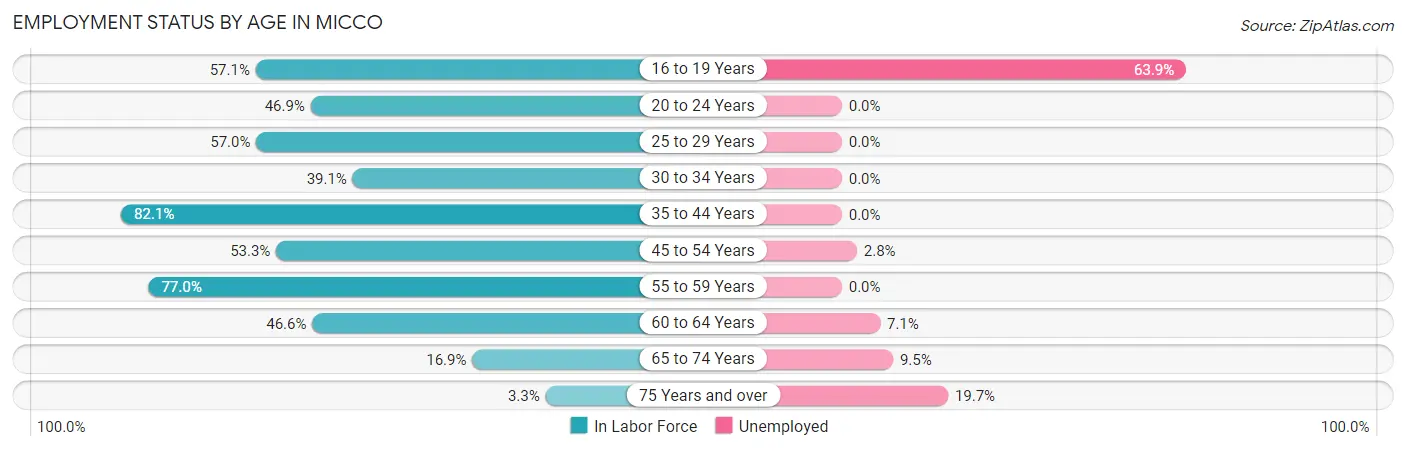
| Age Bracket | In Labor Force | Unemployed |
| 16 to 19 Years | 72 (57.1%) | 46 (63.9%) |
| 20 to 24 Years | 84 (46.9%) | 0 (0.0%) |
| 25 to 29 Years | 126 (57.0%) | 0 (0.0%) |
| 30 to 34 Years | 91 (39.1%) | 0 (0.0%) |
| 35 to 44 Years | 216 (82.1%) | 0 (0.0%) |
| 45 to 54 Years | 464 (53.3%) | 13 (2.8%) |
| 55 to 59 Years | 586 (77.0%) | 0 (0.0%) |
| 60 to 64 Years | 452 (46.6%) | 32 (7.1%) |
| 65 to 74 Years | 504 (16.9%) | 48 (9.5%) |
| 75 Years and over | 71 (3.3%) | 14 (19.7%) |
| Total | 2,669 (30.5%) | 152 (5.7%) |
Employment Status by Educational Attainment in Micco
According to labor force statistics for Micco, 58.3% of individuals (1,935) out of the total population between 25 and 64 years of age (3,319) are in the labor force, with 2.3% or 45 of them being unemployed. The group with the highest labor force participation rate are those with the educational attainment of college / associate degree, with 65.7% or 846 individuals in the labor force. Within the labor force, individuals with college / associate degree education have the highest percentage of unemployment, with 3.5% or 30 of them being unemployed.
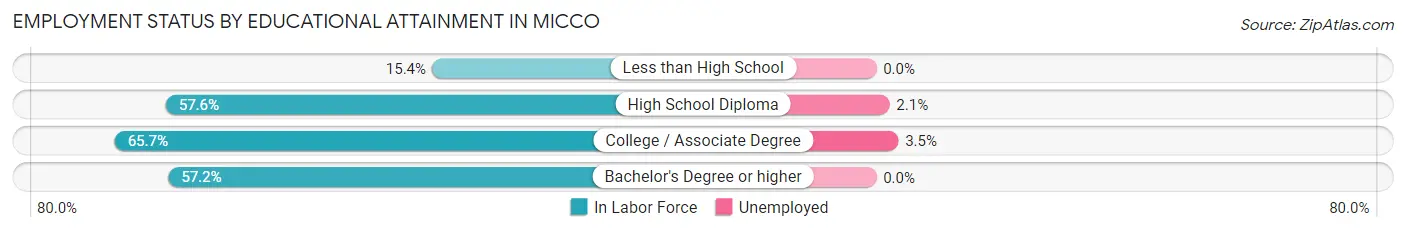
| Educational Attainment | In Labor Force | Unemployed |
| Less than High School | 29 (15.4%) | 0 (0.0%) |
| High School Diploma | 719 (57.6%) | 26 (2.1%) |
| College / Associate Degree | 846 (65.7%) | 45 (3.5%) |
| Bachelor's Degree or higher | 341 (57.2%) | 0 (0.0%) |
| Total | 1,935 (58.3%) | 76 (2.3%) |
Employment Occupations by Sex in Micco
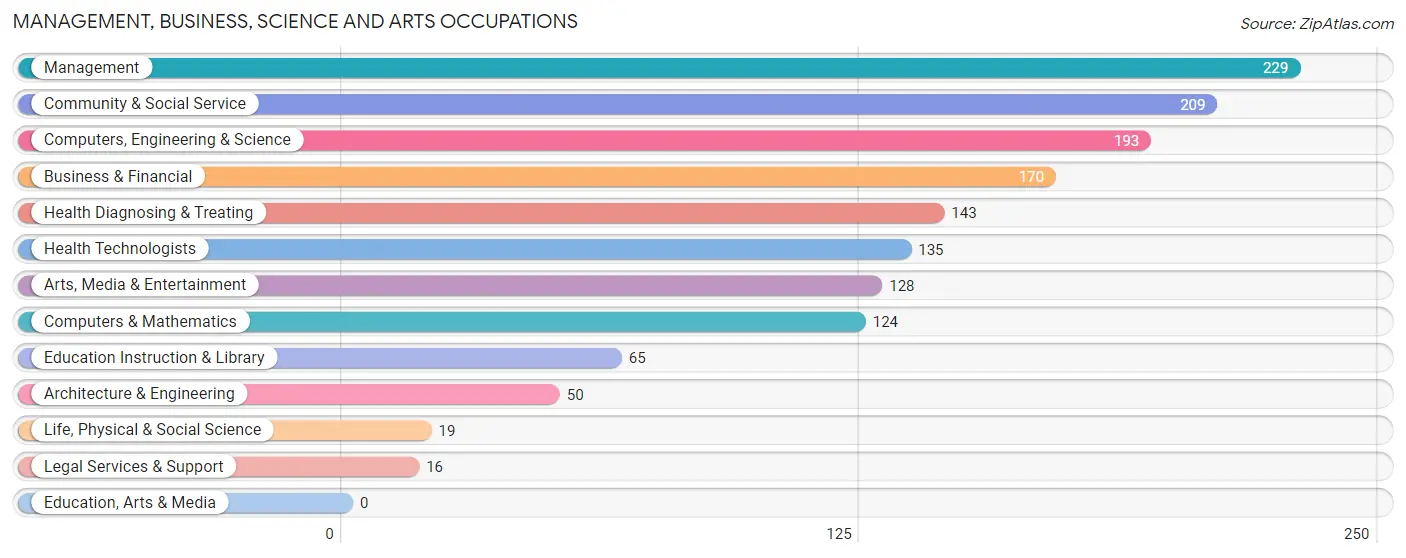
Management, Business, Science and Arts Occupations
The most common Management, Business, Science and Arts occupations in Micco are Management (229 | 9.1%), Community & Social Service (209 | 8.3%), Computers, Engineering & Science (193 | 7.7%), Business & Financial (170 | 6.8%), and Health Diagnosing & Treating (143 | 5.7%).
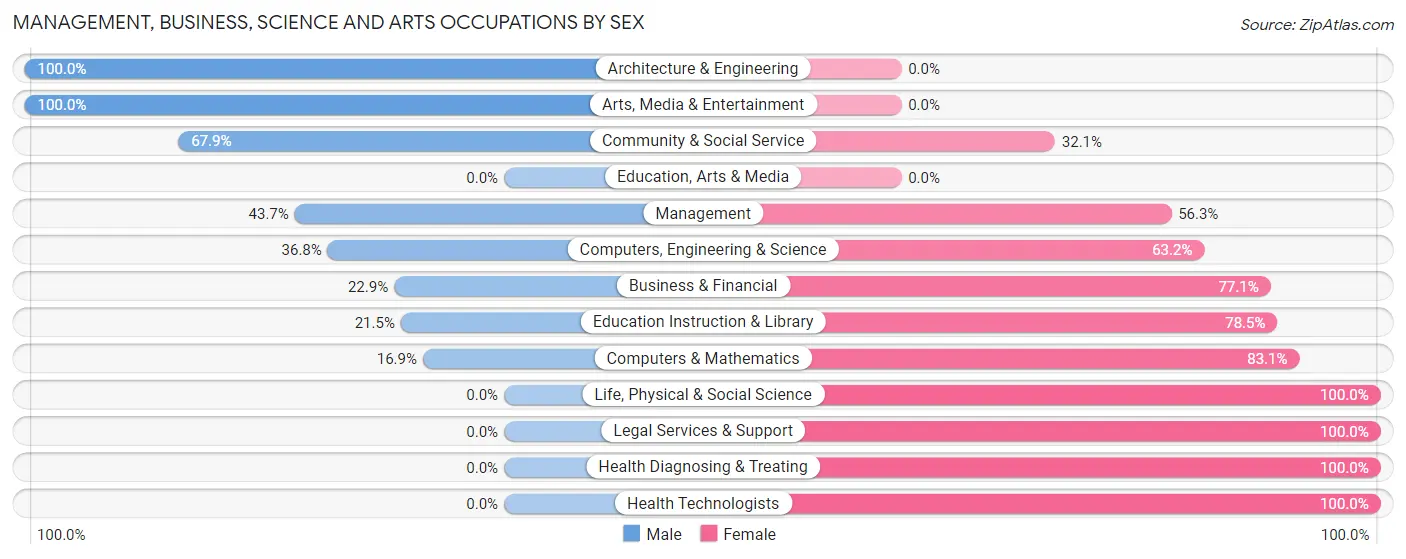
Management, Business, Science and Arts Occupations by Sex
Within the Management, Business, Science and Arts occupations in Micco, the most male-oriented occupations are Architecture & Engineering (100.0%), Arts, Media & Entertainment (100.0%), and Community & Social Service (67.9%), while the most female-oriented occupations are Life, Physical & Social Science (100.0%), Legal Services & Support (100.0%), and Health Diagnosing & Treating (100.0%).
| Occupation | Male | Female |
| Management | 100 (43.7%) | 129 (56.3%) |
| Business & Financial | 39 (22.9%) | 131 (77.1%) |
| Computers, Engineering & Science | 71 (36.8%) | 122 (63.2%) |
| Computers & Mathematics | 21 (16.9%) | 103 (83.1%) |
| Architecture & Engineering | 50 (100.0%) | 0 (0.0%) |
| Life, Physical & Social Science | 0 (0.0%) | 19 (100.0%) |
| Community & Social Service | 142 (67.9%) | 67 (32.1%) |
| Education, Arts & Media | 0 (0.0%) | 0 (0.0%) |
| Legal Services & Support | 0 (0.0%) | 16 (100.0%) |
| Education Instruction & Library | 14 (21.5%) | 51 (78.5%) |
| Arts, Media & Entertainment | 128 (100.0%) | 0 (0.0%) |
| Health Diagnosing & Treating | 0 (0.0%) | 143 (100.0%) |
| Health Technologists | 0 (0.0%) | 135 (100.0%) |
| Total (Category) | 352 (37.3%) | 592 (62.7%) |
| Total (Overall) | 1,303 (51.8%) | 1,211 (48.2%) |
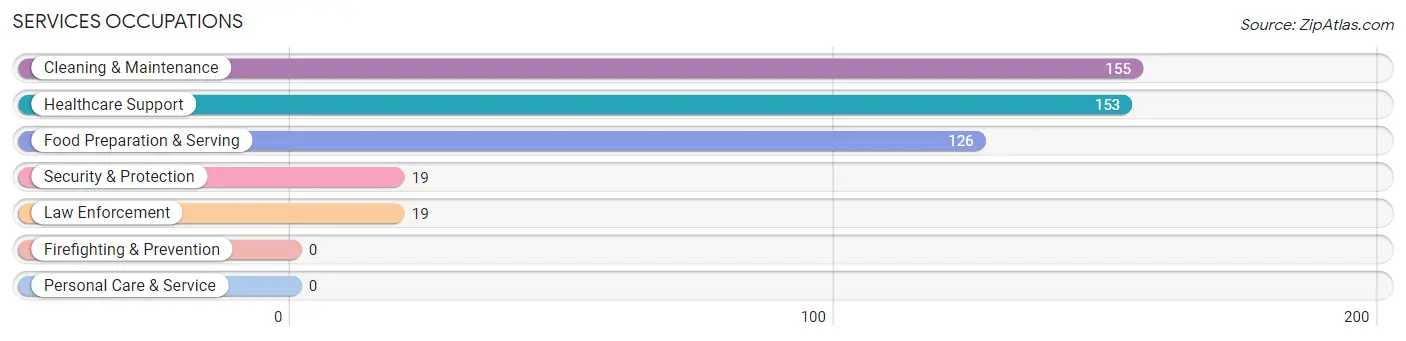
Services Occupations
The most common Services occupations in Micco are Cleaning & Maintenance (155 | 6.2%), Healthcare Support (153 | 6.1%), Food Preparation & Serving (126 | 5.0%), Security & Protection (19 | 0.8%), and Law Enforcement (19 | 0.8%).
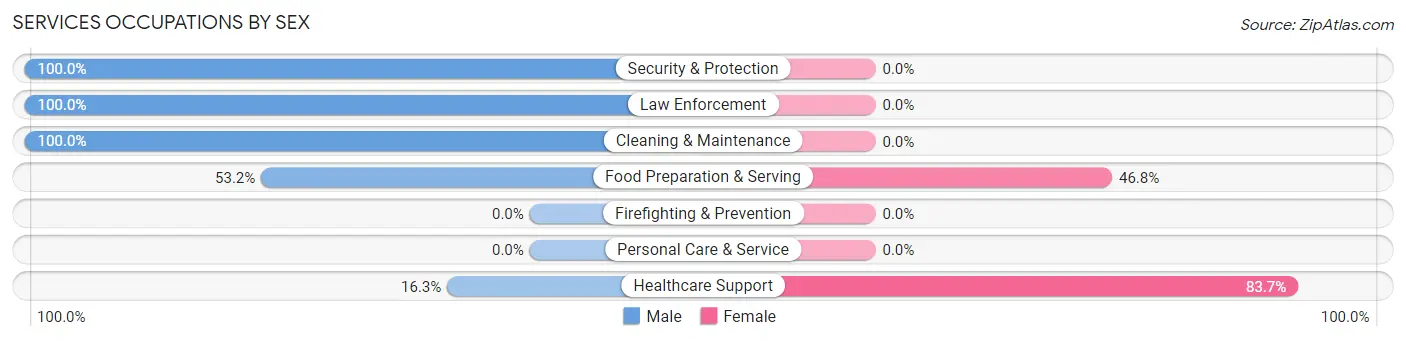
Services Occupations by Sex
Within the Services occupations in Micco, the most male-oriented occupations are Security & Protection (100.0%), Law Enforcement (100.0%), and Cleaning & Maintenance (100.0%), while the most female-oriented occupations are Healthcare Support (83.7%), and Food Preparation & Serving (46.8%).
| Occupation | Male | Female |
| Healthcare Support | 25 (16.3%) | 128 (83.7%) |
| Security & Protection | 19 (100.0%) | 0 (0.0%) |
| Firefighting & Prevention | 0 (0.0%) | 0 (0.0%) |
| Law Enforcement | 19 (100.0%) | 0 (0.0%) |
| Food Preparation & Serving | 67 (53.2%) | 59 (46.8%) |
| Cleaning & Maintenance | 155 (100.0%) | 0 (0.0%) |
| Personal Care & Service | 0 (0.0%) | 0 (0.0%) |
| Total (Category) | 266 (58.7%) | 187 (41.3%) |
| Total (Overall) | 1,303 (51.8%) | 1,211 (48.2%) |
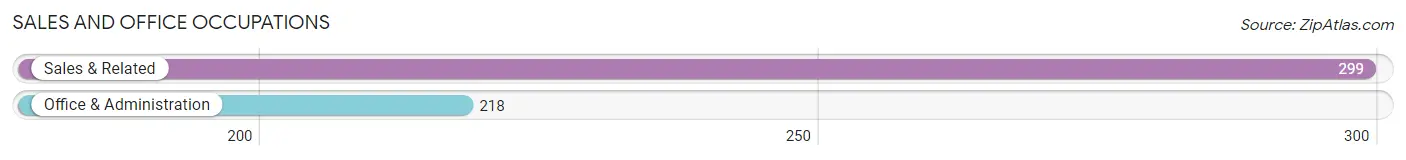
Sales and Office Occupations
The most common Sales and Office occupations in Micco are Sales & Related (299 | 11.9%), and Office & Administration (218 | 8.7%).
Sales and Office Occupations by Sex
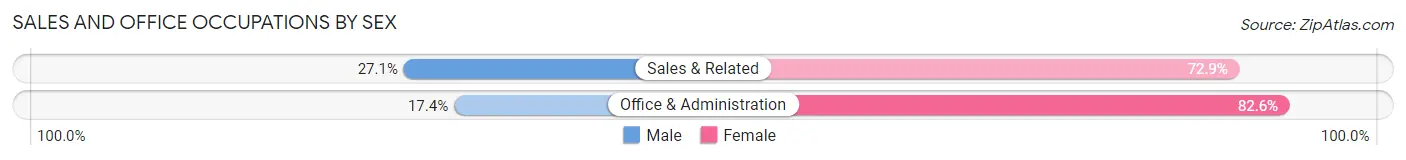
| Occupation | Male | Female |
| Sales & Related | 81 (27.1%) | 218 (72.9%) |
| Office & Administration | 38 (17.4%) | 180 (82.6%) |
| Total (Category) | 119 (23.0%) | 398 (77.0%) |
| Total (Overall) | 1,303 (51.8%) | 1,211 (48.2%) |
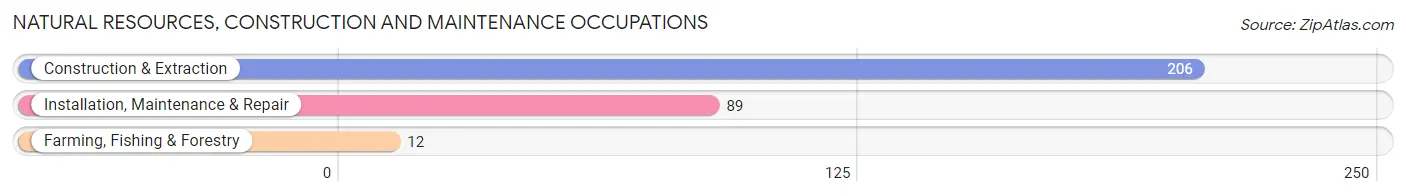
Natural Resources, Construction and Maintenance Occupations
The most common Natural Resources, Construction and Maintenance occupations in Micco are Construction & Extraction (206 | 8.2%), Installation, Maintenance & Repair (89 | 3.5%), and Farming, Fishing & Forestry (12 | 0.5%).
Natural Resources, Construction and Maintenance Occupations by Sex
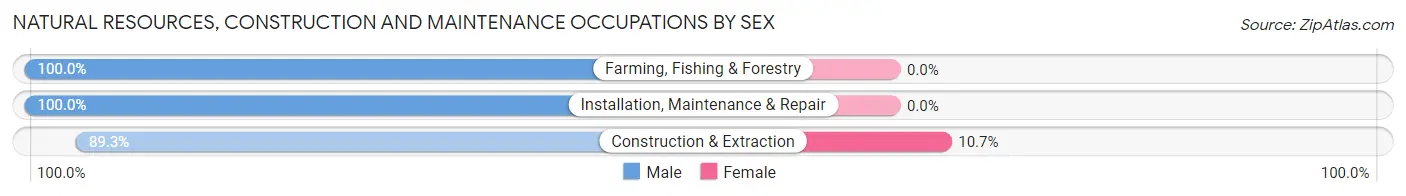
| Occupation | Male | Female |
| Farming, Fishing & Forestry | 12 (100.0%) | 0 (0.0%) |
| Construction & Extraction | 184 (89.3%) | 22 (10.7%) |
| Installation, Maintenance & Repair | 89 (100.0%) | 0 (0.0%) |
| Total (Category) | 285 (92.8%) | 22 (7.2%) |
| Total (Overall) | 1,303 (51.8%) | 1,211 (48.2%) |
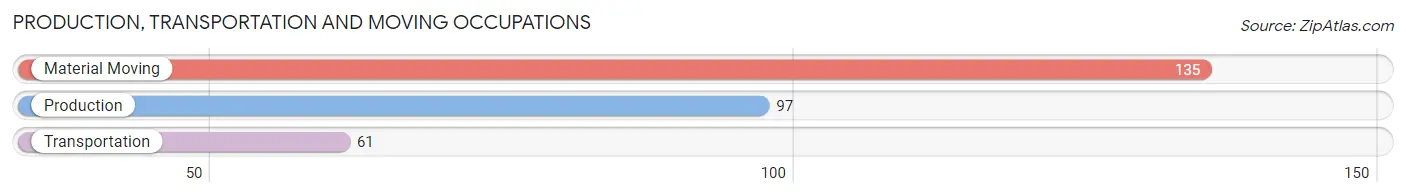
Production, Transportation and Moving Occupations
The most common Production, Transportation and Moving occupations in Micco are Material Moving (135 | 5.4%), Production (97 | 3.9%), and Transportation (61 | 2.4%).
Production, Transportation and Moving Occupations by Sex
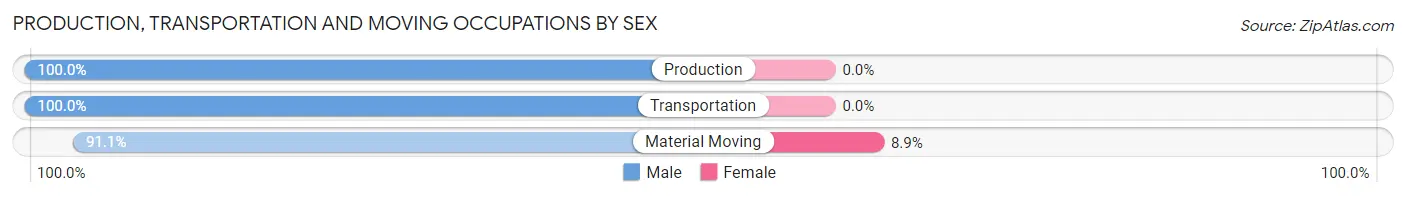
| Occupation | Male | Female |
| Production | 97 (100.0%) | 0 (0.0%) |
| Transportation | 61 (100.0%) | 0 (0.0%) |
| Material Moving | 123 (91.1%) | 12 (8.9%) |
| Total (Category) | 281 (95.9%) | 12 (4.1%) |
| Total (Overall) | 1,303 (51.8%) | 1,211 (48.2%) |
Employment Industries by Sex in Micco
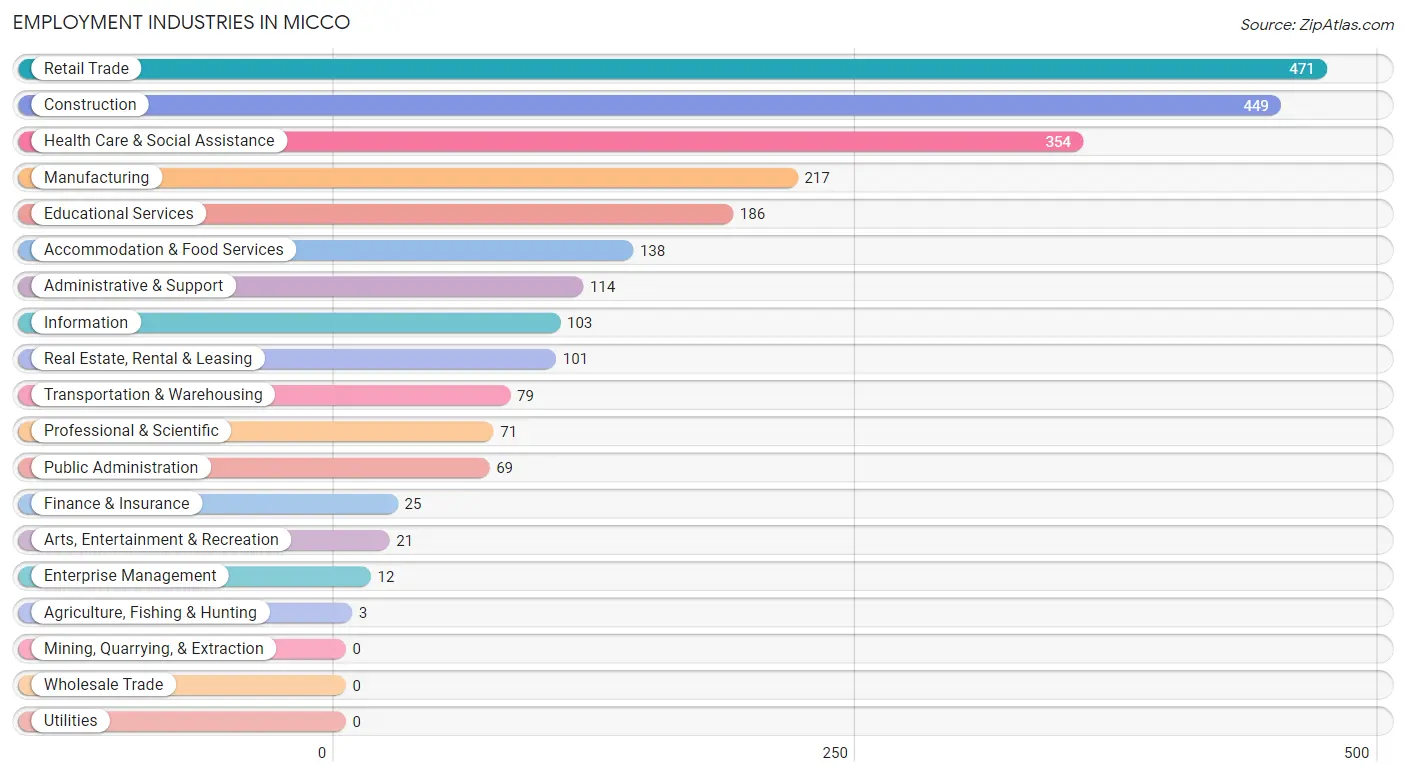
Employment Industries in Micco
The major employment industries in Micco include Retail Trade (471 | 18.7%), Construction (449 | 17.9%), Health Care & Social Assistance (354 | 14.1%), Manufacturing (217 | 8.6%), and Educational Services (186 | 7.4%).
Employment Industries by Sex in Micco
The Micco industries that see more men than women are Enterprise Management (100.0%), Arts, Entertainment & Recreation (100.0%), and Manufacturing (95.9%), whereas the industries that tend to have a higher number of women are Agriculture, Fishing & Hunting (100.0%), Information (100.0%), and Finance & Insurance (100.0%).
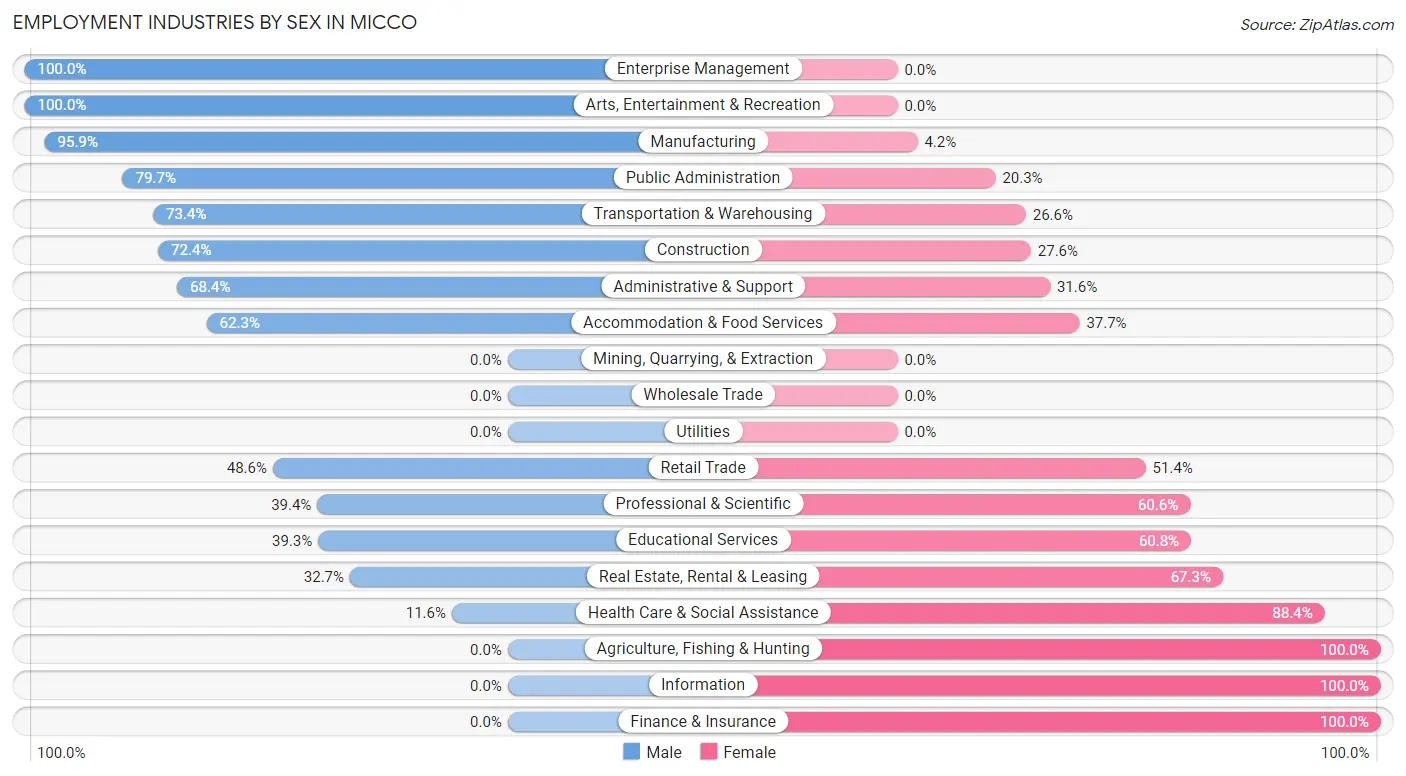
| Industry | Male | Female |
| Agriculture, Fishing & Hunting | 0 (0.0%) | 3 (100.0%) |
| Mining, Quarrying, & Extraction | 0 (0.0%) | 0 (0.0%) |
| Construction | 325 (72.4%) | 124 (27.6%) |
| Manufacturing | 208 (95.9%) | 9 (4.2%) |
| Wholesale Trade | 0 (0.0%) | 0 (0.0%) |
| Retail Trade | 229 (48.6%) | 242 (51.4%) |
| Transportation & Warehousing | 58 (73.4%) | 21 (26.6%) |
| Utilities | 0 (0.0%) | 0 (0.0%) |
| Information | 0 (0.0%) | 103 (100.0%) |
| Finance & Insurance | 0 (0.0%) | 25 (100.0%) |
| Real Estate, Rental & Leasing | 33 (32.7%) | 68 (67.3%) |
| Professional & Scientific | 28 (39.4%) | 43 (60.6%) |
| Enterprise Management | 12 (100.0%) | 0 (0.0%) |
| Administrative & Support | 78 (68.4%) | 36 (31.6%) |
| Educational Services | 73 (39.3%) | 113 (60.8%) |
| Health Care & Social Assistance | 41 (11.6%) | 313 (88.4%) |
| Arts, Entertainment & Recreation | 21 (100.0%) | 0 (0.0%) |
| Accommodation & Food Services | 86 (62.3%) | 52 (37.7%) |
| Public Administration | 55 (79.7%) | 14 (20.3%) |
| Total | 1,303 (51.8%) | 1,211 (48.2%) |
Education in Micco
School Enrollment in Micco
The most common levels of schooling among the 606 students in Micco are elementary school (177 | 29.2%), middle school (177 | 29.2%), and high school (129 | 21.3%).
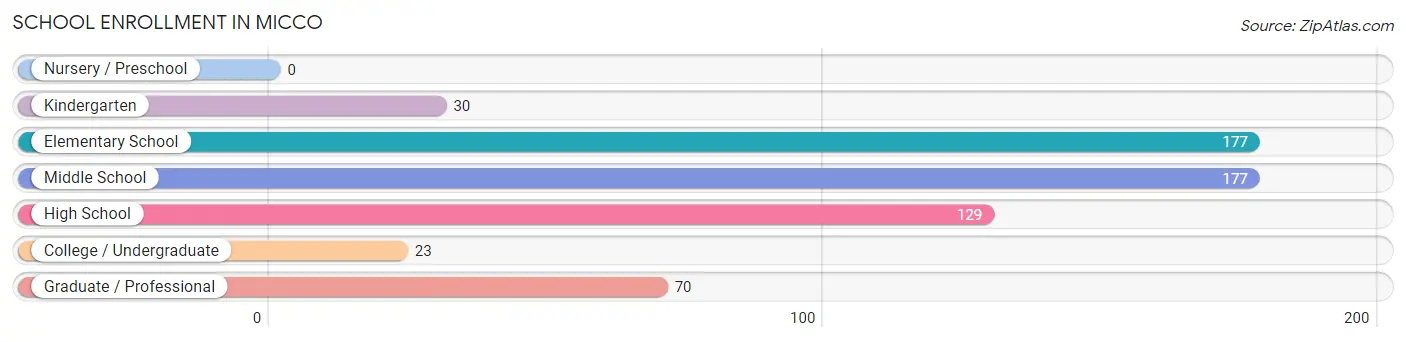
| School Level | # Students | % Students |
| Nursery / Preschool | 0 | 0.0% |
| Kindergarten | 30 | 5.0% |
| Elementary School | 177 | 29.2% |
| Middle School | 177 | 29.2% |
| High School | 129 | 21.3% |
| College / Undergraduate | 23 | 3.8% |
| Graduate / Professional | 70 | 11.6% |
| Total | 606 | 100.0% |
School Enrollment by Age by Funding Source in Micco
Out of a total of 606 students who are enrolled in schools in Micco, 61 (10.1%) attend a private institution, while the remaining 545 (89.9%) are enrolled in public schools. The age group of 18 to 19 year olds has the highest likelihood of being enrolled in private schools, with 46 (100.0% in the age bracket) enrolled. Conversely, the age group of 5 to 9 year old has the lowest likelihood of being enrolled in a private school, with 207 (100.0% in the age bracket) attending a public institution.
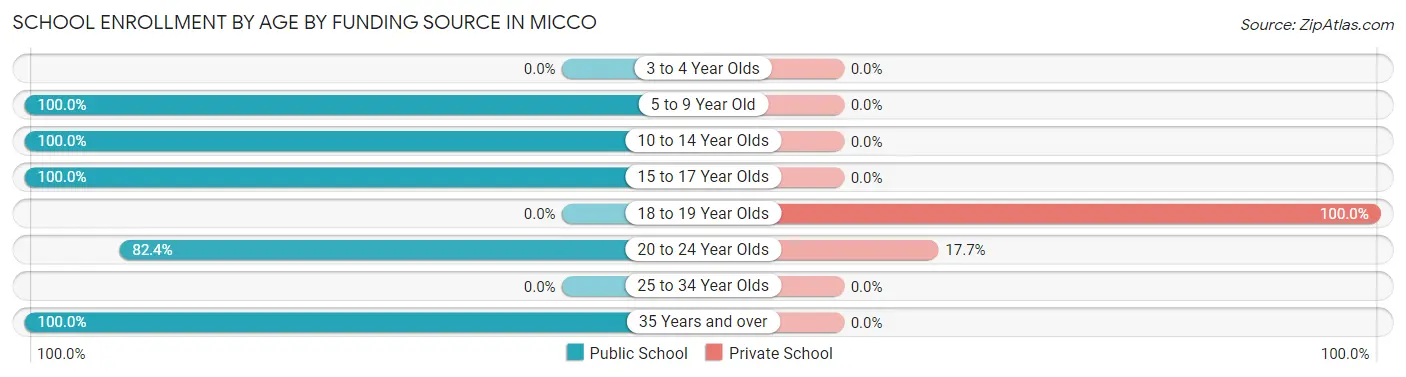
| Age Bracket | Public School | Private School |
| 3 to 4 Year Olds | 0 (0.0%) | 0 (0.0%) |
| 5 to 9 Year Old | 207 (100.0%) | 0 (0.0%) |
| 10 to 14 Year Olds | 177 (100.0%) | 0 (0.0%) |
| 15 to 17 Year Olds | 83 (100.0%) | 0 (0.0%) |
| 18 to 19 Year Olds | 0 (0.0%) | 46 (100.0%) |
| 20 to 24 Year Olds | 70 (82.4%) | 15 (17.6%) |
| 25 to 34 Year Olds | 0 (0.0%) | 0 (0.0%) |
| 35 Years and over | 8 (100.0%) | 0 (0.0%) |
| Total | 545 (89.9%) | 61 (10.1%) |
Educational Attainment by Field of Study in Micco
Science & technology (460 | 27.3%), business (357 | 21.2%), education (272 | 16.1%), social sciences (110 | 6.5%), and engineering (102 | 6.0%) are the most common fields of study among 1,686 individuals in Micco who have obtained a bachelor's degree or higher.
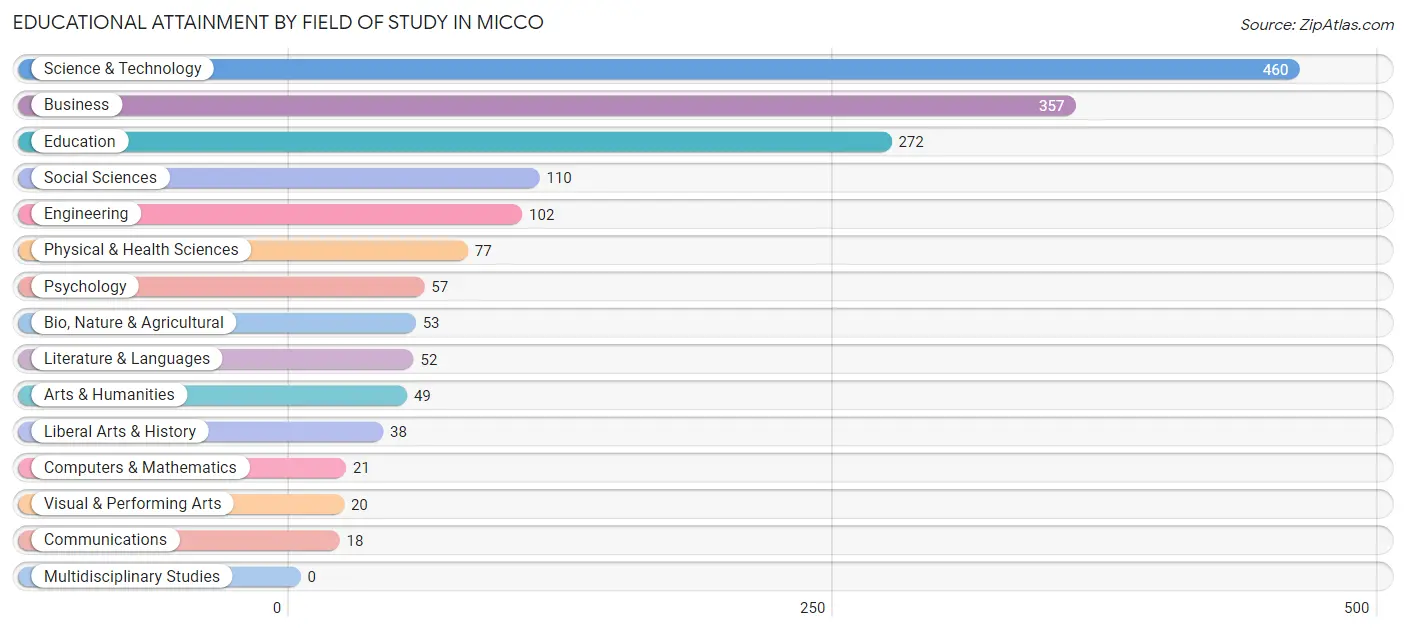
| Field of Study | # Graduates | % Graduates |
| Computers & Mathematics | 21 | 1.3% |
| Bio, Nature & Agricultural | 53 | 3.1% |
| Physical & Health Sciences | 77 | 4.6% |
| Psychology | 57 | 3.4% |
| Social Sciences | 110 | 6.5% |
| Engineering | 102 | 6.0% |
| Multidisciplinary Studies | 0 | 0.0% |
| Science & Technology | 460 | 27.3% |
| Business | 357 | 21.2% |
| Education | 272 | 16.1% |
| Literature & Languages | 52 | 3.1% |
| Liberal Arts & History | 38 | 2.2% |
| Visual & Performing Arts | 20 | 1.2% |
| Communications | 18 | 1.1% |
| Arts & Humanities | 49 | 2.9% |
| Total | 1,686 | 100.0% |
Transportation & Commute in Micco
Vehicle Availability by Sex in Micco
The most prevalent vehicle ownership categories in Micco are males with 2 vehicles (498, accounting for 38.8%) and females with 2 vehicles (496, making up 41.6%).
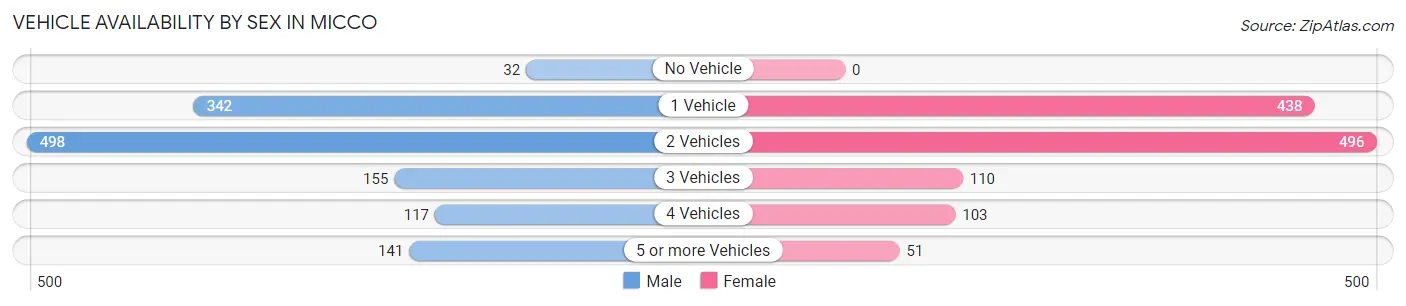
| Vehicles Available | Male | Female |
| No Vehicle | 32 (2.5%) | 0 (0.0%) |
| 1 Vehicle | 342 (26.6%) | 438 (36.6%) |
| 2 Vehicles | 498 (38.8%) | 496 (41.4%) |
| 3 Vehicles | 155 (12.1%) | 110 (9.2%) |
| 4 Vehicles | 117 (9.1%) | 103 (8.6%) |
| 5 or more Vehicles | 141 (11.0%) | 51 (4.3%) |
| Total | 1,285 (100.0%) | 1,198 (100.0%) |
Commute Time in Micco
The most frequently occuring commute durations in Micco are 30 to 34 minutes (517 commuters, 23.0%), 25 to 29 minutes (334 commuters, 14.9%), and 15 to 19 minutes (250 commuters, 11.1%).
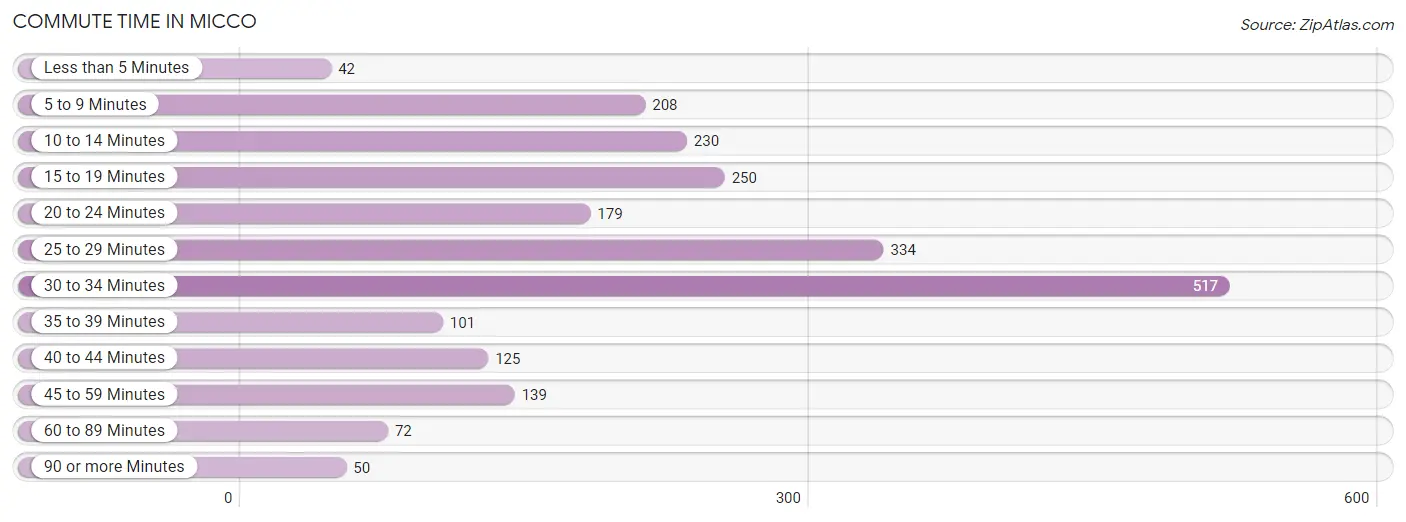
| Commute Time | # Commuters | % Commuters |
| Less than 5 Minutes | 42 | 1.9% |
| 5 to 9 Minutes | 208 | 9.3% |
| 10 to 14 Minutes | 230 | 10.2% |
| 15 to 19 Minutes | 250 | 11.1% |
| 20 to 24 Minutes | 179 | 8.0% |
| 25 to 29 Minutes | 334 | 14.9% |
| 30 to 34 Minutes | 517 | 23.0% |
| 35 to 39 Minutes | 101 | 4.5% |
| 40 to 44 Minutes | 125 | 5.6% |
| 45 to 59 Minutes | 139 | 6.2% |
| 60 to 89 Minutes | 72 | 3.2% |
| 90 or more Minutes | 50 | 2.2% |
Commute Time by Sex in Micco
The most common commute times in Micco are 30 to 34 minutes (326 commuters, 28.5%) for males and 25 to 29 minutes (263 commuters, 23.8%) for females.
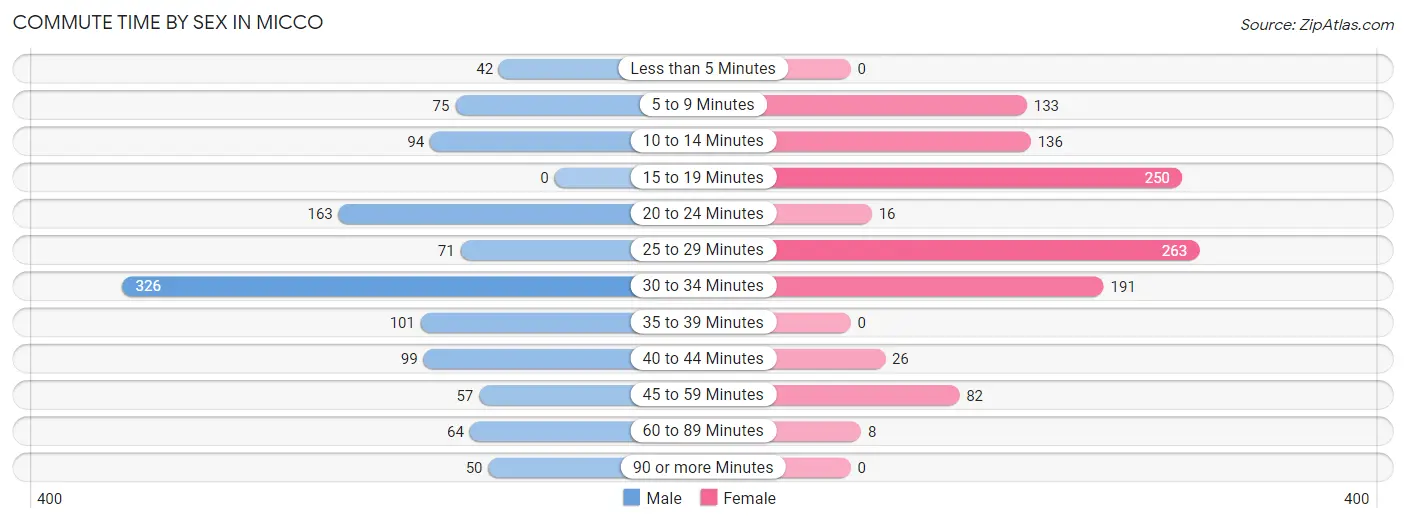
| Commute Time | Male | Female |
| Less than 5 Minutes | 42 (3.7%) | 0 (0.0%) |
| 5 to 9 Minutes | 75 (6.6%) | 133 (12.0%) |
| 10 to 14 Minutes | 94 (8.2%) | 136 (12.3%) |
| 15 to 19 Minutes | 0 (0.0%) | 250 (22.6%) |
| 20 to 24 Minutes | 163 (14.3%) | 16 (1.5%) |
| 25 to 29 Minutes | 71 (6.2%) | 263 (23.8%) |
| 30 to 34 Minutes | 326 (28.5%) | 191 (17.3%) |
| 35 to 39 Minutes | 101 (8.8%) | 0 (0.0%) |
| 40 to 44 Minutes | 99 (8.7%) | 26 (2.4%) |
| 45 to 59 Minutes | 57 (5.0%) | 82 (7.4%) |
| 60 to 89 Minutes | 64 (5.6%) | 8 (0.7%) |
| 90 or more Minutes | 50 (4.4%) | 0 (0.0%) |
Time of Departure to Work by Sex in Micco
The most frequent times of departure to work in Micco are 6:00 AM to 6:29 AM (214, 18.7%) for males and 7:30 AM to 7:59 AM (213, 19.3%) for females.
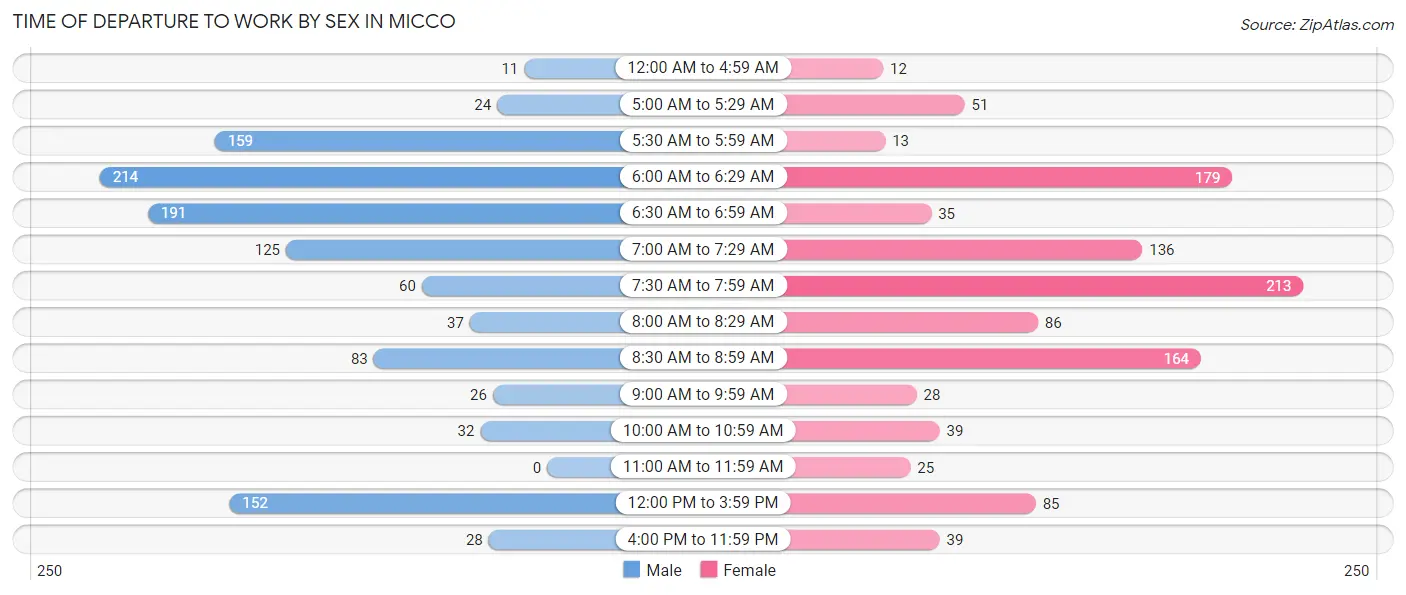
| Time of Departure | Male | Female |
| 12:00 AM to 4:59 AM | 11 (1.0%) | 12 (1.1%) |
| 5:00 AM to 5:29 AM | 24 (2.1%) | 51 (4.6%) |
| 5:30 AM to 5:59 AM | 159 (13.9%) | 13 (1.2%) |
| 6:00 AM to 6:29 AM | 214 (18.7%) | 179 (16.2%) |
| 6:30 AM to 6:59 AM | 191 (16.7%) | 35 (3.2%) |
| 7:00 AM to 7:29 AM | 125 (11.0%) | 136 (12.3%) |
| 7:30 AM to 7:59 AM | 60 (5.2%) | 213 (19.3%) |
| 8:00 AM to 8:29 AM | 37 (3.2%) | 86 (7.8%) |
| 8:30 AM to 8:59 AM | 83 (7.3%) | 164 (14.8%) |
| 9:00 AM to 9:59 AM | 26 (2.3%) | 28 (2.5%) |
| 10:00 AM to 10:59 AM | 32 (2.8%) | 39 (3.5%) |
| 11:00 AM to 11:59 AM | 0 (0.0%) | 25 (2.3%) |
| 12:00 PM to 3:59 PM | 152 (13.3%) | 85 (7.7%) |
| 4:00 PM to 11:59 PM | 28 (2.5%) | 39 (3.5%) |
| Total | 1,142 (100.0%) | 1,105 (100.0%) |
Housing Occupancy in Micco
Occupancy by Ownership in Micco
Of the total 4,997 dwellings in Micco, owner-occupied units account for 4,712 (94.3%), while renter-occupied units make up 285 (5.7%).
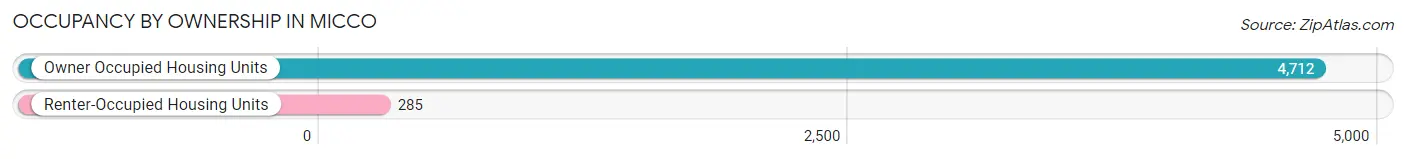
| Occupancy | # Housing Units | % Housing Units |
| Owner Occupied Housing Units | 4,712 | 94.3% |
| Renter-Occupied Housing Units | 285 | 5.7% |
| Total Occupied Housing Units | 4,997 | 100.0% |
Occupancy by Household Size in Micco
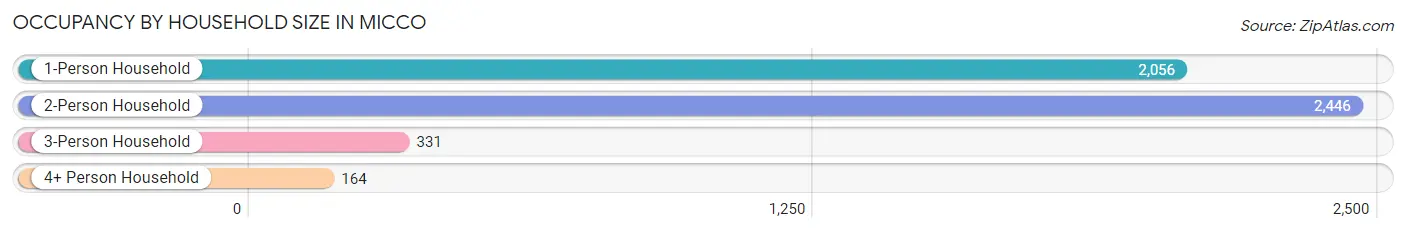
| Household Size | # Housing Units | % Housing Units |
| 1-Person Household | 2,056 | 41.1% |
| 2-Person Household | 2,446 | 48.9% |
| 3-Person Household | 331 | 6.6% |
| 4+ Person Household | 164 | 3.3% |
| Total Housing Units | 4,997 | 100.0% |
Occupancy by Ownership by Household Size in Micco
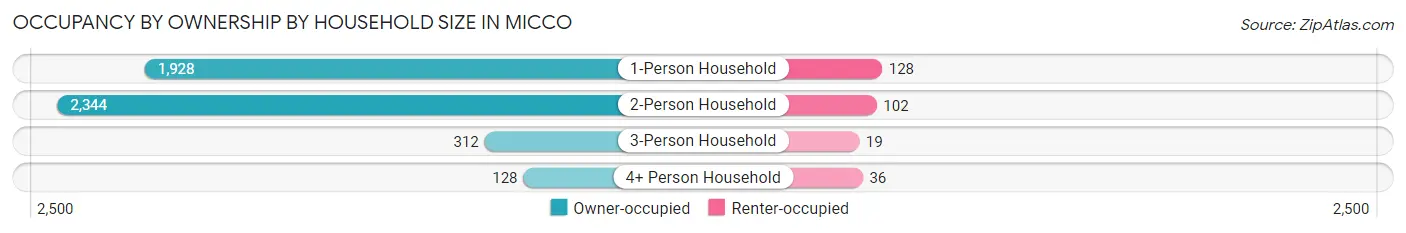
| Household Size | Owner-occupied | Renter-occupied |
| 1-Person Household | 1,928 (93.8%) | 128 (6.2%) |
| 2-Person Household | 2,344 (95.8%) | 102 (4.2%) |
| 3-Person Household | 312 (94.3%) | 19 (5.7%) |
| 4+ Person Household | 128 (78.0%) | 36 (22.0%) |
| Total Housing Units | 4,712 (94.3%) | 285 (5.7%) |
Occupancy by Educational Attainment in Micco
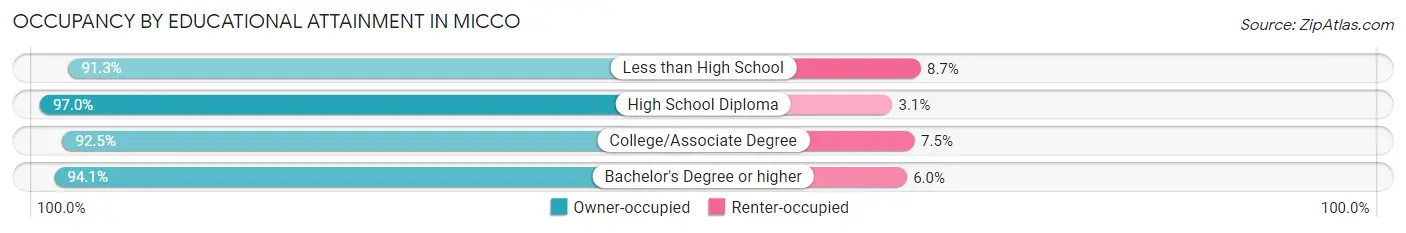
| Household Size | Owner-occupied | Renter-occupied |
| Less than High School | 189 (91.3%) | 18 (8.7%) |
| High School Diploma | 1,684 (97.0%) | 53 (3.0%) |
| College/Associate Degree | 1,890 (92.5%) | 154 (7.5%) |
| Bachelor's Degree or higher | 949 (94.1%) | 60 (5.9%) |
Occupancy by Age of Householder in Micco
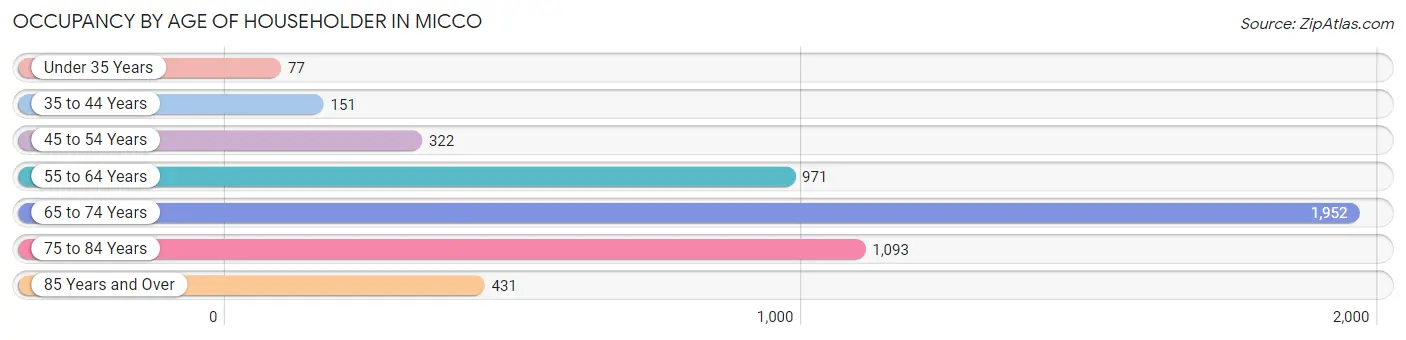
| Age Bracket | # Households | % Households |
| Under 35 Years | 77 | 1.5% |
| 35 to 44 Years | 151 | 3.0% |
| 45 to 54 Years | 322 | 6.4% |
| 55 to 64 Years | 971 | 19.4% |
| 65 to 74 Years | 1,952 | 39.1% |
| 75 to 84 Years | 1,093 | 21.9% |
| 85 Years and Over | 431 | 8.6% |
| Total | 4,997 | 100.0% |
Housing Finances in Micco
Median Income by Occupancy in Micco
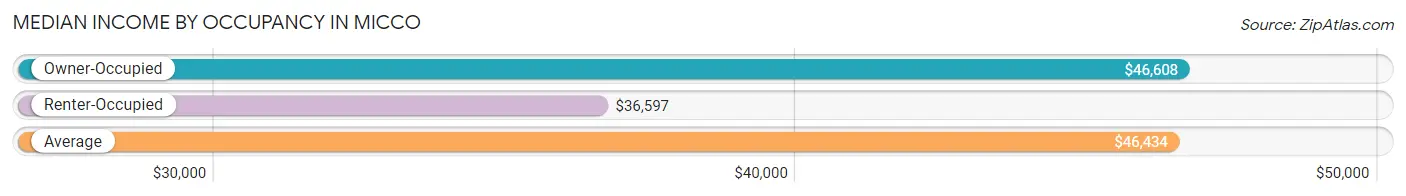
| Occupancy Type | # Households | Median Income |
| Owner-Occupied | 4,712 (94.3%) | $46,608 |
| Renter-Occupied | 285 (5.7%) | $36,597 |
| Average | 4,997 (100.0%) | $46,434 |
Occupancy by Householder Income Bracket in Micco
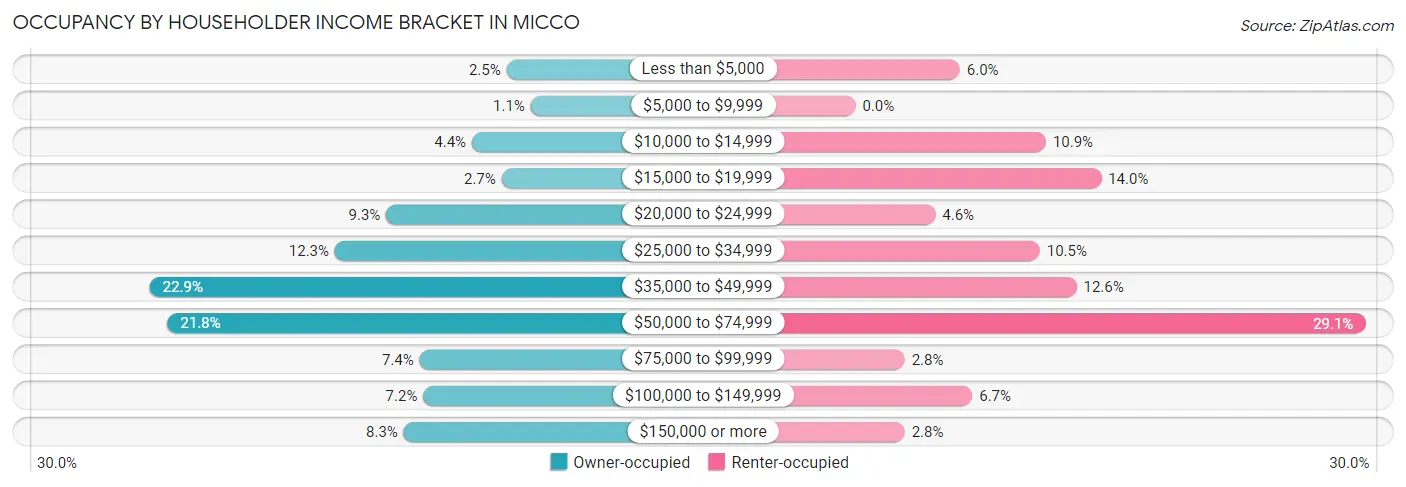
| Income Bracket | Owner-occupied | Renter-occupied |
| Less than $5,000 | 116 (2.5%) | 17 (6.0%) |
| $5,000 to $9,999 | 51 (1.1%) | 0 (0.0%) |
| $10,000 to $14,999 | 209 (4.4%) | 31 (10.9%) |
| $15,000 to $19,999 | 129 (2.7%) | 40 (14.0%) |
| $20,000 to $24,999 | 440 (9.3%) | 13 (4.6%) |
| $25,000 to $34,999 | 578 (12.3%) | 30 (10.5%) |
| $35,000 to $49,999 | 1,077 (22.9%) | 36 (12.6%) |
| $50,000 to $74,999 | 1,029 (21.8%) | 83 (29.1%) |
| $75,000 to $99,999 | 350 (7.4%) | 8 (2.8%) |
| $100,000 to $149,999 | 340 (7.2%) | 19 (6.7%) |
| $150,000 or more | 393 (8.3%) | 8 (2.8%) |
| Total | 4,712 (100.0%) | 285 (100.0%) |
Monthly Housing Cost Tiers in Micco
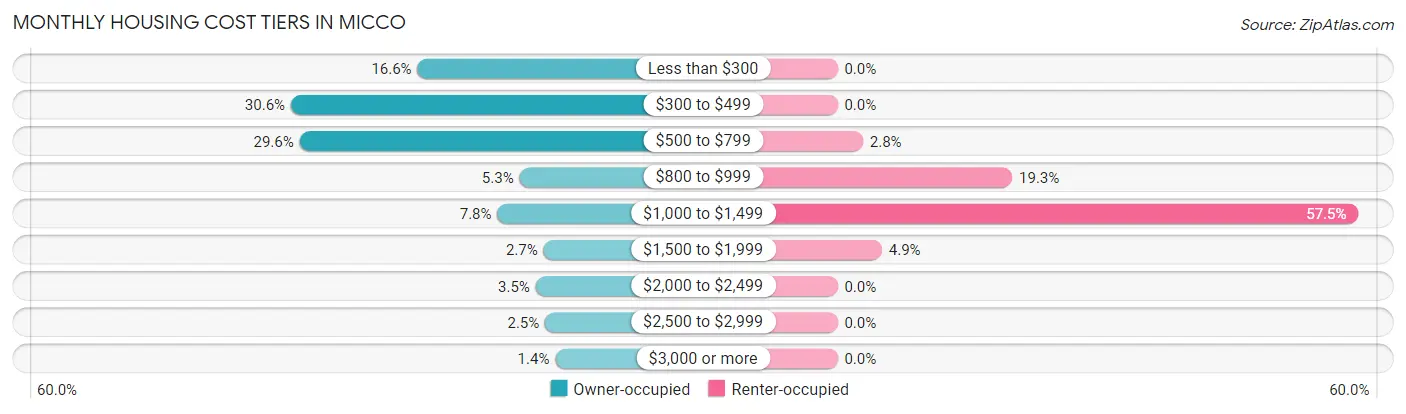
| Monthly Cost | Owner-occupied | Renter-occupied |
| Less than $300 | 782 (16.6%) | 0 (0.0%) |
| $300 to $499 | 1,441 (30.6%) | 0 (0.0%) |
| $500 to $799 | 1,396 (29.6%) | 8 (2.8%) |
| $800 to $999 | 251 (5.3%) | 55 (19.3%) |
| $1,000 to $1,499 | 366 (7.8%) | 164 (57.5%) |
| $1,500 to $1,999 | 126 (2.7%) | 14 (4.9%) |
| $2,000 to $2,499 | 167 (3.5%) | 0 (0.0%) |
| $2,500 to $2,999 | 118 (2.5%) | 0 (0.0%) |
| $3,000 or more | 65 (1.4%) | 0 (0.0%) |
| Total | 4,712 (100.0%) | 285 (100.0%) |
Physical Housing Characteristics in Micco
Housing Structures in Micco
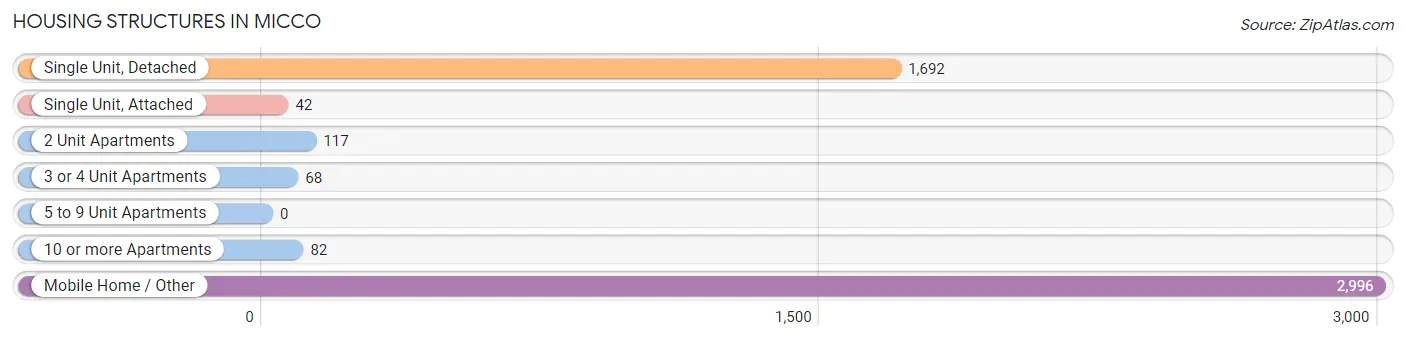
| Structure Type | # Housing Units | % Housing Units |
| Single Unit, Detached | 1,692 | 33.9% |
| Single Unit, Attached | 42 | 0.8% |
| 2 Unit Apartments | 117 | 2.3% |
| 3 or 4 Unit Apartments | 68 | 1.4% |
| 5 to 9 Unit Apartments | 0 | 0.0% |
| 10 or more Apartments | 82 | 1.6% |
| Mobile Home / Other | 2,996 | 60.0% |
| Total | 4,997 | 100.0% |
Housing Structures by Occupancy in Micco
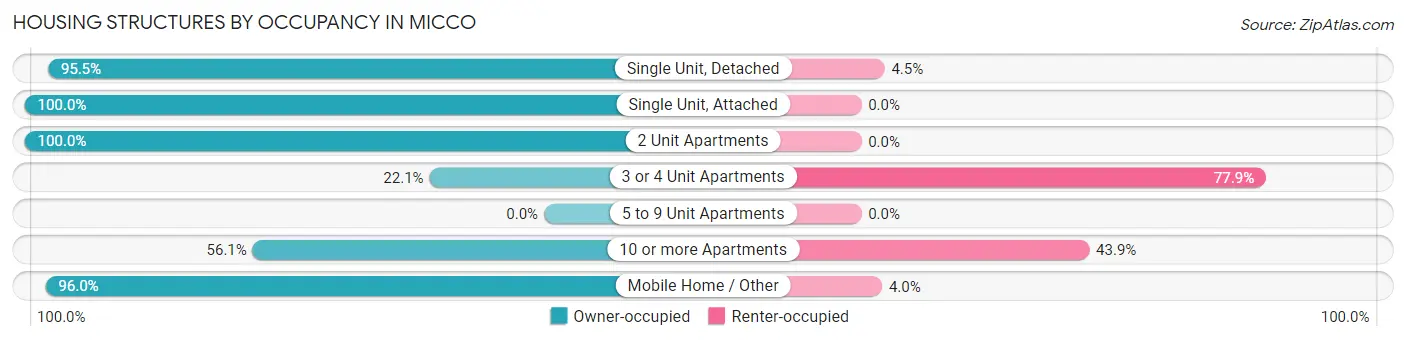
| Structure Type | Owner-occupied | Renter-occupied |
| Single Unit, Detached | 1,616 (95.5%) | 76 (4.5%) |
| Single Unit, Attached | 42 (100.0%) | 0 (0.0%) |
| 2 Unit Apartments | 117 (100.0%) | 0 (0.0%) |
| 3 or 4 Unit Apartments | 15 (22.1%) | 53 (77.9%) |
| 5 to 9 Unit Apartments | 0 (0.0%) | 0 (0.0%) |
| 10 or more Apartments | 46 (56.1%) | 36 (43.9%) |
| Mobile Home / Other | 2,876 (96.0%) | 120 (4.0%) |
| Total | 4,712 (94.3%) | 285 (5.7%) |
Housing Structures by Number of Rooms in Micco
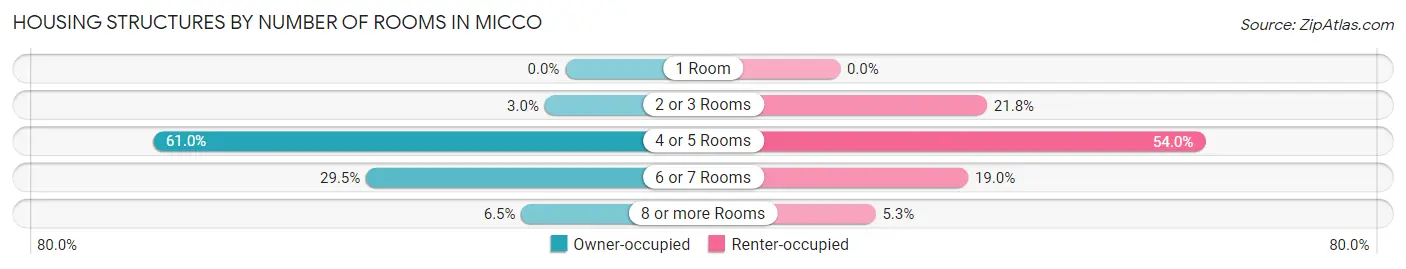
| Number of Rooms | Owner-occupied | Renter-occupied |
| 1 Room | 0 (0.0%) | 0 (0.0%) |
| 2 or 3 Rooms | 143 (3.0%) | 62 (21.7%) |
| 4 or 5 Rooms | 2,875 (61.0%) | 154 (54.0%) |
| 6 or 7 Rooms | 1,388 (29.5%) | 54 (19.0%) |
| 8 or more Rooms | 306 (6.5%) | 15 (5.3%) |
| Total | 4,712 (100.0%) | 285 (100.0%) |
Housing Structure by Heating Type in Micco
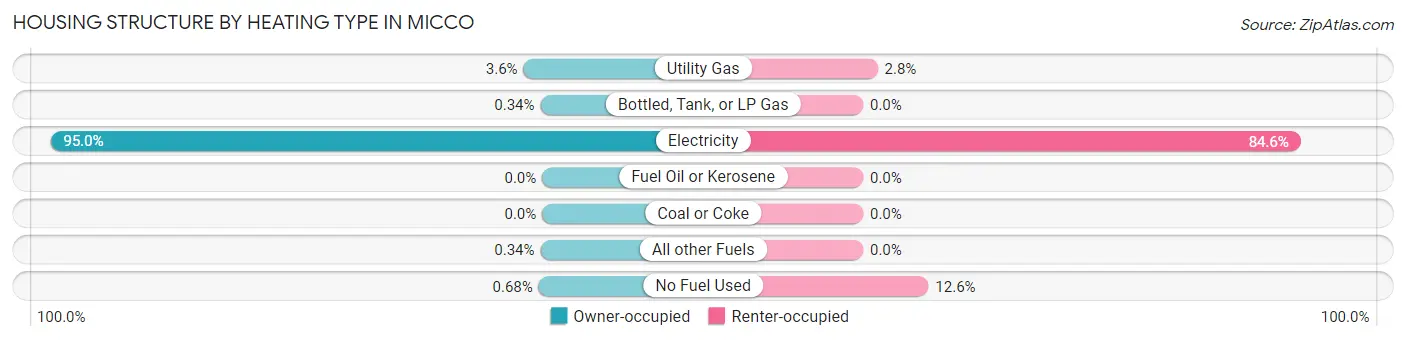
| Heating Type | Owner-occupied | Renter-occupied |
| Utility Gas | 170 (3.6%) | 8 (2.8%) |
| Bottled, Tank, or LP Gas | 16 (0.3%) | 0 (0.0%) |
| Electricity | 4,478 (95.0%) | 241 (84.6%) |
| Fuel Oil or Kerosene | 0 (0.0%) | 0 (0.0%) |
| Coal or Coke | 0 (0.0%) | 0 (0.0%) |
| All other Fuels | 16 (0.3%) | 0 (0.0%) |
| No Fuel Used | 32 (0.7%) | 36 (12.6%) |
| Total | 4,712 (100.0%) | 285 (100.0%) |
Household Vehicle Usage in Micco
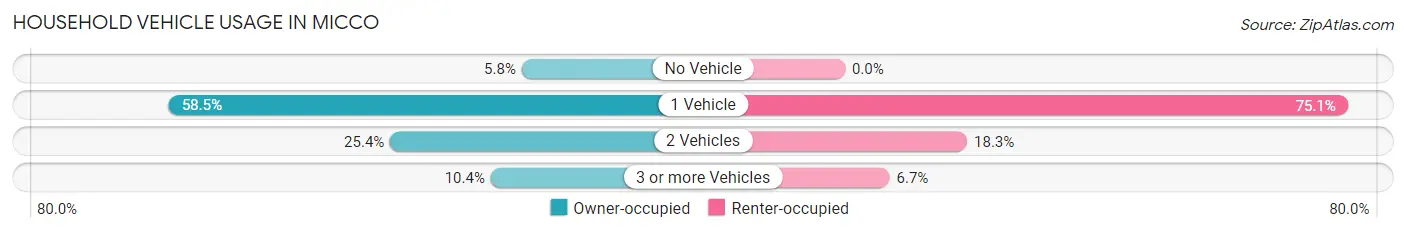
| Vehicles per Household | Owner-occupied | Renter-occupied |
| No Vehicle | 271 (5.8%) | 0 (0.0%) |
| 1 Vehicle | 2,755 (58.5%) | 214 (75.1%) |
| 2 Vehicles | 1,197 (25.4%) | 52 (18.2%) |
| 3 or more Vehicles | 489 (10.4%) | 19 (6.7%) |
| Total | 4,712 (100.0%) | 285 (100.0%) |
Real Estate & Mortgages in Micco
Real Estate and Mortgage Overview in Micco
| Characteristic | Without Mortgage | With Mortgage |
| Housing Units | 3,522 | 1,190 |
| Median Property Value | $132,100 | $181,000 |
| Median Household Income | $45,483 | $125 |
| Monthly Housing Costs | $450 | $65 |
| Real Estate Taxes | $1,316 | $30 |
Property Value by Mortgage Status in Micco
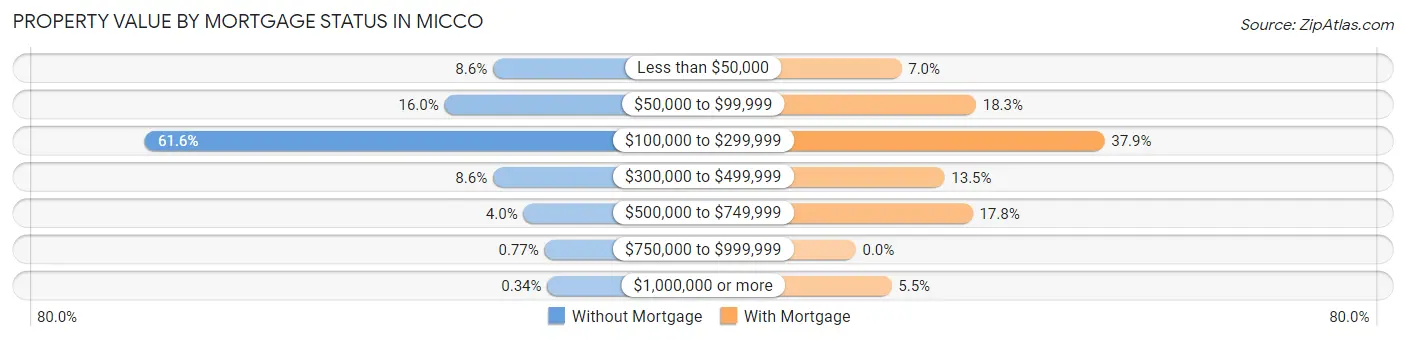
| Property Value | Without Mortgage | With Mortgage |
| Less than $50,000 | 304 (8.6%) | 83 (7.0%) |
| $50,000 to $99,999 | 564 (16.0%) | 218 (18.3%) |
| $100,000 to $299,999 | 2,171 (61.6%) | 451 (37.9%) |
| $300,000 to $499,999 | 304 (8.6%) | 161 (13.5%) |
| $500,000 to $749,999 | 140 (4.0%) | 212 (17.8%) |
| $750,000 to $999,999 | 27 (0.8%) | 0 (0.0%) |
| $1,000,000 or more | 12 (0.3%) | 65 (5.5%) |
| Total | 3,522 (100.0%) | 1,190 (100.0%) |
Household Income by Mortgage Status in Micco
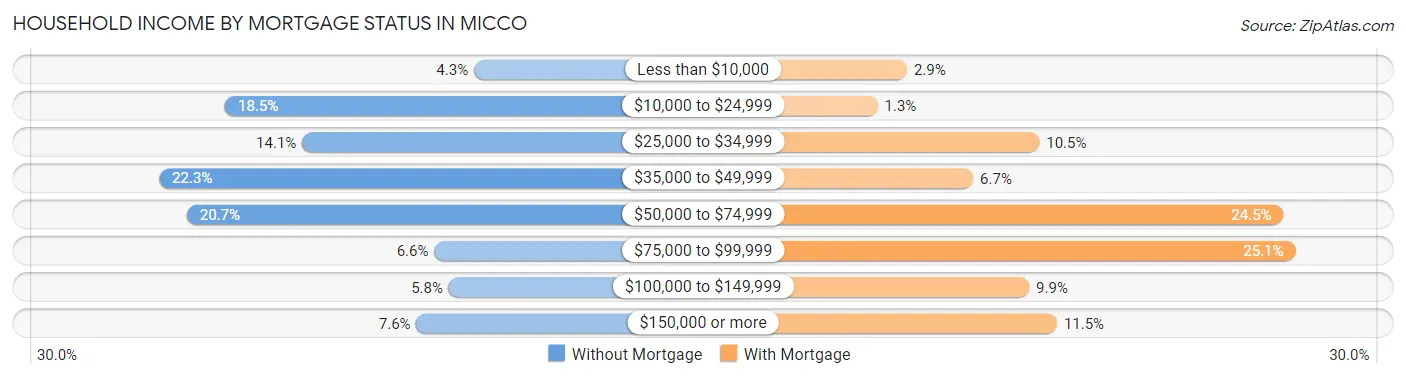
| Household Income | Without Mortgage | With Mortgage |
| Less than $10,000 | 152 (4.3%) | 35 (2.9%) |
| $10,000 to $24,999 | 653 (18.5%) | 15 (1.3%) |
| $25,000 to $34,999 | 498 (14.1%) | 125 (10.5%) |
| $35,000 to $49,999 | 786 (22.3%) | 80 (6.7%) |
| $50,000 to $74,999 | 730 (20.7%) | 291 (24.4%) |
| $75,000 to $99,999 | 232 (6.6%) | 299 (25.1%) |
| $100,000 to $149,999 | 203 (5.8%) | 118 (9.9%) |
| $150,000 or more | 268 (7.6%) | 137 (11.5%) |
| Total | 3,522 (100.0%) | 1,190 (100.0%) |
Property Value to Household Income Ratio in Micco
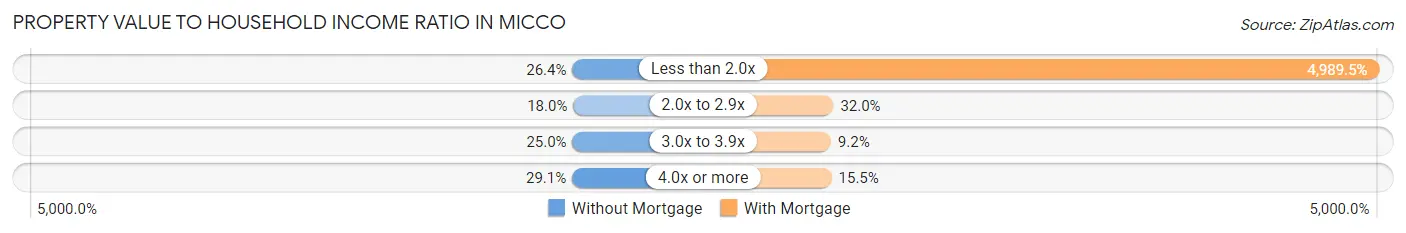
| Value-to-Income Ratio | Without Mortgage | With Mortgage |
| Less than 2.0x | 929 (26.4%) | 59,375 (4,989.5%) |
| 2.0x to 2.9x | 634 (18.0%) | 381 (32.0%) |
| 3.0x to 3.9x | 882 (25.0%) | 109 (9.2%) |
| 4.0x or more | 1,026 (29.1%) | 184 (15.5%) |
| Total | 3,522 (100.0%) | 1,190 (100.0%) |
Real Estate Taxes by Mortgage Status in Micco
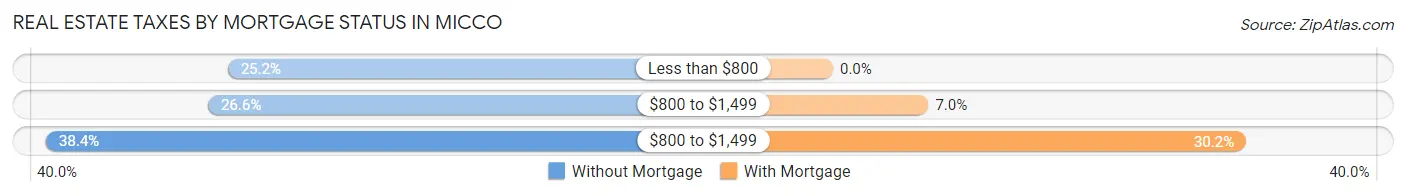
| Property Taxes | Without Mortgage | With Mortgage |
| Less than $800 | 886 (25.2%) | 0 (0.0%) |
| $800 to $1,499 | 937 (26.6%) | 83 (7.0%) |
| $800 to $1,499 | 1,354 (38.4%) | 359 (30.2%) |
| Total | 3,522 (100.0%) | 1,190 (100.0%) |
Health & Disability in Micco
Health Insurance Coverage by Age in Micco
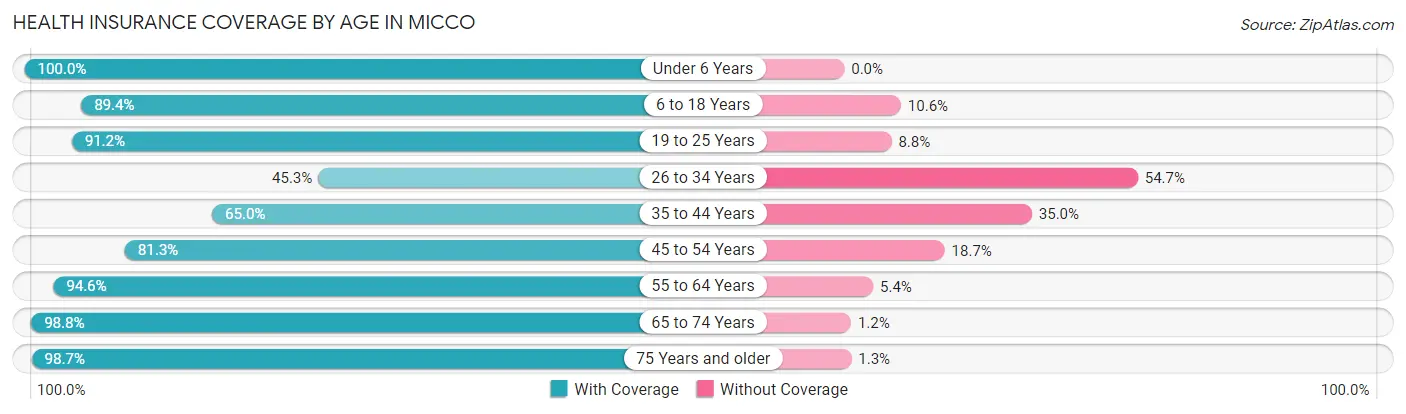
| Age Bracket | With Coverage | Without Coverage |
| Under 6 Years | 56 (100.0%) | 0 (0.0%) |
| 6 to 18 Years | 432 (89.4%) | 51 (10.6%) |
| 19 to 25 Years | 259 (91.2%) | 25 (8.8%) |
| 26 to 34 Years | 158 (45.3%) | 191 (54.7%) |
| 35 to 44 Years | 171 (65.0%) | 92 (35.0%) |
| 45 to 54 Years | 708 (81.3%) | 163 (18.7%) |
| 55 to 64 Years | 1,638 (94.6%) | 93 (5.4%) |
| 65 to 74 Years | 2,947 (98.8%) | 37 (1.2%) |
| 75 Years and older | 2,115 (98.7%) | 28 (1.3%) |
| Total | 8,484 (92.6%) | 680 (7.4%) |
Health Insurance Coverage by Citizenship Status in Micco
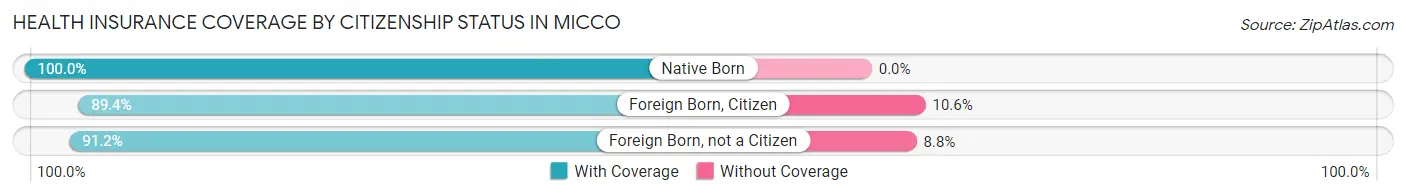
| Citizenship Status | With Coverage | Without Coverage |
| Native Born | 56 (100.0%) | 0 (0.0%) |
| Foreign Born, Citizen | 432 (89.4%) | 51 (10.6%) |
| Foreign Born, not a Citizen | 259 (91.2%) | 25 (8.8%) |
Health Insurance Coverage by Household Income in Micco
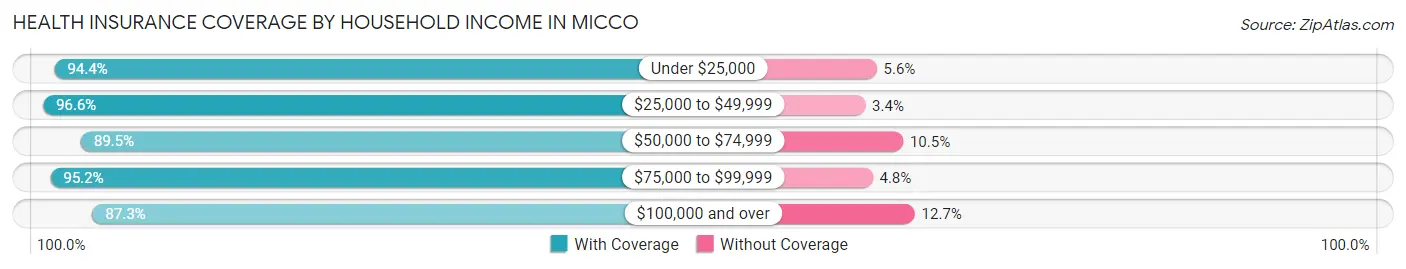
| Household Income | With Coverage | Without Coverage |
| Under $25,000 | 1,334 (94.4%) | 79 (5.6%) |
| $25,000 to $49,999 | 2,892 (96.6%) | 103 (3.4%) |
| $50,000 to $74,999 | 1,886 (89.5%) | 222 (10.5%) |
| $75,000 to $99,999 | 730 (95.2%) | 37 (4.8%) |
| $100,000 and over | 1,642 (87.3%) | 239 (12.7%) |
Public vs Private Health Insurance Coverage by Age in Micco
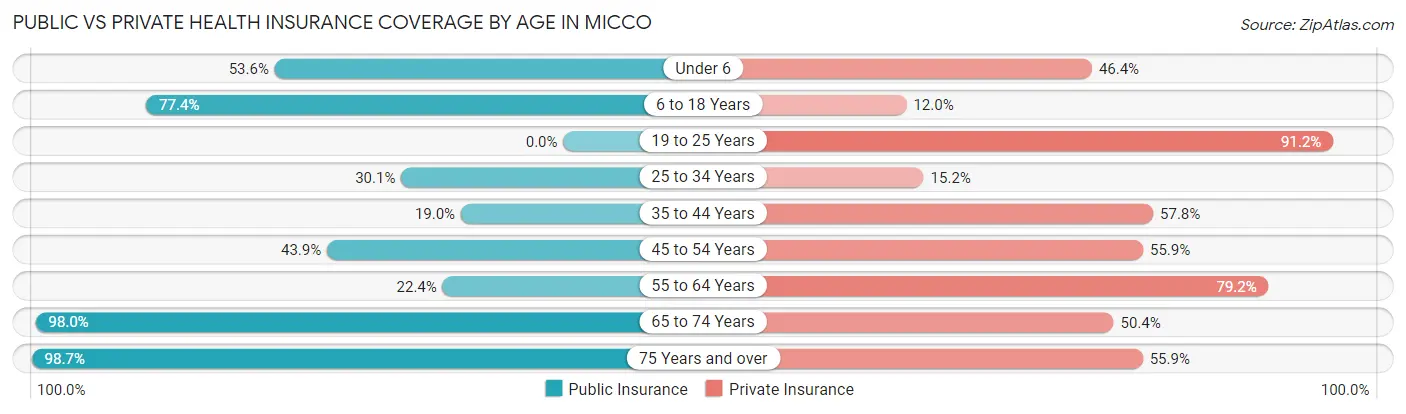
| Age Bracket | Public Insurance | Private Insurance |
| Under 6 | 30 (53.6%) | 26 (46.4%) |
| 6 to 18 Years | 374 (77.4%) | 58 (12.0%) |
| 19 to 25 Years | 0 (0.0%) | 259 (91.2%) |
| 25 to 34 Years | 105 (30.1%) | 53 (15.2%) |
| 35 to 44 Years | 50 (19.0%) | 152 (57.8%) |
| 45 to 54 Years | 382 (43.9%) | 487 (55.9%) |
| 55 to 64 Years | 388 (22.4%) | 1,371 (79.2%) |
| 65 to 74 Years | 2,924 (98.0%) | 1,505 (50.4%) |
| 75 Years and over | 2,115 (98.7%) | 1,197 (55.9%) |
| Total | 6,368 (69.5%) | 5,108 (55.7%) |
Disability Status by Sex by Age in Micco
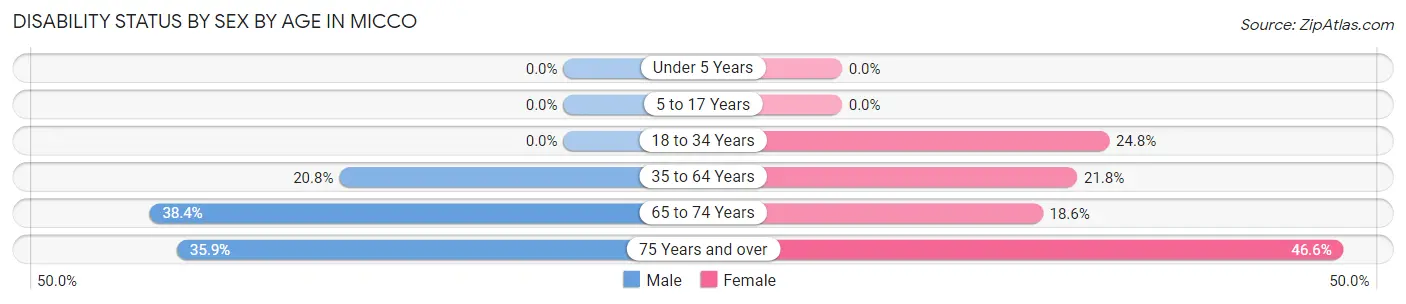
| Age Bracket | Male | Female |
| Under 5 Years | 0 (0.0%) | 0 (0.0%) |
| 5 to 17 Years | 0 (0.0%) | 0 (0.0%) |
| 18 to 34 Years | 0 (0.0%) | 65 (24.8%) |
| 35 to 64 Years | 271 (20.8%) | 341 (21.8%) |
| 65 to 74 Years | 540 (38.4%) | 294 (18.6%) |
| 75 Years and over | 398 (35.9%) | 481 (46.6%) |
Disability Class by Sex by Age in Micco
Disability Class: Hearing Difficulty
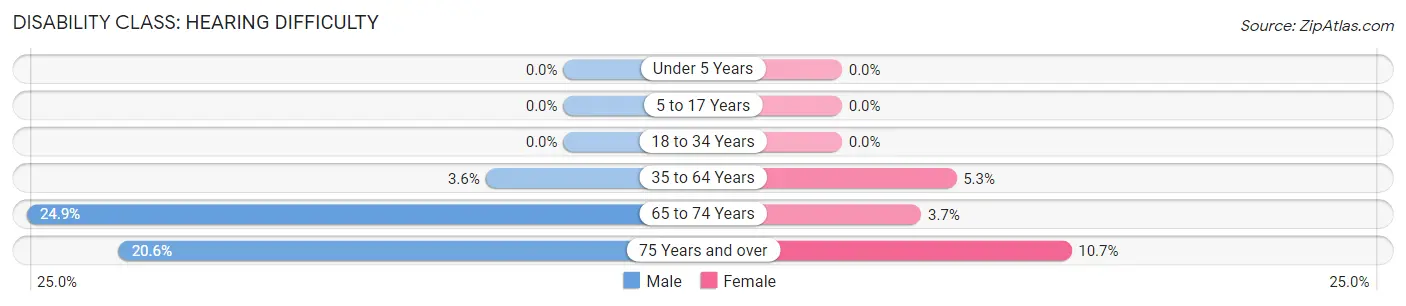
| Age Bracket | Male | Female |
| Under 5 Years | 0 (0.0%) | 0 (0.0%) |
| 5 to 17 Years | 0 (0.0%) | 0 (0.0%) |
| 18 to 34 Years | 0 (0.0%) | 0 (0.0%) |
| 35 to 64 Years | 47 (3.6%) | 83 (5.3%) |
| 65 to 74 Years | 350 (24.9%) | 58 (3.7%) |
| 75 Years and over | 229 (20.6%) | 110 (10.6%) |
Disability Class: Vision Difficulty
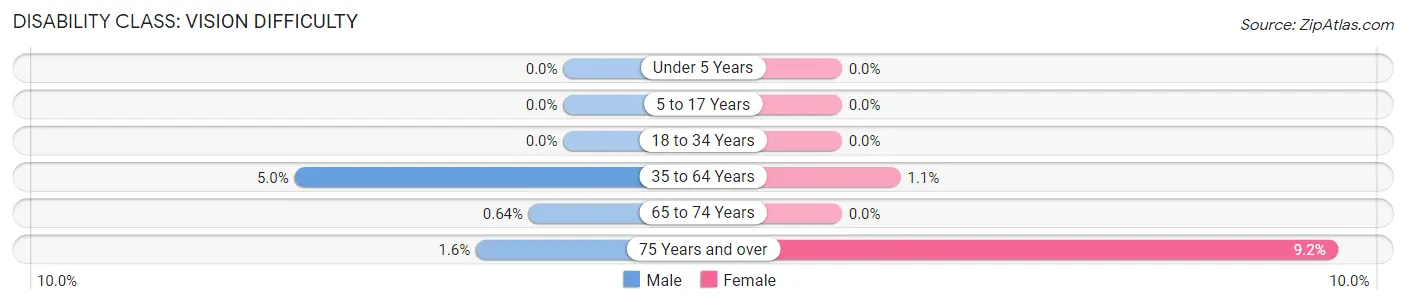
| Age Bracket | Male | Female |
| Under 5 Years | 0 (0.0%) | 0 (0.0%) |
| 5 to 17 Years | 0 (0.0%) | 0 (0.0%) |
| 18 to 34 Years | 0 (0.0%) | 0 (0.0%) |
| 35 to 64 Years | 65 (5.0%) | 17 (1.1%) |
| 65 to 74 Years | 9 (0.6%) | 0 (0.0%) |
| 75 Years and over | 18 (1.6%) | 95 (9.2%) |
Disability Class: Cognitive Difficulty
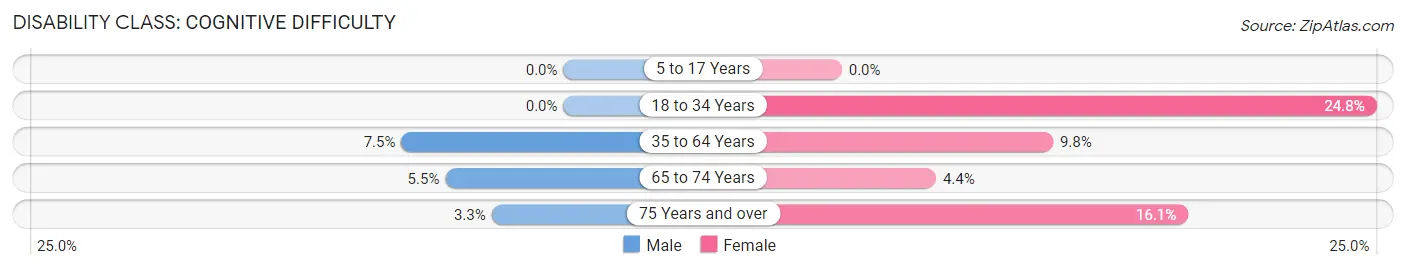
| Age Bracket | Male | Female |
| 5 to 17 Years | 0 (0.0%) | 0 (0.0%) |
| 18 to 34 Years | 0 (0.0%) | 65 (24.8%) |
| 35 to 64 Years | 98 (7.5%) | 153 (9.8%) |
| 65 to 74 Years | 77 (5.5%) | 69 (4.4%) |
| 75 Years and over | 37 (3.3%) | 166 (16.1%) |
Disability Class: Ambulatory Difficulty
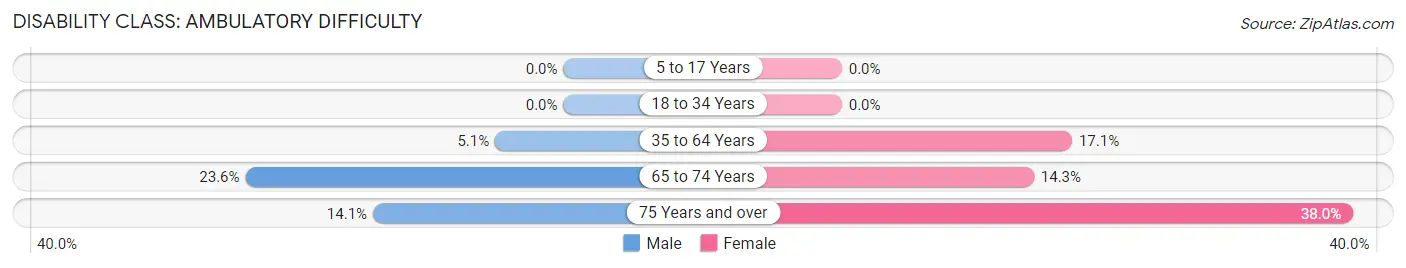
| Age Bracket | Male | Female |
| 5 to 17 Years | 0 (0.0%) | 0 (0.0%) |
| 18 to 34 Years | 0 (0.0%) | 0 (0.0%) |
| 35 to 64 Years | 66 (5.1%) | 267 (17.1%) |
| 65 to 74 Years | 332 (23.6%) | 225 (14.3%) |
| 75 Years and over | 157 (14.1%) | 392 (38.0%) |
Disability Class: Self-Care Difficulty
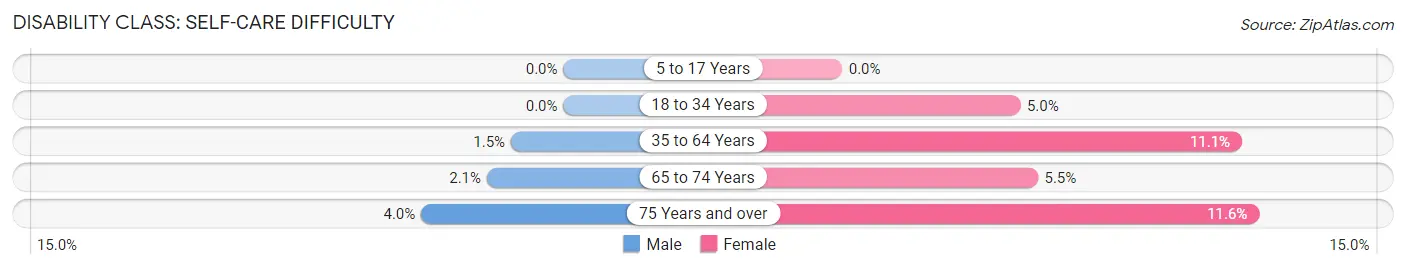
| Age Bracket | Male | Female |
| 5 to 17 Years | 0 (0.0%) | 0 (0.0%) |
| 18 to 34 Years | 0 (0.0%) | 13 (5.0%) |
| 35 to 64 Years | 19 (1.5%) | 174 (11.1%) |
| 65 to 74 Years | 30 (2.1%) | 86 (5.4%) |
| 75 Years and over | 44 (4.0%) | 120 (11.6%) |
Technology Access in Micco
Computing Device Access in Micco
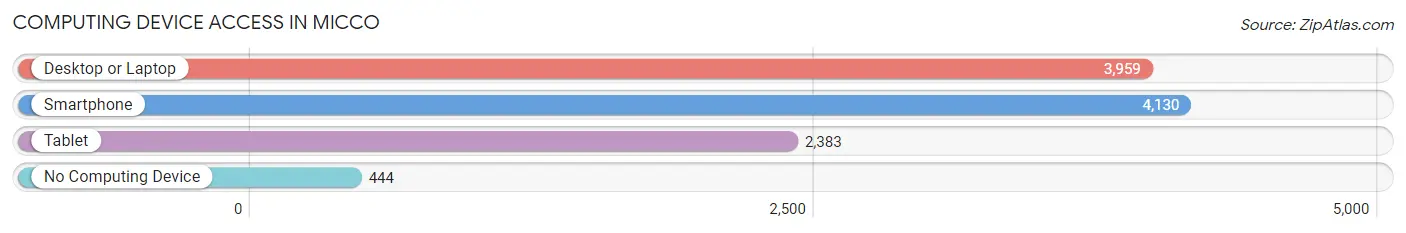
| Device Type | # Households | % Households |
| Desktop or Laptop | 3,959 | 79.2% |
| Smartphone | 4,130 | 82.7% |
| Tablet | 2,383 | 47.7% |
| No Computing Device | 444 | 8.9% |
| Total | 4,997 | 100.0% |
Internet Access in Micco
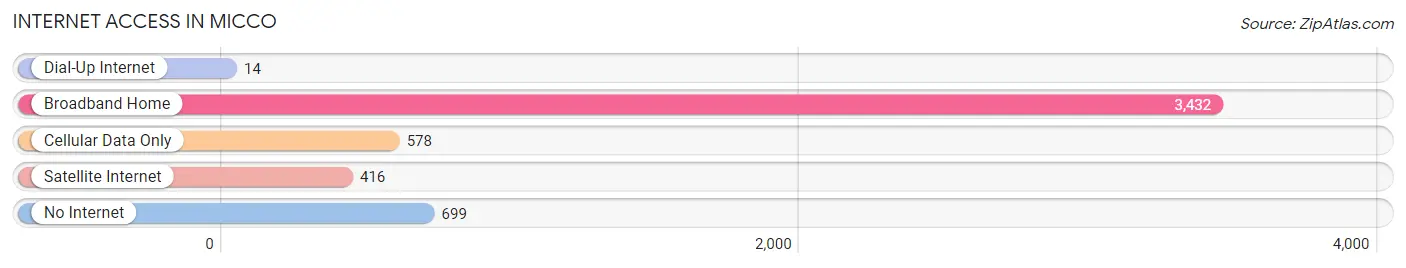
| Internet Type | # Households | % Households |
| Dial-Up Internet | 14 | 0.3% |
| Broadband Home | 3,432 | 68.7% |
| Cellular Data Only | 578 | 11.6% |
| Satellite Internet | 416 | 8.3% |
| No Internet | 699 | 14.0% |
| Total | 4,997 | 100.0% |
Micco Summary
Micco, Florida is a small unincorporated community located in Brevard County, Florida. It is situated on the Indian River Lagoon, just south of Sebastian Inlet State Park. The population of Micco was estimated to be 1,845 in 2019.
History
The area now known as Micco was originally inhabited by the Ais Indians, who were part of the Seminole tribe. The Ais Indians were known for their fishing and hunting skills, and they lived in the area for centuries before the arrival of Europeans. The first Europeans to settle in the area were Spanish explorers in the late 1500s. They named the area “Rio de Ais”, which translates to “River of the Ais”.
In the early 1800s, the area was settled by a group of settlers from Georgia. They named the settlement “Micco”, which is an Indian word meaning “chief”. The settlers built a small village and began to farm the land. The village grew slowly, and by the late 1800s, it had become a small fishing village.
In the early 1900s, the area began to attract more settlers, and the population began to grow. The town was incorporated in 1925, and the population continued to grow throughout the 20th century.
Geography
Micco is located in Brevard County, Florida, on the Indian River Lagoon. It is situated just south of Sebastian Inlet State Park. The town is bordered by the Indian River to the east, the St. Sebastian River to the west, and the Atlantic Ocean to the south.
The town is located in a humid subtropical climate zone, with hot, humid summers and mild winters. The average temperature in the summer is around 90°F, and the average temperature in the winter is around 60°F. The area receives an average of 54 inches of rain per year.
Economy
The economy of Micco is largely based on tourism and fishing. The town is home to several marinas, which attract visitors from all over the world. The town is also home to several restaurants, bars, and shops.
The town is also home to several businesses, including a boat repair shop, a bait and tackle shop, and a seafood market. The town is also home to a number of small businesses, such as a grocery store, a hardware store, and a gas station.
Demographics
The population of Micco was estimated to be 1,845 in 2019. The population is predominantly white, with a small percentage of African Americans and Hispanics. The median household income in the town is $45,000, and the median home value is $150,000. The town has a low unemployment rate, and the majority of the population is employed in the tourism and fishing industries.
Common Questions
What is the Total Population of Micco?
Total Population of Micco is 9,164.
What is the Total Male Population of Micco?
Total Male Population of Micco is 4,339.
What is the Total Female Population of Micco?
Total Female Population of Micco is 4,825.
What is the Ratio of Males per 100 Females in Micco?
There are 89.93 Males per 100 Females in Micco.
What is the Ratio of Females per 100 Males in Micco?
There are 111.20 Females per 100 Males in Micco.
What is the Median Population Age in Micco?
Median Population Age in Micco is 67.3 Years.
What is the Average Family Size in Micco
Average Family Size in Micco is 2.4 People.
What is the Average Household Size in Micco
Average Household Size in Micco is 1.8 People.
What is Per Capita Income in Micco?
Per Capita income in Micco is $34,982.
What is the Median Family Income in Micco?
Median Family Income in Micco is $58,342.
What is the Median Household income in Micco?
Median Household Income in Micco is $46,434.
What is Income or Wage Gap in Micco?
Income or Wage Gap in Micco is 16.6%.
Women in Micco earn 83.4 cents for every dollar earned by a man.
What is Inequality or Gini Index in Micco?
Inequality or Gini Index in Micco is 0.42.
How Large is the Labor Force in Micco?
There are 2,669 People in the Labor Forcein in Micco.
What is the Percentage of People in the Labor Force in Micco?
30.5% of People are in the Labor Force in Micco.
What is the Unemployment Rate in Micco?
Unemployment Rate in Micco is 5.7%.