Oriole Beach, FL
Oriole Beach Map

Oriole Beach Overview
1,731
TOTAL POPULATION
903
MALE POPULATION
828
FEMALE POPULATION
109.06
MALES / 100 FEMALES
91.69
FEMALES / 100 MALES
39.3
MEDIAN AGE
3.1
AVG FAMILY SIZE
2.6
AVG HOUSEHOLD SIZE
$37,756
PER CAPITA INCOME
$113,750
AVG FAMILY INCOME
$71,080
AVG HOUSEHOLD INCOME
0.42
INEQUALITY / GINI INDEX
945
LABOR FORCE [ PEOPLE ]
68.8%
PERCENT IN LABOR FORCE
2.1%
UNEMPLOYMENT RATE
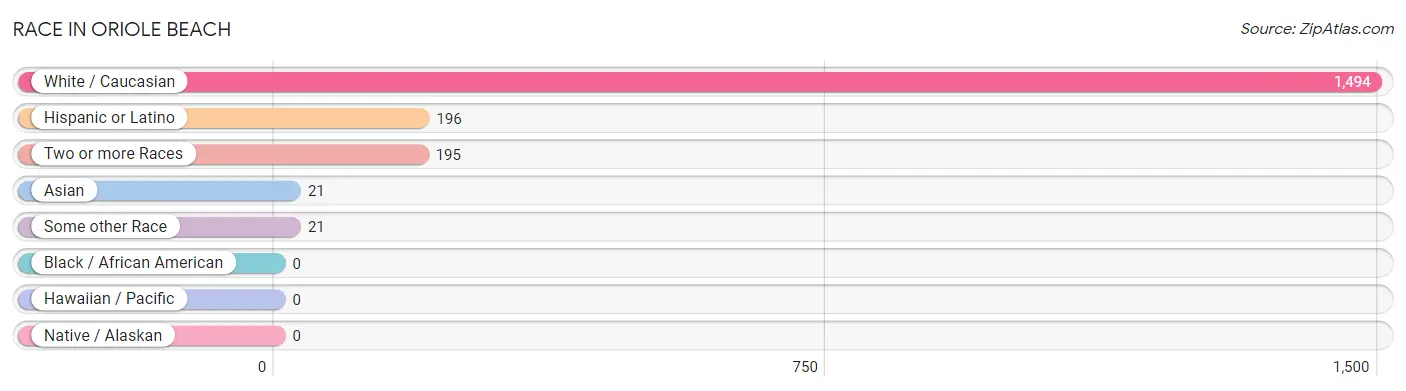
Race in Oriole Beach
The most populous races in Oriole Beach are White / Caucasian (1,494 | 86.3%), Hispanic or Latino (196 | 11.3%), and Two or more Races (195 | 11.3%).
| Race | # Population | % Population |
| Asian | 21 | 1.2% |
| Black / African American | 0 | 0.0% |
| Hawaiian / Pacific | 0 | 0.0% |
| Hispanic or Latino | 196 | 11.3% |
| Native / Alaskan | 0 | 0.0% |
| White / Caucasian | 1,494 | 86.3% |
| Two or more Races | 195 | 11.3% |
| Some other Race | 21 | 1.2% |
| Total | 1,731 | 100.0% |
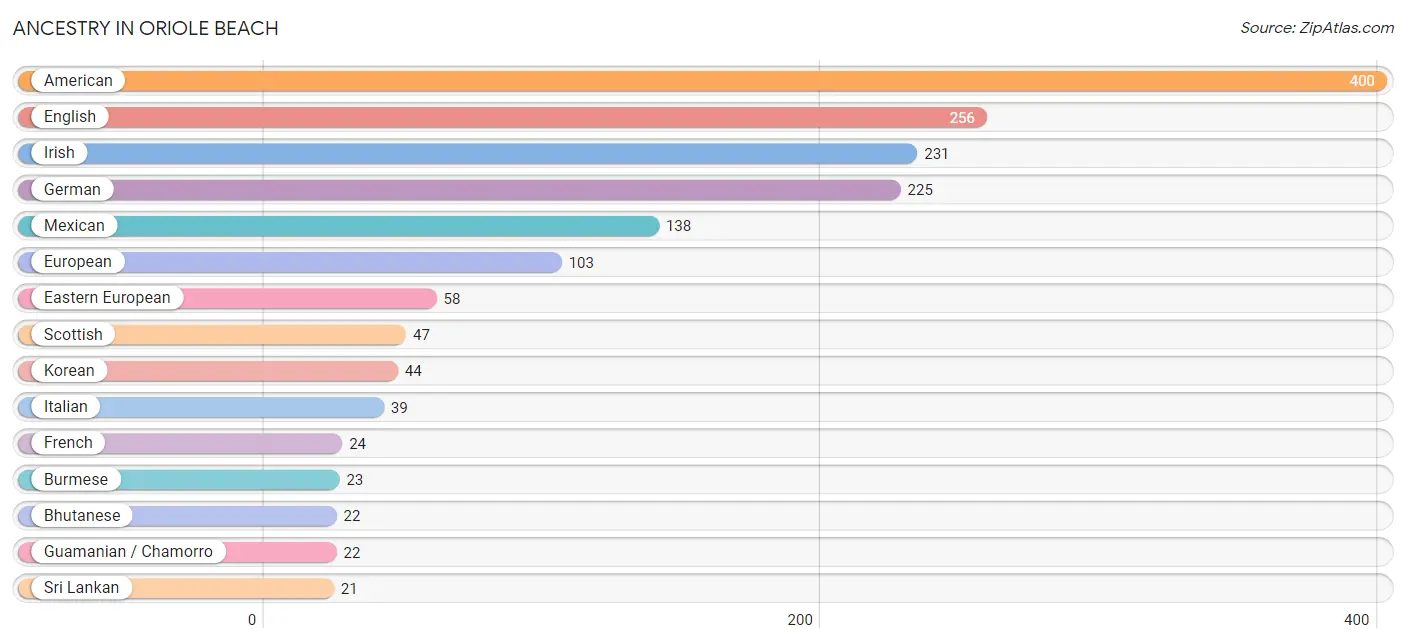
Ancestry in Oriole Beach
The most populous ancestries reported in Oriole Beach are American (400 | 23.1%), English (256 | 14.8%), Irish (231 | 13.3%), German (225 | 13.0%), and Mexican (138 | 8.0%), together accounting for 72.2% of all Oriole Beach residents.
| Ancestry | # Population | % Population |
| American | 400 | 23.1% |
| Bhutanese | 22 | 1.3% |
| British | 8 | 0.5% |
| Burmese | 23 | 1.3% |
| Colombian | 13 | 0.7% |
| Cuban | 9 | 0.5% |
| Danish | 10 | 0.6% |
| Dutch | 6 | 0.4% |
| Eastern European | 58 | 3.4% |
| English | 256 | 14.8% |
| European | 103 | 5.9% |
| French | 24 | 1.4% |
| German | 225 | 13.0% |
| Guamanian / Chamorro | 22 | 1.3% |
| Hungarian | 6 | 0.4% |
| Irish | 231 | 13.3% |
| Italian | 39 | 2.2% |
| Korean | 44 | 2.5% |
| Lithuanian | 5 | 0.3% |
| Mexican | 138 | 8.0% |
| Navajo | 5 | 0.3% |
| Scottish | 47 | 2.7% |
| South American | 13 | 0.7% |
| Spanish | 15 | 0.9% |
| Sri Lankan | 21 | 1.2% |
| Swedish | 17 | 1.0% |
| Swiss | 17 | 1.0% |
| Welsh | 10 | 0.6% | View All 28 Rows |
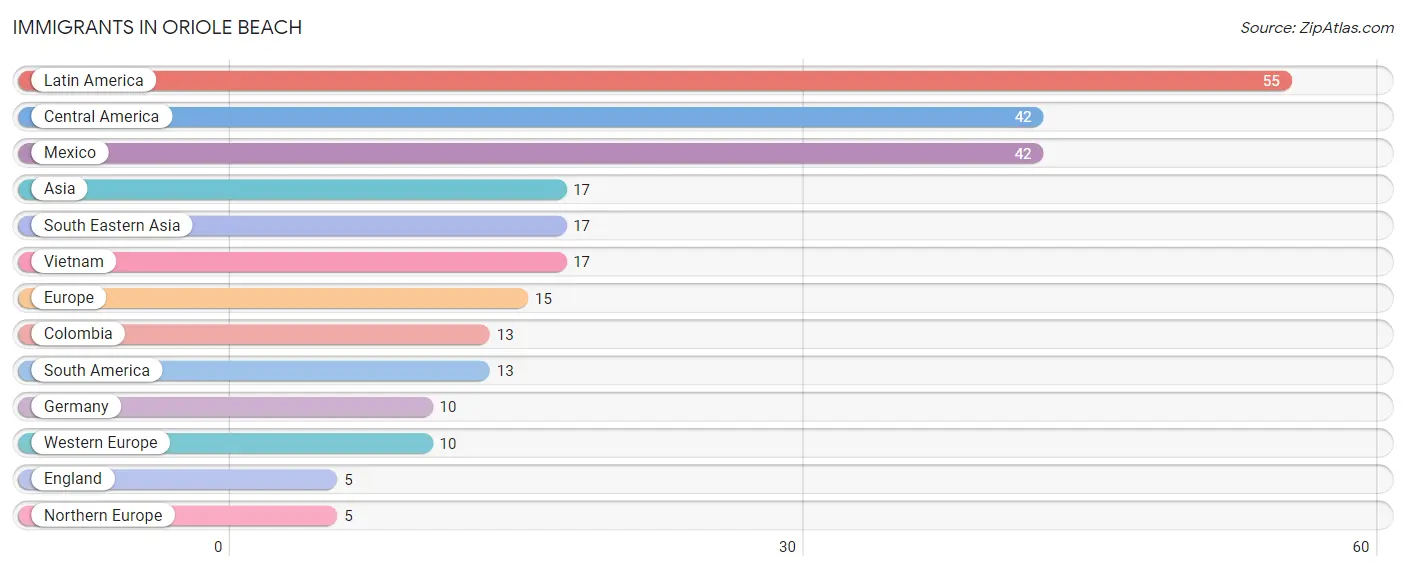
Immigrants in Oriole Beach
The most numerous immigrant groups reported in Oriole Beach came from Latin America (55 | 3.2%), Central America (42 | 2.4%), Mexico (42 | 2.4%), Asia (17 | 1.0%), and South Eastern Asia (17 | 1.0%), together accounting for 10.0% of all Oriole Beach residents.
| Immigration Origin | # Population | % Population |
| Asia | 17 | 1.0% |
| Central America | 42 | 2.4% |
| Colombia | 13 | 0.7% |
| England | 5 | 0.3% |
| Europe | 15 | 0.9% |
| Germany | 10 | 0.6% |
| Latin America | 55 | 3.2% |
| Mexico | 42 | 2.4% |
| Northern Europe | 5 | 0.3% |
| South America | 13 | 0.7% |
| South Eastern Asia | 17 | 1.0% |
| Vietnam | 17 | 1.0% |
| Western Europe | 10 | 0.6% | View All 13 Rows |
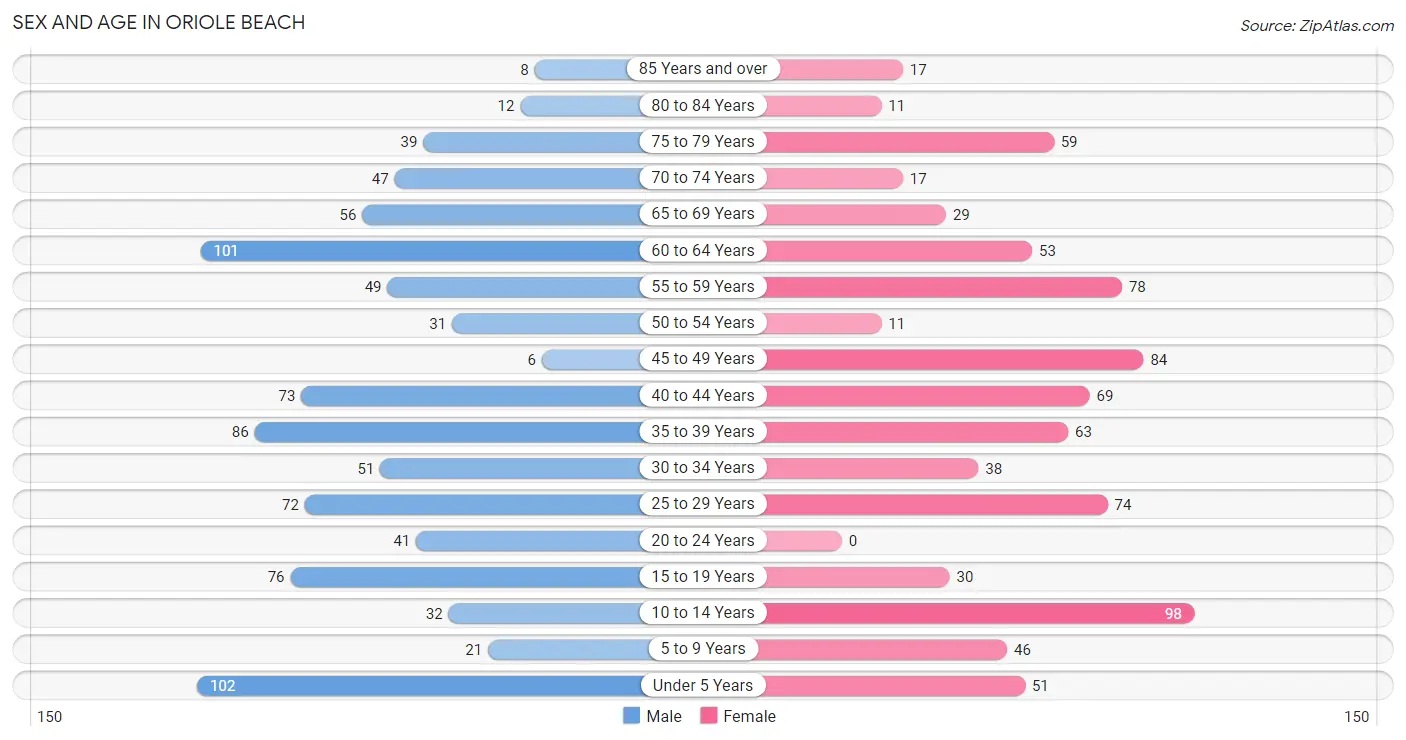
Sex and Age in Oriole Beach
Sex and Age in Oriole Beach
The most populous age groups in Oriole Beach are Under 5 Years (102 | 11.3%) for men and 10 to 14 Years (98 | 11.8%) for women.
| Age Bracket | Male | Female |
| Under 5 Years | 102 (11.3%) | 51 (6.2%) |
| 5 to 9 Years | 21 (2.3%) | 46 (5.6%) |
| 10 to 14 Years | 32 (3.5%) | 98 (11.8%) |
| 15 to 19 Years | 76 (8.4%) | 30 (3.6%) |
| 20 to 24 Years | 41 (4.5%) | 0 (0.0%) |
| 25 to 29 Years | 72 (8.0%) | 74 (8.9%) |
| 30 to 34 Years | 51 (5.7%) | 38 (4.6%) |
| 35 to 39 Years | 86 (9.5%) | 63 (7.6%) |
| 40 to 44 Years | 73 (8.1%) | 69 (8.3%) |
| 45 to 49 Years | 6 (0.7%) | 84 (10.1%) |
| 50 to 54 Years | 31 (3.4%) | 11 (1.3%) |
| 55 to 59 Years | 49 (5.4%) | 78 (9.4%) |
| 60 to 64 Years | 101 (11.2%) | 53 (6.4%) |
| 65 to 69 Years | 56 (6.2%) | 29 (3.5%) |
| 70 to 74 Years | 47 (5.2%) | 17 (2.1%) |
| 75 to 79 Years | 39 (4.3%) | 59 (7.1%) |
| 80 to 84 Years | 12 (1.3%) | 11 (1.3%) |
| 85 Years and over | 8 (0.9%) | 17 (2.1%) |
| Total | 903 (100.0%) | 828 (100.0%) |
Families and Households in Oriole Beach
Median Family Size in Oriole Beach
The median family size in Oriole Beach is 3.09 persons per family, with single female/mother families (13 | 2.6%) accounting for the largest median family size of 3.38 persons per family. On the other hand, single male/father families (10 | 2.0%) represent the smallest median family size with 2.10 persons per family.

| Family Type | # Families | Family Size |
| Married-Couple | 472 (95.4%) | 3.10 |
| Single Male/Father | 10 (2.0%) | 2.10 |
| Single Female/Mother | 13 (2.6%) | 3.38 |
| Total Families | 495 (100.0%) | 3.09 |
Median Household Size in Oriole Beach
The median household size in Oriole Beach is 2.61 persons per household, with single female/mother households (13 | 2.0%) accounting for the largest median household size of 3.38 persons per household. non-family households (168 | 25.3%) represent the smallest median household size with 1.15 persons per household.
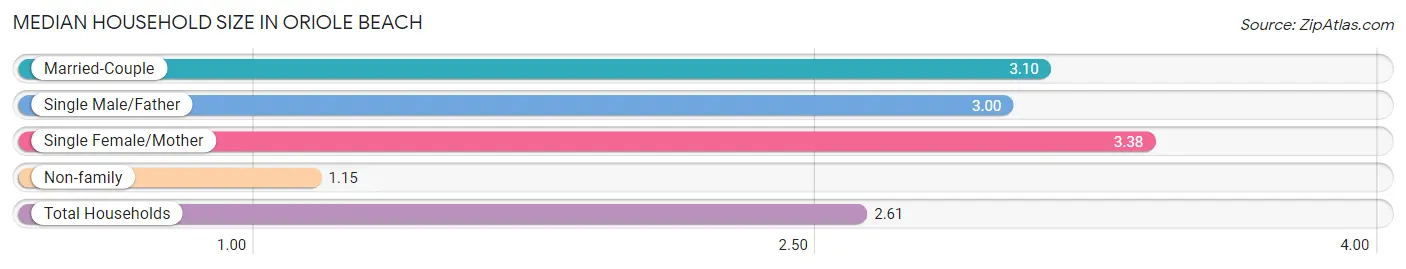
| Household Type | # Households | Household Size |
| Married-Couple | 472 (71.2%) | 3.10 |
| Single Male/Father | 10 (1.5%) | 3.00 |
| Single Female/Mother | 13 (2.0%) | 3.38 |
| Non-family | 168 (25.3%) | 1.15 |
| Total Households | 663 (100.0%) | 2.61 |
Household Size by Marriage Status in Oriole Beach
Out of a total of 663 households in Oriole Beach, 495 (74.7%) are family households, while 168 (25.3%) are nonfamily households. The most numerous type of family households are 2-person households, comprising 203, and the most common type of nonfamily households are 1-person households, comprising 148.

| Household Size | Family Households | Nonfamily Households |
| 1-Person Households | - | 148 (22.3%) |
| 2-Person Households | 203 (30.6%) | 20 (3.0%) |
| 3-Person Households | 133 (20.1%) | 0 (0.0%) |
| 4-Person Households | 93 (14.0%) | 0 (0.0%) |
| 5-Person Households | 13 (2.0%) | 0 (0.0%) |
| 6-Person Households | 53 (8.0%) | 0 (0.0%) |
| 7+ Person Households | 0 (0.0%) | 0 (0.0%) |
| Total | 495 (74.7%) | 168 (25.3%) |
Female Fertility in Oriole Beach
Fertility by Age in Oriole Beach
Average fertility rate in Oriole Beach is 67.0 births per 1,000 women. Women in the age bracket of 20 to 34 years have the highest fertility rate with 214.0 births per 1,000 women. Women in the age bracket of 20 to 34 years acount for 100.0% of all women with births.
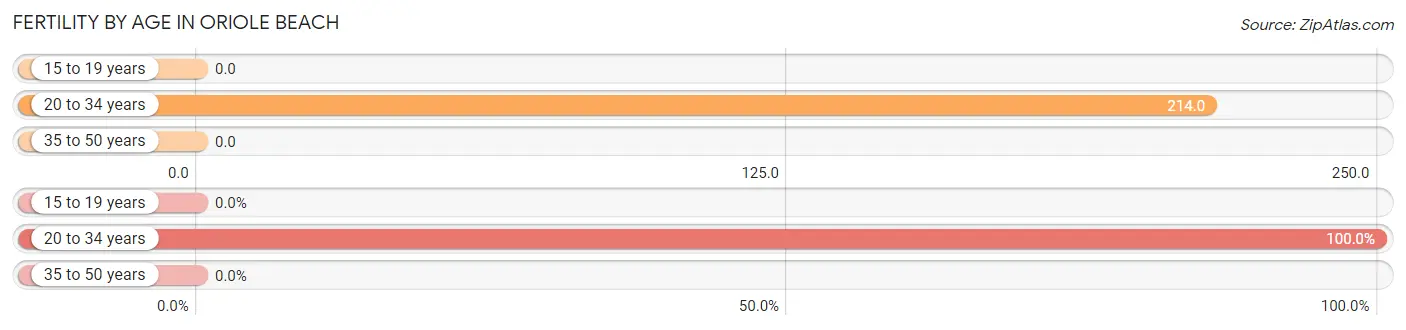
| Age Bracket | Women with Births | Births / 1,000 Women |
| 15 to 19 years | 0 (0.0%) | 0.0 |
| 20 to 34 years | 24 (100.0%) | 214.0 |
| 35 to 50 years | 0 (0.0%) | 0.0 |
| Total | 24 (100.0%) | 67.0 |
Fertility by Age by Marriage Status in Oriole Beach
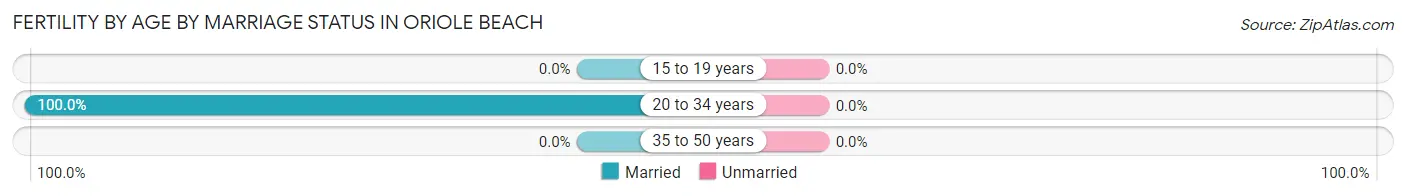
| Age Bracket | Married | Unmarried |
| 15 to 19 years | 0 (0.0%) | 0 (0.0%) |
| 20 to 34 years | 24 (100.0%) | 0 (0.0%) |
| 35 to 50 years | 0 (0.0%) | 0 (0.0%) |
| Total | 24 (100.0%) | 0 (0.0%) |
Fertility by Education in Oriole Beach
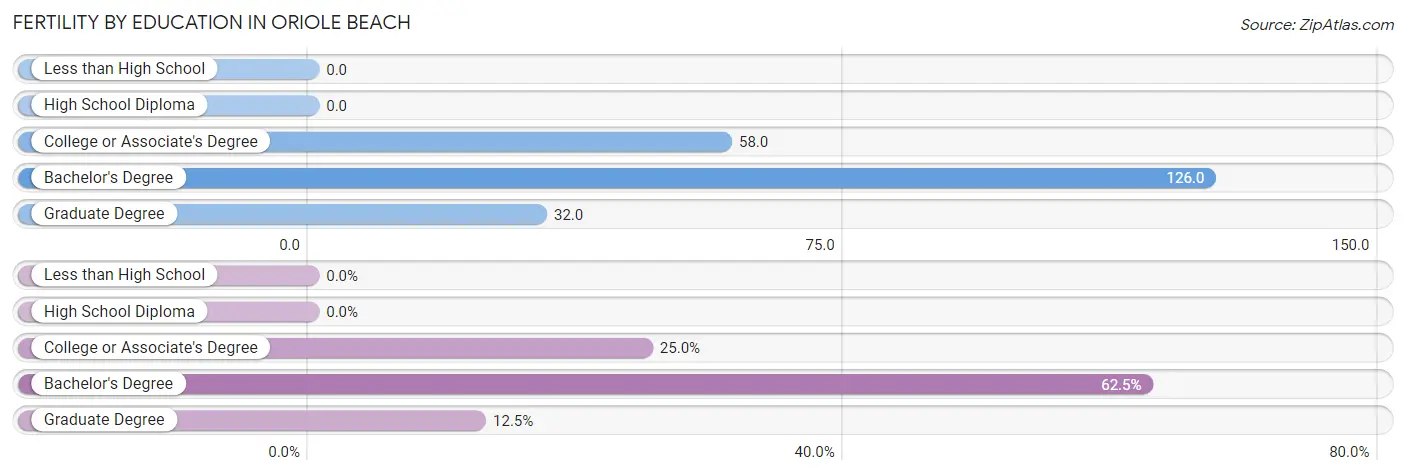
| Educational Attainment | Women with Births | Births / 1,000 Women |
| Less than High School | 0 (0.0%) | 0.0 |
| High School Diploma | 0 (0.0%) | 0.0 |
| College or Associate's Degree | 6 (25.0%) | 58.0 |
| Bachelor's Degree | 15 (62.5%) | 126.0 |
| Graduate Degree | 3 (12.5%) | 32.0 |
| Total | 24 (100.0%) | 67.0 |
Fertility by Education by Marriage Status in Oriole Beach
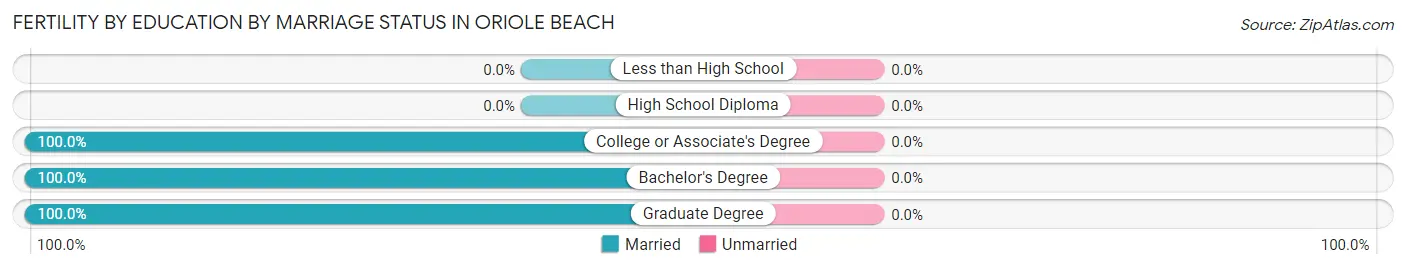
| Educational Attainment | Married | Unmarried |
| Less than High School | 0 (0.0%) | 0 (0.0%) |
| High School Diploma | 0 (0.0%) | 0 (0.0%) |
| College or Associate's Degree | 6 (100.0%) | 0 (0.0%) |
| Bachelor's Degree | 15 (100.0%) | 0 (0.0%) |
| Graduate Degree | 3 (100.0%) | 0 (0.0%) |
| Total | 24 (100.0%) | 0 (0.0%) |
Income in Oriole Beach
Income Overview in Oriole Beach
Per Capita Income in Oriole Beach is $37,756, while median incomes of families and households are $113,750 and $71,080 respectively.
| Characteristic | Number | Measure |
| Per Capita Income | 1,731 | $37,756 |
| Median Family Income | 495 | $113,750 |
| Mean Family Income | 495 | $122,153 |
| Median Household Income | 663 | $71,080 |
| Mean Household Income | 663 | $98,453 |
| Income Deficit | 495 | $0 |
| Wage / Income Gap (%) | 1,731 | 0.00% |
| Wage / Income Gap ($) | 1,731 | 100.00¢ per $1 |
| Gini / Inequality Index | 1,731 | 0.42 |
Earnings by Sex in Oriole Beach
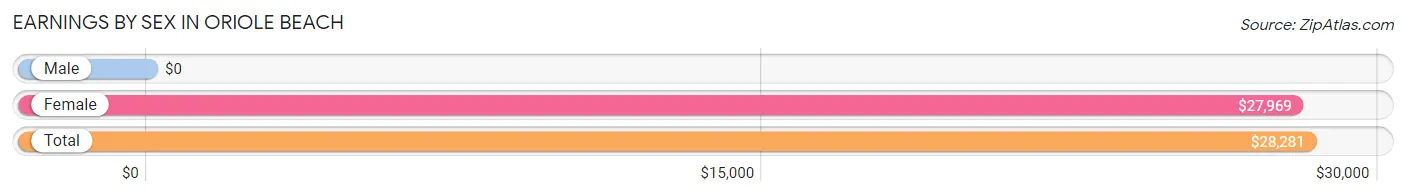
| Sex | Number | Average Earnings |
| Male | 574 (52.0%) | $0 |
| Female | 529 (48.0%) | $27,969 |
| Total | 1,103 (100.0%) | $28,281 |
Earnings by Sex by Income Bracket in Oriole Beach
The most common earnings brackets in Oriole Beach are $100,000+ for men (103 | 17.9%) and $25,000 to $29,999 for women (107 | 20.2%).

| Income | Male | Female |
| $2,499 or less | 54 (9.4%) | 59 (11.2%) |
| $2,500 to $4,999 | 62 (10.8%) | 0 (0.0%) |
| $5,000 to $7,499 | 21 (3.7%) | 11 (2.1%) |
| $7,500 to $9,999 | 19 (3.3%) | 7 (1.3%) |
| $10,000 to $12,499 | 11 (1.9%) | 15 (2.8%) |
| $12,500 to $14,999 | 9 (1.6%) | 0 (0.0%) |
| $15,000 to $17,499 | 0 (0.0%) | 16 (3.0%) |
| $17,500 to $19,999 | 5 (0.9%) | 0 (0.0%) |
| $20,000 to $22,499 | 92 (16.0%) | 69 (13.0%) |
| $22,500 to $24,999 | 0 (0.0%) | 13 (2.5%) |
| $25,000 to $29,999 | 9 (1.6%) | 107 (20.2%) |
| $30,000 to $34,999 | 13 (2.3%) | 33 (6.2%) |
| $35,000 to $39,999 | 0 (0.0%) | 23 (4.3%) |
| $40,000 to $44,999 | 10 (1.7%) | 0 (0.0%) |
| $45,000 to $49,999 | 9 (1.6%) | 0 (0.0%) |
| $50,000 to $54,999 | 0 (0.0%) | 54 (10.2%) |
| $55,000 to $64,999 | 70 (12.2%) | 39 (7.4%) |
| $65,000 to $74,999 | 11 (1.9%) | 38 (7.2%) |
| $75,000 to $99,999 | 76 (13.2%) | 22 (4.2%) |
| $100,000+ | 103 (17.9%) | 23 (4.3%) |
| Total | 574 (100.0%) | 529 (100.0%) |
Earnings by Sex by Educational Attainment in Oriole Beach
Average earnings in Oriole Beach are $57,545 for men and $28,313 for women, a difference of 50.8%. Men with an educational attainment of graduate degree enjoy the highest average annual earnings of $109,821, while those with high school diploma education earn the least with $20,750. Women with an educational attainment of college or associate's degree earn the most with the average annual earnings of $28,750, while those with high school diploma education have the smallest earnings of $26,228.
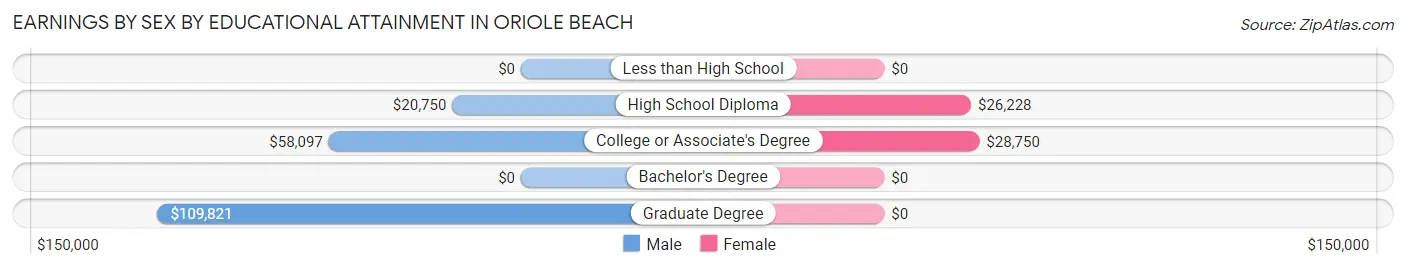
| Educational Attainment | Male Income | Female Income |
| Less than High School | - | - |
| High School Diploma | $20,750 | $26,228 |
| College or Associate's Degree | $58,097 | $28,750 |
| Bachelor's Degree | - | - |
| Graduate Degree | $109,821 | $0 |
| Total | $57,545 | $28,313 |
Family Income in Oriole Beach
Family Income Brackets in Oriole Beach
According to the Oriole Beach family income data, there are 140 families falling into the $100,000 to $149,999 income range, which is the most common income bracket and makes up 28.3% of all families.

| Income Bracket | # Families | % Families |
| Less than $10,000 | 0 | 0.0% |
| $10,000 to $14,999 | 8 | 1.6% |
| $15,000 to $24,999 | 0 | 0.0% |
| $25,000 to $34,999 | 0 | 0.0% |
| $35,000 to $49,999 | 68 | 13.7% |
| $50,000 to $74,999 | 117 | 23.6% |
| $75,000 to $99,999 | 17 | 3.4% |
| $100,000 to $149,999 | 140 | 28.3% |
| $150,000 to $199,999 | 68 | 13.7% |
| $200,000+ | 77 | 15.6% |
Family Income by Famaliy Size in Oriole Beach
3-person families (123 | 24.8%) account for the highest median family income in Oriole Beach with $173,482 per family, while 3-person families (123 | 24.8%) have the highest median income of $57,827 per family member.
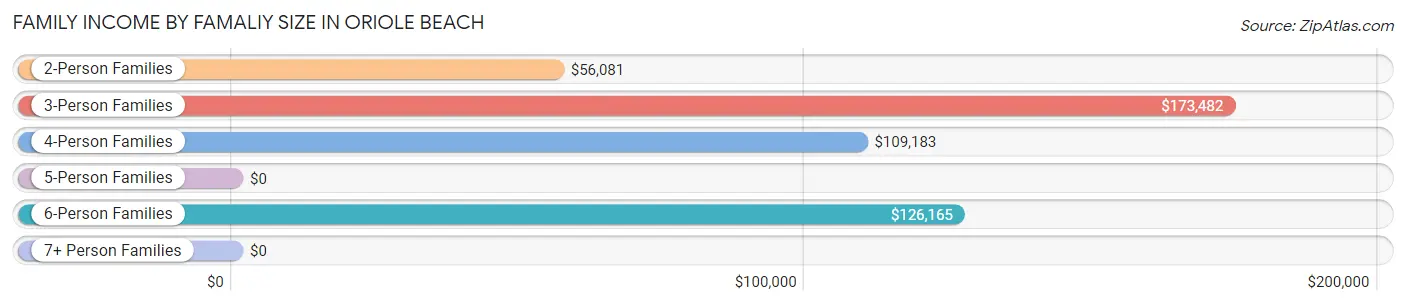
| Income Bracket | # Families | Median Income |
| 2-Person Families | 213 (43.0%) | $56,081 |
| 3-Person Families | 123 (24.8%) | $173,482 |
| 4-Person Families | 93 (18.8%) | $109,183 |
| 5-Person Families | 13 (2.6%) | $0 |
| 6-Person Families | 53 (10.7%) | $126,165 |
| 7+ Person Families | 0 (0.0%) | $0 |
| Total | 495 (100.0%) | $113,750 |
Family Income by Number of Earners in Oriole Beach
The median family income in Oriole Beach is $113,750, with families comprising 3+ earners (97) having the highest median family income of $127,017, while families with 1 earner (94) have the lowest median family income of $56,568, accounting for 19.6% and 19.0% of families, respectively.
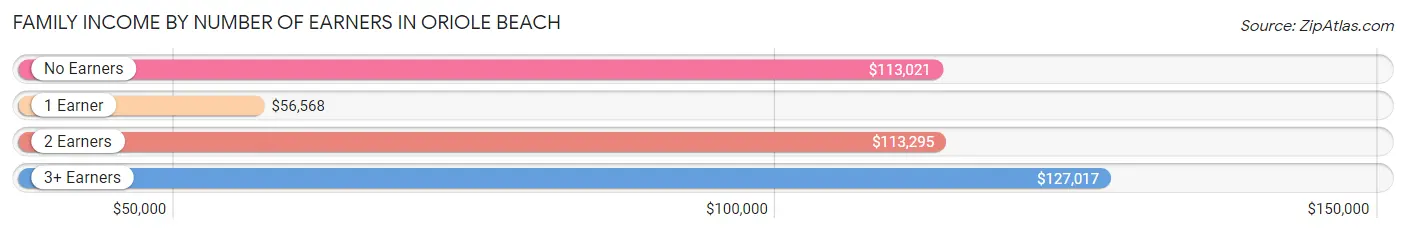
| Number of Earners | # Families | Median Income |
| No Earners | 45 (9.1%) | $113,021 |
| 1 Earner | 94 (19.0%) | $56,568 |
| 2 Earners | 259 (52.3%) | $113,295 |
| 3+ Earners | 97 (19.6%) | $127,017 |
| Total | 495 (100.0%) | $113,750 |
Household Income in Oriole Beach
Household Income Brackets in Oriole Beach
With 140 households falling in the category, the $100,000 to $149,999 income range is the most frequent in Oriole Beach, accounting for 21.1% of all households.
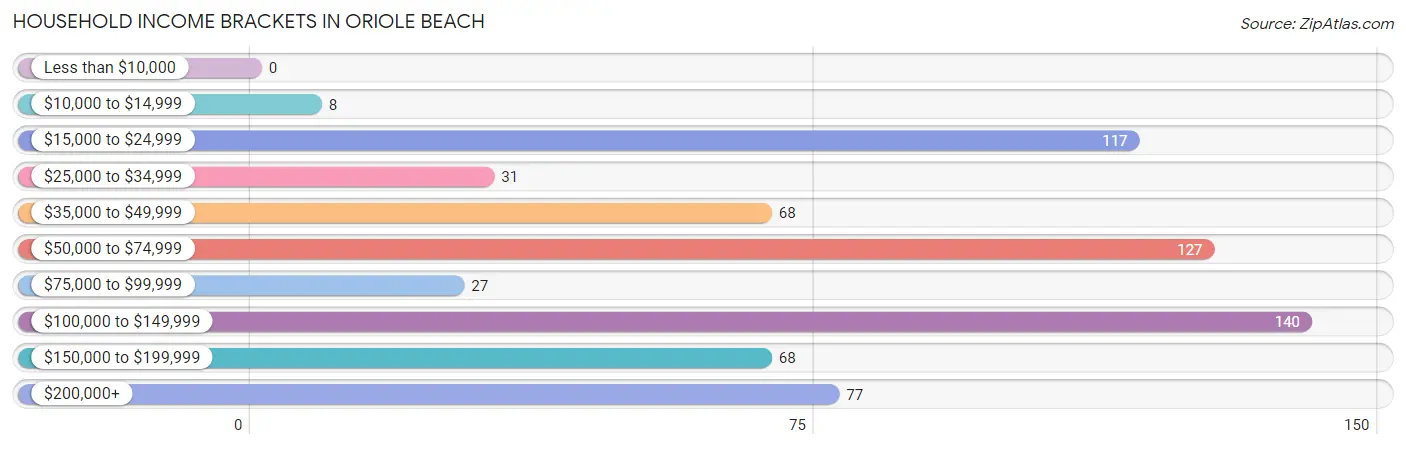
| Income Bracket | # Households | % Households |
| Less than $10,000 | 0 | 0.0% |
| $10,000 to $14,999 | 8 | 1.2% |
| $15,000 to $24,999 | 117 | 17.6% |
| $25,000 to $34,999 | 31 | 4.7% |
| $35,000 to $49,999 | 68 | 10.3% |
| $50,000 to $74,999 | 127 | 19.2% |
| $75,000 to $99,999 | 27 | 4.1% |
| $100,000 to $149,999 | 140 | 21.1% |
| $150,000 to $199,999 | 68 | 10.3% |
| $200,000+ | 77 | 11.6% |
Household Income by Householder Age in Oriole Beach
The median household income in Oriole Beach is $71,080, with the highest median household income of $125,963 found in the 25 to 44 years age bracket for the primary householder. A total of 241 households (36.3%) fall into this category.
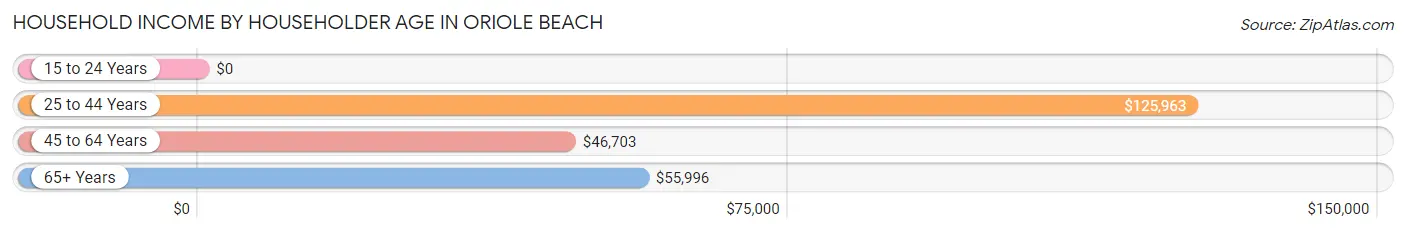
| Income Bracket | # Households | Median Income |
| 15 to 24 Years | 0 (0.0%) | $0 |
| 25 to 44 Years | 241 (36.3%) | $125,963 |
| 45 to 64 Years | 237 (35.7%) | $46,703 |
| 65+ Years | 185 (27.9%) | $55,996 |
| Total | 663 (100.0%) | $71,080 |
Poverty in Oriole Beach
Income Below Poverty by Sex and Age in Oriole Beach
With 0.9% poverty level for males and 1.1% for females among the residents of Oriole Beach, 75 year old and over males and 75 year old and over females are the most vulnerable to poverty, with 8 males (13.6%) and 9 females (10.3%) in their respective age groups living below the poverty level.
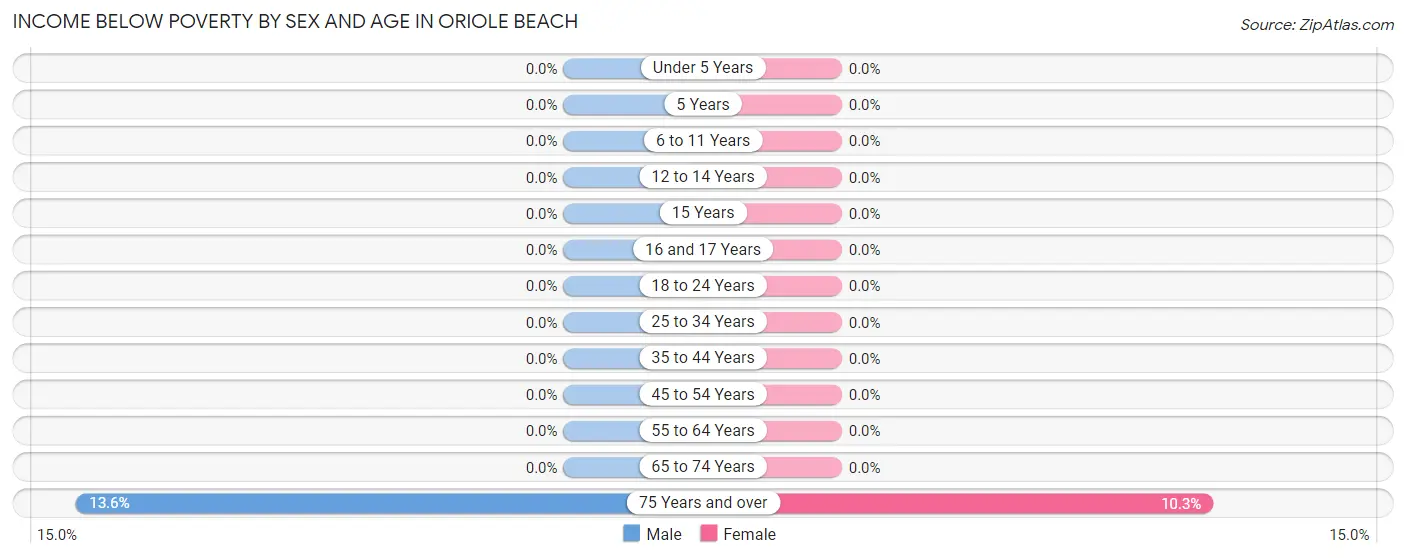
| Age Bracket | Male | Female |
| Under 5 Years | 0 (0.0%) | 0 (0.0%) |
| 5 Years | 0 (0.0%) | 0 (0.0%) |
| 6 to 11 Years | 0 (0.0%) | 0 (0.0%) |
| 12 to 14 Years | 0 (0.0%) | 0 (0.0%) |
| 15 Years | 0 (0.0%) | 0 (0.0%) |
| 16 and 17 Years | 0 (0.0%) | 0 (0.0%) |
| 18 to 24 Years | 0 (0.0%) | 0 (0.0%) |
| 25 to 34 Years | 0 (0.0%) | 0 (0.0%) |
| 35 to 44 Years | 0 (0.0%) | 0 (0.0%) |
| 45 to 54 Years | 0 (0.0%) | 0 (0.0%) |
| 55 to 64 Years | 0 (0.0%) | 0 (0.0%) |
| 65 to 74 Years | 0 (0.0%) | 0 (0.0%) |
| 75 Years and over | 8 (13.6%) | 9 (10.3%) |
| Total | 8 (0.9%) | 9 (1.1%) |
Income Above Poverty by Sex and Age in Oriole Beach
According to the poverty statistics in Oriole Beach, males aged under 5 years and females aged under 5 years are the age groups that are most secure financially, with 100.0% of males and 100.0% of females in these age groups living above the poverty line.
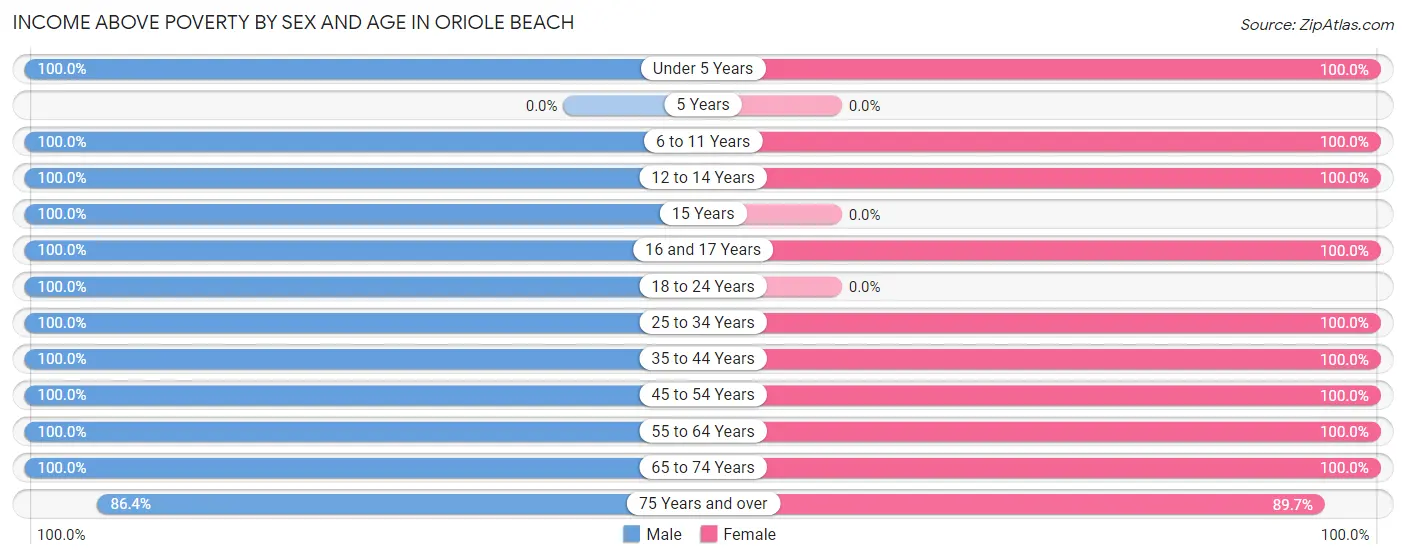
| Age Bracket | Male | Female |
| Under 5 Years | 102 (100.0%) | 51 (100.0%) |
| 5 Years | 0 (0.0%) | 0 (0.0%) |
| 6 to 11 Years | 49 (100.0%) | 87 (100.0%) |
| 12 to 14 Years | 4 (100.0%) | 57 (100.0%) |
| 15 Years | 8 (100.0%) | 0 (0.0%) |
| 16 and 17 Years | 29 (100.0%) | 30 (100.0%) |
| 18 to 24 Years | 80 (100.0%) | 0 (0.0%) |
| 25 to 34 Years | 123 (100.0%) | 112 (100.0%) |
| 35 to 44 Years | 159 (100.0%) | 132 (100.0%) |
| 45 to 54 Years | 37 (100.0%) | 95 (100.0%) |
| 55 to 64 Years | 150 (100.0%) | 131 (100.0%) |
| 65 to 74 Years | 103 (100.0%) | 46 (100.0%) |
| 75 Years and over | 51 (86.4%) | 78 (89.7%) |
| Total | 895 (99.1%) | 819 (98.9%) |
Income Below Poverty Among Married-Couple Families in Oriole Beach
The poverty statistics for married-couple families in Oriole Beach show that 1.7% or 8 of the total 472 families live below the poverty line. Families with no children have the highest poverty rate of 3.2%, comprising of 8 families. On the other hand, families with 1 or 2 children have the lowest poverty rate of 0.0%, which includes 0 families.
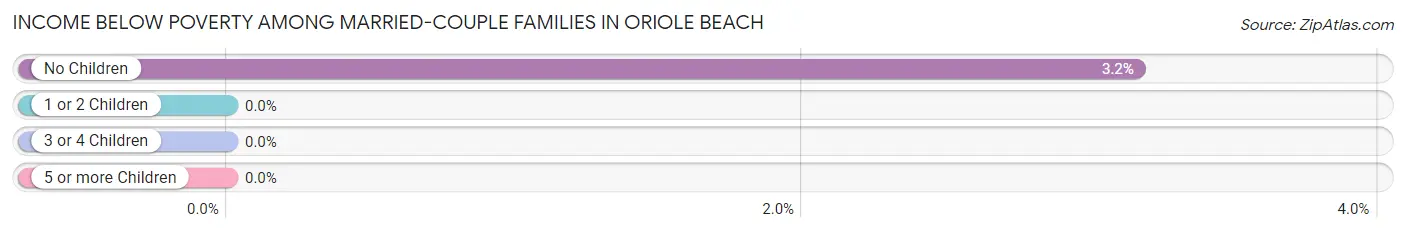
| Children | Above Poverty | Below Poverty |
| No Children | 245 (96.8%) | 8 (3.2%) |
| 1 or 2 Children | 169 (100.0%) | 0 (0.0%) |
| 3 or 4 Children | 50 (100.0%) | 0 (0.0%) |
| 5 or more Children | 0 (0.0%) | 0 (0.0%) |
| Total | 464 (98.3%) | 8 (1.7%) |
Income Below Poverty Among Single-Parent Households in Oriole Beach
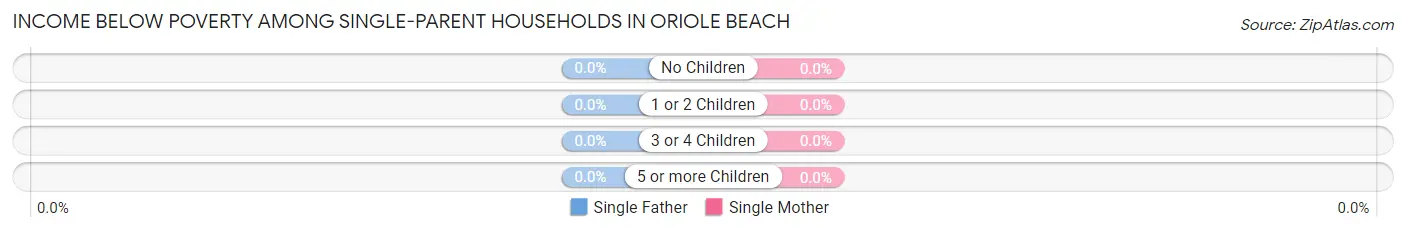
| Children | Single Father | Single Mother |
| No Children | 0 (0.0%) | 0 (0.0%) |
| 1 or 2 Children | 0 (0.0%) | 0 (0.0%) |
| 3 or 4 Children | 0 (0.0%) | 0 (0.0%) |
| 5 or more Children | 0 (0.0%) | 0 (0.0%) |
| Total | 0 (0.0%) | 0 (0.0%) |
Income Below Poverty Among Married-Couple vs Single-Parent Households in Oriole Beach
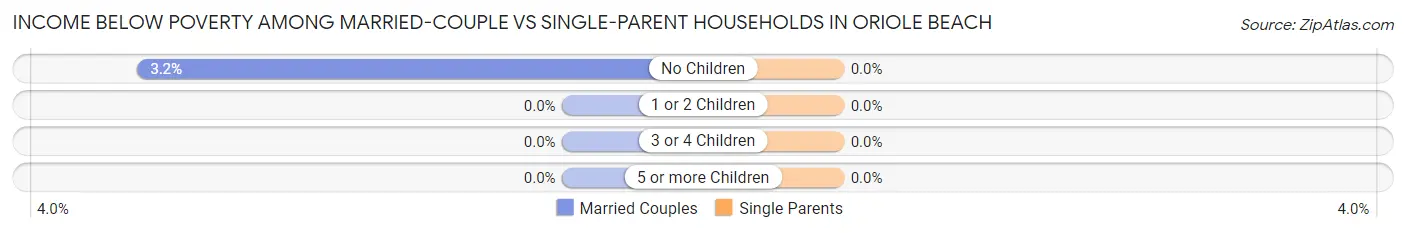
| Children | Married-Couple Families | Single-Parent Households |
| No Children | 8 (3.2%) | 0 (0.0%) |
| 1 or 2 Children | 0 (0.0%) | 0 (0.0%) |
| 3 or 4 Children | 0 (0.0%) | 0 (0.0%) |
| 5 or more Children | 0 (0.0%) | 0 (0.0%) |
| Total | 8 (1.7%) | 0 (0.0%) |
Employment Characteristics in Oriole Beach
Employment by Class of Employer in Oriole Beach
Among the 924 employed individuals in Oriole Beach, private company employees (711 | 76.9%), self-employed (not incorporated) (56 | 6.1%), and local government employees (48 | 5.2%) make up the most common classes of employment.
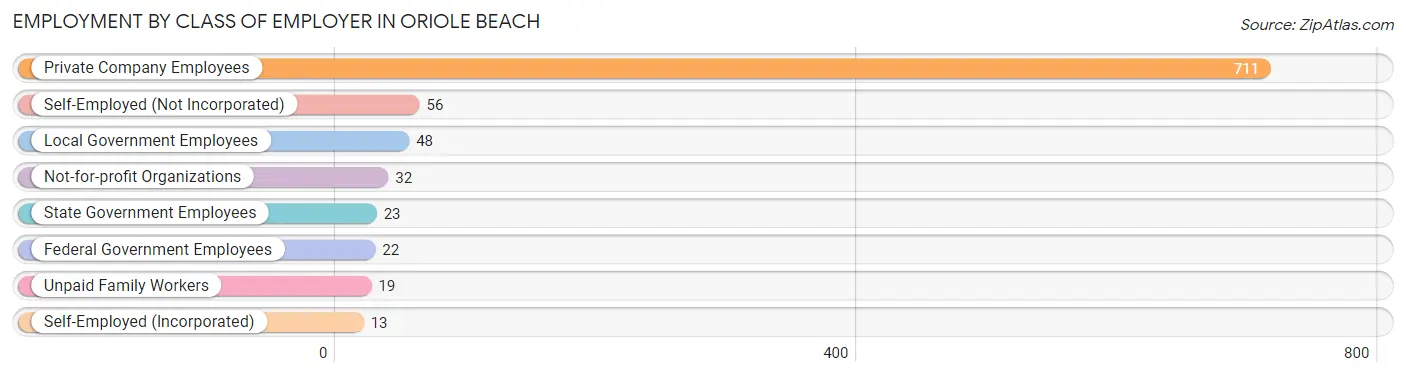
| Employer Class | # Employees | % Employees |
| Private Company Employees | 711 | 76.9% |
| Self-Employed (Incorporated) | 13 | 1.4% |
| Self-Employed (Not Incorporated) | 56 | 6.1% |
| Not-for-profit Organizations | 32 | 3.5% |
| Local Government Employees | 48 | 5.2% |
| State Government Employees | 23 | 2.5% |
| Federal Government Employees | 22 | 2.4% |
| Unpaid Family Workers | 19 | 2.1% |
| Total | 924 | 100.0% |
Employment Status by Age in Oriole Beach
According to the labor force statistics for Oriole Beach, out of the total population over 16 years of age (1,373), 68.8% or 945 individuals are in the labor force, with 2.1% or 20 of them unemployed. The age group with the highest labor force participation rate is 25 to 29 years, with 100.0% or 146 individuals in the labor force. Within the labor force, the 16 to 19 years age range has the highest percentage of unemployed individuals, with 40.0% or 12 of them being unemployed.
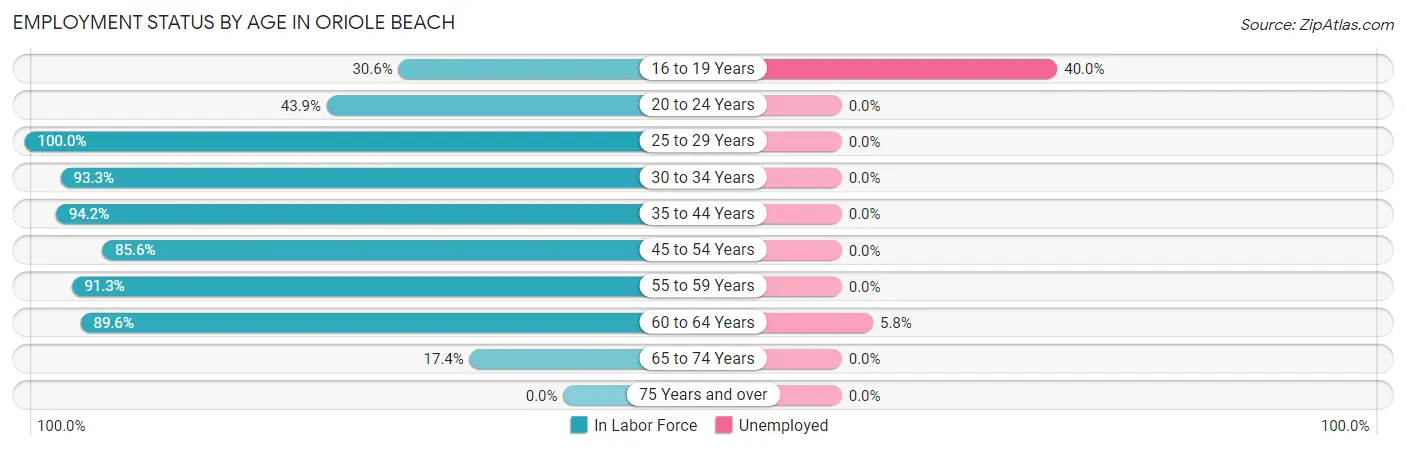
| Age Bracket | In Labor Force | Unemployed |
| 16 to 19 Years | 30 (30.6%) | 12 (40.0%) |
| 20 to 24 Years | 18 (43.9%) | 0 (0.0%) |
| 25 to 29 Years | 146 (100.0%) | 0 (0.0%) |
| 30 to 34 Years | 83 (93.3%) | 0 (0.0%) |
| 35 to 44 Years | 274 (94.2%) | 0 (0.0%) |
| 45 to 54 Years | 113 (85.6%) | 0 (0.0%) |
| 55 to 59 Years | 116 (91.3%) | 0 (0.0%) |
| 60 to 64 Years | 138 (89.6%) | 8 (5.8%) |
| 65 to 74 Years | 26 (17.4%) | 0 (0.0%) |
| 75 Years and over | 0 (0.0%) | 0 (0.0%) |
| Total | 945 (68.8%) | 20 (2.1%) |
Employment Status by Educational Attainment in Oriole Beach
According to labor force statistics for Oriole Beach, 92.7% of individuals (870) out of the total population between 25 and 64 years of age (939) are in the labor force, with 0.9% or 8 of them being unemployed. The group with the highest labor force participation rate are those with the educational attainment of bachelor's degree or higher, with 96.5% or 473 individuals in the labor force. Within the labor force, individuals with bachelor's degree or higher education have the highest percentage of unemployment, with 1.7% or 8 of them being unemployed.
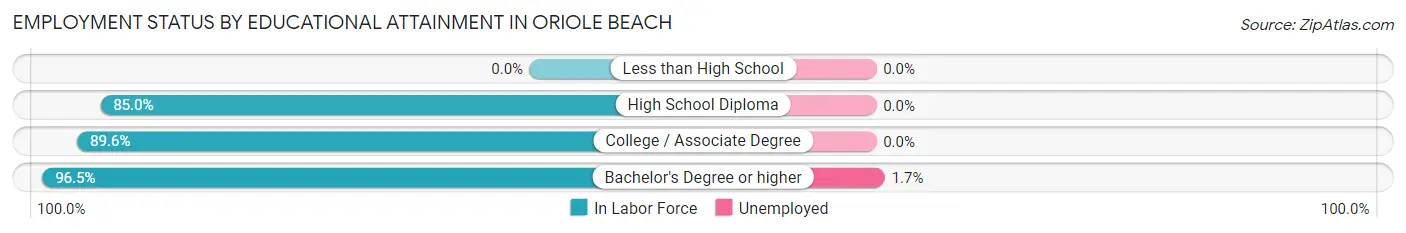
| Educational Attainment | In Labor Force | Unemployed |
| Less than High School | 0 (0.0%) | 0 (0.0%) |
| High School Diploma | 96 (85.0%) | 0 (0.0%) |
| College / Associate Degree | 301 (89.6%) | 0 (0.0%) |
| Bachelor's Degree or higher | 473 (96.5%) | 8 (1.7%) |
| Total | 870 (92.7%) | 8 (0.9%) |
Employment Occupations by Sex in Oriole Beach
Management, Business, Science and Arts Occupations
The most common Management, Business, Science and Arts occupations in Oriole Beach are Community & Social Service (160 | 17.3%), Management (104 | 11.3%), Business & Financial (77 | 8.3%), Health Diagnosing & Treating (71 | 7.7%), and Education Instruction & Library (59 | 6.4%).

Management, Business, Science and Arts Occupations by Sex
Within the Management, Business, Science and Arts occupations in Oriole Beach, the most male-oriented occupations are Computers & Mathematics (100.0%), Arts, Media & Entertainment (100.0%), and Management (60.6%), while the most female-oriented occupations are Life, Physical & Social Science (100.0%), Education Instruction & Library (100.0%), and Health Diagnosing & Treating (88.7%).
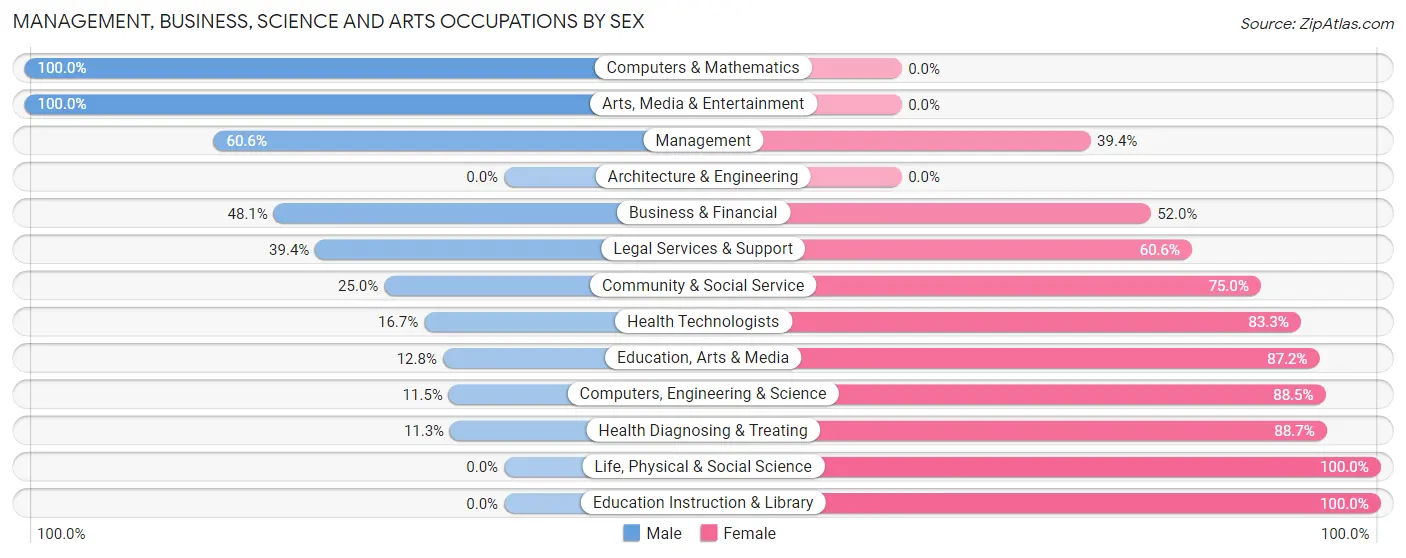
| Occupation | Male | Female |
| Management | 63 (60.6%) | 41 (39.4%) |
| Business & Financial | 37 (48.0%) | 40 (51.9%) |
| Computers, Engineering & Science | 3 (11.5%) | 23 (88.5%) |
| Computers & Mathematics | 3 (100.0%) | 0 (0.0%) |
| Architecture & Engineering | 0 (0.0%) | 0 (0.0%) |
| Life, Physical & Social Science | 0 (0.0%) | 23 (100.0%) |
| Community & Social Service | 40 (25.0%) | 120 (75.0%) |
| Education, Arts & Media | 6 (12.8%) | 41 (87.2%) |
| Legal Services & Support | 13 (39.4%) | 20 (60.6%) |
| Education Instruction & Library | 0 (0.0%) | 59 (100.0%) |
| Arts, Media & Entertainment | 21 (100.0%) | 0 (0.0%) |
| Health Diagnosing & Treating | 8 (11.3%) | 63 (88.7%) |
| Health Technologists | 8 (16.7%) | 40 (83.3%) |
| Total (Category) | 151 (34.5%) | 287 (65.5%) |
| Total (Overall) | 454 (49.1%) | 470 (50.9%) |
Services Occupations
The most common Services occupations in Oriole Beach are Food Preparation & Serving (22 | 2.4%), Security & Protection (14 | 1.5%), and Law Enforcement (14 | 1.5%).
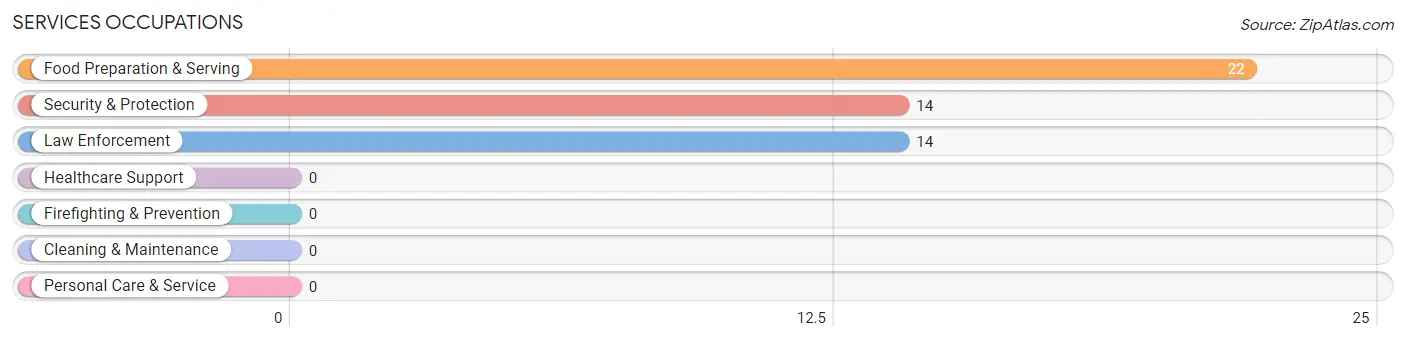
Services Occupations by Sex

| Occupation | Male | Female |
| Healthcare Support | 0 (0.0%) | 0 (0.0%) |
| Security & Protection | 14 (100.0%) | 0 (0.0%) |
| Firefighting & Prevention | 0 (0.0%) | 0 (0.0%) |
| Law Enforcement | 14 (100.0%) | 0 (0.0%) |
| Food Preparation & Serving | 7 (31.8%) | 15 (68.2%) |
| Cleaning & Maintenance | 0 (0.0%) | 0 (0.0%) |
| Personal Care & Service | 0 (0.0%) | 0 (0.0%) |
| Total (Category) | 21 (58.3%) | 15 (41.7%) |
| Total (Overall) | 454 (49.1%) | 470 (50.9%) |
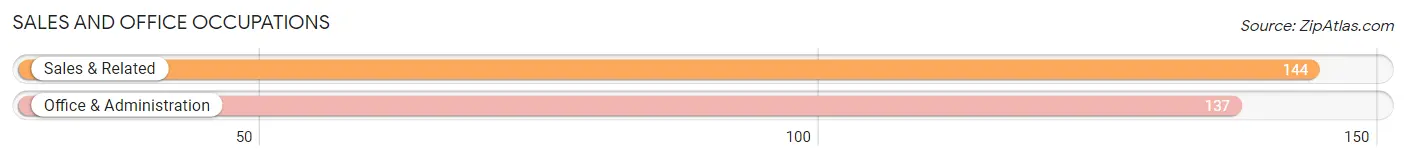
Sales and Office Occupations
The most common Sales and Office occupations in Oriole Beach are Sales & Related (144 | 15.6%), and Office & Administration (137 | 14.8%).
Sales and Office Occupations by Sex
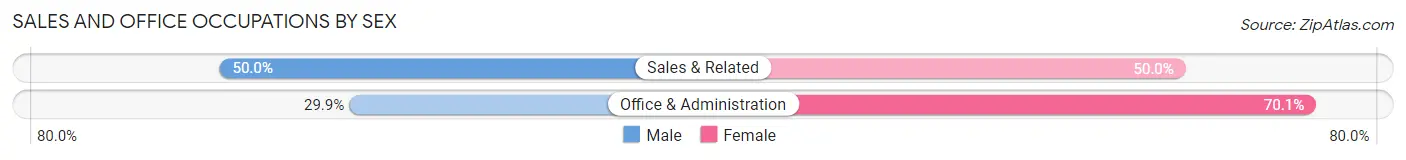
| Occupation | Male | Female |
| Sales & Related | 72 (50.0%) | 72 (50.0%) |
| Office & Administration | 41 (29.9%) | 96 (70.1%) |
| Total (Category) | 113 (40.2%) | 168 (59.8%) |
| Total (Overall) | 454 (49.1%) | 470 (50.9%) |
Natural Resources, Construction and Maintenance Occupations
The most common Natural Resources, Construction and Maintenance occupations in Oriole Beach are Installation, Maintenance & Repair (47 | 5.1%), and Construction & Extraction (31 | 3.4%).
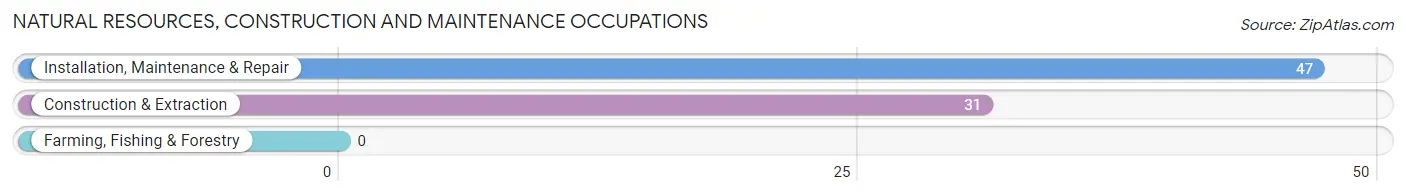
Natural Resources, Construction and Maintenance Occupations by Sex
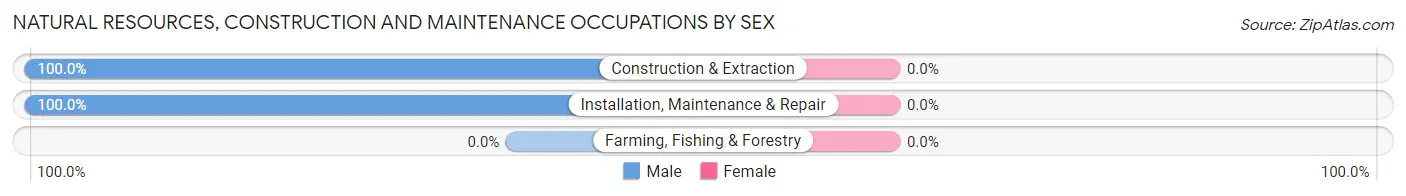
| Occupation | Male | Female |
| Farming, Fishing & Forestry | 0 (0.0%) | 0 (0.0%) |
| Construction & Extraction | 31 (100.0%) | 0 (0.0%) |
| Installation, Maintenance & Repair | 47 (100.0%) | 0 (0.0%) |
| Total (Category) | 78 (100.0%) | 0 (0.0%) |
| Total (Overall) | 454 (49.1%) | 470 (50.9%) |
Production, Transportation and Moving Occupations
The most common Production, Transportation and Moving occupations in Oriole Beach are Production (44 | 4.8%), Transportation (34 | 3.7%), and Material Moving (13 | 1.4%).

Production, Transportation and Moving Occupations by Sex

| Occupation | Male | Female |
| Production | 44 (100.0%) | 0 (0.0%) |
| Transportation | 34 (100.0%) | 0 (0.0%) |
| Material Moving | 13 (100.0%) | 0 (0.0%) |
| Total (Category) | 91 (100.0%) | 0 (0.0%) |
| Total (Overall) | 454 (49.1%) | 470 (50.9%) |
Employment Industries by Sex in Oriole Beach
Employment Industries in Oriole Beach
The major employment industries in Oriole Beach include Retail Trade (281 | 30.4%), Health Care & Social Assistance (107 | 11.6%), Professional & Scientific (90 | 9.7%), Finance & Insurance (75 | 8.1%), and Construction (65 | 7.0%).

Employment Industries by Sex in Oriole Beach
The Oriole Beach industries that see more men than women are Construction (100.0%), Transportation & Warehousing (100.0%), and Administrative & Support (100.0%), whereas the industries that tend to have a higher number of women are Finance & Insurance (100.0%), Educational Services (100.0%), and Professional & Scientific (65.6%).
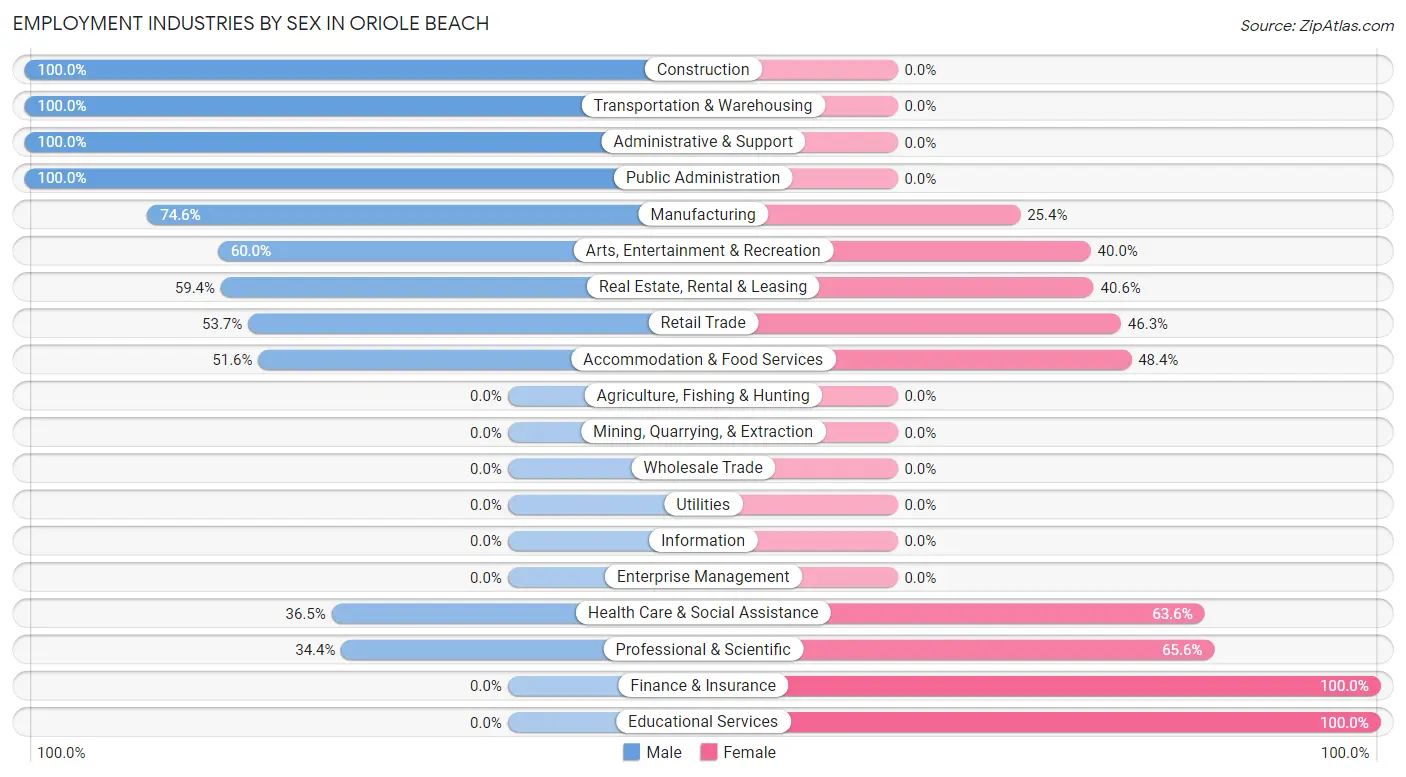
| Industry | Male | Female |
| Agriculture, Fishing & Hunting | 0 (0.0%) | 0 (0.0%) |
| Mining, Quarrying, & Extraction | 0 (0.0%) | 0 (0.0%) |
| Construction | 65 (100.0%) | 0 (0.0%) |
| Manufacturing | 44 (74.6%) | 15 (25.4%) |
| Wholesale Trade | 0 (0.0%) | 0 (0.0%) |
| Retail Trade | 151 (53.7%) | 130 (46.3%) |
| Transportation & Warehousing | 29 (100.0%) | 0 (0.0%) |
| Utilities | 0 (0.0%) | 0 (0.0%) |
| Information | 0 (0.0%) | 0 (0.0%) |
| Finance & Insurance | 0 (0.0%) | 75 (100.0%) |
| Real Estate, Rental & Leasing | 19 (59.4%) | 13 (40.6%) |
| Professional & Scientific | 31 (34.4%) | 59 (65.6%) |
| Enterprise Management | 0 (0.0%) | 0 (0.0%) |
| Administrative & Support | 13 (100.0%) | 0 (0.0%) |
| Educational Services | 0 (0.0%) | 59 (100.0%) |
| Health Care & Social Assistance | 39 (36.4%) | 68 (63.5%) |
| Arts, Entertainment & Recreation | 15 (60.0%) | 10 (40.0%) |
| Accommodation & Food Services | 16 (51.6%) | 15 (48.4%) |
| Public Administration | 26 (100.0%) | 0 (0.0%) |
| Total | 454 (49.1%) | 470 (50.9%) |
Education in Oriole Beach
School Enrollment in Oriole Beach
The most common levels of schooling among the 400 students in Oriole Beach are middle school (130 | 32.5%), high school (94 | 23.5%), and college / undergraduate (72 | 18.0%).
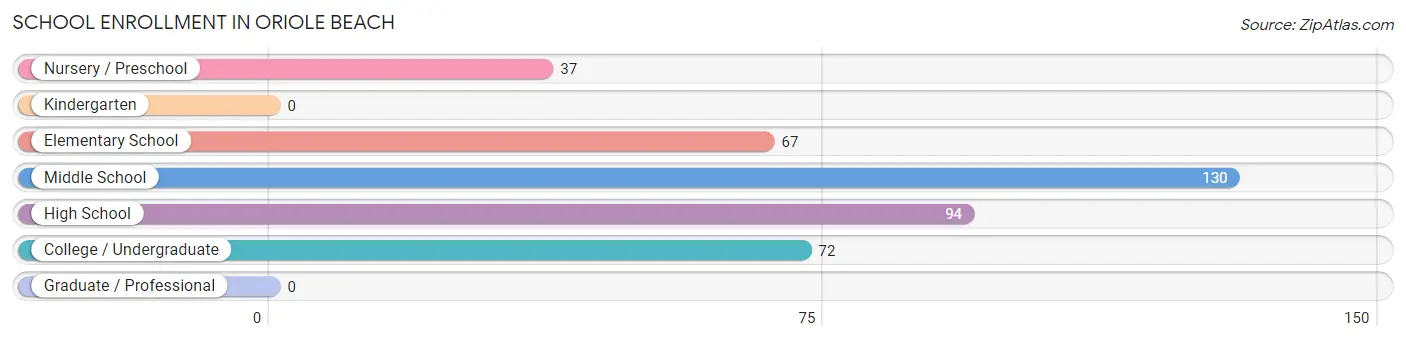
| School Level | # Students | % Students |
| Nursery / Preschool | 37 | 9.2% |
| Kindergarten | 0 | 0.0% |
| Elementary School | 67 | 16.8% |
| Middle School | 130 | 32.5% |
| High School | 94 | 23.5% |
| College / Undergraduate | 72 | 18.0% |
| Graduate / Professional | 0 | 0.0% |
| Total | 400 | 100.0% |
School Enrollment by Age by Funding Source in Oriole Beach
Out of a total of 400 students who are enrolled in schools in Oriole Beach, 72 (18.0%) attend a private institution, while the remaining 328 (82.0%) are enrolled in public schools. The age group of 3 to 4 year olds has the highest likelihood of being enrolled in private schools, with 17 (46.0% in the age bracket) enrolled. Conversely, the age group of 5 to 9 year old has the lowest likelihood of being enrolled in a private school, with 67 (100.0% in the age bracket) attending a public institution.
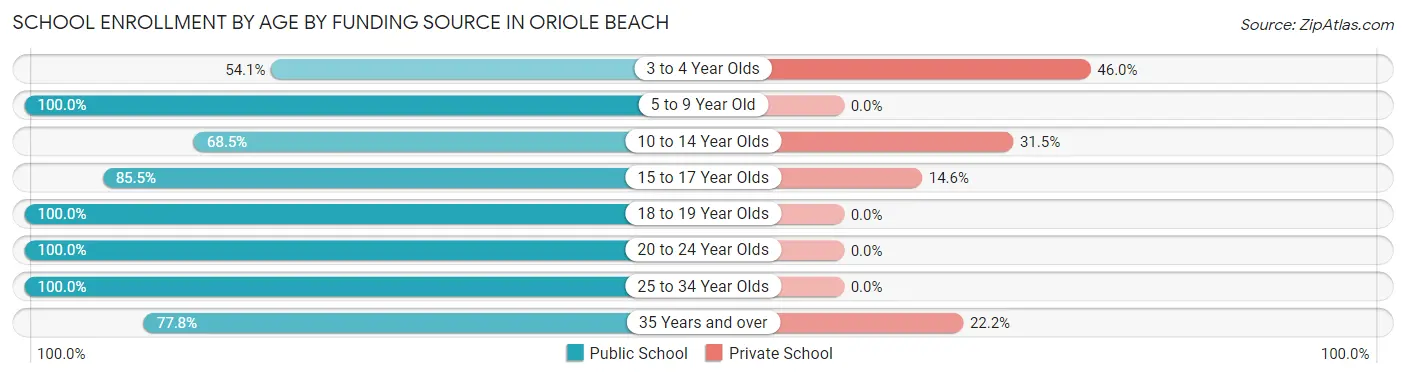
| Age Bracket | Public School | Private School |
| 3 to 4 Year Olds | 20 (54.0%) | 17 (46.0%) |
| 5 to 9 Year Old | 67 (100.0%) | 0 (0.0%) |
| 10 to 14 Year Olds | 89 (68.5%) | 41 (31.5%) |
| 15 to 17 Year Olds | 47 (85.5%) | 8 (14.5%) |
| 18 to 19 Year Olds | 39 (100.0%) | 0 (0.0%) |
| 20 to 24 Year Olds | 23 (100.0%) | 0 (0.0%) |
| 25 to 34 Year Olds | 22 (100.0%) | 0 (0.0%) |
| 35 Years and over | 21 (77.8%) | 6 (22.2%) |
| Total | 328 (82.0%) | 72 (18.0%) |
Educational Attainment by Field of Study in Oriole Beach
Business (217 | 32.6%), science & technology (127 | 19.1%), bio, nature & agricultural (68 | 10.2%), arts & humanities (63 | 9.5%), and education (49 | 7.4%) are the most common fields of study among 665 individuals in Oriole Beach who have obtained a bachelor's degree or higher.
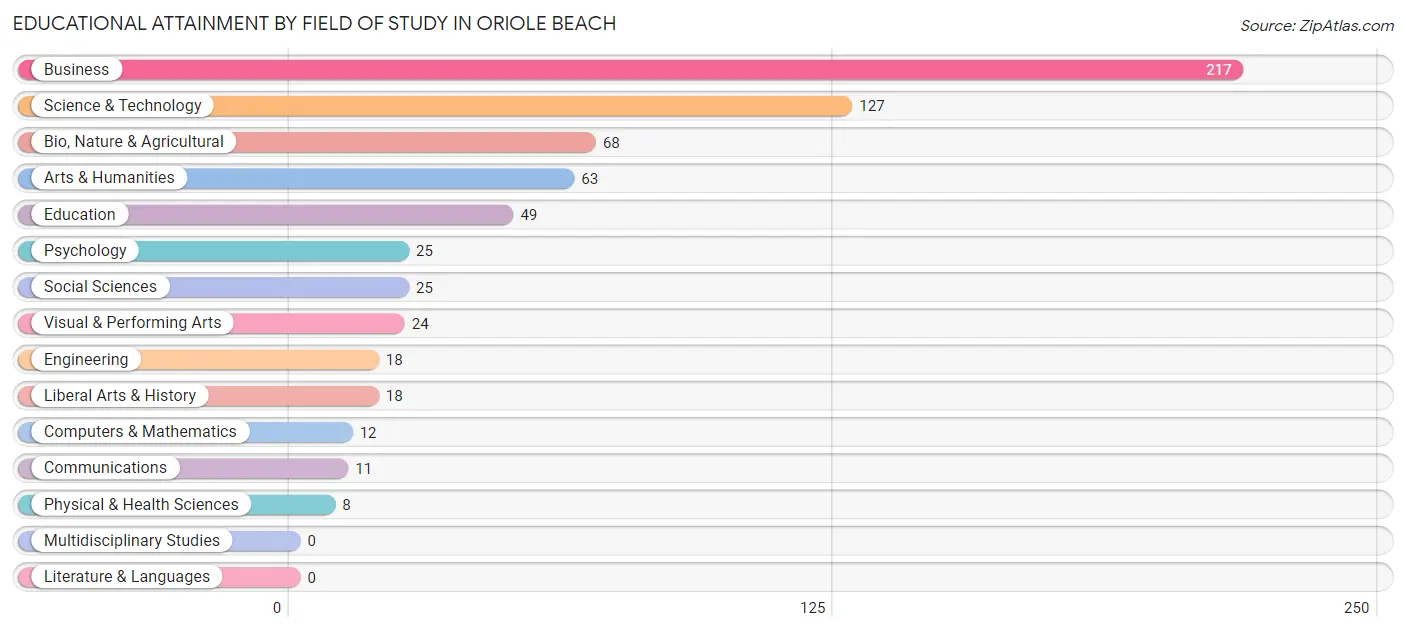
| Field of Study | # Graduates | % Graduates |
| Computers & Mathematics | 12 | 1.8% |
| Bio, Nature & Agricultural | 68 | 10.2% |
| Physical & Health Sciences | 8 | 1.2% |
| Psychology | 25 | 3.8% |
| Social Sciences | 25 | 3.8% |
| Engineering | 18 | 2.7% |
| Multidisciplinary Studies | 0 | 0.0% |
| Science & Technology | 127 | 19.1% |
| Business | 217 | 32.6% |
| Education | 49 | 7.4% |
| Literature & Languages | 0 | 0.0% |
| Liberal Arts & History | 18 | 2.7% |
| Visual & Performing Arts | 24 | 3.6% |
| Communications | 11 | 1.7% |
| Arts & Humanities | 63 | 9.5% |
| Total | 665 | 100.0% |
Transportation & Commute in Oriole Beach
Vehicle Availability by Sex in Oriole Beach
The most prevalent vehicle ownership categories in Oriole Beach are males with 2 vehicles (264, accounting for 58.2%) and females with 2 vehicles (218, making up 56.2%).
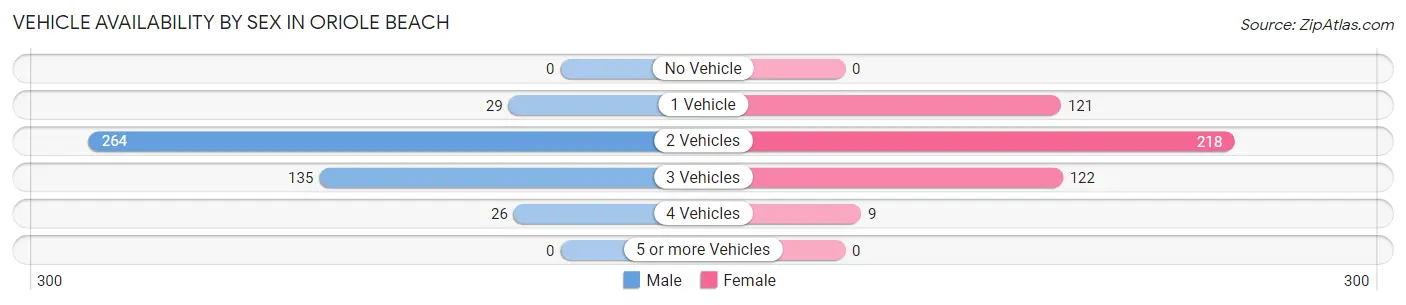
| Vehicles Available | Male | Female |
| No Vehicle | 0 (0.0%) | 0 (0.0%) |
| 1 Vehicle | 29 (6.4%) | 121 (25.7%) |
| 2 Vehicles | 264 (58.2%) | 218 (46.4%) |
| 3 Vehicles | 135 (29.7%) | 122 (26.0%) |
| 4 Vehicles | 26 (5.7%) | 9 (1.9%) |
| 5 or more Vehicles | 0 (0.0%) | 0 (0.0%) |
| Total | 454 (100.0%) | 470 (100.0%) |
Commute Time in Oriole Beach
The most frequently occuring commute durations in Oriole Beach are 30 to 34 minutes (180 commuters, 23.2%), 20 to 24 minutes (145 commuters, 18.7%), and 45 to 59 minutes (131 commuters, 16.9%).
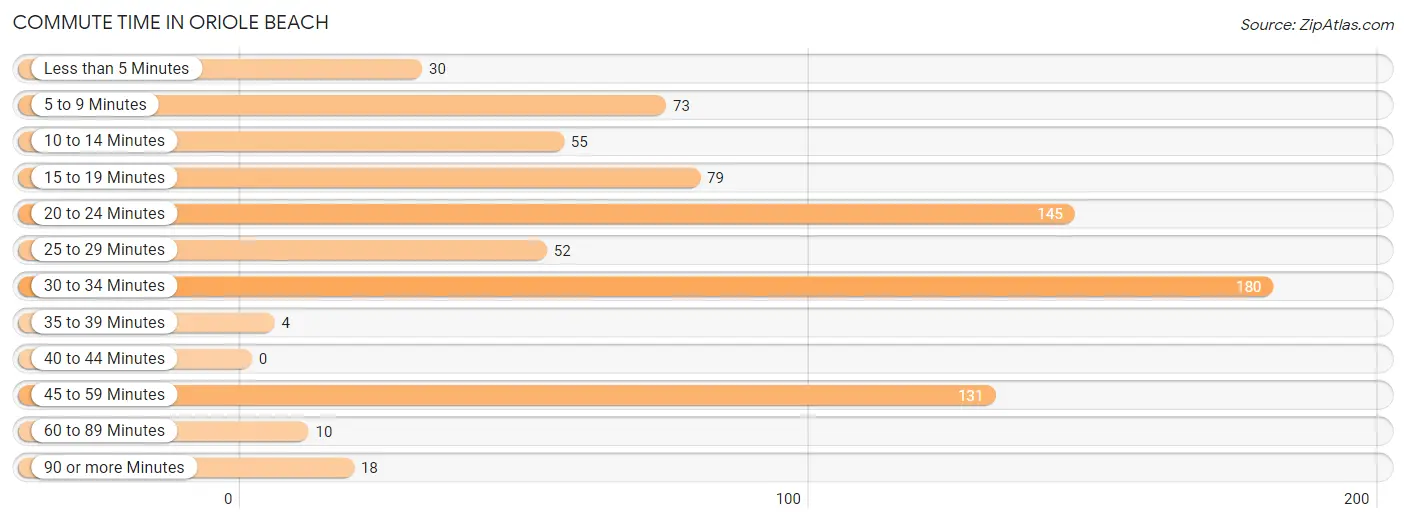
| Commute Time | # Commuters | % Commuters |
| Less than 5 Minutes | 30 | 3.9% |
| 5 to 9 Minutes | 73 | 9.4% |
| 10 to 14 Minutes | 55 | 7.1% |
| 15 to 19 Minutes | 79 | 10.2% |
| 20 to 24 Minutes | 145 | 18.7% |
| 25 to 29 Minutes | 52 | 6.7% |
| 30 to 34 Minutes | 180 | 23.2% |
| 35 to 39 Minutes | 4 | 0.5% |
| 40 to 44 Minutes | 0 | 0.0% |
| 45 to 59 Minutes | 131 | 16.9% |
| 60 to 89 Minutes | 10 | 1.3% |
| 90 or more Minutes | 18 | 2.3% |
Commute Time by Sex in Oriole Beach
The most common commute times in Oriole Beach are 30 to 34 minutes (118 commuters, 29.9%) for males and 20 to 24 minutes (82 commuters, 21.5%) for females.
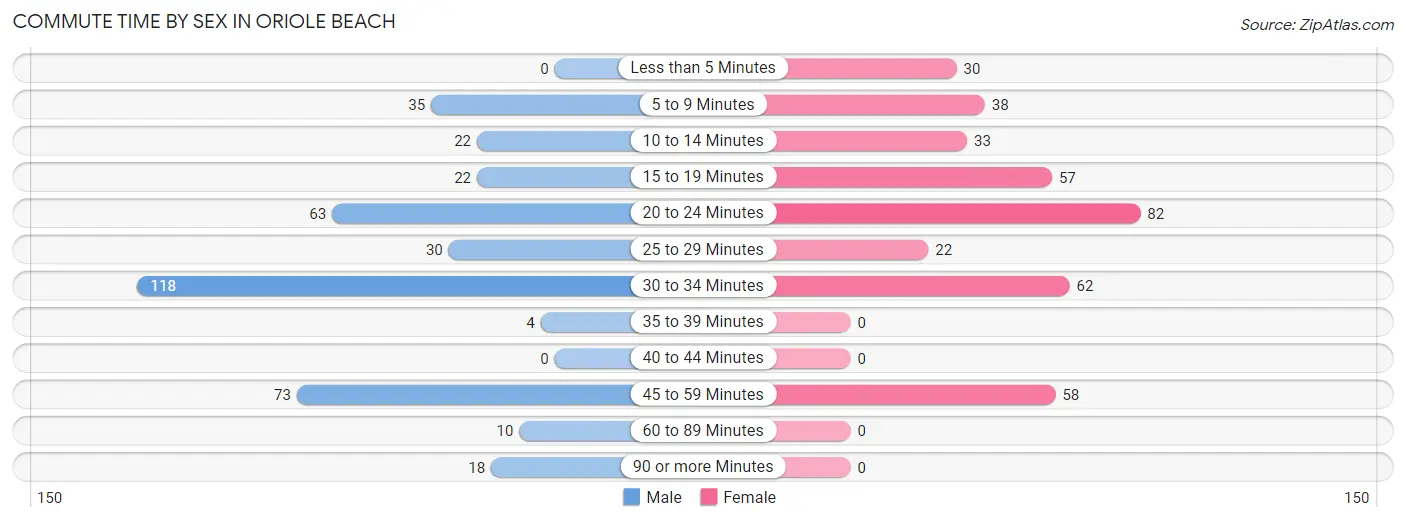
| Commute Time | Male | Female |
| Less than 5 Minutes | 0 (0.0%) | 30 (7.9%) |
| 5 to 9 Minutes | 35 (8.9%) | 38 (10.0%) |
| 10 to 14 Minutes | 22 (5.6%) | 33 (8.6%) |
| 15 to 19 Minutes | 22 (5.6%) | 57 (14.9%) |
| 20 to 24 Minutes | 63 (16.0%) | 82 (21.5%) |
| 25 to 29 Minutes | 30 (7.6%) | 22 (5.8%) |
| 30 to 34 Minutes | 118 (29.9%) | 62 (16.2%) |
| 35 to 39 Minutes | 4 (1.0%) | 0 (0.0%) |
| 40 to 44 Minutes | 0 (0.0%) | 0 (0.0%) |
| 45 to 59 Minutes | 73 (18.5%) | 58 (15.2%) |
| 60 to 89 Minutes | 10 (2.5%) | 0 (0.0%) |
| 90 or more Minutes | 18 (4.6%) | 0 (0.0%) |
Time of Departure to Work by Sex in Oriole Beach
The most frequent times of departure to work in Oriole Beach are 9:00 AM to 9:59 AM (102, 25.8%) for males and 9:00 AM to 9:59 AM (119, 31.1%) for females.
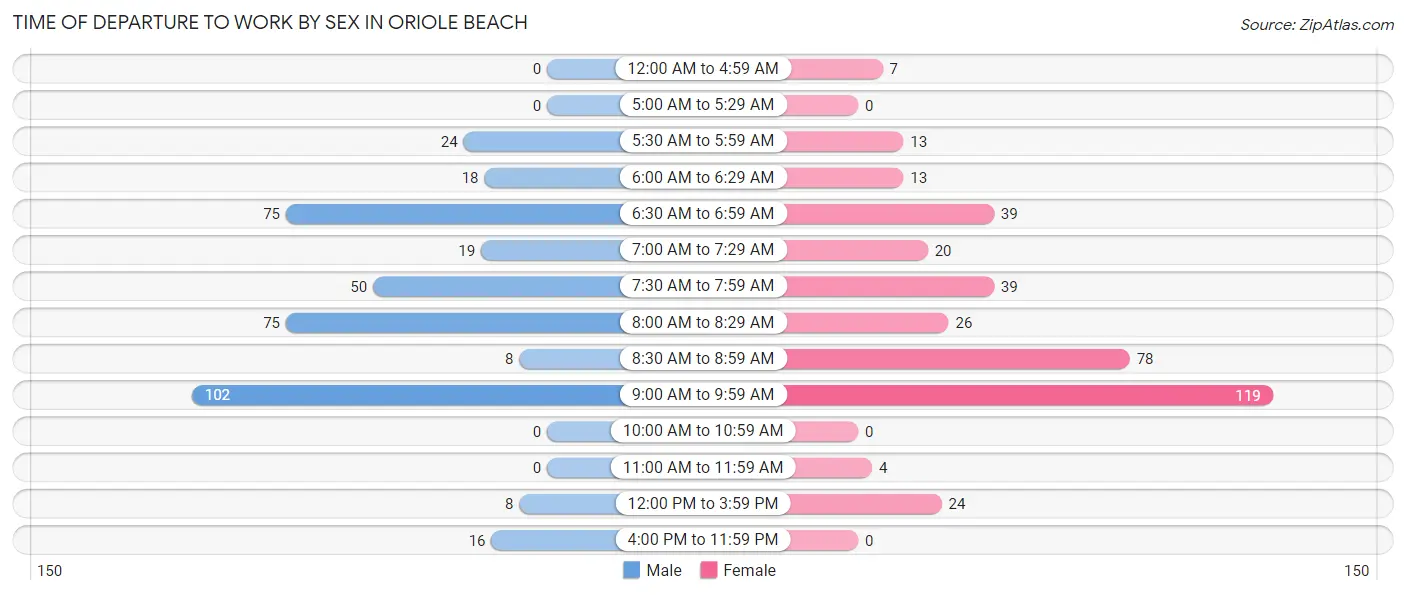
| Time of Departure | Male | Female |
| 12:00 AM to 4:59 AM | 0 (0.0%) | 7 (1.8%) |
| 5:00 AM to 5:29 AM | 0 (0.0%) | 0 (0.0%) |
| 5:30 AM to 5:59 AM | 24 (6.1%) | 13 (3.4%) |
| 6:00 AM to 6:29 AM | 18 (4.6%) | 13 (3.4%) |
| 6:30 AM to 6:59 AM | 75 (19.0%) | 39 (10.2%) |
| 7:00 AM to 7:29 AM | 19 (4.8%) | 20 (5.2%) |
| 7:30 AM to 7:59 AM | 50 (12.7%) | 39 (10.2%) |
| 8:00 AM to 8:29 AM | 75 (19.0%) | 26 (6.8%) |
| 8:30 AM to 8:59 AM | 8 (2.0%) | 78 (20.4%) |
| 9:00 AM to 9:59 AM | 102 (25.8%) | 119 (31.1%) |
| 10:00 AM to 10:59 AM | 0 (0.0%) | 0 (0.0%) |
| 11:00 AM to 11:59 AM | 0 (0.0%) | 4 (1.1%) |
| 12:00 PM to 3:59 PM | 8 (2.0%) | 24 (6.3%) |
| 4:00 PM to 11:59 PM | 16 (4.1%) | 0 (0.0%) |
| Total | 395 (100.0%) | 382 (100.0%) |
Housing Occupancy in Oriole Beach
Occupancy by Ownership in Oriole Beach
Of the total 663 dwellings in Oriole Beach, owner-occupied units account for 492 (74.2%), while renter-occupied units make up 171 (25.8%).
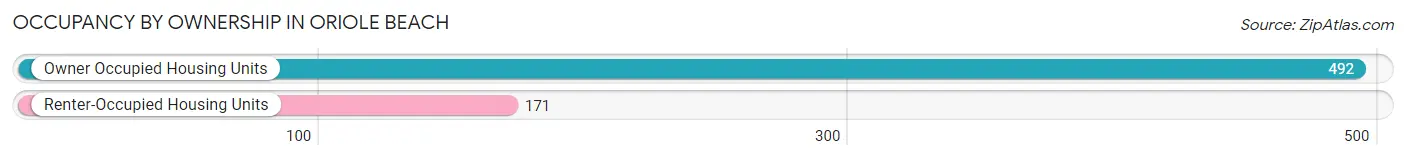
| Occupancy | # Housing Units | % Housing Units |
| Owner Occupied Housing Units | 492 | 74.2% |
| Renter-Occupied Housing Units | 171 | 25.8% |
| Total Occupied Housing Units | 663 | 100.0% |
Occupancy by Household Size in Oriole Beach
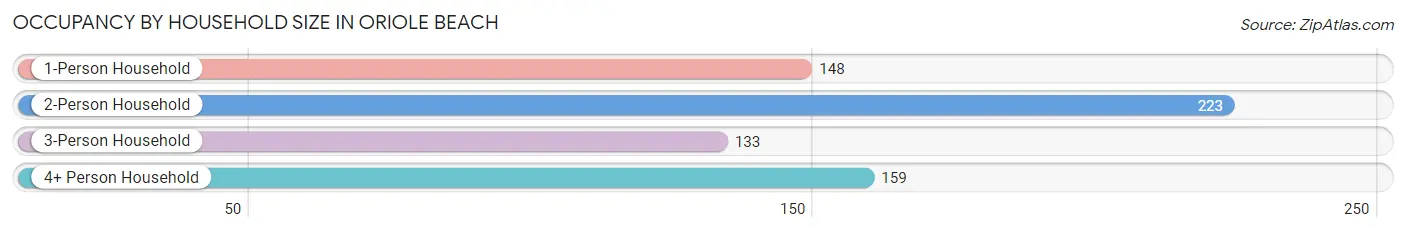
| Household Size | # Housing Units | % Housing Units |
| 1-Person Household | 148 | 22.3% |
| 2-Person Household | 223 | 33.6% |
| 3-Person Household | 133 | 20.1% |
| 4+ Person Household | 159 | 24.0% |
| Total Housing Units | 663 | 100.0% |
Occupancy by Ownership by Household Size in Oriole Beach
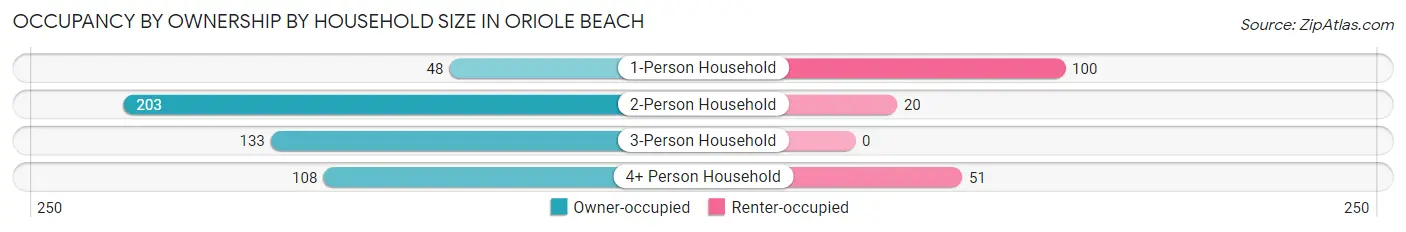
| Household Size | Owner-occupied | Renter-occupied |
| 1-Person Household | 48 (32.4%) | 100 (67.6%) |
| 2-Person Household | 203 (91.0%) | 20 (9.0%) |
| 3-Person Household | 133 (100.0%) | 0 (0.0%) |
| 4+ Person Household | 108 (67.9%) | 51 (32.1%) |
| Total Housing Units | 492 (74.2%) | 171 (25.8%) |
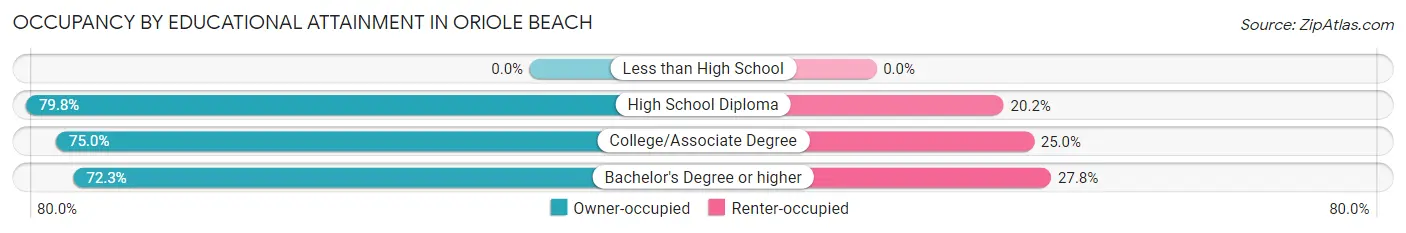
Occupancy by Educational Attainment in Oriole Beach
| Household Size | Owner-occupied | Renter-occupied |
| Less than High School | 0 (0.0%) | 0 (0.0%) |
| High School Diploma | 71 (79.8%) | 18 (20.2%) |
| College/Associate Degree | 171 (75.0%) | 57 (25.0%) |
| Bachelor's Degree or higher | 250 (72.3%) | 96 (27.8%) |
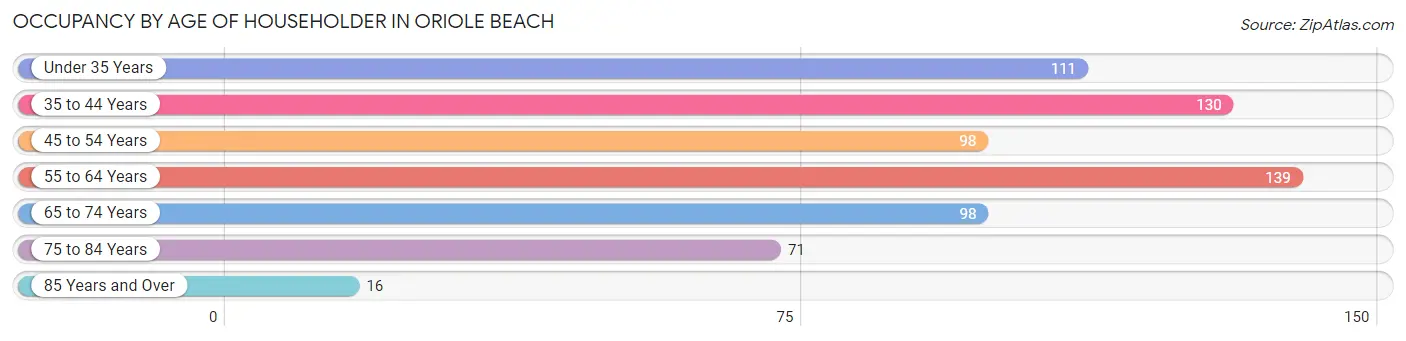
Occupancy by Age of Householder in Oriole Beach
| Age Bracket | # Households | % Households |
| Under 35 Years | 111 | 16.7% |
| 35 to 44 Years | 130 | 19.6% |
| 45 to 54 Years | 98 | 14.8% |
| 55 to 64 Years | 139 | 21.0% |
| 65 to 74 Years | 98 | 14.8% |
| 75 to 84 Years | 71 | 10.7% |
| 85 Years and Over | 16 | 2.4% |
| Total | 663 | 100.0% |
Housing Finances in Oriole Beach
Median Income by Occupancy in Oriole Beach
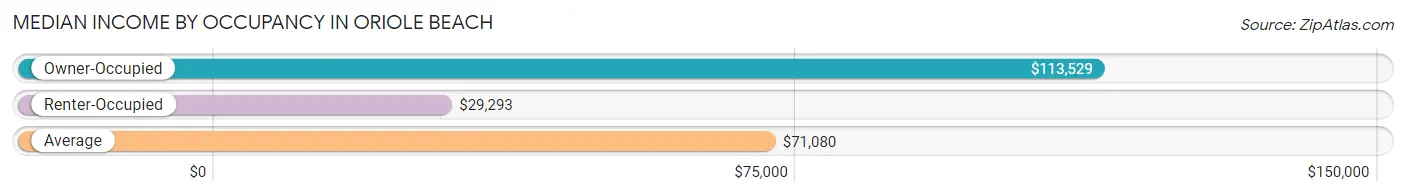
| Occupancy Type | # Households | Median Income |
| Owner-Occupied | 492 (74.2%) | $113,529 |
| Renter-Occupied | 171 (25.8%) | $29,293 |
| Average | 663 (100.0%) | $71,080 |
Occupancy by Householder Income Bracket in Oriole Beach
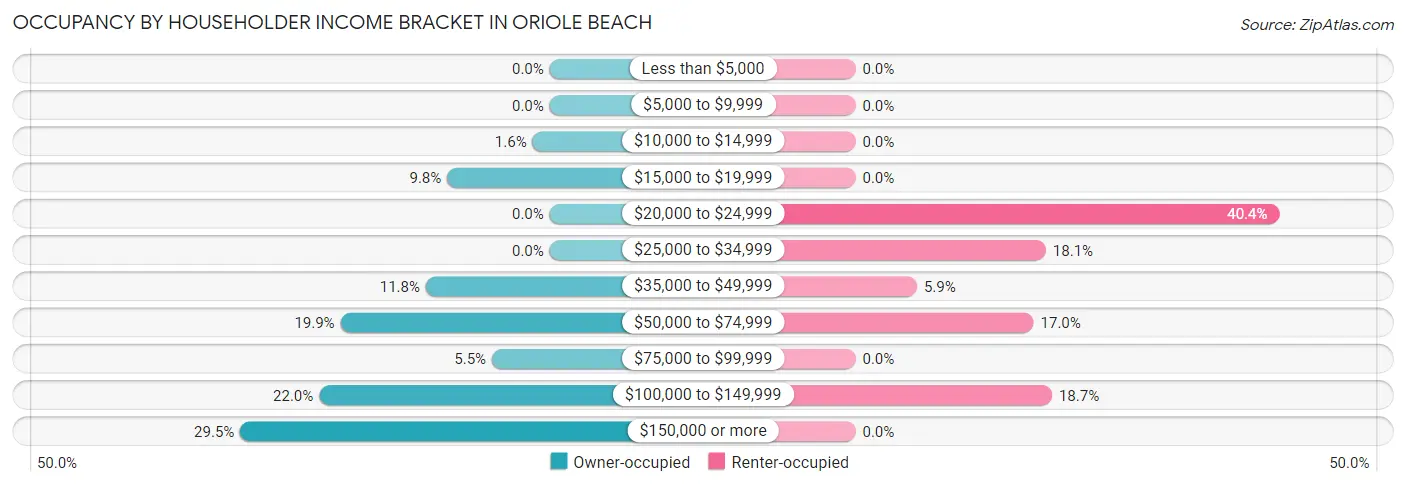
| Income Bracket | Owner-occupied | Renter-occupied |
| Less than $5,000 | 0 (0.0%) | 0 (0.0%) |
| $5,000 to $9,999 | 0 (0.0%) | 0 (0.0%) |
| $10,000 to $14,999 | 8 (1.6%) | 0 (0.0%) |
| $15,000 to $19,999 | 48 (9.8%) | 0 (0.0%) |
| $20,000 to $24,999 | 0 (0.0%) | 69 (40.4%) |
| $25,000 to $34,999 | 0 (0.0%) | 31 (18.1%) |
| $35,000 to $49,999 | 58 (11.8%) | 10 (5.9%) |
| $50,000 to $74,999 | 98 (19.9%) | 29 (17.0%) |
| $75,000 to $99,999 | 27 (5.5%) | 0 (0.0%) |
| $100,000 to $149,999 | 108 (22.0%) | 32 (18.7%) |
| $150,000 or more | 145 (29.5%) | 0 (0.0%) |
| Total | 492 (100.0%) | 171 (100.0%) |
Monthly Housing Cost Tiers in Oriole Beach

| Monthly Cost | Owner-occupied | Renter-occupied |
| Less than $300 | 0 (0.0%) | 0 (0.0%) |
| $300 to $499 | 75 (15.2%) | 0 (0.0%) |
| $500 to $799 | 59 (12.0%) | 0 (0.0%) |
| $800 to $999 | 86 (17.5%) | 0 (0.0%) |
| $1,000 to $1,499 | 41 (8.3%) | 97 (56.7%) |
| $1,500 to $1,999 | 65 (13.2%) | 32 (18.7%) |
| $2,000 to $2,499 | 63 (12.8%) | 19 (11.1%) |
| $2,500 to $2,999 | 64 (13.0%) | 0 (0.0%) |
| $3,000 or more | 39 (7.9%) | 0 (0.0%) |
| Total | 492 (100.0%) | 171 (100.0%) |
Physical Housing Characteristics in Oriole Beach
Housing Structures in Oriole Beach
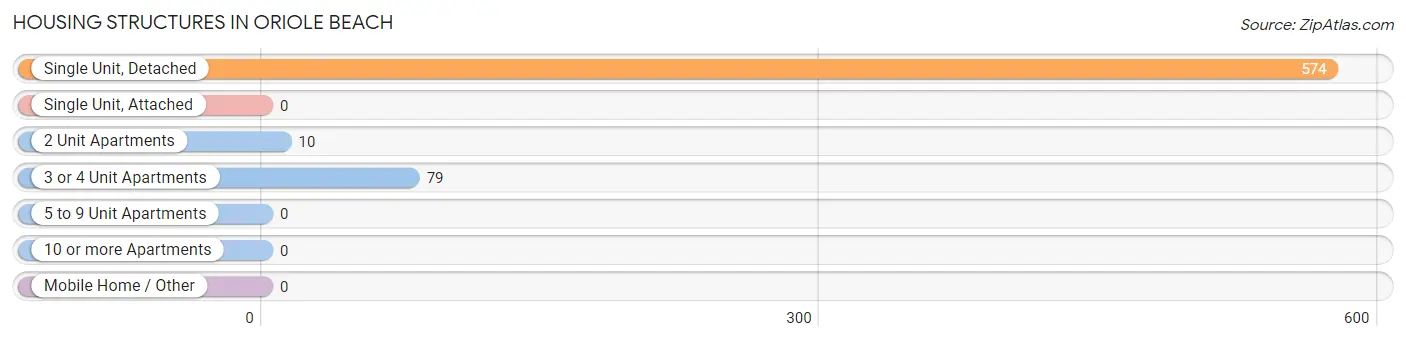
| Structure Type | # Housing Units | % Housing Units |
| Single Unit, Detached | 574 | 86.6% |
| Single Unit, Attached | 0 | 0.0% |
| 2 Unit Apartments | 10 | 1.5% |
| 3 or 4 Unit Apartments | 79 | 11.9% |
| 5 to 9 Unit Apartments | 0 | 0.0% |
| 10 or more Apartments | 0 | 0.0% |
| Mobile Home / Other | 0 | 0.0% |
| Total | 663 | 100.0% |
Housing Structures by Occupancy in Oriole Beach
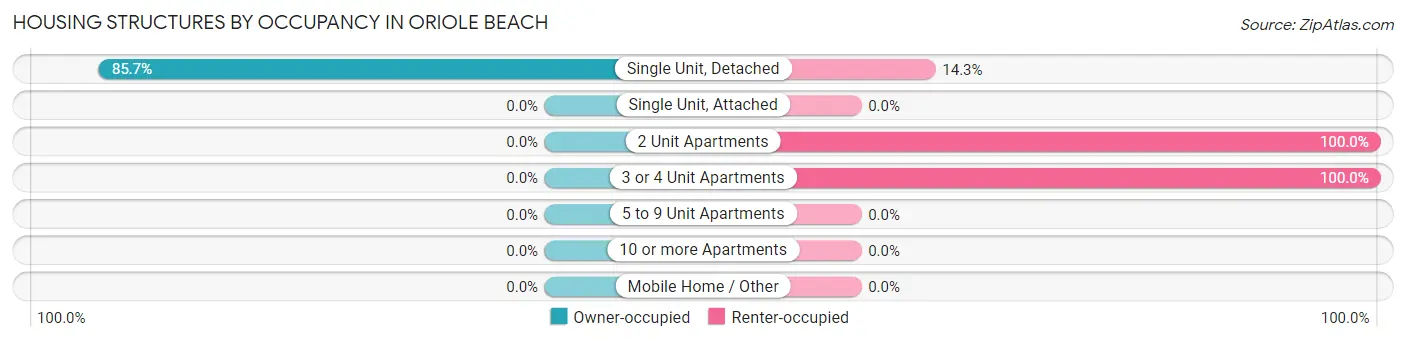
| Structure Type | Owner-occupied | Renter-occupied |
| Single Unit, Detached | 492 (85.7%) | 82 (14.3%) |
| Single Unit, Attached | 0 (0.0%) | 0 (0.0%) |
| 2 Unit Apartments | 0 (0.0%) | 10 (100.0%) |
| 3 or 4 Unit Apartments | 0 (0.0%) | 79 (100.0%) |
| 5 to 9 Unit Apartments | 0 (0.0%) | 0 (0.0%) |
| 10 or more Apartments | 0 (0.0%) | 0 (0.0%) |
| Mobile Home / Other | 0 (0.0%) | 0 (0.0%) |
| Total | 492 (74.2%) | 171 (25.8%) |
Housing Structures by Number of Rooms in Oriole Beach
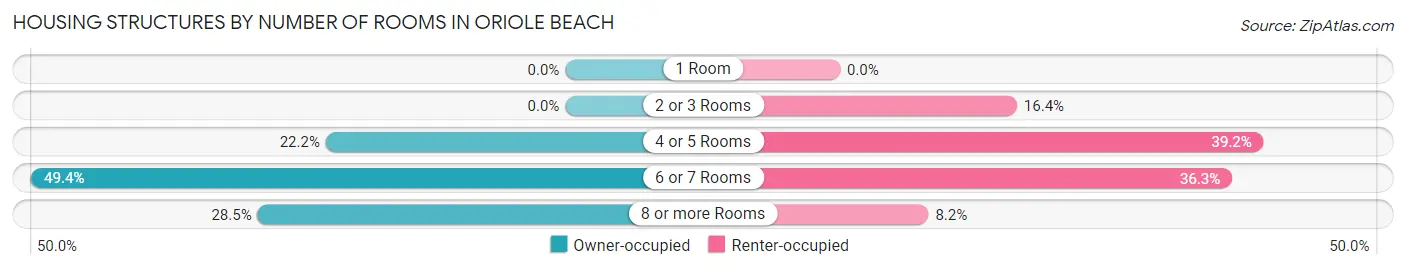
| Number of Rooms | Owner-occupied | Renter-occupied |
| 1 Room | 0 (0.0%) | 0 (0.0%) |
| 2 or 3 Rooms | 0 (0.0%) | 28 (16.4%) |
| 4 or 5 Rooms | 109 (22.2%) | 67 (39.2%) |
| 6 or 7 Rooms | 243 (49.4%) | 62 (36.3%) |
| 8 or more Rooms | 140 (28.5%) | 14 (8.2%) |
| Total | 492 (100.0%) | 171 (100.0%) |
Housing Structure by Heating Type in Oriole Beach

| Heating Type | Owner-occupied | Renter-occupied |
| Utility Gas | 77 (15.7%) | 26 (15.2%) |
| Bottled, Tank, or LP Gas | 0 (0.0%) | 0 (0.0%) |
| Electricity | 415 (84.4%) | 145 (84.8%) |
| Fuel Oil or Kerosene | 0 (0.0%) | 0 (0.0%) |
| Coal or Coke | 0 (0.0%) | 0 (0.0%) |
| All other Fuels | 0 (0.0%) | 0 (0.0%) |
| No Fuel Used | 0 (0.0%) | 0 (0.0%) |
| Total | 492 (100.0%) | 171 (100.0%) |
Household Vehicle Usage in Oriole Beach

| Vehicles per Household | Owner-occupied | Renter-occupied |
| No Vehicle | 0 (0.0%) | 0 (0.0%) |
| 1 Vehicle | 81 (16.5%) | 113 (66.1%) |
| 2 Vehicles | 273 (55.5%) | 46 (26.9%) |
| 3 or more Vehicles | 138 (28.1%) | 12 (7.0%) |
| Total | 492 (100.0%) | 171 (100.0%) |
Real Estate & Mortgages in Oriole Beach
Real Estate and Mortgage Overview in Oriole Beach
| Characteristic | Without Mortgage | With Mortgage |
| Housing Units | 218 | 274 |
| Median Property Value | $298,300 | $363,500 |
| Median Household Income | $47,284 | $134 |
| Monthly Housing Costs | $558 | $39 |
| Real Estate Taxes | $1,430 | $13 |
Property Value by Mortgage Status in Oriole Beach
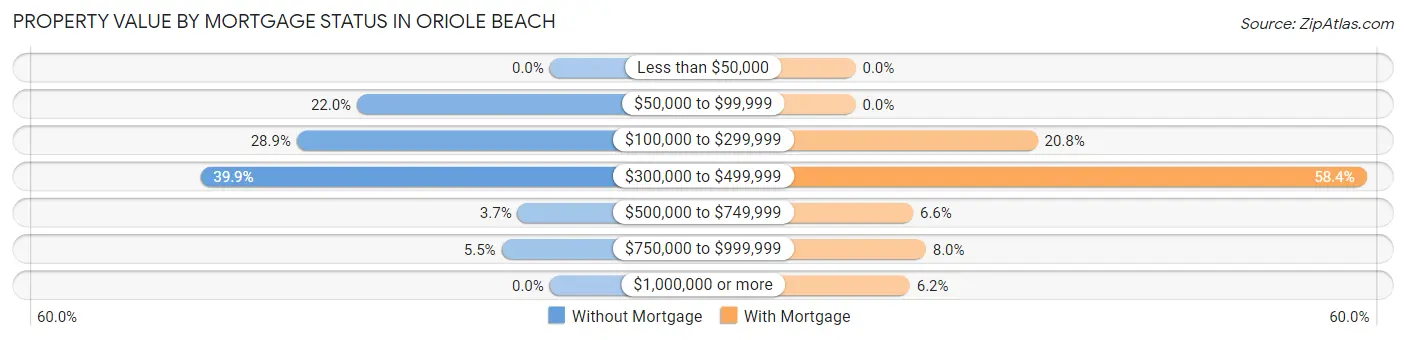
| Property Value | Without Mortgage | With Mortgage |
| Less than $50,000 | 0 (0.0%) | 0 (0.0%) |
| $50,000 to $99,999 | 48 (22.0%) | 0 (0.0%) |
| $100,000 to $299,999 | 63 (28.9%) | 57 (20.8%) |
| $300,000 to $499,999 | 87 (39.9%) | 160 (58.4%) |
| $500,000 to $749,999 | 8 (3.7%) | 18 (6.6%) |
| $750,000 to $999,999 | 12 (5.5%) | 22 (8.0%) |
| $1,000,000 or more | 0 (0.0%) | 17 (6.2%) |
| Total | 218 (100.0%) | 274 (100.0%) |
Household Income by Mortgage Status in Oriole Beach
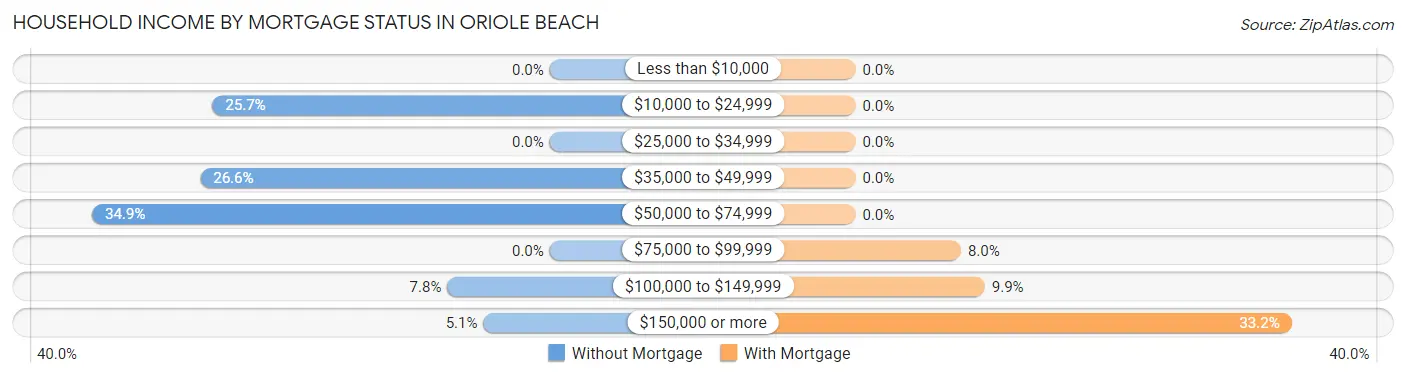
| Household Income | Without Mortgage | With Mortgage |
| Less than $10,000 | 0 (0.0%) | 0 (0.0%) |
| $10,000 to $24,999 | 56 (25.7%) | 0 (0.0%) |
| $25,000 to $34,999 | 0 (0.0%) | 0 (0.0%) |
| $35,000 to $49,999 | 58 (26.6%) | 0 (0.0%) |
| $50,000 to $74,999 | 76 (34.9%) | 0 (0.0%) |
| $75,000 to $99,999 | 0 (0.0%) | 22 (8.0%) |
| $100,000 to $149,999 | 17 (7.8%) | 27 (9.9%) |
| $150,000 or more | 11 (5.1%) | 91 (33.2%) |
| Total | 218 (100.0%) | 274 (100.0%) |
Property Value to Household Income Ratio in Oriole Beach
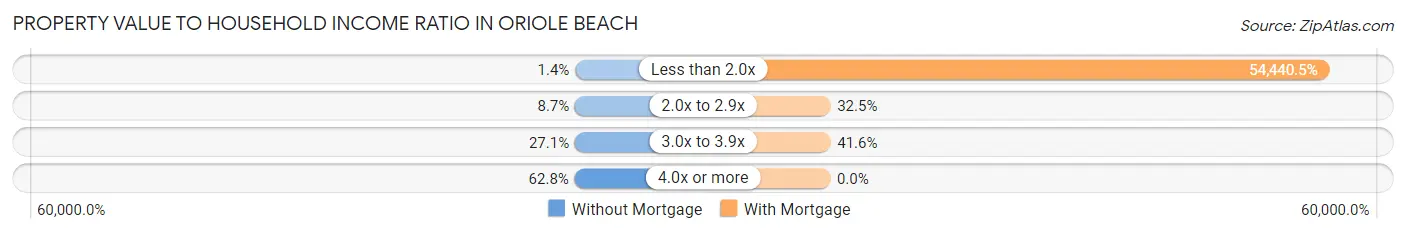
| Value-to-Income Ratio | Without Mortgage | With Mortgage |
| Less than 2.0x | 3 (1.4%) | 149,167 (54,440.5%) |
| 2.0x to 2.9x | 19 (8.7%) | 89 (32.5%) |
| 3.0x to 3.9x | 59 (27.1%) | 114 (41.6%) |
| 4.0x or more | 137 (62.8%) | 0 (0.0%) |
| Total | 218 (100.0%) | 274 (100.0%) |
Real Estate Taxes by Mortgage Status in Oriole Beach

| Property Taxes | Without Mortgage | With Mortgage |
| Less than $800 | 48 (22.0%) | 0 (0.0%) |
| $800 to $1,499 | 71 (32.6%) | 0 (0.0%) |
| $800 to $1,499 | 99 (45.4%) | 17 (6.2%) |
| Total | 218 (100.0%) | 274 (100.0%) |
Health & Disability in Oriole Beach
Health Insurance Coverage by Age in Oriole Beach
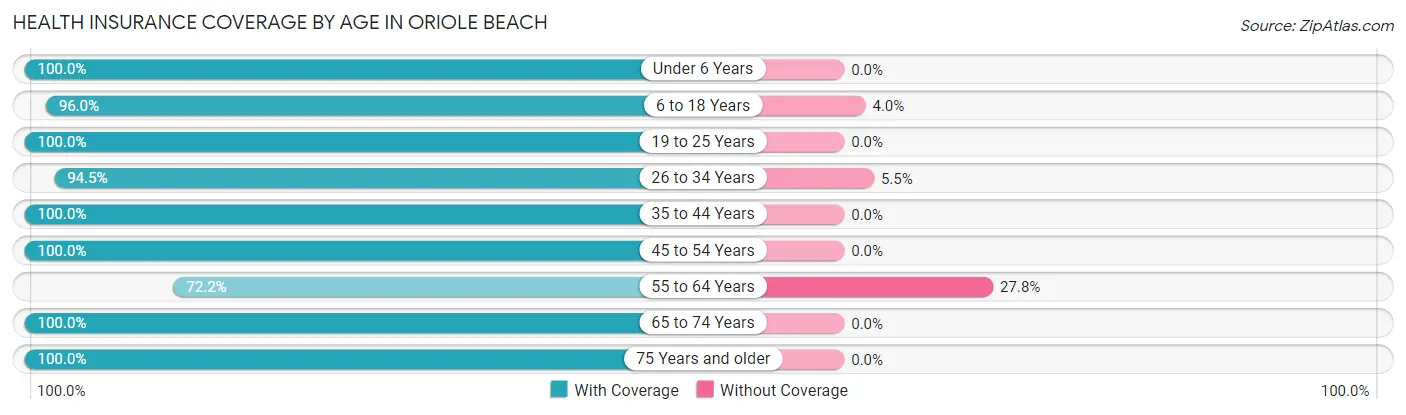
| Age Bracket | With Coverage | Without Coverage |
| Under 6 Years | 153 (100.0%) | 0 (0.0%) |
| 6 to 18 Years | 291 (96.0%) | 12 (4.0%) |
| 19 to 25 Years | 41 (100.0%) | 0 (0.0%) |
| 26 to 34 Years | 222 (94.5%) | 13 (5.5%) |
| 35 to 44 Years | 291 (100.0%) | 0 (0.0%) |
| 45 to 54 Years | 132 (100.0%) | 0 (0.0%) |
| 55 to 64 Years | 203 (72.2%) | 78 (27.8%) |
| 65 to 74 Years | 149 (100.0%) | 0 (0.0%) |
| 75 Years and older | 146 (100.0%) | 0 (0.0%) |
| Total | 1,628 (94.1%) | 103 (5.9%) |
Health Insurance Coverage by Citizenship Status in Oriole Beach
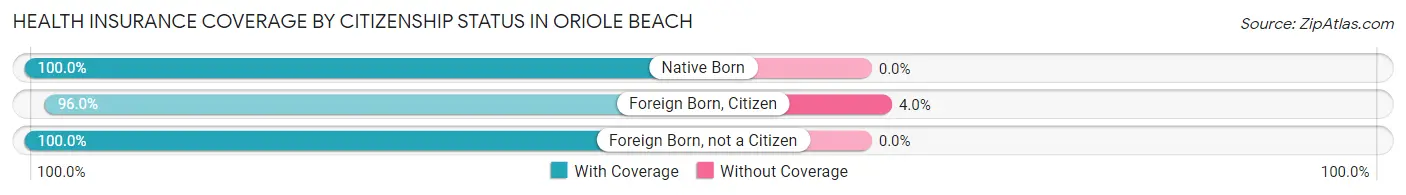
| Citizenship Status | With Coverage | Without Coverage |
| Native Born | 153 (100.0%) | 0 (0.0%) |
| Foreign Born, Citizen | 291 (96.0%) | 12 (4.0%) |
| Foreign Born, not a Citizen | 41 (100.0%) | 0 (0.0%) |
Health Insurance Coverage by Household Income in Oriole Beach
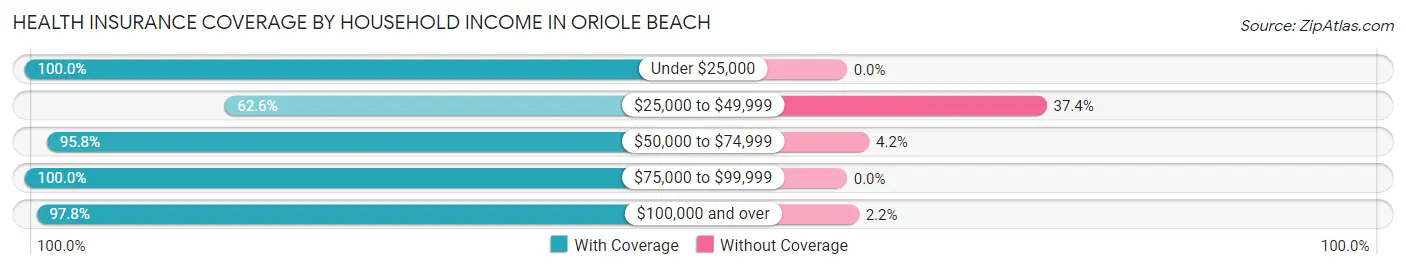
| Household Income | With Coverage | Without Coverage |
| Under $25,000 | 134 (100.0%) | 0 (0.0%) |
| $25,000 to $49,999 | 112 (62.6%) | 67 (37.4%) |
| $50,000 to $74,999 | 298 (95.8%) | 13 (4.2%) |
| $75,000 to $99,999 | 75 (100.0%) | 0 (0.0%) |
| $100,000 and over | 1,009 (97.8%) | 23 (2.2%) |
Public vs Private Health Insurance Coverage by Age in Oriole Beach
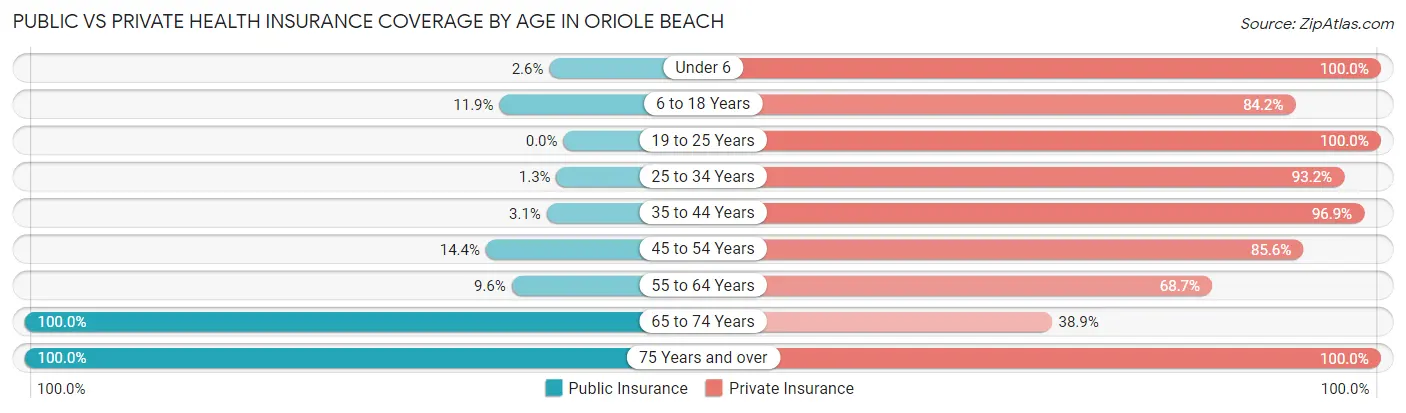
| Age Bracket | Public Insurance | Private Insurance |
| Under 6 | 4 (2.6%) | 153 (100.0%) |
| 6 to 18 Years | 36 (11.9%) | 255 (84.2%) |
| 19 to 25 Years | 0 (0.0%) | 41 (100.0%) |
| 25 to 34 Years | 3 (1.3%) | 219 (93.2%) |
| 35 to 44 Years | 9 (3.1%) | 282 (96.9%) |
| 45 to 54 Years | 19 (14.4%) | 113 (85.6%) |
| 55 to 64 Years | 27 (9.6%) | 193 (68.7%) |
| 65 to 74 Years | 149 (100.0%) | 58 (38.9%) |
| 75 Years and over | 146 (100.0%) | 146 (100.0%) |
| Total | 393 (22.7%) | 1,460 (84.3%) |
Disability Status by Sex by Age in Oriole Beach
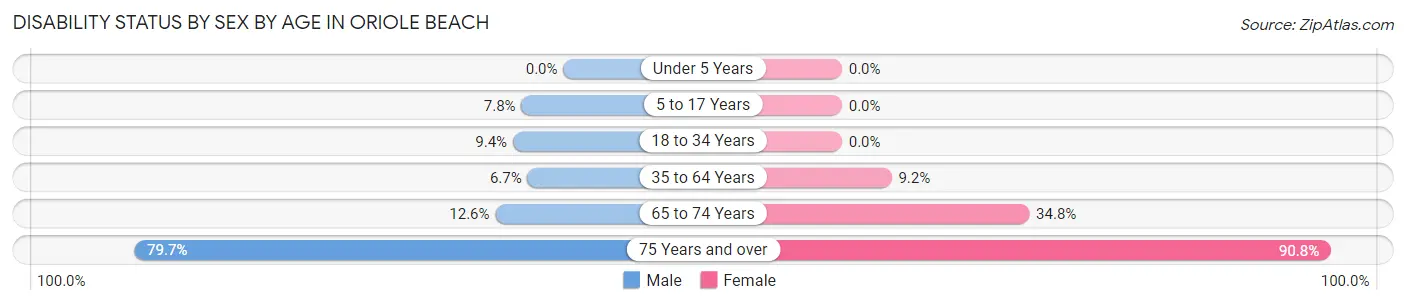
| Age Bracket | Male | Female |
| Under 5 Years | 0 (0.0%) | 0 (0.0%) |
| 5 to 17 Years | 7 (7.8%) | 0 (0.0%) |
| 18 to 34 Years | 19 (9.4%) | 0 (0.0%) |
| 35 to 64 Years | 23 (6.7%) | 33 (9.2%) |
| 65 to 74 Years | 13 (12.6%) | 16 (34.8%) |
| 75 Years and over | 47 (79.7%) | 79 (90.8%) |
Disability Class by Sex by Age in Oriole Beach
Disability Class: Hearing Difficulty
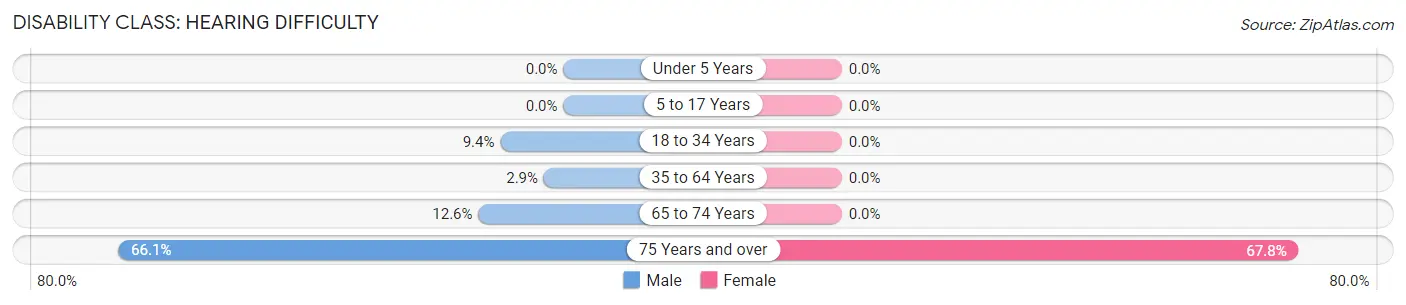
| Age Bracket | Male | Female |
| Under 5 Years | 0 (0.0%) | 0 (0.0%) |
| 5 to 17 Years | 0 (0.0%) | 0 (0.0%) |
| 18 to 34 Years | 19 (9.4%) | 0 (0.0%) |
| 35 to 64 Years | 10 (2.9%) | 0 (0.0%) |
| 65 to 74 Years | 13 (12.6%) | 0 (0.0%) |
| 75 Years and over | 39 (66.1%) | 59 (67.8%) |
Disability Class: Vision Difficulty
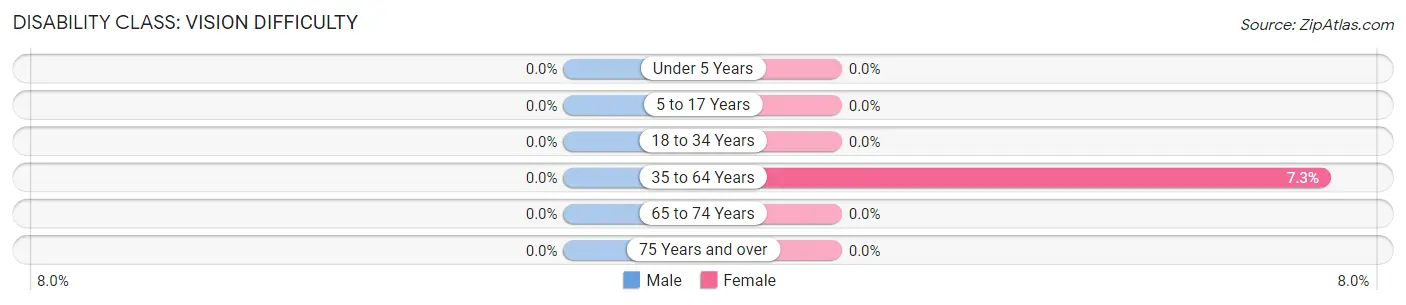
| Age Bracket | Male | Female |
| Under 5 Years | 0 (0.0%) | 0 (0.0%) |
| 5 to 17 Years | 0 (0.0%) | 0 (0.0%) |
| 18 to 34 Years | 0 (0.0%) | 0 (0.0%) |
| 35 to 64 Years | 0 (0.0%) | 26 (7.3%) |
| 65 to 74 Years | 0 (0.0%) | 0 (0.0%) |
| 75 Years and over | 0 (0.0%) | 0 (0.0%) |
Disability Class: Cognitive Difficulty
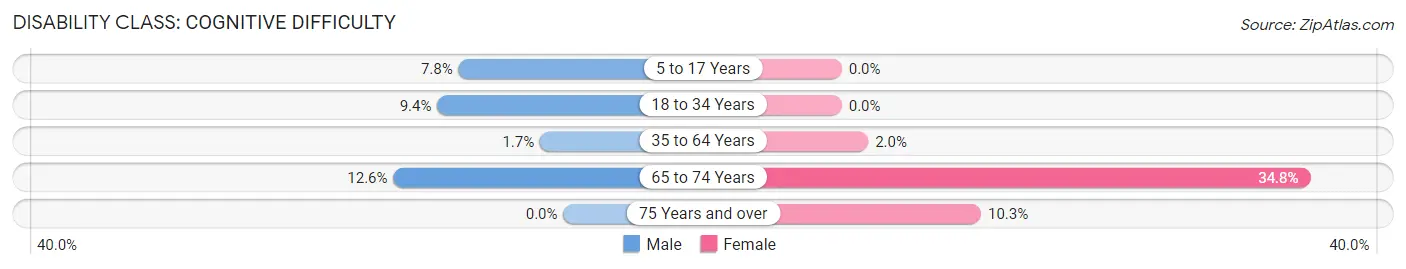
| Age Bracket | Male | Female |
| 5 to 17 Years | 7 (7.8%) | 0 (0.0%) |
| 18 to 34 Years | 19 (9.4%) | 0 (0.0%) |
| 35 to 64 Years | 6 (1.7%) | 7 (2.0%) |
| 65 to 74 Years | 13 (12.6%) | 16 (34.8%) |
| 75 Years and over | 0 (0.0%) | 9 (10.3%) |
Disability Class: Ambulatory Difficulty
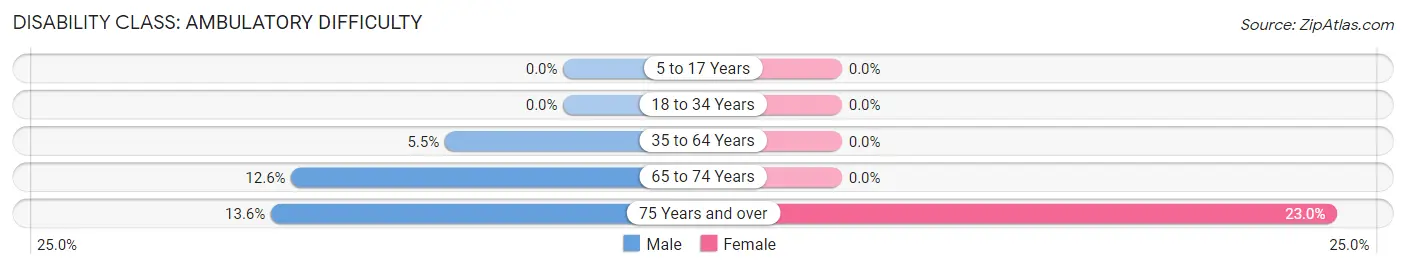
| Age Bracket | Male | Female |
| 5 to 17 Years | 0 (0.0%) | 0 (0.0%) |
| 18 to 34 Years | 0 (0.0%) | 0 (0.0%) |
| 35 to 64 Years | 19 (5.5%) | 0 (0.0%) |
| 65 to 74 Years | 13 (12.6%) | 0 (0.0%) |
| 75 Years and over | 8 (13.6%) | 20 (23.0%) |
Disability Class: Self-Care Difficulty
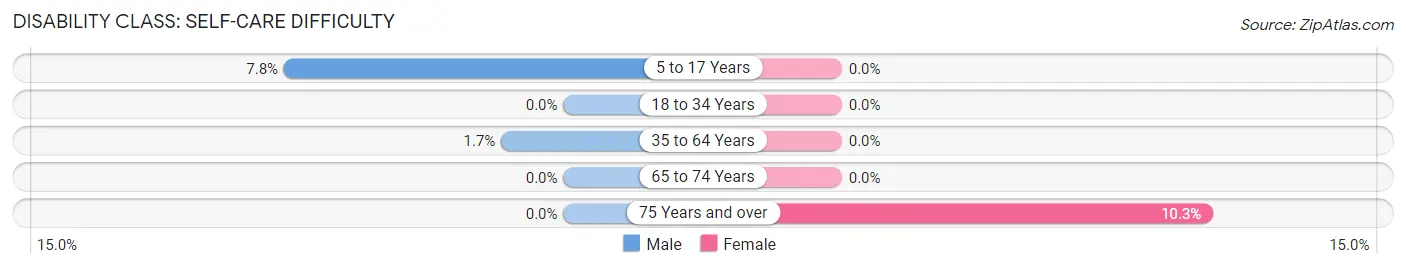
| Age Bracket | Male | Female |
| 5 to 17 Years | 7 (7.8%) | 0 (0.0%) |
| 18 to 34 Years | 0 (0.0%) | 0 (0.0%) |
| 35 to 64 Years | 6 (1.7%) | 0 (0.0%) |
| 65 to 74 Years | 0 (0.0%) | 0 (0.0%) |
| 75 Years and over | 0 (0.0%) | 9 (10.3%) |
Technology Access in Oriole Beach
Computing Device Access in Oriole Beach
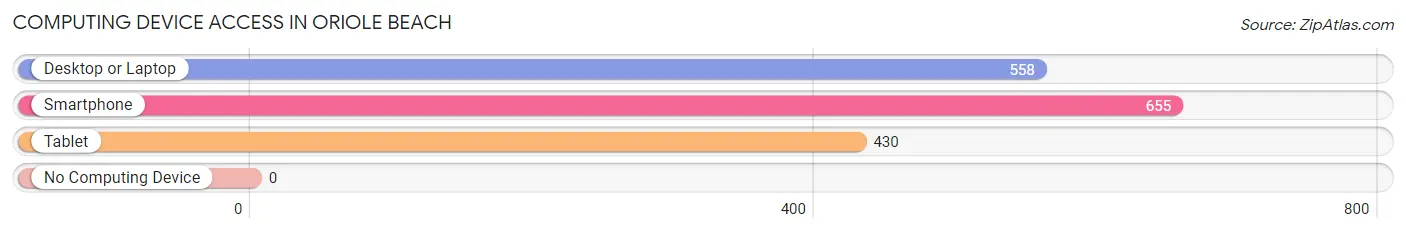
| Device Type | # Households | % Households |
| Desktop or Laptop | 558 | 84.2% |
| Smartphone | 655 | 98.8% |
| Tablet | 430 | 64.9% |
| No Computing Device | 0 | 0.0% |
| Total | 663 | 100.0% |
Internet Access in Oriole Beach
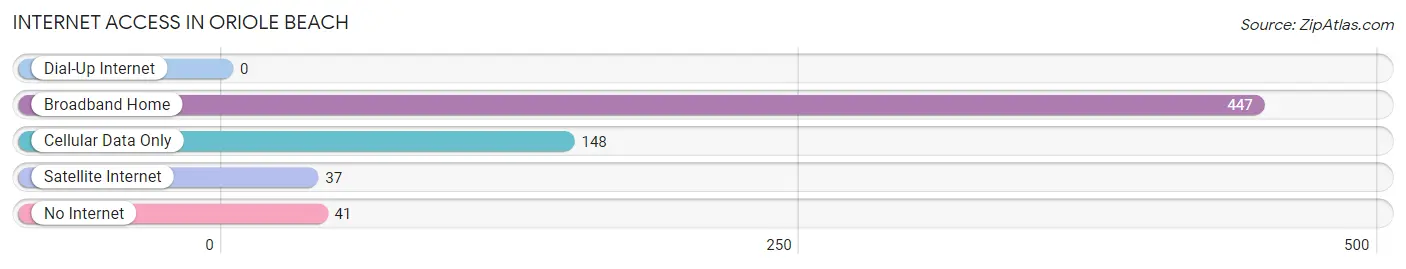
| Internet Type | # Households | % Households |
| Dial-Up Internet | 0 | 0.0% |
| Broadband Home | 447 | 67.4% |
| Cellular Data Only | 148 | 22.3% |
| Satellite Internet | 37 | 5.6% |
| No Internet | 41 | 6.2% |
| Total | 663 | 100.0% |
Oriole Beach Summary
Oriole Beach is a small unincorporated community located in Santa Rosa County, Florida. It is situated on the northern shore of Santa Rosa Sound, just east of Navarre Beach and west of Pensacola Beach. The community is part of the Pensacola–Ferry Pass–Brent Metropolitan Statistical Area.
History
Oriole Beach was originally inhabited by Native Americans, who used the area for fishing and hunting. The first European settlers arrived in the area in the early 19th century, and the community was officially established in 1845. The community was named after the oriole, a type of bird that is native to the area.
In the late 19th century, the area was used for timber harvesting and farming. The timber industry was particularly important to the local economy, and the community was home to several sawmills.
In the early 20th century, the area began to develop as a tourist destination. The first hotel was built in the area in the 1920s, and the community was incorporated in 1927. The area was popular with tourists from the nearby cities of Pensacola and Mobile, Alabama.
Geography
Oriole Beach is located in Santa Rosa County, Florida. It is situated on the northern shore of Santa Rosa Sound, just east of Navarre Beach and west of Pensacola Beach. The community is part of the Pensacola–Ferry Pass–Brent Metropolitan Statistical Area.
The community is located at an elevation of 10 feet (3 m) above sea level. The climate is humid subtropical, with hot, humid summers and mild winters. The average annual temperature is 72 °F (22 °C).
Economy
The economy of Oriole Beach is largely based on tourism. The area is popular with visitors from the nearby cities of Pensacola and Mobile, Alabama. The community is home to several hotels, restaurants, and other tourist attractions.
The timber industry is also important to the local economy. The area is home to several sawmills, and timber harvesting is still an important part of the local economy.
Demographics
As of the 2010 census, the population of Oriole Beach was 1,845. The racial makeup of the community was 97.3% White, 0.7% African American, 0.3% Native American, 0.3% Asian, 0.2% from other races, and 1.2% from two or more races. Hispanic or Latino of any race were 1.2% of the population.
The median household income in Oriole Beach was $45,938, and the median family income was $50,938. The per capita income was $21,938. About 8.3% of families and 10.3% of the population were below the poverty line, including 14.3% of those under age 18 and 5.3% of those age 65 or over.
Common Questions
What is the Total Population of Oriole Beach?
Total Population of Oriole Beach is 1,731.
What is the Total Male Population of Oriole Beach?
Total Male Population of Oriole Beach is 903.
What is the Total Female Population of Oriole Beach?
Total Female Population of Oriole Beach is 828.
What is the Ratio of Males per 100 Females in Oriole Beach?
There are 109.06 Males per 100 Females in Oriole Beach.
What is the Ratio of Females per 100 Males in Oriole Beach?
There are 91.69 Females per 100 Males in Oriole Beach.
What is the Median Population Age in Oriole Beach?
Median Population Age in Oriole Beach is 39.3 Years.
What is the Average Family Size in Oriole Beach
Average Family Size in Oriole Beach is 3.1 People.
What is the Average Household Size in Oriole Beach
Average Household Size in Oriole Beach is 2.6 People.
What is Per Capita Income in Oriole Beach?
Per Capita income in Oriole Beach is $37,756.
What is the Median Family Income in Oriole Beach?
Median Family Income in Oriole Beach is $113,750.
What is the Median Household income in Oriole Beach?
Median Household Income in Oriole Beach is $71,080.
What is Inequality or Gini Index in Oriole Beach?
Inequality or Gini Index in Oriole Beach is 0.42.
How Large is the Labor Force in Oriole Beach?
There are 945 People in the Labor Forcein in Oriole Beach.
What is the Percentage of People in the Labor Force in Oriole Beach?
68.8% of People are in the Labor Force in Oriole Beach.
What is the Unemployment Rate in Oriole Beach?
Unemployment Rate in Oriole Beach is 2.1%.