Key Colony Beach, FL
Key Colony Beach Map
Key Colony Beach Overview
650
TOTAL POPULATION
290
MALE POPULATION
360
FEMALE POPULATION
80.56
MALES / 100 FEMALES
124.14
FEMALES / 100 MALES
66.7
MEDIAN AGE
2.2
AVG FAMILY SIZE
1.8
AVG HOUSEHOLD SIZE
$67,750
PER CAPITA INCOME
$120,000
AVG FAMILY INCOME
$103,096
AVG HOUSEHOLD INCOME
0.40
INEQUALITY / GINI INDEX
266
LABOR FORCE [ PEOPLE ]
41.5%
PERCENT IN LABOR FORCE
Key Colony Beach Zip Codes
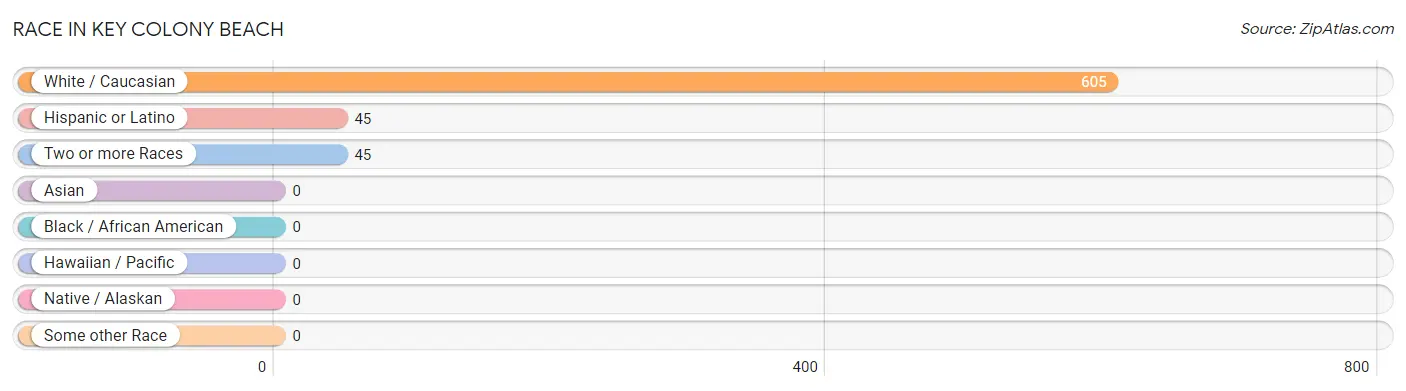
Race in Key Colony Beach
The most populous races in Key Colony Beach are White / Caucasian (605 | 93.1%), Hispanic or Latino (45 | 6.9%), and Two or more Races (45 | 6.9%).
| Race | # Population | % Population |
| Asian | 0 | 0.0% |
| Black / African American | 0 | 0.0% |
| Hawaiian / Pacific | 0 | 0.0% |
| Hispanic or Latino | 45 | 6.9% |
| Native / Alaskan | 0 | 0.0% |
| White / Caucasian | 605 | 93.1% |
| Two or more Races | 45 | 6.9% |
| Some other Race | 0 | 0.0% |
| Total | 650 | 100.0% |
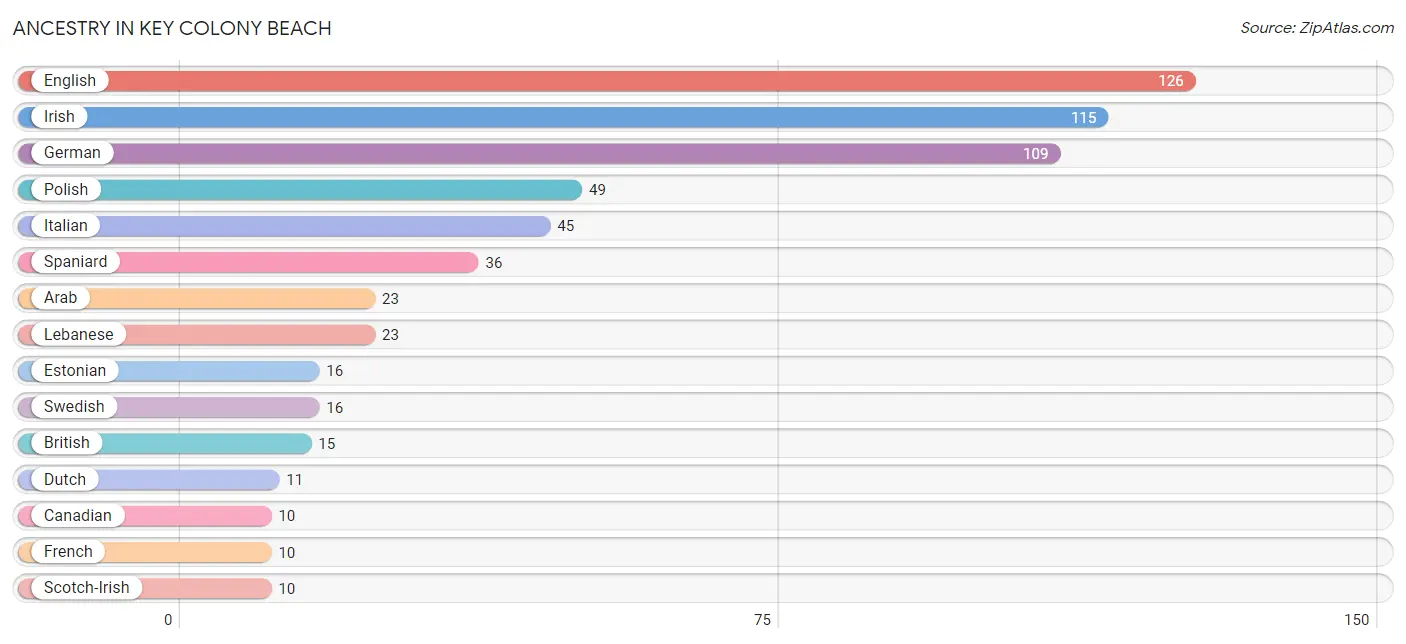
Ancestry in Key Colony Beach
The most populous ancestries reported in Key Colony Beach are English (126 | 19.4%), Irish (115 | 17.7%), German (109 | 16.8%), Polish (49 | 7.5%), and Italian (45 | 6.9%), together accounting for 68.3% of all Key Colony Beach residents.
| Ancestry | # Population | % Population |
| Arab | 23 | 3.5% |
| Armenian | 6 | 0.9% |
| Belgian | 8 | 1.2% |
| British | 15 | 2.3% |
| Canadian | 10 | 1.5% |
| Cuban | 9 | 1.4% |
| Dutch | 11 | 1.7% |
| English | 126 | 19.4% |
| Estonian | 16 | 2.5% |
| European | 9 | 1.4% |
| French | 10 | 1.5% |
| French Canadian | 7 | 1.1% |
| German | 109 | 16.8% |
| Irish | 115 | 17.7% |
| Italian | 45 | 6.9% |
| Lebanese | 23 | 3.5% |
| Polish | 49 | 7.5% |
| Scotch-Irish | 10 | 1.5% |
| Scottish | 9 | 1.4% |
| Spaniard | 36 | 5.5% |
| Swedish | 16 | 2.5% | View All 21 Rows |
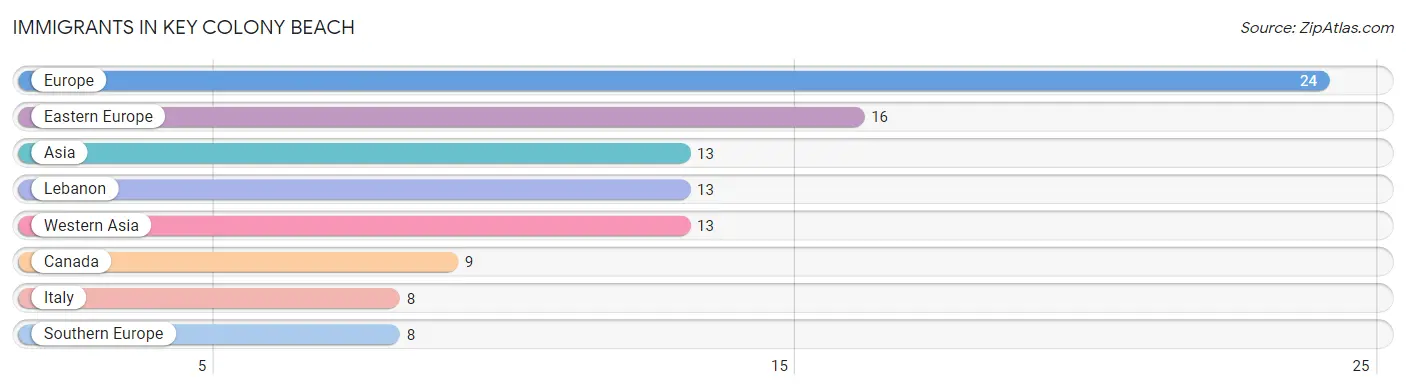
Immigrants in Key Colony Beach
The most numerous immigrant groups reported in Key Colony Beach came from Europe (24 | 3.7%), Eastern Europe (16 | 2.5%), Asia (13 | 2.0%), Lebanon (13 | 2.0%), and Western Asia (13 | 2.0%), together accounting for 12.2% of all Key Colony Beach residents.
| Immigration Origin | # Population | % Population |
| Asia | 13 | 2.0% |
| Canada | 9 | 1.4% |
| Eastern Europe | 16 | 2.5% |
| Europe | 24 | 3.7% |
| Italy | 8 | 1.2% |
| Lebanon | 13 | 2.0% |
| Southern Europe | 8 | 1.2% |
| Western Asia | 13 | 2.0% | View All 8 Rows |
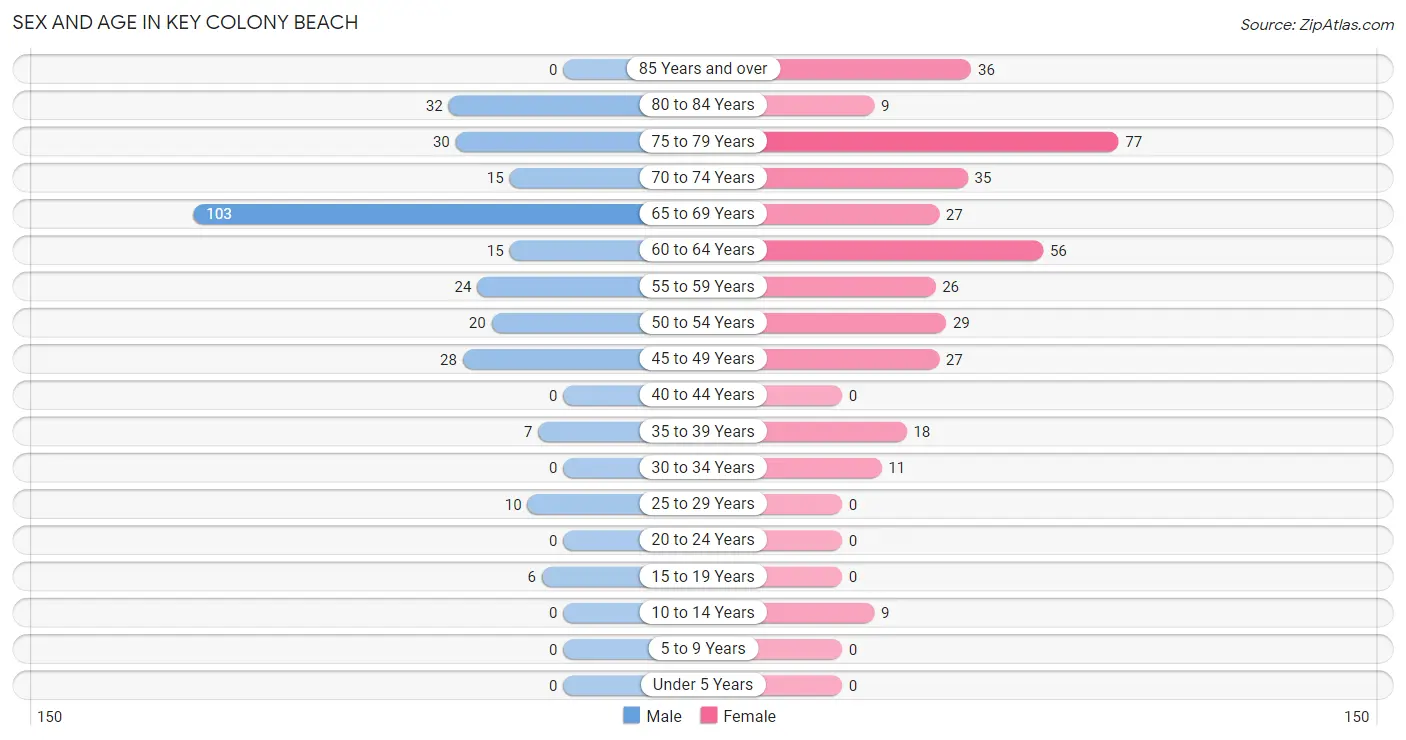
Sex and Age in Key Colony Beach
Sex and Age in Key Colony Beach
The most populous age groups in Key Colony Beach are 65 to 69 Years (103 | 35.5%) for men and 75 to 79 Years (77 | 21.4%) for women.
| Age Bracket | Male | Female |
| Under 5 Years | 0 (0.0%) | 0 (0.0%) |
| 5 to 9 Years | 0 (0.0%) | 0 (0.0%) |
| 10 to 14 Years | 0 (0.0%) | 9 (2.5%) |
| 15 to 19 Years | 6 (2.1%) | 0 (0.0%) |
| 20 to 24 Years | 0 (0.0%) | 0 (0.0%) |
| 25 to 29 Years | 10 (3.5%) | 0 (0.0%) |
| 30 to 34 Years | 0 (0.0%) | 11 (3.1%) |
| 35 to 39 Years | 7 (2.4%) | 18 (5.0%) |
| 40 to 44 Years | 0 (0.0%) | 0 (0.0%) |
| 45 to 49 Years | 28 (9.7%) | 27 (7.5%) |
| 50 to 54 Years | 20 (6.9%) | 29 (8.1%) |
| 55 to 59 Years | 24 (8.3%) | 26 (7.2%) |
| 60 to 64 Years | 15 (5.2%) | 56 (15.6%) |
| 65 to 69 Years | 103 (35.5%) | 27 (7.5%) |
| 70 to 74 Years | 15 (5.2%) | 35 (9.7%) |
| 75 to 79 Years | 30 (10.3%) | 77 (21.4%) |
| 80 to 84 Years | 32 (11.0%) | 9 (2.5%) |
| 85 Years and over | 0 (0.0%) | 36 (10.0%) |
| Total | 290 (100.0%) | 360 (100.0%) |
Families and Households in Key Colony Beach
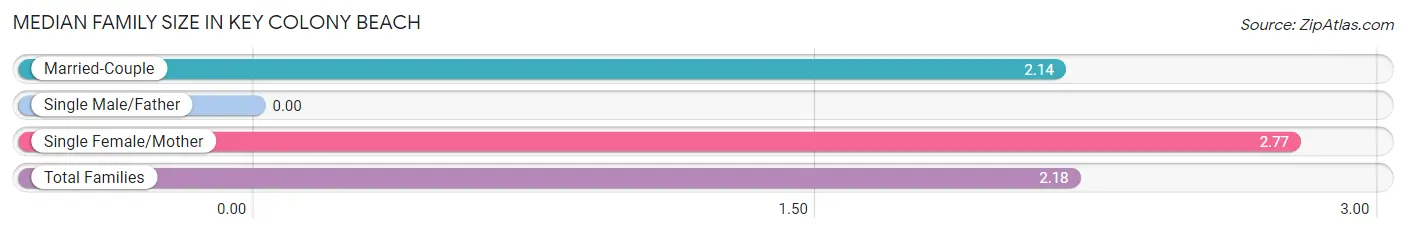
Median Family Size in Key Colony Beach
| Family Type | # Families | Family Size |
| Married-Couple | 207 (94.1%) | 2.14 |
| Single Male/Father | 0 (0.0%) | - |
| Single Female/Mother | 13 (5.9%) | 2.77 |
| Total Families | 220 (100.0%) | 2.18 |
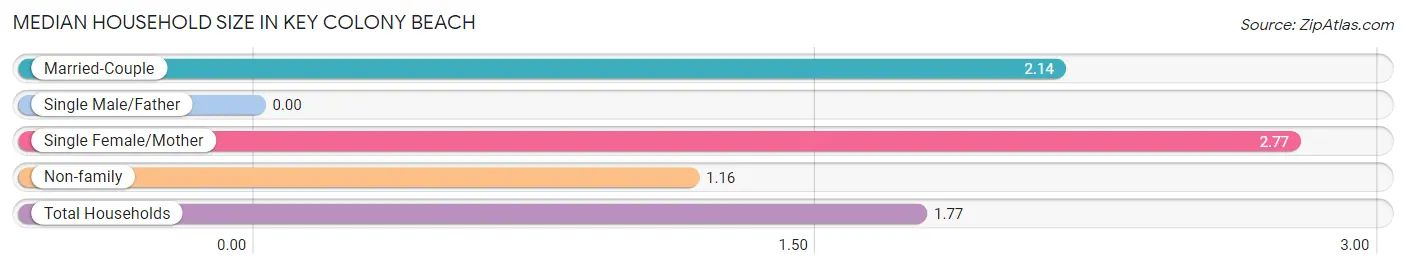
Median Household Size in Key Colony Beach
| Household Type | # Households | Household Size |
| Married-Couple | 207 (56.4%) | 2.14 |
| Single Male/Father | 0 (0.0%) | - |
| Single Female/Mother | 13 (3.5%) | 2.77 |
| Non-family | 147 (40.1%) | 1.16 |
| Total Households | 367 (100.0%) | 1.77 |
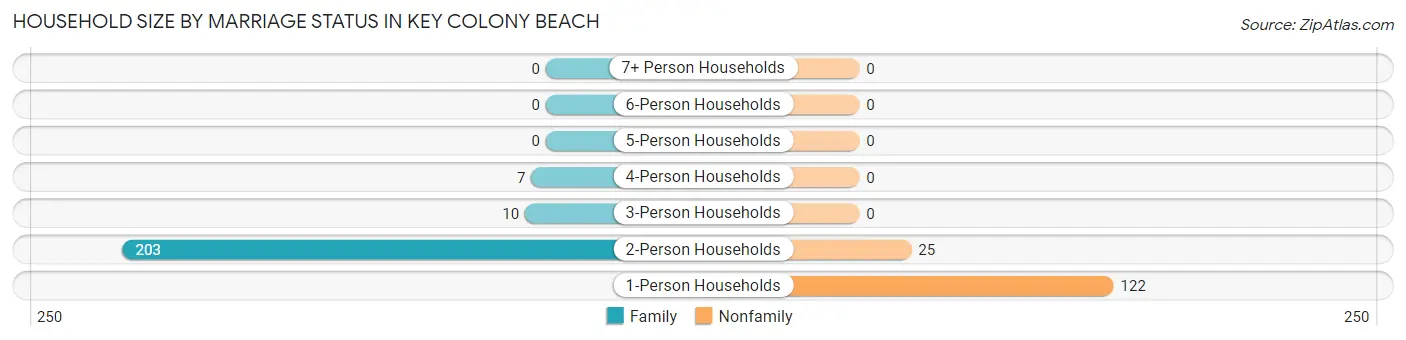
Household Size by Marriage Status in Key Colony Beach
Out of a total of 367 households in Key Colony Beach, 220 (60.0%) are family households, while 147 (40.1%) are nonfamily households. The most numerous type of family households are 2-person households, comprising 203, and the most common type of nonfamily households are 1-person households, comprising 122.
| Household Size | Family Households | Nonfamily Households |
| 1-Person Households | - | 122 (33.2%) |
| 2-Person Households | 203 (55.3%) | 25 (6.8%) |
| 3-Person Households | 10 (2.7%) | 0 (0.0%) |
| 4-Person Households | 7 (1.9%) | 0 (0.0%) |
| 5-Person Households | 0 (0.0%) | 0 (0.0%) |
| 6-Person Households | 0 (0.0%) | 0 (0.0%) |
| 7+ Person Households | 0 (0.0%) | 0 (0.0%) |
| Total | 220 (60.0%) | 147 (40.1%) |
Female Fertility in Key Colony Beach
Fertility by Age in Key Colony Beach
| Age Bracket | Women with Births | Births / 1,000 Women |
| 15 to 19 years | 0 (0.0%) | 0.0 |
| 20 to 34 years | 0 (0.0%) | 0.0 |
| 35 to 50 years | 0 (0.0%) | 0.0 |
| Total | 0 (0.0%) | 0.0 |
Fertility by Age by Marriage Status in Key Colony Beach
| Age Bracket | Married | Unmarried |
| 15 to 19 years | 0 (0.0%) | 0 (0.0%) |
| 20 to 34 years | 0 (0.0%) | 0 (0.0%) |
| 35 to 50 years | 0 (0.0%) | 0 (0.0%) |
| Total | 0 (0.0%) | 0 (0.0%) |
Fertility by Education in Key Colony Beach
| Educational Attainment | Women with Births | Births / 1,000 Women |
| Less than High School | 0 (0.0%) | 0.0 |
| High School Diploma | 0 (0.0%) | 0.0 |
| College or Associate's Degree | 0 (0.0%) | 0.0 |
| Bachelor's Degree | 0 (0.0%) | 0.0 |
| Graduate Degree | 0 (0.0%) | 0.0 |
| Total | 0 (0.0%) | 0.0 |
Fertility by Education by Marriage Status in Key Colony Beach
| Educational Attainment | Married | Unmarried |
| Less than High School | 0 (0.0%) | 0 (0.0%) |
| High School Diploma | 0 (0.0%) | 0 (0.0%) |
| College or Associate's Degree | 0 (0.0%) | 0 (0.0%) |
| Bachelor's Degree | 0 (0.0%) | 0 (0.0%) |
| Graduate Degree | 0 (0.0%) | 0 (0.0%) |
| Total | 0 (0.0%) | 0 (0.0%) |
Income in Key Colony Beach
Income Overview in Key Colony Beach
Per Capita Income in Key Colony Beach is $67,750, while median incomes of families and households are $120,000 and $103,096 respectively.
| Characteristic | Number | Measure |
| Per Capita Income | 650 | $67,750 |
| Median Family Income | 220 | $120,000 |
| Mean Family Income | 220 | $146,165 |
| Median Household Income | 367 | $103,096 |
| Mean Household Income | 367 | $119,023 |
| Income Deficit | 220 | $0 |
| Wage / Income Gap (%) | 650 | 0.00% |
| Wage / Income Gap ($) | 650 | 100.00¢ per $1 |
| Gini / Inequality Index | 650 | 0.40 |
Earnings by Sex in Key Colony Beach
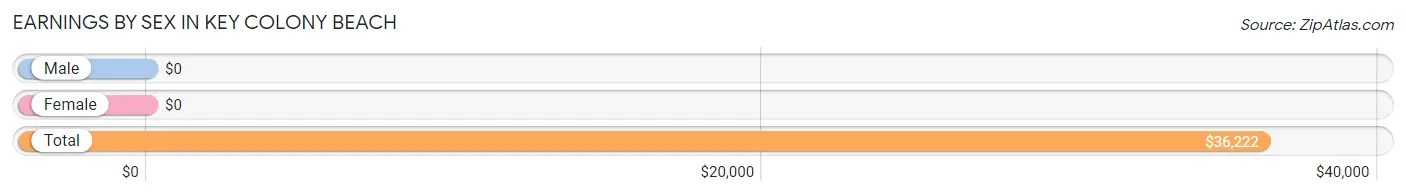
| Sex | Number | Average Earnings |
| Male | 144 (50.9%) | $0 |
| Female | 139 (49.1%) | $0 |
| Total | 283 (100.0%) | $36,222 |
Earnings by Sex by Income Bracket in Key Colony Beach
The most common earnings brackets in Key Colony Beach are $75,000 to $99,999 for men (41 | 28.5%) and $5,000 to $7,499 for women (34 | 24.5%).
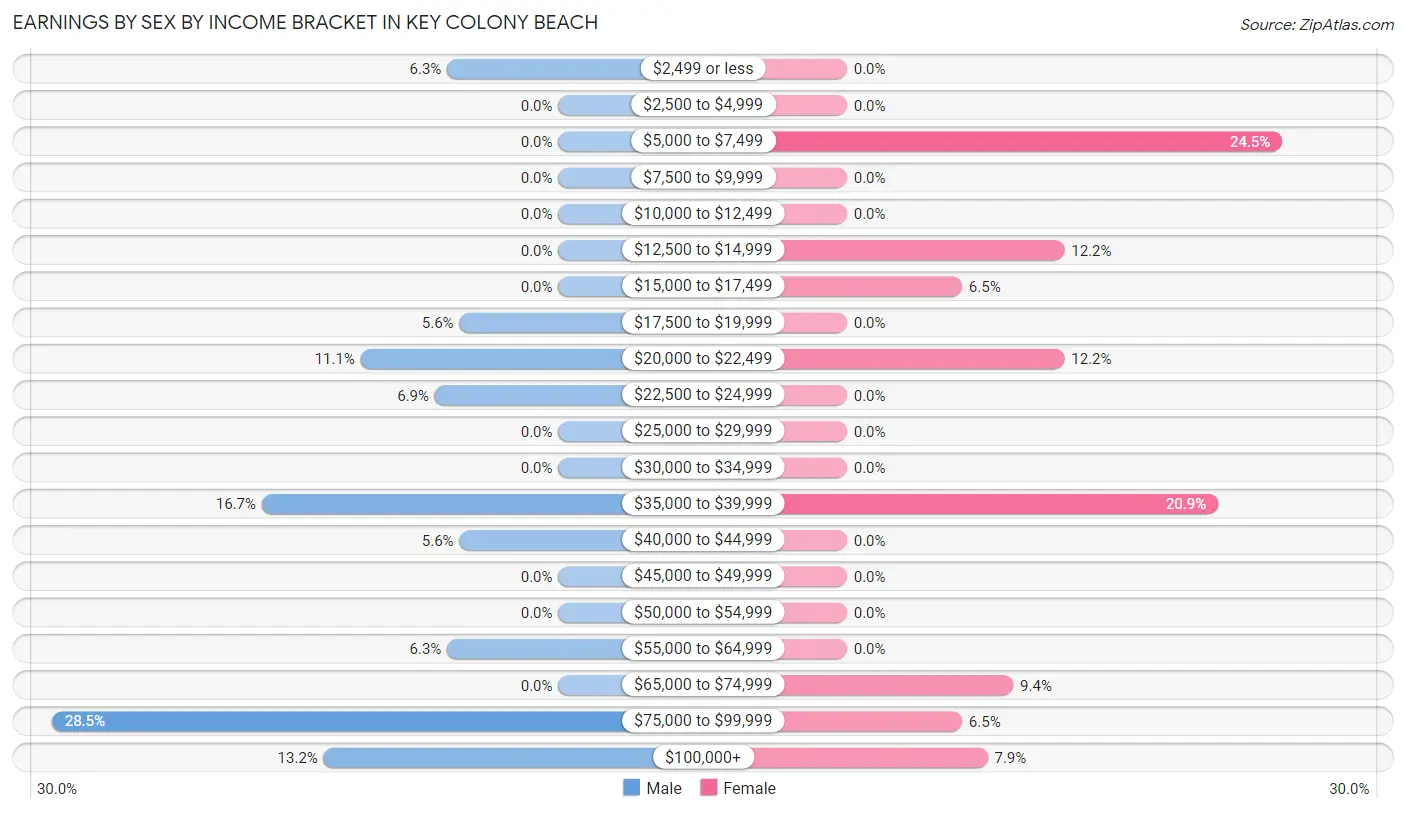
| Income | Male | Female |
| $2,499 or less | 9 (6.2%) | 0 (0.0%) |
| $2,500 to $4,999 | 0 (0.0%) | 0 (0.0%) |
| $5,000 to $7,499 | 0 (0.0%) | 34 (24.5%) |
| $7,500 to $9,999 | 0 (0.0%) | 0 (0.0%) |
| $10,000 to $12,499 | 0 (0.0%) | 0 (0.0%) |
| $12,500 to $14,999 | 0 (0.0%) | 17 (12.2%) |
| $15,000 to $17,499 | 0 (0.0%) | 9 (6.5%) |
| $17,500 to $19,999 | 8 (5.6%) | 0 (0.0%) |
| $20,000 to $22,499 | 16 (11.1%) | 17 (12.2%) |
| $22,500 to $24,999 | 10 (6.9%) | 0 (0.0%) |
| $25,000 to $29,999 | 0 (0.0%) | 0 (0.0%) |
| $30,000 to $34,999 | 0 (0.0%) | 0 (0.0%) |
| $35,000 to $39,999 | 24 (16.7%) | 29 (20.9%) |
| $40,000 to $44,999 | 8 (5.6%) | 0 (0.0%) |
| $45,000 to $49,999 | 0 (0.0%) | 0 (0.0%) |
| $50,000 to $54,999 | 0 (0.0%) | 0 (0.0%) |
| $55,000 to $64,999 | 9 (6.2%) | 0 (0.0%) |
| $65,000 to $74,999 | 0 (0.0%) | 13 (9.3%) |
| $75,000 to $99,999 | 41 (28.5%) | 9 (6.5%) |
| $100,000+ | 19 (13.2%) | 11 (7.9%) |
| Total | 144 (100.0%) | 139 (100.0%) |
Earnings by Sex by Educational Attainment in Key Colony Beach
| Educational Attainment | Male Income | Female Income |
| Less than High School | - | - |
| High School Diploma | - | - |
| College or Associate's Degree | - | - |
| Bachelor's Degree | - | - |
| Graduate Degree | - | - |
| Total | - | - |
Family Income in Key Colony Beach
Family Income Brackets in Key Colony Beach
According to the Key Colony Beach family income data, there are 75 families falling into the $100,000 to $149,999 income range, which is the most common income bracket and makes up 34.1% of all families.
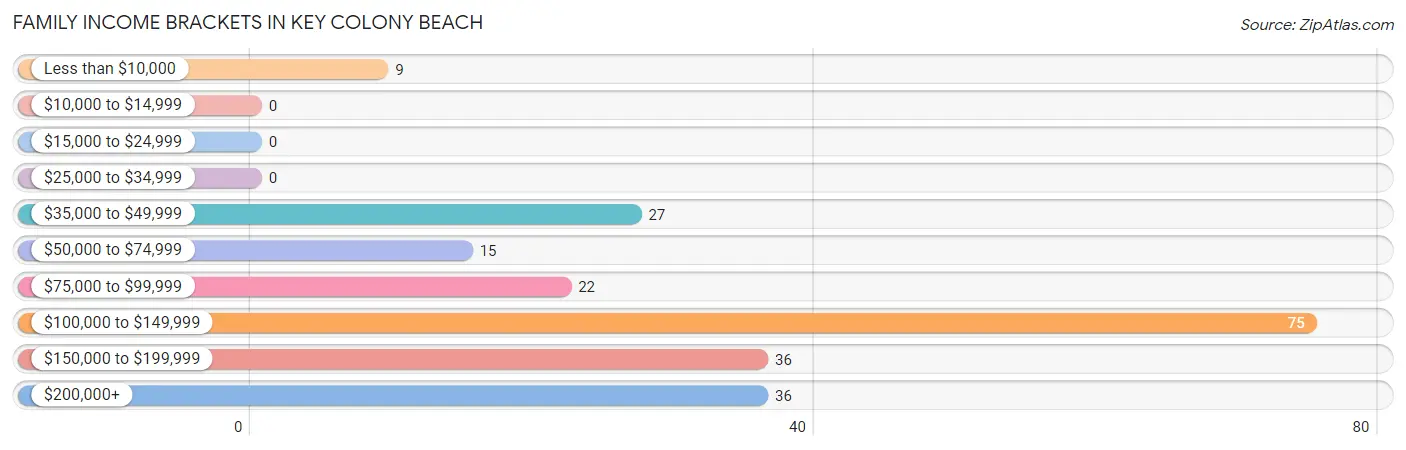
| Income Bracket | # Families | % Families |
| Less than $10,000 | 9 | 4.1% |
| $10,000 to $14,999 | 0 | 0.0% |
| $15,000 to $24,999 | 0 | 0.0% |
| $25,000 to $34,999 | 0 | 0.0% |
| $35,000 to $49,999 | 27 | 12.3% |
| $50,000 to $74,999 | 15 | 6.8% |
| $75,000 to $99,999 | 22 | 10.0% |
| $100,000 to $149,999 | 75 | 34.1% |
| $150,000 to $199,999 | 36 | 16.4% |
| $200,000+ | 36 | 16.4% |
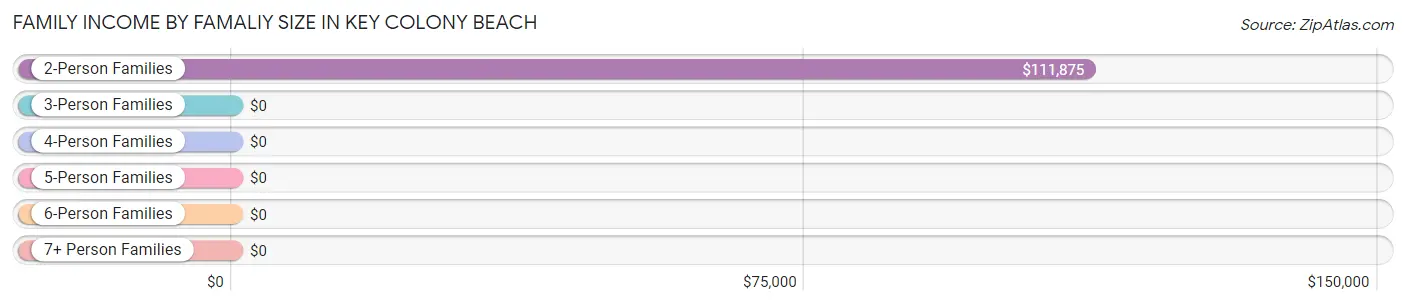
Family Income by Famaliy Size in Key Colony Beach
2-person families (203 | 92.3%) account for the highest median family income in Key Colony Beach with $111,875 per family, while 2-person families (203 | 92.3%) have the highest median income of $55,938 per family member.
| Income Bracket | # Families | Median Income |
| 2-Person Families | 203 (92.3%) | $111,875 |
| 3-Person Families | 10 (4.5%) | $0 |
| 4-Person Families | 7 (3.2%) | $0 |
| 5-Person Families | 0 (0.0%) | $0 |
| 6-Person Families | 0 (0.0%) | $0 |
| 7+ Person Families | 0 (0.0%) | $0 |
| Total | 220 (100.0%) | $120,000 |
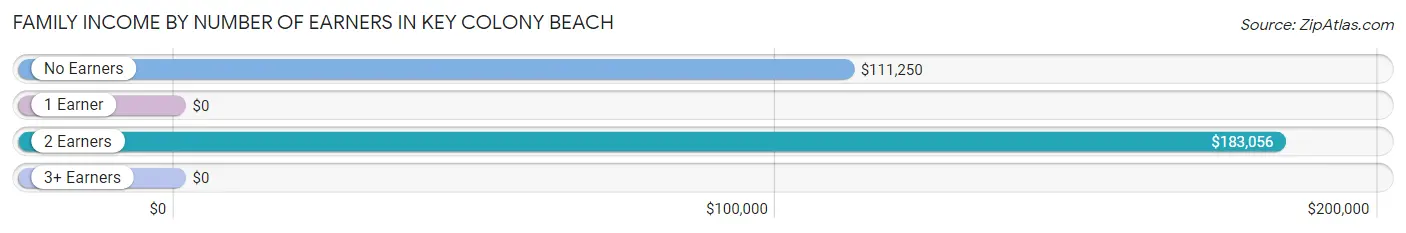
Family Income by Number of Earners in Key Colony Beach
| Number of Earners | # Families | Median Income |
| No Earners | 104 (47.3%) | $111,250 |
| 1 Earner | 66 (30.0%) | $0 |
| 2 Earners | 50 (22.7%) | $183,056 |
| 3+ Earners | 0 (0.0%) | $0 |
| Total | 220 (100.0%) | $120,000 |
Household Income in Key Colony Beach
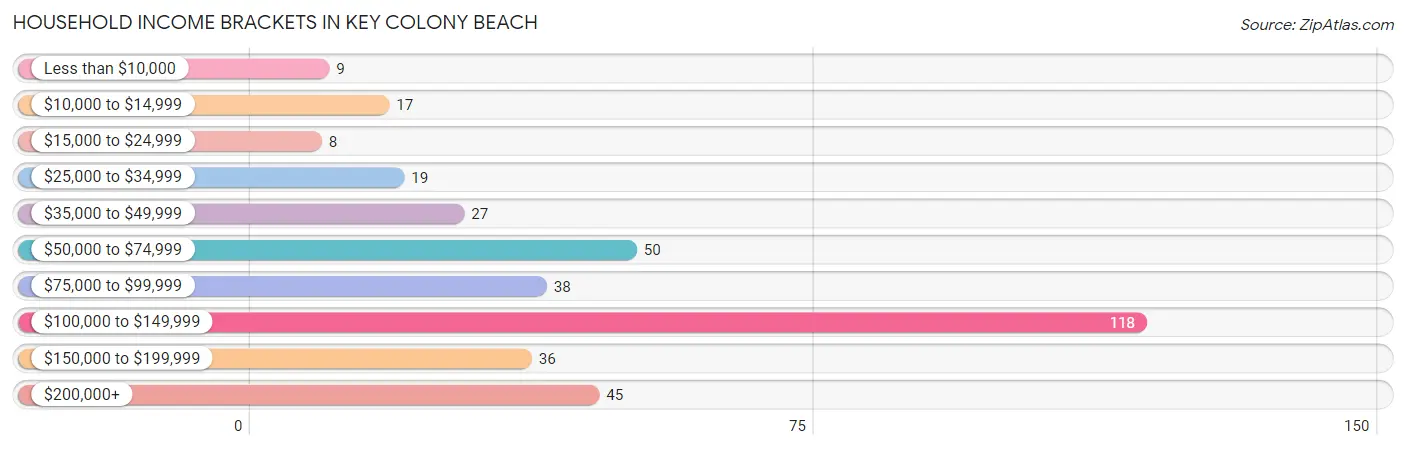
Household Income Brackets in Key Colony Beach
With 118 households falling in the category, the $100,000 to $149,999 income range is the most frequent in Key Colony Beach, accounting for 32.2% of all households. In contrast, only 8 households (2.2%) fall into the $15,000 to $24,999 income bracket, making it the least populous group.
| Income Bracket | # Households | % Households |
| Less than $10,000 | 9 | 2.5% |
| $10,000 to $14,999 | 17 | 4.6% |
| $15,000 to $24,999 | 8 | 2.2% |
| $25,000 to $34,999 | 19 | 5.2% |
| $35,000 to $49,999 | 27 | 7.4% |
| $50,000 to $74,999 | 50 | 13.6% |
| $75,000 to $99,999 | 38 | 10.4% |
| $100,000 to $149,999 | 118 | 32.2% |
| $150,000 to $199,999 | 36 | 9.8% |
| $200,000+ | 45 | 12.3% |
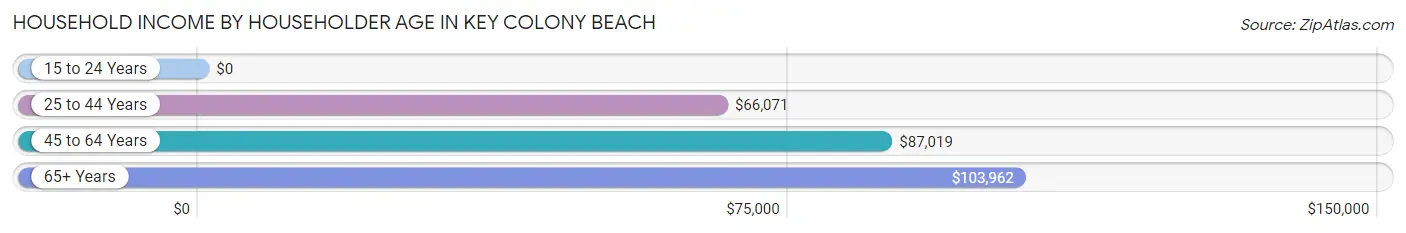
Household Income by Householder Age in Key Colony Beach
The median household income in Key Colony Beach is $103,096, with the highest median household income of $103,962 found in the 65+ years age bracket for the primary householder. A total of 230 households (62.7%) fall into this category.
| Income Bracket | # Households | Median Income |
| 15 to 24 Years | 0 (0.0%) | $0 |
| 25 to 44 Years | 26 (7.1%) | $66,071 |
| 45 to 64 Years | 111 (30.2%) | $87,019 |
| 65+ Years | 230 (62.7%) | $103,962 |
| Total | 367 (100.0%) | $103,096 |
Poverty in Key Colony Beach
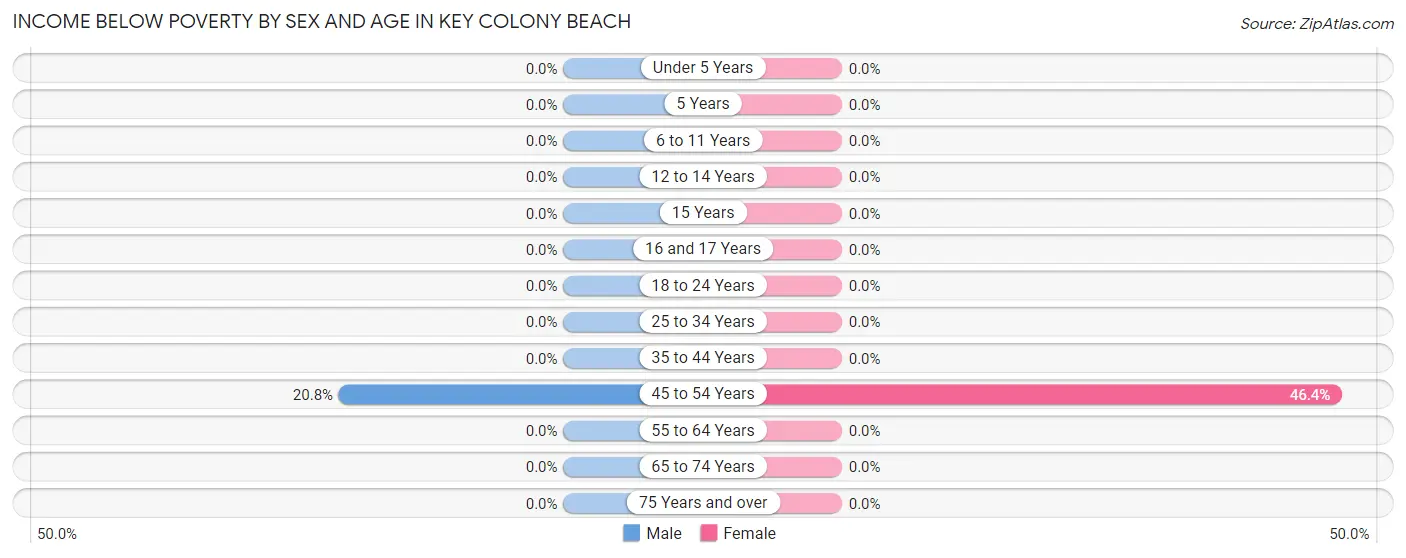
Income Below Poverty by Sex and Age in Key Colony Beach
With 3.5% poverty level for males and 7.2% for females among the residents of Key Colony Beach, 45 to 54 year old males and 45 to 54 year old females are the most vulnerable to poverty, with 10 males (20.8%) and 26 females (46.4%) in their respective age groups living below the poverty level.
| Age Bracket | Male | Female |
| Under 5 Years | 0 (0.0%) | 0 (0.0%) |
| 5 Years | 0 (0.0%) | 0 (0.0%) |
| 6 to 11 Years | 0 (0.0%) | 0 (0.0%) |
| 12 to 14 Years | 0 (0.0%) | 0 (0.0%) |
| 15 Years | 0 (0.0%) | 0 (0.0%) |
| 16 and 17 Years | 0 (0.0%) | 0 (0.0%) |
| 18 to 24 Years | 0 (0.0%) | 0 (0.0%) |
| 25 to 34 Years | 0 (0.0%) | 0 (0.0%) |
| 35 to 44 Years | 0 (0.0%) | 0 (0.0%) |
| 45 to 54 Years | 10 (20.8%) | 26 (46.4%) |
| 55 to 64 Years | 0 (0.0%) | 0 (0.0%) |
| 65 to 74 Years | 0 (0.0%) | 0 (0.0%) |
| 75 Years and over | 0 (0.0%) | 0 (0.0%) |
| Total | 10 (3.5%) | 26 (7.2%) |
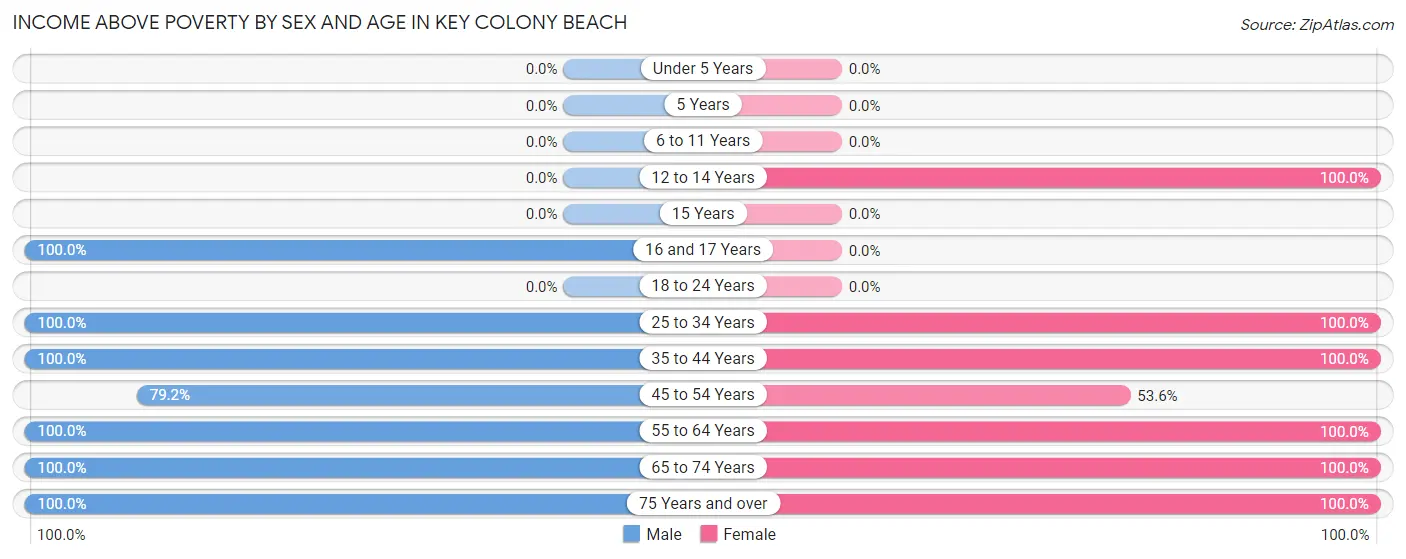
Income Above Poverty by Sex and Age in Key Colony Beach
According to the poverty statistics in Key Colony Beach, males aged 16 and 17 years and females aged 12 to 14 years are the age groups that are most secure financially, with 100.0% of males and 100.0% of females in these age groups living above the poverty line.
| Age Bracket | Male | Female |
| Under 5 Years | 0 (0.0%) | 0 (0.0%) |
| 5 Years | 0 (0.0%) | 0 (0.0%) |
| 6 to 11 Years | 0 (0.0%) | 0 (0.0%) |
| 12 to 14 Years | 0 (0.0%) | 9 (100.0%) |
| 15 Years | 0 (0.0%) | 0 (0.0%) |
| 16 and 17 Years | 6 (100.0%) | 0 (0.0%) |
| 18 to 24 Years | 0 (0.0%) | 0 (0.0%) |
| 25 to 34 Years | 10 (100.0%) | 11 (100.0%) |
| 35 to 44 Years | 7 (100.0%) | 18 (100.0%) |
| 45 to 54 Years | 38 (79.2%) | 30 (53.6%) |
| 55 to 64 Years | 39 (100.0%) | 82 (100.0%) |
| 65 to 74 Years | 118 (100.0%) | 62 (100.0%) |
| 75 Years and over | 62 (100.0%) | 122 (100.0%) |
| Total | 280 (96.6%) | 334 (92.8%) |
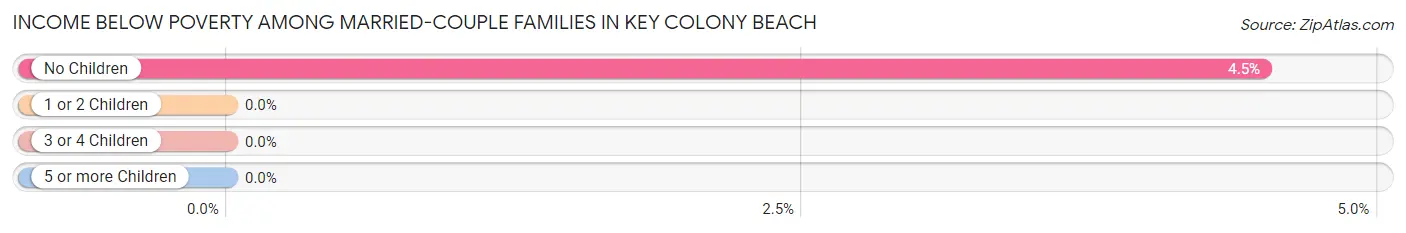
Income Below Poverty Among Married-Couple Families in Key Colony Beach
The poverty statistics for married-couple families in Key Colony Beach show that 4.3% or 9 of the total 207 families live below the poverty line. Families with no children have the highest poverty rate of 4.5%, comprising of 9 families. On the other hand, families with 1 or 2 children have the lowest poverty rate of 0.0%, which includes 0 families.
| Children | Above Poverty | Below Poverty |
| No Children | 191 (95.5%) | 9 (4.5%) |
| 1 or 2 Children | 7 (100.0%) | 0 (0.0%) |
| 3 or 4 Children | 0 (0.0%) | 0 (0.0%) |
| 5 or more Children | 0 (0.0%) | 0 (0.0%) |
| Total | 198 (95.7%) | 9 (4.3%) |
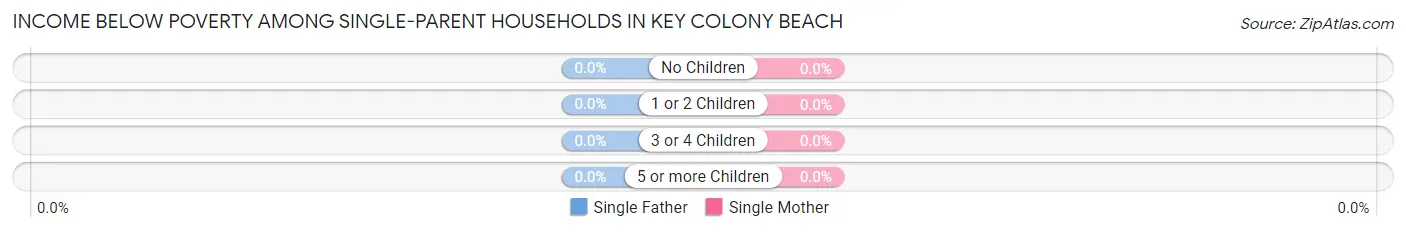
Income Below Poverty Among Single-Parent Households in Key Colony Beach
| Children | Single Father | Single Mother |
| No Children | 0 (0.0%) | 0 (0.0%) |
| 1 or 2 Children | 0 (0.0%) | 0 (0.0%) |
| 3 or 4 Children | 0 (0.0%) | 0 (0.0%) |
| 5 or more Children | 0 (0.0%) | 0 (0.0%) |
| Total | 0 (0.0%) | 0 (0.0%) |
Income Below Poverty Among Married-Couple vs Single-Parent Households in Key Colony Beach
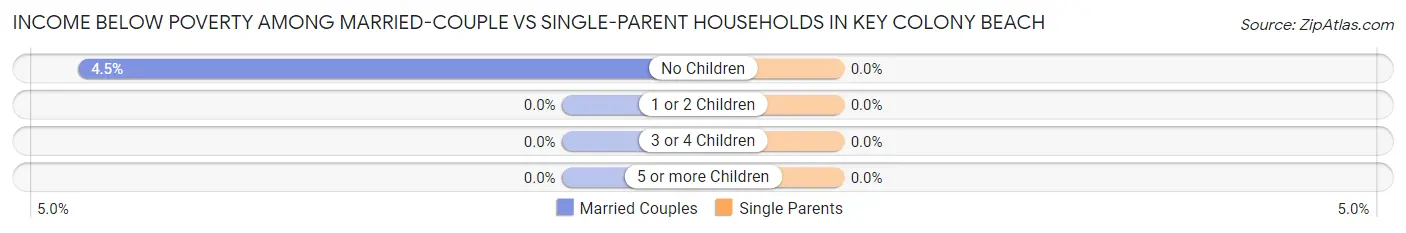
| Children | Married-Couple Families | Single-Parent Households |
| No Children | 9 (4.5%) | 0 (0.0%) |
| 1 or 2 Children | 0 (0.0%) | 0 (0.0%) |
| 3 or 4 Children | 0 (0.0%) | 0 (0.0%) |
| 5 or more Children | 0 (0.0%) | 0 (0.0%) |
| Total | 9 (4.3%) | 0 (0.0%) |
Employment Characteristics in Key Colony Beach
Employment by Class of Employer in Key Colony Beach
Among the 266 employed individuals in Key Colony Beach, private company employees (169 | 63.5%), self-employed (not incorporated) (38 | 14.3%), and self-employed (incorporated) (18 | 6.8%) make up the most common classes of employment.
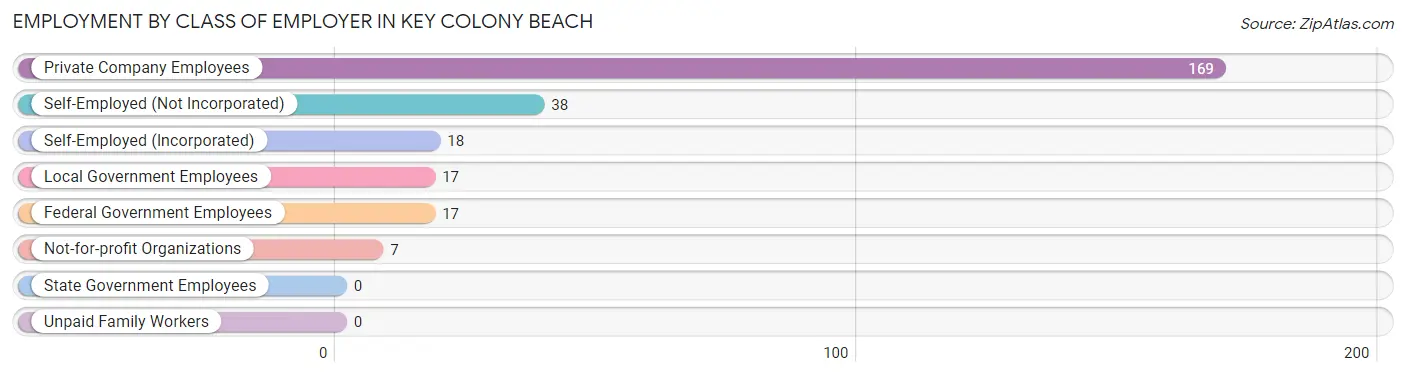
| Employer Class | # Employees | % Employees |
| Private Company Employees | 169 | 63.5% |
| Self-Employed (Incorporated) | 18 | 6.8% |
| Self-Employed (Not Incorporated) | 38 | 14.3% |
| Not-for-profit Organizations | 7 | 2.6% |
| Local Government Employees | 17 | 6.4% |
| State Government Employees | 0 | 0.0% |
| Federal Government Employees | 17 | 6.4% |
| Unpaid Family Workers | 0 | 0.0% |
| Total | 266 | 100.0% |
Employment Status by Age in Key Colony Beach
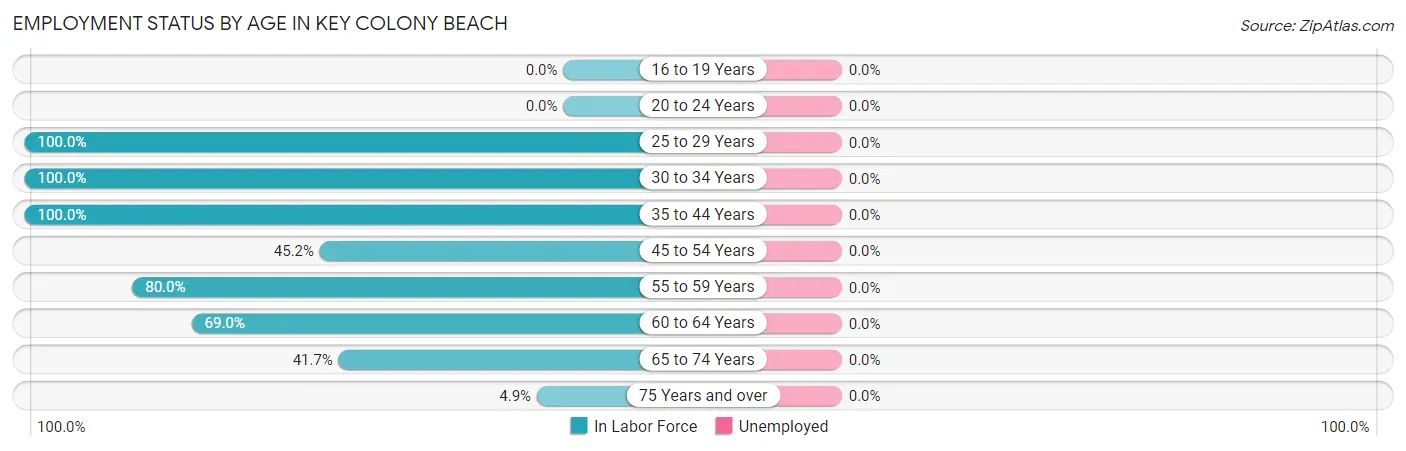
| Age Bracket | In Labor Force | Unemployed |
| 16 to 19 Years | 0 (0.0%) | 0 (0.0%) |
| 20 to 24 Years | 0 (0.0%) | 0 (0.0%) |
| 25 to 29 Years | 10 (100.0%) | 0 (0.0%) |
| 30 to 34 Years | 11 (100.0%) | 0 (0.0%) |
| 35 to 44 Years | 25 (100.0%) | 0 (0.0%) |
| 45 to 54 Years | 47 (45.2%) | 0 (0.0%) |
| 55 to 59 Years | 40 (80.0%) | 0 (0.0%) |
| 60 to 64 Years | 49 (69.0%) | 0 (0.0%) |
| 65 to 74 Years | 75 (41.7%) | 0 (0.0%) |
| 75 Years and over | 9 (4.9%) | 0 (0.0%) |
| Total | 266 (41.5%) | 0 (0.0%) |
Employment Status by Educational Attainment in Key Colony Beach
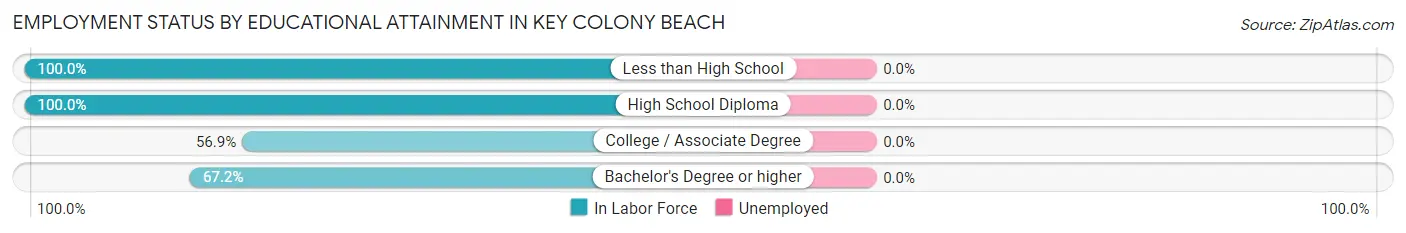
| Educational Attainment | In Labor Force | Unemployed |
| Less than High School | 13 (100.0%) | 0 (0.0%) |
| High School Diploma | 21 (100.0%) | 0 (0.0%) |
| College / Associate Degree | 62 (56.9%) | 0 (0.0%) |
| Bachelor's Degree or higher | 86 (67.2%) | 0 (0.0%) |
| Total | 182 (67.2%) | 0 (0.0%) |
Employment Occupations by Sex in Key Colony Beach
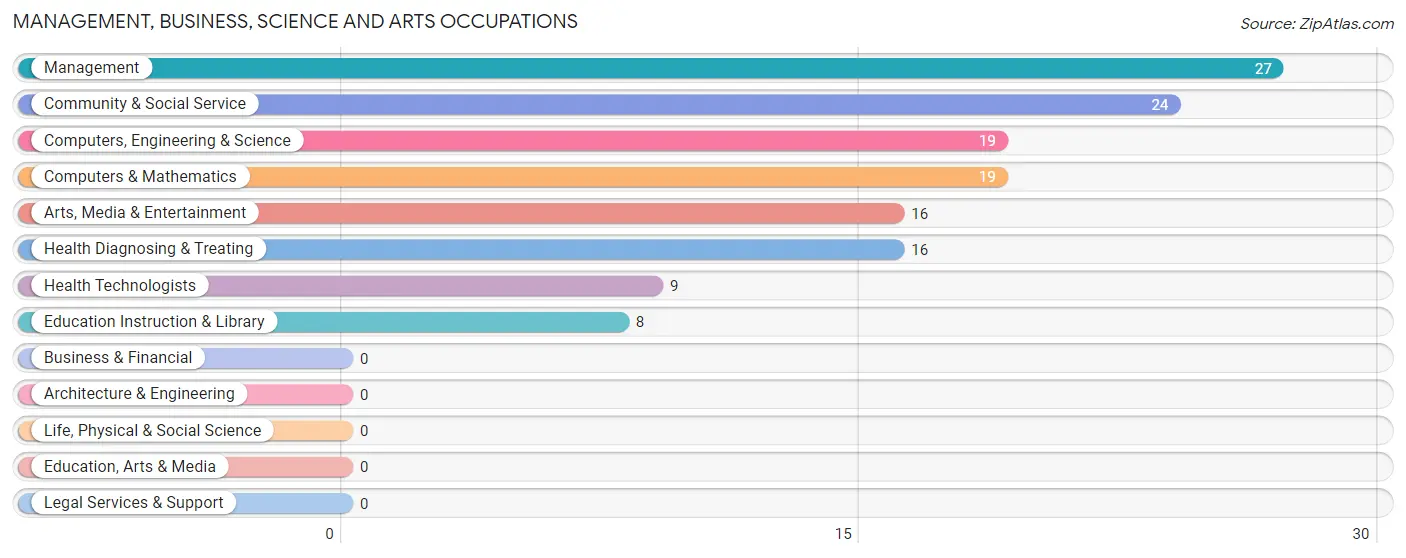
Management, Business, Science and Arts Occupations
The most common Management, Business, Science and Arts occupations in Key Colony Beach are Management (27 | 10.2%), Community & Social Service (24 | 9.0%), Computers, Engineering & Science (19 | 7.1%), Computers & Mathematics (19 | 7.1%), and Arts, Media & Entertainment (16 | 6.0%).
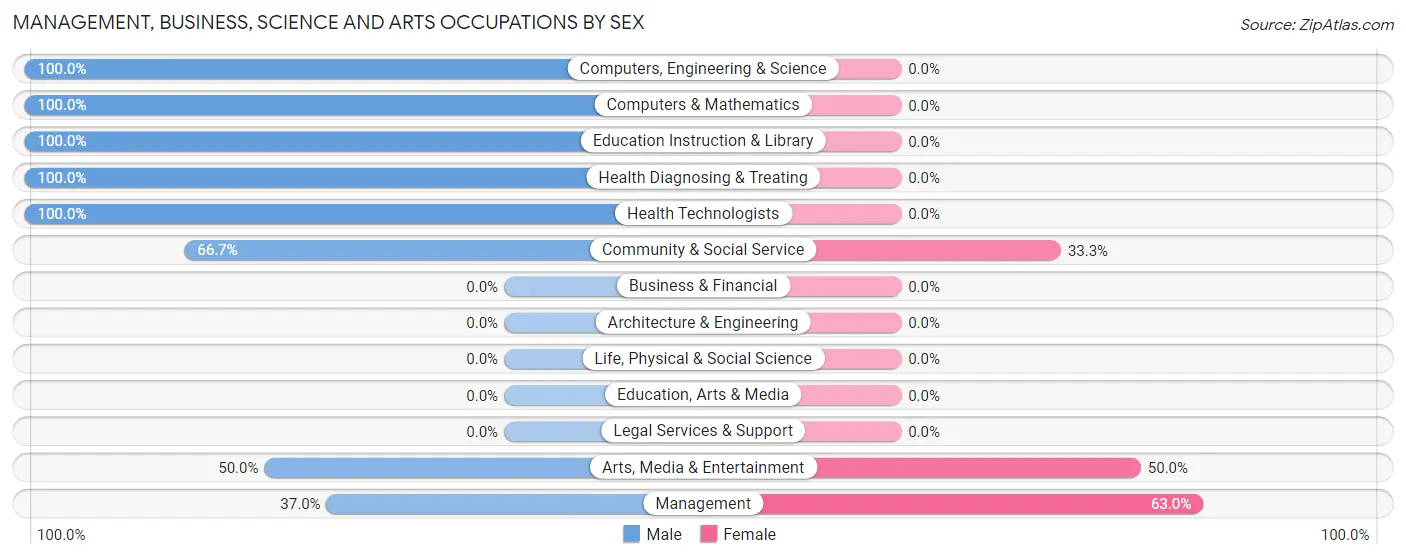
Management, Business, Science and Arts Occupations by Sex
Within the Management, Business, Science and Arts occupations in Key Colony Beach, the most male-oriented occupations are Computers, Engineering & Science (100.0%), Computers & Mathematics (100.0%), and Education Instruction & Library (100.0%), while the most female-oriented occupations are Management (63.0%), Arts, Media & Entertainment (50.0%), and Community & Social Service (33.3%).
| Occupation | Male | Female |
| Management | 10 (37.0%) | 17 (63.0%) |
| Business & Financial | 0 (0.0%) | 0 (0.0%) |
| Computers, Engineering & Science | 19 (100.0%) | 0 (0.0%) |
| Computers & Mathematics | 19 (100.0%) | 0 (0.0%) |
| Architecture & Engineering | 0 (0.0%) | 0 (0.0%) |
| Life, Physical & Social Science | 0 (0.0%) | 0 (0.0%) |
| Community & Social Service | 16 (66.7%) | 8 (33.3%) |
| Education, Arts & Media | 0 (0.0%) | 0 (0.0%) |
| Legal Services & Support | 0 (0.0%) | 0 (0.0%) |
| Education Instruction & Library | 8 (100.0%) | 0 (0.0%) |
| Arts, Media & Entertainment | 8 (50.0%) | 8 (50.0%) |
| Health Diagnosing & Treating | 16 (100.0%) | 0 (0.0%) |
| Health Technologists | 9 (100.0%) | 0 (0.0%) |
| Total (Category) | 61 (70.9%) | 25 (29.1%) |
| Total (Overall) | 144 (54.1%) | 122 (45.9%) |
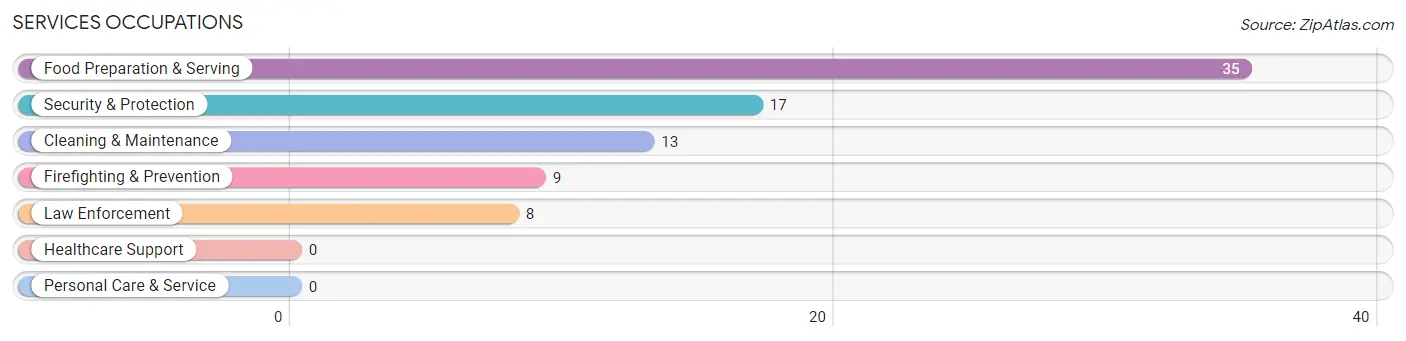
Services Occupations
The most common Services occupations in Key Colony Beach are Food Preparation & Serving (35 | 13.2%), Security & Protection (17 | 6.4%), Cleaning & Maintenance (13 | 4.9%), Firefighting & Prevention (9 | 3.4%), and Law Enforcement (8 | 3.0%).
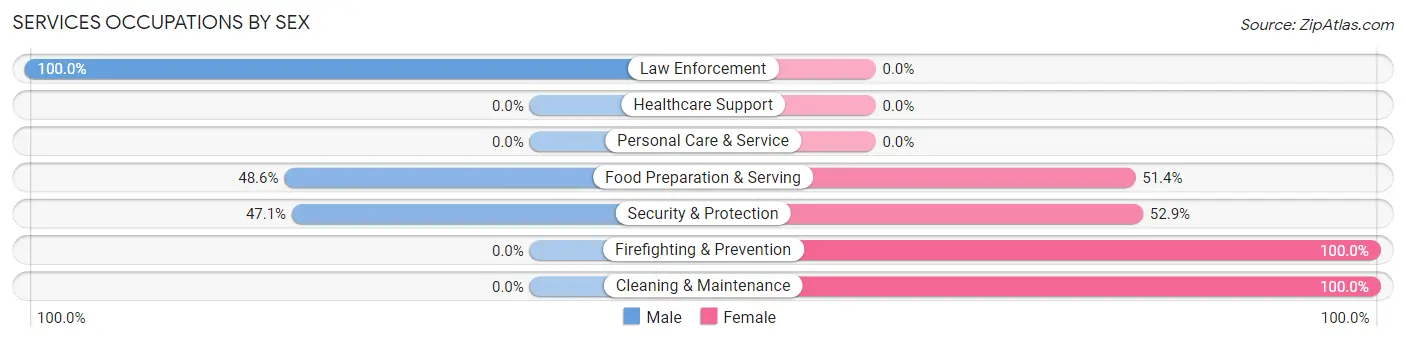
Services Occupations by Sex
Within the Services occupations in Key Colony Beach, the most male-oriented occupations are Law Enforcement (100.0%), Food Preparation & Serving (48.6%), and Security & Protection (47.1%), while the most female-oriented occupations are Firefighting & Prevention (100.0%), Cleaning & Maintenance (100.0%), and Security & Protection (52.9%).
| Occupation | Male | Female |
| Healthcare Support | 0 (0.0%) | 0 (0.0%) |
| Security & Protection | 8 (47.1%) | 9 (52.9%) |
| Firefighting & Prevention | 0 (0.0%) | 9 (100.0%) |
| Law Enforcement | 8 (100.0%) | 0 (0.0%) |
| Food Preparation & Serving | 17 (48.6%) | 18 (51.4%) |
| Cleaning & Maintenance | 0 (0.0%) | 13 (100.0%) |
| Personal Care & Service | 0 (0.0%) | 0 (0.0%) |
| Total (Category) | 25 (38.5%) | 40 (61.5%) |
| Total (Overall) | 144 (54.1%) | 122 (45.9%) |
Sales and Office Occupations
The most common Sales and Office occupations in Key Colony Beach are Sales & Related (91 | 34.2%), and Office & Administration (17 | 6.4%).
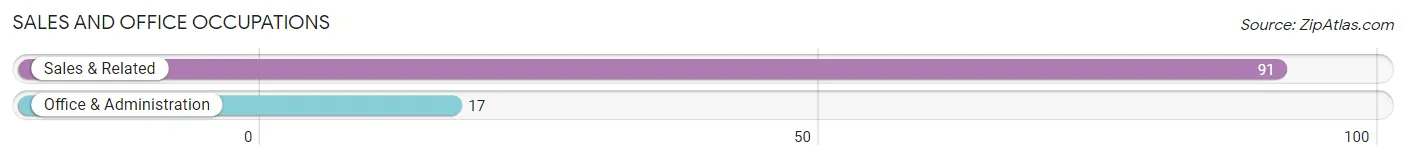
Sales and Office Occupations by Sex

| Occupation | Male | Female |
| Sales & Related | 51 (56.0%) | 40 (44.0%) |
| Office & Administration | 0 (0.0%) | 17 (100.0%) |
| Total (Category) | 51 (47.2%) | 57 (52.8%) |
| Total (Overall) | 144 (54.1%) | 122 (45.9%) |
Natural Resources, Construction and Maintenance Occupations
The most common Natural Resources, Construction and Maintenance occupations in Key Colony Beach are , and Construction & Extraction (7 | 2.6%).
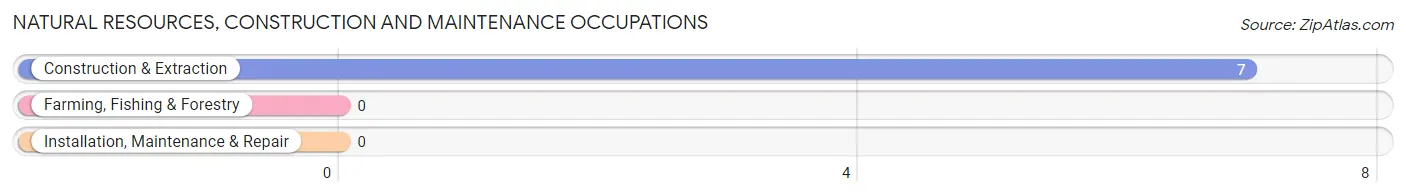
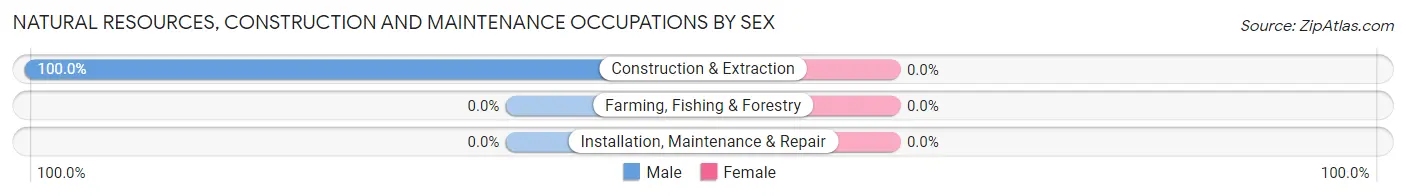
Natural Resources, Construction and Maintenance Occupations by Sex
| Occupation | Male | Female |
| Farming, Fishing & Forestry | 0 (0.0%) | 0 (0.0%) |
| Construction & Extraction | 7 (100.0%) | 0 (0.0%) |
| Installation, Maintenance & Repair | 0 (0.0%) | 0 (0.0%) |
| Total (Category) | 7 (100.0%) | 0 (0.0%) |
| Total (Overall) | 144 (54.1%) | 122 (45.9%) |
Production, Transportation and Moving Occupations
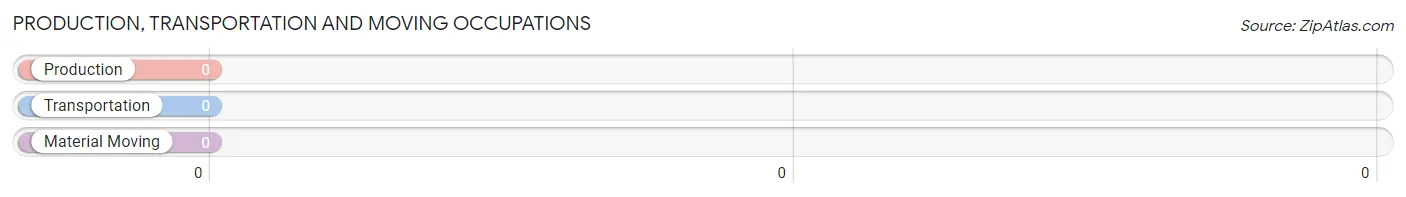
Production, Transportation and Moving Occupations by Sex
| Occupation | Male | Female |
| Production | 0 (0.0%) | 0 (0.0%) |
| Transportation | 0 (0.0%) | 0 (0.0%) |
| Material Moving | 0 (0.0%) | 0 (0.0%) |
| Total (Category) | 0 (0.0%) | 0 (0.0%) |
| Total (Overall) | 144 (54.1%) | 122 (45.9%) |
Employment Industries by Sex in Key Colony Beach
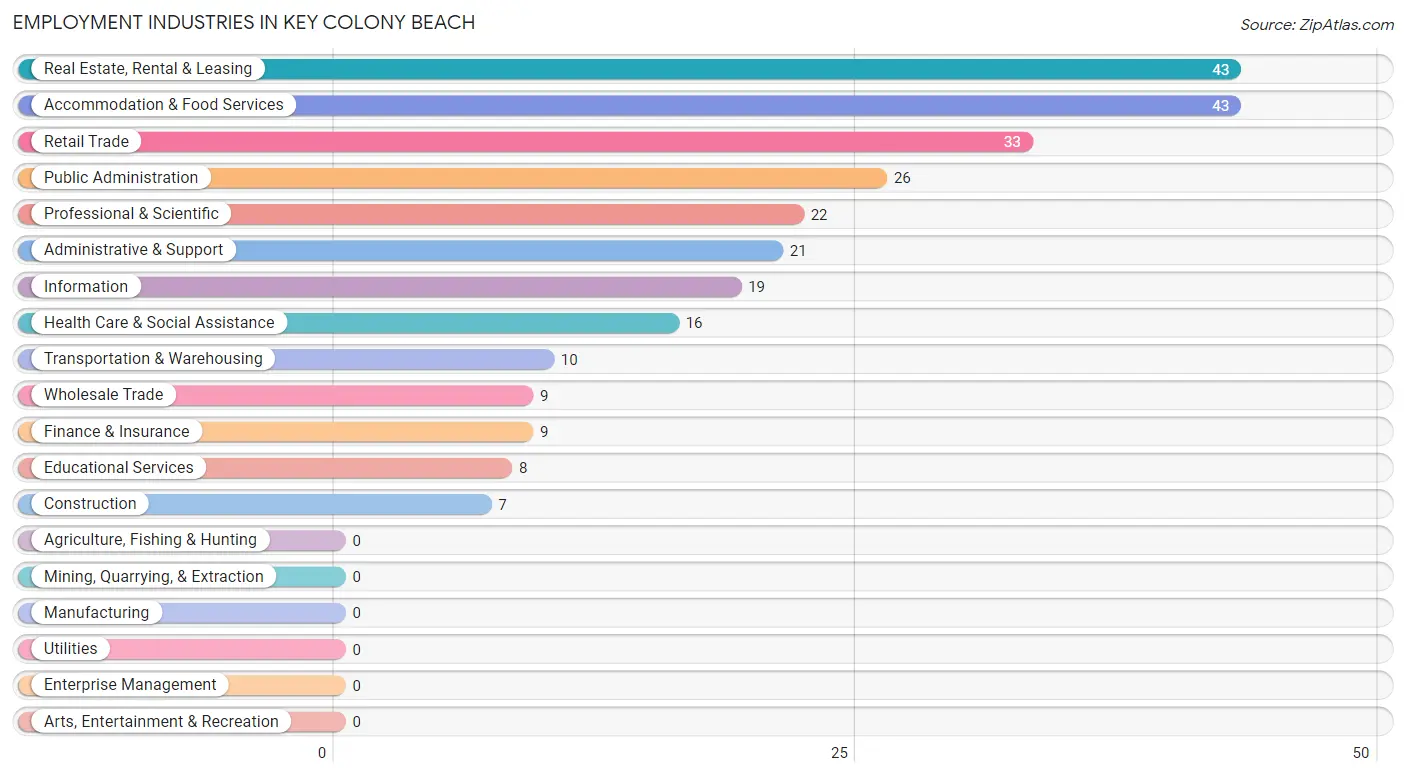
Employment Industries in Key Colony Beach
The major employment industries in Key Colony Beach include Real Estate, Rental & Leasing (43 | 16.2%), Accommodation & Food Services (43 | 16.2%), Retail Trade (33 | 12.4%), Public Administration (26 | 9.8%), and Professional & Scientific (22 | 8.3%).
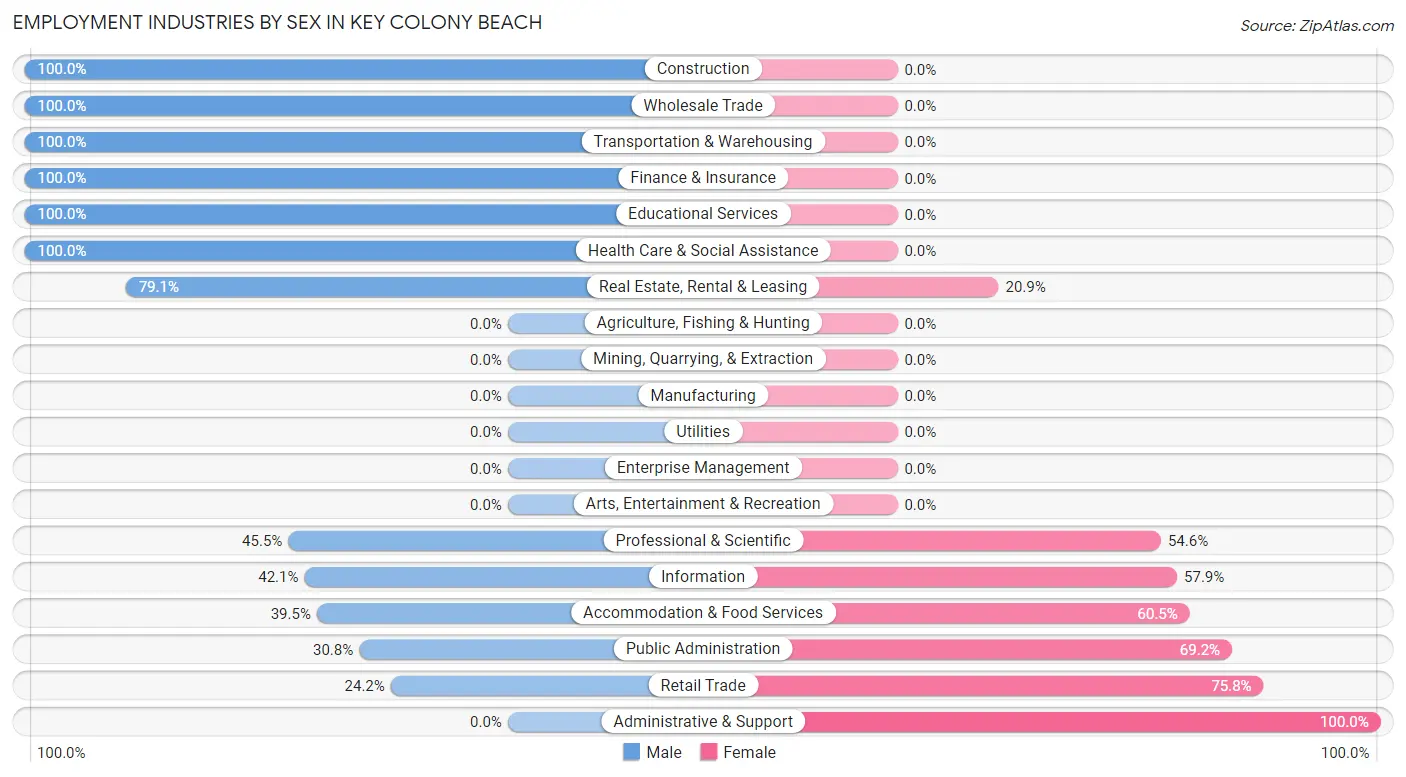
Employment Industries by Sex in Key Colony Beach
The Key Colony Beach industries that see more men than women are Construction (100.0%), Wholesale Trade (100.0%), and Transportation & Warehousing (100.0%), whereas the industries that tend to have a higher number of women are Administrative & Support (100.0%), Retail Trade (75.8%), and Public Administration (69.2%).
| Industry | Male | Female |
| Agriculture, Fishing & Hunting | 0 (0.0%) | 0 (0.0%) |
| Mining, Quarrying, & Extraction | 0 (0.0%) | 0 (0.0%) |
| Construction | 7 (100.0%) | 0 (0.0%) |
| Manufacturing | 0 (0.0%) | 0 (0.0%) |
| Wholesale Trade | 9 (100.0%) | 0 (0.0%) |
| Retail Trade | 8 (24.2%) | 25 (75.8%) |
| Transportation & Warehousing | 10 (100.0%) | 0 (0.0%) |
| Utilities | 0 (0.0%) | 0 (0.0%) |
| Information | 8 (42.1%) | 11 (57.9%) |
| Finance & Insurance | 9 (100.0%) | 0 (0.0%) |
| Real Estate, Rental & Leasing | 34 (79.1%) | 9 (20.9%) |
| Professional & Scientific | 10 (45.5%) | 12 (54.5%) |
| Enterprise Management | 0 (0.0%) | 0 (0.0%) |
| Administrative & Support | 0 (0.0%) | 21 (100.0%) |
| Educational Services | 8 (100.0%) | 0 (0.0%) |
| Health Care & Social Assistance | 16 (100.0%) | 0 (0.0%) |
| Arts, Entertainment & Recreation | 0 (0.0%) | 0 (0.0%) |
| Accommodation & Food Services | 17 (39.5%) | 26 (60.5%) |
| Public Administration | 8 (30.8%) | 18 (69.2%) |
| Total | 144 (54.1%) | 122 (45.9%) |
Education in Key Colony Beach
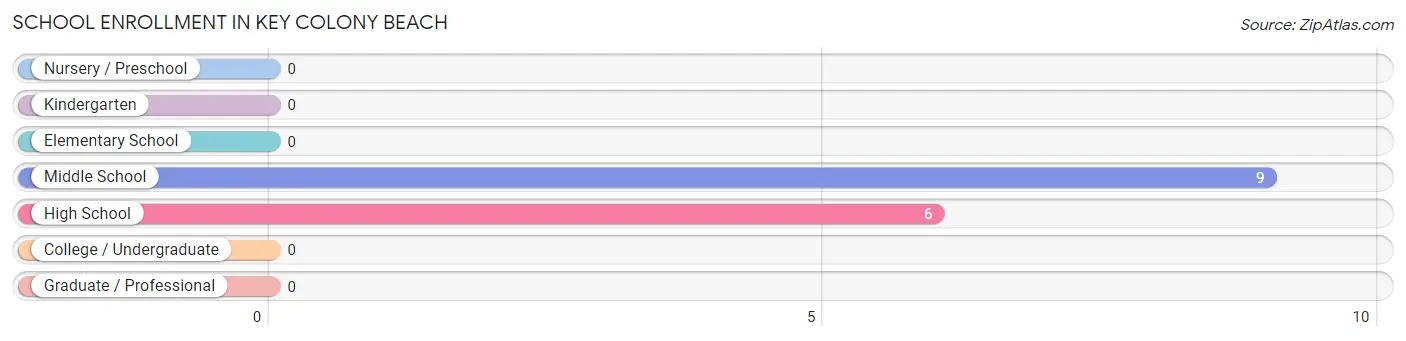
School Enrollment in Key Colony Beach
The most common levels of schooling among the 15 students in Key Colony Beach are middle school (9 | 60.0%), and high school (6 | 40.0%).
| School Level | # Students | % Students |
| Nursery / Preschool | 0 | 0.0% |
| Kindergarten | 0 | 0.0% |
| Elementary School | 0 | 0.0% |
| Middle School | 9 | 60.0% |
| High School | 6 | 40.0% |
| College / Undergraduate | 0 | 0.0% |
| Graduate / Professional | 0 | 0.0% |
| Total | 15 | 100.0% |
School Enrollment by Age by Funding Source in Key Colony Beach
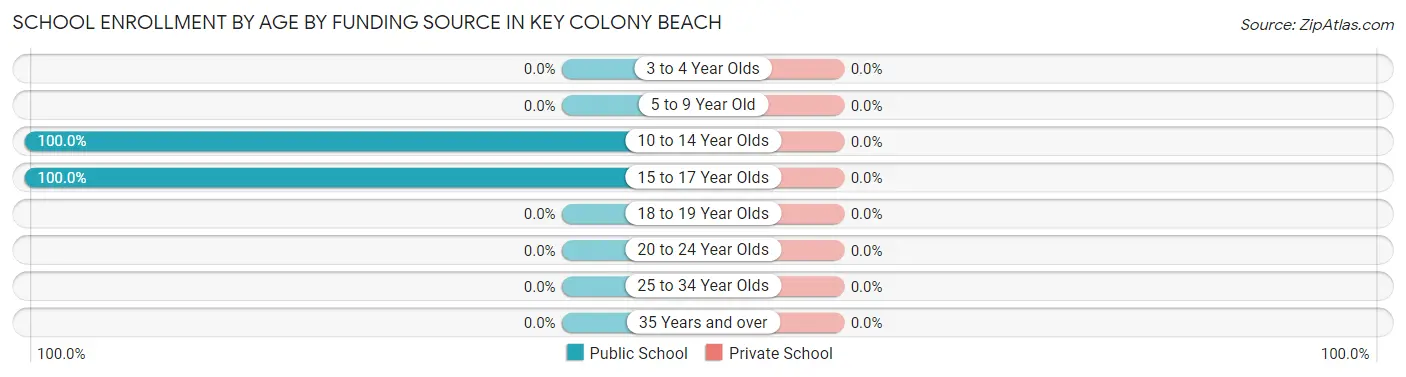
| Age Bracket | Public School | Private School |
| 3 to 4 Year Olds | 0 (0.0%) | 0 (0.0%) |
| 5 to 9 Year Old | 0 (0.0%) | 0 (0.0%) |
| 10 to 14 Year Olds | 9 (100.0%) | 0 (0.0%) |
| 15 to 17 Year Olds | 6 (100.0%) | 0 (0.0%) |
| 18 to 19 Year Olds | 0 (0.0%) | 0 (0.0%) |
| 20 to 24 Year Olds | 0 (0.0%) | 0 (0.0%) |
| 25 to 34 Year Olds | 0 (0.0%) | 0 (0.0%) |
| 35 Years and over | 0 (0.0%) | 0 (0.0%) |
| Total | 15 (100.0%) | 0 (0.0%) |
Educational Attainment by Field of Study in Key Colony Beach
Science & technology (80 | 23.6%), business (68 | 20.1%), education (53 | 15.6%), literature & languages (33 | 9.7%), and social sciences (29 | 8.6%) are the most common fields of study among 339 individuals in Key Colony Beach who have obtained a bachelor's degree or higher.
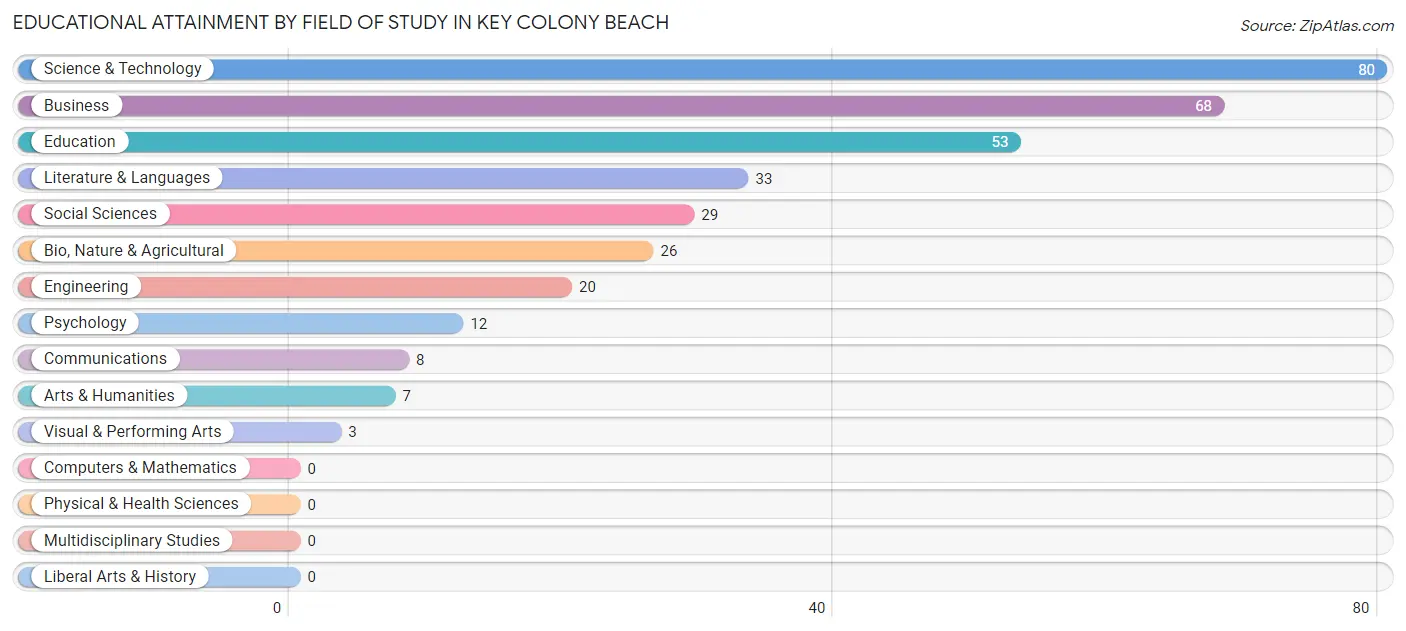
| Field of Study | # Graduates | % Graduates |
| Computers & Mathematics | 0 | 0.0% |
| Bio, Nature & Agricultural | 26 | 7.7% |
| Physical & Health Sciences | 0 | 0.0% |
| Psychology | 12 | 3.5% |
| Social Sciences | 29 | 8.6% |
| Engineering | 20 | 5.9% |
| Multidisciplinary Studies | 0 | 0.0% |
| Science & Technology | 80 | 23.6% |
| Business | 68 | 20.1% |
| Education | 53 | 15.6% |
| Literature & Languages | 33 | 9.7% |
| Liberal Arts & History | 0 | 0.0% |
| Visual & Performing Arts | 3 | 0.9% |
| Communications | 8 | 2.4% |
| Arts & Humanities | 7 | 2.1% |
| Total | 339 | 100.0% |
Transportation & Commute in Key Colony Beach
Vehicle Availability by Sex in Key Colony Beach
The most prevalent vehicle ownership categories in Key Colony Beach are males with 1 vehicle (87, accounting for 60.4%) and females with 1 vehicle (64, making up 71.3%).
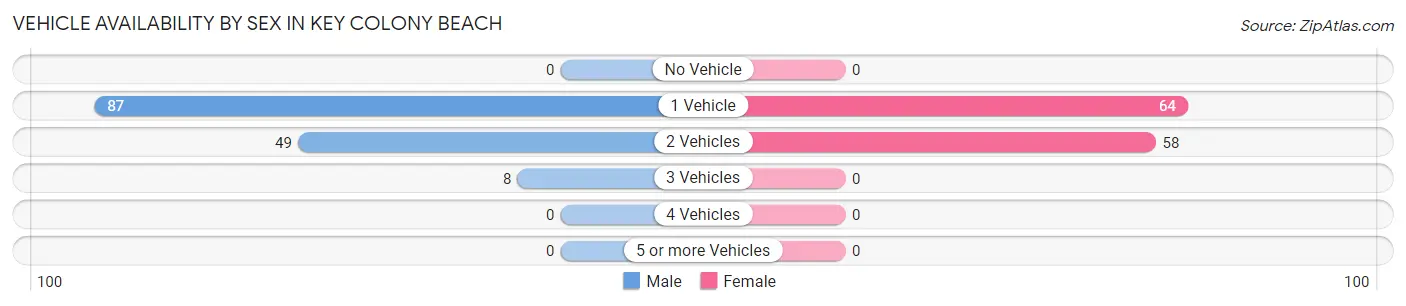
| Vehicles Available | Male | Female |
| No Vehicle | 0 (0.0%) | 0 (0.0%) |
| 1 Vehicle | 87 (60.4%) | 64 (52.5%) |
| 2 Vehicles | 49 (34.0%) | 58 (47.5%) |
| 3 Vehicles | 8 (5.6%) | 0 (0.0%) |
| 4 Vehicles | 0 (0.0%) | 0 (0.0%) |
| 5 or more Vehicles | 0 (0.0%) | 0 (0.0%) |
| Total | 144 (100.0%) | 122 (100.0%) |
Commute Time in Key Colony Beach
The most frequently occuring commute durations in Key Colony Beach are 10 to 14 minutes (75 commuters, 33.3%), 5 to 9 minutes (62 commuters, 27.6%), and 15 to 19 minutes (55 commuters, 24.4%).
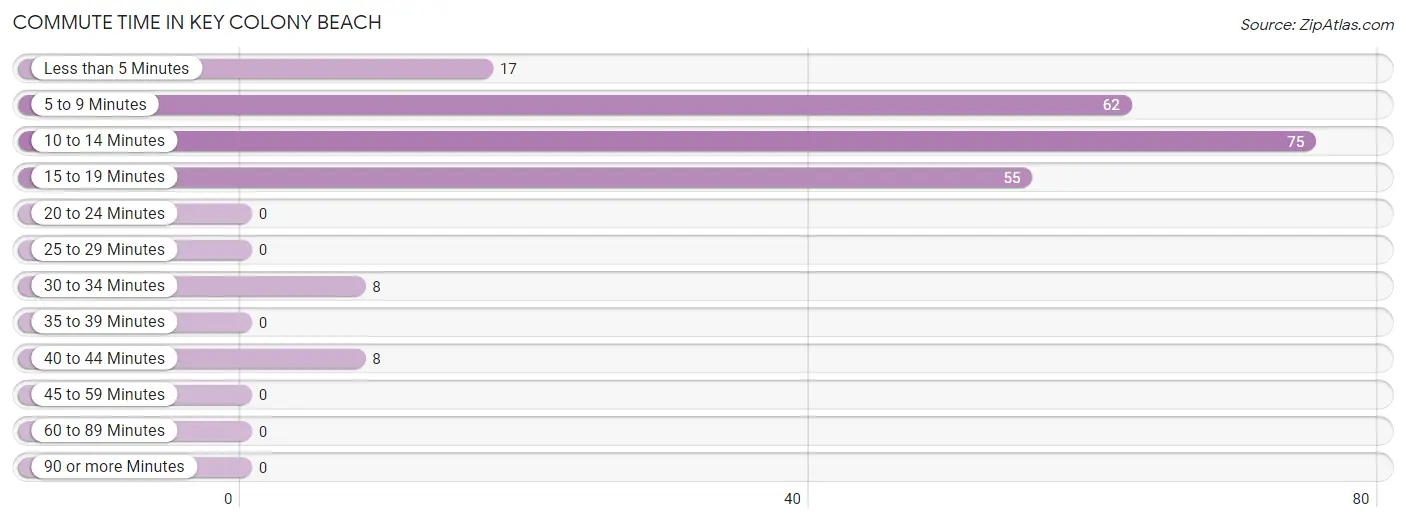
| Commute Time | # Commuters | % Commuters |
| Less than 5 Minutes | 17 | 7.6% |
| 5 to 9 Minutes | 62 | 27.6% |
| 10 to 14 Minutes | 75 | 33.3% |
| 15 to 19 Minutes | 55 | 24.4% |
| 20 to 24 Minutes | 0 | 0.0% |
| 25 to 29 Minutes | 0 | 0.0% |
| 30 to 34 Minutes | 8 | 3.6% |
| 35 to 39 Minutes | 0 | 0.0% |
| 40 to 44 Minutes | 8 | 3.6% |
| 45 to 59 Minutes | 0 | 0.0% |
| 60 to 89 Minutes | 0 | 0.0% |
| 90 or more Minutes | 0 | 0.0% |
Commute Time by Sex in Key Colony Beach
The most common commute times in Key Colony Beach are 10 to 14 minutes (57 commuters, 42.5%) for males and 15 to 19 minutes (31 commuters, 34.1%) for females.
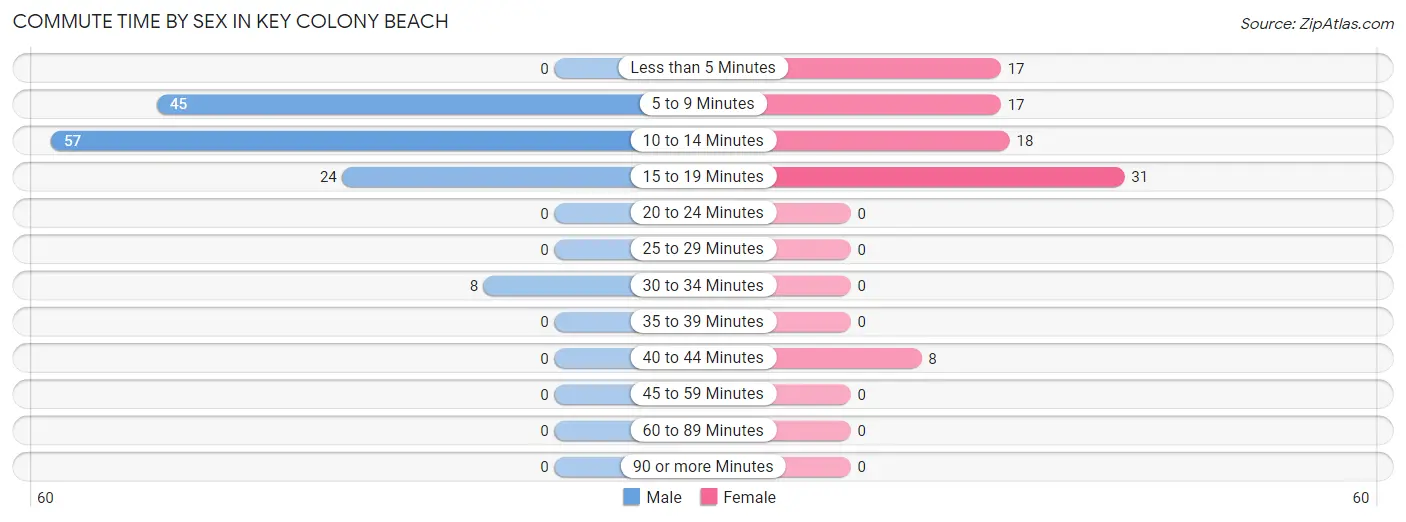
| Commute Time | Male | Female |
| Less than 5 Minutes | 0 (0.0%) | 17 (18.7%) |
| 5 to 9 Minutes | 45 (33.6%) | 17 (18.7%) |
| 10 to 14 Minutes | 57 (42.5%) | 18 (19.8%) |
| 15 to 19 Minutes | 24 (17.9%) | 31 (34.1%) |
| 20 to 24 Minutes | 0 (0.0%) | 0 (0.0%) |
| 25 to 29 Minutes | 0 (0.0%) | 0 (0.0%) |
| 30 to 34 Minutes | 8 (6.0%) | 0 (0.0%) |
| 35 to 39 Minutes | 0 (0.0%) | 0 (0.0%) |
| 40 to 44 Minutes | 0 (0.0%) | 8 (8.8%) |
| 45 to 59 Minutes | 0 (0.0%) | 0 (0.0%) |
| 60 to 89 Minutes | 0 (0.0%) | 0 (0.0%) |
| 90 or more Minutes | 0 (0.0%) | 0 (0.0%) |
Time of Departure to Work by Sex in Key Colony Beach
The most frequent times of departure to work in Key Colony Beach are 8:00 AM to 8:29 AM (68, 50.7%) for males and 8:00 AM to 8:29 AM (21, 23.1%) for females.
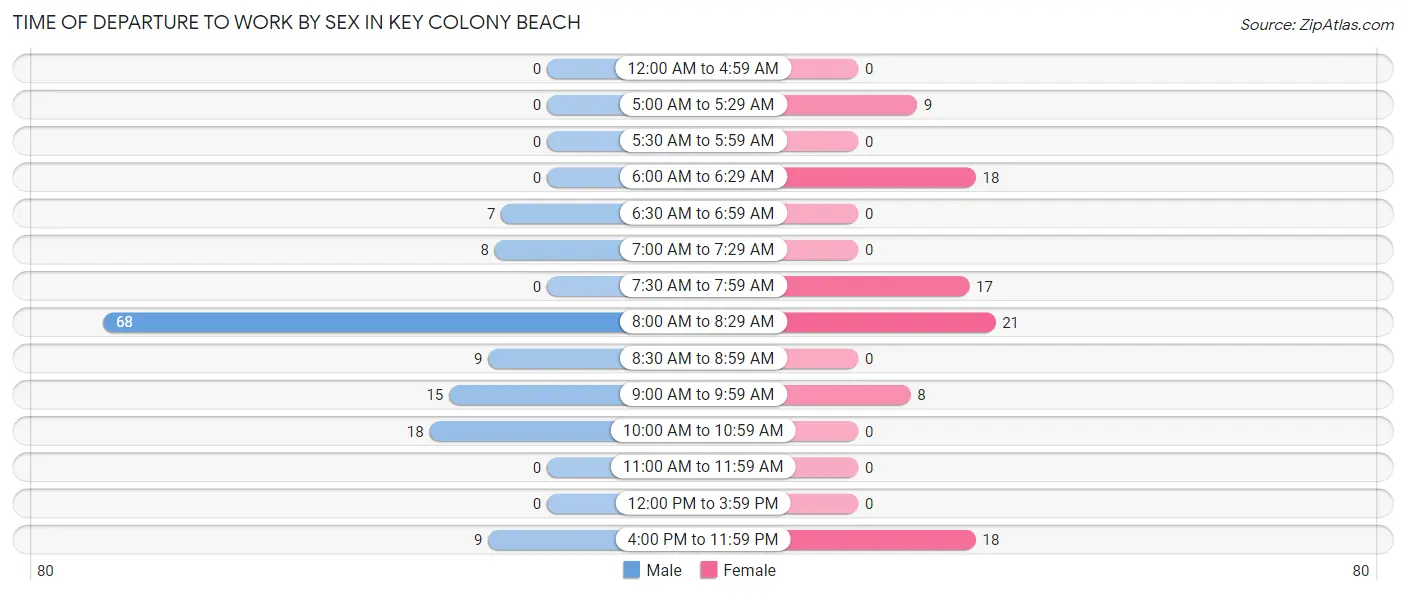
| Time of Departure | Male | Female |
| 12:00 AM to 4:59 AM | 0 (0.0%) | 0 (0.0%) |
| 5:00 AM to 5:29 AM | 0 (0.0%) | 9 (9.9%) |
| 5:30 AM to 5:59 AM | 0 (0.0%) | 0 (0.0%) |
| 6:00 AM to 6:29 AM | 0 (0.0%) | 18 (19.8%) |
| 6:30 AM to 6:59 AM | 7 (5.2%) | 0 (0.0%) |
| 7:00 AM to 7:29 AM | 8 (6.0%) | 0 (0.0%) |
| 7:30 AM to 7:59 AM | 0 (0.0%) | 17 (18.7%) |
| 8:00 AM to 8:29 AM | 68 (50.7%) | 21 (23.1%) |
| 8:30 AM to 8:59 AM | 9 (6.7%) | 0 (0.0%) |
| 9:00 AM to 9:59 AM | 15 (11.2%) | 8 (8.8%) |
| 10:00 AM to 10:59 AM | 18 (13.4%) | 0 (0.0%) |
| 11:00 AM to 11:59 AM | 0 (0.0%) | 0 (0.0%) |
| 12:00 PM to 3:59 PM | 0 (0.0%) | 0 (0.0%) |
| 4:00 PM to 11:59 PM | 9 (6.7%) | 18 (19.8%) |
| Total | 134 (100.0%) | 91 (100.0%) |
Housing Occupancy in Key Colony Beach
Occupancy by Ownership in Key Colony Beach
Of the total 367 dwellings in Key Colony Beach, owner-occupied units account for 268 (73.0%), while renter-occupied units make up 99 (27.0%).
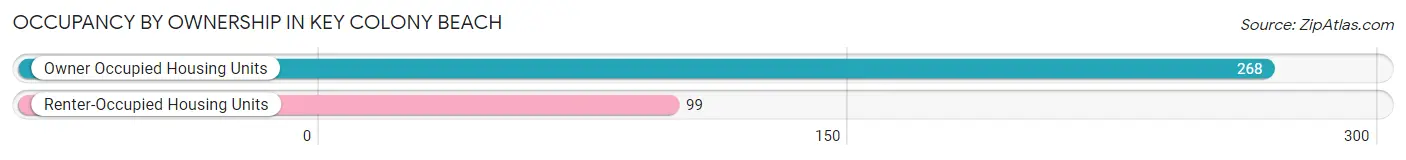
| Occupancy | # Housing Units | % Housing Units |
| Owner Occupied Housing Units | 268 | 73.0% |
| Renter-Occupied Housing Units | 99 | 27.0% |
| Total Occupied Housing Units | 367 | 100.0% |
Occupancy by Household Size in Key Colony Beach
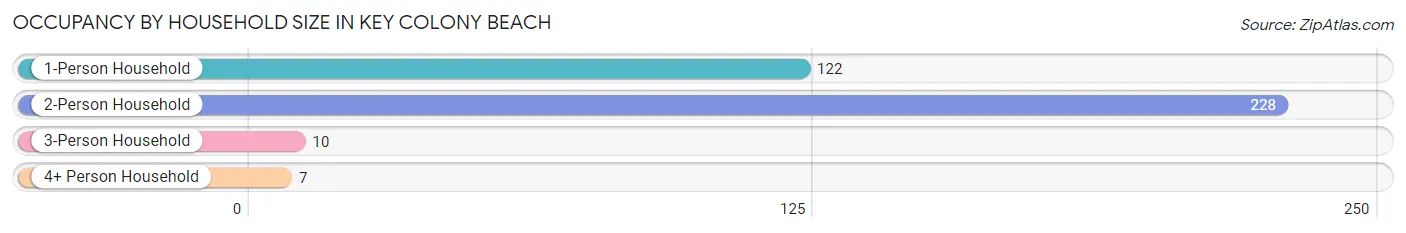
| Household Size | # Housing Units | % Housing Units |
| 1-Person Household | 122 | 33.2% |
| 2-Person Household | 228 | 62.1% |
| 3-Person Household | 10 | 2.7% |
| 4+ Person Household | 7 | 1.9% |
| Total Housing Units | 367 | 100.0% |
Occupancy by Ownership by Household Size in Key Colony Beach
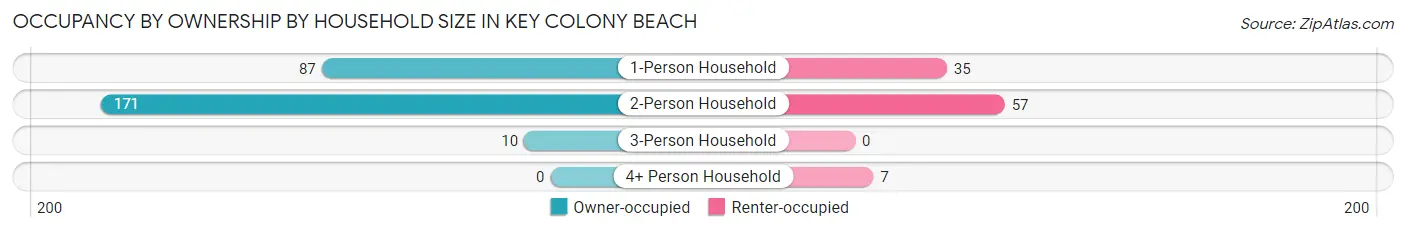
| Household Size | Owner-occupied | Renter-occupied |
| 1-Person Household | 87 (71.3%) | 35 (28.7%) |
| 2-Person Household | 171 (75.0%) | 57 (25.0%) |
| 3-Person Household | 10 (100.0%) | 0 (0.0%) |
| 4+ Person Household | 0 (0.0%) | 7 (100.0%) |
| Total Housing Units | 268 (73.0%) | 99 (27.0%) |
Occupancy by Educational Attainment in Key Colony Beach
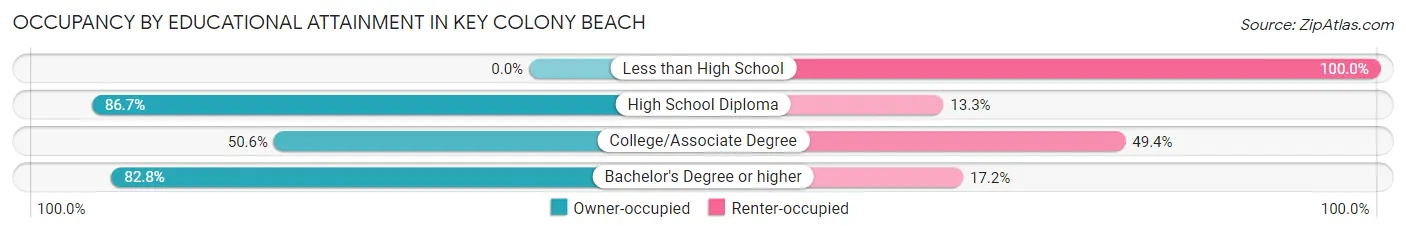
| Household Size | Owner-occupied | Renter-occupied |
| Less than High School | 0 (0.0%) | 13 (100.0%) |
| High School Diploma | 52 (86.7%) | 8 (13.3%) |
| College/Associate Degree | 43 (50.6%) | 42 (49.4%) |
| Bachelor's Degree or higher | 173 (82.8%) | 36 (17.2%) |
Occupancy by Age of Householder in Key Colony Beach
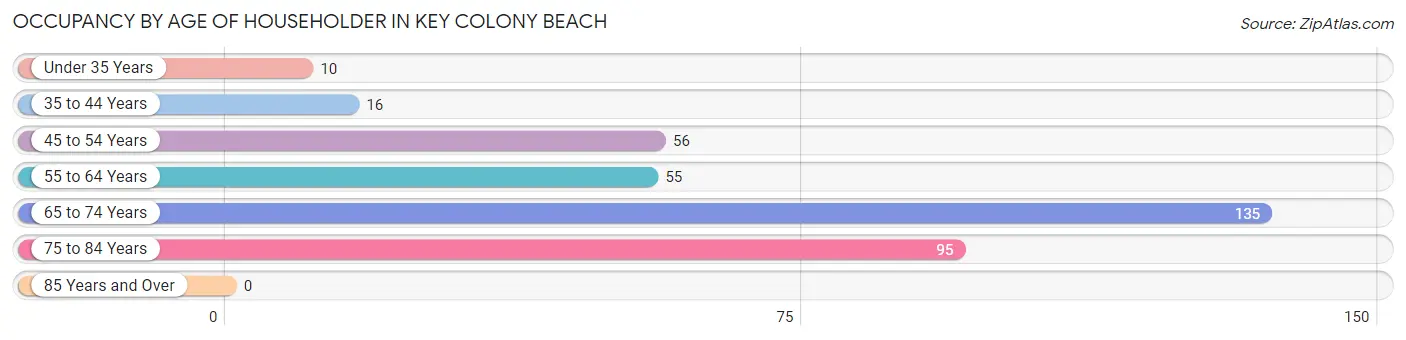
| Age Bracket | # Households | % Households |
| Under 35 Years | 10 | 2.7% |
| 35 to 44 Years | 16 | 4.4% |
| 45 to 54 Years | 56 | 15.3% |
| 55 to 64 Years | 55 | 15.0% |
| 65 to 74 Years | 135 | 36.8% |
| 75 to 84 Years | 95 | 25.9% |
| 85 Years and Over | 0 | 0.0% |
| Total | 367 | 100.0% |
Housing Finances in Key Colony Beach
Median Income by Occupancy in Key Colony Beach
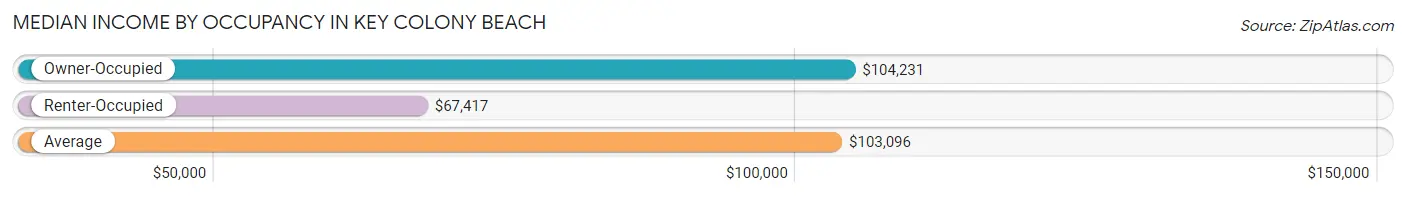
| Occupancy Type | # Households | Median Income |
| Owner-Occupied | 268 (73.0%) | $104,231 |
| Renter-Occupied | 99 (27.0%) | $67,417 |
| Average | 367 (100.0%) | $103,096 |
Occupancy by Householder Income Bracket in Key Colony Beach
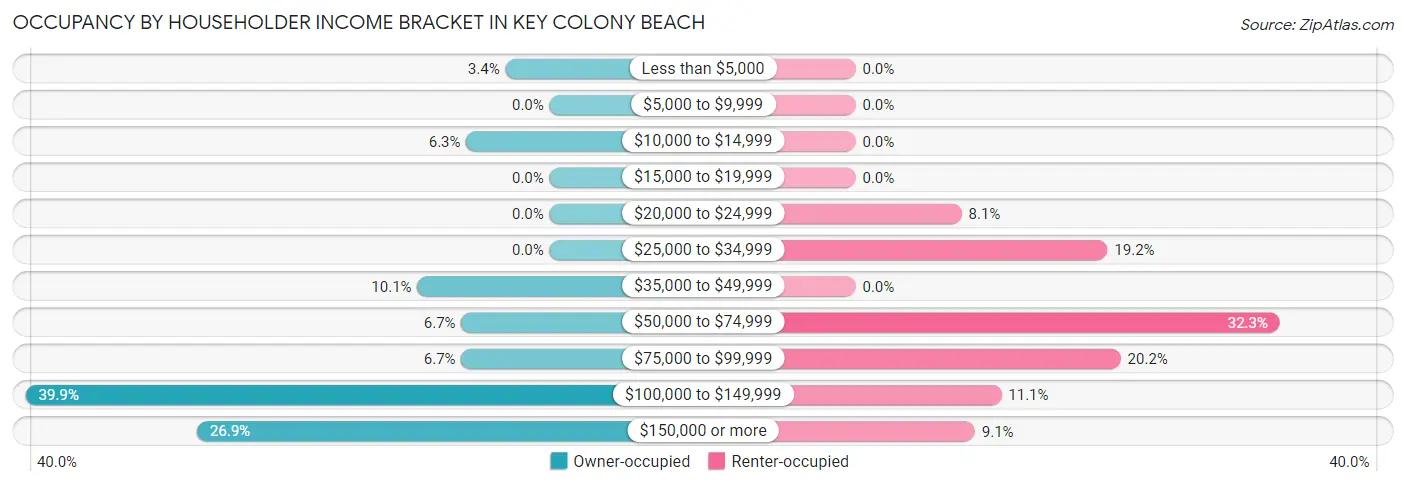
| Income Bracket | Owner-occupied | Renter-occupied |
| Less than $5,000 | 9 (3.4%) | 0 (0.0%) |
| $5,000 to $9,999 | 0 (0.0%) | 0 (0.0%) |
| $10,000 to $14,999 | 17 (6.3%) | 0 (0.0%) |
| $15,000 to $19,999 | 0 (0.0%) | 0 (0.0%) |
| $20,000 to $24,999 | 0 (0.0%) | 8 (8.1%) |
| $25,000 to $34,999 | 0 (0.0%) | 19 (19.2%) |
| $35,000 to $49,999 | 27 (10.1%) | 0 (0.0%) |
| $50,000 to $74,999 | 18 (6.7%) | 32 (32.3%) |
| $75,000 to $99,999 | 18 (6.7%) | 20 (20.2%) |
| $100,000 to $149,999 | 107 (39.9%) | 11 (11.1%) |
| $150,000 or more | 72 (26.9%) | 9 (9.1%) |
| Total | 268 (100.0%) | 99 (100.0%) |
Monthly Housing Cost Tiers in Key Colony Beach
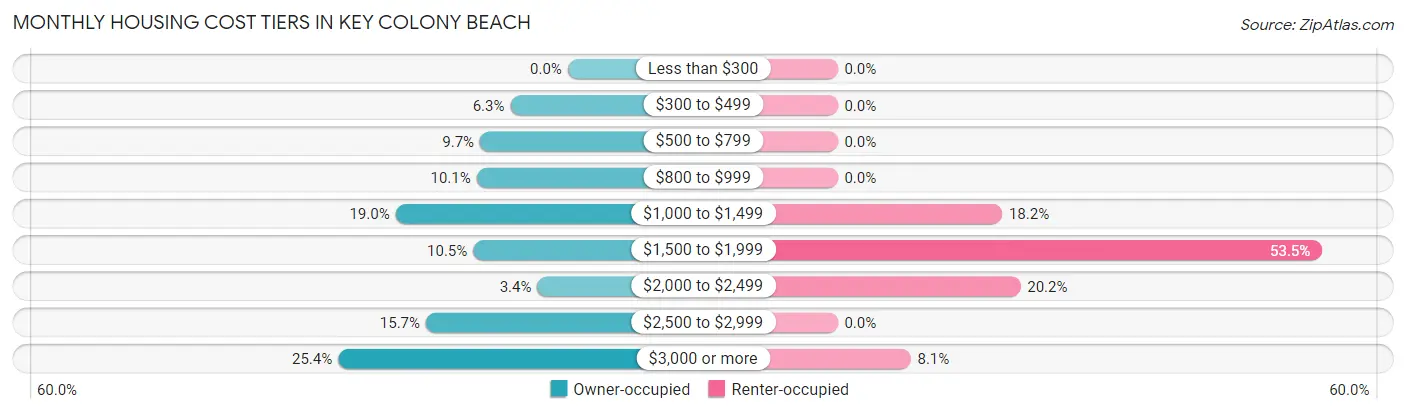
| Monthly Cost | Owner-occupied | Renter-occupied |
| Less than $300 | 0 (0.0%) | 0 (0.0%) |
| $300 to $499 | 17 (6.3%) | 0 (0.0%) |
| $500 to $799 | 26 (9.7%) | 0 (0.0%) |
| $800 to $999 | 27 (10.1%) | 0 (0.0%) |
| $1,000 to $1,499 | 51 (19.0%) | 18 (18.2%) |
| $1,500 to $1,999 | 28 (10.4%) | 53 (53.5%) |
| $2,000 to $2,499 | 9 (3.4%) | 20 (20.2%) |
| $2,500 to $2,999 | 42 (15.7%) | 0 (0.0%) |
| $3,000 or more | 68 (25.4%) | 8 (8.1%) |
| Total | 268 (100.0%) | 99 (100.0%) |
Physical Housing Characteristics in Key Colony Beach
Housing Structures in Key Colony Beach
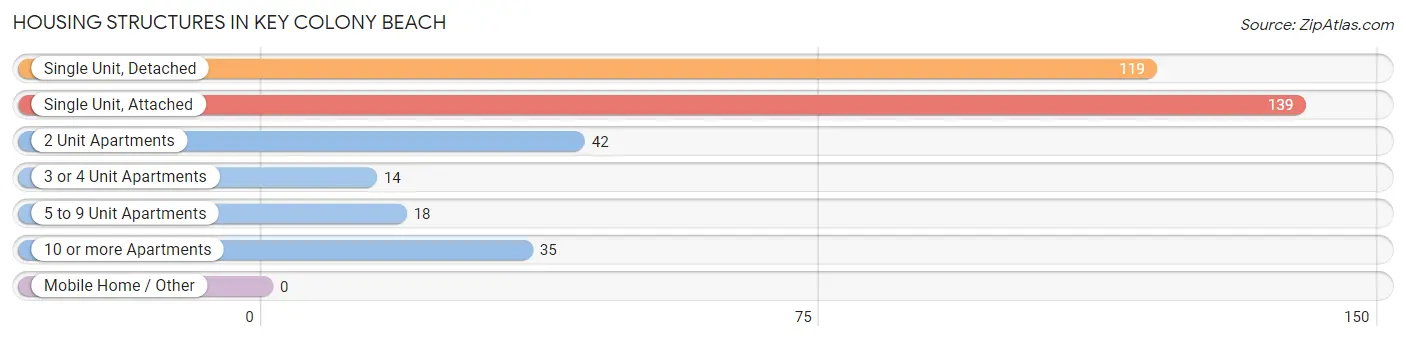
| Structure Type | # Housing Units | % Housing Units |
| Single Unit, Detached | 119 | 32.4% |
| Single Unit, Attached | 139 | 37.9% |
| 2 Unit Apartments | 42 | 11.4% |
| 3 or 4 Unit Apartments | 14 | 3.8% |
| 5 to 9 Unit Apartments | 18 | 4.9% |
| 10 or more Apartments | 35 | 9.5% |
| Mobile Home / Other | 0 | 0.0% |
| Total | 367 | 100.0% |
Housing Structures by Occupancy in Key Colony Beach
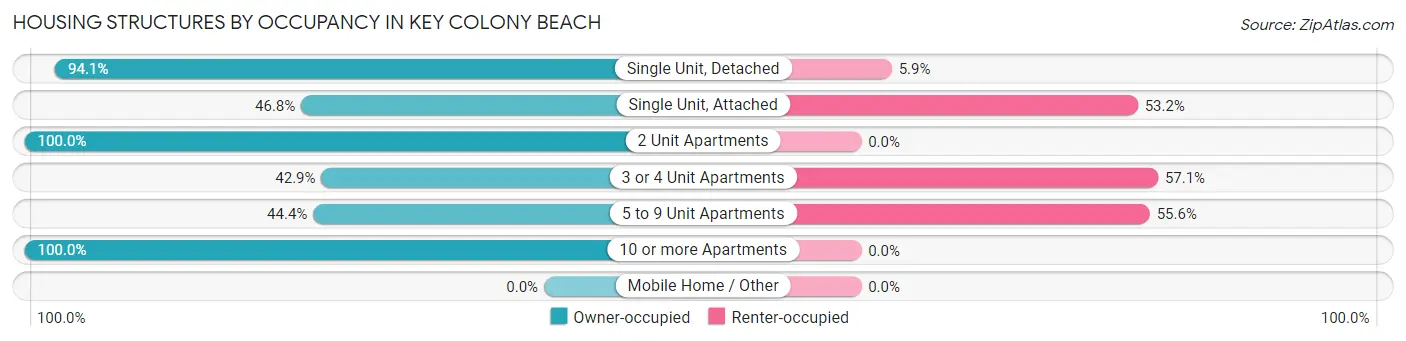
| Structure Type | Owner-occupied | Renter-occupied |
| Single Unit, Detached | 112 (94.1%) | 7 (5.9%) |
| Single Unit, Attached | 65 (46.8%) | 74 (53.2%) |
| 2 Unit Apartments | 42 (100.0%) | 0 (0.0%) |
| 3 or 4 Unit Apartments | 6 (42.9%) | 8 (57.1%) |
| 5 to 9 Unit Apartments | 8 (44.4%) | 10 (55.6%) |
| 10 or more Apartments | 35 (100.0%) | 0 (0.0%) |
| Mobile Home / Other | 0 (0.0%) | 0 (0.0%) |
| Total | 268 (73.0%) | 99 (27.0%) |
Housing Structures by Number of Rooms in Key Colony Beach
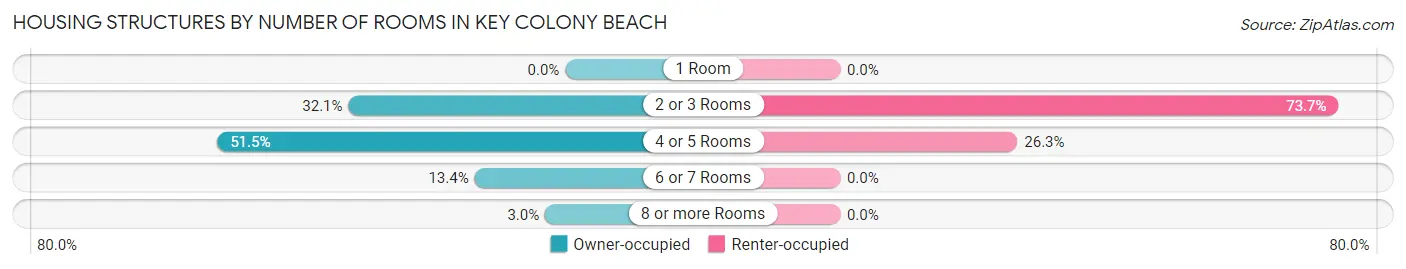
| Number of Rooms | Owner-occupied | Renter-occupied |
| 1 Room | 0 (0.0%) | 0 (0.0%) |
| 2 or 3 Rooms | 86 (32.1%) | 73 (73.7%) |
| 4 or 5 Rooms | 138 (51.5%) | 26 (26.3%) |
| 6 or 7 Rooms | 36 (13.4%) | 0 (0.0%) |
| 8 or more Rooms | 8 (3.0%) | 0 (0.0%) |
| Total | 268 (100.0%) | 99 (100.0%) |
Housing Structure by Heating Type in Key Colony Beach
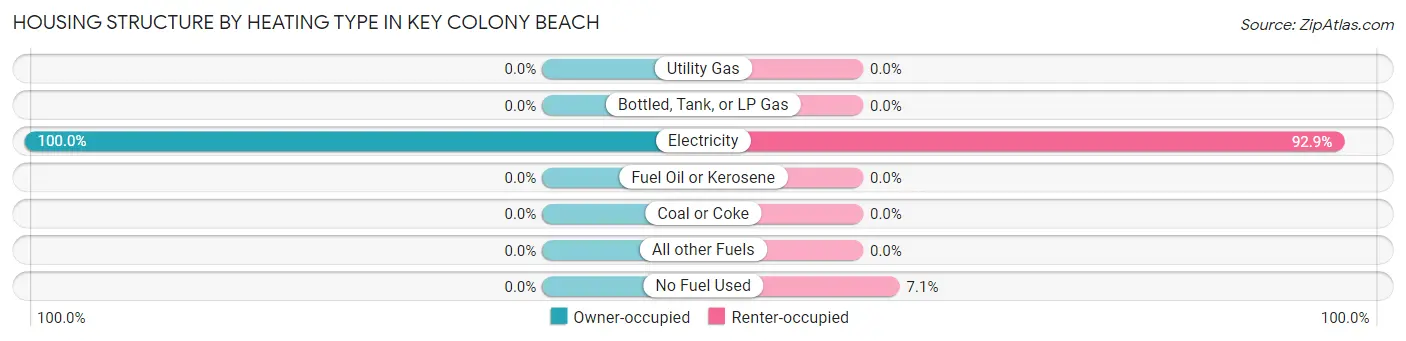
| Heating Type | Owner-occupied | Renter-occupied |
| Utility Gas | 0 (0.0%) | 0 (0.0%) |
| Bottled, Tank, or LP Gas | 0 (0.0%) | 0 (0.0%) |
| Electricity | 268 (100.0%) | 92 (92.9%) |
| Fuel Oil or Kerosene | 0 (0.0%) | 0 (0.0%) |
| Coal or Coke | 0 (0.0%) | 0 (0.0%) |
| All other Fuels | 0 (0.0%) | 0 (0.0%) |
| No Fuel Used | 0 (0.0%) | 7 (7.1%) |
| Total | 268 (100.0%) | 99 (100.0%) |
Household Vehicle Usage in Key Colony Beach
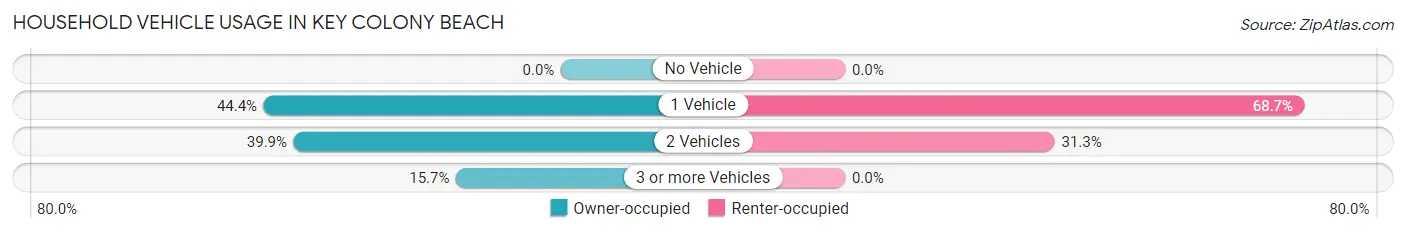
| Vehicles per Household | Owner-occupied | Renter-occupied |
| No Vehicle | 0 (0.0%) | 0 (0.0%) |
| 1 Vehicle | 119 (44.4%) | 68 (68.7%) |
| 2 Vehicles | 107 (39.9%) | 31 (31.3%) |
| 3 or more Vehicles | 42 (15.7%) | 0 (0.0%) |
| Total | 268 (100.0%) | 99 (100.0%) |
Real Estate & Mortgages in Key Colony Beach
Real Estate and Mortgage Overview in Key Colony Beach
| Characteristic | Without Mortgage | With Mortgage |
| Housing Units | 157 | 111 |
| Median Property Value | $922,500 | $718,800 |
| Median Household Income | $137,639 | $18 |
| Monthly Housing Costs | $1,047 | $60 |
| Real Estate Taxes | $5,799 | $0 |
Property Value by Mortgage Status in Key Colony Beach
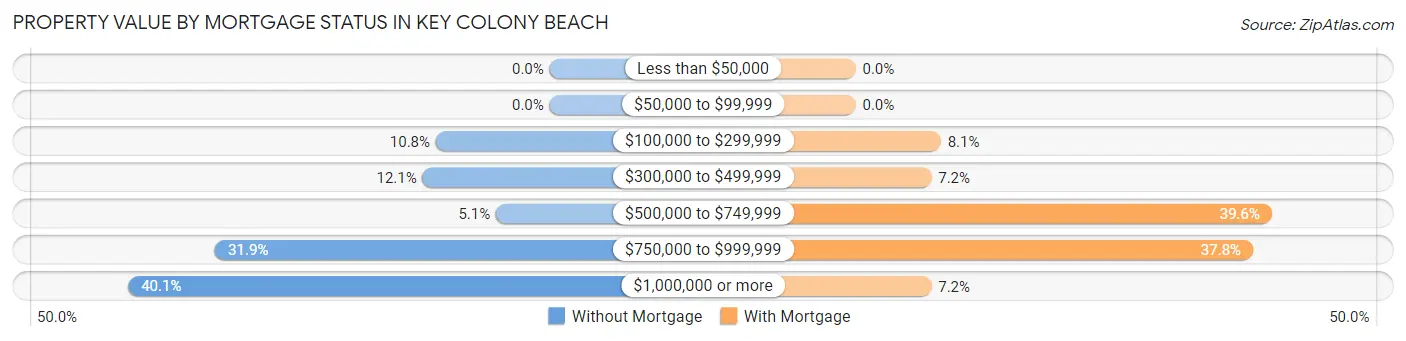
| Property Value | Without Mortgage | With Mortgage |
| Less than $50,000 | 0 (0.0%) | 0 (0.0%) |
| $50,000 to $99,999 | 0 (0.0%) | 0 (0.0%) |
| $100,000 to $299,999 | 17 (10.8%) | 9 (8.1%) |
| $300,000 to $499,999 | 19 (12.1%) | 8 (7.2%) |
| $500,000 to $749,999 | 8 (5.1%) | 44 (39.6%) |
| $750,000 to $999,999 | 50 (31.9%) | 42 (37.8%) |
| $1,000,000 or more | 63 (40.1%) | 8 (7.2%) |
| Total | 157 (100.0%) | 111 (100.0%) |
Household Income by Mortgage Status in Key Colony Beach
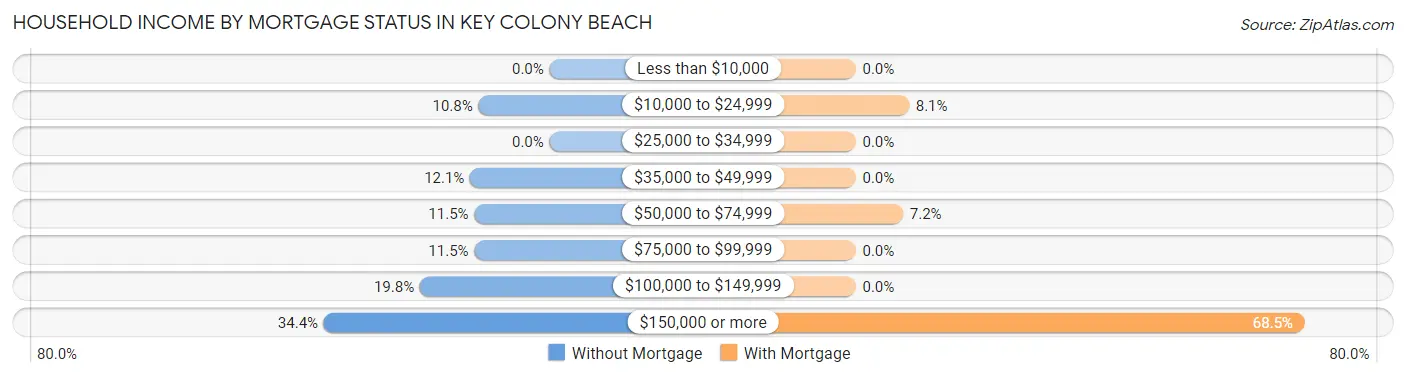
| Household Income | Without Mortgage | With Mortgage |
| Less than $10,000 | 0 (0.0%) | 0 (0.0%) |
| $10,000 to $24,999 | 17 (10.8%) | 9 (8.1%) |
| $25,000 to $34,999 | 0 (0.0%) | 0 (0.0%) |
| $35,000 to $49,999 | 19 (12.1%) | 0 (0.0%) |
| $50,000 to $74,999 | 18 (11.5%) | 8 (7.2%) |
| $75,000 to $99,999 | 18 (11.5%) | 0 (0.0%) |
| $100,000 to $149,999 | 31 (19.8%) | 0 (0.0%) |
| $150,000 or more | 54 (34.4%) | 76 (68.5%) |
| Total | 157 (100.0%) | 111 (100.0%) |
Property Value to Household Income Ratio in Key Colony Beach
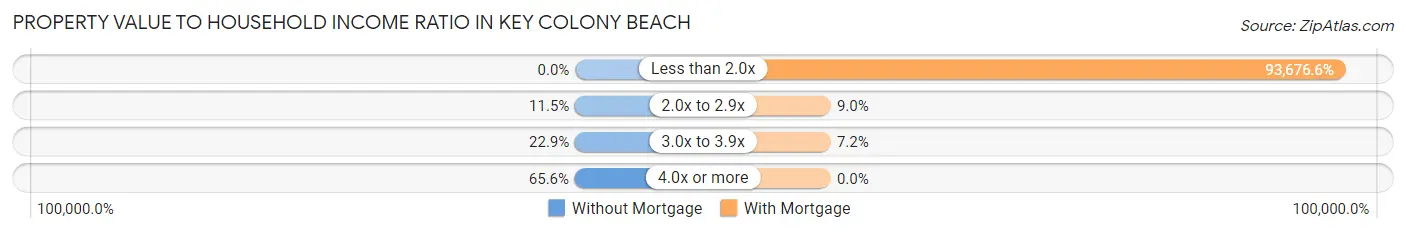
| Value-to-Income Ratio | Without Mortgage | With Mortgage |
| Less than 2.0x | 0 (0.0%) | 103,981 (93,676.6%) |
| 2.0x to 2.9x | 18 (11.5%) | 10 (9.0%) |
| 3.0x to 3.9x | 36 (22.9%) | 8 (7.2%) |
| 4.0x or more | 103 (65.6%) | 0 (0.0%) |
| Total | 157 (100.0%) | 111 (100.0%) |
Real Estate Taxes by Mortgage Status in Key Colony Beach
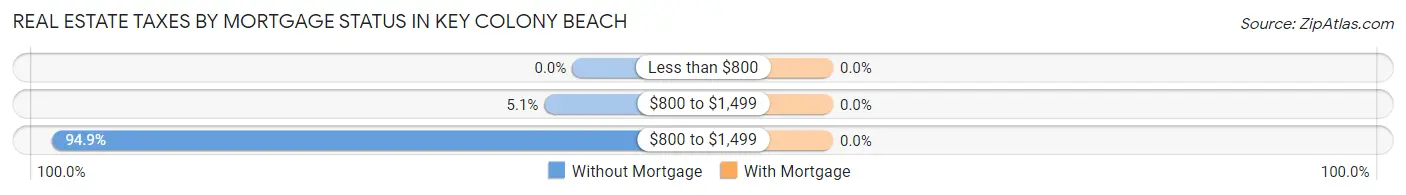
| Property Taxes | Without Mortgage | With Mortgage |
| Less than $800 | 0 (0.0%) | 0 (0.0%) |
| $800 to $1,499 | 8 (5.1%) | 0 (0.0%) |
| $800 to $1,499 | 149 (94.9%) | 0 (0.0%) |
| Total | 157 (100.0%) | 111 (100.0%) |
Health & Disability in Key Colony Beach
Health Insurance Coverage by Age in Key Colony Beach
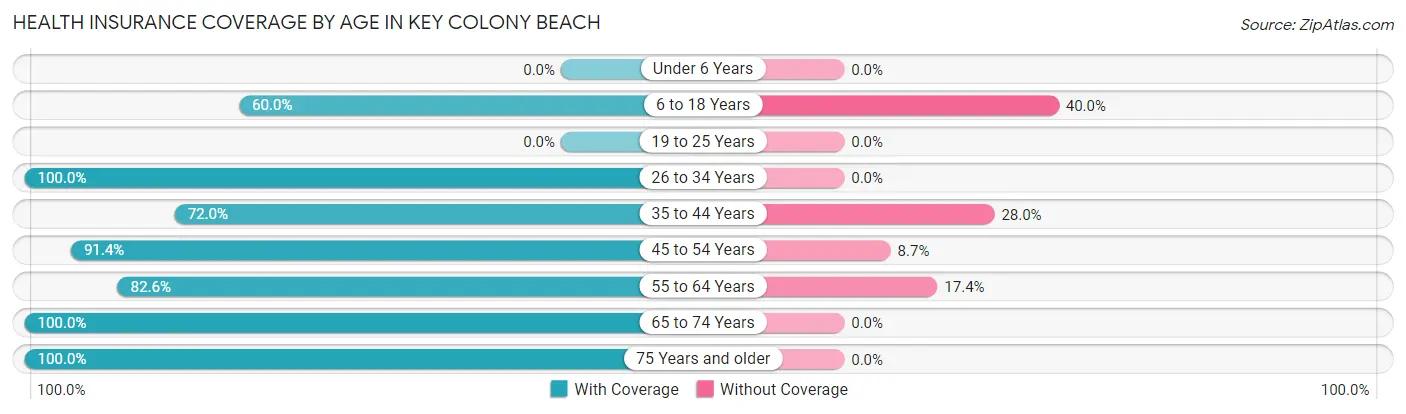
| Age Bracket | With Coverage | Without Coverage |
| Under 6 Years | 0 (0.0%) | 0 (0.0%) |
| 6 to 18 Years | 9 (60.0%) | 6 (40.0%) |
| 19 to 25 Years | 0 (0.0%) | 0 (0.0%) |
| 26 to 34 Years | 21 (100.0%) | 0 (0.0%) |
| 35 to 44 Years | 18 (72.0%) | 7 (28.0%) |
| 45 to 54 Years | 95 (91.3%) | 9 (8.6%) |
| 55 to 64 Years | 100 (82.6%) | 21 (17.4%) |
| 65 to 74 Years | 180 (100.0%) | 0 (0.0%) |
| 75 Years and older | 184 (100.0%) | 0 (0.0%) |
| Total | 607 (93.4%) | 43 (6.6%) |
Health Insurance Coverage by Citizenship Status in Key Colony Beach
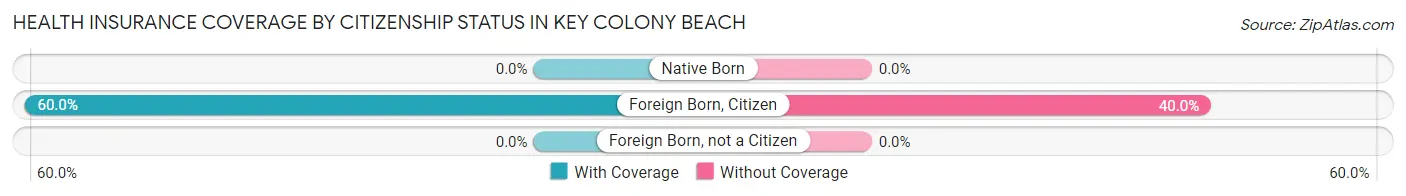
| Citizenship Status | With Coverage | Without Coverage |
| Native Born | 0 (0.0%) | 0 (0.0%) |
| Foreign Born, Citizen | 9 (60.0%) | 6 (40.0%) |
| Foreign Born, not a Citizen | 0 (0.0%) | 0 (0.0%) |
Health Insurance Coverage by Household Income in Key Colony Beach
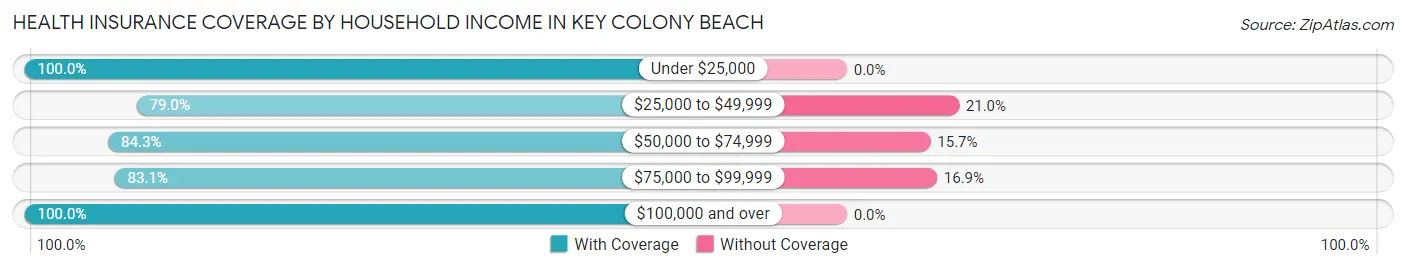
| Household Income | With Coverage | Without Coverage |
| Under $25,000 | 44 (100.0%) | 0 (0.0%) |
| $25,000 to $49,999 | 64 (79.0%) | 17 (21.0%) |
| $50,000 to $74,999 | 70 (84.3%) | 13 (15.7%) |
| $75,000 to $99,999 | 64 (83.1%) | 13 (16.9%) |
| $100,000 and over | 365 (100.0%) | 0 (0.0%) |
Public vs Private Health Insurance Coverage by Age in Key Colony Beach
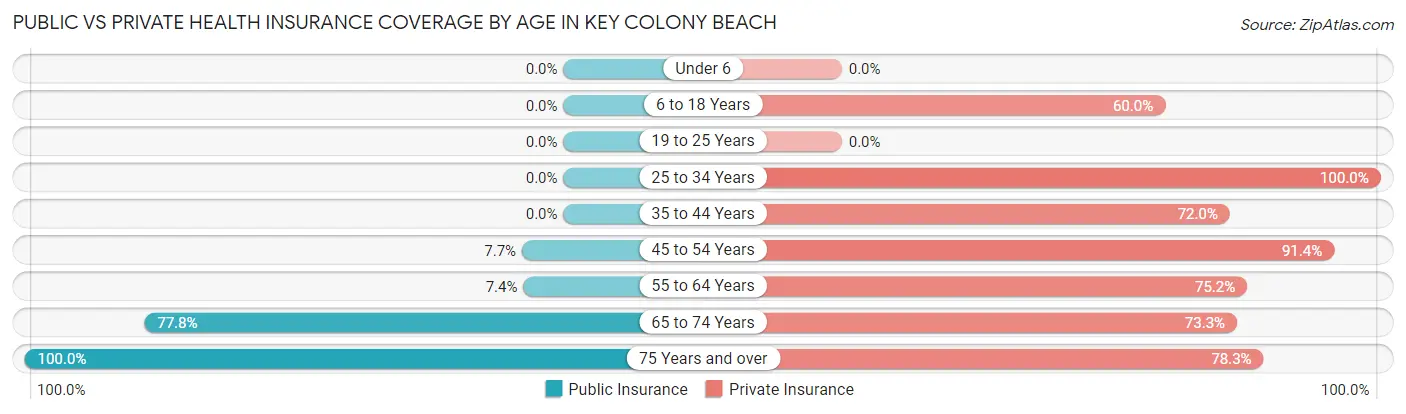
| Age Bracket | Public Insurance | Private Insurance |
| Under 6 | 0 (0.0%) | 0 (0.0%) |
| 6 to 18 Years | 0 (0.0%) | 9 (60.0%) |
| 19 to 25 Years | 0 (0.0%) | 0 (0.0%) |
| 25 to 34 Years | 0 (0.0%) | 21 (100.0%) |
| 35 to 44 Years | 0 (0.0%) | 18 (72.0%) |
| 45 to 54 Years | 8 (7.7%) | 95 (91.3%) |
| 55 to 64 Years | 9 (7.4%) | 91 (75.2%) |
| 65 to 74 Years | 140 (77.8%) | 132 (73.3%) |
| 75 Years and over | 184 (100.0%) | 144 (78.3%) |
| Total | 341 (52.5%) | 510 (78.5%) |
Disability Status by Sex by Age in Key Colony Beach
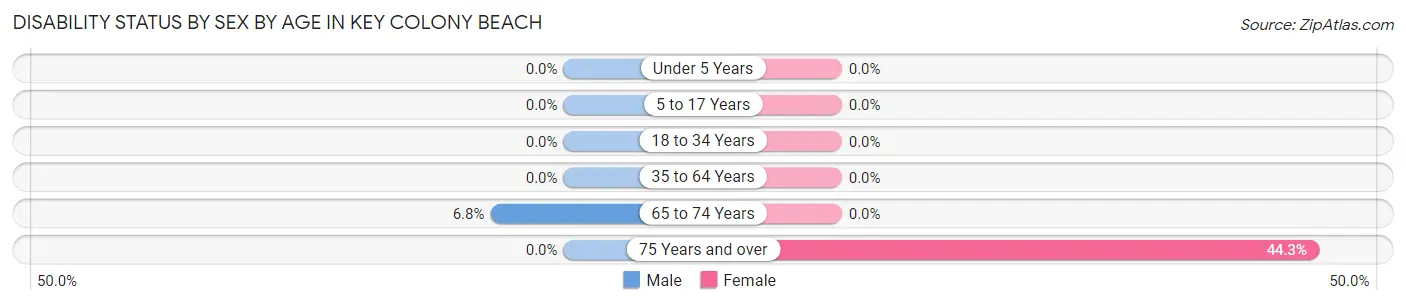
| Age Bracket | Male | Female |
| Under 5 Years | 0 (0.0%) | 0 (0.0%) |
| 5 to 17 Years | 0 (0.0%) | 0 (0.0%) |
| 18 to 34 Years | 0 (0.0%) | 0 (0.0%) |
| 35 to 64 Years | 0 (0.0%) | 0 (0.0%) |
| 65 to 74 Years | 8 (6.8%) | 0 (0.0%) |
| 75 Years and over | 0 (0.0%) | 54 (44.3%) |
Disability Class by Sex by Age in Key Colony Beach
Disability Class: Hearing Difficulty
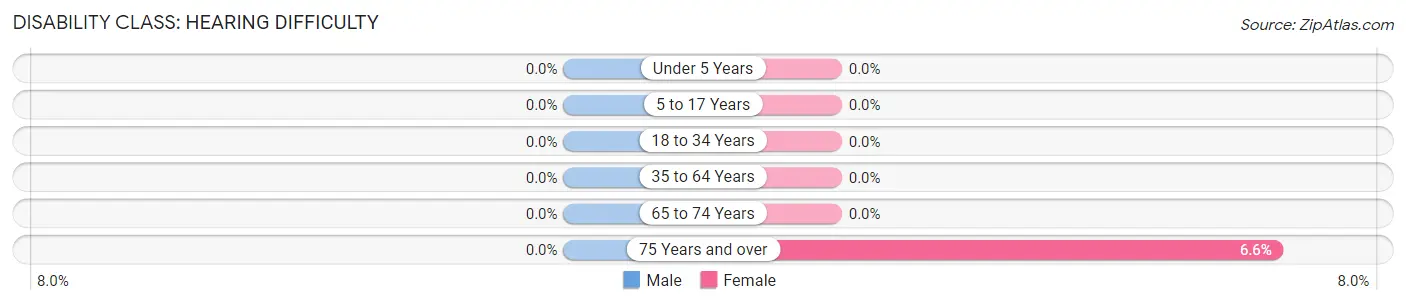
| Age Bracket | Male | Female |
| Under 5 Years | 0 (0.0%) | 0 (0.0%) |
| 5 to 17 Years | 0 (0.0%) | 0 (0.0%) |
| 18 to 34 Years | 0 (0.0%) | 0 (0.0%) |
| 35 to 64 Years | 0 (0.0%) | 0 (0.0%) |
| 65 to 74 Years | 0 (0.0%) | 0 (0.0%) |
| 75 Years and over | 0 (0.0%) | 8 (6.6%) |
Disability Class: Vision Difficulty
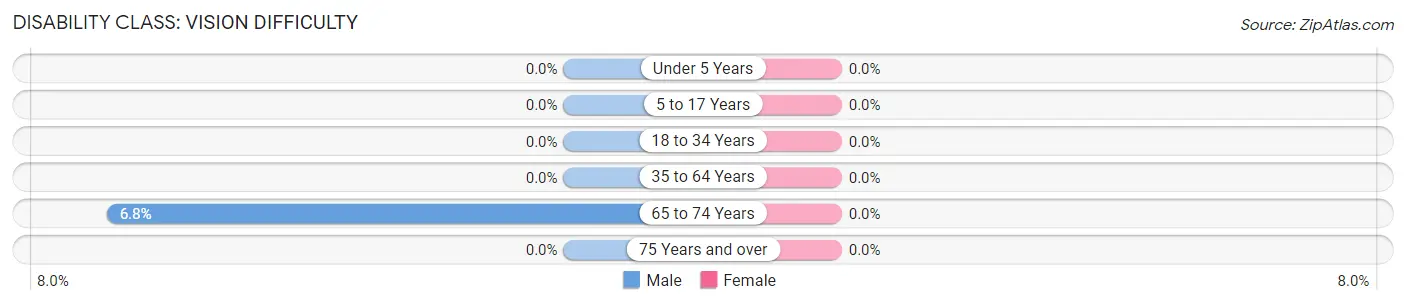
| Age Bracket | Male | Female |
| Under 5 Years | 0 (0.0%) | 0 (0.0%) |
| 5 to 17 Years | 0 (0.0%) | 0 (0.0%) |
| 18 to 34 Years | 0 (0.0%) | 0 (0.0%) |
| 35 to 64 Years | 0 (0.0%) | 0 (0.0%) |
| 65 to 74 Years | 8 (6.8%) | 0 (0.0%) |
| 75 Years and over | 0 (0.0%) | 0 (0.0%) |
Disability Class: Cognitive Difficulty
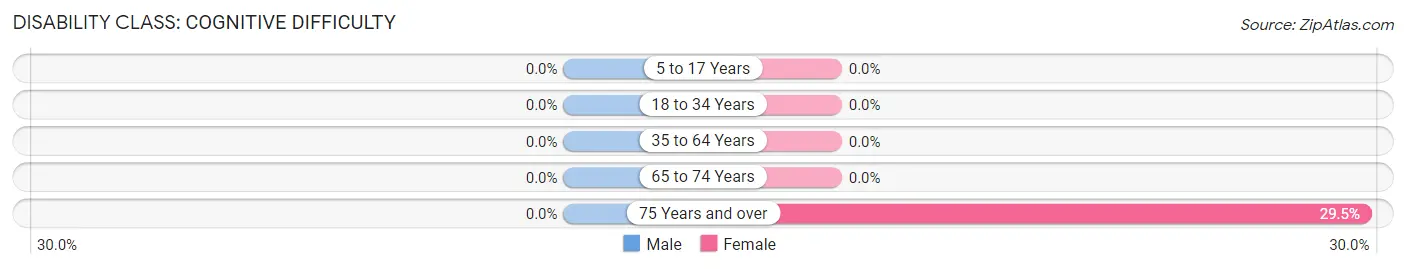
| Age Bracket | Male | Female |
| 5 to 17 Years | 0 (0.0%) | 0 (0.0%) |
| 18 to 34 Years | 0 (0.0%) | 0 (0.0%) |
| 35 to 64 Years | 0 (0.0%) | 0 (0.0%) |
| 65 to 74 Years | 0 (0.0%) | 0 (0.0%) |
| 75 Years and over | 0 (0.0%) | 36 (29.5%) |
Disability Class: Ambulatory Difficulty
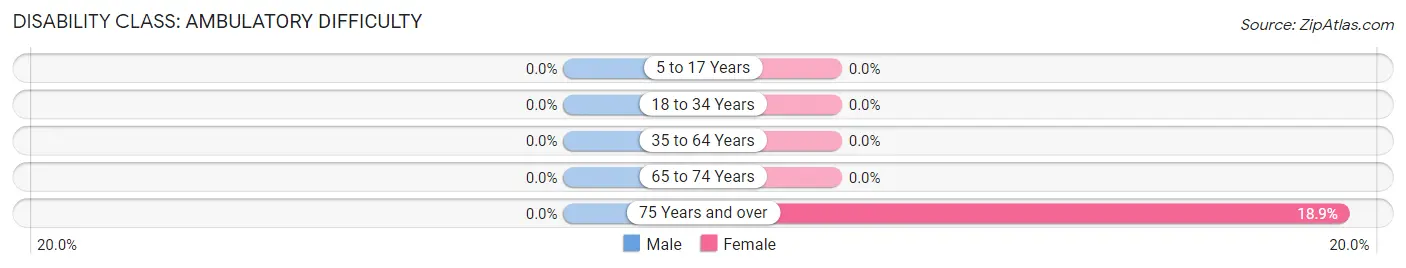
| Age Bracket | Male | Female |
| 5 to 17 Years | 0 (0.0%) | 0 (0.0%) |
| 18 to 34 Years | 0 (0.0%) | 0 (0.0%) |
| 35 to 64 Years | 0 (0.0%) | 0 (0.0%) |
| 65 to 74 Years | 0 (0.0%) | 0 (0.0%) |
| 75 Years and over | 0 (0.0%) | 23 (18.9%) |
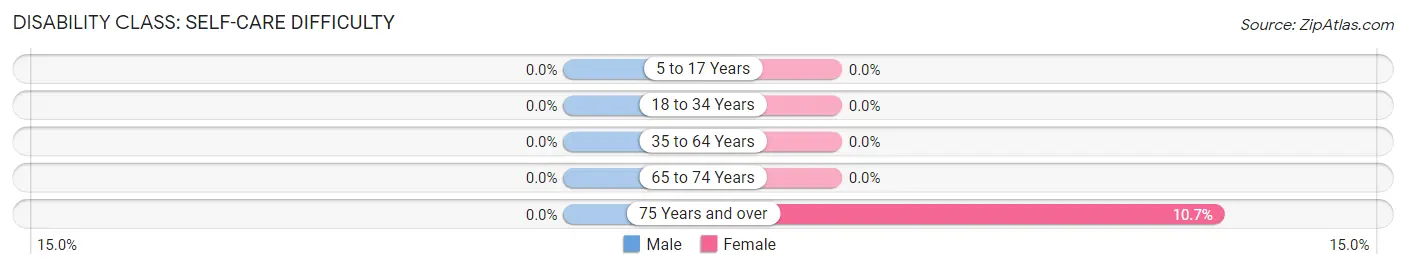
Disability Class: Self-Care Difficulty
| Age Bracket | Male | Female |
| 5 to 17 Years | 0 (0.0%) | 0 (0.0%) |
| 18 to 34 Years | 0 (0.0%) | 0 (0.0%) |
| 35 to 64 Years | 0 (0.0%) | 0 (0.0%) |
| 65 to 74 Years | 0 (0.0%) | 0 (0.0%) |
| 75 Years and over | 0 (0.0%) | 13 (10.7%) |
Technology Access in Key Colony Beach
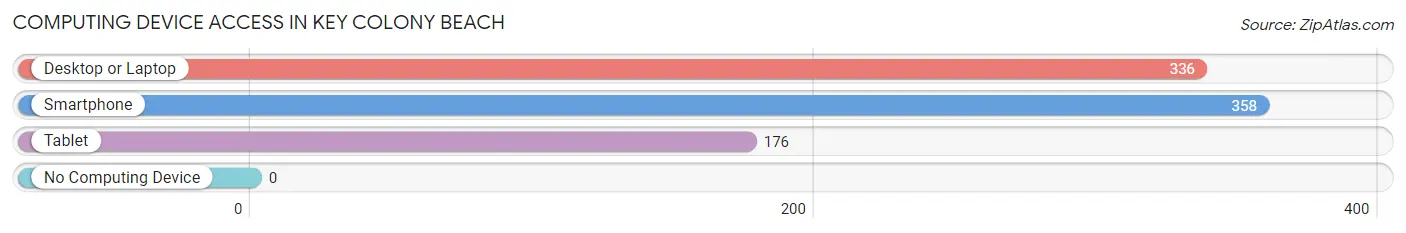
Computing Device Access in Key Colony Beach
| Device Type | # Households | % Households |
| Desktop or Laptop | 336 | 91.5% |
| Smartphone | 358 | 97.6% |
| Tablet | 176 | 48.0% |
| No Computing Device | 0 | 0.0% |
| Total | 367 | 100.0% |
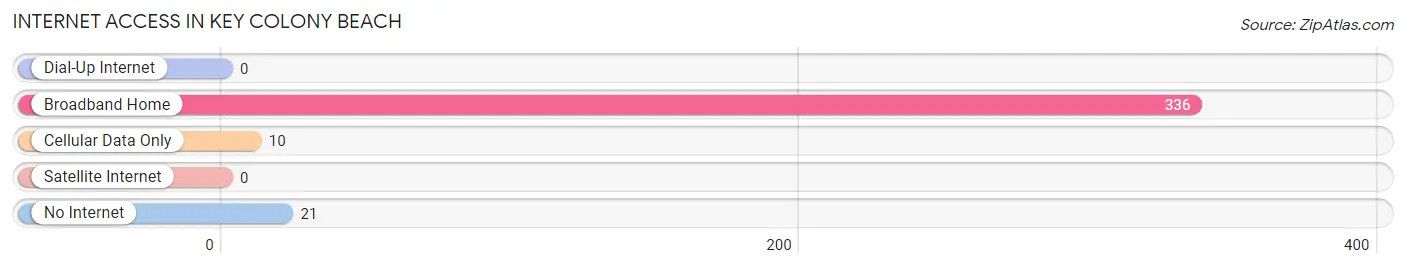
Internet Access in Key Colony Beach
| Internet Type | # Households | % Households |
| Dial-Up Internet | 0 | 0.0% |
| Broadband Home | 336 | 91.5% |
| Cellular Data Only | 10 | 2.7% |
| Satellite Internet | 0 | 0.0% |
| No Internet | 21 | 5.7% |
| Total | 367 | 100.0% |
Key Colony Beach Summary
Key Colony Beach is a small city located in the Florida Keys, a chain of islands off the southern tip of the state of Florida. It is located on the island of Key Vaca, which is part of the Middle Keys. The city is bordered by the Atlantic Ocean to the east and the Gulf of Mexico to the west. The city has a population of about 1,200 people and covers an area of 0.6 square miles.
History
Key Colony Beach was founded in the early 1950s by a group of developers from Miami. The developers purchased the land from the state of Florida and began to develop the area into a resort community. The city was incorporated in 1957 and was named after the nearby Key Colony, which was a fishing village that had been established in the late 1800s.
The city quickly grew in popularity as a vacation destination and by the 1960s, it had become a popular spot for fishing, boating, and other water activities. In the 1970s, the city began to attract more permanent residents and by the 1980s, it had become a popular retirement destination.
Geography
Key Colony Beach is located on the island of Key Vaca, which is part of the Middle Keys. The city is bordered by the Atlantic Ocean to the east and the Gulf of Mexico to the west. The city is located about 25 miles south of Marathon and about 90 miles south of Miami.
The city is located on a narrow strip of land between the Atlantic Ocean and the Gulf of Mexico. The city is surrounded by water on three sides and is connected to the mainland by a bridge. The city is located on a barrier island and is protected from the open ocean by a series of coral reefs.
The city has a tropical climate with hot and humid summers and mild winters. The average temperature in the summer is around 90 degrees Fahrenheit and the average temperature in the winter is around 70 degrees Fahrenheit.
Economy
Key Colony Beach has a thriving economy that is largely based on tourism. The city is a popular destination for fishing, boating, and other water activities. The city also has a number of restaurants, bars, and shops that cater to tourists.
The city also has a number of marinas and boat docks that are used by both tourists and locals. The city also has a number of charter fishing boats that are available for hire.
The city also has a number of real estate developments that are popular with retirees and second home buyers. The city also has a number of condominiums and townhomes that are available for rent or purchase.
Demographics
Key Colony Beach has a population of about 1,200 people. The population is largely made up of retirees and second home buyers. The median age of the population is around 60 years old.
The city is predominantly white with about 90% of the population being white. The remaining 10% of the population is made up of African Americans, Hispanics, and other ethnicities.
The median household income in the city is around $50,000 per year. The median home value in the city is around $400,000.
Conclusion
Key Colony Beach is a small city located in the Florida Keys. The city has a population of about 1,200 people and is a popular destination for fishing, boating, and other water activities. The city has a thriving economy that is largely based on tourism and real estate. The population is largely made up of retirees and second home buyers and the median household income is around $50,000 per year.
Common Questions
What is the Total Population of Key Colony Beach?
Total Population of Key Colony Beach is 650.
What is the Total Male Population of Key Colony Beach?
Total Male Population of Key Colony Beach is 290.
What is the Total Female Population of Key Colony Beach?
Total Female Population of Key Colony Beach is 360.
What is the Ratio of Males per 100 Females in Key Colony Beach?
There are 80.56 Males per 100 Females in Key Colony Beach.
What is the Ratio of Females per 100 Males in Key Colony Beach?
There are 124.14 Females per 100 Males in Key Colony Beach.
What is the Median Population Age in Key Colony Beach?
Median Population Age in Key Colony Beach is 66.7 Years.
What is the Average Family Size in Key Colony Beach
Average Family Size in Key Colony Beach is 2.2 People.
What is the Average Household Size in Key Colony Beach
Average Household Size in Key Colony Beach is 1.8 People.
What is Per Capita Income in Key Colony Beach?
Per Capita income in Key Colony Beach is $67,750.
What is the Median Family Income in Key Colony Beach?
Median Family Income in Key Colony Beach is $120,000.
What is the Median Household income in Key Colony Beach?
Median Household Income in Key Colony Beach is $103,096.
What is Inequality or Gini Index in Key Colony Beach?
Inequality or Gini Index in Key Colony Beach is 0.40.
How Large is the Labor Force in Key Colony Beach?
There are 266 People in the Labor Forcein in Key Colony Beach.
What is the Percentage of People in the Labor Force in Key Colony Beach?
41.5% of People are in the Labor Force in Key Colony Beach.