Marco Island, FL
Marco Island Map
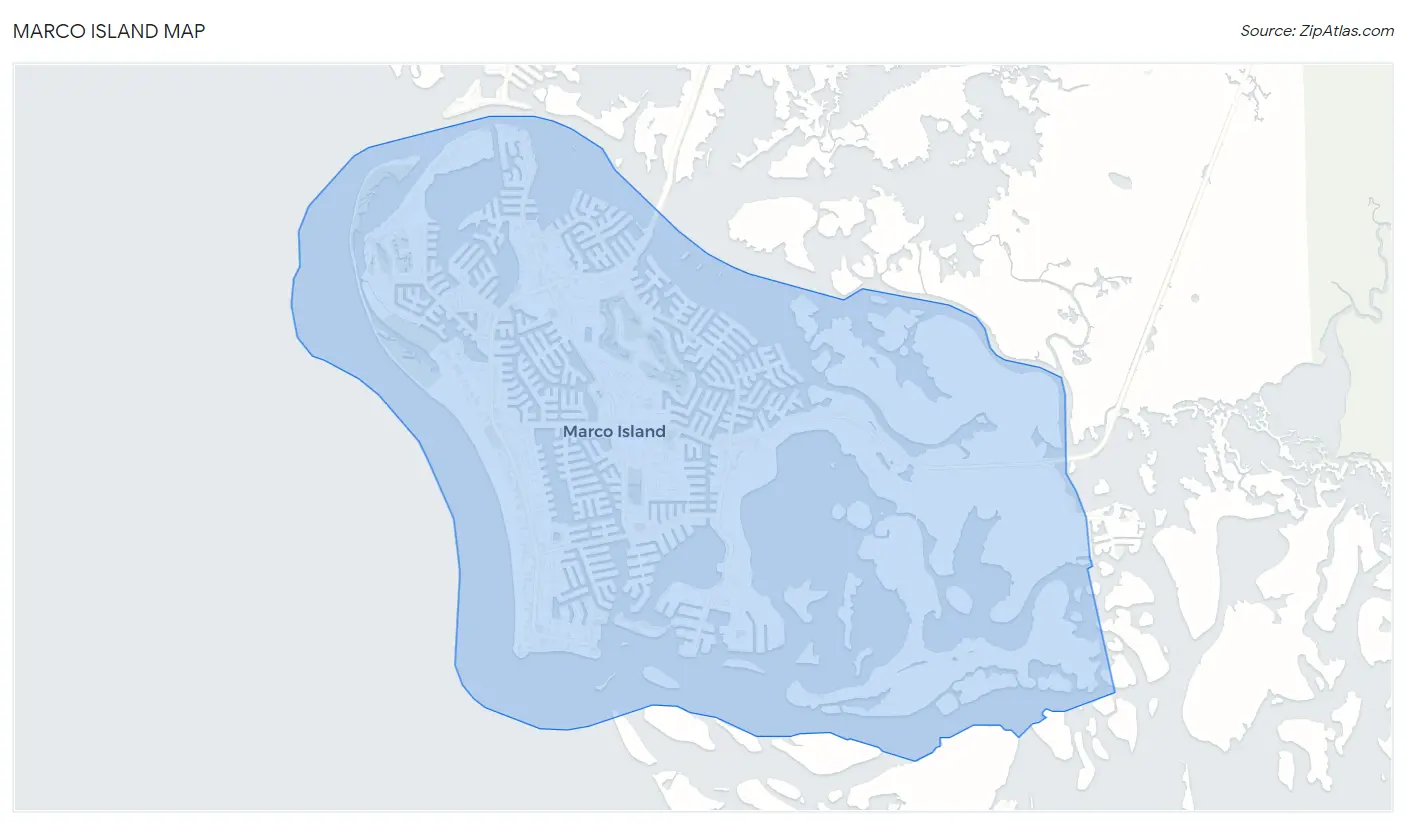
Marco Island Overview
15,942
TOTAL POPULATION
7,933
MALE POPULATION
8,009
FEMALE POPULATION
99.05
MALES / 100 FEMALES
100.96
FEMALES / 100 MALES
67.5
MEDIAN AGE
2.3
AVG FAMILY SIZE
1.9
AVG HOUSEHOLD SIZE
$92,983
PER CAPITA INCOME
$114,277
AVG FAMILY INCOME
$105,315
AVG HOUSEHOLD INCOME
25.0%
WAGE / INCOME GAP [ % ]
75.0¢/ $1
WAGE / INCOME GAP [ $ ]
0.53
INEQUALITY / GINI INDEX
4,865
LABOR FORCE [ PEOPLE ]
32.6%
PERCENT IN LABOR FORCE
4.0%
UNEMPLOYMENT RATE
Marco Island Zip Codes
Marco Island Area Codes
Race in Marco Island
The most populous races in Marco Island are White / Caucasian (15,013 | 94.2%), Hispanic or Latino (1,058 | 6.6%), and Two or more Races (776 | 4.9%).
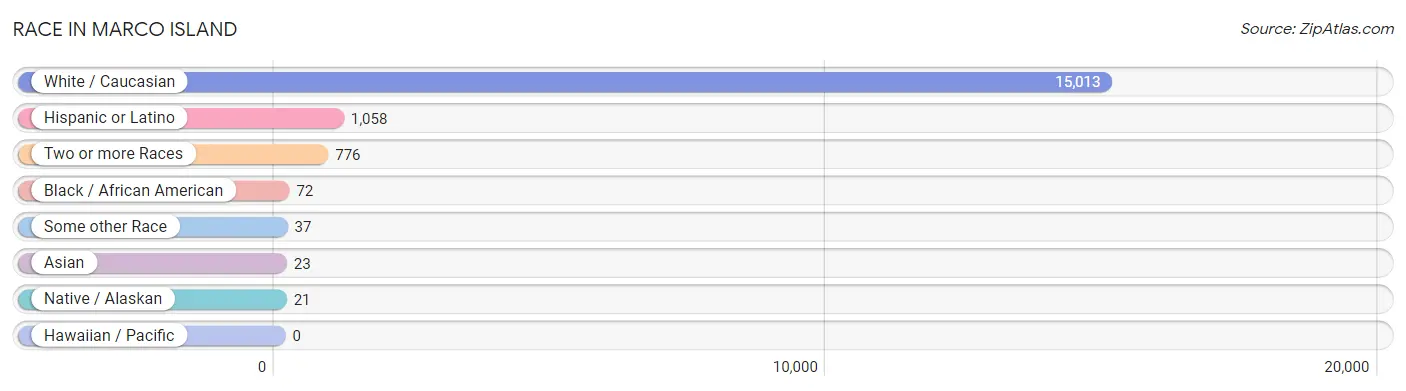
| Race | # Population | % Population |
| Asian | 23 | 0.1% |
| Black / African American | 72 | 0.4% |
| Hawaiian / Pacific | 0 | 0.0% |
| Hispanic or Latino | 1,058 | 6.6% |
| Native / Alaskan | 21 | 0.1% |
| White / Caucasian | 15,013 | 94.2% |
| Two or more Races | 776 | 4.9% |
| Some other Race | 37 | 0.2% |
| Total | 15,942 | 100.0% |
Ancestry in Marco Island
The most populous ancestries reported in Marco Island are German (3,116 | 19.6%), Irish (2,628 | 16.5%), English (2,187 | 13.7%), Italian (1,923 | 12.1%), and American (1,477 | 9.3%), together accounting for 71.1% of all Marco Island residents.

| Ancestry | # Population | % Population |
| American | 1,477 | 9.3% |
| Arab | 105 | 0.7% |
| Armenian | 37 | 0.2% |
| Austrian | 177 | 1.1% |
| Belgian | 69 | 0.4% |
| Bhutanese | 28 | 0.2% |
| British | 108 | 0.7% |
| Bulgarian | 23 | 0.1% |
| Canadian | 16 | 0.1% |
| Central American | 142 | 0.9% |
| Cherokee | 24 | 0.2% |
| Colombian | 75 | 0.5% |
| Costa Rican | 43 | 0.3% |
| Croatian | 57 | 0.4% |
| Cuban | 279 | 1.8% |
| Czech | 65 | 0.4% |
| Czechoslovakian | 46 | 0.3% |
| Danish | 124 | 0.8% |
| Dutch | 143 | 0.9% |
| Eastern European | 118 | 0.7% |
| Egyptian | 11 | 0.1% |
| English | 2,187 | 13.7% |
| European | 171 | 1.1% |
| Filipino | 10 | 0.1% |
| Finnish | 47 | 0.3% |
| French | 462 | 2.9% |
| French Canadian | 107 | 0.7% |
| German | 3,116 | 19.6% |
| Ghanaian | 30 | 0.2% |
| Greek | 267 | 1.7% |
| Guatemalan | 99 | 0.6% |
| Hungarian | 195 | 1.2% |
| Indian (Asian) | 10 | 0.1% |
| Inupiat | 8 | 0.1% |
| Irish | 2,628 | 16.5% |
| Italian | 1,923 | 12.1% |
| Korean | 114 | 0.7% |
| Laotian | 4 | 0.0% |
| Lebanese | 77 | 0.5% |
| Lithuanian | 30 | 0.2% |
| Mexican | 194 | 1.2% |
| Northern European | 6 | 0.0% |
| Norwegian | 256 | 1.6% |
| Palestinian | 17 | 0.1% |
| Peruvian | 55 | 0.4% |
| Polish | 899 | 5.6% |
| Portuguese | 64 | 0.4% |
| Puerto Rican | 154 | 1.0% |
| Romanian | 74 | 0.5% |
| Russian | 153 | 1.0% |
| Scandinavian | 20 | 0.1% |
| Scotch-Irish | 210 | 1.3% |
| Scottish | 363 | 2.3% |
| Serbian | 58 | 0.4% |
| Slovak | 35 | 0.2% |
| Slovene | 4 | 0.0% |
| South African | 33 | 0.2% |
| South American | 130 | 0.8% |
| Spaniard | 6 | 0.0% |
| Spanish | 102 | 0.6% |
| Subsaharan African | 69 | 0.4% |
| Swedish | 595 | 3.7% |
| Trinidadian and Tobagonian | 9 | 0.1% |
| Turkish | 9 | 0.1% |
| Ukrainian | 93 | 0.6% |
| Welsh | 217 | 1.4% |
| West Indian | 33 | 0.2% |
| Yugoslavian | 7 | 0.0% | View All 68 Rows |
Immigrants in Marco Island
The most numerous immigrant groups reported in Marco Island came from Europe (783 | 4.9%), Latin America (432 | 2.7%), Eastern Europe (354 | 2.2%), Western Europe (224 | 1.4%), and Central America (175 | 1.1%), together accounting for 12.3% of all Marco Island residents.
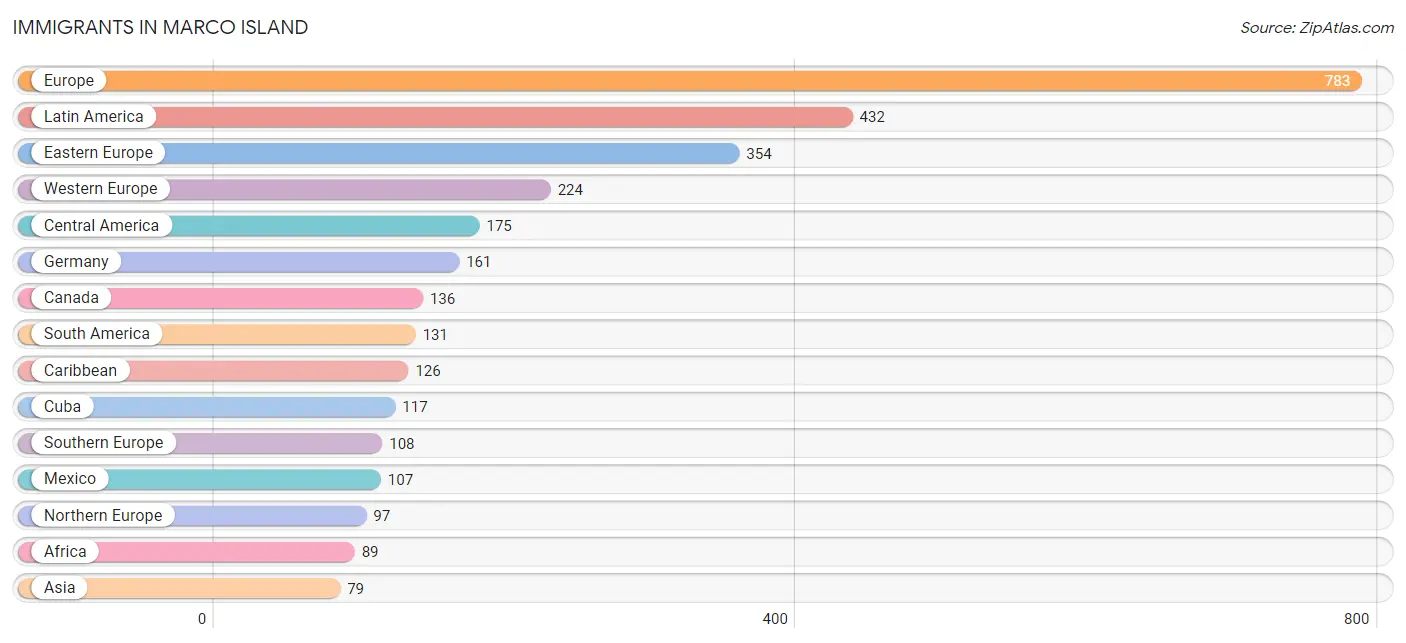
| Immigration Origin | # Population | % Population |
| Africa | 89 | 0.6% |
| Argentina | 6 | 0.0% |
| Asia | 79 | 0.5% |
| Australia | 9 | 0.1% |
| Austria | 21 | 0.1% |
| Bolivia | 14 | 0.1% |
| Bosnia and Herzegovina | 7 | 0.0% |
| Bulgaria | 23 | 0.1% |
| Canada | 136 | 0.9% |
| Caribbean | 126 | 0.8% |
| Central America | 175 | 1.1% |
| China | 10 | 0.1% |
| Colombia | 67 | 0.4% |
| Croatia | 29 | 0.2% |
| Cuba | 117 | 0.7% |
| Eastern Africa | 6 | 0.0% |
| Eastern Asia | 10 | 0.1% |
| Eastern Europe | 354 | 2.2% |
| England | 41 | 0.3% |
| Europe | 783 | 4.9% |
| France | 42 | 0.3% |
| Germany | 161 | 1.0% |
| Ghana | 30 | 0.2% |
| Greece | 54 | 0.3% |
| Guatemala | 68 | 0.4% |
| Hungary | 20 | 0.1% |
| Ireland | 20 | 0.1% |
| Israel | 10 | 0.1% |
| Italy | 39 | 0.2% |
| Latin America | 432 | 2.7% |
| Lebanon | 15 | 0.1% |
| Lithuania | 47 | 0.3% |
| Mexico | 107 | 0.7% |
| Northern Europe | 97 | 0.6% |
| Norway | 26 | 0.2% |
| Oceania | 9 | 0.1% |
| Peru | 44 | 0.3% |
| Philippines | 3 | 0.0% |
| Poland | 72 | 0.4% |
| Romania | 62 | 0.4% |
| Russia | 24 | 0.2% |
| Scotland | 5 | 0.0% |
| Serbia | 34 | 0.2% |
| South Africa | 53 | 0.3% |
| South America | 131 | 0.8% |
| South Eastern Asia | 3 | 0.0% |
| Southern Europe | 108 | 0.7% |
| Spain | 15 | 0.1% |
| Sweden | 5 | 0.0% |
| Taiwan | 10 | 0.1% |
| Trinidad and Tobago | 9 | 0.1% |
| Turkey | 9 | 0.1% |
| Ukraine | 13 | 0.1% |
| Western Africa | 30 | 0.2% |
| Western Asia | 34 | 0.2% |
| Western Europe | 224 | 1.4% | View All 56 Rows |
Sex and Age in Marco Island
Sex and Age in Marco Island
The most populous age groups in Marco Island are 65 to 69 Years (1,349 | 17.0%) for men and 75 to 79 Years (1,272 | 15.9%) for women.
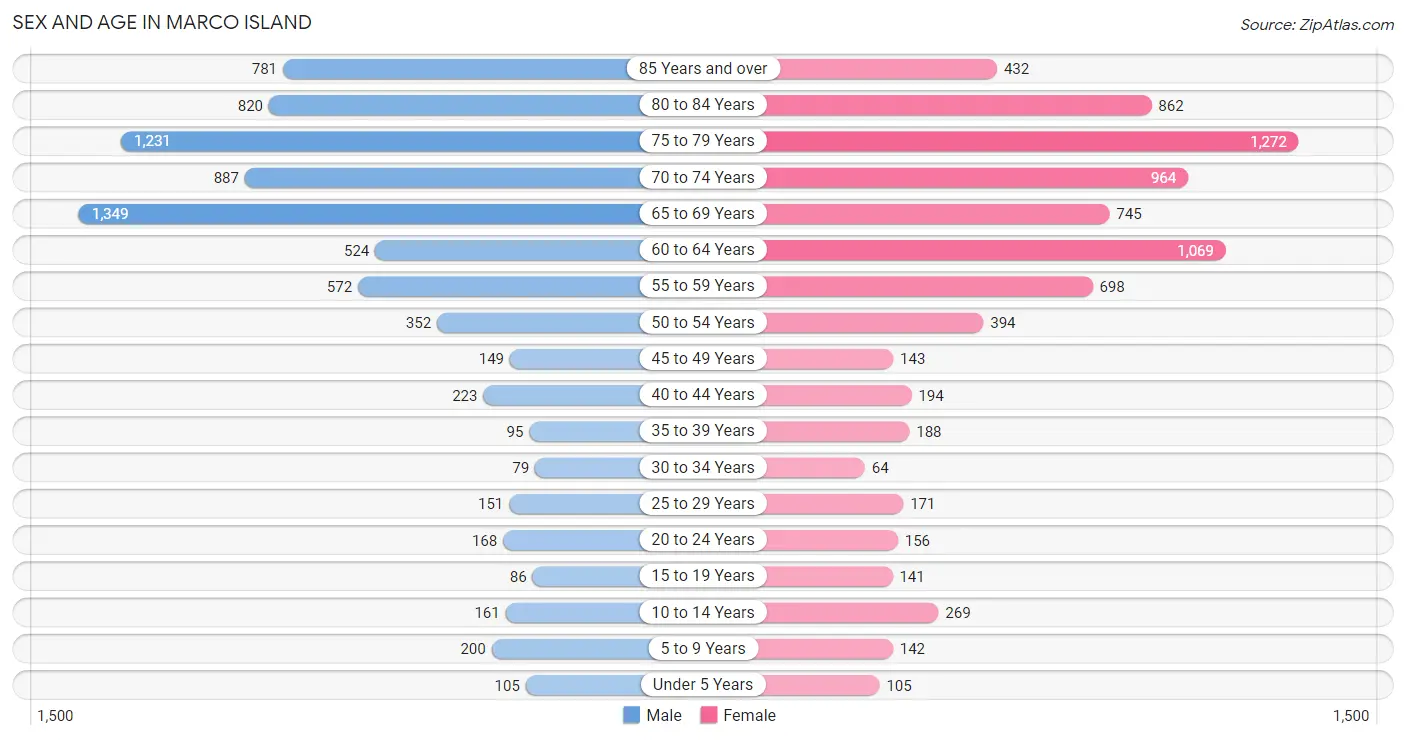
| Age Bracket | Male | Female |
| Under 5 Years | 105 (1.3%) | 105 (1.3%) |
| 5 to 9 Years | 200 (2.5%) | 142 (1.8%) |
| 10 to 14 Years | 161 (2.0%) | 269 (3.4%) |
| 15 to 19 Years | 86 (1.1%) | 141 (1.8%) |
| 20 to 24 Years | 168 (2.1%) | 156 (1.9%) |
| 25 to 29 Years | 151 (1.9%) | 171 (2.1%) |
| 30 to 34 Years | 79 (1.0%) | 64 (0.8%) |
| 35 to 39 Years | 95 (1.2%) | 188 (2.4%) |
| 40 to 44 Years | 223 (2.8%) | 194 (2.4%) |
| 45 to 49 Years | 149 (1.9%) | 143 (1.8%) |
| 50 to 54 Years | 352 (4.4%) | 394 (4.9%) |
| 55 to 59 Years | 572 (7.2%) | 698 (8.7%) |
| 60 to 64 Years | 524 (6.6%) | 1,069 (13.4%) |
| 65 to 69 Years | 1,349 (17.0%) | 745 (9.3%) |
| 70 to 74 Years | 887 (11.2%) | 964 (12.0%) |
| 75 to 79 Years | 1,231 (15.5%) | 1,272 (15.9%) |
| 80 to 84 Years | 820 (10.3%) | 862 (10.8%) |
| 85 Years and over | 781 (9.8%) | 432 (5.4%) |
| Total | 7,933 (100.0%) | 8,009 (100.0%) |
Families and Households in Marco Island
Median Family Size in Marco Island
The median family size in Marco Island is 2.29 persons per family, with single female/mother families (126 | 2.2%) accounting for the largest median family size of 2.95 persons per family. On the other hand, married-couple families (5,374 | 93.4%) represent the smallest median family size with 2.26 persons per family.
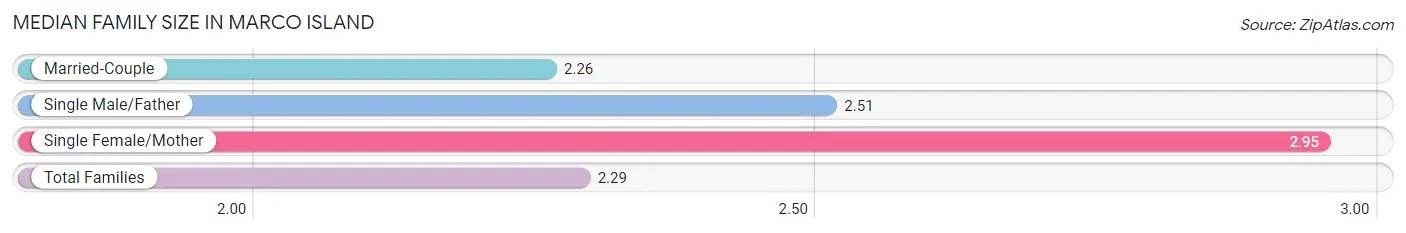
| Family Type | # Families | Family Size |
| Married-Couple | 5,374 (93.4%) | 2.26 |
| Single Male/Father | 253 (4.4%) | 2.51 |
| Single Female/Mother | 126 (2.2%) | 2.95 |
| Total Families | 5,753 (100.0%) | 2.29 |
Median Household Size in Marco Island
The median household size in Marco Island is 1.93 persons per household, with single female/mother households (126 | 1.5%) accounting for the largest median household size of 3 persons per household. non-family households (2,523 | 30.5%) represent the smallest median household size with 1.08 persons per household.
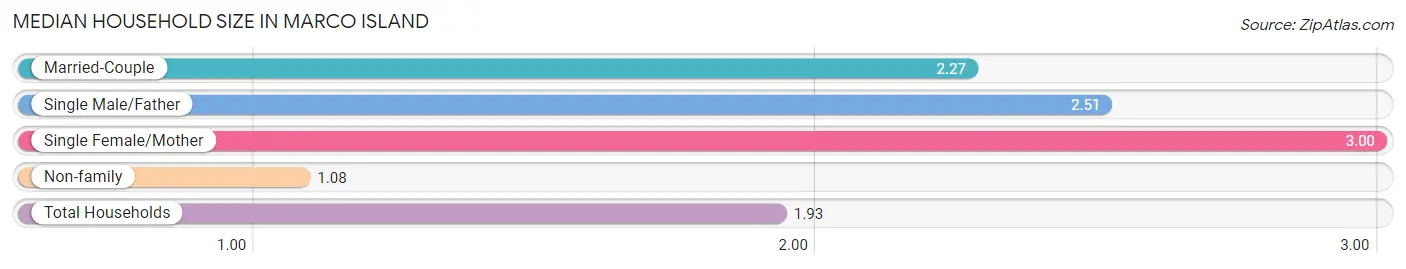
| Household Type | # Households | Household Size |
| Married-Couple | 5,374 (64.9%) | 2.27 |
| Single Male/Father | 253 (3.1%) | 2.51 |
| Single Female/Mother | 126 (1.5%) | 3.00 |
| Non-family | 2,523 (30.5%) | 1.08 |
| Total Households | 8,276 (100.0%) | 1.93 |
Household Size by Marriage Status in Marco Island
Out of a total of 8,276 households in Marco Island, 5,753 (69.5%) are family households, while 2,523 (30.5%) are nonfamily households. The most numerous type of family households are 2-person households, comprising 4,923, and the most common type of nonfamily households are 1-person households, comprising 2,318.
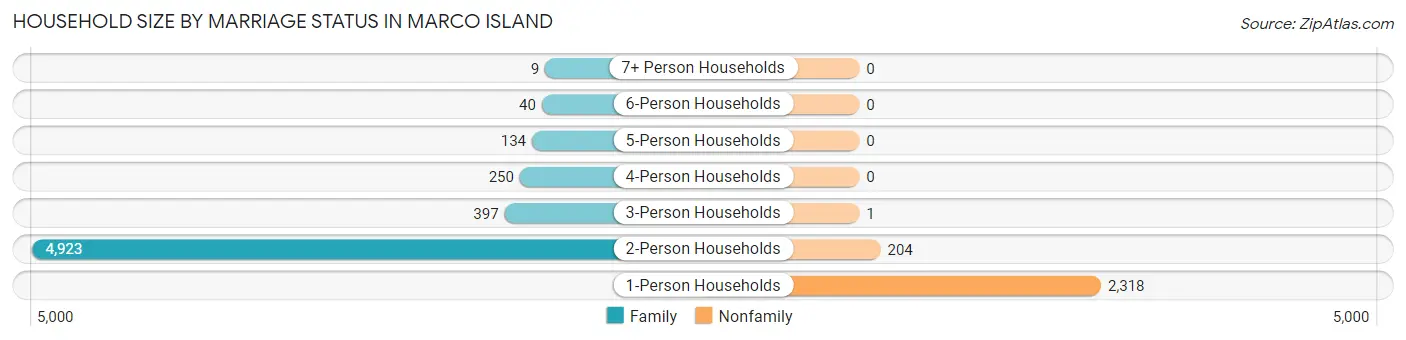
| Household Size | Family Households | Nonfamily Households |
| 1-Person Households | - | 2,318 (28.0%) |
| 2-Person Households | 4,923 (59.5%) | 204 (2.5%) |
| 3-Person Households | 397 (4.8%) | 1 (0.0%) |
| 4-Person Households | 250 (3.0%) | 0 (0.0%) |
| 5-Person Households | 134 (1.6%) | 0 (0.0%) |
| 6-Person Households | 40 (0.5%) | 0 (0.0%) |
| 7+ Person Households | 9 (0.1%) | 0 (0.0%) |
| Total | 5,753 (69.5%) | 2,523 (30.5%) |
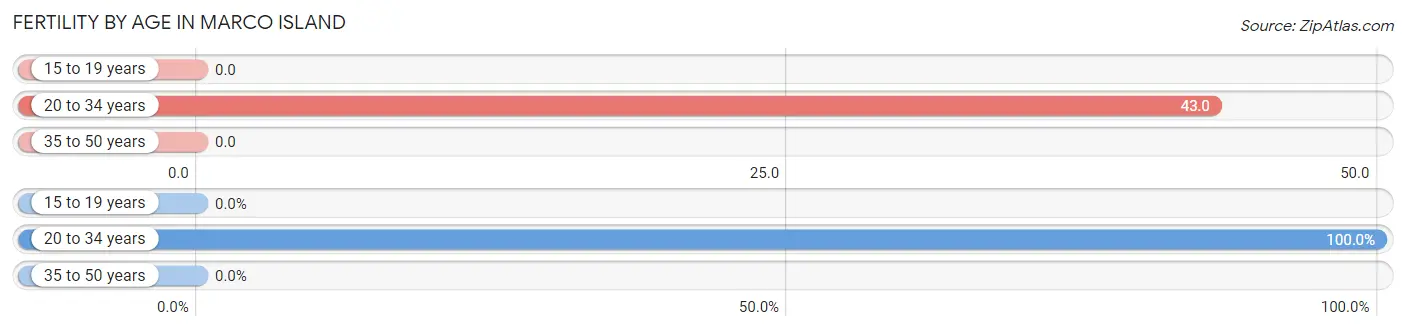
Female Fertility in Marco Island
Fertility by Age in Marco Island
Average fertility rate in Marco Island is 15.0 births per 1,000 women. Women in the age bracket of 20 to 34 years have the highest fertility rate with 43.0 births per 1,000 women. Women in the age bracket of 20 to 34 years acount for 100.0% of all women with births.
| Age Bracket | Women with Births | Births / 1,000 Women |
| 15 to 19 years | 0 (0.0%) | 0.0 |
| 20 to 34 years | 17 (100.0%) | 43.0 |
| 35 to 50 years | 0 (0.0%) | 0.0 |
| Total | 17 (100.0%) | 15.0 |
Fertility by Age by Marriage Status in Marco Island
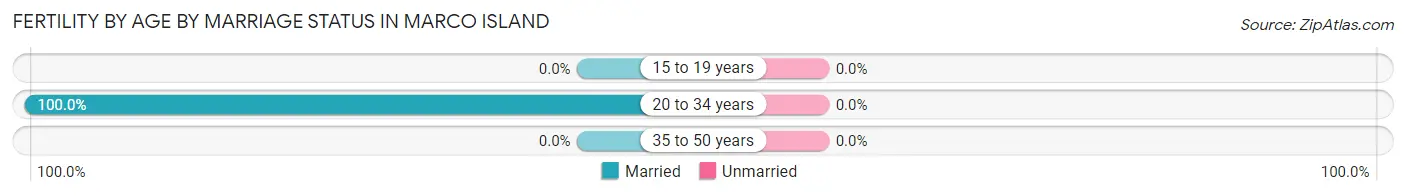
| Age Bracket | Married | Unmarried |
| 15 to 19 years | 0 (0.0%) | 0 (0.0%) |
| 20 to 34 years | 17 (100.0%) | 0 (0.0%) |
| 35 to 50 years | 0 (0.0%) | 0 (0.0%) |
| Total | 17 (100.0%) | 0 (0.0%) |
Fertility by Education in Marco Island
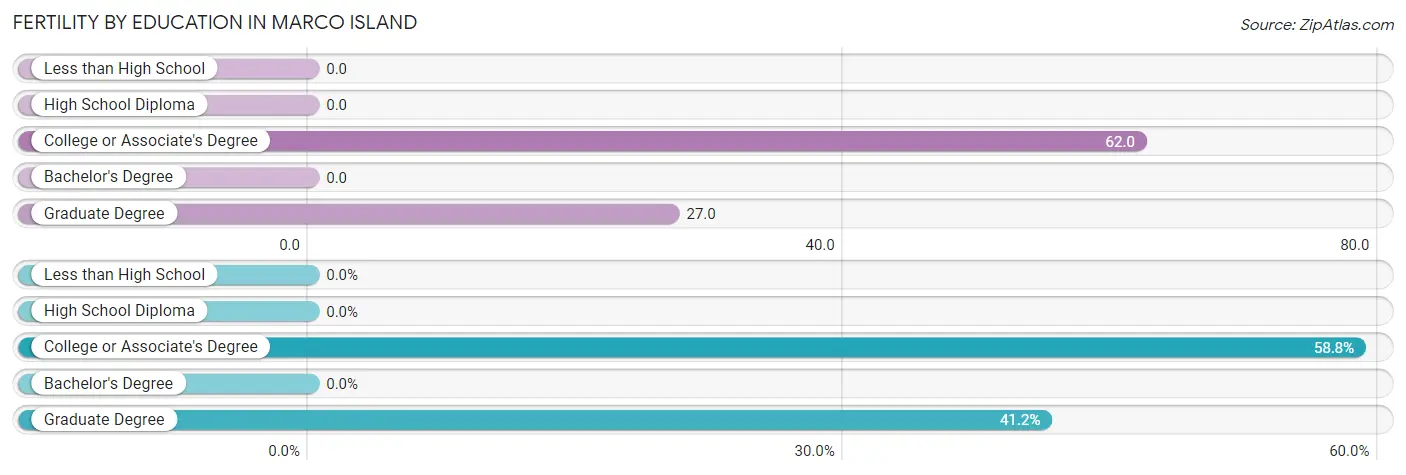
| Educational Attainment | Women with Births | Births / 1,000 Women |
| Less than High School | 0 (0.0%) | 0.0 |
| High School Diploma | 0 (0.0%) | 0.0 |
| College or Associate's Degree | 10 (58.8%) | 62.0 |
| Bachelor's Degree | 0 (0.0%) | 0.0 |
| Graduate Degree | 7 (41.2%) | 27.0 |
| Total | 17 (100.0%) | 15.0 |
Fertility by Education by Marriage Status in Marco Island
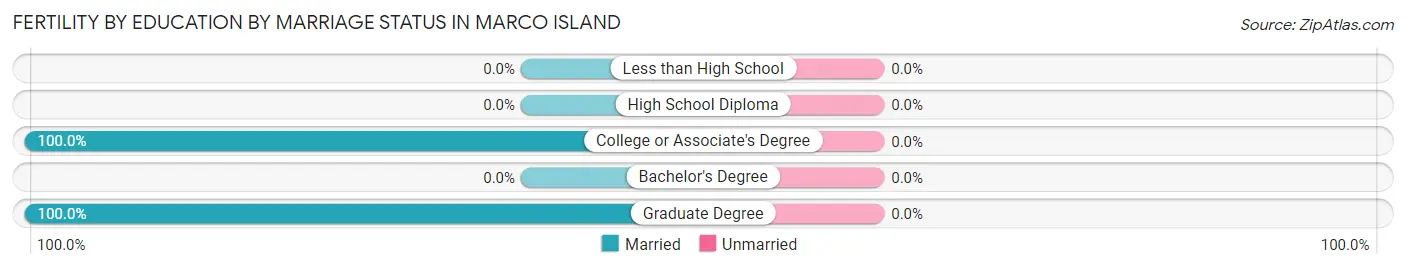
| Educational Attainment | Married | Unmarried |
| Less than High School | 0 (0.0%) | 0 (0.0%) |
| High School Diploma | 0 (0.0%) | 0 (0.0%) |
| College or Associate's Degree | 10 (100.0%) | 0 (0.0%) |
| Bachelor's Degree | 0 (0.0%) | 0 (0.0%) |
| Graduate Degree | 7 (100.0%) | 0 (0.0%) |
| Total | 17 (100.0%) | 0 (0.0%) |
Income in Marco Island
Income Overview in Marco Island
Per Capita Income in Marco Island is $92,983, while median incomes of families and households are $114,277 and $105,315 respectively.
| Characteristic | Number | Measure |
| Per Capita Income | 15,942 | $92,983 |
| Median Family Income | 5,753 | $114,277 |
| Mean Family Income | 5,753 | $198,839 |
| Median Household Income | 8,276 | $105,315 |
| Mean Household Income | 8,276 | $174,203 |
| Income Deficit | 5,753 | $0 |
| Wage / Income Gap (%) | 15,942 | 25.01% |
| Wage / Income Gap ($) | 15,942 | 74.99¢ per $1 |
| Gini / Inequality Index | 15,942 | 0.53 |
Earnings by Sex in Marco Island
Average Earnings in Marco Island are $49,676, $58,462 for men and $43,843 for women, a difference of 25.0%.
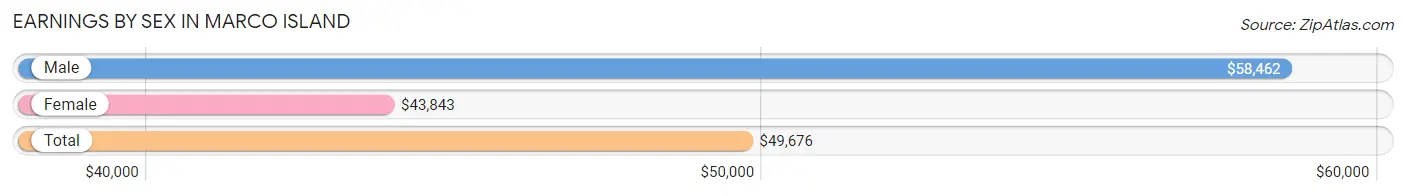
| Sex | Number | Average Earnings |
| Male | 2,864 (54.5%) | $58,462 |
| Female | 2,388 (45.5%) | $43,843 |
| Total | 5,252 (100.0%) | $49,676 |
Earnings by Sex by Income Bracket in Marco Island
The most common earnings brackets in Marco Island are $100,000+ for men (960 | 33.5%) and $100,000+ for women (341 | 14.3%).
| Income | Male | Female |
| $2,499 or less | 54 (1.9%) | 82 (3.4%) |
| $2,500 to $4,999 | 28 (1.0%) | 76 (3.2%) |
| $5,000 to $7,499 | 62 (2.2%) | 39 (1.6%) |
| $7,500 to $9,999 | 67 (2.3%) | 22 (0.9%) |
| $10,000 to $12,499 | 102 (3.6%) | 188 (7.9%) |
| $12,500 to $14,999 | 27 (0.9%) | 114 (4.8%) |
| $15,000 to $17,499 | 82 (2.9%) | 38 (1.6%) |
| $17,500 to $19,999 | 41 (1.4%) | 40 (1.7%) |
| $20,000 to $22,499 | 57 (2.0%) | 165 (6.9%) |
| $22,500 to $24,999 | 135 (4.7%) | 46 (1.9%) |
| $25,000 to $29,999 | 272 (9.5%) | 135 (5.7%) |
| $30,000 to $34,999 | 104 (3.6%) | 122 (5.1%) |
| $35,000 to $39,999 | 180 (6.3%) | 42 (1.8%) |
| $40,000 to $44,999 | 35 (1.2%) | 110 (4.6%) |
| $45,000 to $49,999 | 54 (1.9%) | 124 (5.2%) |
| $50,000 to $54,999 | 35 (1.2%) | 87 (3.6%) |
| $55,000 to $64,999 | 246 (8.6%) | 213 (8.9%) |
| $65,000 to $74,999 | 147 (5.1%) | 171 (7.2%) |
| $75,000 to $99,999 | 176 (6.1%) | 233 (9.8%) |
| $100,000+ | 960 (33.5%) | 341 (14.3%) |
| Total | 2,864 (100.0%) | 2,388 (100.0%) |
Earnings by Sex by Educational Attainment in Marco Island
Average earnings in Marco Island are $60,000 for men and $48,281 for women, a difference of 19.5%. Men with an educational attainment of graduate degree enjoy the highest average annual earnings of $105,469, while those with less than high school education earn the least with $29,525. Women with an educational attainment of graduate degree earn the most with the average annual earnings of $70,439, while those with college or associate's degree education have the smallest earnings of $29,211.
| Educational Attainment | Male Income | Female Income |
| Less than High School | $29,525 | $0 |
| High School Diploma | $40,500 | $33,438 |
| College or Associate's Degree | $58,750 | $29,211 |
| Bachelor's Degree | $99,286 | $55,941 |
| Graduate Degree | $105,469 | $70,439 |
| Total | $60,000 | $48,281 |
Family Income in Marco Island
Family Income Brackets in Marco Island
According to the Marco Island family income data, there are 1,835 families falling into the $200,000+ income range, which is the most common income bracket and makes up 31.9% of all families. Conversely, the $10,000 to $14,999 income bracket is the least frequent group with only 12 families (0.2%) belonging to this category.
| Income Bracket | # Families | % Families |
| Less than $10,000 | 161 | 2.8% |
| $10,000 to $14,999 | 12 | 0.2% |
| $15,000 to $24,999 | 52 | 0.9% |
| $25,000 to $34,999 | 178 | 3.1% |
| $35,000 to $49,999 | 495 | 8.6% |
| $50,000 to $74,999 | 823 | 14.3% |
| $75,000 to $99,999 | 644 | 11.2% |
| $100,000 to $149,999 | 1,099 | 19.1% |
| $150,000 to $199,999 | 460 | 8.0% |
| $200,000+ | 1,835 | 31.9% |
Family Income by Famaliy Size in Marco Island
4-person families (239 | 4.2%) account for the highest median family income in Marco Island with $211,771 per family, while 2-person families (4,934 | 85.8%) have the highest median income of $56,828 per family member.
| Income Bracket | # Families | Median Income |
| 2-Person Families | 4,934 (85.8%) | $113,656 |
| 3-Person Families | 397 (6.9%) | $121,958 |
| 4-Person Families | 239 (4.2%) | $211,771 |
| 5-Person Families | 134 (2.3%) | $101,250 |
| 6-Person Families | 40 (0.7%) | $168,529 |
| 7+ Person Families | 9 (0.2%) | $0 |
| Total | 5,753 (100.0%) | $114,277 |
Family Income by Number of Earners in Marco Island
The median family income in Marco Island is $114,277, with families comprising 3+ earners (194) having the highest median family income of $211,875, while families with no earners (3,092) have the lowest median family income of $105,523, accounting for 3.4% and 53.7% of families, respectively.
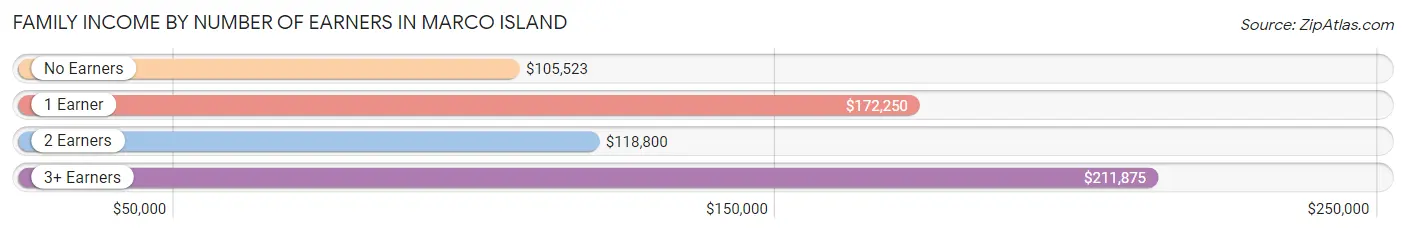
| Number of Earners | # Families | Median Income |
| No Earners | 3,092 (53.7%) | $105,523 |
| 1 Earner | 1,229 (21.4%) | $172,250 |
| 2 Earners | 1,238 (21.5%) | $118,800 |
| 3+ Earners | 194 (3.4%) | $211,875 |
| Total | 5,753 (100.0%) | $114,277 |
Household Income in Marco Island
Household Income Brackets in Marco Island
With 2,243 households falling in the category, the $200,000+ income range is the most frequent in Marco Island, accounting for 27.1% of all households. In contrast, only 182 households (2.2%) fall into the $10,000 to $14,999 income bracket, making it the least populous group.
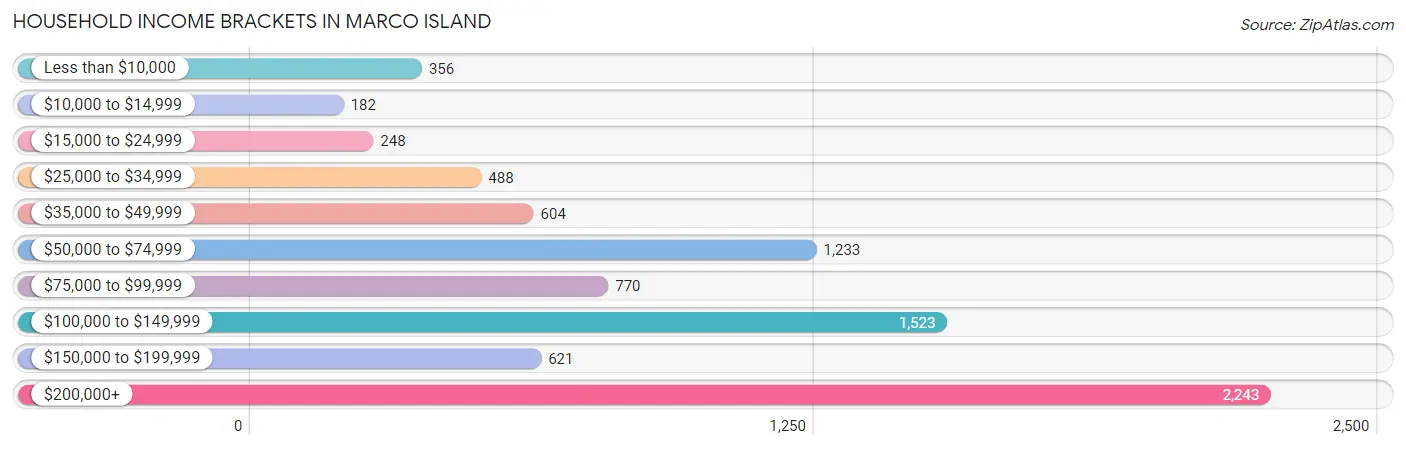
| Income Bracket | # Households | % Households |
| Less than $10,000 | 356 | 4.3% |
| $10,000 to $14,999 | 182 | 2.2% |
| $15,000 to $24,999 | 248 | 3.0% |
| $25,000 to $34,999 | 488 | 5.9% |
| $35,000 to $49,999 | 604 | 7.3% |
| $50,000 to $74,999 | 1,233 | 14.9% |
| $75,000 to $99,999 | 770 | 9.3% |
| $100,000 to $149,999 | 1,523 | 18.4% |
| $150,000 to $199,999 | 621 | 7.5% |
| $200,000+ | 2,243 | 27.1% |
Household Income by Householder Age in Marco Island
The median household income in Marco Island is $105,315, with the highest median household income of $124,779 found in the 45 to 64 years age bracket for the primary householder. A total of 2,035 households (24.6%) fall into this category. Meanwhile, the 15 to 24 years age bracket for the primary householder has the lowest median household income of $0, with 7 households (0.1%) in this group.
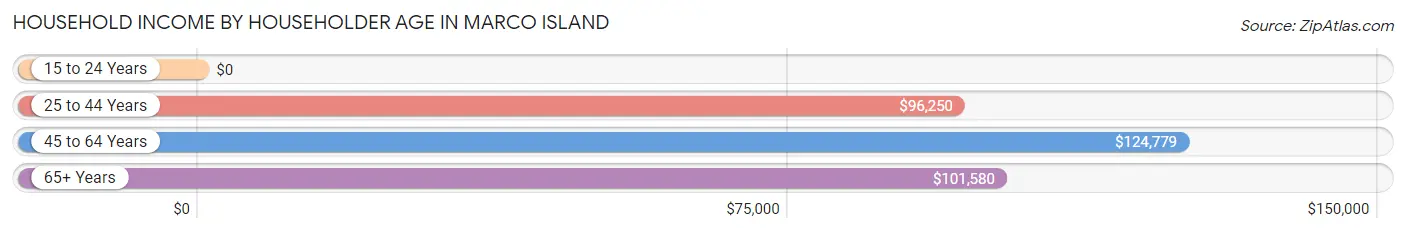
| Income Bracket | # Households | Median Income |
| 15 to 24 Years | 7 (0.1%) | $0 |
| 25 to 44 Years | 511 (6.2%) | $96,250 |
| 45 to 64 Years | 2,035 (24.6%) | $124,779 |
| 65+ Years | 5,723 (69.2%) | $101,580 |
| Total | 8,276 (100.0%) | $105,315 |
Poverty in Marco Island
Income Below Poverty by Sex and Age in Marco Island
With 6.0% poverty level for males and 4.8% for females among the residents of Marco Island, 18 to 24 year old males and under 5 year old females are the most vulnerable to poverty, with 32 males (16.8%) and 53 females (50.5%) in their respective age groups living below the poverty level.
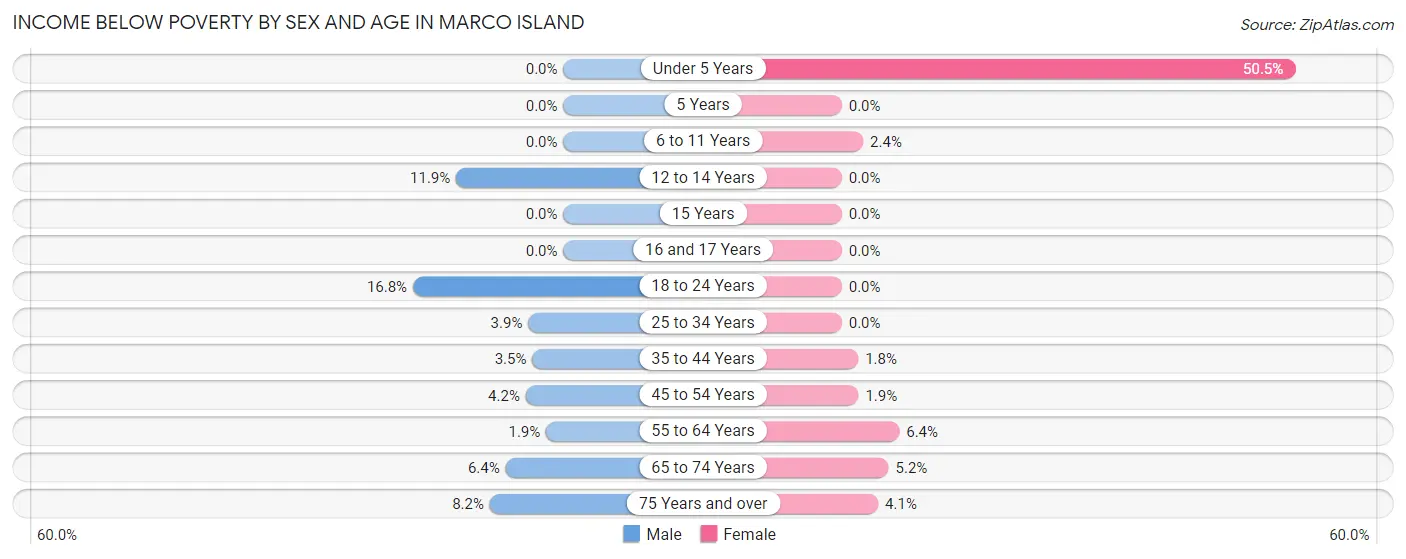
| Age Bracket | Male | Female |
| Under 5 Years | 0 (0.0%) | 53 (50.5%) |
| 5 Years | 0 (0.0%) | 0 (0.0%) |
| 6 to 11 Years | 0 (0.0%) | 7 (2.4%) |
| 12 to 14 Years | 8 (11.9%) | 0 (0.0%) |
| 15 Years | 0 (0.0%) | 0 (0.0%) |
| 16 and 17 Years | 0 (0.0%) | 0 (0.0%) |
| 18 to 24 Years | 32 (16.8%) | 0 (0.0%) |
| 25 to 34 Years | 9 (3.9%) | 0 (0.0%) |
| 35 to 44 Years | 11 (3.5%) | 7 (1.8%) |
| 45 to 54 Years | 21 (4.2%) | 10 (1.9%) |
| 55 to 64 Years | 21 (1.9%) | 113 (6.4%) |
| 65 to 74 Years | 144 (6.4%) | 89 (5.2%) |
| 75 Years and over | 232 (8.2%) | 104 (4.1%) |
| Total | 478 (6.0%) | 383 (4.8%) |
Income Above Poverty by Sex and Age in Marco Island
According to the poverty statistics in Marco Island, males aged under 5 years and females aged 5 years are the age groups that are most secure financially, with 100.0% of males and 100.0% of females in these age groups living above the poverty line.
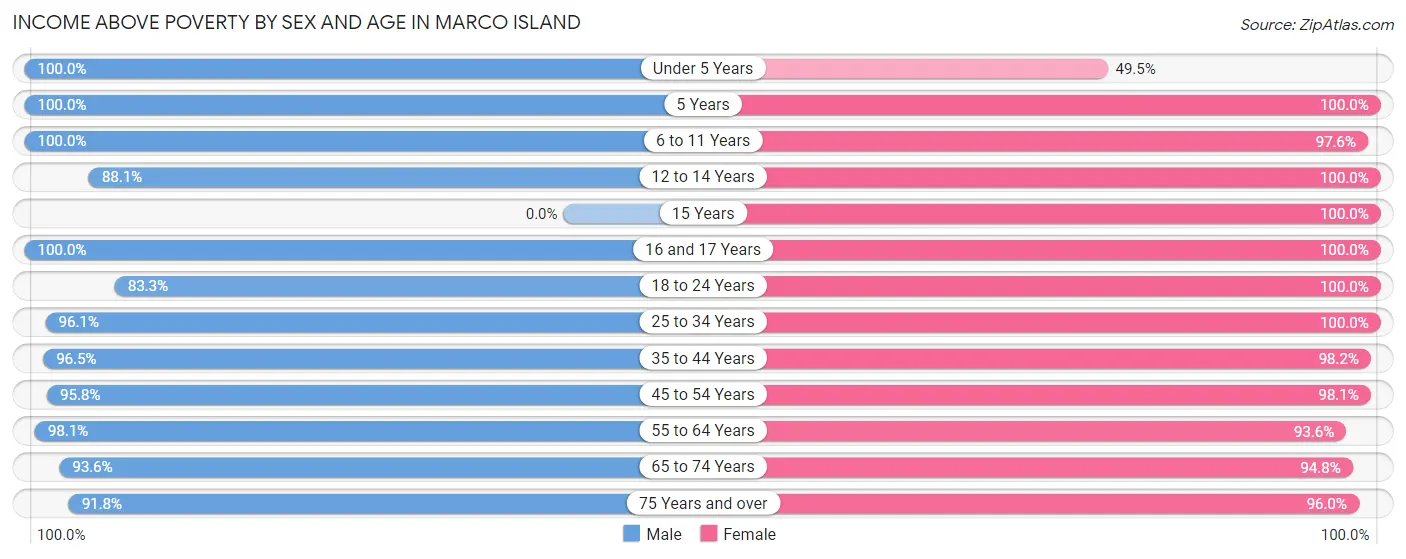
| Age Bracket | Male | Female |
| Under 5 Years | 105 (100.0%) | 52 (49.5%) |
| 5 Years | 37 (100.0%) | 15 (100.0%) |
| 6 to 11 Years | 257 (100.0%) | 287 (97.6%) |
| 12 to 14 Years | 59 (88.1%) | 102 (100.0%) |
| 15 Years | 0 (0.0%) | 36 (100.0%) |
| 16 and 17 Years | 63 (100.0%) | 105 (100.0%) |
| 18 to 24 Years | 159 (83.3%) | 156 (100.0%) |
| 25 to 34 Years | 221 (96.1%) | 235 (100.0%) |
| 35 to 44 Years | 307 (96.5%) | 375 (98.2%) |
| 45 to 54 Years | 480 (95.8%) | 527 (98.1%) |
| 55 to 64 Years | 1,075 (98.1%) | 1,654 (93.6%) |
| 65 to 74 Years | 2,092 (93.6%) | 1,620 (94.8%) |
| 75 Years and over | 2,600 (91.8%) | 2,462 (96.0%) |
| Total | 7,455 (94.0%) | 7,626 (95.2%) |
Income Below Poverty Among Married-Couple Families in Marco Island
The poverty statistics for married-couple families in Marco Island show that 2.5% or 133 of the total 5,374 families live below the poverty line. Families with no children have the highest poverty rate of 2.6%, comprising of 126 families. On the other hand, families with 3 or 4 children have the lowest poverty rate of 0.0%, which includes 0 families.
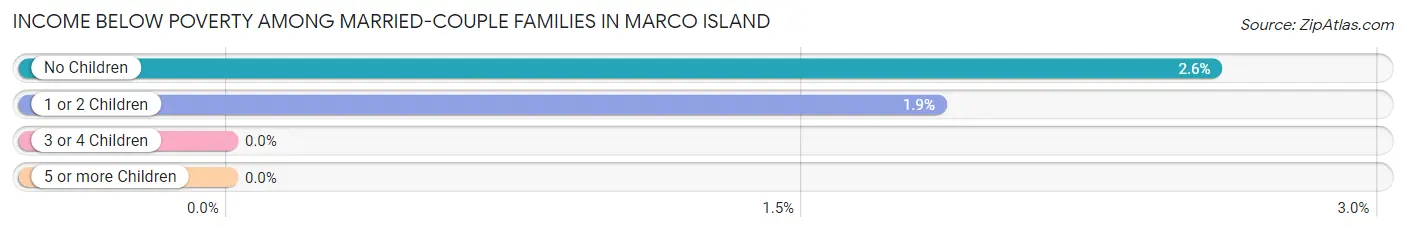
| Children | Above Poverty | Below Poverty |
| No Children | 4,779 (97.4%) | 126 (2.6%) |
| 1 or 2 Children | 372 (98.2%) | 7 (1.8%) |
| 3 or 4 Children | 81 (100.0%) | 0 (0.0%) |
| 5 or more Children | 9 (100.0%) | 0 (0.0%) |
| Total | 5,241 (97.5%) | 133 (2.5%) |
Income Below Poverty Among Single-Parent Households in Marco Island
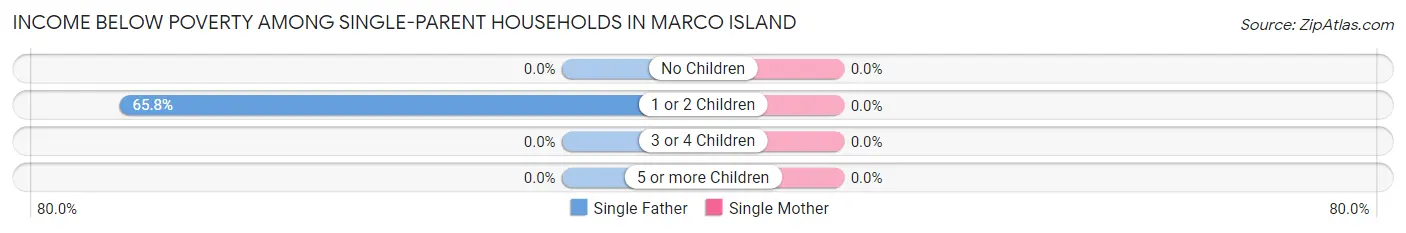
| Children | Single Father | Single Mother |
| No Children | 0 (0.0%) | 0 (0.0%) |
| 1 or 2 Children | 79 (65.8%) | 0 (0.0%) |
| 3 or 4 Children | 0 (0.0%) | 0 (0.0%) |
| 5 or more Children | 0 (0.0%) | 0 (0.0%) |
| Total | 79 (31.2%) | 0 (0.0%) |
Income Below Poverty Among Married-Couple vs Single-Parent Households in Marco Island
The poverty data for Marco Island shows that 133 of the married-couple family households (2.5%) and 79 of the single-parent households (20.8%) are living below the poverty level. Within the married-couple family households, those with no children have the highest poverty rate, with 126 households (2.6%) falling below the poverty line. Among the single-parent households, those with 1 or 2 children have the highest poverty rate, with 79 household (49.1%) living below poverty.
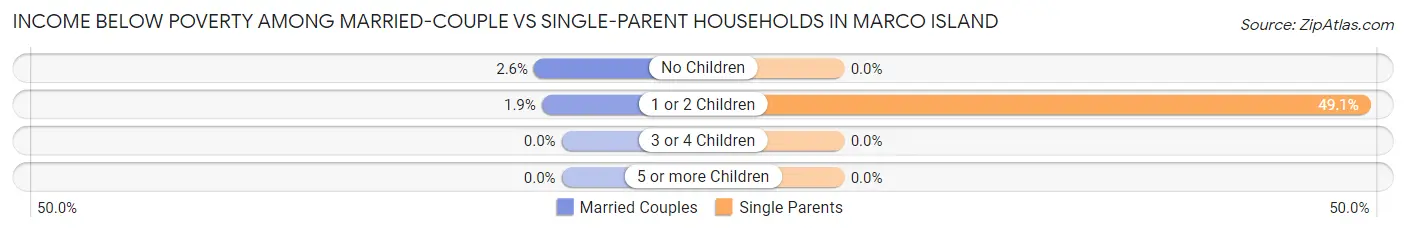
| Children | Married-Couple Families | Single-Parent Households |
| No Children | 126 (2.6%) | 0 (0.0%) |
| 1 or 2 Children | 7 (1.8%) | 79 (49.1%) |
| 3 or 4 Children | 0 (0.0%) | 0 (0.0%) |
| 5 or more Children | 0 (0.0%) | 0 (0.0%) |
| Total | 133 (2.5%) | 79 (20.8%) |
Employment Characteristics in Marco Island
Employment by Class of Employer in Marco Island
Among the 4,618 employed individuals in Marco Island, private company employees (2,561 | 55.5%), self-employed (incorporated) (781 | 16.9%), and self-employed (not incorporated) (541 | 11.7%) make up the most common classes of employment.
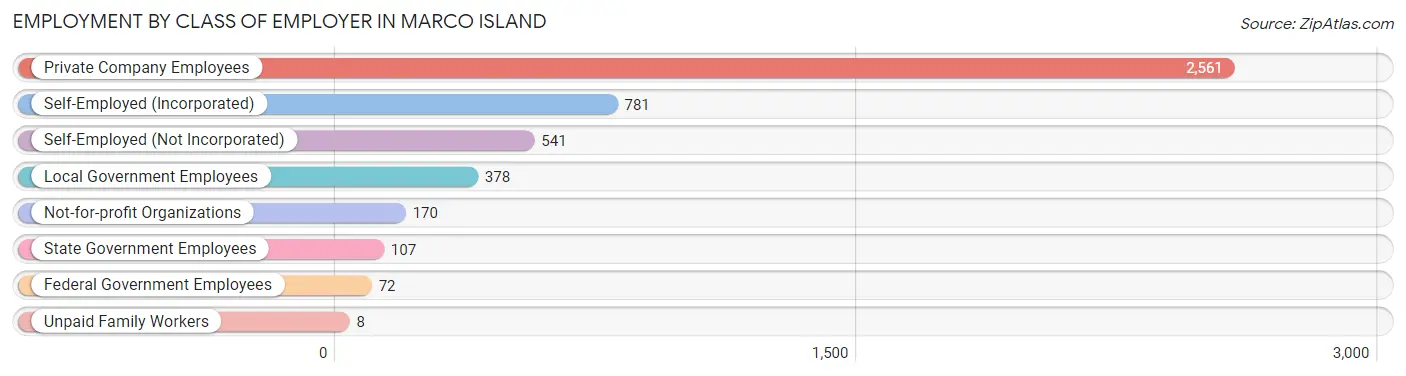
| Employer Class | # Employees | % Employees |
| Private Company Employees | 2,561 | 55.5% |
| Self-Employed (Incorporated) | 781 | 16.9% |
| Self-Employed (Not Incorporated) | 541 | 11.7% |
| Not-for-profit Organizations | 170 | 3.7% |
| Local Government Employees | 378 | 8.2% |
| State Government Employees | 107 | 2.3% |
| Federal Government Employees | 72 | 1.6% |
| Unpaid Family Workers | 8 | 0.2% |
| Total | 4,618 | 100.0% |
Employment Status by Age in Marco Island
According to the labor force statistics for Marco Island, out of the total population over 16 years of age (14,924), 32.6% or 4,865 individuals are in the labor force, with 4.0% or 195 of them unemployed. The age group with the highest labor force participation rate is 35 to 44 years, with 93.1% or 652 individuals in the labor force. Within the labor force, the 60 to 64 years age range has the highest percentage of unemployed individuals, with 19.4% or 134 of them being unemployed.
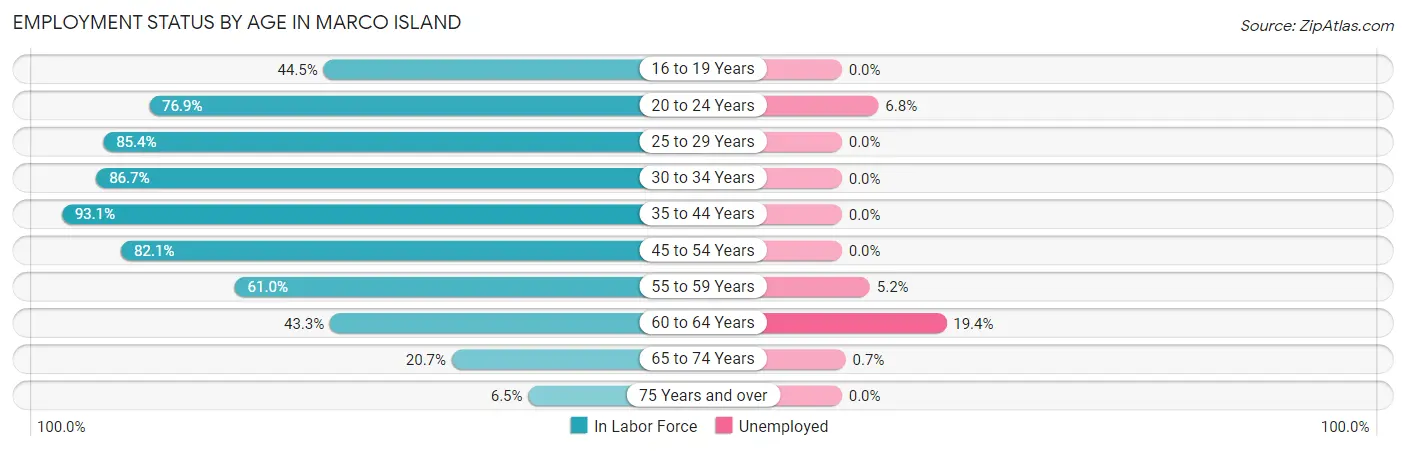
| Age Bracket | In Labor Force | Unemployed |
| 16 to 19 Years | 85 (44.5%) | 0 (0.0%) |
| 20 to 24 Years | 249 (76.9%) | 17 (6.8%) |
| 25 to 29 Years | 275 (85.4%) | 0 (0.0%) |
| 30 to 34 Years | 124 (86.7%) | 0 (0.0%) |
| 35 to 44 Years | 652 (93.1%) | 0 (0.0%) |
| 45 to 54 Years | 852 (82.1%) | 0 (0.0%) |
| 55 to 59 Years | 775 (61.0%) | 40 (5.2%) |
| 60 to 64 Years | 690 (43.3%) | 134 (19.4%) |
| 65 to 74 Years | 817 (20.7%) | 6 (0.7%) |
| 75 Years and over | 351 (6.5%) | 0 (0.0%) |
| Total | 4,865 (32.6%) | 195 (4.0%) |
Employment Status by Educational Attainment in Marco Island
According to labor force statistics for Marco Island, 66.5% of individuals (3,369) out of the total population between 25 and 64 years of age (5,066) are in the labor force, with 5.2% or 175 of them being unemployed. The group with the highest labor force participation rate are those with the educational attainment of less than high school, with 78.4% or 134 individuals in the labor force. Within the labor force, individuals with less than high school education have the highest percentage of unemployment, with 23.9% or 32 of them being unemployed.
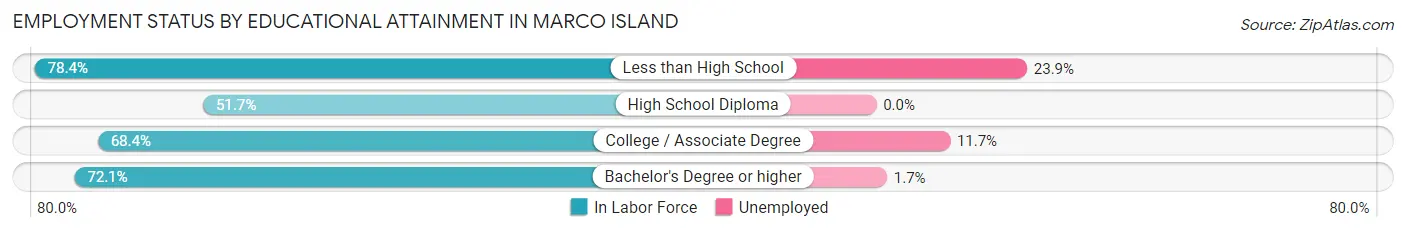
| Educational Attainment | In Labor Force | Unemployed |
| Less than High School | 134 (78.4%) | 41 (23.9%) |
| High School Diploma | 612 (51.7%) | 0 (0.0%) |
| College / Associate Degree | 977 (68.4%) | 167 (11.7%) |
| Bachelor's Degree or higher | 1,646 (72.1%) | 39 (1.7%) |
| Total | 3,369 (66.5%) | 263 (5.2%) |
Employment Occupations by Sex in Marco Island
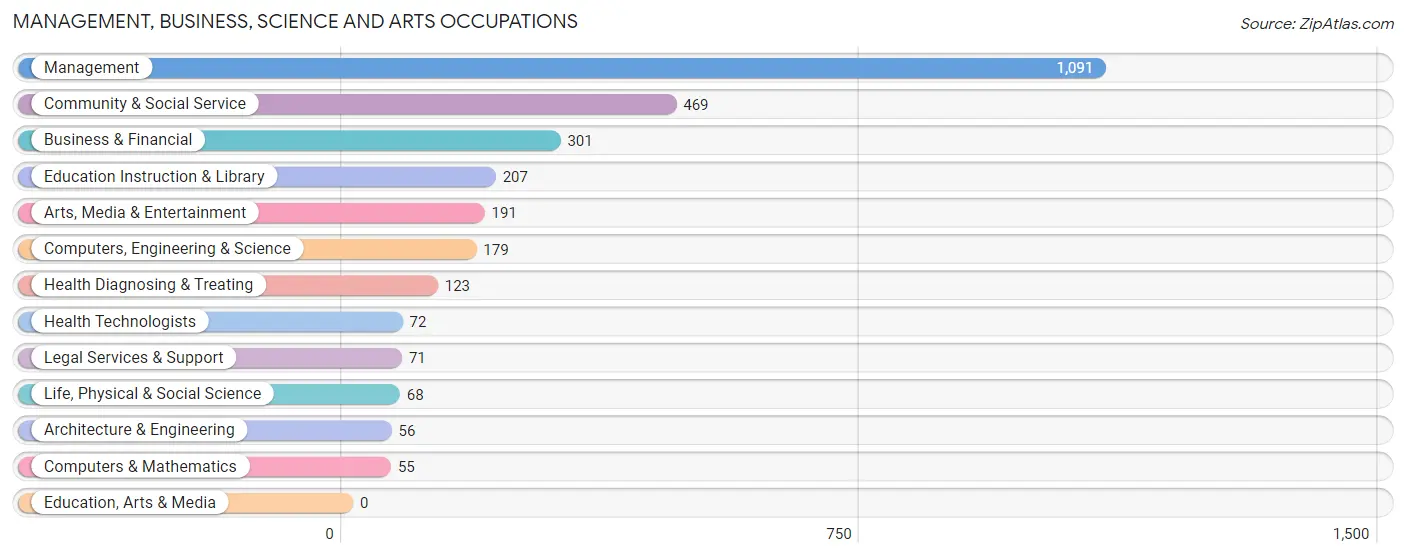
Management, Business, Science and Arts Occupations
The most common Management, Business, Science and Arts occupations in Marco Island are Management (1,091 | 23.4%), Community & Social Service (469 | 10.0%), Business & Financial (301 | 6.4%), Education Instruction & Library (207 | 4.4%), and Arts, Media & Entertainment (191 | 4.1%).
Management, Business, Science and Arts Occupations by Sex
Within the Management, Business, Science and Arts occupations in Marco Island, the most male-oriented occupations are Computers & Mathematics (100.0%), Legal Services & Support (88.7%), and Architecture & Engineering (85.7%), while the most female-oriented occupations are Education Instruction & Library (94.7%), Health Diagnosing & Treating (91.9%), and Health Technologists (86.1%).
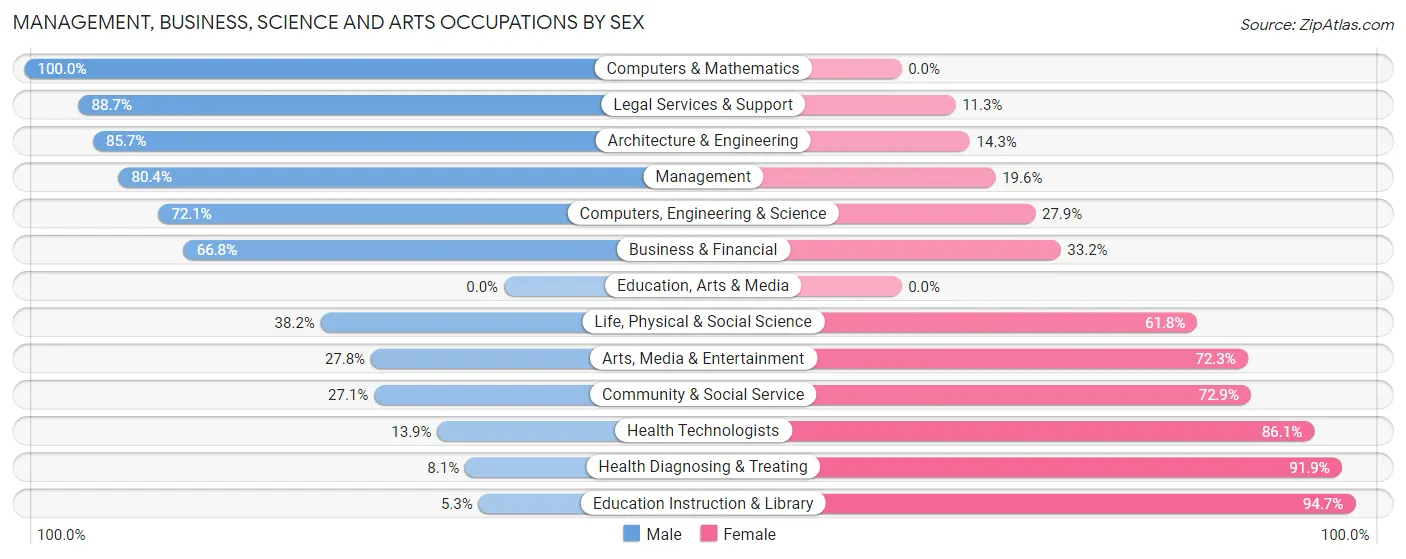
| Occupation | Male | Female |
| Management | 877 (80.4%) | 214 (19.6%) |
| Business & Financial | 201 (66.8%) | 100 (33.2%) |
| Computers, Engineering & Science | 129 (72.1%) | 50 (27.9%) |
| Computers & Mathematics | 55 (100.0%) | 0 (0.0%) |
| Architecture & Engineering | 48 (85.7%) | 8 (14.3%) |
| Life, Physical & Social Science | 26 (38.2%) | 42 (61.8%) |
| Community & Social Service | 127 (27.1%) | 342 (72.9%) |
| Education, Arts & Media | 0 (0.0%) | 0 (0.0%) |
| Legal Services & Support | 63 (88.7%) | 8 (11.3%) |
| Education Instruction & Library | 11 (5.3%) | 196 (94.7%) |
| Arts, Media & Entertainment | 53 (27.8%) | 138 (72.3%) |
| Health Diagnosing & Treating | 10 (8.1%) | 113 (91.9%) |
| Health Technologists | 10 (13.9%) | 62 (86.1%) |
| Total (Category) | 1,344 (62.1%) | 819 (37.9%) |
| Total (Overall) | 2,603 (55.7%) | 2,068 (44.3%) |
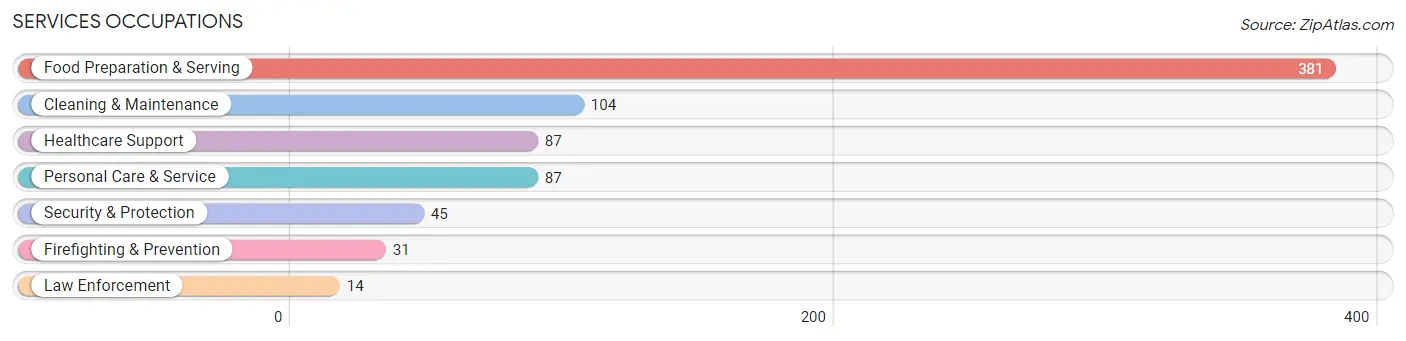
Services Occupations
The most common Services occupations in Marco Island are Food Preparation & Serving (381 | 8.2%), Cleaning & Maintenance (104 | 2.2%), Healthcare Support (87 | 1.9%), Personal Care & Service (87 | 1.9%), and Security & Protection (45 | 1.0%).
Services Occupations by Sex
Within the Services occupations in Marco Island, the most male-oriented occupations are Security & Protection (100.0%), Firefighting & Prevention (100.0%), and Law Enforcement (100.0%), while the most female-oriented occupations are Healthcare Support (87.4%), Food Preparation & Serving (46.5%), and Personal Care & Service (43.7%).
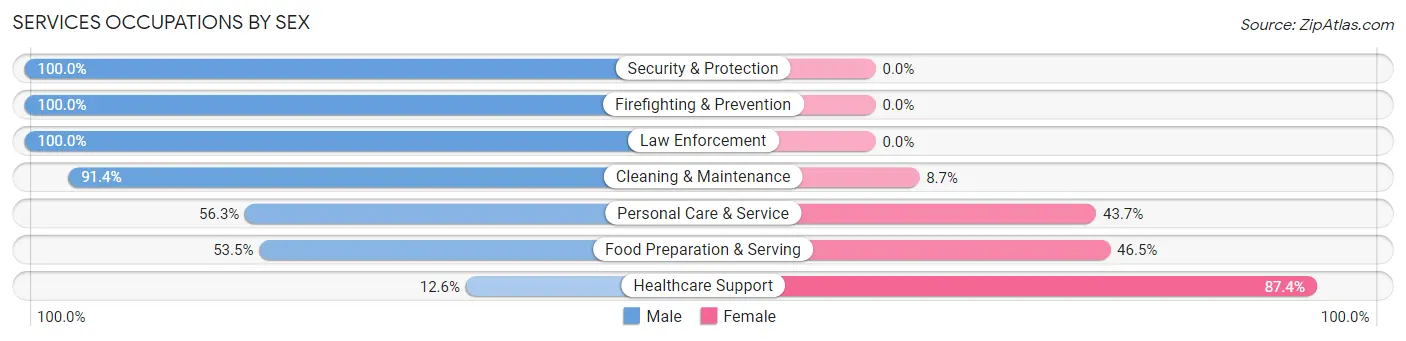
| Occupation | Male | Female |
| Healthcare Support | 11 (12.6%) | 76 (87.4%) |
| Security & Protection | 45 (100.0%) | 0 (0.0%) |
| Firefighting & Prevention | 31 (100.0%) | 0 (0.0%) |
| Law Enforcement | 14 (100.0%) | 0 (0.0%) |
| Food Preparation & Serving | 204 (53.5%) | 177 (46.5%) |
| Cleaning & Maintenance | 95 (91.3%) | 9 (8.6%) |
| Personal Care & Service | 49 (56.3%) | 38 (43.7%) |
| Total (Category) | 404 (57.4%) | 300 (42.6%) |
| Total (Overall) | 2,603 (55.7%) | 2,068 (44.3%) |
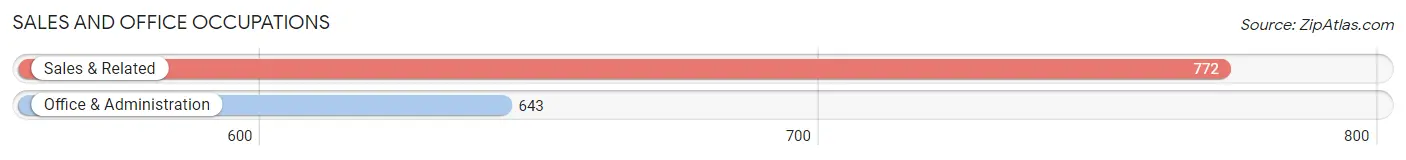
Sales and Office Occupations
The most common Sales and Office occupations in Marco Island are Sales & Related (772 | 16.5%), and Office & Administration (643 | 13.8%).
Sales and Office Occupations by Sex
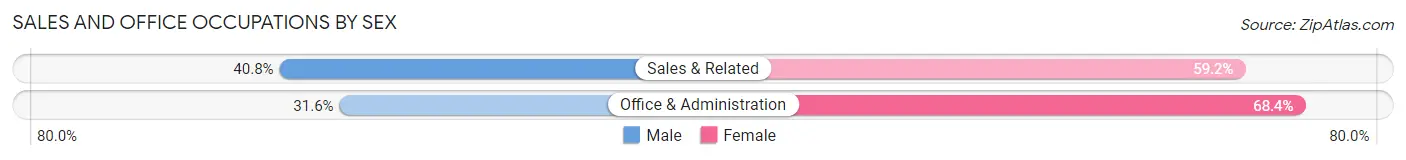
| Occupation | Male | Female |
| Sales & Related | 315 (40.8%) | 457 (59.2%) |
| Office & Administration | 203 (31.6%) | 440 (68.4%) |
| Total (Category) | 518 (36.6%) | 897 (63.4%) |
| Total (Overall) | 2,603 (55.7%) | 2,068 (44.3%) |
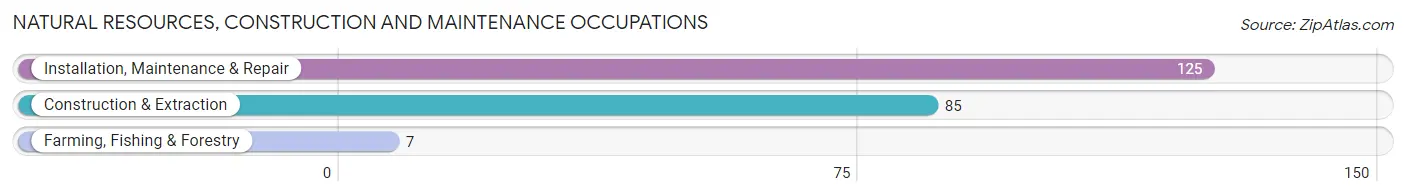
Natural Resources, Construction and Maintenance Occupations
The most common Natural Resources, Construction and Maintenance occupations in Marco Island are Installation, Maintenance & Repair (125 | 2.7%), Construction & Extraction (85 | 1.8%), and Farming, Fishing & Forestry (7 | 0.2%).
Natural Resources, Construction and Maintenance Occupations by Sex
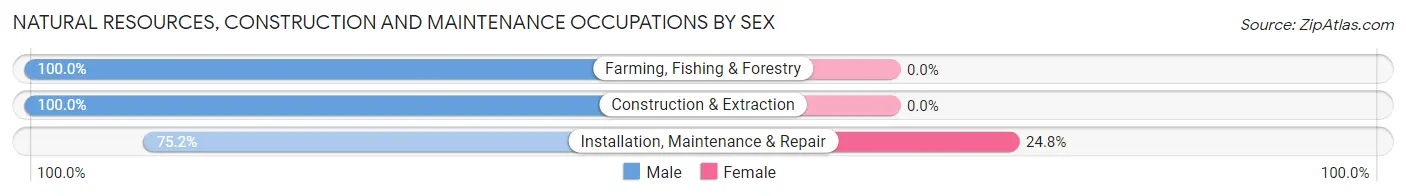
| Occupation | Male | Female |
| Farming, Fishing & Forestry | 7 (100.0%) | 0 (0.0%) |
| Construction & Extraction | 85 (100.0%) | 0 (0.0%) |
| Installation, Maintenance & Repair | 94 (75.2%) | 31 (24.8%) |
| Total (Category) | 186 (85.7%) | 31 (14.3%) |
| Total (Overall) | 2,603 (55.7%) | 2,068 (44.3%) |
Production, Transportation and Moving Occupations
The most common Production, Transportation and Moving occupations in Marco Island are Production (103 | 2.2%), Transportation (43 | 0.9%), and Material Moving (26 | 0.6%).
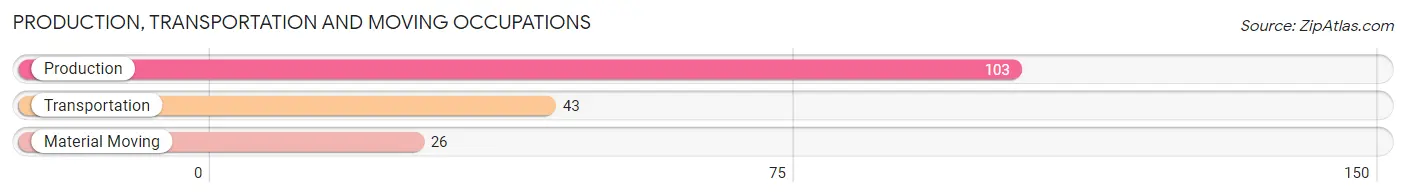
Production, Transportation and Moving Occupations by Sex
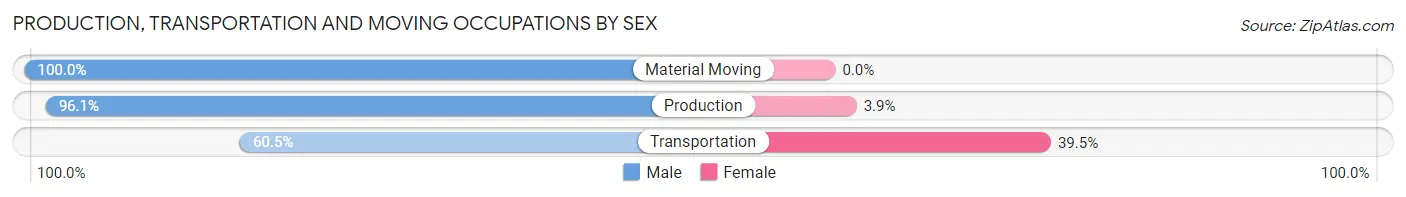
| Occupation | Male | Female |
| Production | 99 (96.1%) | 4 (3.9%) |
| Transportation | 26 (60.5%) | 17 (39.5%) |
| Material Moving | 26 (100.0%) | 0 (0.0%) |
| Total (Category) | 151 (87.8%) | 21 (12.2%) |
| Total (Overall) | 2,603 (55.7%) | 2,068 (44.3%) |
Employment Industries by Sex in Marco Island
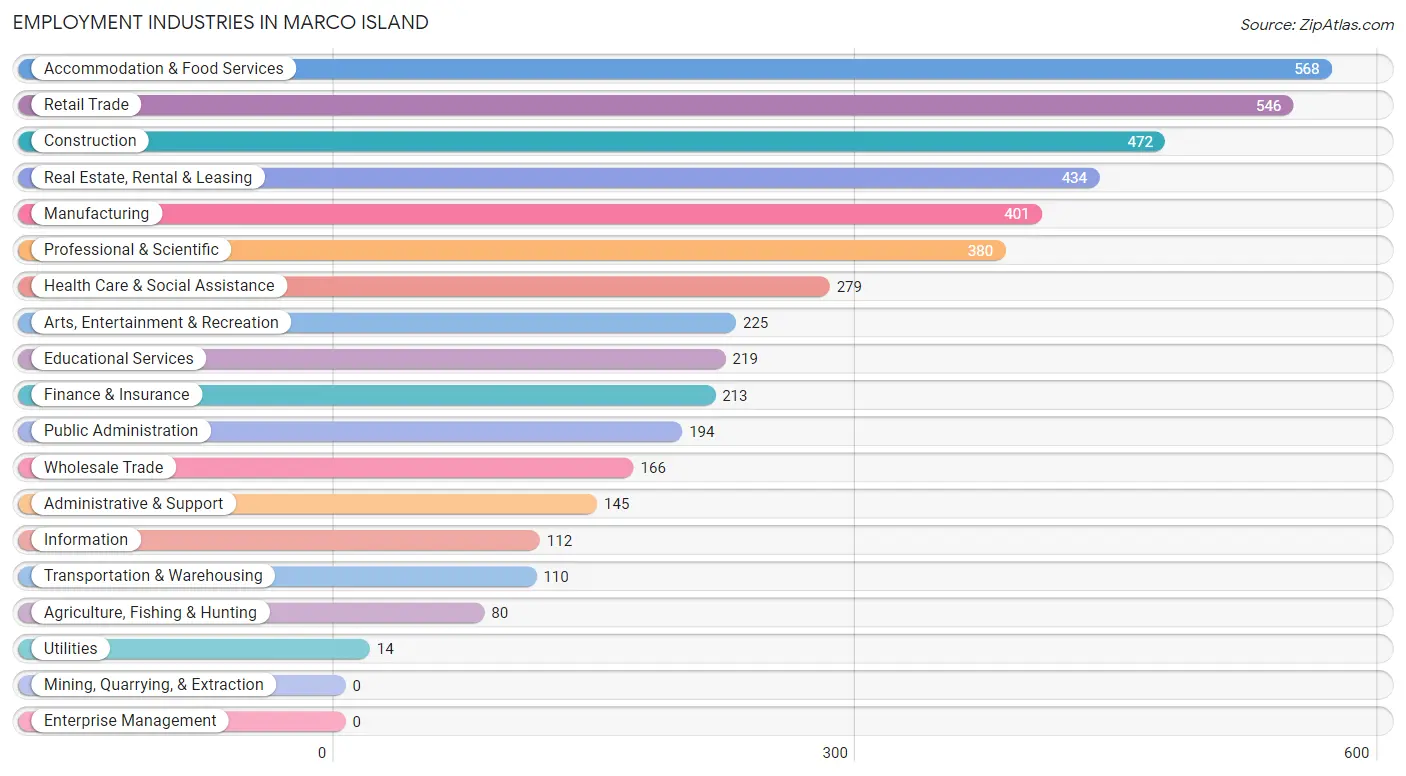
Employment Industries in Marco Island
The major employment industries in Marco Island include Accommodation & Food Services (568 | 12.2%), Retail Trade (546 | 11.7%), Construction (472 | 10.1%), Real Estate, Rental & Leasing (434 | 9.3%), and Manufacturing (401 | 8.6%).
Employment Industries by Sex in Marco Island
The Marco Island industries that see more men than women are Utilities (100.0%), Construction (86.4%), and Administrative & Support (84.8%), whereas the industries that tend to have a higher number of women are Educational Services (90.4%), Health Care & Social Assistance (82.1%), and Arts, Entertainment & Recreation (77.3%).
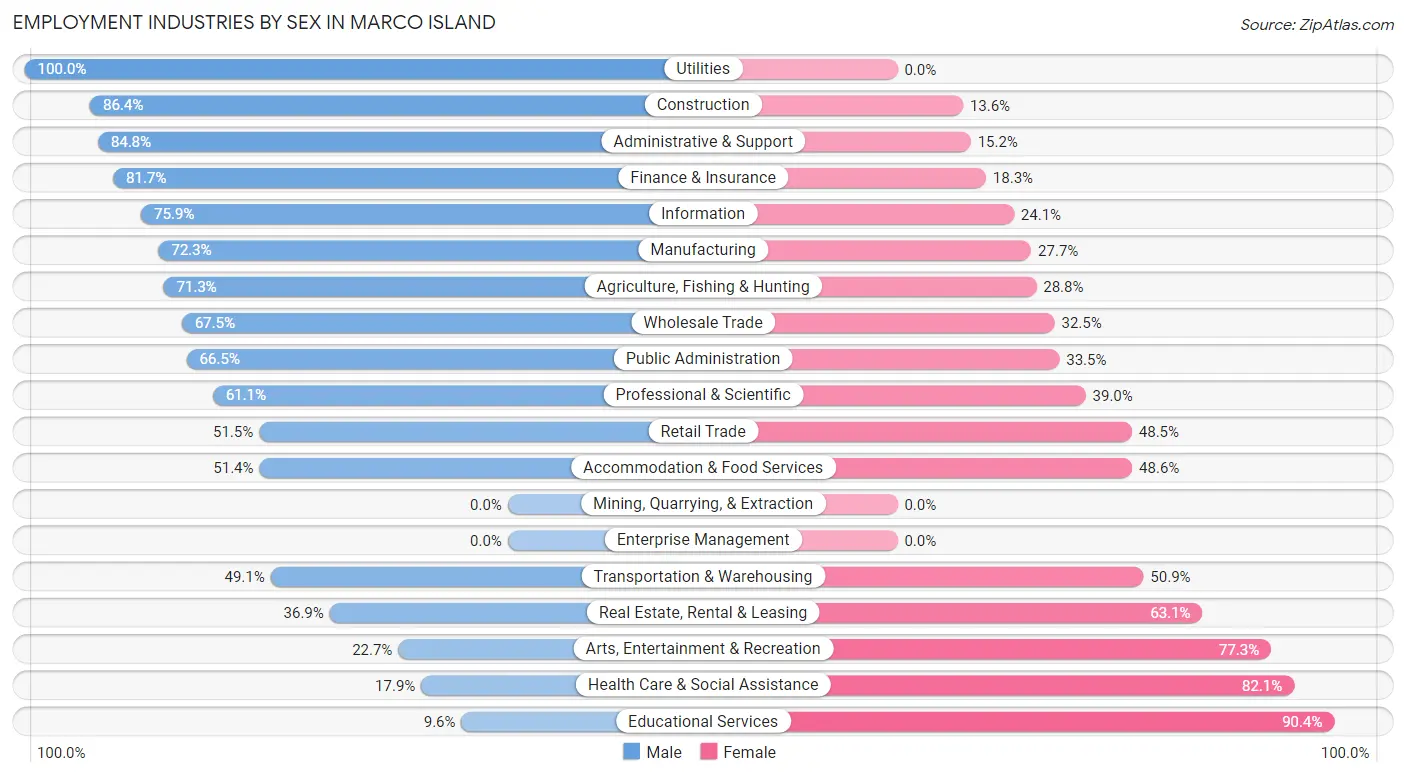
| Industry | Male | Female |
| Agriculture, Fishing & Hunting | 57 (71.3%) | 23 (28.7%) |
| Mining, Quarrying, & Extraction | 0 (0.0%) | 0 (0.0%) |
| Construction | 408 (86.4%) | 64 (13.6%) |
| Manufacturing | 290 (72.3%) | 111 (27.7%) |
| Wholesale Trade | 112 (67.5%) | 54 (32.5%) |
| Retail Trade | 281 (51.5%) | 265 (48.5%) |
| Transportation & Warehousing | 54 (49.1%) | 56 (50.9%) |
| Utilities | 14 (100.0%) | 0 (0.0%) |
| Information | 85 (75.9%) | 27 (24.1%) |
| Finance & Insurance | 174 (81.7%) | 39 (18.3%) |
| Real Estate, Rental & Leasing | 160 (36.9%) | 274 (63.1%) |
| Professional & Scientific | 232 (61.1%) | 148 (39.0%) |
| Enterprise Management | 0 (0.0%) | 0 (0.0%) |
| Administrative & Support | 123 (84.8%) | 22 (15.2%) |
| Educational Services | 21 (9.6%) | 198 (90.4%) |
| Health Care & Social Assistance | 50 (17.9%) | 229 (82.1%) |
| Arts, Entertainment & Recreation | 51 (22.7%) | 174 (77.3%) |
| Accommodation & Food Services | 292 (51.4%) | 276 (48.6%) |
| Public Administration | 129 (66.5%) | 65 (33.5%) |
| Total | 2,603 (55.7%) | 2,068 (44.3%) |
Education in Marco Island
School Enrollment in Marco Island
The most common levels of schooling among the 1,349 students in Marco Island are elementary school (395 | 29.3%), middle school (277 | 20.5%), and high school (234 | 17.3%).
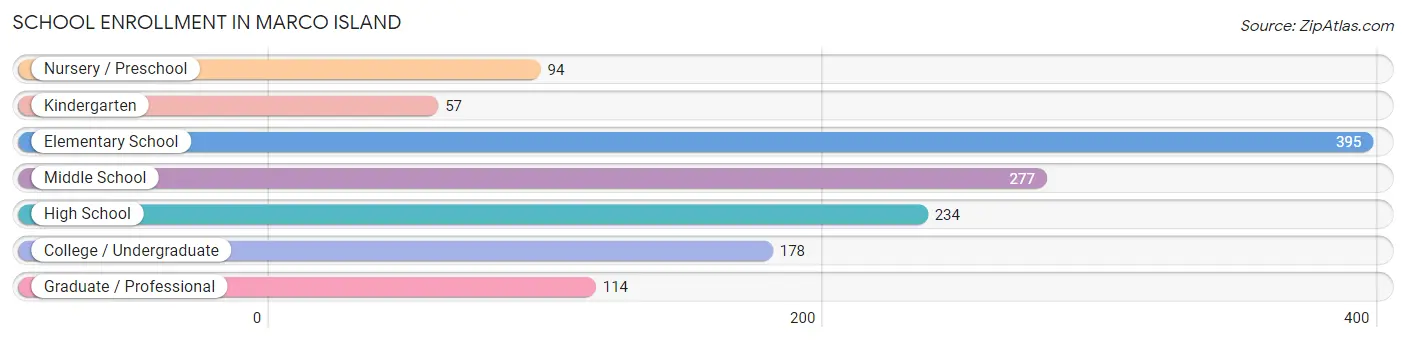
| School Level | # Students | % Students |
| Nursery / Preschool | 94 | 7.0% |
| Kindergarten | 57 | 4.2% |
| Elementary School | 395 | 29.3% |
| Middle School | 277 | 20.5% |
| High School | 234 | 17.3% |
| College / Undergraduate | 178 | 13.2% |
| Graduate / Professional | 114 | 8.5% |
| Total | 1,349 | 100.0% |
School Enrollment by Age by Funding Source in Marco Island
Out of a total of 1,349 students who are enrolled in schools in Marco Island, 289 (21.4%) attend a private institution, while the remaining 1,060 (78.6%) are enrolled in public schools. The age group of 18 to 19 year olds has the highest likelihood of being enrolled in private schools, with 9 (100.0% in the age bracket) enrolled. Conversely, the age group of 15 to 17 year olds has the lowest likelihood of being enrolled in a private school, with 204 (100.0% in the age bracket) attending a public institution.
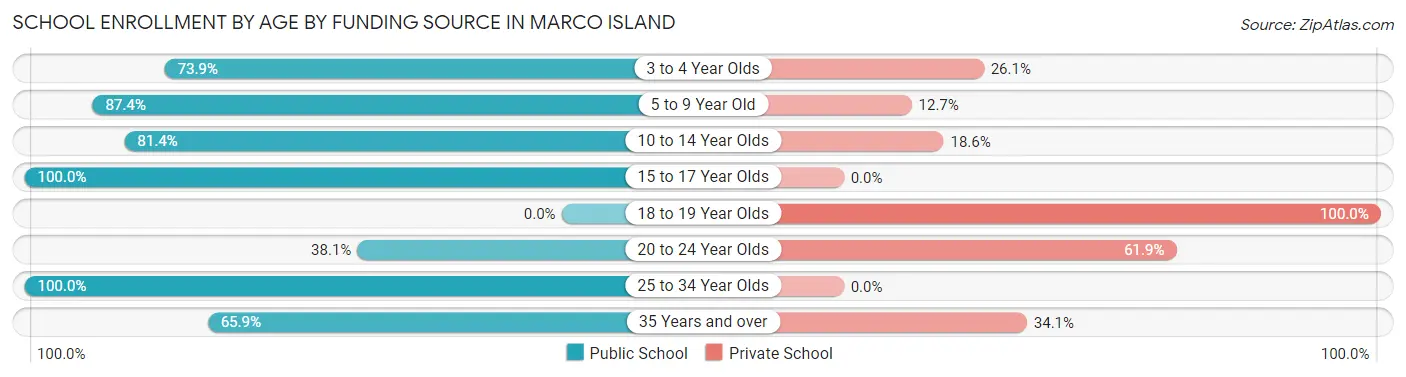
| Age Bracket | Public School | Private School |
| 3 to 4 Year Olds | 51 (73.9%) | 18 (26.1%) |
| 5 to 9 Year Old | 283 (87.4%) | 41 (12.7%) |
| 10 to 14 Year Olds | 350 (81.4%) | 80 (18.6%) |
| 15 to 17 Year Olds | 204 (100.0%) | 0 (0.0%) |
| 18 to 19 Year Olds | 0 (0.0%) | 9 (100.0%) |
| 20 to 24 Year Olds | 51 (38.1%) | 83 (61.9%) |
| 25 to 34 Year Olds | 9 (100.0%) | 0 (0.0%) |
| 35 Years and over | 112 (65.9%) | 58 (34.1%) |
| Total | 1,060 (78.6%) | 289 (21.4%) |
Educational Attainment by Field of Study in Marco Island
Business (1,849 | 26.0%), education (1,053 | 14.8%), social sciences (837 | 11.8%), science & technology (680 | 9.6%), and engineering (579 | 8.2%) are the most common fields of study among 7,108 individuals in Marco Island who have obtained a bachelor's degree or higher.
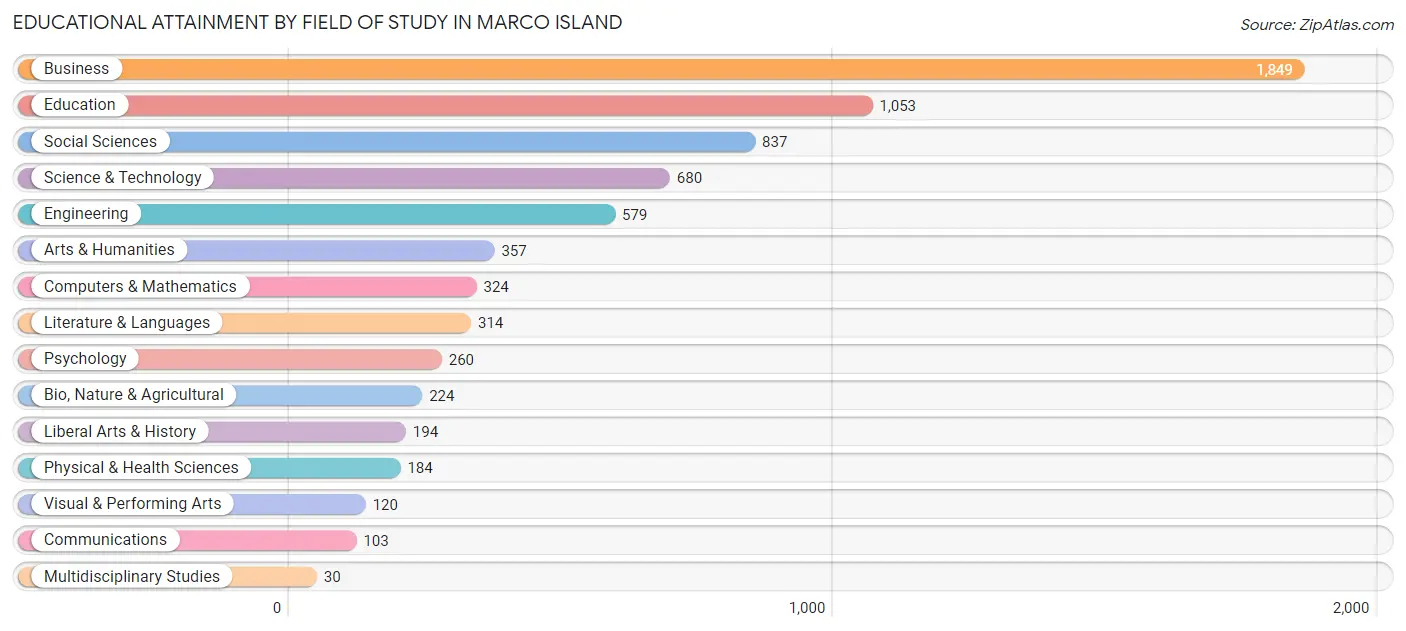
| Field of Study | # Graduates | % Graduates |
| Computers & Mathematics | 324 | 4.6% |
| Bio, Nature & Agricultural | 224 | 3.2% |
| Physical & Health Sciences | 184 | 2.6% |
| Psychology | 260 | 3.7% |
| Social Sciences | 837 | 11.8% |
| Engineering | 579 | 8.2% |
| Multidisciplinary Studies | 30 | 0.4% |
| Science & Technology | 680 | 9.6% |
| Business | 1,849 | 26.0% |
| Education | 1,053 | 14.8% |
| Literature & Languages | 314 | 4.4% |
| Liberal Arts & History | 194 | 2.7% |
| Visual & Performing Arts | 120 | 1.7% |
| Communications | 103 | 1.5% |
| Arts & Humanities | 357 | 5.0% |
| Total | 7,108 | 100.0% |
Transportation & Commute in Marco Island
Vehicle Availability by Sex in Marco Island
The most prevalent vehicle ownership categories in Marco Island are males with 2 vehicles (1,471, accounting for 56.8%) and females with 2 vehicles (1,228, making up 72.5%).
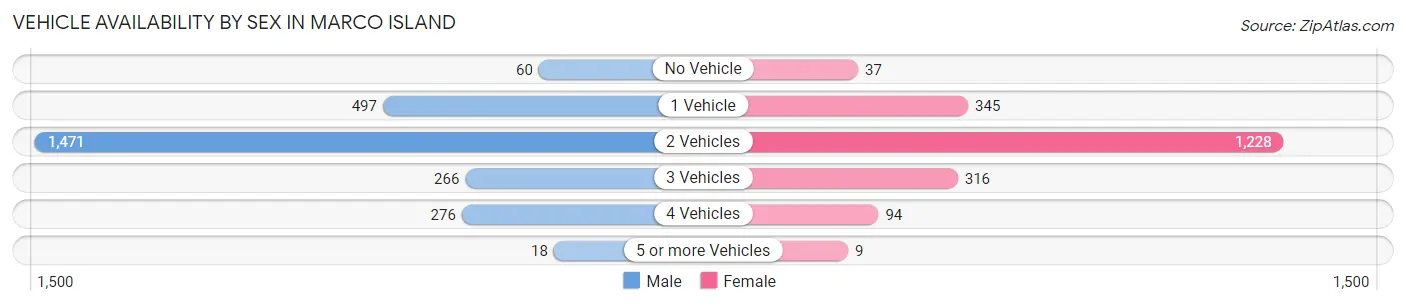
| Vehicles Available | Male | Female |
| No Vehicle | 60 (2.3%) | 37 (1.8%) |
| 1 Vehicle | 497 (19.2%) | 345 (17.0%) |
| 2 Vehicles | 1,471 (56.8%) | 1,228 (60.5%) |
| 3 Vehicles | 266 (10.3%) | 316 (15.6%) |
| 4 Vehicles | 276 (10.7%) | 94 (4.6%) |
| 5 or more Vehicles | 18 (0.7%) | 9 (0.4%) |
| Total | 2,588 (100.0%) | 2,029 (100.0%) |
Commute Time in Marco Island
The most frequently occuring commute durations in Marco Island are 5 to 9 minutes (852 commuters, 24.8%), 10 to 14 minutes (579 commuters, 16.9%), and 15 to 19 minutes (349 commuters, 10.2%).
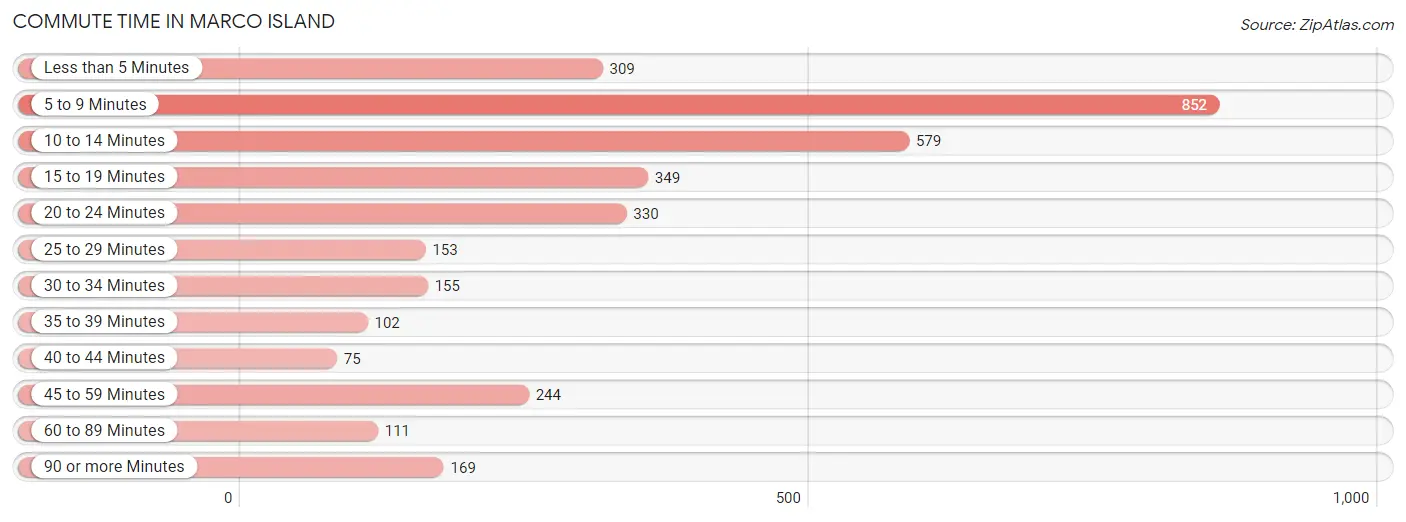
| Commute Time | # Commuters | % Commuters |
| Less than 5 Minutes | 309 | 9.0% |
| 5 to 9 Minutes | 852 | 24.8% |
| 10 to 14 Minutes | 579 | 16.9% |
| 15 to 19 Minutes | 349 | 10.2% |
| 20 to 24 Minutes | 330 | 9.6% |
| 25 to 29 Minutes | 153 | 4.5% |
| 30 to 34 Minutes | 155 | 4.5% |
| 35 to 39 Minutes | 102 | 3.0% |
| 40 to 44 Minutes | 75 | 2.2% |
| 45 to 59 Minutes | 244 | 7.1% |
| 60 to 89 Minutes | 111 | 3.2% |
| 90 or more Minutes | 169 | 4.9% |
Commute Time by Sex in Marco Island
The most common commute times in Marco Island are 5 to 9 minutes (467 commuters, 24.2%) for males and 5 to 9 minutes (385 commuters, 25.7%) for females.
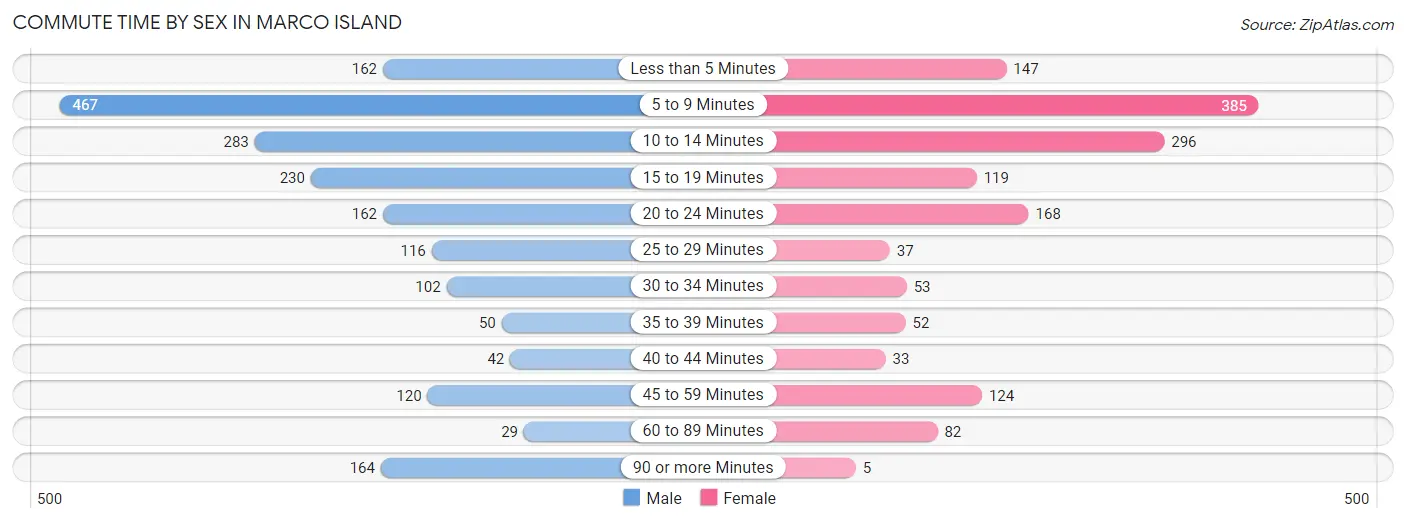
| Commute Time | Male | Female |
| Less than 5 Minutes | 162 (8.4%) | 147 (9.8%) |
| 5 to 9 Minutes | 467 (24.2%) | 385 (25.7%) |
| 10 to 14 Minutes | 283 (14.7%) | 296 (19.7%) |
| 15 to 19 Minutes | 230 (11.9%) | 119 (7.9%) |
| 20 to 24 Minutes | 162 (8.4%) | 168 (11.2%) |
| 25 to 29 Minutes | 116 (6.0%) | 37 (2.5%) |
| 30 to 34 Minutes | 102 (5.3%) | 53 (3.5%) |
| 35 to 39 Minutes | 50 (2.6%) | 52 (3.5%) |
| 40 to 44 Minutes | 42 (2.2%) | 33 (2.2%) |
| 45 to 59 Minutes | 120 (6.2%) | 124 (8.3%) |
| 60 to 89 Minutes | 29 (1.5%) | 82 (5.5%) |
| 90 or more Minutes | 164 (8.5%) | 5 (0.3%) |
Time of Departure to Work by Sex in Marco Island
The most frequent times of departure to work in Marco Island are 8:00 AM to 8:29 AM (326, 16.9%) for males and 7:30 AM to 7:59 AM (264, 17.6%) for females.
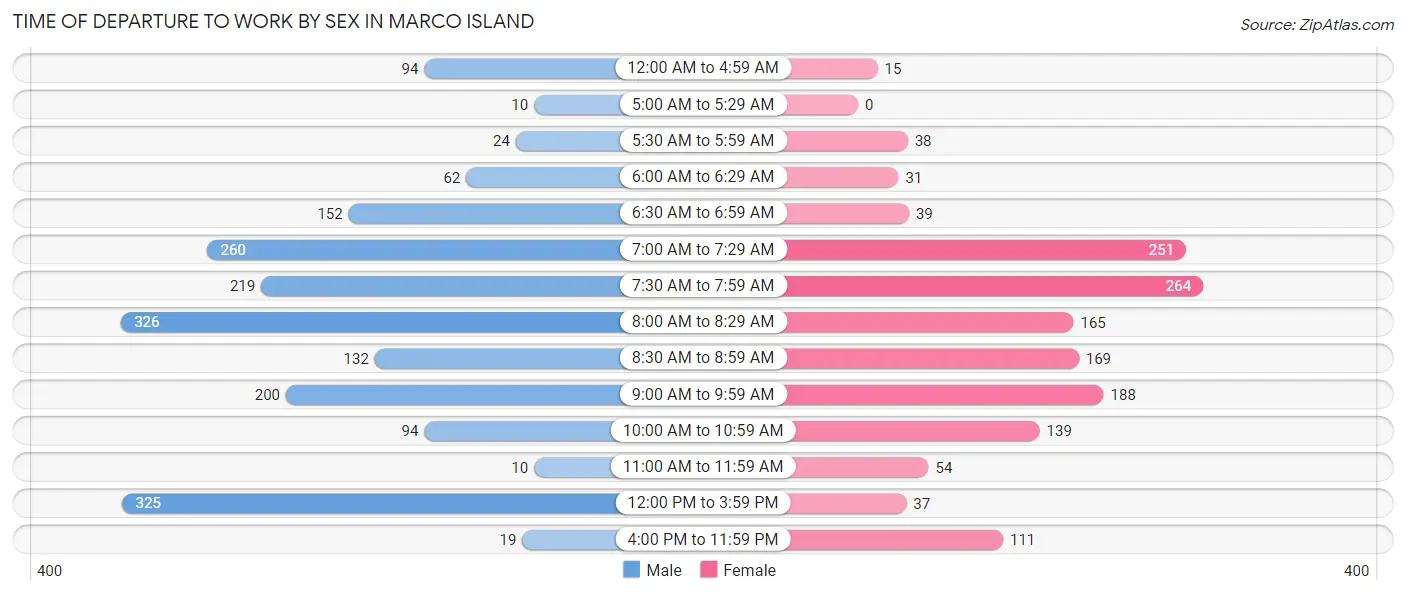
| Time of Departure | Male | Female |
| 12:00 AM to 4:59 AM | 94 (4.9%) | 15 (1.0%) |
| 5:00 AM to 5:29 AM | 10 (0.5%) | 0 (0.0%) |
| 5:30 AM to 5:59 AM | 24 (1.3%) | 38 (2.5%) |
| 6:00 AM to 6:29 AM | 62 (3.2%) | 31 (2.1%) |
| 6:30 AM to 6:59 AM | 152 (7.9%) | 39 (2.6%) |
| 7:00 AM to 7:29 AM | 260 (13.5%) | 251 (16.7%) |
| 7:30 AM to 7:59 AM | 219 (11.4%) | 264 (17.6%) |
| 8:00 AM to 8:29 AM | 326 (16.9%) | 165 (11.0%) |
| 8:30 AM to 8:59 AM | 132 (6.9%) | 169 (11.3%) |
| 9:00 AM to 9:59 AM | 200 (10.4%) | 188 (12.5%) |
| 10:00 AM to 10:59 AM | 94 (4.9%) | 139 (9.3%) |
| 11:00 AM to 11:59 AM | 10 (0.5%) | 54 (3.6%) |
| 12:00 PM to 3:59 PM | 325 (16.9%) | 37 (2.5%) |
| 4:00 PM to 11:59 PM | 19 (1.0%) | 111 (7.4%) |
| Total | 1,927 (100.0%) | 1,501 (100.0%) |
Housing Occupancy in Marco Island
Occupancy by Ownership in Marco Island
Of the total 8,276 dwellings in Marco Island, owner-occupied units account for 7,487 (90.5%), while renter-occupied units make up 789 (9.5%).
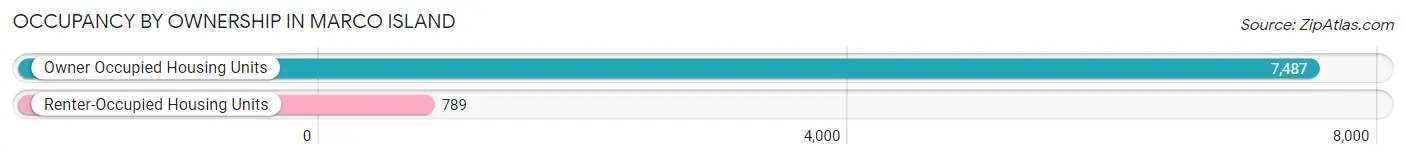
| Occupancy | # Housing Units | % Housing Units |
| Owner Occupied Housing Units | 7,487 | 90.5% |
| Renter-Occupied Housing Units | 789 | 9.5% |
| Total Occupied Housing Units | 8,276 | 100.0% |
Occupancy by Household Size in Marco Island
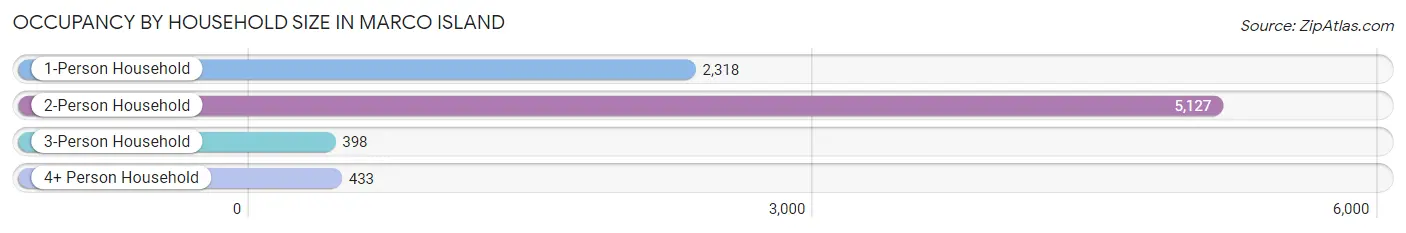
| Household Size | # Housing Units | % Housing Units |
| 1-Person Household | 2,318 | 28.0% |
| 2-Person Household | 5,127 | 62.0% |
| 3-Person Household | 398 | 4.8% |
| 4+ Person Household | 433 | 5.2% |
| Total Housing Units | 8,276 | 100.0% |
Occupancy by Ownership by Household Size in Marco Island
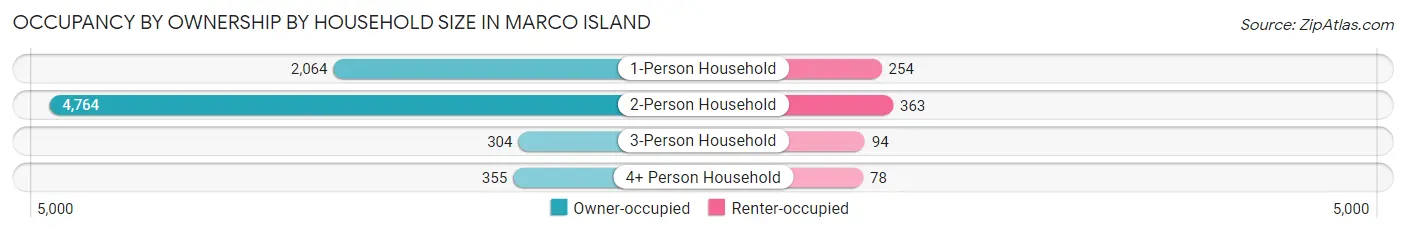
| Household Size | Owner-occupied | Renter-occupied |
| 1-Person Household | 2,064 (89.0%) | 254 (11.0%) |
| 2-Person Household | 4,764 (92.9%) | 363 (7.1%) |
| 3-Person Household | 304 (76.4%) | 94 (23.6%) |
| 4+ Person Household | 355 (82.0%) | 78 (18.0%) |
| Total Housing Units | 7,487 (90.5%) | 789 (9.5%) |
Occupancy by Educational Attainment in Marco Island
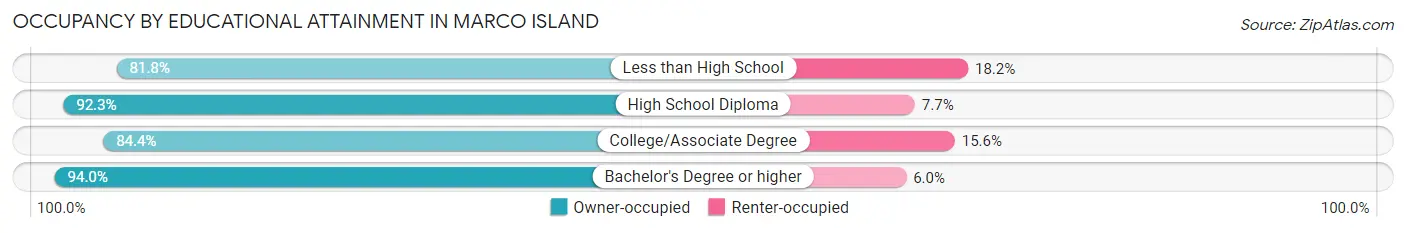
| Household Size | Owner-occupied | Renter-occupied |
| Less than High School | 220 (81.8%) | 49 (18.2%) |
| High School Diploma | 1,335 (92.3%) | 111 (7.7%) |
| College/Associate Degree | 2,084 (84.4%) | 385 (15.6%) |
| Bachelor's Degree or higher | 3,848 (94.0%) | 244 (6.0%) |
Occupancy by Age of Householder in Marco Island
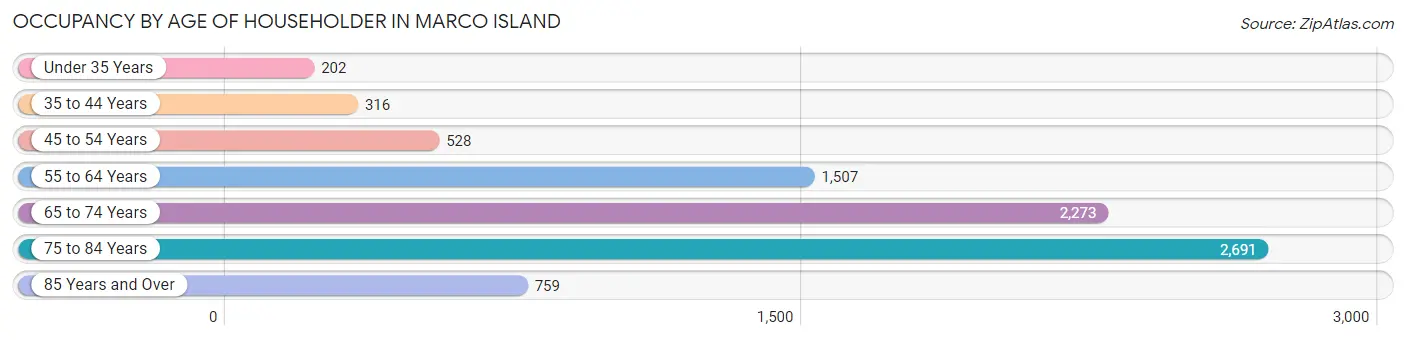
| Age Bracket | # Households | % Households |
| Under 35 Years | 202 | 2.4% |
| 35 to 44 Years | 316 | 3.8% |
| 45 to 54 Years | 528 | 6.4% |
| 55 to 64 Years | 1,507 | 18.2% |
| 65 to 74 Years | 2,273 | 27.5% |
| 75 to 84 Years | 2,691 | 32.5% |
| 85 Years and Over | 759 | 9.2% |
| Total | 8,276 | 100.0% |
Housing Finances in Marco Island
Median Income by Occupancy in Marco Island
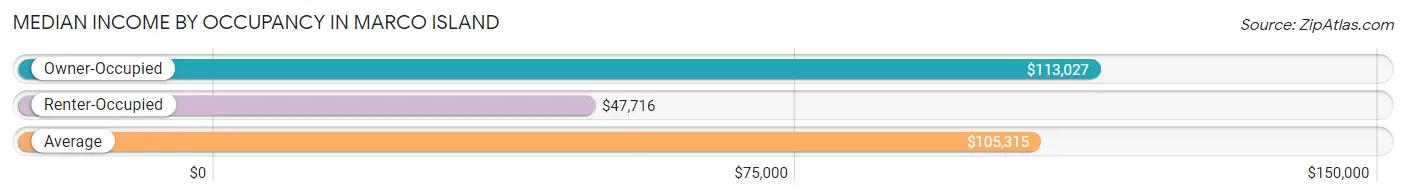
| Occupancy Type | # Households | Median Income |
| Owner-Occupied | 7,487 (90.5%) | $113,027 |
| Renter-Occupied | 789 (9.5%) | $47,716 |
| Average | 8,276 (100.0%) | $105,315 |
Occupancy by Householder Income Bracket in Marco Island
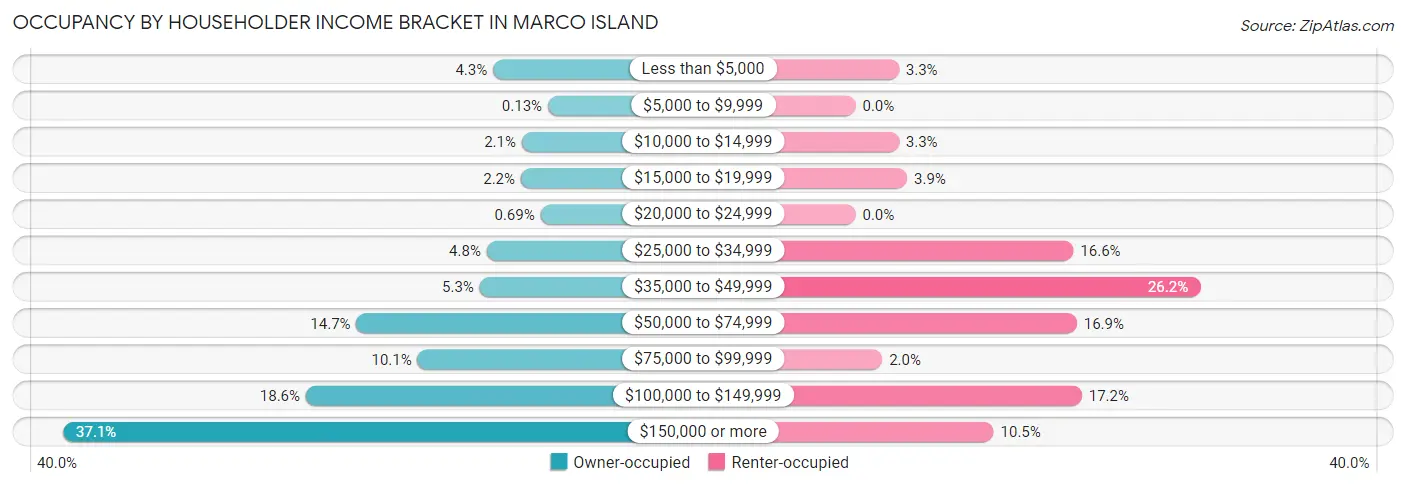
| Income Bracket | Owner-occupied | Renter-occupied |
| Less than $5,000 | 323 (4.3%) | 26 (3.3%) |
| $5,000 to $9,999 | 10 (0.1%) | 0 (0.0%) |
| $10,000 to $14,999 | 159 (2.1%) | 26 (3.3%) |
| $15,000 to $19,999 | 164 (2.2%) | 31 (3.9%) |
| $20,000 to $24,999 | 52 (0.7%) | 0 (0.0%) |
| $25,000 to $34,999 | 359 (4.8%) | 131 (16.6%) |
| $35,000 to $49,999 | 399 (5.3%) | 207 (26.2%) |
| $50,000 to $74,999 | 1,102 (14.7%) | 133 (16.9%) |
| $75,000 to $99,999 | 753 (10.1%) | 16 (2.0%) |
| $100,000 to $149,999 | 1,390 (18.6%) | 136 (17.2%) |
| $150,000 or more | 2,776 (37.1%) | 83 (10.5%) |
| Total | 7,487 (100.0%) | 789 (100.0%) |
Monthly Housing Cost Tiers in Marco Island
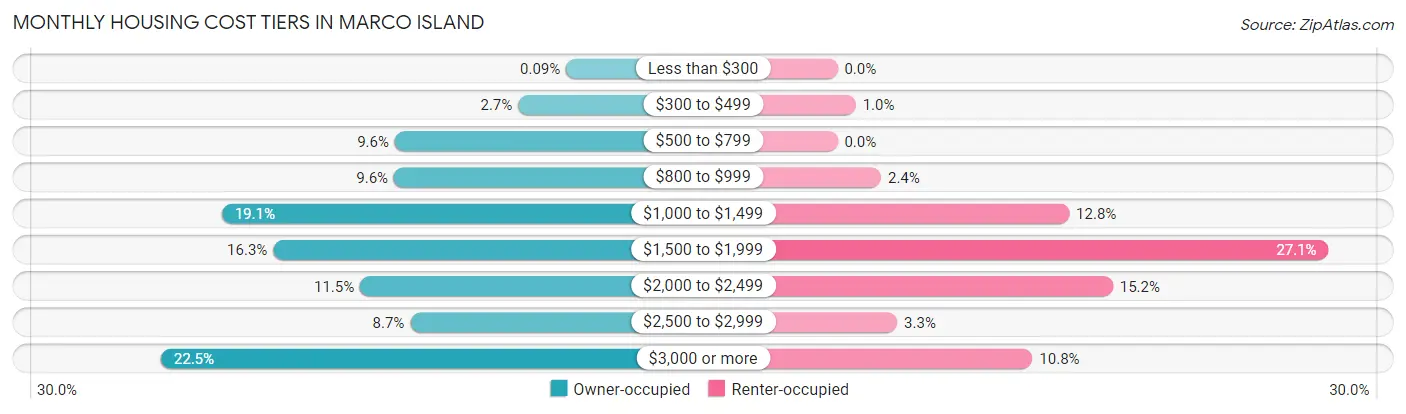
| Monthly Cost | Owner-occupied | Renter-occupied |
| Less than $300 | 7 (0.1%) | 0 (0.0%) |
| $300 to $499 | 205 (2.7%) | 8 (1.0%) |
| $500 to $799 | 715 (9.6%) | 0 (0.0%) |
| $800 to $999 | 719 (9.6%) | 19 (2.4%) |
| $1,000 to $1,499 | 1,431 (19.1%) | 101 (12.8%) |
| $1,500 to $1,999 | 1,218 (16.3%) | 214 (27.1%) |
| $2,000 to $2,499 | 859 (11.5%) | 120 (15.2%) |
| $2,500 to $2,999 | 651 (8.7%) | 26 (3.3%) |
| $3,000 or more | 1,682 (22.5%) | 85 (10.8%) |
| Total | 7,487 (100.0%) | 789 (100.0%) |
Physical Housing Characteristics in Marco Island
Housing Structures in Marco Island
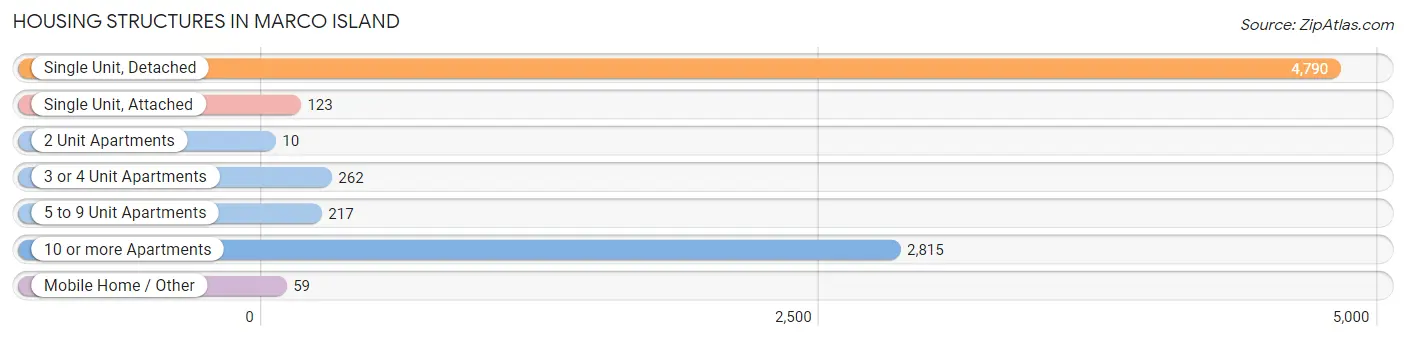
| Structure Type | # Housing Units | % Housing Units |
| Single Unit, Detached | 4,790 | 57.9% |
| Single Unit, Attached | 123 | 1.5% |
| 2 Unit Apartments | 10 | 0.1% |
| 3 or 4 Unit Apartments | 262 | 3.2% |
| 5 to 9 Unit Apartments | 217 | 2.6% |
| 10 or more Apartments | 2,815 | 34.0% |
| Mobile Home / Other | 59 | 0.7% |
| Total | 8,276 | 100.0% |
Housing Structures by Occupancy in Marco Island
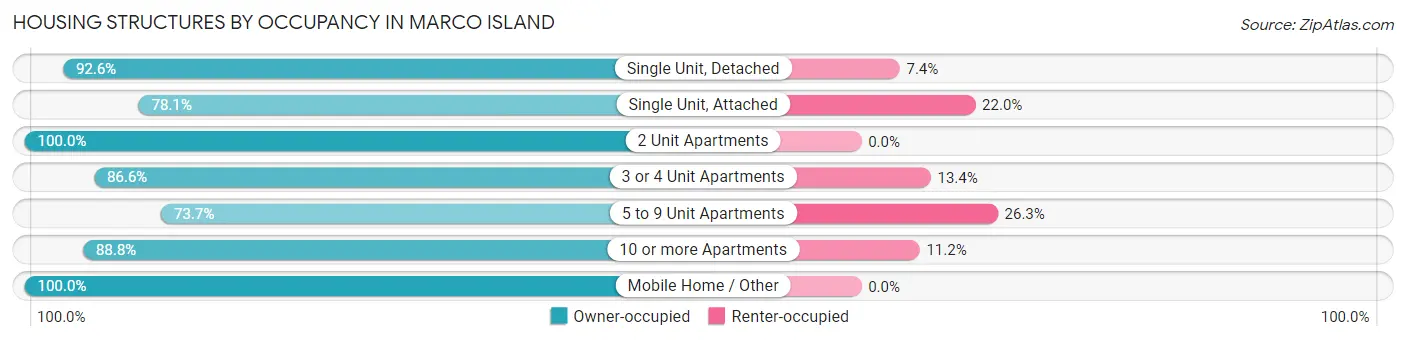
| Structure Type | Owner-occupied | Renter-occupied |
| Single Unit, Detached | 4,436 (92.6%) | 354 (7.4%) |
| Single Unit, Attached | 96 (78.0%) | 27 (22.0%) |
| 2 Unit Apartments | 10 (100.0%) | 0 (0.0%) |
| 3 or 4 Unit Apartments | 227 (86.6%) | 35 (13.4%) |
| 5 to 9 Unit Apartments | 160 (73.7%) | 57 (26.3%) |
| 10 or more Apartments | 2,499 (88.8%) | 316 (11.2%) |
| Mobile Home / Other | 59 (100.0%) | 0 (0.0%) |
| Total | 7,487 (90.5%) | 789 (9.5%) |
Housing Structures by Number of Rooms in Marco Island
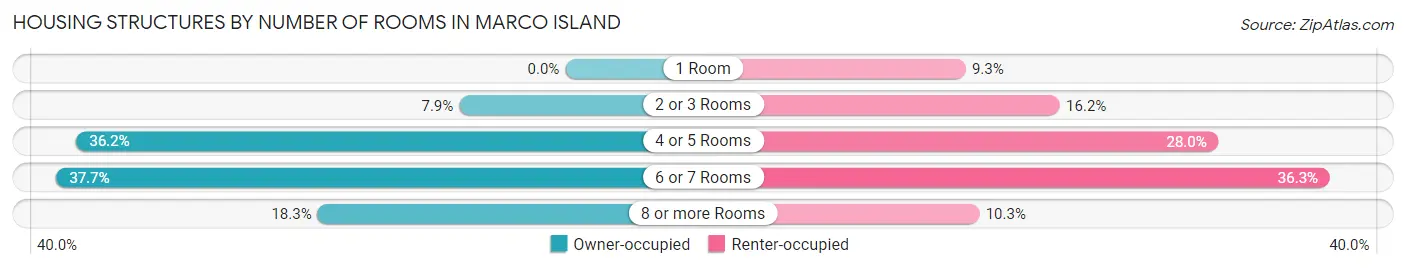
| Number of Rooms | Owner-occupied | Renter-occupied |
| 1 Room | 0 (0.0%) | 73 (9.2%) |
| 2 or 3 Rooms | 588 (7.9%) | 128 (16.2%) |
| 4 or 5 Rooms | 2,708 (36.2%) | 221 (28.0%) |
| 6 or 7 Rooms | 2,819 (37.7%) | 286 (36.2%) |
| 8 or more Rooms | 1,372 (18.3%) | 81 (10.3%) |
| Total | 7,487 (100.0%) | 789 (100.0%) |
Housing Structure by Heating Type in Marco Island
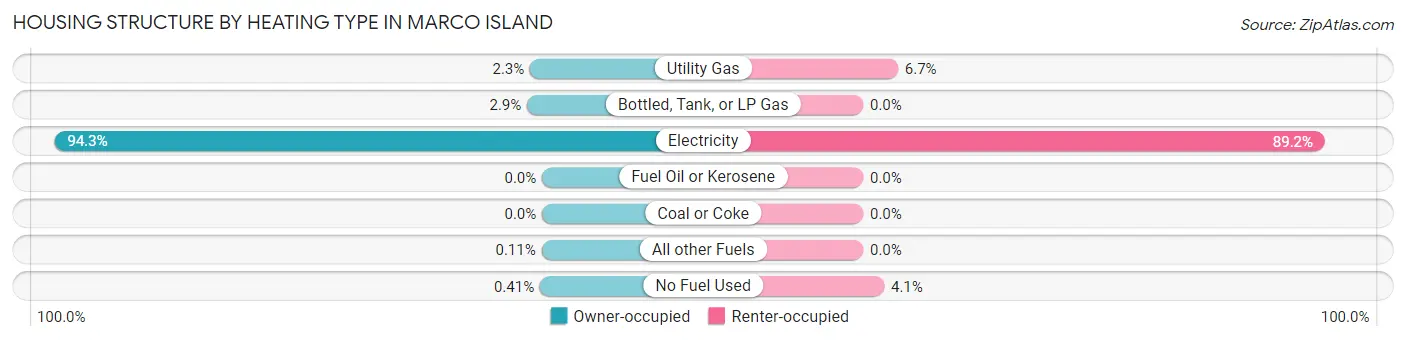
| Heating Type | Owner-occupied | Renter-occupied |
| Utility Gas | 174 (2.3%) | 53 (6.7%) |
| Bottled, Tank, or LP Gas | 217 (2.9%) | 0 (0.0%) |
| Electricity | 7,057 (94.3%) | 704 (89.2%) |
| Fuel Oil or Kerosene | 0 (0.0%) | 0 (0.0%) |
| Coal or Coke | 0 (0.0%) | 0 (0.0%) |
| All other Fuels | 8 (0.1%) | 0 (0.0%) |
| No Fuel Used | 31 (0.4%) | 32 (4.1%) |
| Total | 7,487 (100.0%) | 789 (100.0%) |
Household Vehicle Usage in Marco Island
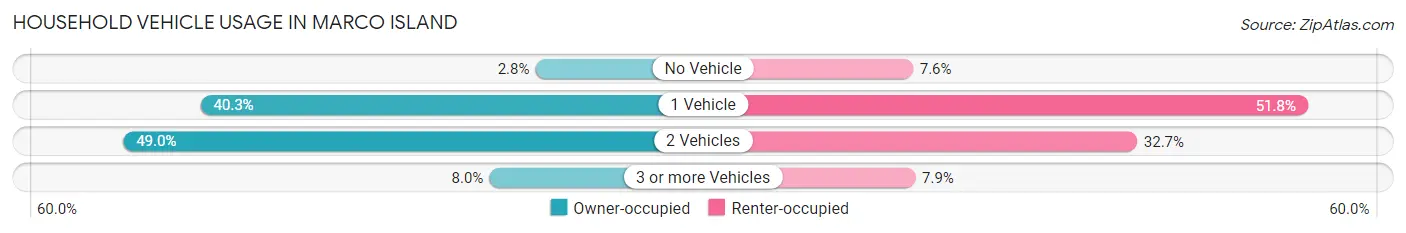
| Vehicles per Household | Owner-occupied | Renter-occupied |
| No Vehicle | 209 (2.8%) | 60 (7.6%) |
| 1 Vehicle | 3,017 (40.3%) | 409 (51.8%) |
| 2 Vehicles | 3,665 (48.9%) | 258 (32.7%) |
| 3 or more Vehicles | 596 (8.0%) | 62 (7.9%) |
| Total | 7,487 (100.0%) | 789 (100.0%) |
Real Estate & Mortgages in Marco Island
Real Estate and Mortgage Overview in Marco Island
| Characteristic | Without Mortgage | With Mortgage |
| Housing Units | 5,162 | 2,325 |
| Median Property Value | $803,200 | $816,400 |
| Median Household Income | $104,779 | $1,042 |
| Monthly Housing Costs | $1,363 | $1,359 |
| Real Estate Taxes | $5,891 | $47 |
Property Value by Mortgage Status in Marco Island
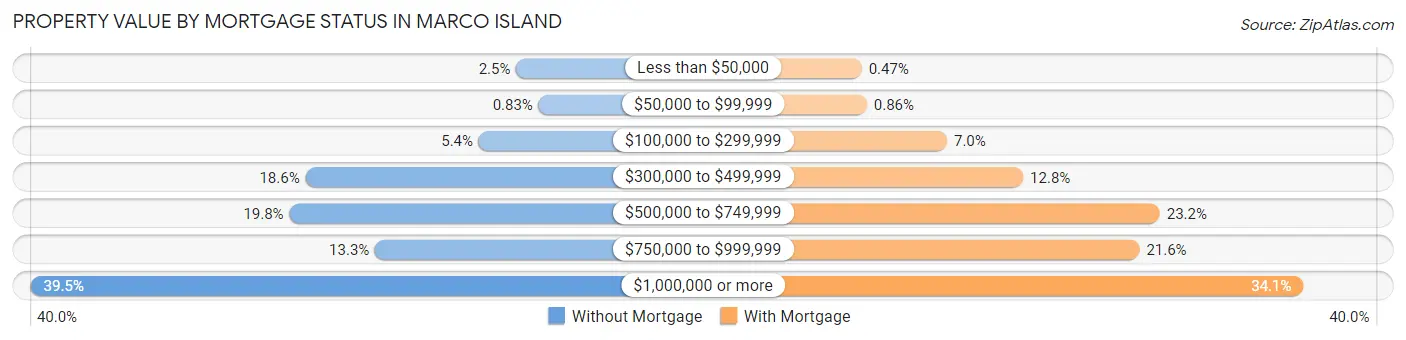
| Property Value | Without Mortgage | With Mortgage |
| Less than $50,000 | 131 (2.5%) | 11 (0.5%) |
| $50,000 to $99,999 | 43 (0.8%) | 20 (0.9%) |
| $100,000 to $299,999 | 278 (5.4%) | 162 (7.0%) |
| $300,000 to $499,999 | 960 (18.6%) | 297 (12.8%) |
| $500,000 to $749,999 | 1,023 (19.8%) | 539 (23.2%) |
| $750,000 to $999,999 | 686 (13.3%) | 503 (21.6%) |
| $1,000,000 or more | 2,041 (39.5%) | 793 (34.1%) |
| Total | 5,162 (100.0%) | 2,325 (100.0%) |
Household Income by Mortgage Status in Marco Island
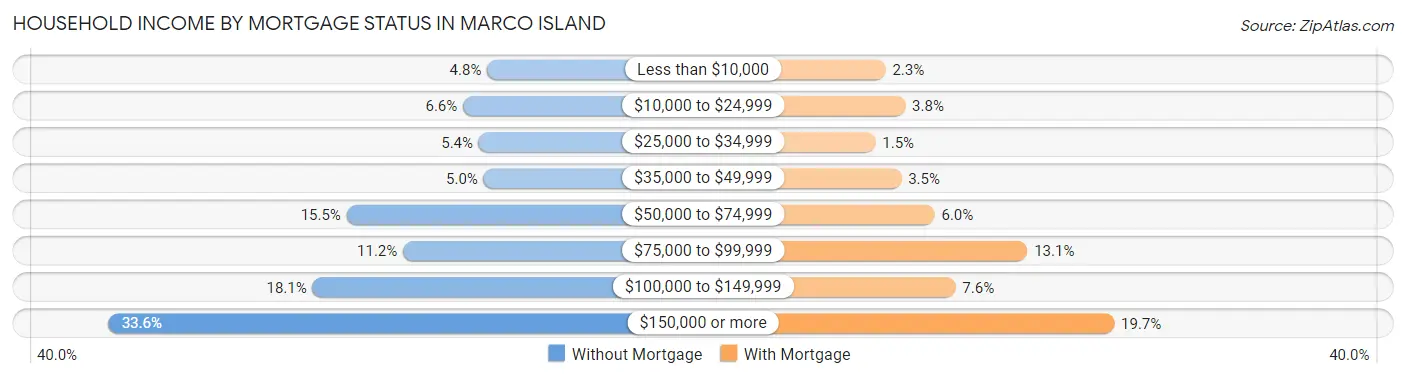
| Household Income | Without Mortgage | With Mortgage |
| Less than $10,000 | 245 (4.8%) | 53 (2.3%) |
| $10,000 to $24,999 | 340 (6.6%) | 88 (3.8%) |
| $25,000 to $34,999 | 278 (5.4%) | 35 (1.5%) |
| $35,000 to $49,999 | 259 (5.0%) | 81 (3.5%) |
| $50,000 to $74,999 | 798 (15.5%) | 140 (6.0%) |
| $75,000 to $99,999 | 576 (11.2%) | 304 (13.1%) |
| $100,000 to $149,999 | 932 (18.1%) | 177 (7.6%) |
| $150,000 or more | 1,734 (33.6%) | 458 (19.7%) |
| Total | 5,162 (100.0%) | 2,325 (100.0%) |
Property Value to Household Income Ratio in Marco Island
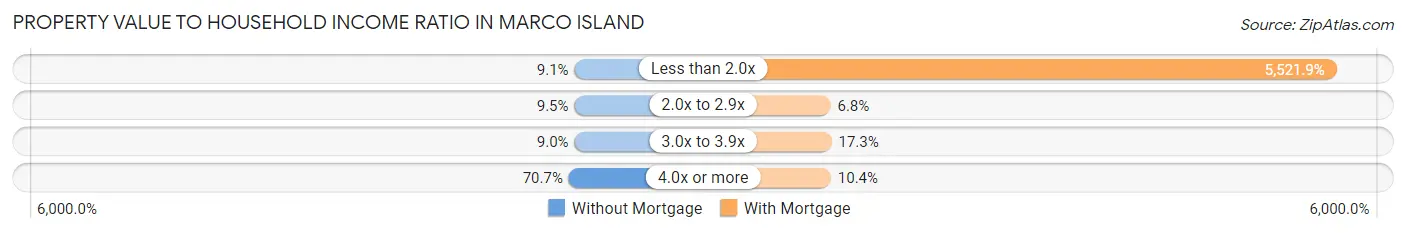
| Value-to-Income Ratio | Without Mortgage | With Mortgage |
| Less than 2.0x | 469 (9.1%) | 128,384 (5,521.9%) |
| 2.0x to 2.9x | 489 (9.5%) | 158 (6.8%) |
| 3.0x to 3.9x | 462 (8.9%) | 401 (17.2%) |
| 4.0x or more | 3,648 (70.7%) | 241 (10.4%) |
| Total | 5,162 (100.0%) | 2,325 (100.0%) |
Real Estate Taxes by Mortgage Status in Marco Island
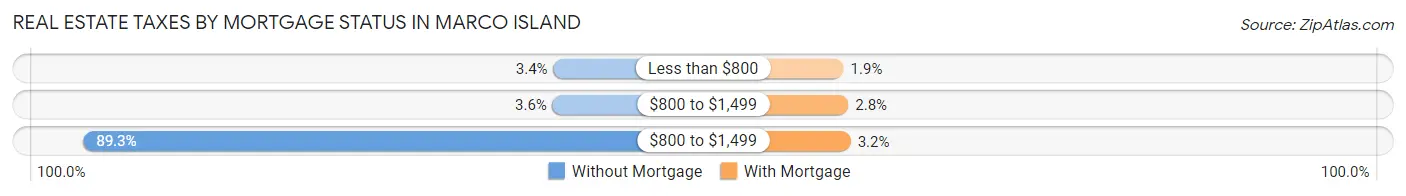
| Property Taxes | Without Mortgage | With Mortgage |
| Less than $800 | 176 (3.4%) | 45 (1.9%) |
| $800 to $1,499 | 183 (3.5%) | 65 (2.8%) |
| $800 to $1,499 | 4,608 (89.3%) | 75 (3.2%) |
| Total | 5,162 (100.0%) | 2,325 (100.0%) |
Health & Disability in Marco Island
Health Insurance Coverage by Age in Marco Island
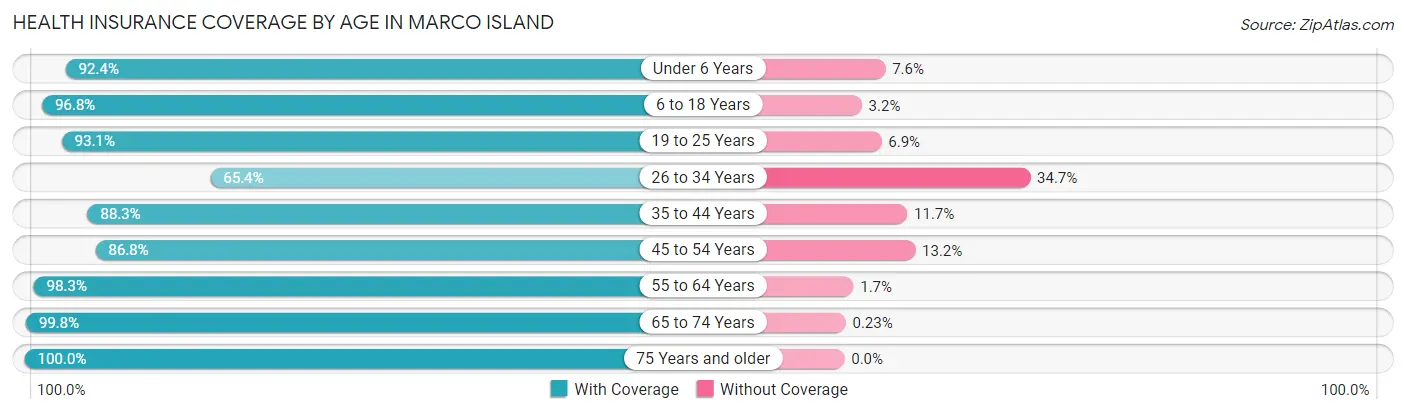
| Age Bracket | With Coverage | Without Coverage |
| Under 6 Years | 242 (92.4%) | 20 (7.6%) |
| 6 to 18 Years | 897 (96.8%) | 30 (3.2%) |
| 19 to 25 Years | 377 (93.1%) | 28 (6.9%) |
| 26 to 34 Years | 264 (65.3%) | 140 (34.6%) |
| 35 to 44 Years | 618 (88.3%) | 82 (11.7%) |
| 45 to 54 Years | 901 (86.8%) | 137 (13.2%) |
| 55 to 64 Years | 2,815 (98.3%) | 48 (1.7%) |
| 65 to 74 Years | 3,936 (99.8%) | 9 (0.2%) |
| 75 Years and older | 5,398 (100.0%) | 0 (0.0%) |
| Total | 15,448 (96.9%) | 494 (3.1%) |
Health Insurance Coverage by Citizenship Status in Marco Island
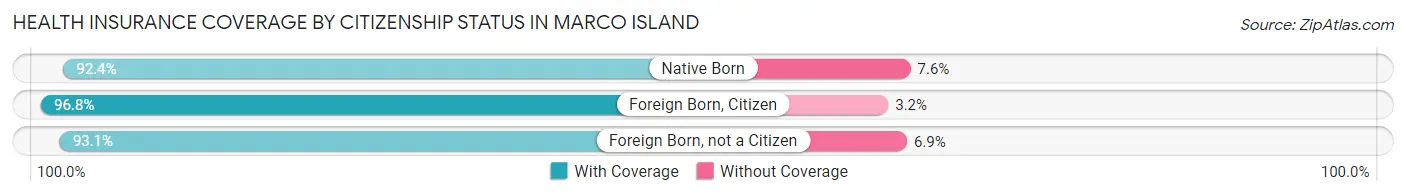
| Citizenship Status | With Coverage | Without Coverage |
| Native Born | 242 (92.4%) | 20 (7.6%) |
| Foreign Born, Citizen | 897 (96.8%) | 30 (3.2%) |
| Foreign Born, not a Citizen | 377 (93.1%) | 28 (6.9%) |
Health Insurance Coverage by Household Income in Marco Island
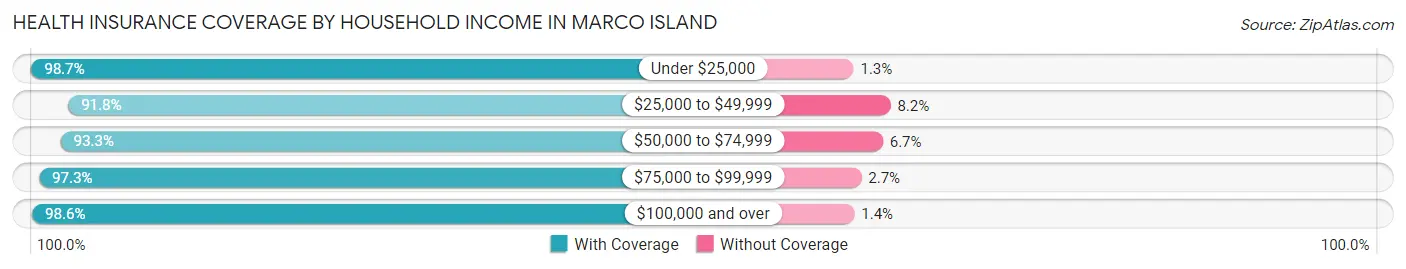
| Household Income | With Coverage | Without Coverage |
| Under $25,000 | 1,018 (98.7%) | 13 (1.3%) |
| $25,000 to $49,999 | 1,774 (91.8%) | 158 (8.2%) |
| $50,000 to $74,999 | 2,077 (93.3%) | 150 (6.7%) |
| $75,000 to $99,999 | 1,496 (97.3%) | 42 (2.7%) |
| $100,000 and over | 9,076 (98.6%) | 131 (1.4%) |
Public vs Private Health Insurance Coverage by Age in Marco Island
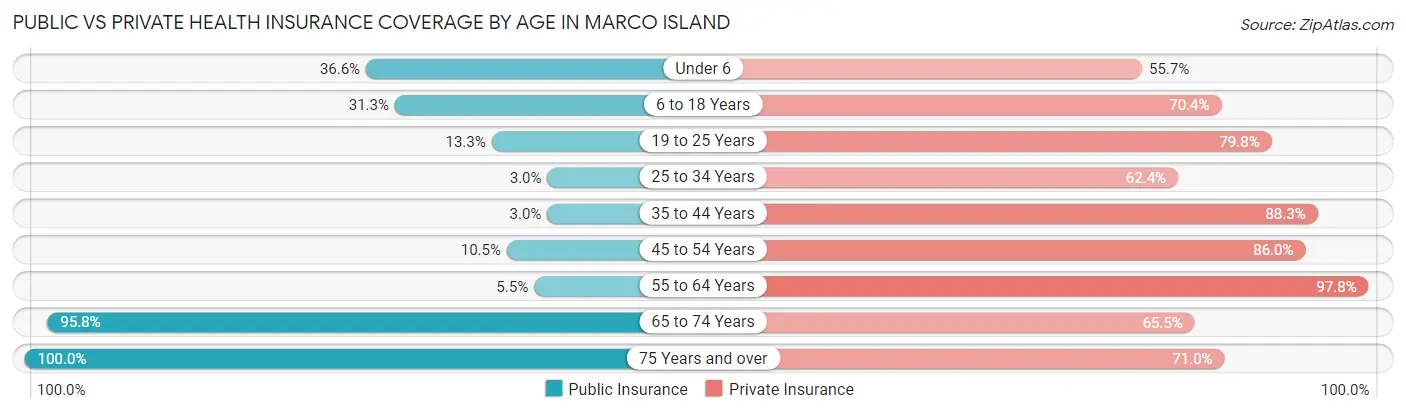
| Age Bracket | Public Insurance | Private Insurance |
| Under 6 | 96 (36.6%) | 146 (55.7%) |
| 6 to 18 Years | 290 (31.3%) | 653 (70.4%) |
| 19 to 25 Years | 54 (13.3%) | 323 (79.7%) |
| 25 to 34 Years | 12 (3.0%) | 252 (62.4%) |
| 35 to 44 Years | 21 (3.0%) | 618 (88.3%) |
| 45 to 54 Years | 109 (10.5%) | 893 (86.0%) |
| 55 to 64 Years | 156 (5.4%) | 2,799 (97.8%) |
| 65 to 74 Years | 3,778 (95.8%) | 2,584 (65.5%) |
| 75 Years and over | 5,398 (100.0%) | 3,833 (71.0%) |
| Total | 9,914 (62.2%) | 12,101 (75.9%) |
Disability Status by Sex by Age in Marco Island
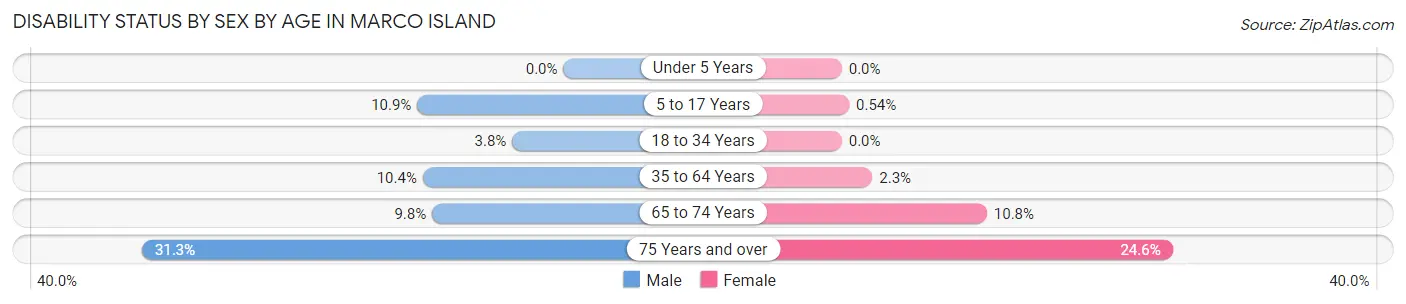
| Age Bracket | Male | Female |
| Under 5 Years | 0 (0.0%) | 0 (0.0%) |
| 5 to 17 Years | 46 (10.8%) | 3 (0.5%) |
| 18 to 34 Years | 16 (3.8%) | 0 (0.0%) |
| 35 to 64 Years | 200 (10.4%) | 61 (2.3%) |
| 65 to 74 Years | 218 (9.8%) | 184 (10.8%) |
| 75 Years and over | 886 (31.3%) | 630 (24.5%) |
Disability Class by Sex by Age in Marco Island
Disability Class: Hearing Difficulty
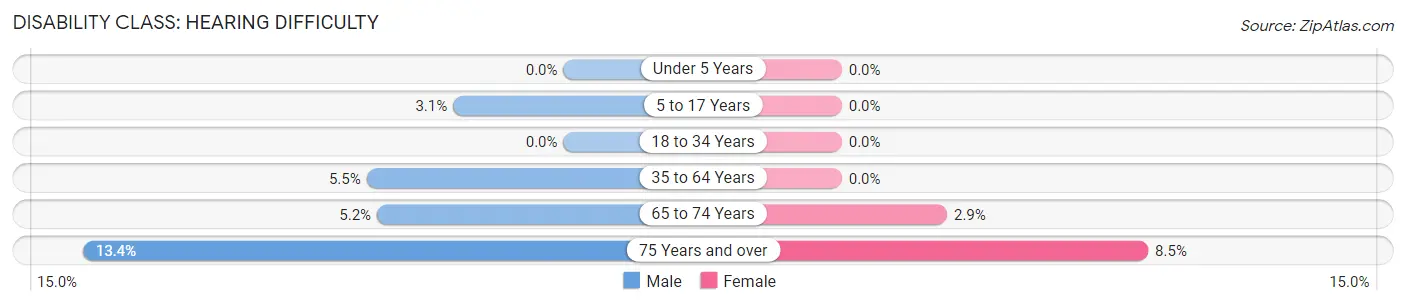
| Age Bracket | Male | Female |
| Under 5 Years | 0 (0.0%) | 0 (0.0%) |
| 5 to 17 Years | 13 (3.1%) | 0 (0.0%) |
| 18 to 34 Years | 0 (0.0%) | 0 (0.0%) |
| 35 to 64 Years | 105 (5.5%) | 0 (0.0%) |
| 65 to 74 Years | 116 (5.2%) | 50 (2.9%) |
| 75 Years and over | 379 (13.4%) | 219 (8.5%) |
Disability Class: Vision Difficulty
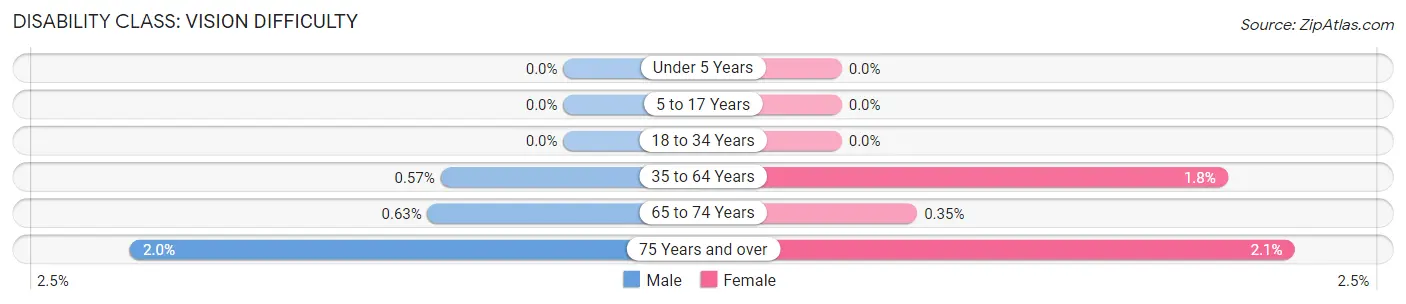
| Age Bracket | Male | Female |
| Under 5 Years | 0 (0.0%) | 0 (0.0%) |
| 5 to 17 Years | 0 (0.0%) | 0 (0.0%) |
| 18 to 34 Years | 0 (0.0%) | 0 (0.0%) |
| 35 to 64 Years | 11 (0.6%) | 48 (1.8%) |
| 65 to 74 Years | 14 (0.6%) | 6 (0.4%) |
| 75 Years and over | 57 (2.0%) | 54 (2.1%) |
Disability Class: Cognitive Difficulty
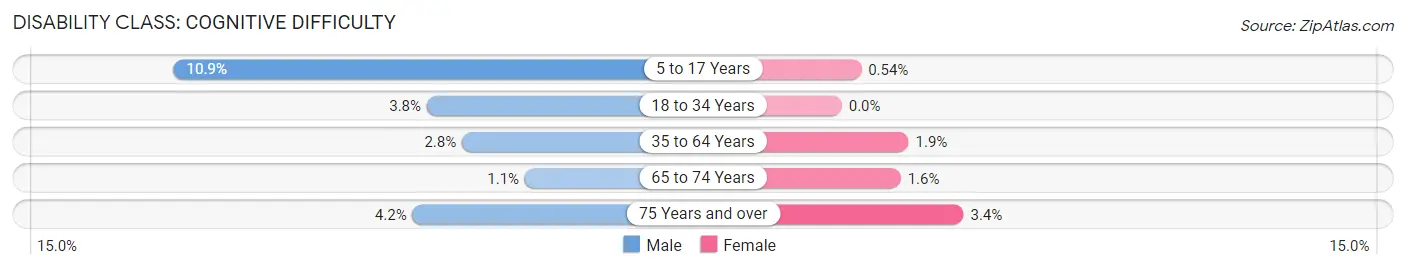
| Age Bracket | Male | Female |
| 5 to 17 Years | 46 (10.8%) | 3 (0.5%) |
| 18 to 34 Years | 16 (3.8%) | 0 (0.0%) |
| 35 to 64 Years | 54 (2.8%) | 50 (1.9%) |
| 65 to 74 Years | 24 (1.1%) | 28 (1.6%) |
| 75 Years and over | 119 (4.2%) | 87 (3.4%) |
Disability Class: Ambulatory Difficulty
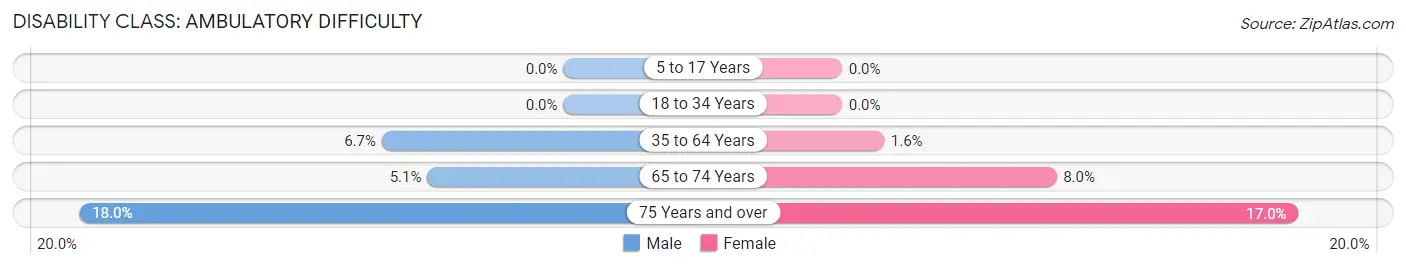
| Age Bracket | Male | Female |
| 5 to 17 Years | 0 (0.0%) | 0 (0.0%) |
| 18 to 34 Years | 0 (0.0%) | 0 (0.0%) |
| 35 to 64 Years | 129 (6.7%) | 42 (1.6%) |
| 65 to 74 Years | 113 (5.1%) | 136 (8.0%) |
| 75 Years and over | 509 (18.0%) | 435 (17.0%) |
Disability Class: Self-Care Difficulty
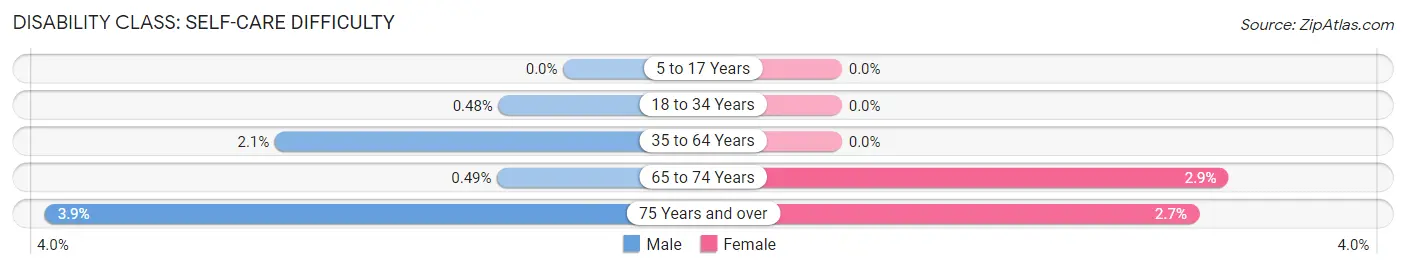
| Age Bracket | Male | Female |
| 5 to 17 Years | 0 (0.0%) | 0 (0.0%) |
| 18 to 34 Years | 2 (0.5%) | 0 (0.0%) |
| 35 to 64 Years | 41 (2.1%) | 0 (0.0%) |
| 65 to 74 Years | 11 (0.5%) | 49 (2.9%) |
| 75 Years and over | 109 (3.8%) | 68 (2.6%) |
Technology Access in Marco Island
Computing Device Access in Marco Island
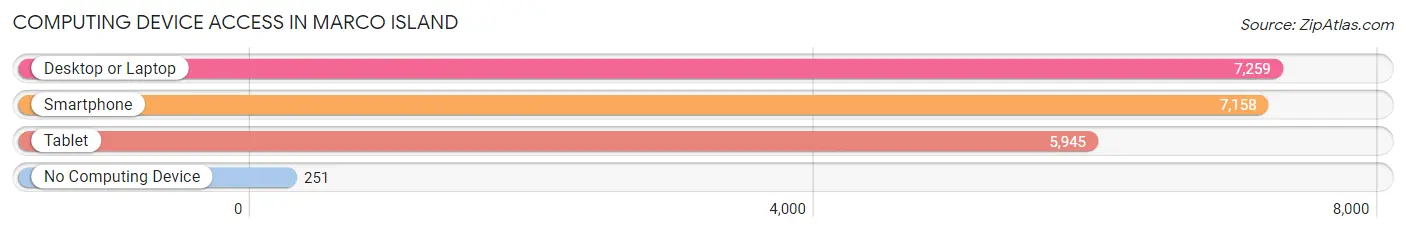
| Device Type | # Households | % Households |
| Desktop or Laptop | 7,259 | 87.7% |
| Smartphone | 7,158 | 86.5% |
| Tablet | 5,945 | 71.8% |
| No Computing Device | 251 | 3.0% |
| Total | 8,276 | 100.0% |
Internet Access in Marco Island
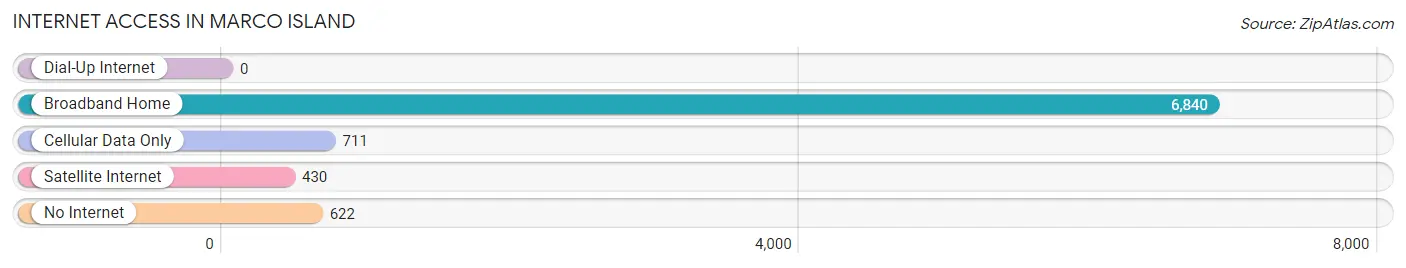
| Internet Type | # Households | % Households |
| Dial-Up Internet | 0 | 0.0% |
| Broadband Home | 6,840 | 82.7% |
| Cellular Data Only | 711 | 8.6% |
| Satellite Internet | 430 | 5.2% |
| No Internet | 622 | 7.5% |
| Total | 8,276 | 100.0% |
Marco Island Summary
Marco Island is a city located in Collier County, Florida, United States, located on an island of the same name in the Gulf of Mexico off the coast of Southwest Florida. It is the largest of Florida's Ten Thousand Islands, and the only one with a significant population. The population was 16,413 at the 2010 census. Marco Island is a principal city of the Naples–Marco Island Metropolitan Statistical Area.
Geography
Marco Island is located at 25°57′N 81°44′W (25.95, -81.73). It is bordered by the Gulf of Mexico to the west, Goodland to the east, and the Ten Thousand Islands to the south. The island is 6.1 miles (9.8 km) long and 4.3 miles (6.9 km) wide, with a total area of 15.8 square miles (41 km2).
The island is composed of sediment and is characterized by mangrove forests, estuaries, and tidal creeks. The terrain is generally flat, with an average elevation of 4 feet (1.2 m) above sea level.
Climate
Marco Island has a humid subtropical climate, with hot, humid summers and mild, dry winters. The average annual temperature is 77 °F (25 °C), with an average high of 83 °F (28 °C) and an average low of 71 °F (22 °C). The average annual precipitation is 54 inches (1,400 mm).
History
Marco Island was first inhabited by the Calusa Indians, who lived in the area for thousands of years. The island was later explored by Spanish explorers in the 16th century, and was later settled by the Spanish in the 18th century. The island was later abandoned by the Spanish, and was later re-settled by the Seminole Indians in the 19th century.
In the early 20th century, the island was developed as a fishing and hunting resort. In the 1950s, the island was developed as a residential community, and in the 1960s, the island was incorporated as a city.
Economy
Marco Island is a popular tourist destination, and the city's economy is largely based on tourism. The city is home to several resorts, hotels, and restaurants, as well as a variety of shops and other businesses. The city also has a large marina, which is popular with boaters and fishermen.
Demographics
As of the 2010 census, there were 16,413 people, 8,845 households, and 5,845 families residing in the city. The population density was 1,037.2 people per square mile (400.3/km2). There were 11,845 housing units at an average density of 745.3 per square mile (287.7/km2). The racial makeup of the city was 94.2% White, 2.2% African American, 0.2% Native American, 1.2% Asian, 0.1% Pacific Islander, 0.9% from other races, and 1.2% from two or more races. Hispanic or Latino of any race were 5.3% of the population.
The median income for a household in the city was $63,945, and the median income for a family was $77,845. Males had a median income of $50,945 versus $37,845 for females. The per capita income for the city was $41,845. About 4.2% of families and 6.2% of the population were below the poverty line, including 8.2% of those under age 18 and 4.2% of those age 65 or over.
Common Questions
What is the Total Population of Marco Island?
Total Population of Marco Island is 15,942.
What is the Total Male Population of Marco Island?
Total Male Population of Marco Island is 7,933.
What is the Total Female Population of Marco Island?
Total Female Population of Marco Island is 8,009.
What is the Ratio of Males per 100 Females in Marco Island?
There are 99.05 Males per 100 Females in Marco Island.
What is the Ratio of Females per 100 Males in Marco Island?
There are 100.96 Females per 100 Males in Marco Island.
What is the Median Population Age in Marco Island?
Median Population Age in Marco Island is 67.5 Years.
What is the Average Family Size in Marco Island
Average Family Size in Marco Island is 2.3 People.
What is the Average Household Size in Marco Island
Average Household Size in Marco Island is 1.9 People.
What is Per Capita Income in Marco Island?
Per Capita income in Marco Island is $92,983.
What is the Median Family Income in Marco Island?
Median Family Income in Marco Island is $114,277.
What is the Median Household income in Marco Island?
Median Household Income in Marco Island is $105,315.
What is Income or Wage Gap in Marco Island?
Income or Wage Gap in Marco Island is 25.0%.
Women in Marco Island earn 75.0 cents for every dollar earned by a man.
What is Inequality or Gini Index in Marco Island?
Inequality or Gini Index in Marco Island is 0.53.
How Large is the Labor Force in Marco Island?
There are 4,865 People in the Labor Forcein in Marco Island.
What is the Percentage of People in the Labor Force in Marco Island?
32.6% of People are in the Labor Force in Marco Island.
What is the Unemployment Rate in Marco Island?
Unemployment Rate in Marco Island is 4.0%.