Bear Creek, FL
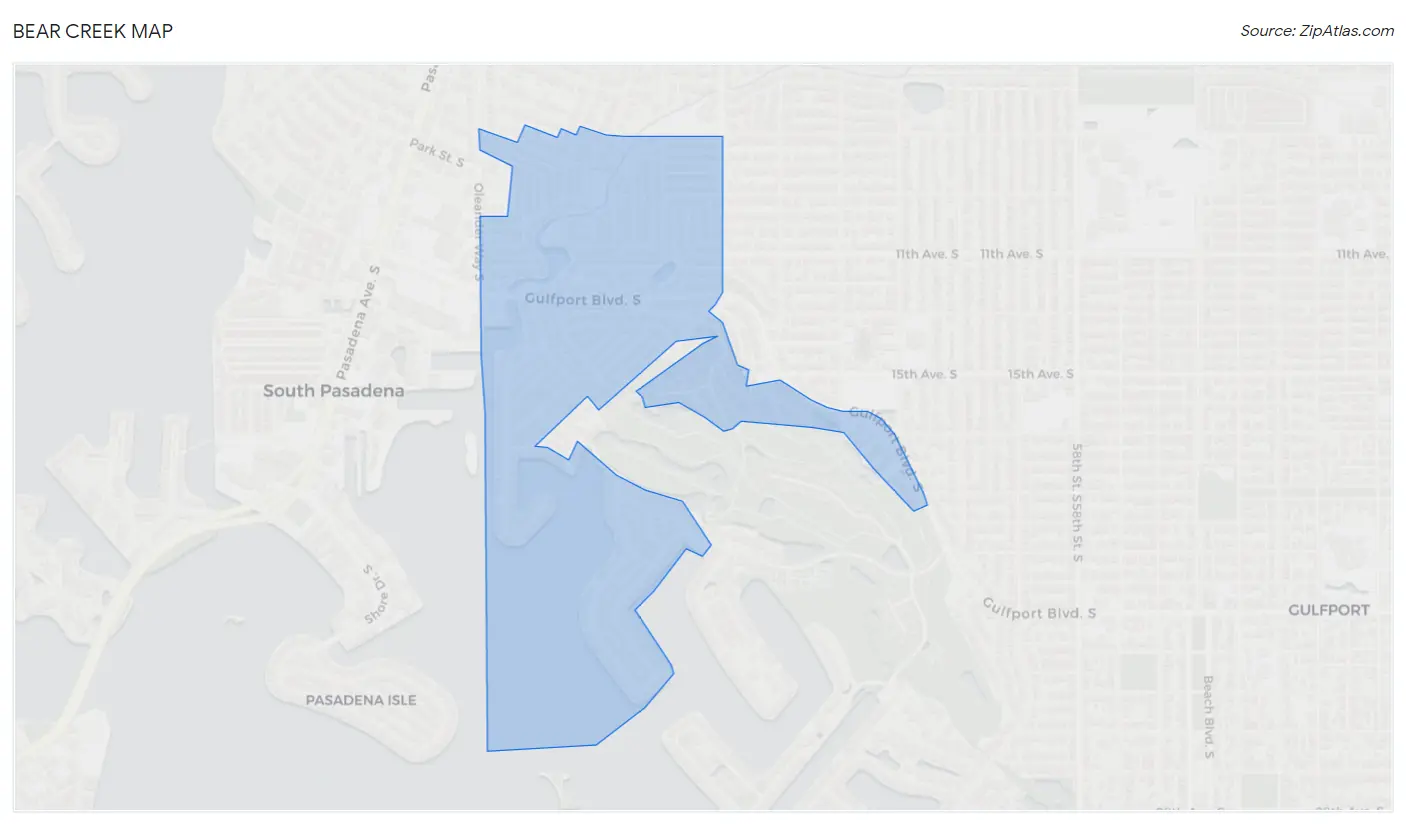
Bear Creek Map
Bear Creek Overview
2,066
TOTAL POPULATION
842
MALE POPULATION
1,224
FEMALE POPULATION
68.79
MALES / 100 FEMALES
145.37
FEMALES / 100 MALES
53.2
MEDIAN AGE
2.8
AVG FAMILY SIZE
2.2
AVG HOUSEHOLD SIZE
$43,459
PER CAPITA INCOME
$115,893
AVG FAMILY INCOME
$70,298
AVG HOUSEHOLD INCOME
13.6%
WAGE / INCOME GAP [ % ]
86.4¢/ $1
WAGE / INCOME GAP [ $ ]
0.43
INEQUALITY / GINI INDEX
1,003
LABOR FORCE [ PEOPLE ]
50.6%
PERCENT IN LABOR FORCE
3.8%
UNEMPLOYMENT RATE
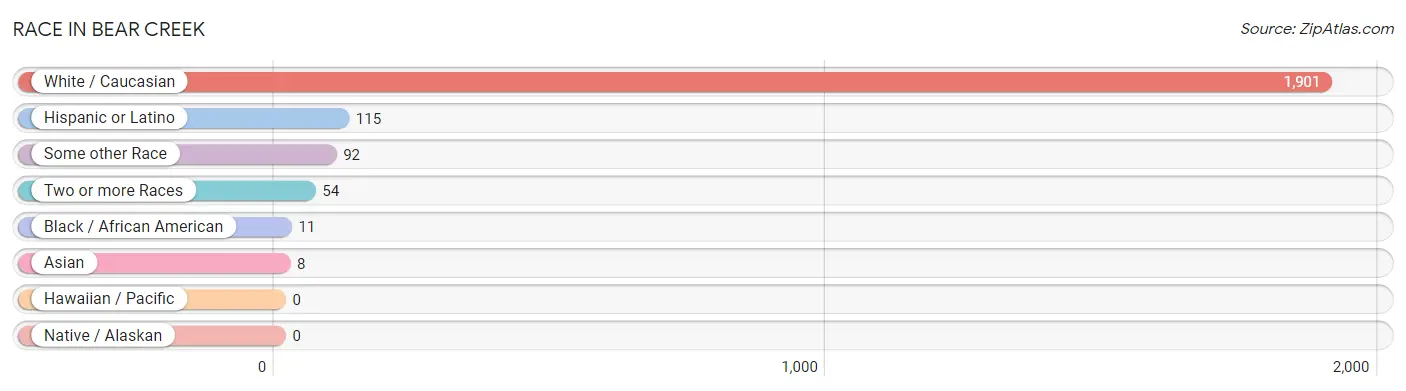
Race in Bear Creek
The most populous races in Bear Creek are White / Caucasian (1,901 | 92.0%), Hispanic or Latino (115 | 5.6%), and Some other Race (92 | 4.4%).
| Race | # Population | % Population |
| Asian | 8 | 0.4% |
| Black / African American | 11 | 0.5% |
| Hawaiian / Pacific | 0 | 0.0% |
| Hispanic or Latino | 115 | 5.6% |
| Native / Alaskan | 0 | 0.0% |
| White / Caucasian | 1,901 | 92.0% |
| Two or more Races | 54 | 2.6% |
| Some other Race | 92 | 4.4% |
| Total | 2,066 | 100.0% |
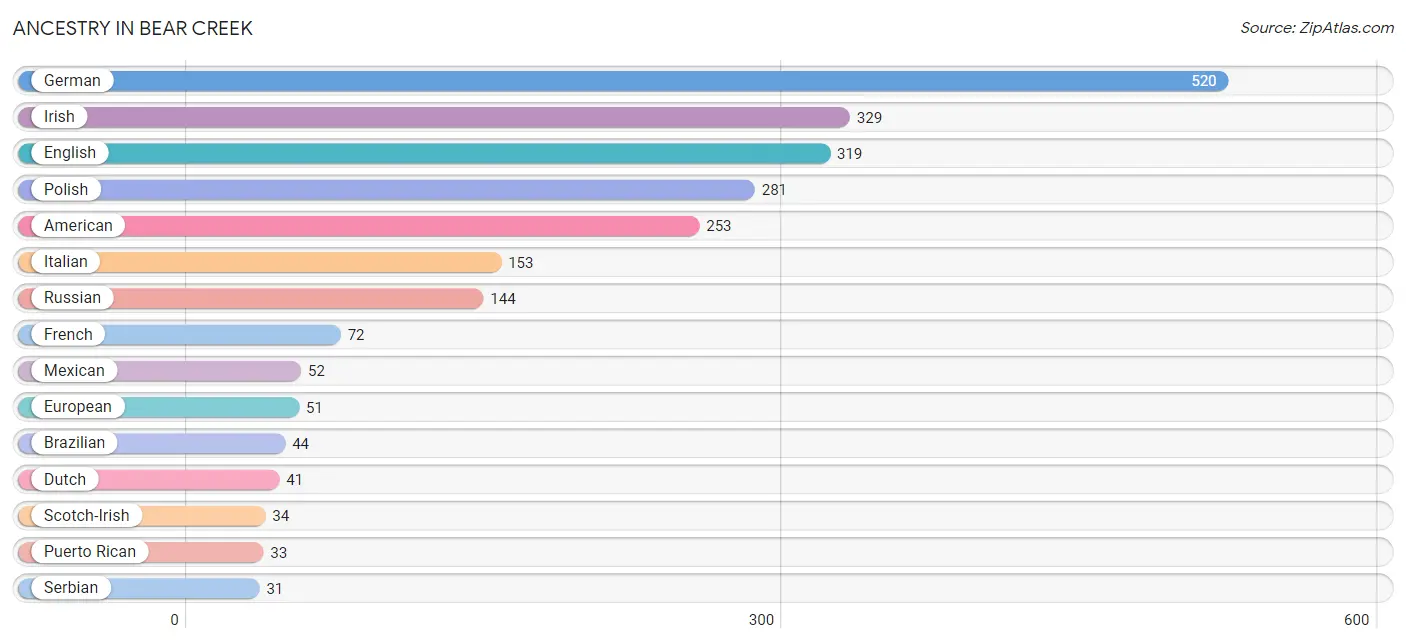
Ancestry in Bear Creek
The most populous ancestries reported in Bear Creek are German (520 | 25.2%), Irish (329 | 15.9%), English (319 | 15.4%), Polish (281 | 13.6%), and American (253 | 12.2%), together accounting for 82.4% of all Bear Creek residents.
| Ancestry | # Population | % Population |
| American | 253 | 12.2% |
| Arab | 7 | 0.3% |
| Australian | 9 | 0.4% |
| Austrian | 6 | 0.3% |
| Brazilian | 44 | 2.1% |
| British | 25 | 1.2% |
| Cuban | 19 | 0.9% |
| Czechoslovakian | 7 | 0.3% |
| Danish | 26 | 1.3% |
| Dutch | 41 | 2.0% |
| Eastern European | 10 | 0.5% |
| Ecuadorian | 11 | 0.5% |
| English | 319 | 15.4% |
| European | 51 | 2.5% |
| French | 72 | 3.5% |
| German | 520 | 25.2% |
| Greek | 21 | 1.0% |
| Hungarian | 7 | 0.3% |
| Indian (Asian) | 8 | 0.4% |
| Iraqi | 7 | 0.3% |
| Irish | 329 | 15.9% |
| Italian | 153 | 7.4% |
| Korean | 18 | 0.9% |
| Mexican | 52 | 2.5% |
| Polish | 281 | 13.6% |
| Portuguese | 9 | 0.4% |
| Puerto Rican | 33 | 1.6% |
| Romanian | 10 | 0.5% |
| Russian | 144 | 7.0% |
| Scotch-Irish | 34 | 1.7% |
| Scottish | 8 | 0.4% |
| Serbian | 31 | 1.5% |
| South American | 11 | 0.5% |
| Swedish | 6 | 0.3% |
| Turkish | 14 | 0.7% |
| Ukrainian | 11 | 0.5% |
| Welsh | 9 | 0.4% | View All 37 Rows |
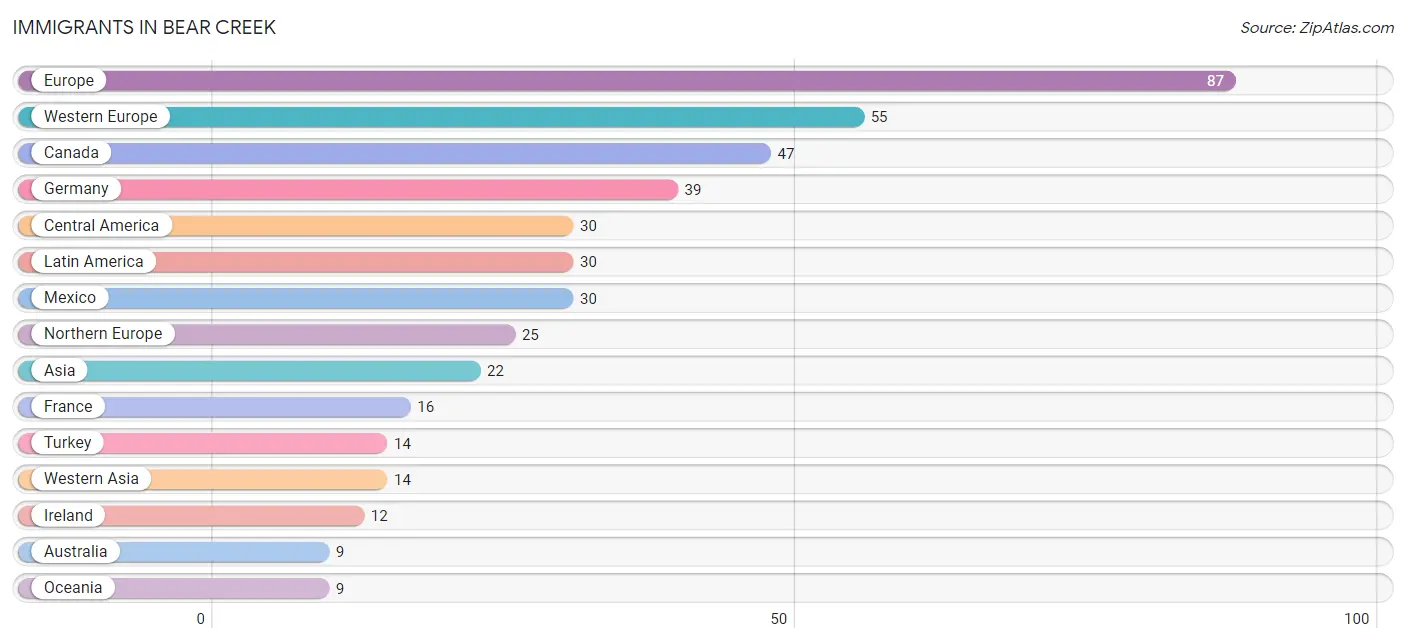
Immigrants in Bear Creek
The most numerous immigrant groups reported in Bear Creek came from Europe (87 | 4.2%), Western Europe (55 | 2.7%), Canada (47 | 2.3%), Germany (39 | 1.9%), and Central America (30 | 1.5%), together accounting for 12.5% of all Bear Creek residents.
| Immigration Origin | # Population | % Population |
| Asia | 22 | 1.1% |
| Australia | 9 | 0.4% |
| Canada | 47 | 2.3% |
| Central America | 30 | 1.5% |
| Eastern Europe | 7 | 0.3% |
| Europe | 87 | 4.2% |
| France | 16 | 0.8% |
| Germany | 39 | 1.9% |
| Hungary | 7 | 0.3% |
| Ireland | 12 | 0.6% |
| Latin America | 30 | 1.5% |
| Mexico | 30 | 1.5% |
| Northern Europe | 25 | 1.2% |
| Oceania | 9 | 0.4% |
| Philippines | 8 | 0.4% |
| Scotland | 6 | 0.3% |
| South Eastern Asia | 8 | 0.4% |
| Turkey | 14 | 0.7% |
| Western Asia | 14 | 0.7% |
| Western Europe | 55 | 2.7% | View All 20 Rows |
Sex and Age in Bear Creek
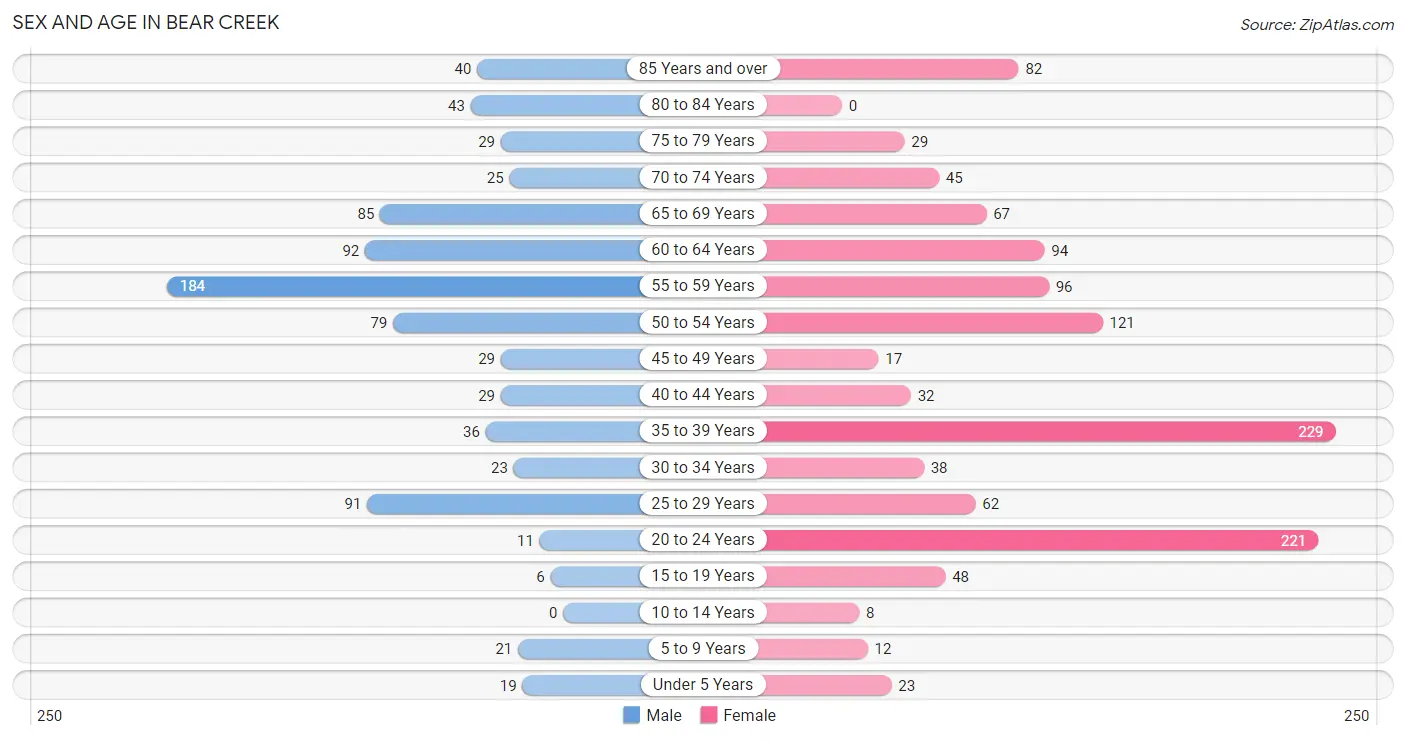
Sex and Age in Bear Creek
The most populous age groups in Bear Creek are 55 to 59 Years (184 | 21.8%) for men and 35 to 39 Years (229 | 18.7%) for women.
| Age Bracket | Male | Female |
| Under 5 Years | 19 (2.3%) | 23 (1.9%) |
| 5 to 9 Years | 21 (2.5%) | 12 (1.0%) |
| 10 to 14 Years | 0 (0.0%) | 8 (0.6%) |
| 15 to 19 Years | 6 (0.7%) | 48 (3.9%) |
| 20 to 24 Years | 11 (1.3%) | 221 (18.1%) |
| 25 to 29 Years | 91 (10.8%) | 62 (5.1%) |
| 30 to 34 Years | 23 (2.7%) | 38 (3.1%) |
| 35 to 39 Years | 36 (4.3%) | 229 (18.7%) |
| 40 to 44 Years | 29 (3.4%) | 32 (2.6%) |
| 45 to 49 Years | 29 (3.4%) | 17 (1.4%) |
| 50 to 54 Years | 79 (9.4%) | 121 (9.9%) |
| 55 to 59 Years | 184 (21.8%) | 96 (7.8%) |
| 60 to 64 Years | 92 (10.9%) | 94 (7.7%) |
| 65 to 69 Years | 85 (10.1%) | 67 (5.5%) |
| 70 to 74 Years | 25 (3.0%) | 45 (3.7%) |
| 75 to 79 Years | 29 (3.4%) | 29 (2.4%) |
| 80 to 84 Years | 43 (5.1%) | 0 (0.0%) |
| 85 Years and over | 40 (4.8%) | 82 (6.7%) |
| Total | 842 (100.0%) | 1,224 (100.0%) |
Families and Households in Bear Creek
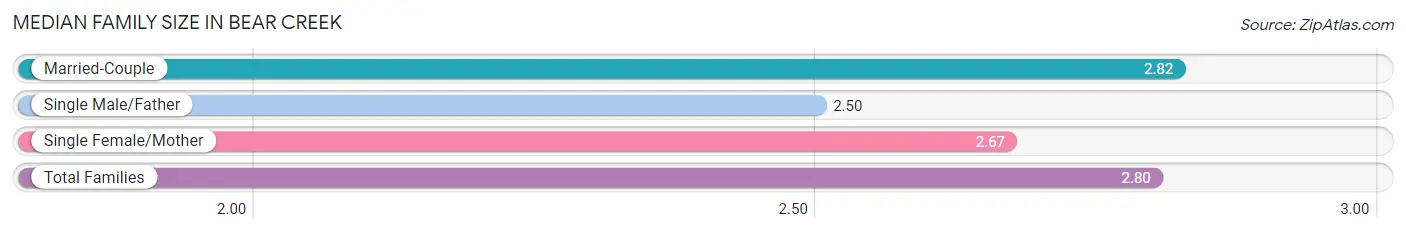
Median Family Size in Bear Creek
The median family size in Bear Creek is 2.80 persons per family, with married-couple families (414 | 91.0%) accounting for the largest median family size of 2.82 persons per family. On the other hand, single male/father families (14 | 3.1%) represent the smallest median family size with 2.50 persons per family.
| Family Type | # Families | Family Size |
| Married-Couple | 414 (91.0%) | 2.82 |
| Single Male/Father | 14 (3.1%) | 2.50 |
| Single Female/Mother | 27 (5.9%) | 2.67 |
| Total Families | 455 (100.0%) | 2.80 |
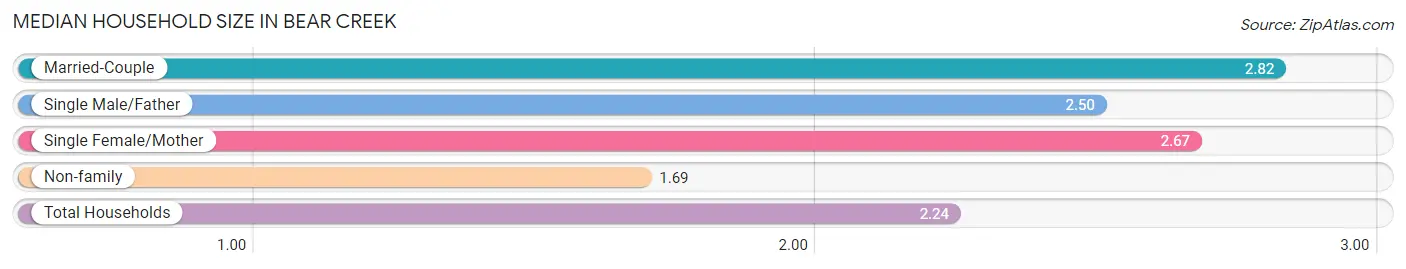
Median Household Size in Bear Creek
The median household size in Bear Creek is 2.24 persons per household, with married-couple households (414 | 44.9%) accounting for the largest median household size of 2.82 persons per household. non-family households (468 | 50.7%) represent the smallest median household size with 1.69 persons per household.
| Household Type | # Households | Household Size |
| Married-Couple | 414 (44.9%) | 2.82 |
| Single Male/Father | 14 (1.5%) | 2.50 |
| Single Female/Mother | 27 (2.9%) | 2.67 |
| Non-family | 468 (50.7%) | 1.69 |
| Total Households | 923 (100.0%) | 2.24 |
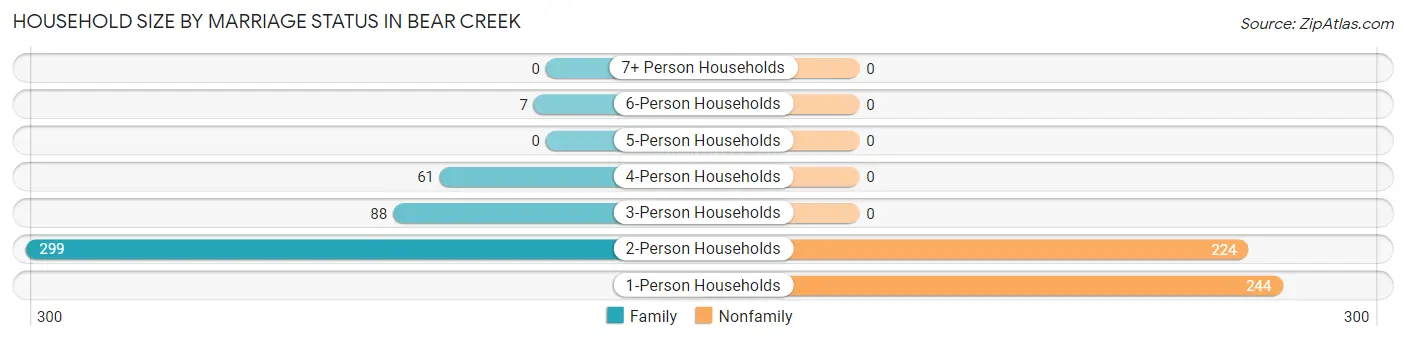
Household Size by Marriage Status in Bear Creek
Out of a total of 923 households in Bear Creek, 455 (49.3%) are family households, while 468 (50.7%) are nonfamily households. The most numerous type of family households are 2-person households, comprising 299, and the most common type of nonfamily households are 1-person households, comprising 244.
| Household Size | Family Households | Nonfamily Households |
| 1-Person Households | - | 244 (26.4%) |
| 2-Person Households | 299 (32.4%) | 224 (24.3%) |
| 3-Person Households | 88 (9.5%) | 0 (0.0%) |
| 4-Person Households | 61 (6.6%) | 0 (0.0%) |
| 5-Person Households | 0 (0.0%) | 0 (0.0%) |
| 6-Person Households | 7 (0.8%) | 0 (0.0%) |
| 7+ Person Households | 0 (0.0%) | 0 (0.0%) |
| Total | 455 (49.3%) | 468 (50.7%) |
Female Fertility in Bear Creek
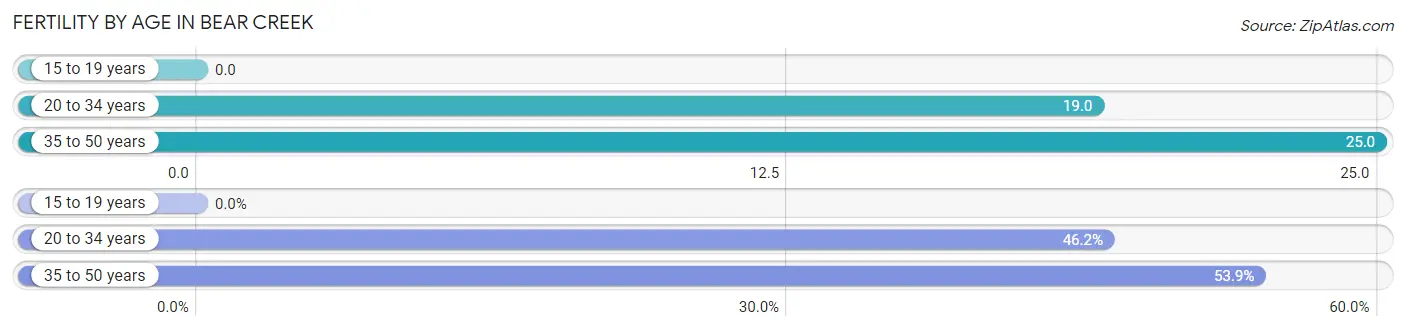
Fertility by Age in Bear Creek
Average fertility rate in Bear Creek is 20.0 births per 1,000 women. Women in the age bracket of 35 to 50 years have the highest fertility rate with 25.0 births per 1,000 women. Women in the age bracket of 35 to 50 years acount for 53.8% of all women with births.
| Age Bracket | Women with Births | Births / 1,000 Women |
| 15 to 19 years | 0 (0.0%) | 0.0 |
| 20 to 34 years | 6 (46.2%) | 19.0 |
| 35 to 50 years | 7 (53.8%) | 25.0 |
| Total | 13 (100.0%) | 20.0 |
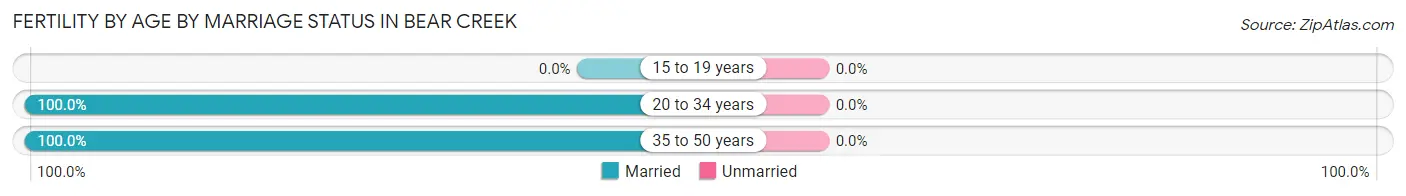
Fertility by Age by Marriage Status in Bear Creek
| Age Bracket | Married | Unmarried |
| 15 to 19 years | 0 (0.0%) | 0 (0.0%) |
| 20 to 34 years | 6 (100.0%) | 0 (0.0%) |
| 35 to 50 years | 7 (100.0%) | 0 (0.0%) |
| Total | 13 (100.0%) | 0 (0.0%) |
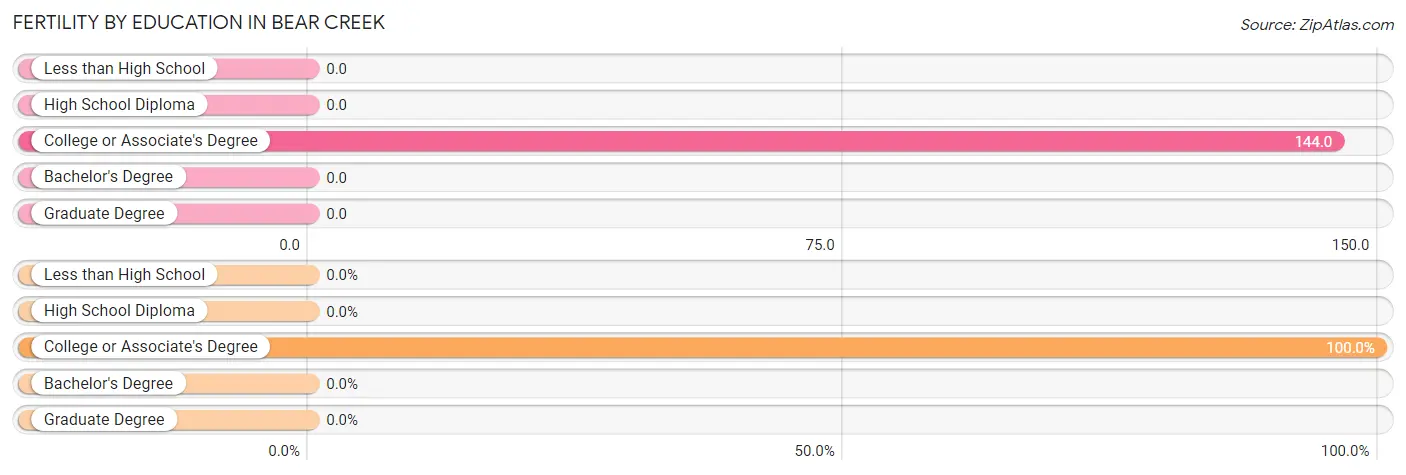
Fertility by Education in Bear Creek
| Educational Attainment | Women with Births | Births / 1,000 Women |
| Less than High School | 0 (0.0%) | 0.0 |
| High School Diploma | 0 (0.0%) | 0.0 |
| College or Associate's Degree | 13 (100.0%) | 144.0 |
| Bachelor's Degree | 0 (0.0%) | 0.0 |
| Graduate Degree | 0 (0.0%) | 0.0 |
| Total | 13 (100.0%) | 20.0 |
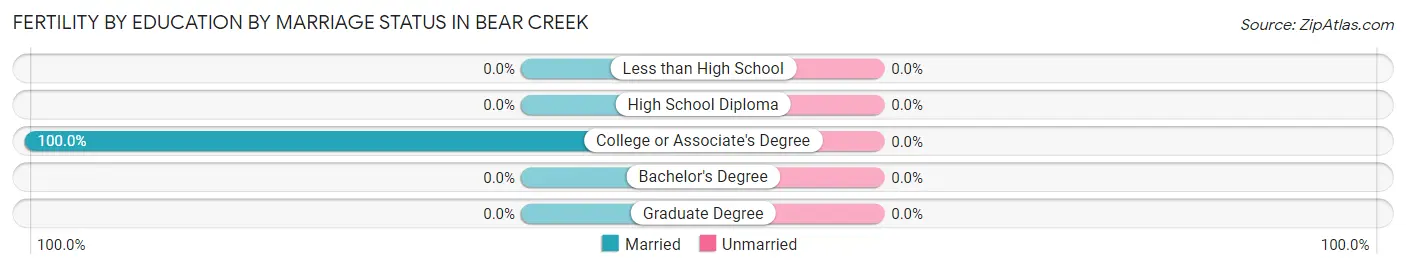
Fertility by Education by Marriage Status in Bear Creek
| Educational Attainment | Married | Unmarried |
| Less than High School | 0 (0.0%) | 0 (0.0%) |
| High School Diploma | 0 (0.0%) | 0 (0.0%) |
| College or Associate's Degree | 13 (100.0%) | 0 (0.0%) |
| Bachelor's Degree | 0 (0.0%) | 0 (0.0%) |
| Graduate Degree | 0 (0.0%) | 0 (0.0%) |
| Total | 13 (100.0%) | 0 (0.0%) |
Income in Bear Creek
Income Overview in Bear Creek
Per Capita Income in Bear Creek is $43,459, while median incomes of families and households are $115,893 and $70,298 respectively.
| Characteristic | Number | Measure |
| Per Capita Income | 2,066 | $43,459 |
| Median Family Income | 455 | $115,893 |
| Mean Family Income | 455 | $123,210 |
| Median Household Income | 923 | $70,298 |
| Mean Household Income | 923 | $94,395 |
| Income Deficit | 455 | $0 |
| Wage / Income Gap (%) | 2,066 | 13.55% |
| Wage / Income Gap ($) | 2,066 | 86.45¢ per $1 |
| Gini / Inequality Index | 2,066 | 0.43 |
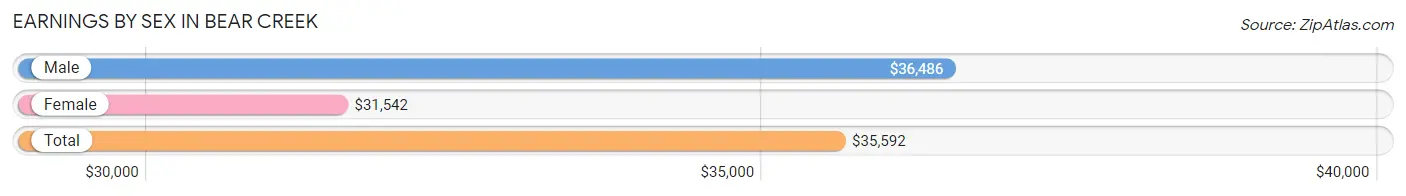
Earnings by Sex in Bear Creek
Average Earnings in Bear Creek are $35,592, $36,486 for men and $31,542 for women, a difference of 13.6%.
| Sex | Number | Average Earnings |
| Male | 492 (47.1%) | $36,486 |
| Female | 553 (52.9%) | $31,542 |
| Total | 1,045 (100.0%) | $35,592 |
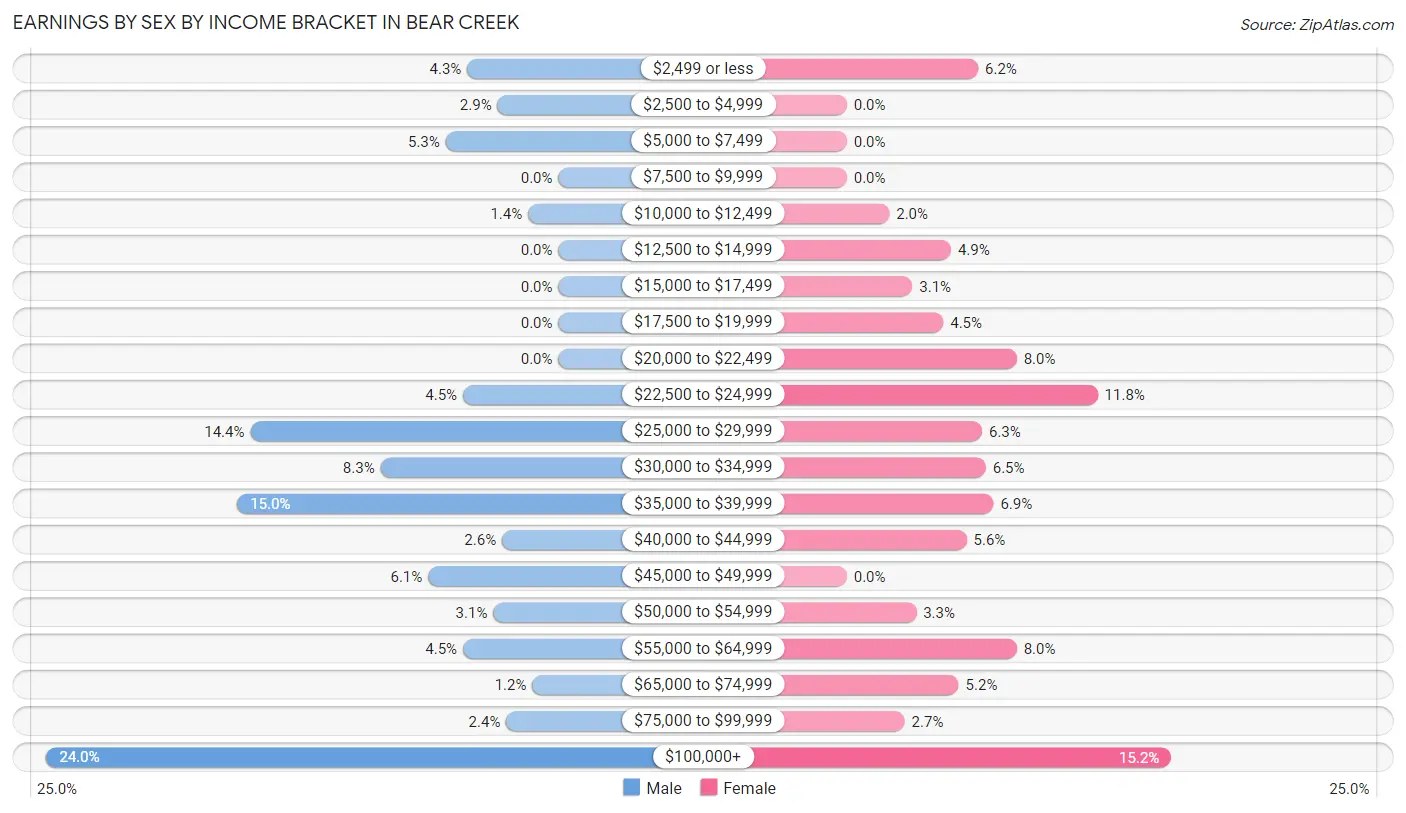
Earnings by Sex by Income Bracket in Bear Creek
The most common earnings brackets in Bear Creek are $100,000+ for men (118 | 24.0%) and $100,000+ for women (84 | 15.2%).
| Income | Male | Female |
| $2,499 or less | 21 (4.3%) | 34 (6.1%) |
| $2,500 to $4,999 | 14 (2.9%) | 0 (0.0%) |
| $5,000 to $7,499 | 26 (5.3%) | 0 (0.0%) |
| $7,500 to $9,999 | 0 (0.0%) | 0 (0.0%) |
| $10,000 to $12,499 | 7 (1.4%) | 11 (2.0%) |
| $12,500 to $14,999 | 0 (0.0%) | 27 (4.9%) |
| $15,000 to $17,499 | 0 (0.0%) | 17 (3.1%) |
| $17,500 to $19,999 | 0 (0.0%) | 25 (4.5%) |
| $20,000 to $22,499 | 0 (0.0%) | 44 (8.0%) |
| $22,500 to $24,999 | 22 (4.5%) | 65 (11.7%) |
| $25,000 to $29,999 | 71 (14.4%) | 35 (6.3%) |
| $30,000 to $34,999 | 41 (8.3%) | 36 (6.5%) |
| $35,000 to $39,999 | 74 (15.0%) | 38 (6.9%) |
| $40,000 to $44,999 | 13 (2.6%) | 31 (5.6%) |
| $45,000 to $49,999 | 30 (6.1%) | 0 (0.0%) |
| $50,000 to $54,999 | 15 (3.0%) | 18 (3.3%) |
| $55,000 to $64,999 | 22 (4.5%) | 44 (8.0%) |
| $65,000 to $74,999 | 6 (1.2%) | 29 (5.2%) |
| $75,000 to $99,999 | 12 (2.4%) | 15 (2.7%) |
| $100,000+ | 118 (24.0%) | 84 (15.2%) |
| Total | 492 (100.0%) | 553 (100.0%) |
Earnings by Sex by Educational Attainment in Bear Creek
Average earnings in Bear Creek are $36,588 for men and $37,303 for women, a difference of 1.9%. Men with an educational attainment of high school diploma enjoy the highest average annual earnings of $31,964, while those with high school diploma education earn the least with $31,964. Women with an educational attainment of college or associate's degree earn the most with the average annual earnings of $47,500, while those with high school diploma education have the smallest earnings of $41,250.

| Educational Attainment | Male Income | Female Income |
| Less than High School | - | - |
| High School Diploma | $31,964 | $41,250 |
| College or Associate's Degree | - | - |
| Bachelor's Degree | - | - |
| Graduate Degree | - | - |
| Total | $36,588 | $37,303 |
Family Income in Bear Creek
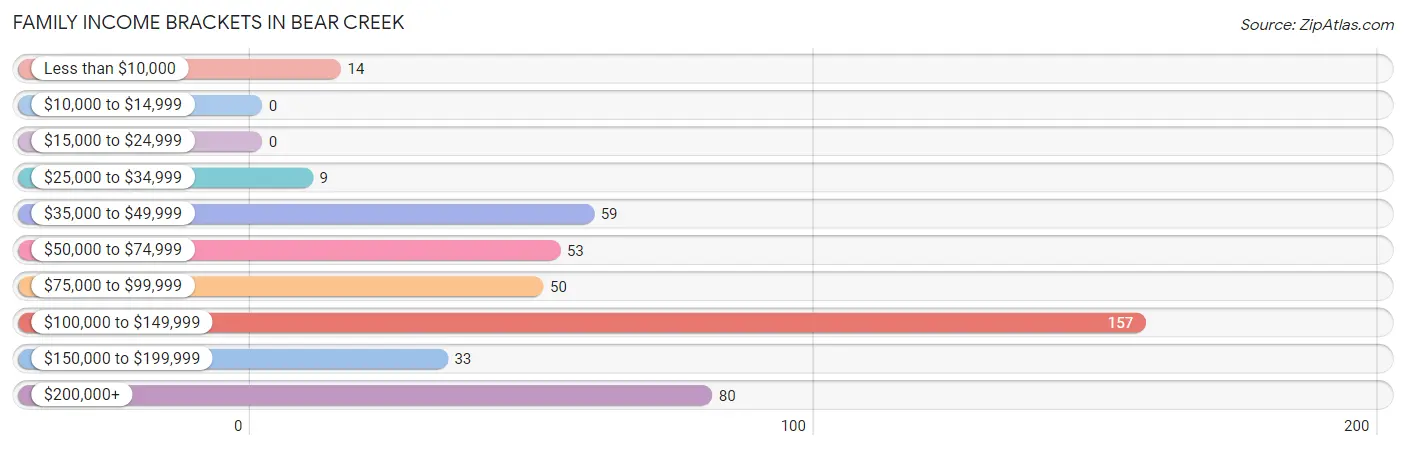
Family Income Brackets in Bear Creek
According to the Bear Creek family income data, there are 157 families falling into the $100,000 to $149,999 income range, which is the most common income bracket and makes up 34.5% of all families.
| Income Bracket | # Families | % Families |
| Less than $10,000 | 14 | 3.1% |
| $10,000 to $14,999 | 0 | 0.0% |
| $15,000 to $24,999 | 0 | 0.0% |
| $25,000 to $34,999 | 9 | 2.0% |
| $35,000 to $49,999 | 59 | 13.0% |
| $50,000 to $74,999 | 53 | 11.6% |
| $75,000 to $99,999 | 50 | 11.0% |
| $100,000 to $149,999 | 157 | 34.5% |
| $150,000 to $199,999 | 33 | 7.3% |
| $200,000+ | 80 | 17.6% |
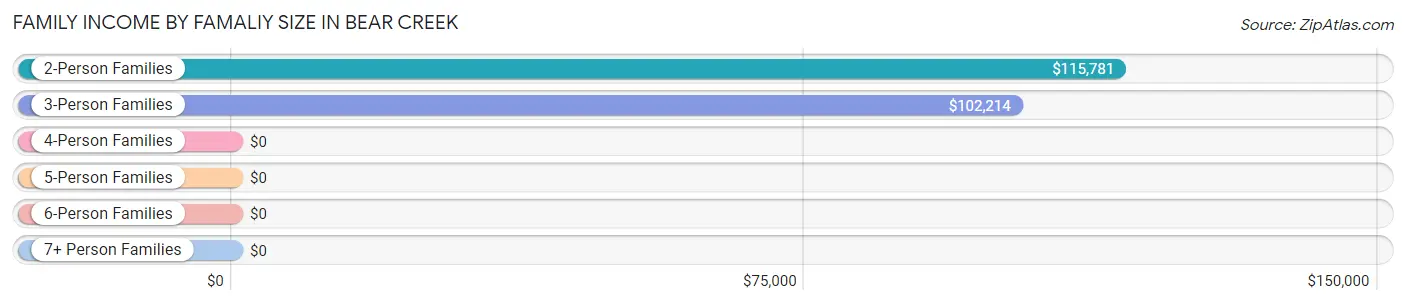
Family Income by Famaliy Size in Bear Creek
2-person families (299 | 65.7%) account for the highest median family income in Bear Creek with $115,781 per family, while 2-person families (299 | 65.7%) have the highest median income of $57,890 per family member.
| Income Bracket | # Families | Median Income |
| 2-Person Families | 299 (65.7%) | $115,781 |
| 3-Person Families | 88 (19.3%) | $102,214 |
| 4-Person Families | 61 (13.4%) | $0 |
| 5-Person Families | 0 (0.0%) | $0 |
| 6-Person Families | 7 (1.5%) | $0 |
| 7+ Person Families | 0 (0.0%) | $0 |
| Total | 455 (100.0%) | $115,893 |
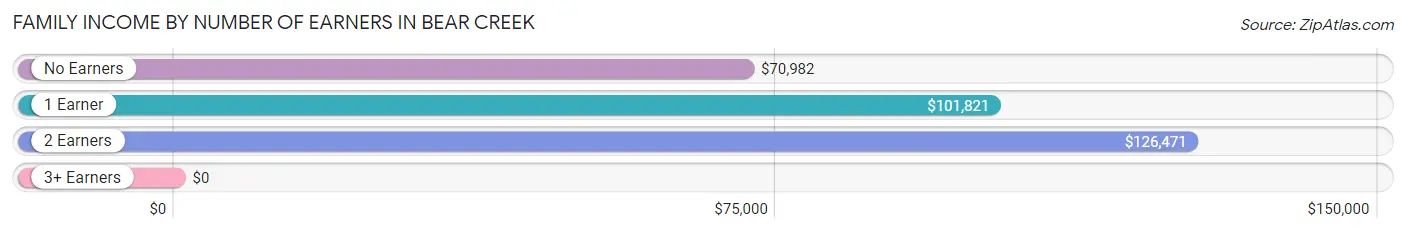
Family Income by Number of Earners in Bear Creek
| Number of Earners | # Families | Median Income |
| No Earners | 91 (20.0%) | $70,982 |
| 1 Earner | 169 (37.1%) | $101,821 |
| 2 Earners | 170 (37.4%) | $126,471 |
| 3+ Earners | 25 (5.5%) | $0 |
| Total | 455 (100.0%) | $115,893 |
Household Income in Bear Creek
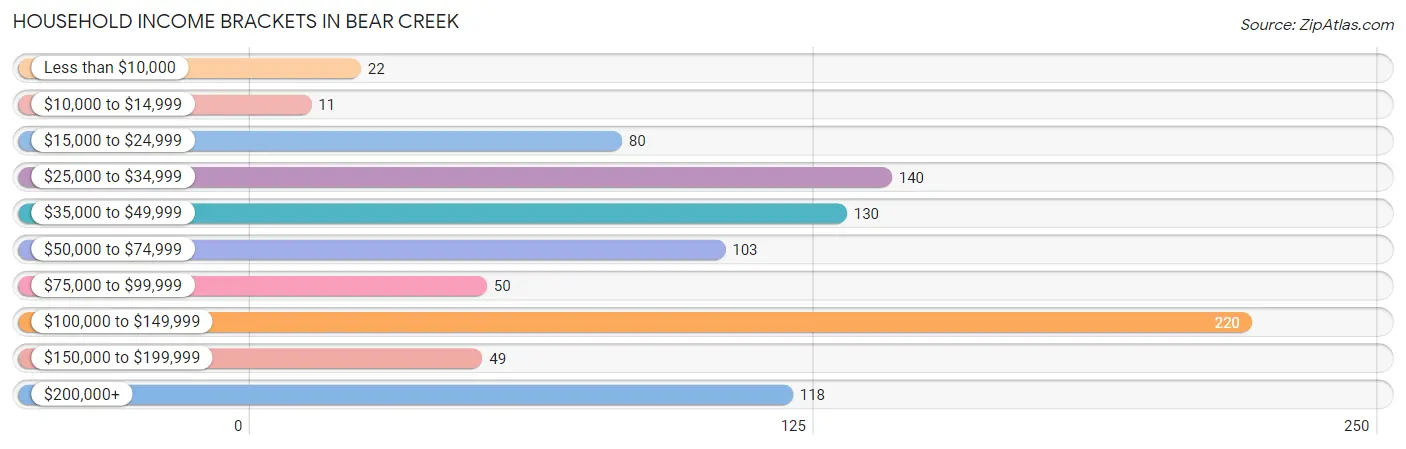
Household Income Brackets in Bear Creek
With 220 households falling in the category, the $100,000 to $149,999 income range is the most frequent in Bear Creek, accounting for 23.8% of all households. In contrast, only 11 households (1.2%) fall into the $10,000 to $14,999 income bracket, making it the least populous group.
| Income Bracket | # Households | % Households |
| Less than $10,000 | 22 | 2.4% |
| $10,000 to $14,999 | 11 | 1.2% |
| $15,000 to $24,999 | 80 | 8.7% |
| $25,000 to $34,999 | 140 | 15.2% |
| $35,000 to $49,999 | 130 | 14.1% |
| $50,000 to $74,999 | 103 | 11.2% |
| $75,000 to $99,999 | 50 | 5.4% |
| $100,000 to $149,999 | 220 | 23.8% |
| $150,000 to $199,999 | 49 | 5.3% |
| $200,000+ | 118 | 12.8% |
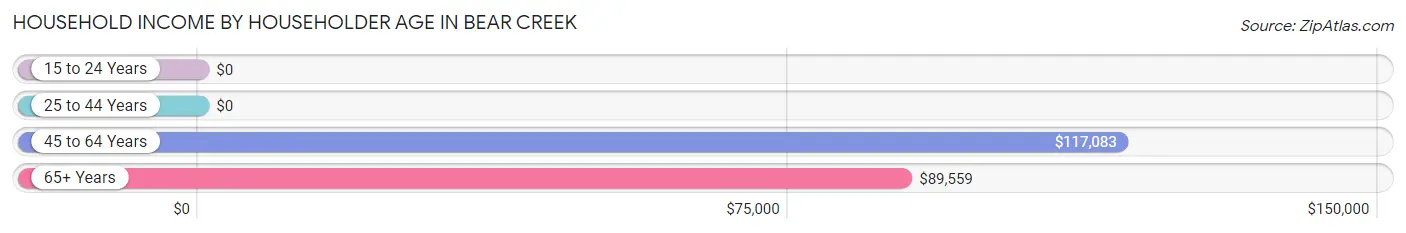
Household Income by Householder Age in Bear Creek
The median household income in Bear Creek is $70,298, with the highest median household income of $117,083 found in the 45 to 64 years age bracket for the primary householder. A total of 389 households (42.1%) fall into this category. Meanwhile, the 15 to 24 years age bracket for the primary householder has the lowest median household income of $0, with 116 households (12.6%) in this group.
| Income Bracket | # Households | Median Income |
| 15 to 24 Years | 116 (12.6%) | $0 |
| 25 to 44 Years | 160 (17.3%) | $0 |
| 45 to 64 Years | 389 (42.1%) | $117,083 |
| 65+ Years | 258 (28.0%) | $89,559 |
| Total | 923 (100.0%) | $70,298 |
Poverty in Bear Creek
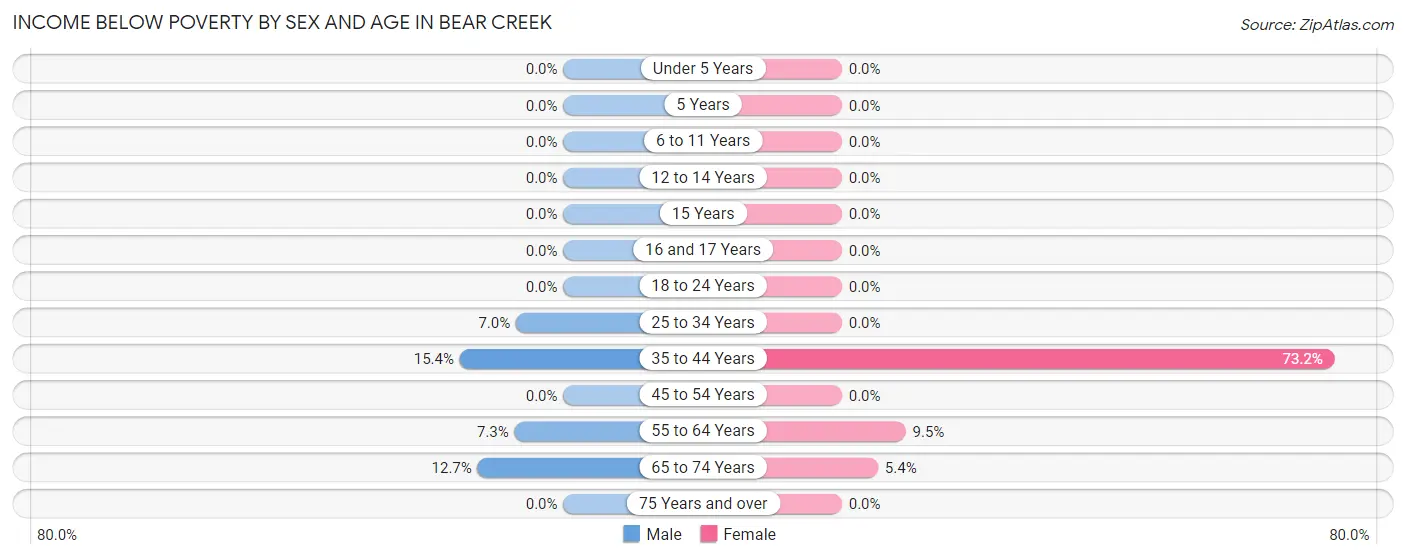
Income Below Poverty by Sex and Age in Bear Creek
With 6.2% poverty level for males and 17.6% for females among the residents of Bear Creek, 35 to 44 year old males and 35 to 44 year old females are the most vulnerable to poverty, with 10 males (15.4%) and 191 females (73.2%) in their respective age groups living below the poverty level.
| Age Bracket | Male | Female |
| Under 5 Years | 0 (0.0%) | 0 (0.0%) |
| 5 Years | 0 (0.0%) | 0 (0.0%) |
| 6 to 11 Years | 0 (0.0%) | 0 (0.0%) |
| 12 to 14 Years | 0 (0.0%) | 0 (0.0%) |
| 15 Years | 0 (0.0%) | 0 (0.0%) |
| 16 and 17 Years | 0 (0.0%) | 0 (0.0%) |
| 18 to 24 Years | 0 (0.0%) | 0 (0.0%) |
| 25 to 34 Years | 8 (7.0%) | 0 (0.0%) |
| 35 to 44 Years | 10 (15.4%) | 191 (73.2%) |
| 45 to 54 Years | 0 (0.0%) | 0 (0.0%) |
| 55 to 64 Years | 20 (7.2%) | 18 (9.5%) |
| 65 to 74 Years | 14 (12.7%) | 6 (5.4%) |
| 75 Years and over | 0 (0.0%) | 0 (0.0%) |
| Total | 52 (6.2%) | 215 (17.6%) |
Income Above Poverty by Sex and Age in Bear Creek
According to the poverty statistics in Bear Creek, males aged under 5 years and females aged under 5 years are the age groups that are most secure financially, with 100.0% of males and 100.0% of females in these age groups living above the poverty line.
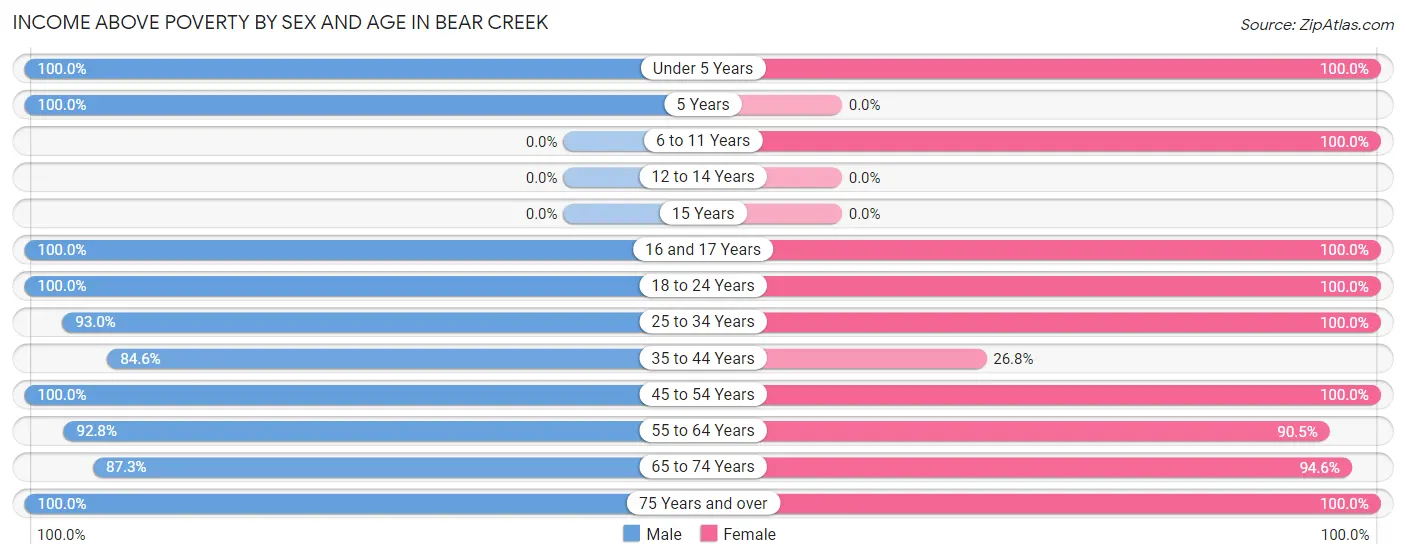
| Age Bracket | Male | Female |
| Under 5 Years | 19 (100.0%) | 23 (100.0%) |
| 5 Years | 21 (100.0%) | 0 (0.0%) |
| 6 to 11 Years | 0 (0.0%) | 20 (100.0%) |
| 12 to 14 Years | 0 (0.0%) | 0 (0.0%) |
| 15 Years | 0 (0.0%) | 0 (0.0%) |
| 16 and 17 Years | 6 (100.0%) | 48 (100.0%) |
| 18 to 24 Years | 11 (100.0%) | 221 (100.0%) |
| 25 to 34 Years | 106 (93.0%) | 100 (100.0%) |
| 35 to 44 Years | 55 (84.6%) | 70 (26.8%) |
| 45 to 54 Years | 108 (100.0%) | 138 (100.0%) |
| 55 to 64 Years | 256 (92.7%) | 172 (90.5%) |
| 65 to 74 Years | 96 (87.3%) | 106 (94.6%) |
| 75 Years and over | 112 (100.0%) | 111 (100.0%) |
| Total | 790 (93.8%) | 1,009 (82.4%) |
Income Below Poverty Among Married-Couple Families in Bear Creek
The poverty statistics for married-couple families in Bear Creek show that 3.4% or 14 of the total 414 families live below the poverty line. Families with no children have the highest poverty rate of 4.3%, comprising of 14 families. On the other hand, families with 1 or 2 children have the lowest poverty rate of 0.0%, which includes 0 families.
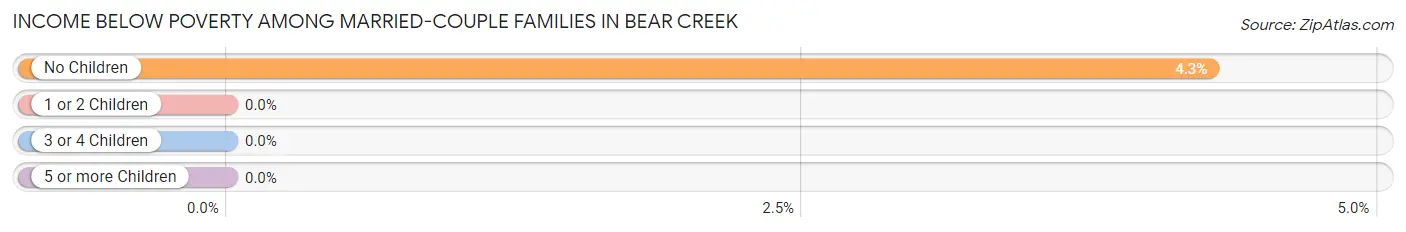
| Children | Above Poverty | Below Poverty |
| No Children | 314 (95.7%) | 14 (4.3%) |
| 1 or 2 Children | 79 (100.0%) | 0 (0.0%) |
| 3 or 4 Children | 7 (100.0%) | 0 (0.0%) |
| 5 or more Children | 0 (0.0%) | 0 (0.0%) |
| Total | 400 (96.6%) | 14 (3.4%) |
Income Below Poverty Among Single-Parent Households in Bear Creek
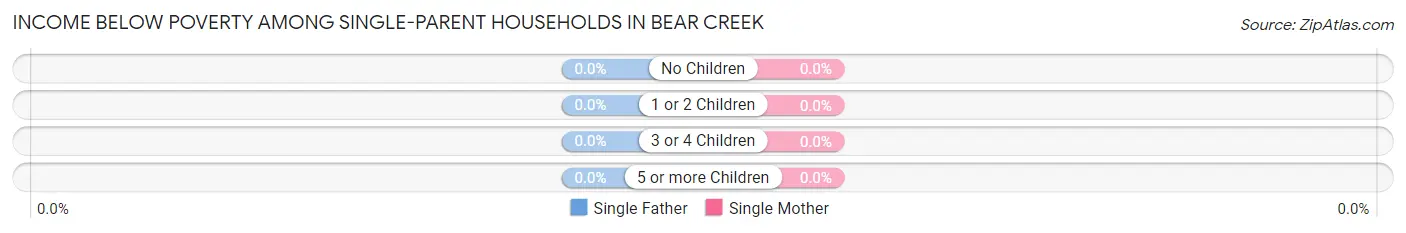
| Children | Single Father | Single Mother |
| No Children | 0 (0.0%) | 0 (0.0%) |
| 1 or 2 Children | 0 (0.0%) | 0 (0.0%) |
| 3 or 4 Children | 0 (0.0%) | 0 (0.0%) |
| 5 or more Children | 0 (0.0%) | 0 (0.0%) |
| Total | 0 (0.0%) | 0 (0.0%) |
Income Below Poverty Among Married-Couple vs Single-Parent Households in Bear Creek
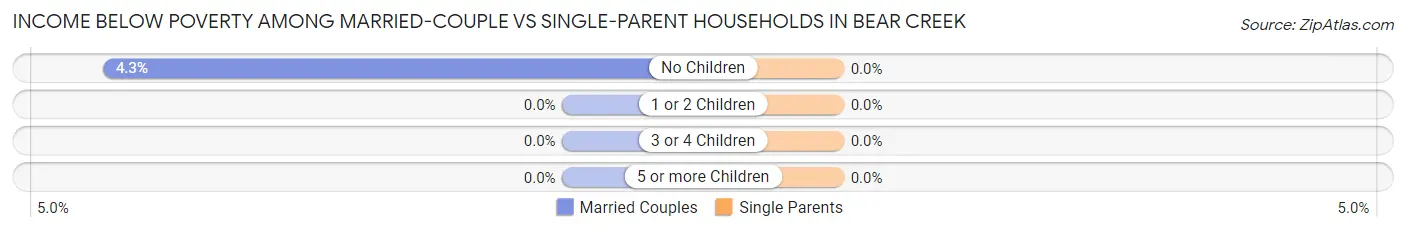
| Children | Married-Couple Families | Single-Parent Households |
| No Children | 14 (4.3%) | 0 (0.0%) |
| 1 or 2 Children | 0 (0.0%) | 0 (0.0%) |
| 3 or 4 Children | 0 (0.0%) | 0 (0.0%) |
| 5 or more Children | 0 (0.0%) | 0 (0.0%) |
| Total | 14 (3.4%) | 0 (0.0%) |
Employment Characteristics in Bear Creek
Employment by Class of Employer in Bear Creek
Among the 941 employed individuals in Bear Creek, private company employees (470 | 49.9%), self-employed (incorporated) (206 | 21.9%), and local government employees (77 | 8.2%) make up the most common classes of employment.
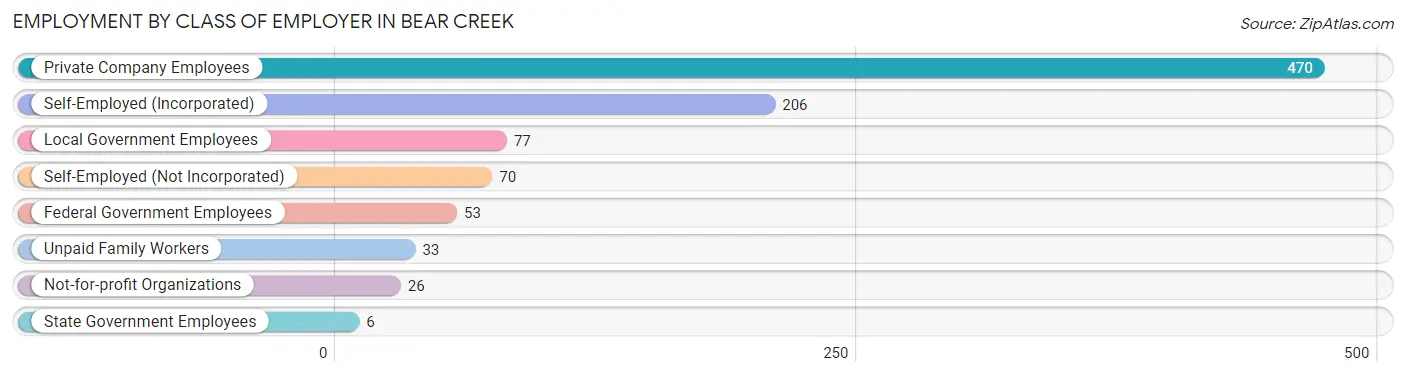
| Employer Class | # Employees | % Employees |
| Private Company Employees | 470 | 49.9% |
| Self-Employed (Incorporated) | 206 | 21.9% |
| Self-Employed (Not Incorporated) | 70 | 7.4% |
| Not-for-profit Organizations | 26 | 2.8% |
| Local Government Employees | 77 | 8.2% |
| State Government Employees | 6 | 0.6% |
| Federal Government Employees | 53 | 5.6% |
| Unpaid Family Workers | 33 | 3.5% |
| Total | 941 | 100.0% |
Employment Status by Age in Bear Creek
According to the labor force statistics for Bear Creek, out of the total population over 16 years of age (1,983), 50.6% or 1,003 individuals are in the labor force, with 3.8% or 38 of them unemployed. The age group with the highest labor force participation rate is 30 to 34 years, with 100.0% or 61 individuals in the labor force. Within the labor force, the 20 to 24 years age range has the highest percentage of unemployed individuals, with 51.9% or 54 of them being unemployed.
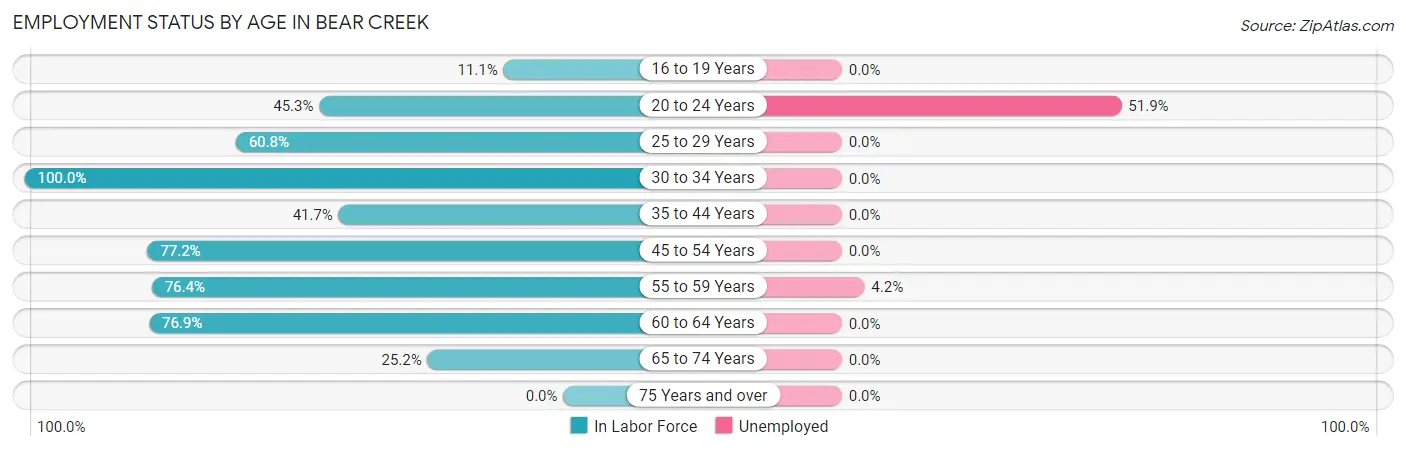
| Age Bracket | In Labor Force | Unemployed |
| 16 to 19 Years | 6 (11.1%) | 0 (0.0%) |
| 20 to 24 Years | 105 (45.3%) | 54 (51.9%) |
| 25 to 29 Years | 93 (60.8%) | 0 (0.0%) |
| 30 to 34 Years | 61 (100.0%) | 0 (0.0%) |
| 35 to 44 Years | 136 (41.7%) | 0 (0.0%) |
| 45 to 54 Years | 190 (77.2%) | 0 (0.0%) |
| 55 to 59 Years | 214 (76.4%) | 9 (4.2%) |
| 60 to 64 Years | 143 (76.9%) | 0 (0.0%) |
| 65 to 74 Years | 56 (25.2%) | 0 (0.0%) |
| 75 Years and over | 0 (0.0%) | 0 (0.0%) |
| Total | 1,003 (50.6%) | 38 (3.8%) |
Employment Status by Educational Attainment in Bear Creek
According to labor force statistics for Bear Creek, 66.9% of individuals (838) out of the total population between 25 and 64 years of age (1,252) are in the labor force, with 1.1% or 9 of them being unemployed. The group with the highest labor force participation rate are those with the educational attainment of less than high school, with 100.0% or 46 individuals in the labor force. Within the labor force, individuals with college / associate degree education have the highest percentage of unemployment, with 4.4% or 9 of them being unemployed.
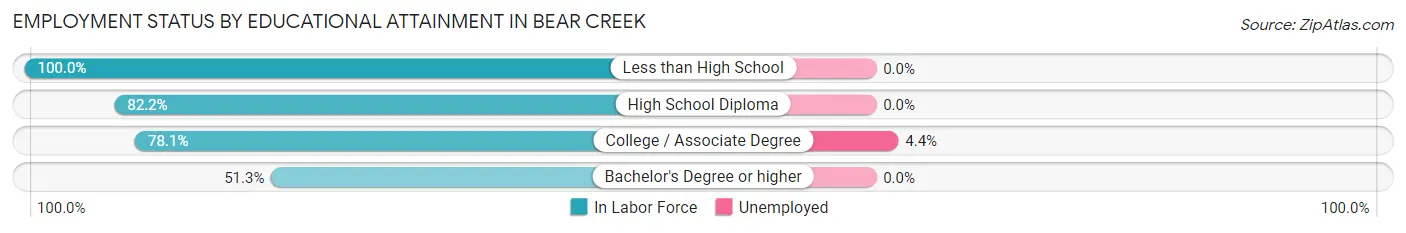
| Educational Attainment | In Labor Force | Unemployed |
| Less than High School | 46 (100.0%) | 0 (0.0%) |
| High School Diploma | 273 (82.2%) | 0 (0.0%) |
| College / Associate Degree | 203 (78.1%) | 11 (4.4%) |
| Bachelor's Degree or higher | 315 (51.3%) | 0 (0.0%) |
| Total | 838 (66.9%) | 14 (1.1%) |
Employment Occupations by Sex in Bear Creek
Management, Business, Science and Arts Occupations
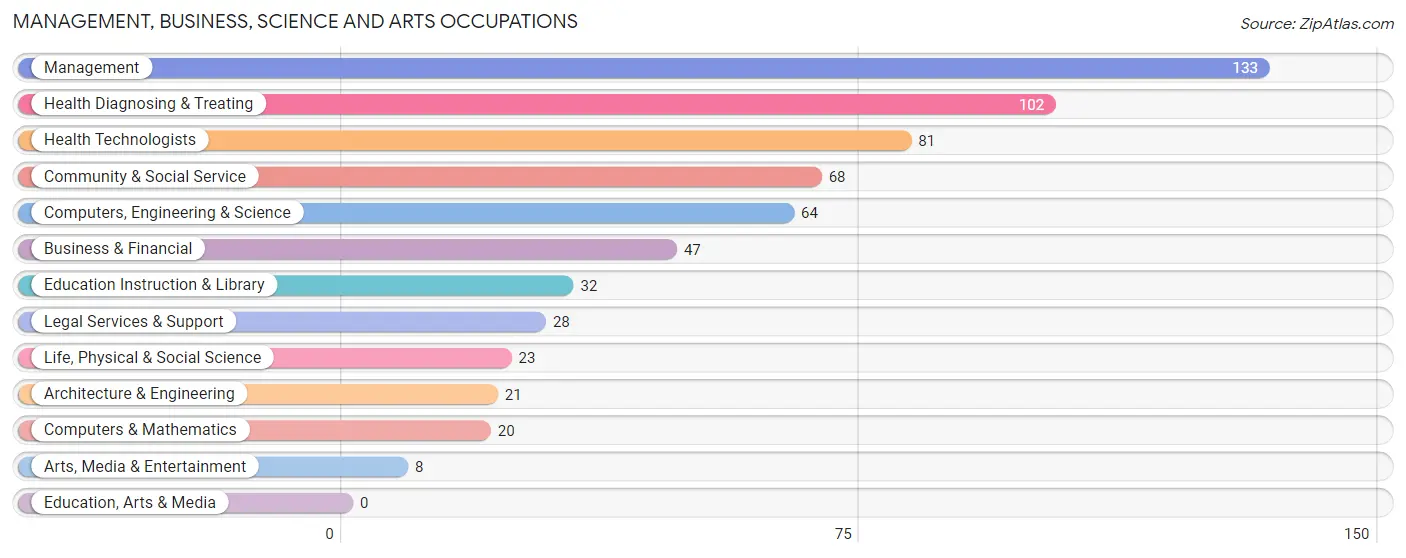
The most common Management, Business, Science and Arts occupations in Bear Creek are Management (133 | 14.5%), Health Diagnosing & Treating (102 | 11.2%), Health Technologists (81 | 8.8%), Community & Social Service (68 | 7.4%), and Computers, Engineering & Science (64 | 7.0%).
Management, Business, Science and Arts Occupations by Sex
Within the Management, Business, Science and Arts occupations in Bear Creek, the most male-oriented occupations are Computers & Mathematics (100.0%), Architecture & Engineering (100.0%), and Computers, Engineering & Science (87.5%), while the most female-oriented occupations are Arts, Media & Entertainment (100.0%), Health Technologists (100.0%), and Health Diagnosing & Treating (92.2%).
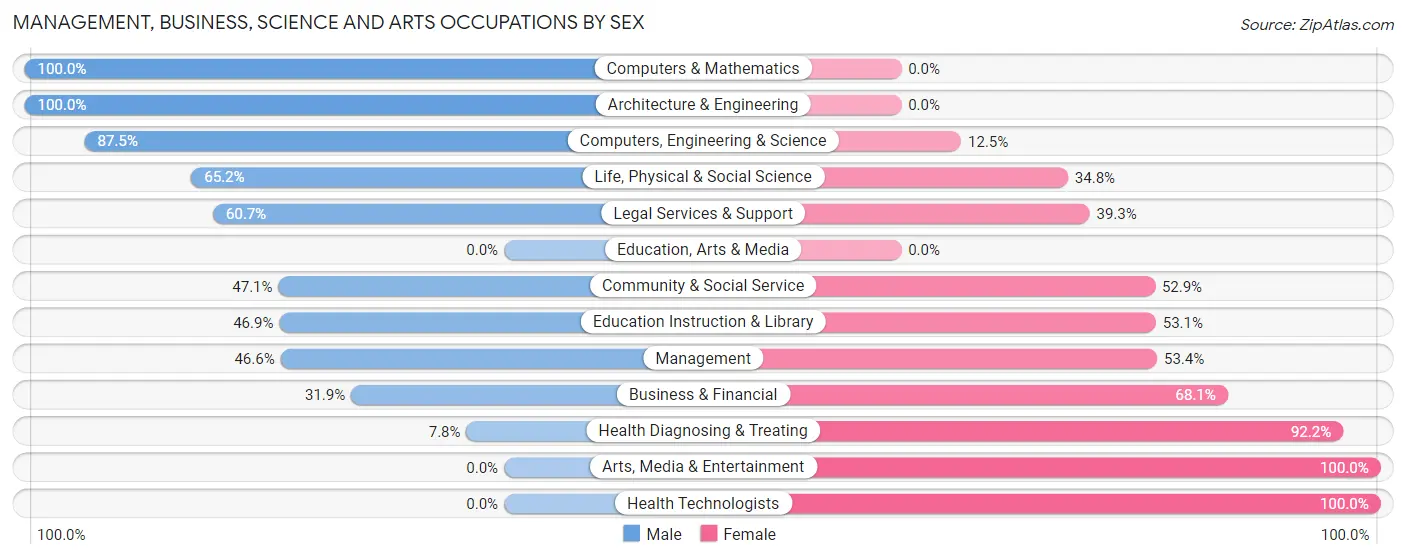
| Occupation | Male | Female |
| Management | 62 (46.6%) | 71 (53.4%) |
| Business & Financial | 15 (31.9%) | 32 (68.1%) |
| Computers, Engineering & Science | 56 (87.5%) | 8 (12.5%) |
| Computers & Mathematics | 20 (100.0%) | 0 (0.0%) |
| Architecture & Engineering | 21 (100.0%) | 0 (0.0%) |
| Life, Physical & Social Science | 15 (65.2%) | 8 (34.8%) |
| Community & Social Service | 32 (47.1%) | 36 (52.9%) |
| Education, Arts & Media | 0 (0.0%) | 0 (0.0%) |
| Legal Services & Support | 17 (60.7%) | 11 (39.3%) |
| Education Instruction & Library | 15 (46.9%) | 17 (53.1%) |
| Arts, Media & Entertainment | 0 (0.0%) | 8 (100.0%) |
| Health Diagnosing & Treating | 8 (7.8%) | 94 (92.2%) |
| Health Technologists | 0 (0.0%) | 81 (100.0%) |
| Total (Category) | 173 (41.8%) | 241 (58.2%) |
| Total (Overall) | 492 (53.8%) | 423 (46.2%) |
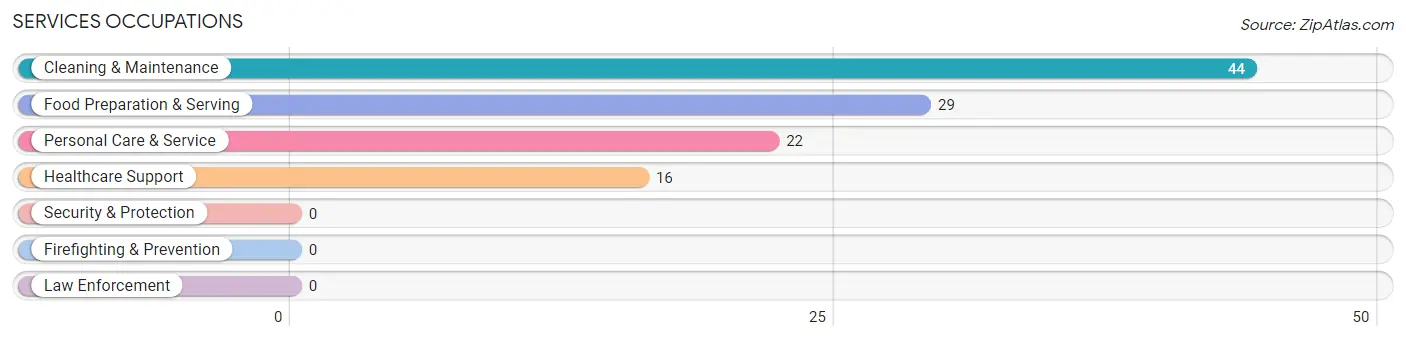
Services Occupations
The most common Services occupations in Bear Creek are Cleaning & Maintenance (44 | 4.8%), Food Preparation & Serving (29 | 3.2%), Personal Care & Service (22 | 2.4%), and Healthcare Support (16 | 1.8%).
Services Occupations by Sex
Within the Services occupations in Bear Creek, the most male-oriented occupations are Food Preparation & Serving (100.0%), and Cleaning & Maintenance (47.7%), while the most female-oriented occupations are Healthcare Support (100.0%), Personal Care & Service (100.0%), and Cleaning & Maintenance (52.3%).
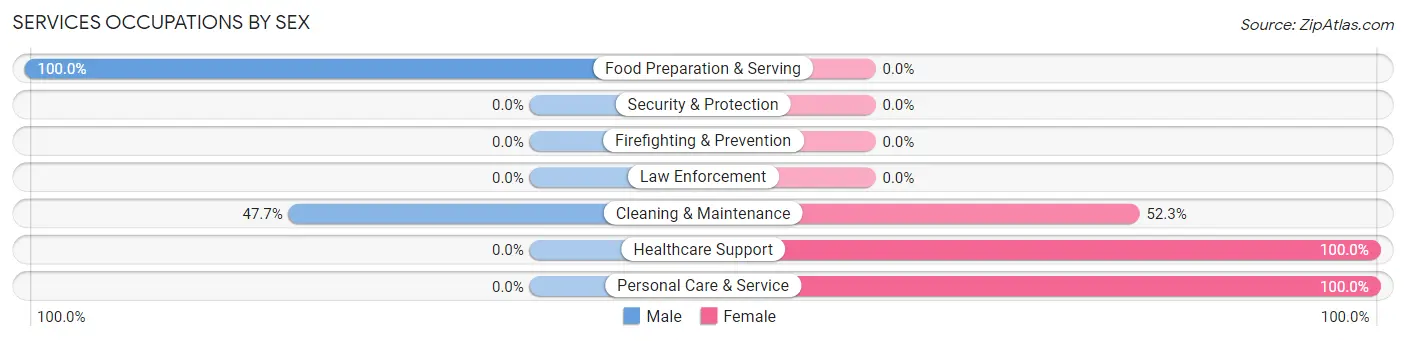
| Occupation | Male | Female |
| Healthcare Support | 0 (0.0%) | 16 (100.0%) |
| Security & Protection | 0 (0.0%) | 0 (0.0%) |
| Firefighting & Prevention | 0 (0.0%) | 0 (0.0%) |
| Law Enforcement | 0 (0.0%) | 0 (0.0%) |
| Food Preparation & Serving | 29 (100.0%) | 0 (0.0%) |
| Cleaning & Maintenance | 21 (47.7%) | 23 (52.3%) |
| Personal Care & Service | 0 (0.0%) | 22 (100.0%) |
| Total (Category) | 50 (45.1%) | 61 (54.9%) |
| Total (Overall) | 492 (53.8%) | 423 (46.2%) |
Sales and Office Occupations
The most common Sales and Office occupations in Bear Creek are Office & Administration (135 | 14.7%), and Sales & Related (97 | 10.6%).

Sales and Office Occupations by Sex
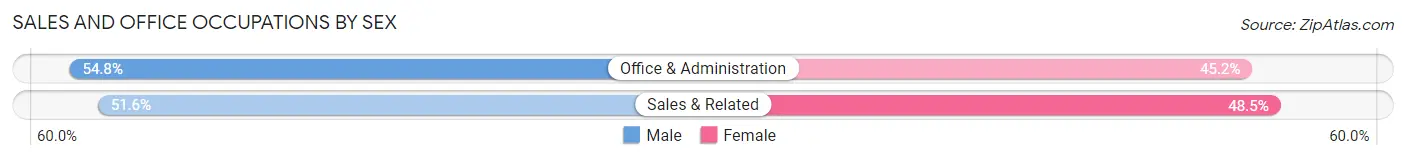
| Occupation | Male | Female |
| Sales & Related | 50 (51.5%) | 47 (48.4%) |
| Office & Administration | 74 (54.8%) | 61 (45.2%) |
| Total (Category) | 124 (53.4%) | 108 (46.6%) |
| Total (Overall) | 492 (53.8%) | 423 (46.2%) |
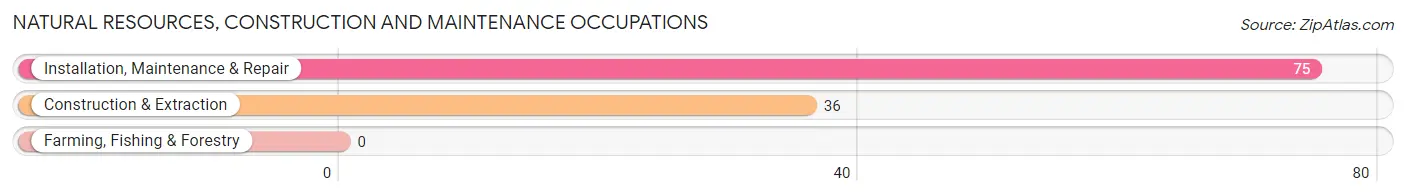
Natural Resources, Construction and Maintenance Occupations
The most common Natural Resources, Construction and Maintenance occupations in Bear Creek are Installation, Maintenance & Repair (75 | 8.2%), and Construction & Extraction (36 | 3.9%).
Natural Resources, Construction and Maintenance Occupations by Sex
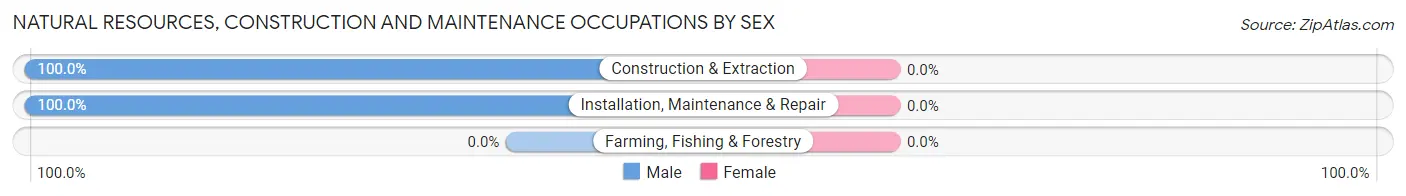
| Occupation | Male | Female |
| Farming, Fishing & Forestry | 0 (0.0%) | 0 (0.0%) |
| Construction & Extraction | 36 (100.0%) | 0 (0.0%) |
| Installation, Maintenance & Repair | 75 (100.0%) | 0 (0.0%) |
| Total (Category) | 111 (100.0%) | 0 (0.0%) |
| Total (Overall) | 492 (53.8%) | 423 (46.2%) |
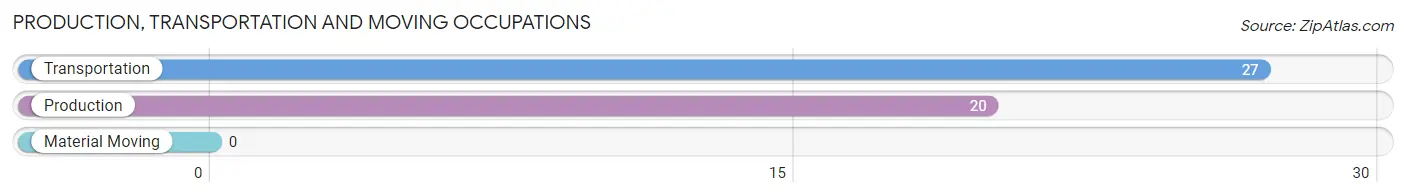
Production, Transportation and Moving Occupations
The most common Production, Transportation and Moving occupations in Bear Creek are Transportation (27 | 2.9%), and Production (20 | 2.2%).
Production, Transportation and Moving Occupations by Sex
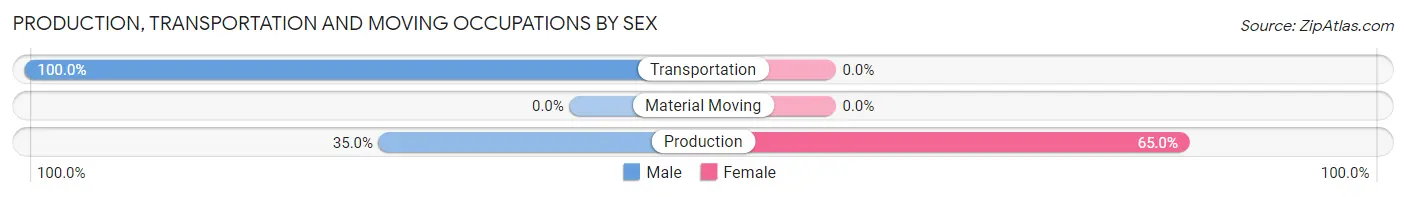
| Occupation | Male | Female |
| Production | 7 (35.0%) | 13 (65.0%) |
| Transportation | 27 (100.0%) | 0 (0.0%) |
| Material Moving | 0 (0.0%) | 0 (0.0%) |
| Total (Category) | 34 (72.3%) | 13 (27.7%) |
| Total (Overall) | 492 (53.8%) | 423 (46.2%) |
Employment Industries by Sex in Bear Creek
Employment Industries in Bear Creek
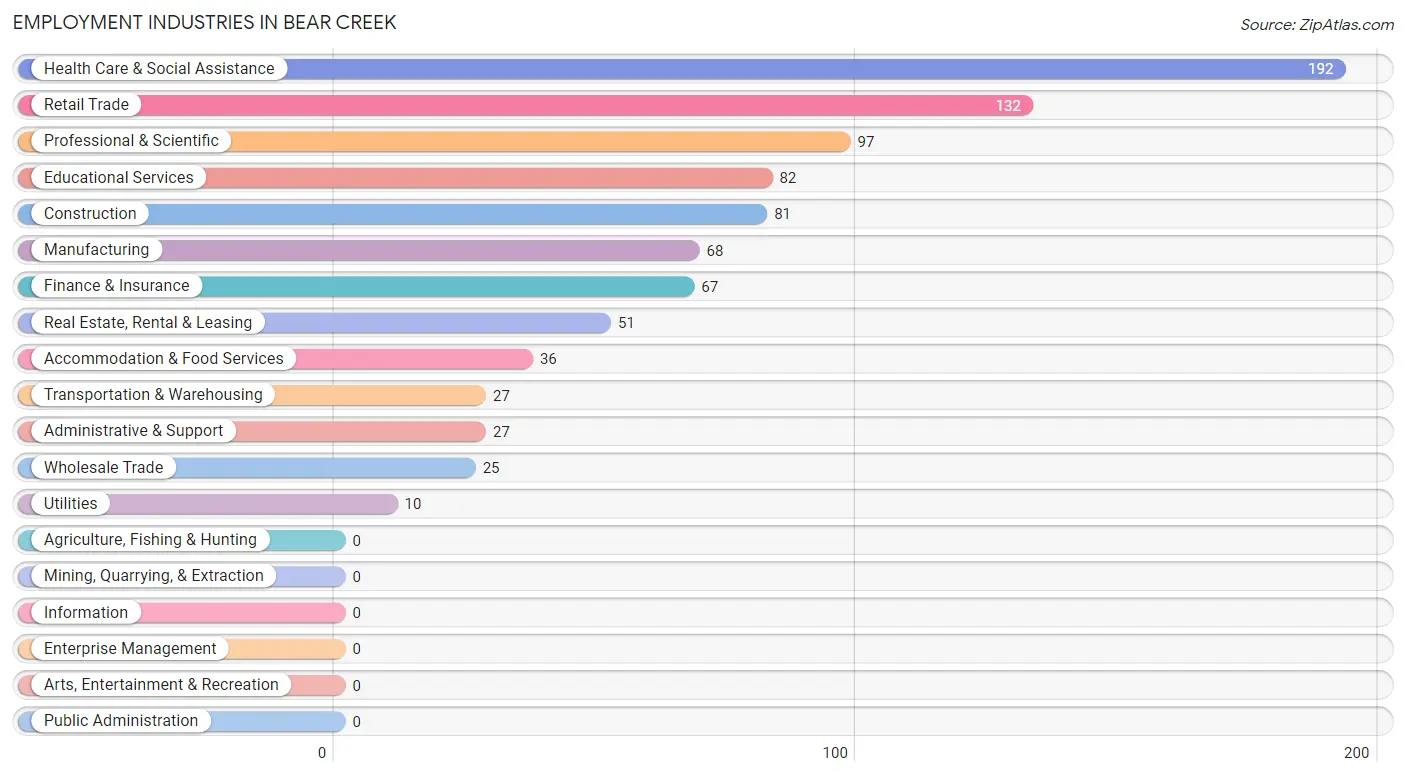
The major employment industries in Bear Creek include Health Care & Social Assistance (192 | 21.0%), Retail Trade (132 | 14.4%), Professional & Scientific (97 | 10.6%), Educational Services (82 | 9.0%), and Construction (81 | 8.8%).
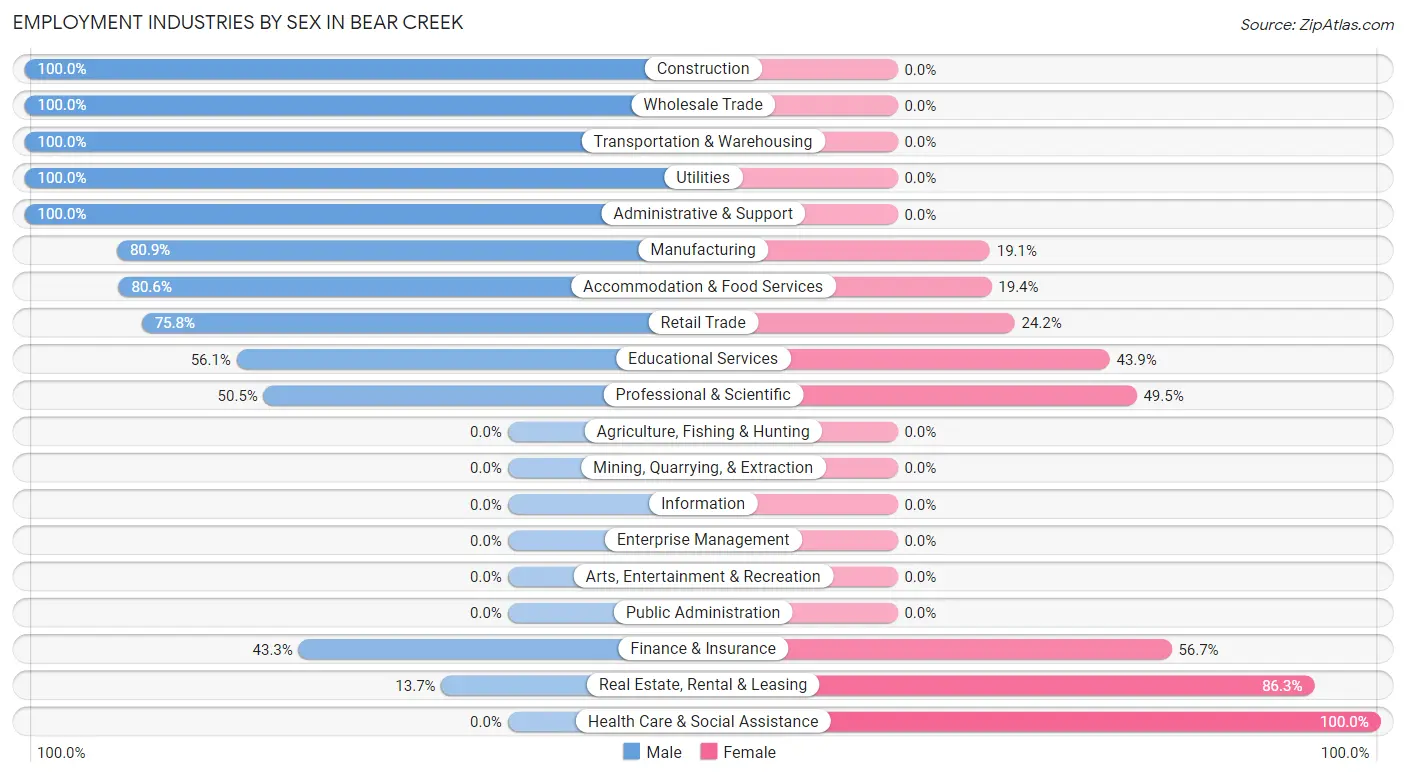
Employment Industries by Sex in Bear Creek
The Bear Creek industries that see more men than women are Construction (100.0%), Wholesale Trade (100.0%), and Transportation & Warehousing (100.0%), whereas the industries that tend to have a higher number of women are Health Care & Social Assistance (100.0%), Real Estate, Rental & Leasing (86.3%), and Finance & Insurance (56.7%).
| Industry | Male | Female |
| Agriculture, Fishing & Hunting | 0 (0.0%) | 0 (0.0%) |
| Mining, Quarrying, & Extraction | 0 (0.0%) | 0 (0.0%) |
| Construction | 81 (100.0%) | 0 (0.0%) |
| Manufacturing | 55 (80.9%) | 13 (19.1%) |
| Wholesale Trade | 25 (100.0%) | 0 (0.0%) |
| Retail Trade | 100 (75.8%) | 32 (24.2%) |
| Transportation & Warehousing | 27 (100.0%) | 0 (0.0%) |
| Utilities | 10 (100.0%) | 0 (0.0%) |
| Information | 0 (0.0%) | 0 (0.0%) |
| Finance & Insurance | 29 (43.3%) | 38 (56.7%) |
| Real Estate, Rental & Leasing | 7 (13.7%) | 44 (86.3%) |
| Professional & Scientific | 49 (50.5%) | 48 (49.5%) |
| Enterprise Management | 0 (0.0%) | 0 (0.0%) |
| Administrative & Support | 27 (100.0%) | 0 (0.0%) |
| Educational Services | 46 (56.1%) | 36 (43.9%) |
| Health Care & Social Assistance | 0 (0.0%) | 192 (100.0%) |
| Arts, Entertainment & Recreation | 0 (0.0%) | 0 (0.0%) |
| Accommodation & Food Services | 29 (80.6%) | 7 (19.4%) |
| Public Administration | 0 (0.0%) | 0 (0.0%) |
| Total | 492 (53.8%) | 423 (46.2%) |
Education in Bear Creek
School Enrollment in Bear Creek
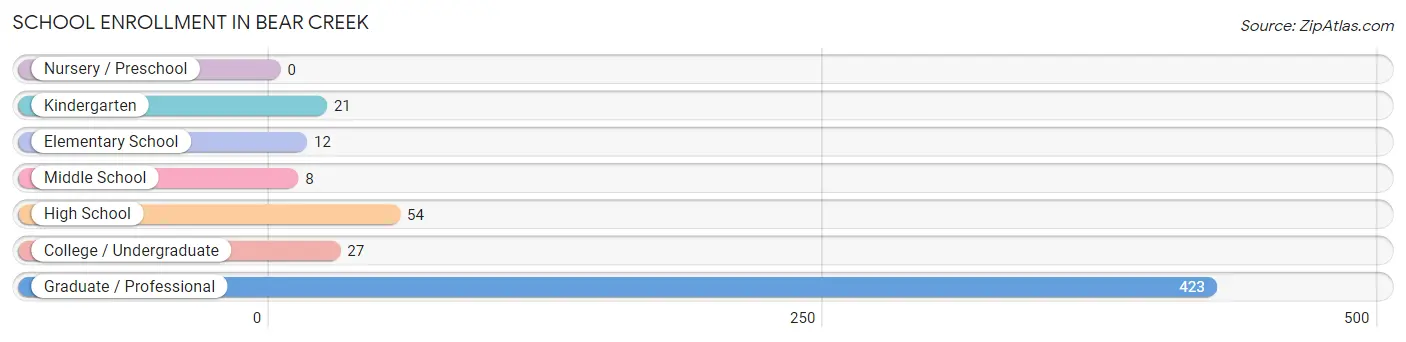
The most common levels of schooling among the 545 students in Bear Creek are graduate / professional (423 | 77.6%), high school (54 | 9.9%), and college / undergraduate (27 | 5.0%).
| School Level | # Students | % Students |
| Nursery / Preschool | 0 | 0.0% |
| Kindergarten | 21 | 3.8% |
| Elementary School | 12 | 2.2% |
| Middle School | 8 | 1.5% |
| High School | 54 | 9.9% |
| College / Undergraduate | 27 | 5.0% |
| Graduate / Professional | 423 | 77.6% |
| Total | 545 | 100.0% |
School Enrollment by Age by Funding Source in Bear Creek
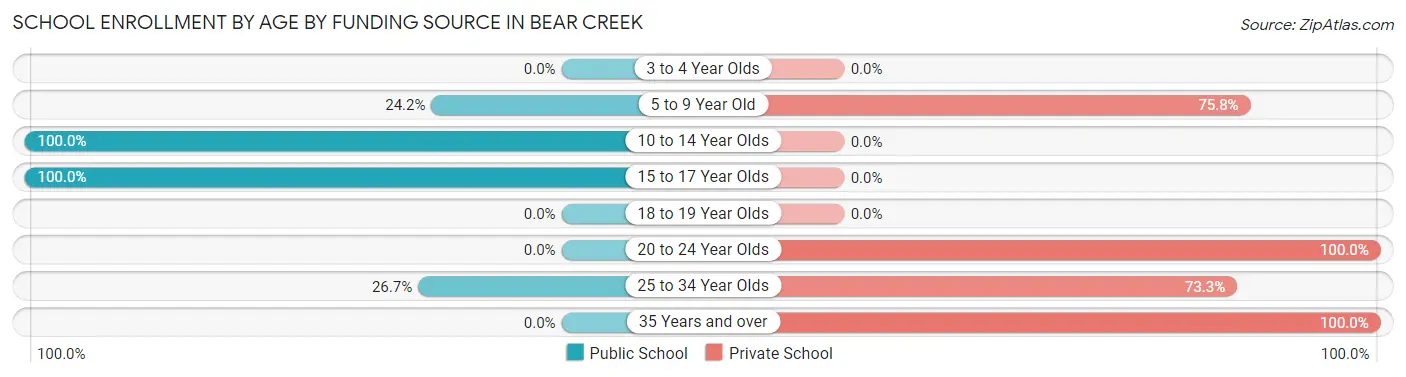
Out of a total of 545 students who are enrolled in schools in Bear Creek, 448 (82.2%) attend a private institution, while the remaining 97 (17.8%) are enrolled in public schools. The age group of 20 to 24 year olds has the highest likelihood of being enrolled in private schools, with 169 (100.0% in the age bracket) enrolled. Conversely, the age group of 10 to 14 year olds has the lowest likelihood of being enrolled in a private school, with 8 (100.0% in the age bracket) attending a public institution.
| Age Bracket | Public School | Private School |
| 3 to 4 Year Olds | 0 (0.0%) | 0 (0.0%) |
| 5 to 9 Year Old | 8 (24.2%) | 25 (75.8%) |
| 10 to 14 Year Olds | 8 (100.0%) | 0 (0.0%) |
| 15 to 17 Year Olds | 54 (100.0%) | 0 (0.0%) |
| 18 to 19 Year Olds | 0 (0.0%) | 0 (0.0%) |
| 20 to 24 Year Olds | 0 (0.0%) | 169 (100.0%) |
| 25 to 34 Year Olds | 27 (26.7%) | 74 (73.3%) |
| 35 Years and over | 0 (0.0%) | 180 (100.0%) |
| Total | 97 (17.8%) | 448 (82.2%) |
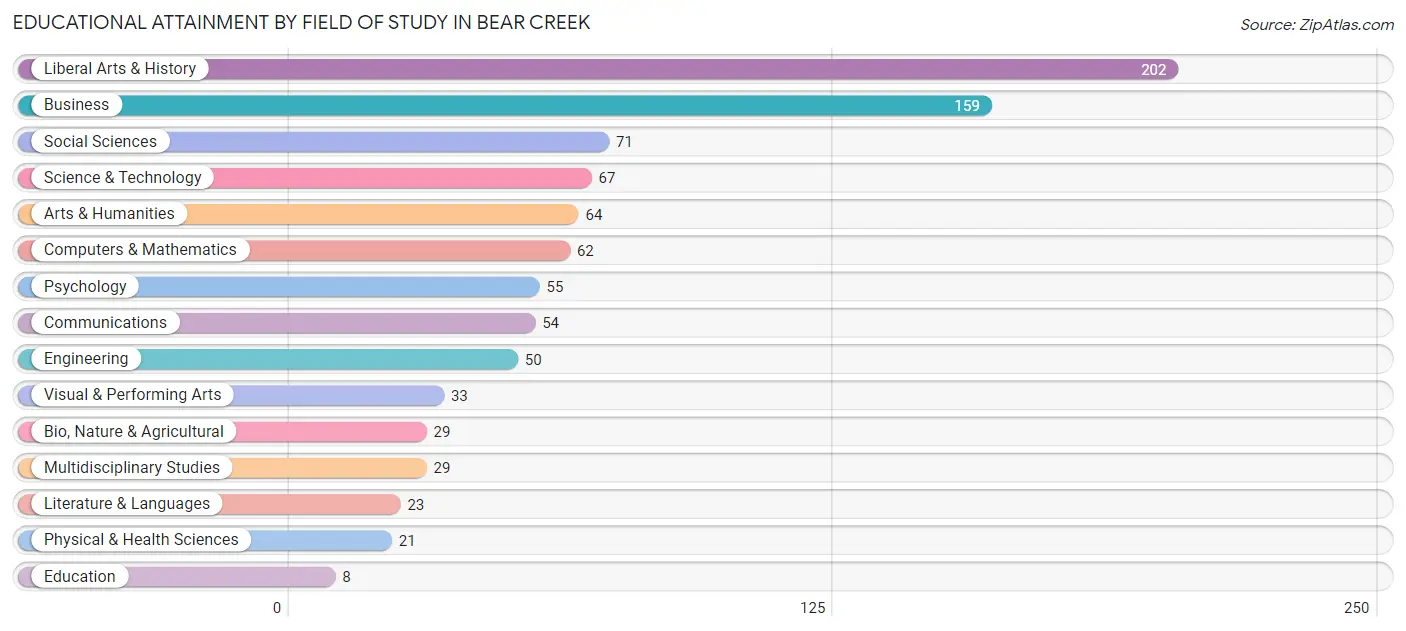
Educational Attainment by Field of Study in Bear Creek
Liberal arts & history (202 | 21.8%), business (159 | 17.2%), social sciences (71 | 7.7%), science & technology (67 | 7.2%), and arts & humanities (64 | 6.9%) are the most common fields of study among 927 individuals in Bear Creek who have obtained a bachelor's degree or higher.
| Field of Study | # Graduates | % Graduates |
| Computers & Mathematics | 62 | 6.7% |
| Bio, Nature & Agricultural | 29 | 3.1% |
| Physical & Health Sciences | 21 | 2.3% |
| Psychology | 55 | 5.9% |
| Social Sciences | 71 | 7.7% |
| Engineering | 50 | 5.4% |
| Multidisciplinary Studies | 29 | 3.1% |
| Science & Technology | 67 | 7.2% |
| Business | 159 | 17.2% |
| Education | 8 | 0.9% |
| Literature & Languages | 23 | 2.5% |
| Liberal Arts & History | 202 | 21.8% |
| Visual & Performing Arts | 33 | 3.6% |
| Communications | 54 | 5.8% |
| Arts & Humanities | 64 | 6.9% |
| Total | 927 | 100.0% |
Transportation & Commute in Bear Creek
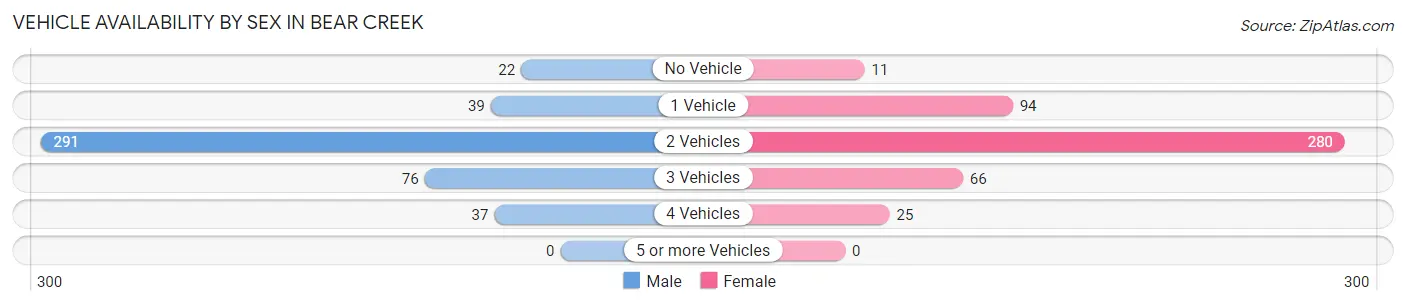
Vehicle Availability by Sex in Bear Creek
The most prevalent vehicle ownership categories in Bear Creek are males with 2 vehicles (291, accounting for 62.6%) and females with 2 vehicles (280, making up 61.1%).
| Vehicles Available | Male | Female |
| No Vehicle | 22 (4.7%) | 11 (2.3%) |
| 1 Vehicle | 39 (8.4%) | 94 (19.8%) |
| 2 Vehicles | 291 (62.6%) | 280 (58.8%) |
| 3 Vehicles | 76 (16.3%) | 66 (13.9%) |
| 4 Vehicles | 37 (8.0%) | 25 (5.2%) |
| 5 or more Vehicles | 0 (0.0%) | 0 (0.0%) |
| Total | 465 (100.0%) | 476 (100.0%) |
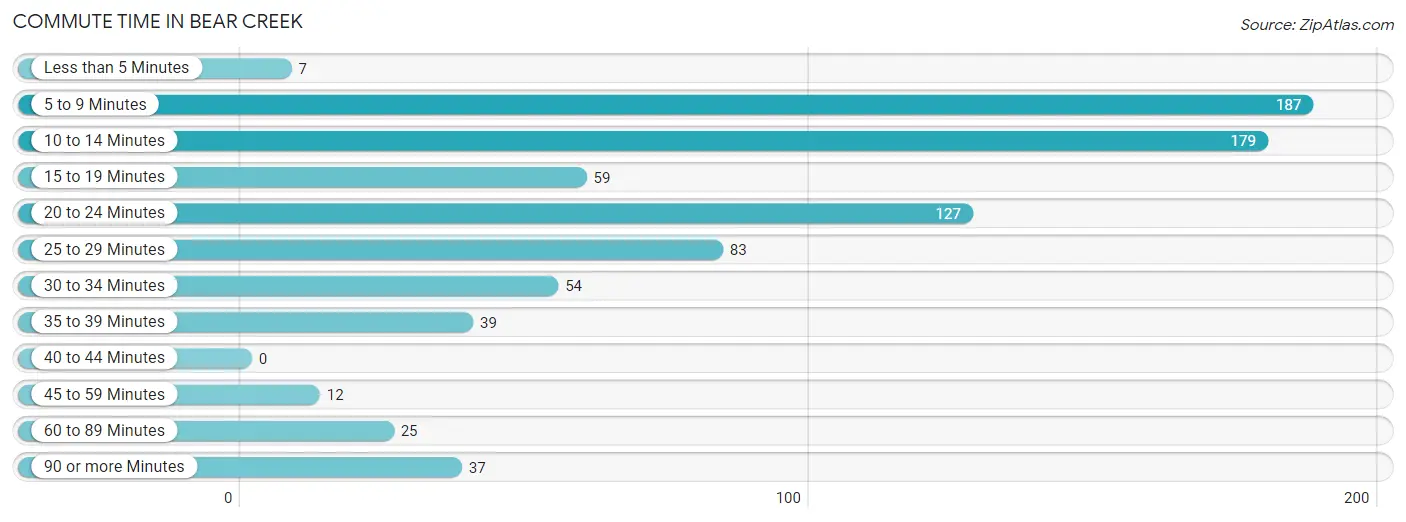
Commute Time in Bear Creek
The most frequently occuring commute durations in Bear Creek are 5 to 9 minutes (187 commuters, 23.1%), 10 to 14 minutes (179 commuters, 22.1%), and 20 to 24 minutes (127 commuters, 15.7%).
| Commute Time | # Commuters | % Commuters |
| Less than 5 Minutes | 7 | 0.9% |
| 5 to 9 Minutes | 187 | 23.1% |
| 10 to 14 Minutes | 179 | 22.1% |
| 15 to 19 Minutes | 59 | 7.3% |
| 20 to 24 Minutes | 127 | 15.7% |
| 25 to 29 Minutes | 83 | 10.3% |
| 30 to 34 Minutes | 54 | 6.7% |
| 35 to 39 Minutes | 39 | 4.8% |
| 40 to 44 Minutes | 0 | 0.0% |
| 45 to 59 Minutes | 12 | 1.5% |
| 60 to 89 Minutes | 25 | 3.1% |
| 90 or more Minutes | 37 | 4.6% |
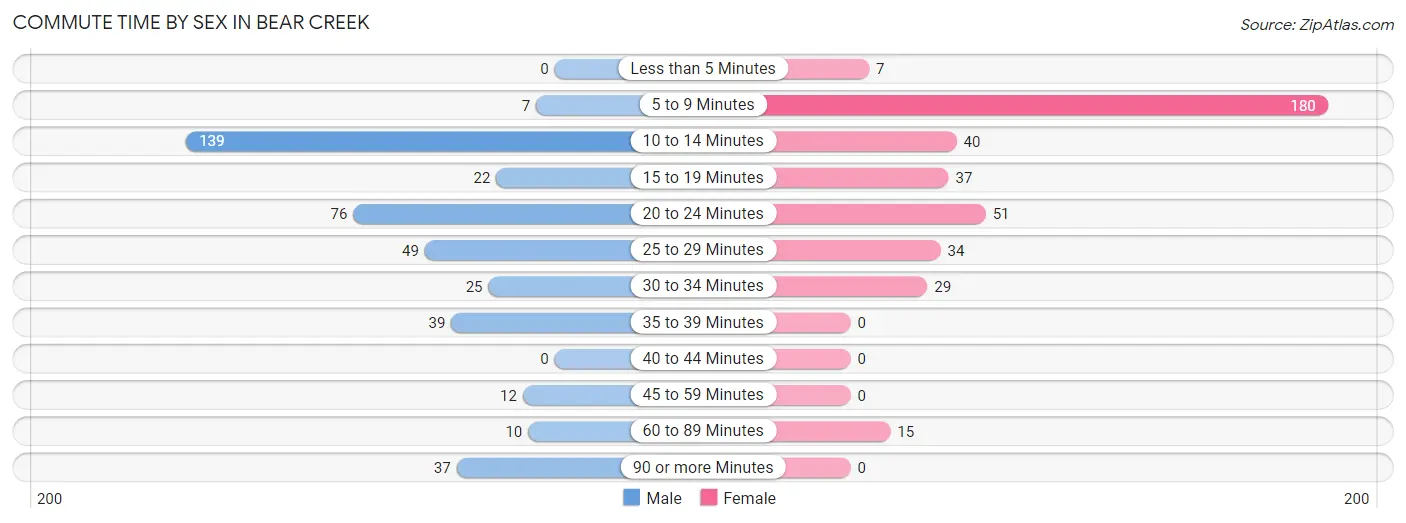
Commute Time by Sex in Bear Creek
The most common commute times in Bear Creek are 10 to 14 minutes (139 commuters, 33.4%) for males and 5 to 9 minutes (180 commuters, 45.8%) for females.
| Commute Time | Male | Female |
| Less than 5 Minutes | 0 (0.0%) | 7 (1.8%) |
| 5 to 9 Minutes | 7 (1.7%) | 180 (45.8%) |
| 10 to 14 Minutes | 139 (33.4%) | 40 (10.2%) |
| 15 to 19 Minutes | 22 (5.3%) | 37 (9.4%) |
| 20 to 24 Minutes | 76 (18.3%) | 51 (13.0%) |
| 25 to 29 Minutes | 49 (11.8%) | 34 (8.6%) |
| 30 to 34 Minutes | 25 (6.0%) | 29 (7.4%) |
| 35 to 39 Minutes | 39 (9.4%) | 0 (0.0%) |
| 40 to 44 Minutes | 0 (0.0%) | 0 (0.0%) |
| 45 to 59 Minutes | 12 (2.9%) | 0 (0.0%) |
| 60 to 89 Minutes | 10 (2.4%) | 15 (3.8%) |
| 90 or more Minutes | 37 (8.9%) | 0 (0.0%) |
Time of Departure to Work by Sex in Bear Creek
The most frequent times of departure to work in Bear Creek are 6:30 AM to 6:59 AM (87, 20.9%) for males and 7:30 AM to 7:59 AM (160, 40.7%) for females.
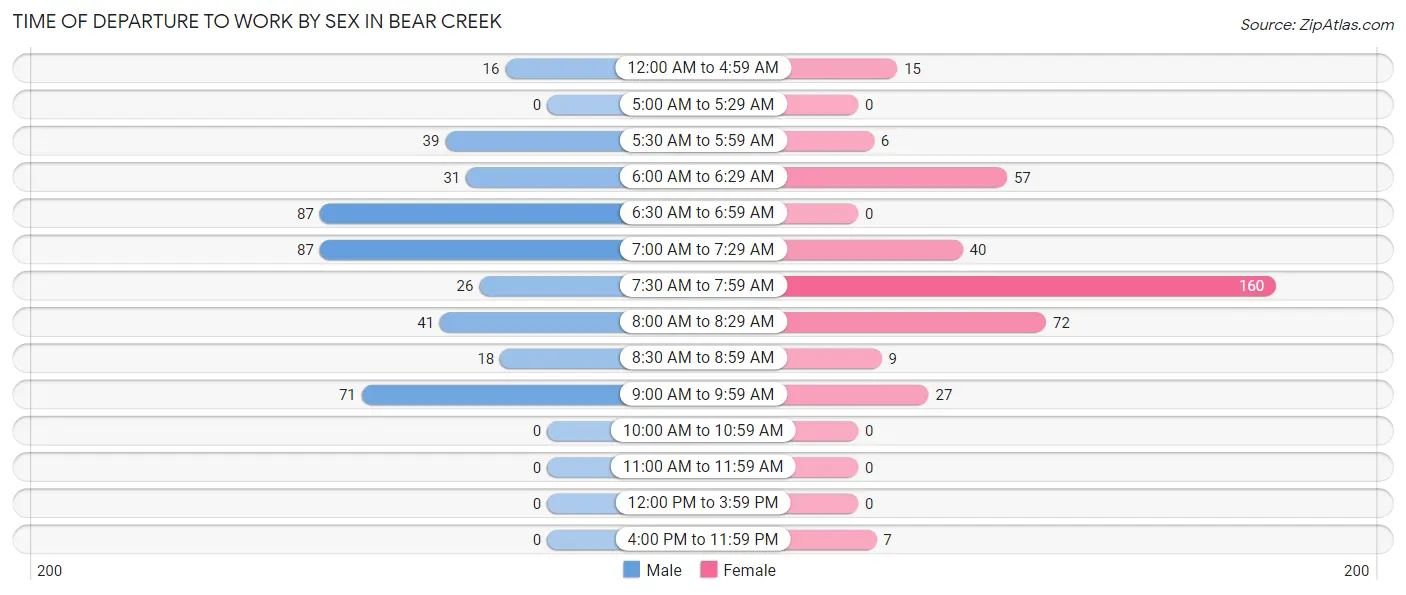
| Time of Departure | Male | Female |
| 12:00 AM to 4:59 AM | 16 (3.8%) | 15 (3.8%) |
| 5:00 AM to 5:29 AM | 0 (0.0%) | 0 (0.0%) |
| 5:30 AM to 5:59 AM | 39 (9.4%) | 6 (1.5%) |
| 6:00 AM to 6:29 AM | 31 (7.4%) | 57 (14.5%) |
| 6:30 AM to 6:59 AM | 87 (20.9%) | 0 (0.0%) |
| 7:00 AM to 7:29 AM | 87 (20.9%) | 40 (10.2%) |
| 7:30 AM to 7:59 AM | 26 (6.2%) | 160 (40.7%) |
| 8:00 AM to 8:29 AM | 41 (9.9%) | 72 (18.3%) |
| 8:30 AM to 8:59 AM | 18 (4.3%) | 9 (2.3%) |
| 9:00 AM to 9:59 AM | 71 (17.1%) | 27 (6.9%) |
| 10:00 AM to 10:59 AM | 0 (0.0%) | 0 (0.0%) |
| 11:00 AM to 11:59 AM | 0 (0.0%) | 0 (0.0%) |
| 12:00 PM to 3:59 PM | 0 (0.0%) | 0 (0.0%) |
| 4:00 PM to 11:59 PM | 0 (0.0%) | 7 (1.8%) |
| Total | 416 (100.0%) | 393 (100.0%) |
Housing Occupancy in Bear Creek
Occupancy by Ownership in Bear Creek
Of the total 923 dwellings in Bear Creek, owner-occupied units account for 650 (70.4%), while renter-occupied units make up 273 (29.6%).
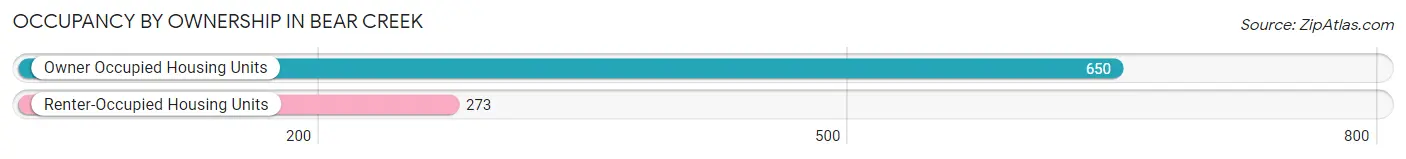
| Occupancy | # Housing Units | % Housing Units |
| Owner Occupied Housing Units | 650 | 70.4% |
| Renter-Occupied Housing Units | 273 | 29.6% |
| Total Occupied Housing Units | 923 | 100.0% |
Occupancy by Household Size in Bear Creek
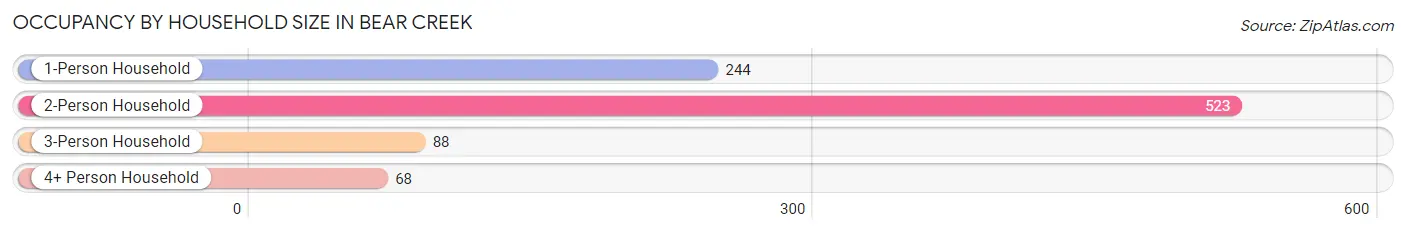
| Household Size | # Housing Units | % Housing Units |
| 1-Person Household | 244 | 26.4% |
| 2-Person Household | 523 | 56.7% |
| 3-Person Household | 88 | 9.5% |
| 4+ Person Household | 68 | 7.4% |
| Total Housing Units | 923 | 100.0% |
Occupancy by Ownership by Household Size in Bear Creek
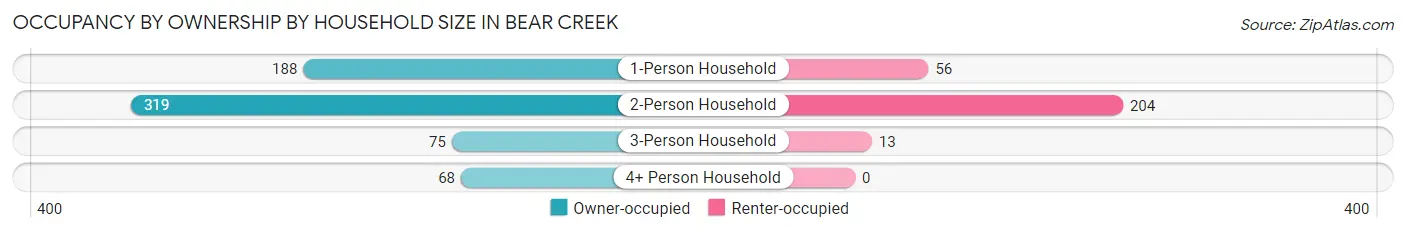
| Household Size | Owner-occupied | Renter-occupied |
| 1-Person Household | 188 (77.0%) | 56 (23.0%) |
| 2-Person Household | 319 (61.0%) | 204 (39.0%) |
| 3-Person Household | 75 (85.2%) | 13 (14.8%) |
| 4+ Person Household | 68 (100.0%) | 0 (0.0%) |
| Total Housing Units | 650 (70.4%) | 273 (29.6%) |
Occupancy by Educational Attainment in Bear Creek
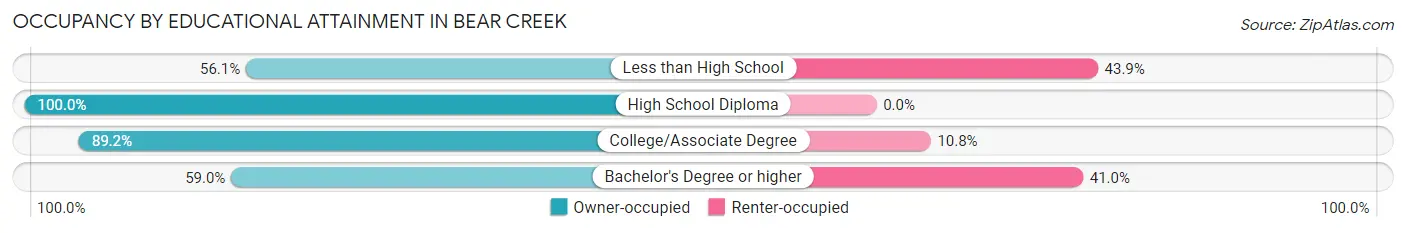
| Household Size | Owner-occupied | Renter-occupied |
| Less than High School | 23 (56.1%) | 18 (43.9%) |
| High School Diploma | 95 (100.0%) | 0 (0.0%) |
| College/Associate Degree | 199 (89.2%) | 24 (10.8%) |
| Bachelor's Degree or higher | 333 (59.0%) | 231 (41.0%) |
Occupancy by Age of Householder in Bear Creek
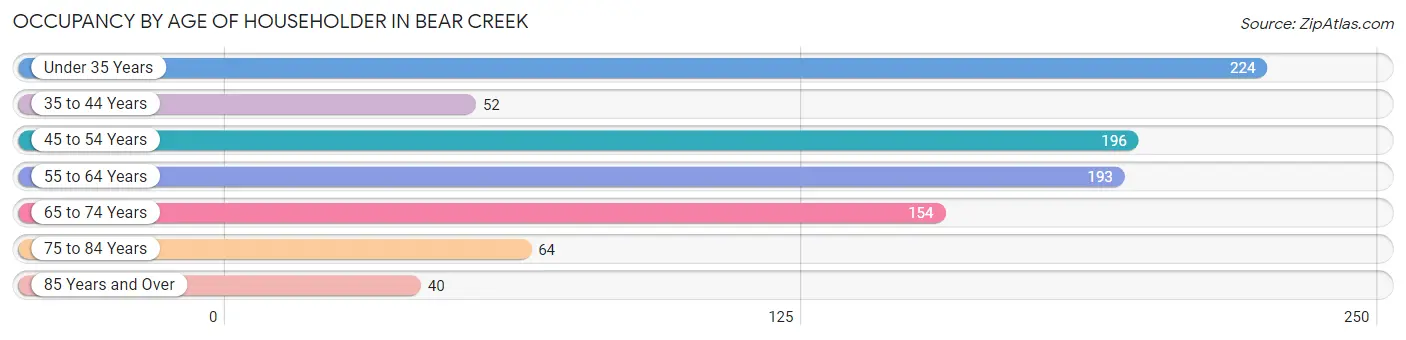
| Age Bracket | # Households | % Households |
| Under 35 Years | 224 | 24.3% |
| 35 to 44 Years | 52 | 5.6% |
| 45 to 54 Years | 196 | 21.2% |
| 55 to 64 Years | 193 | 20.9% |
| 65 to 74 Years | 154 | 16.7% |
| 75 to 84 Years | 64 | 6.9% |
| 85 Years and Over | 40 | 4.3% |
| Total | 923 | 100.0% |
Housing Finances in Bear Creek
Median Income by Occupancy in Bear Creek
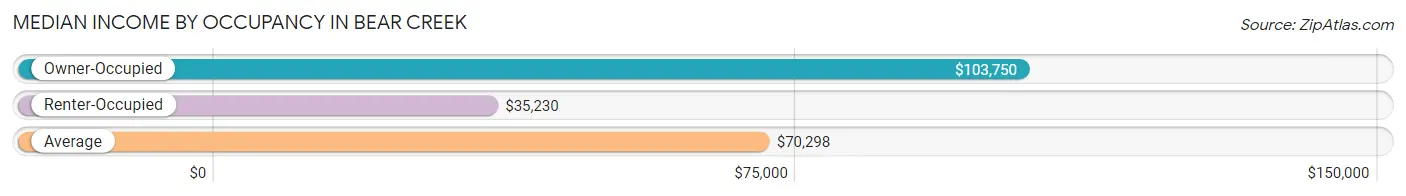
| Occupancy Type | # Households | Median Income |
| Owner-Occupied | 650 (70.4%) | $103,750 |
| Renter-Occupied | 273 (29.6%) | $35,230 |
| Average | 923 (100.0%) | $70,298 |
Occupancy by Householder Income Bracket in Bear Creek
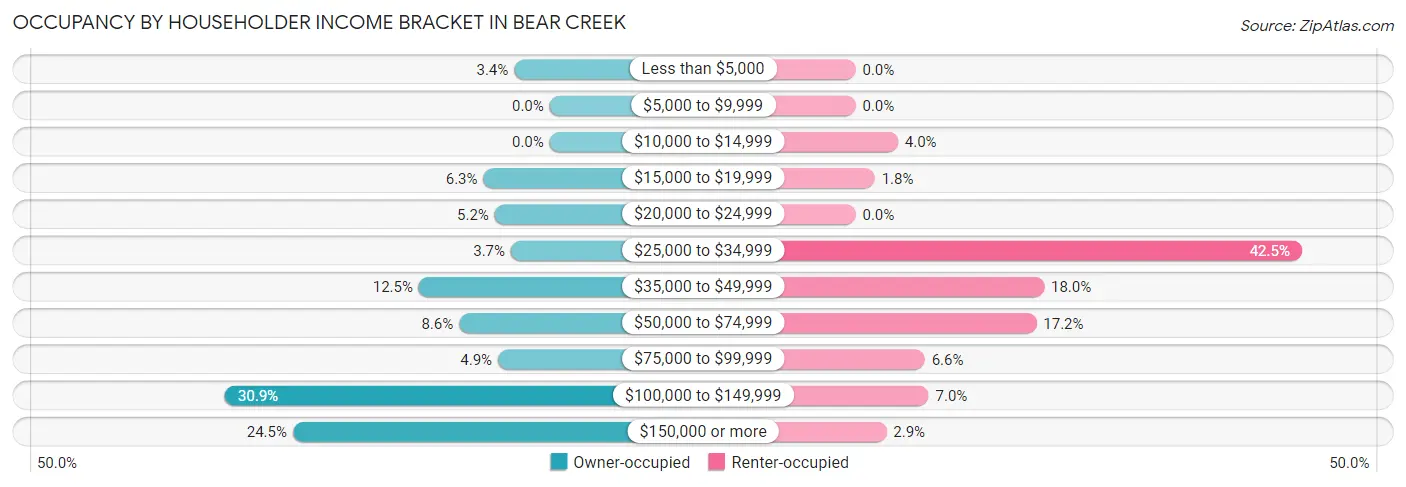
| Income Bracket | Owner-occupied | Renter-occupied |
| Less than $5,000 | 22 (3.4%) | 0 (0.0%) |
| $5,000 to $9,999 | 0 (0.0%) | 0 (0.0%) |
| $10,000 to $14,999 | 0 (0.0%) | 11 (4.0%) |
| $15,000 to $19,999 | 41 (6.3%) | 5 (1.8%) |
| $20,000 to $24,999 | 34 (5.2%) | 0 (0.0%) |
| $25,000 to $34,999 | 24 (3.7%) | 116 (42.5%) |
| $35,000 to $49,999 | 81 (12.5%) | 49 (17.9%) |
| $50,000 to $74,999 | 56 (8.6%) | 47 (17.2%) |
| $75,000 to $99,999 | 32 (4.9%) | 18 (6.6%) |
| $100,000 to $149,999 | 201 (30.9%) | 19 (7.0%) |
| $150,000 or more | 159 (24.5%) | 8 (2.9%) |
| Total | 650 (100.0%) | 273 (100.0%) |
Monthly Housing Cost Tiers in Bear Creek
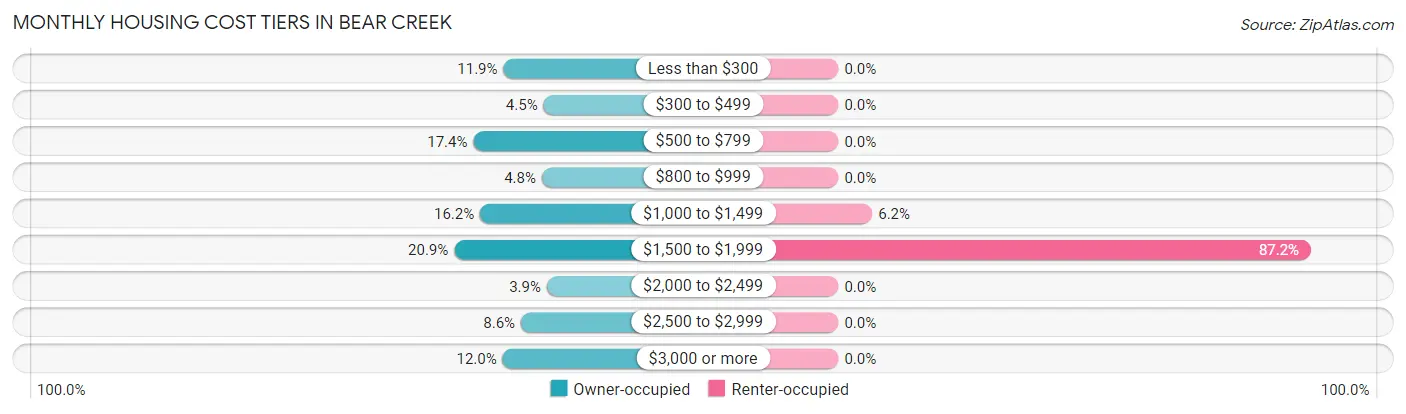
| Monthly Cost | Owner-occupied | Renter-occupied |
| Less than $300 | 77 (11.8%) | 0 (0.0%) |
| $300 to $499 | 29 (4.5%) | 0 (0.0%) |
| $500 to $799 | 113 (17.4%) | 0 (0.0%) |
| $800 to $999 | 31 (4.8%) | 0 (0.0%) |
| $1,000 to $1,499 | 105 (16.2%) | 17 (6.2%) |
| $1,500 to $1,999 | 136 (20.9%) | 238 (87.2%) |
| $2,000 to $2,499 | 25 (3.8%) | 0 (0.0%) |
| $2,500 to $2,999 | 56 (8.6%) | 0 (0.0%) |
| $3,000 or more | 78 (12.0%) | 0 (0.0%) |
| Total | 650 (100.0%) | 273 (100.0%) |
Physical Housing Characteristics in Bear Creek
Housing Structures in Bear Creek
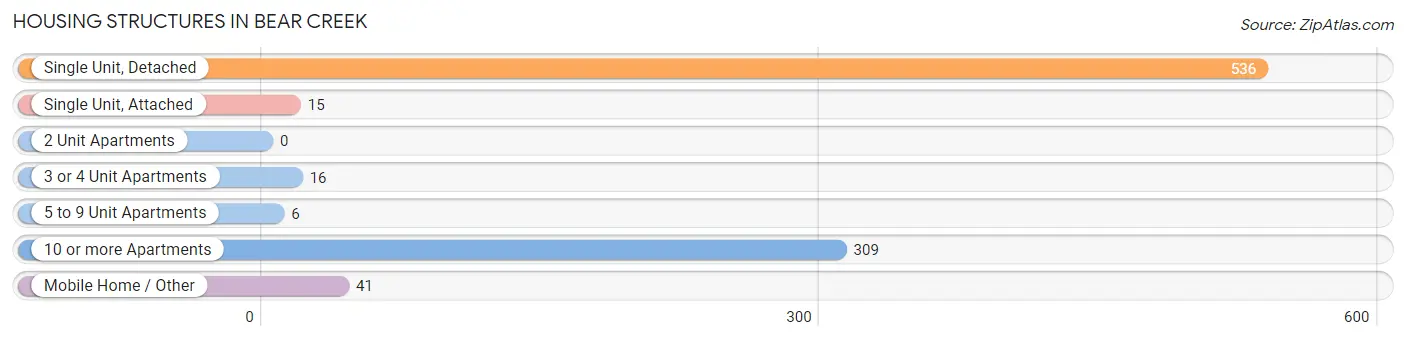
| Structure Type | # Housing Units | % Housing Units |
| Single Unit, Detached | 536 | 58.1% |
| Single Unit, Attached | 15 | 1.6% |
| 2 Unit Apartments | 0 | 0.0% |
| 3 or 4 Unit Apartments | 16 | 1.7% |
| 5 to 9 Unit Apartments | 6 | 0.6% |
| 10 or more Apartments | 309 | 33.5% |
| Mobile Home / Other | 41 | 4.4% |
| Total | 923 | 100.0% |
Housing Structures by Occupancy in Bear Creek
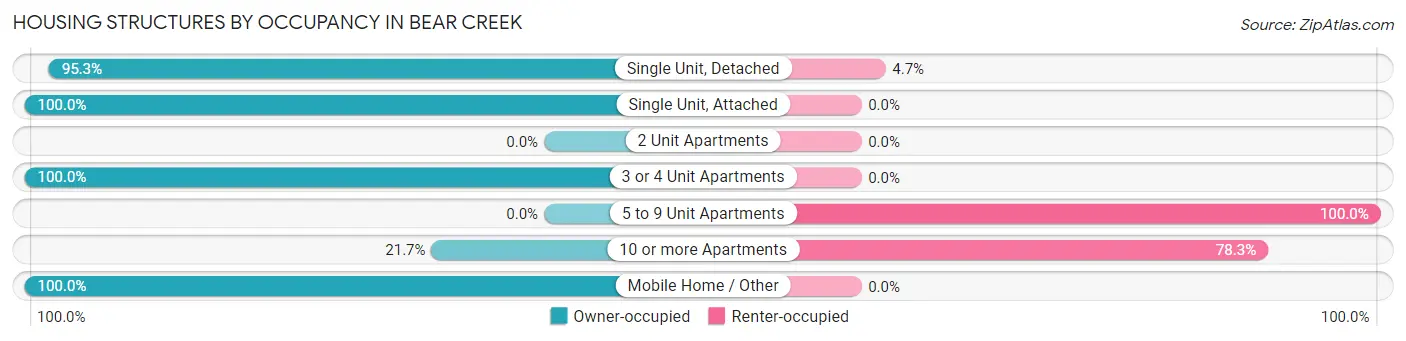
| Structure Type | Owner-occupied | Renter-occupied |
| Single Unit, Detached | 511 (95.3%) | 25 (4.7%) |
| Single Unit, Attached | 15 (100.0%) | 0 (0.0%) |
| 2 Unit Apartments | 0 (0.0%) | 0 (0.0%) |
| 3 or 4 Unit Apartments | 16 (100.0%) | 0 (0.0%) |
| 5 to 9 Unit Apartments | 0 (0.0%) | 6 (100.0%) |
| 10 or more Apartments | 67 (21.7%) | 242 (78.3%) |
| Mobile Home / Other | 41 (100.0%) | 0 (0.0%) |
| Total | 650 (70.4%) | 273 (29.6%) |
Housing Structures by Number of Rooms in Bear Creek
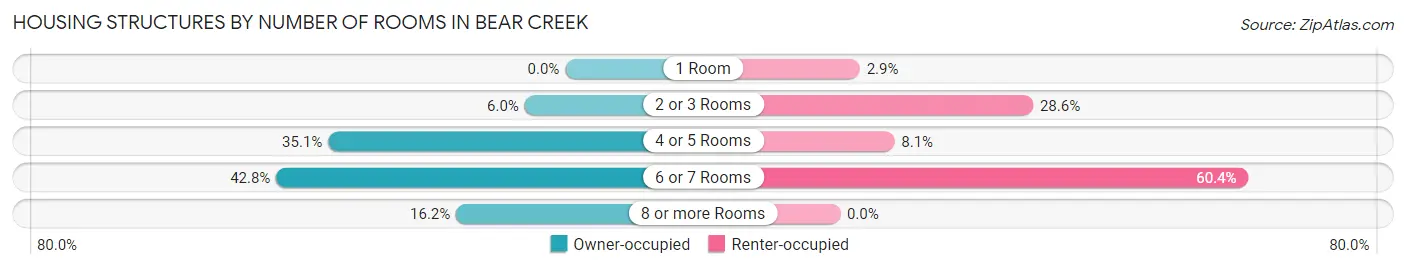
| Number of Rooms | Owner-occupied | Renter-occupied |
| 1 Room | 0 (0.0%) | 8 (2.9%) |
| 2 or 3 Rooms | 39 (6.0%) | 78 (28.6%) |
| 4 or 5 Rooms | 228 (35.1%) | 22 (8.1%) |
| 6 or 7 Rooms | 278 (42.8%) | 165 (60.4%) |
| 8 or more Rooms | 105 (16.2%) | 0 (0.0%) |
| Total | 650 (100.0%) | 273 (100.0%) |
Housing Structure by Heating Type in Bear Creek
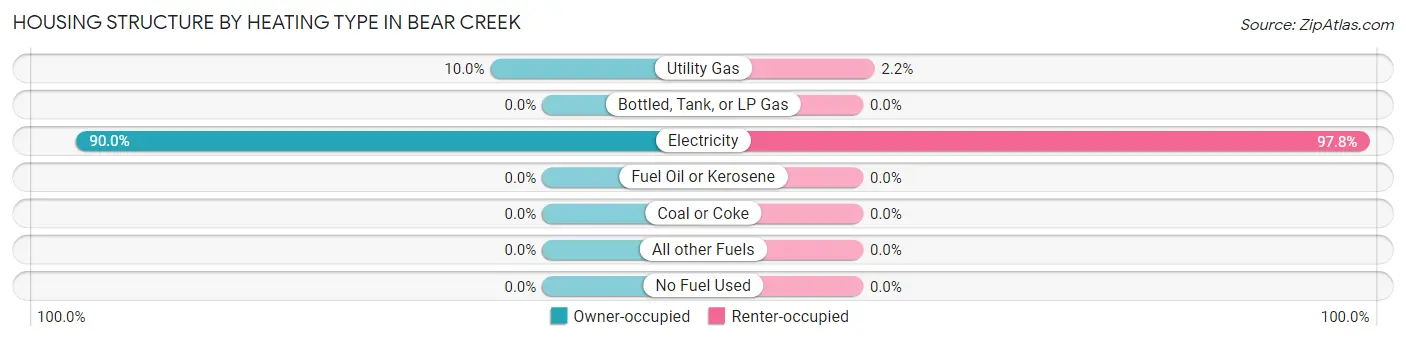
| Heating Type | Owner-occupied | Renter-occupied |
| Utility Gas | 65 (10.0%) | 6 (2.2%) |
| Bottled, Tank, or LP Gas | 0 (0.0%) | 0 (0.0%) |
| Electricity | 585 (90.0%) | 267 (97.8%) |
| Fuel Oil or Kerosene | 0 (0.0%) | 0 (0.0%) |
| Coal or Coke | 0 (0.0%) | 0 (0.0%) |
| All other Fuels | 0 (0.0%) | 0 (0.0%) |
| No Fuel Used | 0 (0.0%) | 0 (0.0%) |
| Total | 650 (100.0%) | 273 (100.0%) |
Household Vehicle Usage in Bear Creek
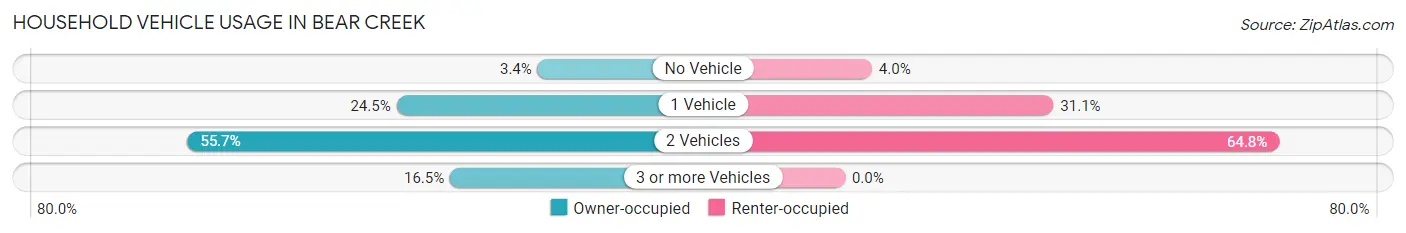
| Vehicles per Household | Owner-occupied | Renter-occupied |
| No Vehicle | 22 (3.4%) | 11 (4.0%) |
| 1 Vehicle | 159 (24.5%) | 85 (31.1%) |
| 2 Vehicles | 362 (55.7%) | 177 (64.8%) |
| 3 or more Vehicles | 107 (16.5%) | 0 (0.0%) |
| Total | 650 (100.0%) | 273 (100.0%) |
Real Estate & Mortgages in Bear Creek
Real Estate and Mortgage Overview in Bear Creek
| Characteristic | Without Mortgage | With Mortgage |
| Housing Units | 357 | 293 |
| Median Property Value | $384,900 | $359,400 |
| Median Household Income | $95,781 | $104 |
| Monthly Housing Costs | $665 | $78 |
| Real Estate Taxes | $2,478 | $0 |
Property Value by Mortgage Status in Bear Creek
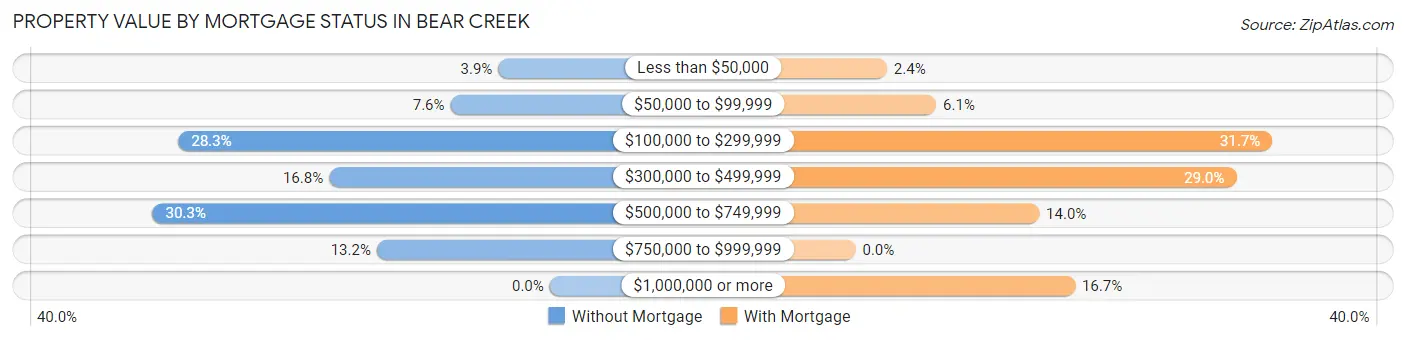
| Property Value | Without Mortgage | With Mortgage |
| Less than $50,000 | 14 (3.9%) | 7 (2.4%) |
| $50,000 to $99,999 | 27 (7.6%) | 18 (6.1%) |
| $100,000 to $299,999 | 101 (28.3%) | 93 (31.7%) |
| $300,000 to $499,999 | 60 (16.8%) | 85 (29.0%) |
| $500,000 to $749,999 | 108 (30.2%) | 41 (14.0%) |
| $750,000 to $999,999 | 47 (13.2%) | 0 (0.0%) |
| $1,000,000 or more | 0 (0.0%) | 49 (16.7%) |
| Total | 357 (100.0%) | 293 (100.0%) |
Household Income by Mortgage Status in Bear Creek
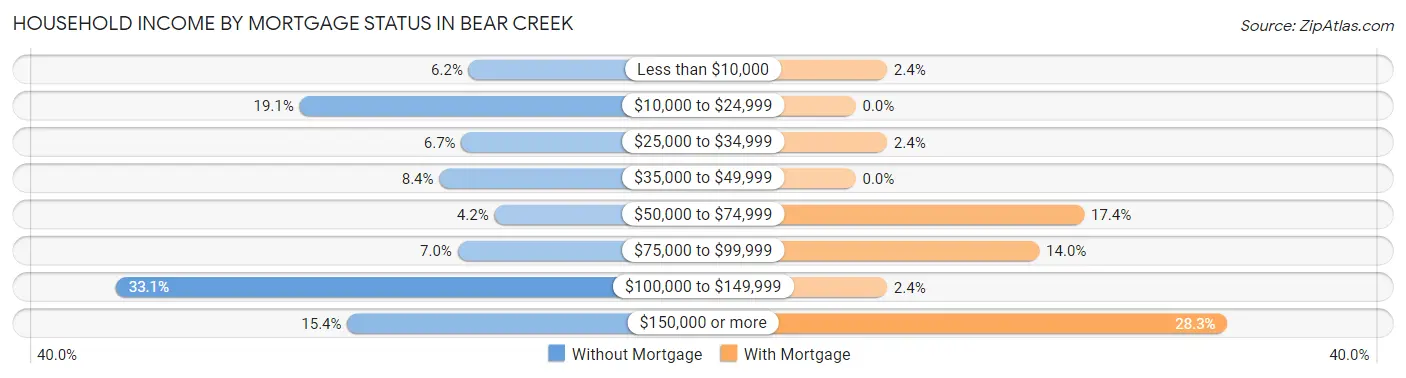
| Household Income | Without Mortgage | With Mortgage |
| Less than $10,000 | 22 (6.2%) | 7 (2.4%) |
| $10,000 to $24,999 | 68 (19.1%) | 0 (0.0%) |
| $25,000 to $34,999 | 24 (6.7%) | 7 (2.4%) |
| $35,000 to $49,999 | 30 (8.4%) | 0 (0.0%) |
| $50,000 to $74,999 | 15 (4.2%) | 51 (17.4%) |
| $75,000 to $99,999 | 25 (7.0%) | 41 (14.0%) |
| $100,000 to $149,999 | 118 (33.1%) | 7 (2.4%) |
| $150,000 or more | 55 (15.4%) | 83 (28.3%) |
| Total | 357 (100.0%) | 293 (100.0%) |
Property Value to Household Income Ratio in Bear Creek
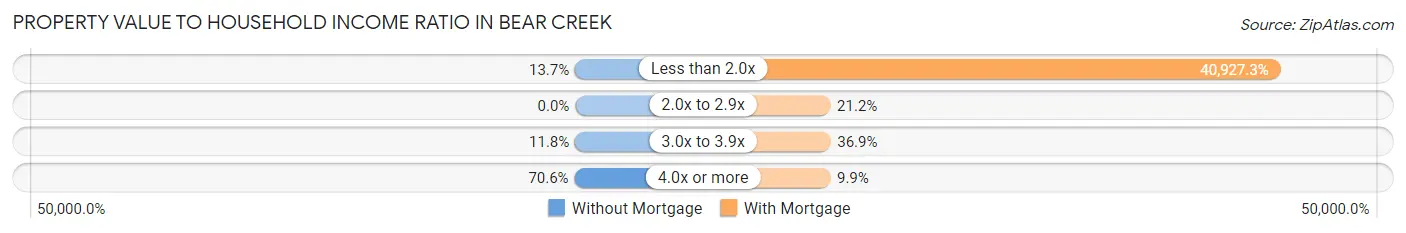
| Value-to-Income Ratio | Without Mortgage | With Mortgage |
| Less than 2.0x | 49 (13.7%) | 119,917 (40,927.3%) |
| 2.0x to 2.9x | 0 (0.0%) | 62 (21.2%) |
| 3.0x to 3.9x | 42 (11.8%) | 108 (36.9%) |
| 4.0x or more | 252 (70.6%) | 29 (9.9%) |
| Total | 357 (100.0%) | 293 (100.0%) |
Real Estate Taxes by Mortgage Status in Bear Creek
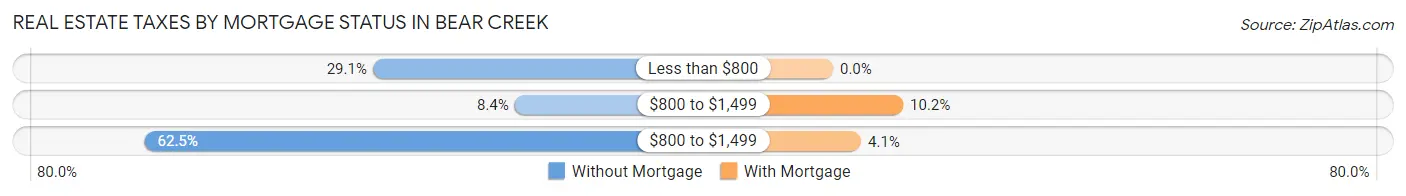
| Property Taxes | Without Mortgage | With Mortgage |
| Less than $800 | 104 (29.1%) | 0 (0.0%) |
| $800 to $1,499 | 30 (8.4%) | 30 (10.2%) |
| $800 to $1,499 | 223 (62.5%) | 12 (4.1%) |
| Total | 357 (100.0%) | 293 (100.0%) |
Health & Disability in Bear Creek
Health Insurance Coverage by Age in Bear Creek
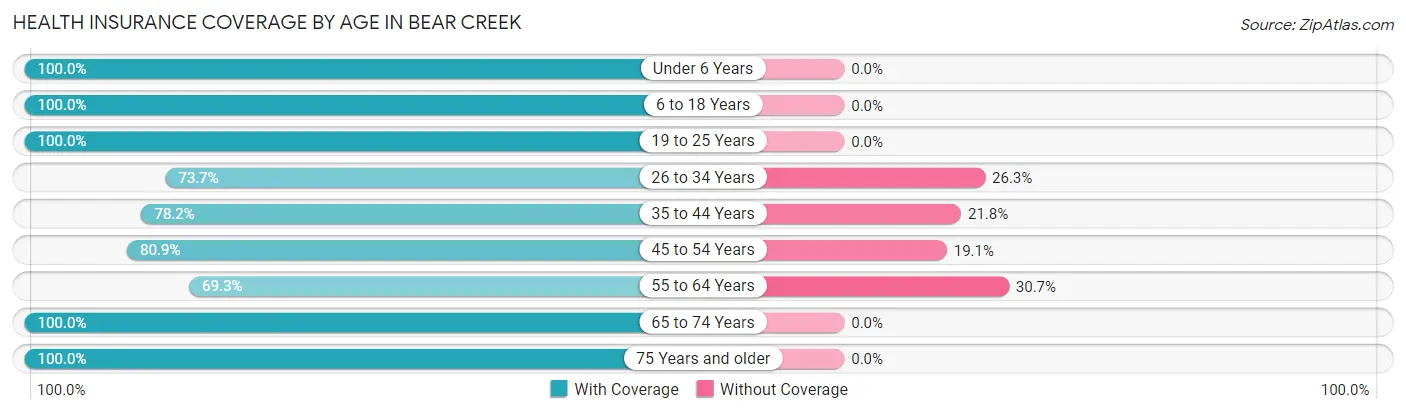
| Age Bracket | With Coverage | Without Coverage |
| Under 6 Years | 63 (100.0%) | 0 (0.0%) |
| 6 to 18 Years | 74 (100.0%) | 0 (0.0%) |
| 19 to 25 Years | 214 (100.0%) | 0 (0.0%) |
| 26 to 34 Years | 132 (73.7%) | 47 (26.3%) |
| 35 to 44 Years | 255 (78.2%) | 71 (21.8%) |
| 45 to 54 Years | 199 (80.9%) | 47 (19.1%) |
| 55 to 64 Years | 323 (69.3%) | 143 (30.7%) |
| 65 to 74 Years | 222 (100.0%) | 0 (0.0%) |
| 75 Years and older | 223 (100.0%) | 0 (0.0%) |
| Total | 1,705 (84.7%) | 308 (15.3%) |
Health Insurance Coverage by Citizenship Status in Bear Creek
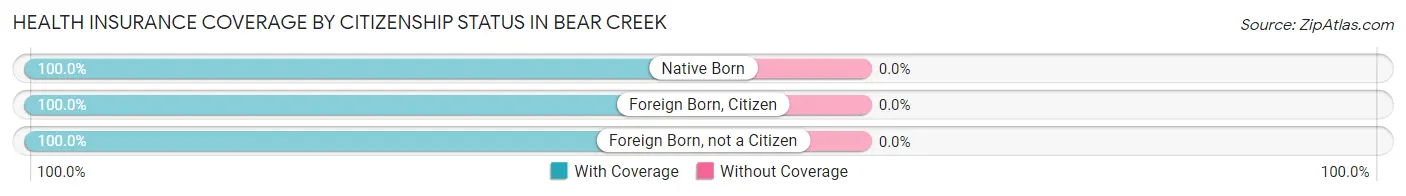
| Citizenship Status | With Coverage | Without Coverage |
| Native Born | 63 (100.0%) | 0 (0.0%) |
| Foreign Born, Citizen | 74 (100.0%) | 0 (0.0%) |
| Foreign Born, not a Citizen | 214 (100.0%) | 0 (0.0%) |
Health Insurance Coverage by Household Income in Bear Creek
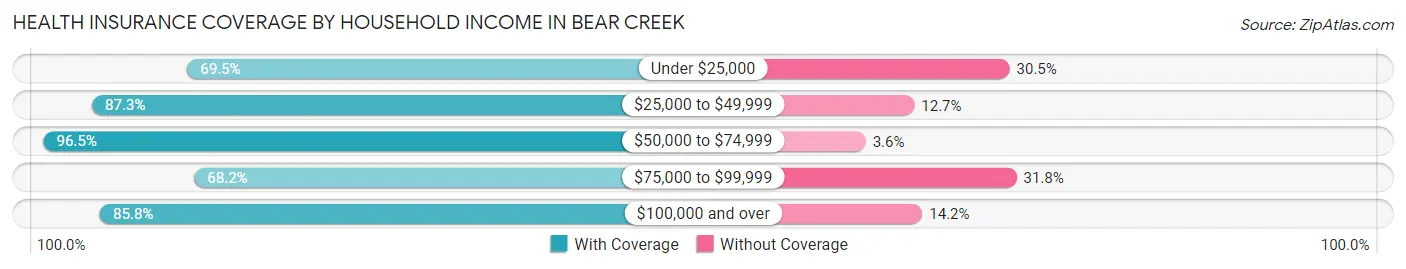
| Household Income | With Coverage | Without Coverage |
| Under $25,000 | 98 (69.5%) | 43 (30.5%) |
| $25,000 to $49,999 | 545 (87.3%) | 79 (12.7%) |
| $50,000 to $74,999 | 163 (96.5%) | 6 (3.5%) |
| $75,000 to $99,999 | 105 (68.2%) | 49 (31.8%) |
| $100,000 and over | 794 (85.8%) | 131 (14.2%) |
Public vs Private Health Insurance Coverage by Age in Bear Creek
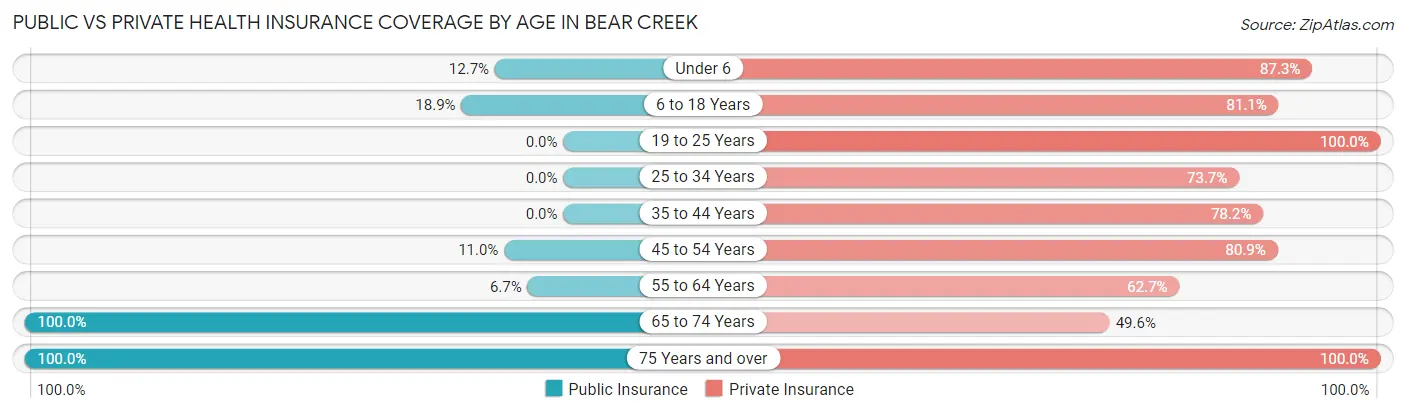
| Age Bracket | Public Insurance | Private Insurance |
| Under 6 | 8 (12.7%) | 55 (87.3%) |
| 6 to 18 Years | 14 (18.9%) | 60 (81.1%) |
| 19 to 25 Years | 0 (0.0%) | 214 (100.0%) |
| 25 to 34 Years | 0 (0.0%) | 132 (73.7%) |
| 35 to 44 Years | 0 (0.0%) | 255 (78.2%) |
| 45 to 54 Years | 27 (11.0%) | 199 (80.9%) |
| 55 to 64 Years | 31 (6.7%) | 292 (62.7%) |
| 65 to 74 Years | 222 (100.0%) | 110 (49.5%) |
| 75 Years and over | 223 (100.0%) | 223 (100.0%) |
| Total | 525 (26.1%) | 1,540 (76.5%) |
Disability Status by Sex by Age in Bear Creek
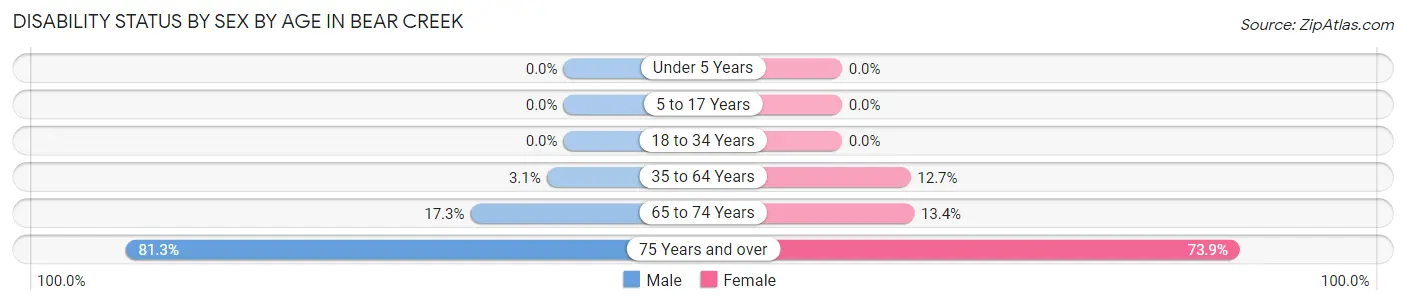
| Age Bracket | Male | Female |
| Under 5 Years | 0 (0.0%) | 0 (0.0%) |
| 5 to 17 Years | 0 (0.0%) | 0 (0.0%) |
| 18 to 34 Years | 0 (0.0%) | 0 (0.0%) |
| 35 to 64 Years | 14 (3.1%) | 75 (12.7%) |
| 65 to 74 Years | 19 (17.3%) | 15 (13.4%) |
| 75 Years and over | 91 (81.2%) | 82 (73.9%) |
Disability Class by Sex by Age in Bear Creek
Disability Class: Hearing Difficulty
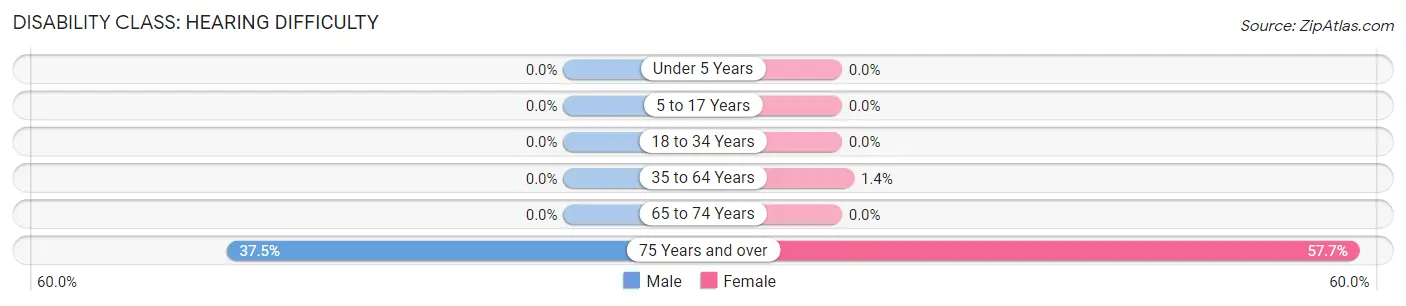
| Age Bracket | Male | Female |
| Under 5 Years | 0 (0.0%) | 0 (0.0%) |
| 5 to 17 Years | 0 (0.0%) | 0 (0.0%) |
| 18 to 34 Years | 0 (0.0%) | 0 (0.0%) |
| 35 to 64 Years | 0 (0.0%) | 8 (1.4%) |
| 65 to 74 Years | 0 (0.0%) | 0 (0.0%) |
| 75 Years and over | 42 (37.5%) | 64 (57.7%) |
Disability Class: Vision Difficulty
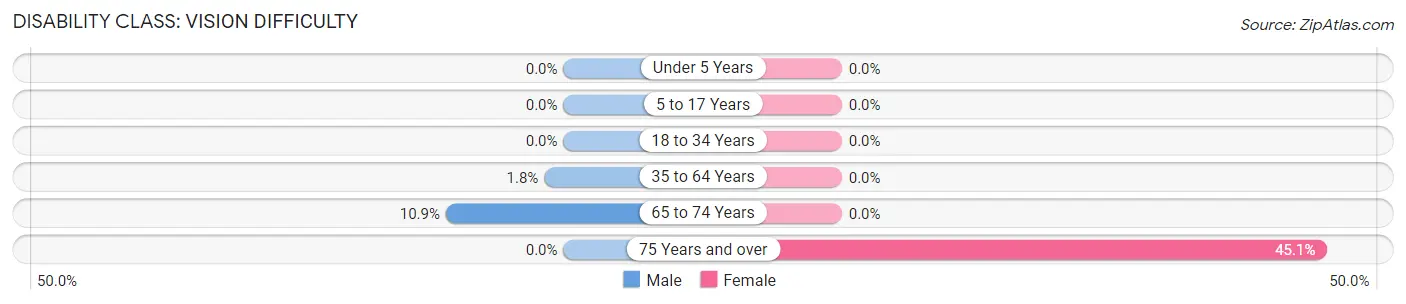
| Age Bracket | Male | Female |
| Under 5 Years | 0 (0.0%) | 0 (0.0%) |
| 5 to 17 Years | 0 (0.0%) | 0 (0.0%) |
| 18 to 34 Years | 0 (0.0%) | 0 (0.0%) |
| 35 to 64 Years | 8 (1.8%) | 0 (0.0%) |
| 65 to 74 Years | 12 (10.9%) | 0 (0.0%) |
| 75 Years and over | 0 (0.0%) | 50 (45.1%) |
Disability Class: Cognitive Difficulty
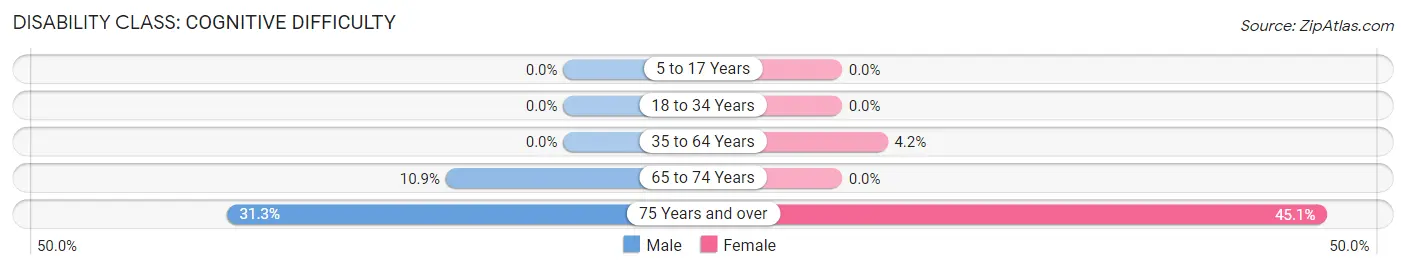
| Age Bracket | Male | Female |
| 5 to 17 Years | 0 (0.0%) | 0 (0.0%) |
| 18 to 34 Years | 0 (0.0%) | 0 (0.0%) |
| 35 to 64 Years | 0 (0.0%) | 25 (4.2%) |
| 65 to 74 Years | 12 (10.9%) | 0 (0.0%) |
| 75 Years and over | 35 (31.2%) | 50 (45.1%) |
Disability Class: Ambulatory Difficulty
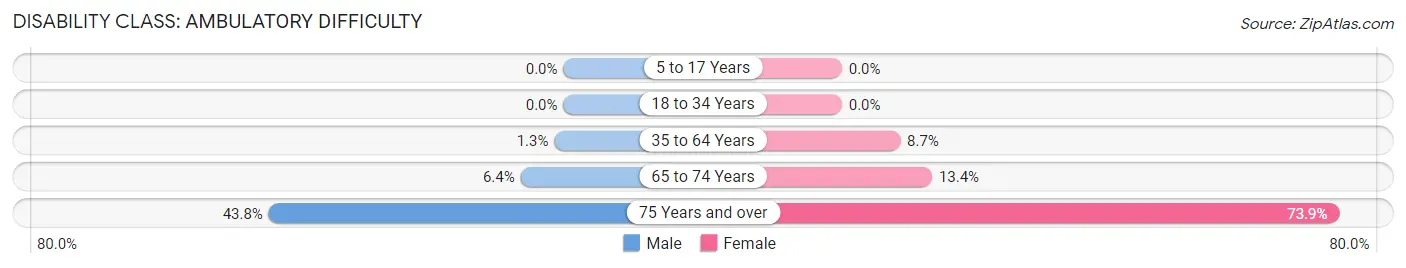
| Age Bracket | Male | Female |
| 5 to 17 Years | 0 (0.0%) | 0 (0.0%) |
| 18 to 34 Years | 0 (0.0%) | 0 (0.0%) |
| 35 to 64 Years | 6 (1.3%) | 51 (8.7%) |
| 65 to 74 Years | 7 (6.4%) | 15 (13.4%) |
| 75 Years and over | 49 (43.8%) | 82 (73.9%) |
Disability Class: Self-Care Difficulty
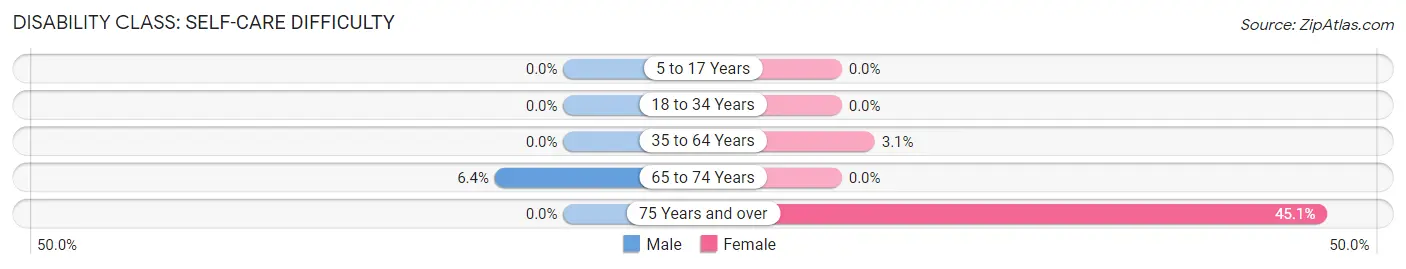
| Age Bracket | Male | Female |
| 5 to 17 Years | 0 (0.0%) | 0 (0.0%) |
| 18 to 34 Years | 0 (0.0%) | 0 (0.0%) |
| 35 to 64 Years | 0 (0.0%) | 18 (3.1%) |
| 65 to 74 Years | 7 (6.4%) | 0 (0.0%) |
| 75 Years and over | 0 (0.0%) | 50 (45.1%) |
Technology Access in Bear Creek
Computing Device Access in Bear Creek
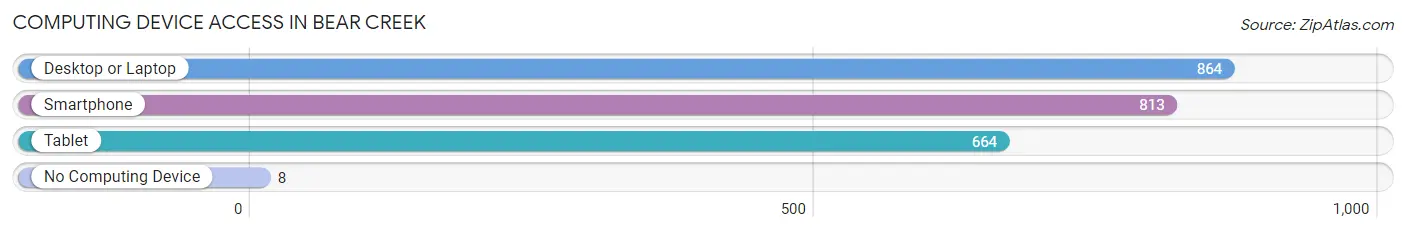
| Device Type | # Households | % Households |
| Desktop or Laptop | 864 | 93.6% |
| Smartphone | 813 | 88.1% |
| Tablet | 664 | 71.9% |
| No Computing Device | 8 | 0.9% |
| Total | 923 | 100.0% |
Internet Access in Bear Creek
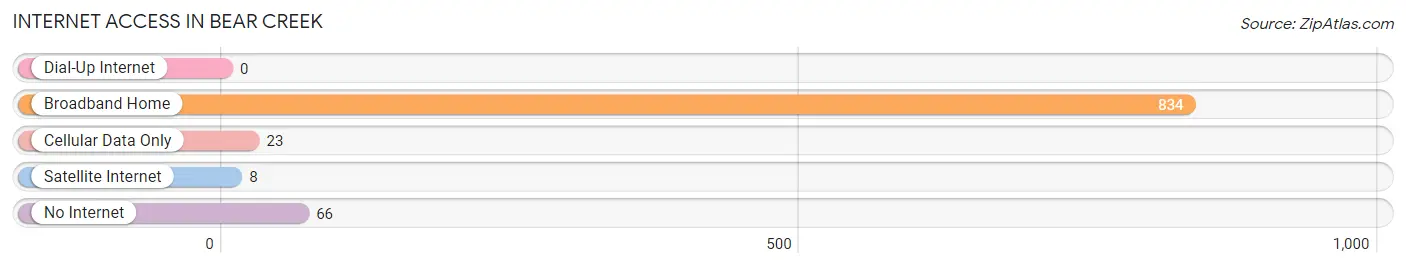
| Internet Type | # Households | % Households |
| Dial-Up Internet | 0 | 0.0% |
| Broadband Home | 834 | 90.4% |
| Cellular Data Only | 23 | 2.5% |
| Satellite Internet | 8 | 0.9% |
| No Internet | 66 | 7.1% |
| Total | 923 | 100.0% |
Bear Creek Summary
Introduction
Bear Creek is a small unincorporated community located in the northern part of Santa Rosa County, Florida. It is situated on the banks of the Blackwater River, approximately 20 miles north of Pensacola. The community is home to a population of approximately 1,000 people and is known for its rural charm and small-town atmosphere.
History
The area that is now known as Bear Creek was first settled in the early 1800s by a group of settlers from Georgia. The settlers were attracted to the area due to its abundance of natural resources, including timber, fish, and game. The settlers established a small community and named it Bear Creek after the nearby creek.
The community grew slowly over the years, and by the early 1900s, it had become a thriving agricultural center. The area was known for its production of cotton, corn, and other crops. The community also had a sawmill, a gristmill, and a general store.
In the early 1900s, the community was connected to the outside world by the Pensacola and Atlantic Railroad. This allowed the community to expand and grow, and by the mid-1900s, it had become a popular tourist destination.
Geography
Bear Creek is located in the northern part of Santa Rosa County, Florida. It is situated on the banks of the Blackwater River, approximately 20 miles north of Pensacola. The community is surrounded by rolling hills and lush forests. The area is known for its abundance of wildlife, including deer, turkey, and other game.
The climate in Bear Creek is mild and humid. The average temperature in the summer is around 80 degrees Fahrenheit, and the average temperature in the winter is around 60 degrees Fahrenheit. The area receives an average of 50 inches of rain per year.
Economy
The economy of Bear Creek is largely based on agriculture and tourism. The area is known for its production of cotton, corn, and other crops. The community also has a sawmill, a gristmill, and a general store.
Tourism is also an important part of the local economy. The area is known for its rural charm and small-town atmosphere, and it attracts visitors from all over the country. The community is home to several popular attractions, including the Bear Creek Wildlife Management Area and the Blackwater River State Park.
Demographics
As of the 2010 census, the population of Bear Creek was 1,000. The racial makeup of the community was 97.2% White, 0.7% African American, 0.3% Native American, 0.2% Asian, and 1.6% from other races. The median household income was $37,500, and the median age was 41.
Conclusion
Bear Creek is a small unincorporated community located in the northern part of Santa Rosa County, Florida. It is situated on the banks of the Blackwater River, approximately 20 miles north of Pensacola. The community is home to a population of approximately 1,000 people and is known for its rural charm and small-town atmosphere. The economy of Bear Creek is largely based on agriculture and tourism, and the area is known for its production of cotton, corn, and other crops. The community also has a sawmill, a gristmill, and a general store. The area is also known for its abundance of wildlife and its mild climate.
Common Questions
What is the Total Population of Bear Creek?
Total Population of Bear Creek is 2,066.
What is the Total Male Population of Bear Creek?
Total Male Population of Bear Creek is 842.
What is the Total Female Population of Bear Creek?
Total Female Population of Bear Creek is 1,224.
What is the Ratio of Males per 100 Females in Bear Creek?
There are 68.79 Males per 100 Females in Bear Creek.
What is the Ratio of Females per 100 Males in Bear Creek?
There are 145.37 Females per 100 Males in Bear Creek.
What is the Median Population Age in Bear Creek?
Median Population Age in Bear Creek is 53.2 Years.
What is the Average Family Size in Bear Creek
Average Family Size in Bear Creek is 2.8 People.
What is the Average Household Size in Bear Creek
Average Household Size in Bear Creek is 2.2 People.
What is Per Capita Income in Bear Creek?
Per Capita income in Bear Creek is $43,459.
What is the Median Family Income in Bear Creek?
Median Family Income in Bear Creek is $115,893.
What is the Median Household income in Bear Creek?
Median Household Income in Bear Creek is $70,298.
What is Income or Wage Gap in Bear Creek?
Income or Wage Gap in Bear Creek is 13.6%.
Women in Bear Creek earn 86.4 cents for every dollar earned by a man.
What is Inequality or Gini Index in Bear Creek?
Inequality or Gini Index in Bear Creek is 0.43.
How Large is the Labor Force in Bear Creek?
There are 1,003 People in the Labor Forcein in Bear Creek.
What is the Percentage of People in the Labor Force in Bear Creek?
50.6% of People are in the Labor Force in Bear Creek.
What is the Unemployment Rate in Bear Creek?
Unemployment Rate in Bear Creek is 3.8%.