Cities with the Highest Percentage of Population Employed in Architecture & Engineering in Arizona
RELATED REPORTS & OPTIONS
Architecture & Engineering
Arizona
Compare Cities
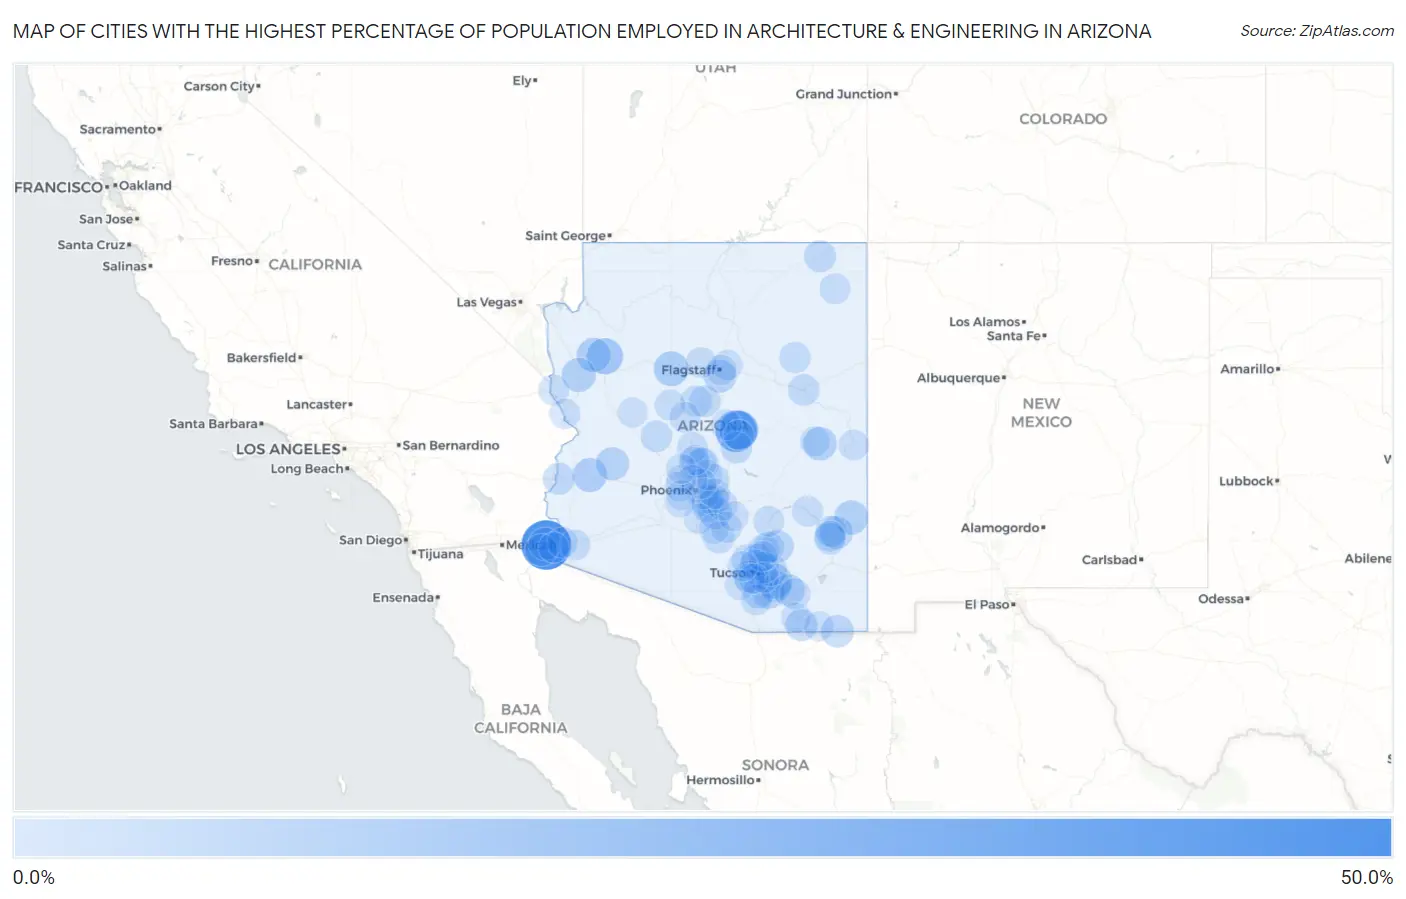
Map of Cities with the Highest Percentage of Population Employed in Architecture & Engineering in Arizona
0.0%
50.0%
Cities with the Highest Percentage of Population Employed in Architecture & Engineering in Arizona
| City | % Employed | vs State | vs National | |
| 1. | Drysdale | 47.4% | 2.4%(+45.0)#1 | 2.1%(+45.2)#29 |
| 2. | East Verde Estates | 27.8% | 2.4%(+25.4)#2 | 2.1%(+25.6)#68 |
| 3. | Freedom Acres | 21.2% | 2.4%(+18.8)#3 | 2.1%(+19.1)#120 |
| 4. | Valentine | 15.4% | 2.4%(+13.0)#4 | 2.1%(+13.2)#221 |
| 5. | Ash Fork | 12.0% | 2.4%(+9.61)#5 | 2.1%(+9.85)#350 |
| 6. | Rincon Valley | 11.9% | 2.4%(+9.47)#6 | 2.1%(+9.72)#362 |
| 7. | Brenda | 10.8% | 2.4%(+8.36)#7 | 2.1%(+8.60)#436 |
| 8. | Valle Vista | 10.6% | 2.4%(+8.19)#8 | 2.1%(+8.43)#447 |
| 9. | Morenci | 10.4% | 2.4%(+7.99)#9 | 2.1%(+8.23)#464 |
| 10. | Walnut Creek | 10.2% | 2.4%(+7.80)#10 | 2.1%(+8.05)#480 |
| 11. | Pinetop Country Club | 9.8% | 2.4%(+7.45)#11 | 2.1%(+7.69)#509 |
| 12. | San Jose | 8.5% | 2.4%(+6.12)#12 | 2.1%(+6.36)#640 |
| 13. | Wenden | 8.4% | 2.4%(+6.01)#13 | 2.1%(+6.25)#652 |
| 14. | Upper Santan Village | 7.7% | 2.4%(+5.35)#14 | 2.1%(+5.59)#763 |
| 15. | Mountainaire | 7.5% | 2.4%(+5.16)#15 | 2.1%(+5.40)#802 |
| 16. | Corona De Tucson | 7.4% | 2.4%(+5.00)#16 | 2.1%(+5.24)#829 |
| 17. | Pirtleville | 6.9% | 2.4%(+4.51)#17 | 2.1%(+4.75)#957 |
| 18. | San Manuel | 6.9% | 2.4%(+4.49)#18 | 2.1%(+4.74)#964 |
| 19. | Oro Valley | 6.7% | 2.4%(+4.33)#19 | 2.1%(+4.57)#995 |
| 20. | Chandler | 6.5% | 2.4%(+4.12)#20 | 2.1%(+4.37)#1,042 |
| 21. | Wall Lane | 6.5% | 2.4%(+4.09)#21 | 2.1%(+4.33)#1,053 |
| 22. | Vail | 6.4% | 2.4%(+4.03)#22 | 2.1%(+4.27)#1,076 |
| 23. | Gadsden | 6.2% | 2.4%(+3.82)#23 | 2.1%(+4.06)#1,157 |
| 24. | Sierra Vista Southeast | 6.0% | 2.4%(+3.66)#24 | 2.1%(+3.90)#1,213 |
| 25. | Mescal | 5.9% | 2.4%(+3.53)#25 | 2.1%(+3.77)#1,280 |
| 26. | Sahuarita | 5.7% | 2.4%(+3.30)#26 | 2.1%(+3.55)#1,398 |
| 27. | Dennehotso | 5.7% | 2.4%(+3.28)#27 | 2.1%(+3.52)#1,407 |
| 28. | Tanque Verde | 5.5% | 2.4%(+3.11)#28 | 2.1%(+3.35)#1,508 |
| 29. | Deer Creek | 5.3% | 2.4%(+2.87)#29 | 2.1%(+3.11)#1,658 |
| 30. | Ehrenberg | 5.2% | 2.4%(+2.84)#30 | 2.1%(+3.09)#1,673 |
| 31. | Arizona City | 5.1% | 2.4%(+2.75)#31 | 2.1%(+2.99)#1,743 |
| 32. | Marana | 5.1% | 2.4%(+2.72)#32 | 2.1%(+2.97)#1,754 |
| 33. | Saddlebrooke | 5.1% | 2.4%(+2.72)#33 | 2.1%(+2.96)#1,760 |
| 34. | Yarnell | 5.1% | 2.4%(+2.69)#34 | 2.1%(+2.94)#1,774 |
| 35. | Swift Trail Junction | 5.1% | 2.4%(+2.67)#35 | 2.1%(+2.92)#1,787 |
| 36. | Cornville | 4.9% | 2.4%(+2.51)#36 | 2.1%(+2.75)#1,901 |
| 37. | Sun Lakes | 4.8% | 2.4%(+2.43)#37 | 2.1%(+2.67)#1,969 |
| 38. | Catalina Foothills | 4.8% | 2.4%(+2.40)#38 | 2.1%(+2.64)#1,987 |
| 39. | Fountain Hills | 4.6% | 2.4%(+2.25)#39 | 2.1%(+2.49)#2,110 |
| 40. | Holbrook | 4.6% | 2.4%(+2.24)#40 | 2.1%(+2.48)#2,115 |
| 41. | Tucson Mountains | 4.6% | 2.4%(+2.22)#41 | 2.1%(+2.47)#2,129 |
| 42. | Tucson Estates | 4.6% | 2.4%(+2.16)#42 | 2.1%(+2.40)#2,178 |
| 43. | Clarkdale | 4.4% | 2.4%(+2.05)#43 | 2.1%(+2.29)#2,277 |
| 44. | Oracle | 4.4% | 2.4%(+1.98)#44 | 2.1%(+2.23)#2,339 |
| 45. | Safford | 4.3% | 2.4%(+1.87)#45 | 2.1%(+2.11)#2,447 |
| 46. | Dilkon | 4.2% | 2.4%(+1.78)#46 | 2.1%(+2.02)#2,560 |
| 47. | Carefree | 3.8% | 2.4%(+1.40)#47 | 2.1%(+1.64)#3,039 |
| 48. | Gilbert | 3.7% | 2.4%(+1.29)#48 | 2.1%(+1.53)#3,213 |
| 49. | Hayden | 3.6% | 2.4%(+1.21)#49 | 2.1%(+1.45)#3,347 |
| 50. | Benson | 3.5% | 2.4%(+1.13)#50 | 2.1%(+1.37)#3,499 |
| 51. | Coolidge | 3.5% | 2.4%(+1.10)#51 | 2.1%(+1.35)#3,542 |
| 52. | Many Farms | 3.5% | 2.4%(+1.09)#52 | 2.1%(+1.33)#3,566 |
| 53. | Bylas | 3.4% | 2.4%(+0.998)#53 | 2.1%(+1.24)#3,733 |
| 54. | Tempe | 3.2% | 2.4%(+0.848)#54 | 2.1%(+1.09)#4,016 |
| 55. | Cactus Flats | 3.2% | 2.4%(+0.783)#55 | 2.1%(+1.03)#4,160 |
| 56. | Casas Adobes | 3.1% | 2.4%(+0.752)#56 | 2.1%(+0.994)#4,236 |
| 57. | Queen Creek | 3.1% | 2.4%(+0.738)#57 | 2.1%(+0.980)#4,261 |
| 58. | Dewey Humboldt | 3.0% | 2.4%(+0.658)#58 | 2.1%(+0.900)#4,457 |
| 59. | Parks | 3.0% | 2.4%(+0.650)#59 | 2.1%(+0.893)#4,473 |
| 60. | Williamson | 3.0% | 2.4%(+0.634)#60 | 2.1%(+0.876)#4,527 |
| 61. | Black Canyon City | 3.0% | 2.4%(+0.597)#61 | 2.1%(+0.840)#4,609 |
| 62. | Mohave Valley | 3.0% | 2.4%(+0.587)#62 | 2.1%(+0.829)#4,639 |
| 63. | Green Valley | 2.9% | 2.4%(+0.543)#63 | 2.1%(+0.785)#4,747 |
| 64. | Valencia West | 2.9% | 2.4%(+0.535)#64 | 2.1%(+0.777)#4,776 |
| 65. | Wellton | 2.9% | 2.4%(+0.534)#65 | 2.1%(+0.777)#4,777 |
| 66. | Strawberry | 2.8% | 2.4%(+0.425)#66 | 2.1%(+0.668)#5,064 |
| 67. | Bellemont | 2.8% | 2.4%(+0.386)#67 | 2.1%(+0.629)#5,173 |
| 68. | Eagar | 2.7% | 2.4%(+0.306)#68 | 2.1%(+0.548)#5,440 |
| 69. | Doney Park | 2.7% | 2.4%(+0.274)#69 | 2.1%(+0.516)#5,536 |
| 70. | Mesa | 2.6% | 2.4%(+0.159)#70 | 2.1%(+0.402)#5,884 |
| 71. | Fortuna Foothills | 2.5% | 2.4%(+0.140)#71 | 2.1%(+0.382)#5,955 |
| 72. | Flagstaff | 2.5% | 2.4%(+0.097)#72 | 2.1%(+0.340)#6,070 |
| 73. | Desert Hills | 2.4% | 2.4%(+0.033)#73 | 2.1%(+0.275)#6,277 |
| 74. | Circle | 2.4% | 2.4%(+0.031)#74 | 2.1%(+0.273)#6,290 |
| 75. | Tucson | 2.4% | 2.4%(+0.002)#75 | 2.1%(+0.245)#6,404 |
| 76. | Anthem | 2.4% | 2.4%(-0.014)#76 | 2.1%(+0.228)#6,462 |
| 77. | Scottsdale | 2.2% | 2.4%(-0.215)#77 | 2.1%(+0.027)#7,228 |
| 78. | Yuma | 2.2% | 2.4%(-0.216)#78 | 2.1%(+0.027)#7,230 |
| 79. | Cave Creek | 2.1% | 2.4%(-0.253)#79 | 2.1%(-0.011)#7,373 |
| 80. | Paradise Valley | 2.1% | 2.4%(-0.281)#80 | 2.1%(-0.039)#7,474 |
| 81. | Maricopa | 2.1% | 2.4%(-0.326)#81 | 2.1%(-0.084)#7,674 |
| 82. | Catalina | 2.0% | 2.4%(-0.377)#82 | 2.1%(-0.134)#7,870 |
| 83. | Bagdad | 2.0% | 2.4%(-0.382)#83 | 2.1%(-0.140)#7,896 |
| 84. | Litchfield Park | 2.0% | 2.4%(-0.410)#84 | 2.1%(-0.168)#8,000 |
| 85. | Pinetop Lakeside | 2.0% | 2.4%(-0.439)#85 | 2.1%(-0.196)#8,098 |
| 86. | Three Points | 2.0% | 2.4%(-0.440)#86 | 2.1%(-0.198)#8,109 |
| 87. | Phoenix | 1.9% | 2.4%(-0.472)#87 | 2.1%(-0.230)#8,222 |
| 88. | Drexel Heights | 1.9% | 2.4%(-0.476)#88 | 2.1%(-0.234)#8,241 |
| 89. | Payson | 1.8% | 2.4%(-0.548)#89 | 2.1%(-0.306)#8,565 |
| 90. | Casa Grande | 1.8% | 2.4%(-0.561)#90 | 2.1%(-0.319)#8,621 |
| 91. | Picture Rocks | 1.8% | 2.4%(-0.564)#91 | 2.1%(-0.322)#8,632 |
| 92. | Sierra Vista | 1.8% | 2.4%(-0.577)#92 | 2.1%(-0.335)#8,690 |
| 93. | El Mirage | 1.8% | 2.4%(-0.592)#93 | 2.1%(-0.350)#8,761 |
| 94. | Red Lake | 1.8% | 2.4%(-0.631)#94 | 2.1%(-0.388)#8,934 |
| 95. | Bisbee | 1.7% | 2.4%(-0.646)#95 | 2.1%(-0.403)#9,006 |
| 96. | Avondale | 1.7% | 2.4%(-0.664)#96 | 2.1%(-0.422)#9,102 |
| 97. | Florence | 1.7% | 2.4%(-0.667)#97 | 2.1%(-0.425)#9,109 |
| 98. | Goodyear | 1.7% | 2.4%(-0.672)#98 | 2.1%(-0.430)#9,134 |
| 99. | New River | 1.7% | 2.4%(-0.676)#99 | 2.1%(-0.434)#9,151 |
| 100. | Peoria | 1.7% | 2.4%(-0.676)#100 | 2.1%(-0.434)#9,152 |
Common Questions
What are the Top 10 Cities with the Highest Percentage of Population Employed in Architecture & Engineering in Arizona?
Top 10 Cities with the Highest Percentage of Population Employed in Architecture & Engineering in Arizona are:
#1
47.4%
#2
27.8%
#3
21.2%
#4
15.4%
#5
12.0%
#6
11.9%
#7
10.8%
#8
10.6%
#9
10.4%
#10
10.2%
What city has the Highest Percentage of Population Employed in Architecture & Engineering in Arizona?
Drysdale has the Highest Percentage of Population Employed in Architecture & Engineering in Arizona with 47.4%.
What is the Percentage of Population Employed in Architecture & Engineering in the State of Arizona?
Percentage of Population Employed in Architecture & Engineering in Arizona is 2.4%.
What is the Percentage of Population Employed in Architecture & Engineering in the United States?
Percentage of Population Employed in Architecture & Engineering in the United States is 2.1%.