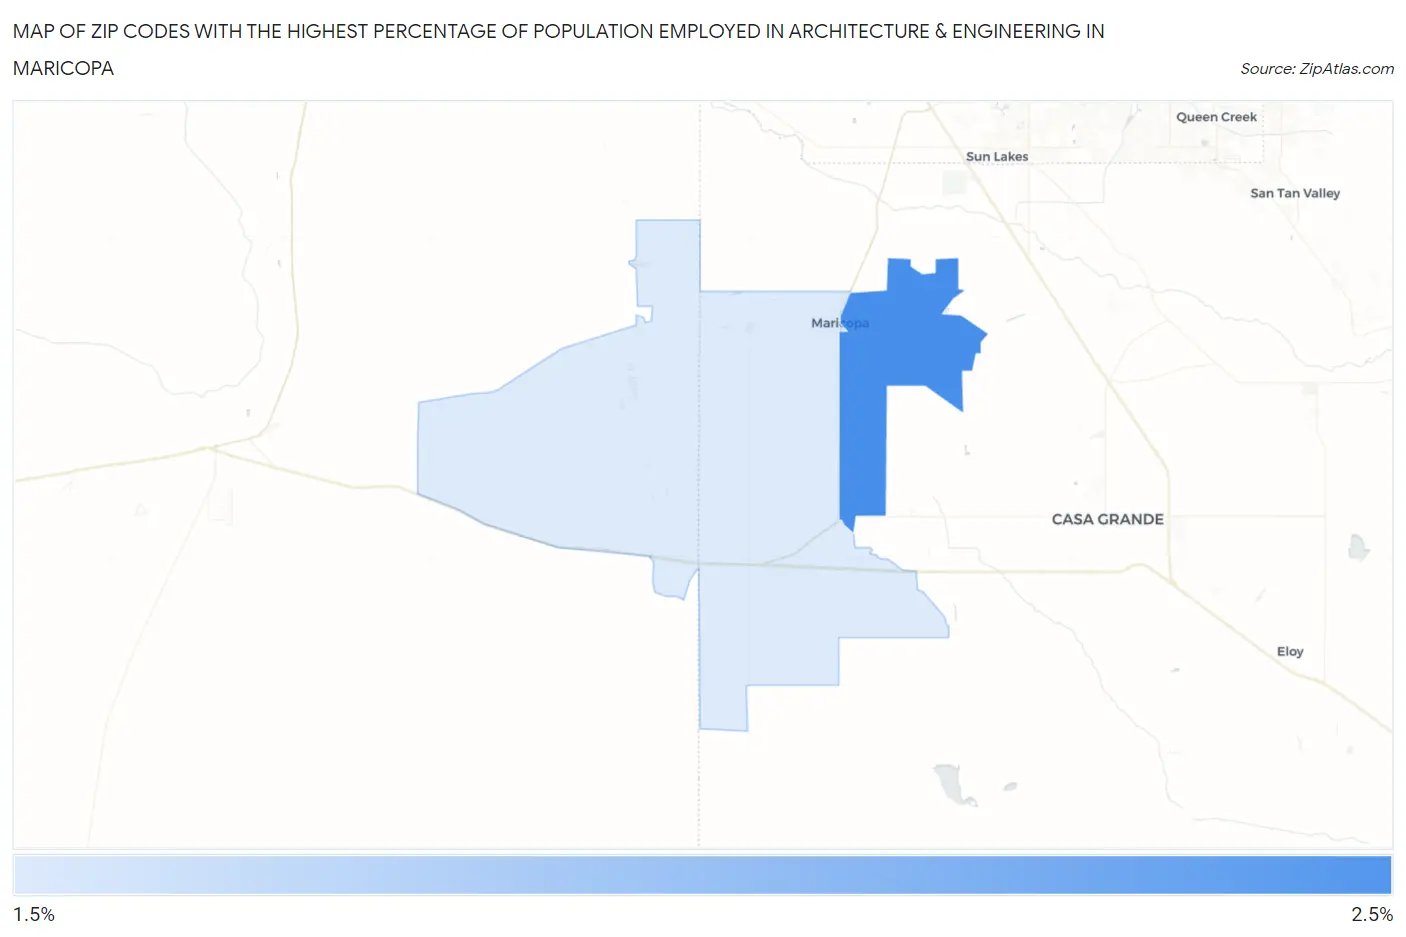
Zip Codes with the Highest Percentage of Population Employed in Architecture & Engineering in Maricopa, AZ
RELATED REPORTS & OPTIONS
Architecture & Engineering
Maricopa
Compare Zip Codes
Map of Zip Codes with the Highest Percentage of Population Employed in Architecture & Engineering in Maricopa
0.0%
2.5%
Zip Codes with the Highest Percentage of Population Employed in Architecture & Engineering in Maricopa, AZ
| Zip Code | % Employed | vs State | vs National | |
| 1. | 85138 | 2.2% | 2.4%(-0.210)#125 | 2.1%(+0.032)#8,589 |
| 2. | 85139 | 1.9% | 2.4%(-0.506)#147 | 2.1%(-0.264)#10,331 |
1
Common Questions
What are the Top Zip Codes with the Highest Percentage of Population Employed in Architecture & Engineering in Maricopa, AZ?
Top Zip Codes with the Highest Percentage of Population Employed in Architecture & Engineering in Maricopa, AZ are:
What zip code has the Highest Percentage of Population Employed in Architecture & Engineering in Maricopa, AZ?
85138 has the Highest Percentage of Population Employed in Architecture & Engineering in Maricopa, AZ with 2.2%.
What is the Percentage of Population Employed in Architecture & Engineering in Maricopa, AZ?
Percentage of Population Employed in Architecture & Engineering in Maricopa is 2.1%.
What is the Percentage of Population Employed in Architecture & Engineering in Arizona?
Percentage of Population Employed in Architecture & Engineering in Arizona is 2.4%.
What is the Percentage of Population Employed in Architecture & Engineering in the United States?
Percentage of Population Employed in Architecture & Engineering in the United States is 2.1%.