Morenci, AZ
Morenci Map
Morenci Overview
1,467
TOTAL POPULATION
766
MALE POPULATION
701
FEMALE POPULATION
109.27
MALES / 100 FEMALES
91.51
FEMALES / 100 MALES
31.2
MEDIAN AGE
3.5
AVG FAMILY SIZE
2.7
AVG HOUSEHOLD SIZE
$34,656
PER CAPITA INCOME
$95,000
AVG FAMILY INCOME
$83,144
AVG HOUSEHOLD INCOME
38.0%
WAGE / INCOME GAP [ % ]
62.0¢/ $1
WAGE / INCOME GAP [ $ ]
0.20
INEQUALITY / GINI INDEX
958
LABOR FORCE [ PEOPLE ]
83.2%
PERCENT IN LABOR FORCE
4.5%
UNEMPLOYMENT RATE
Morenci Zip Codes
Morenci Area Codes
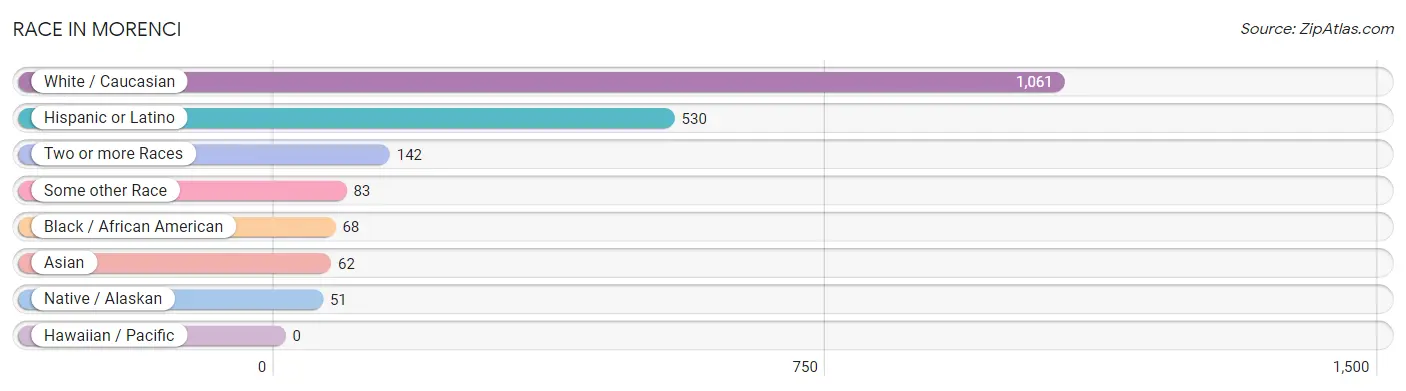
Race in Morenci
The most populous races in Morenci are White / Caucasian (1,061 | 72.3%), Hispanic or Latino (530 | 36.1%), and Two or more Races (142 | 9.7%).
| Race | # Population | % Population |
| Asian | 62 | 4.2% |
| Black / African American | 68 | 4.6% |
| Hawaiian / Pacific | 0 | 0.0% |
| Hispanic or Latino | 530 | 36.1% |
| Native / Alaskan | 51 | 3.5% |
| White / Caucasian | 1,061 | 72.3% |
| Two or more Races | 142 | 9.7% |
| Some other Race | 83 | 5.7% |
| Total | 1,467 | 100.0% |
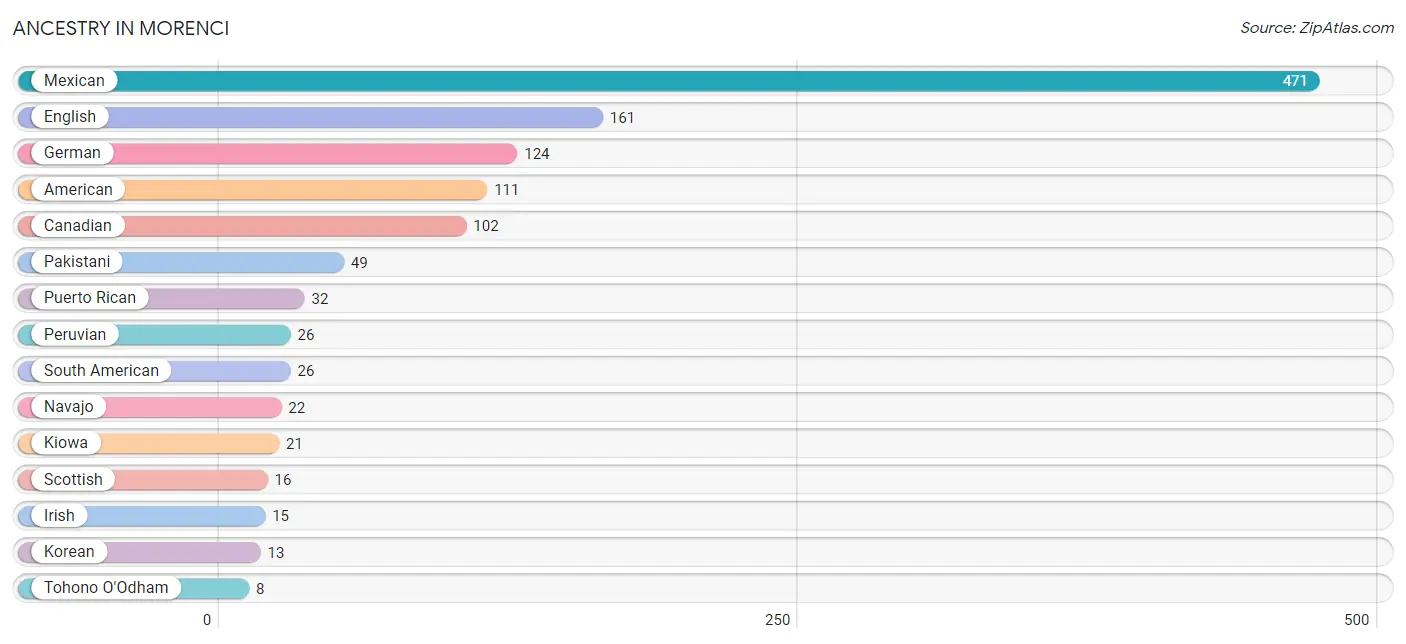
Ancestry in Morenci
The most populous ancestries reported in Morenci are Mexican (471 | 32.1%), English (161 | 11.0%), German (124 | 8.5%), American (111 | 7.6%), and Canadian (102 | 7.0%), together accounting for 66.0% of all Morenci residents.
| Ancestry | # Population | % Population |
| American | 111 | 7.6% |
| Canadian | 102 | 7.0% |
| English | 161 | 11.0% |
| French Canadian | 7 | 0.5% |
| German | 124 | 8.5% |
| Irish | 15 | 1.0% |
| Kiowa | 21 | 1.4% |
| Korean | 13 | 0.9% |
| Mexican | 471 | 32.1% |
| Navajo | 22 | 1.5% |
| Nigerian | 1 | 0.1% |
| Pakistani | 49 | 3.3% |
| Peruvian | 26 | 1.8% |
| Puerto Rican | 32 | 2.2% |
| Scottish | 16 | 1.1% |
| South American | 26 | 1.8% |
| Subsaharan African | 1 | 0.1% |
| Tohono O'Odham | 8 | 0.5% | View All 18 Rows |
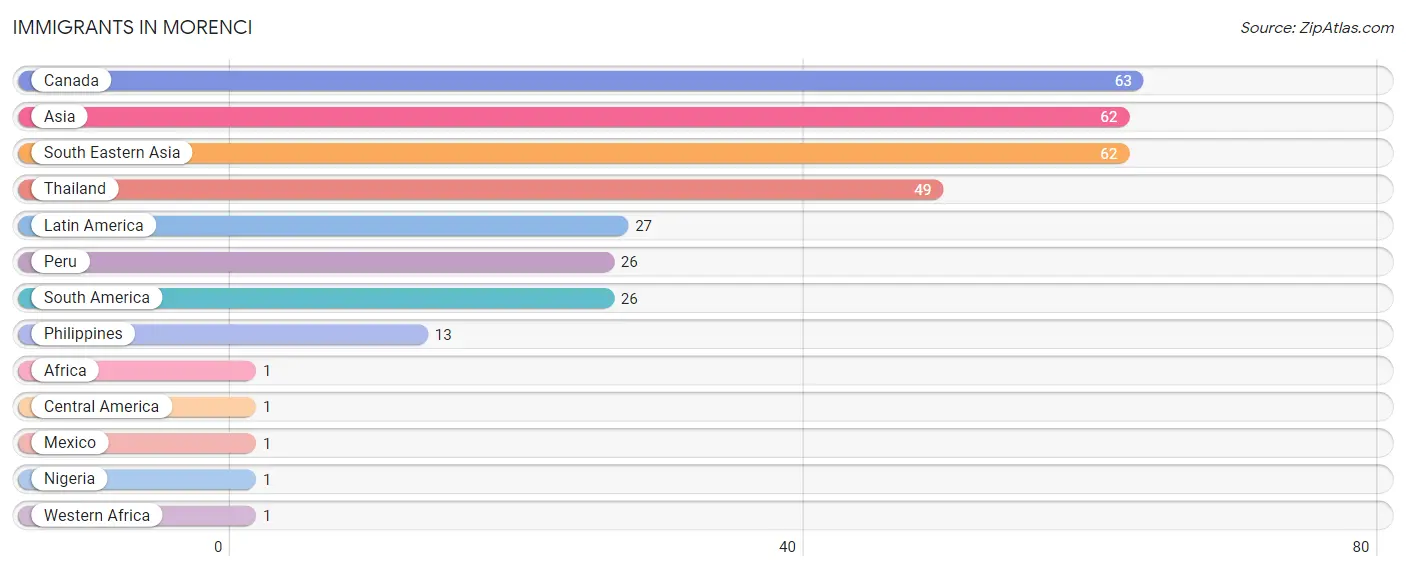
Immigrants in Morenci
The most numerous immigrant groups reported in Morenci came from Canada (63 | 4.3%), Asia (62 | 4.2%), South Eastern Asia (62 | 4.2%), Thailand (49 | 3.3%), and Latin America (27 | 1.8%), together accounting for 17.9% of all Morenci residents.
| Immigration Origin | # Population | % Population |
| Africa | 1 | 0.1% |
| Asia | 62 | 4.2% |
| Canada | 63 | 4.3% |
| Central America | 1 | 0.1% |
| Latin America | 27 | 1.8% |
| Mexico | 1 | 0.1% |
| Nigeria | 1 | 0.1% |
| Peru | 26 | 1.8% |
| Philippines | 13 | 0.9% |
| South America | 26 | 1.8% |
| South Eastern Asia | 62 | 4.2% |
| Thailand | 49 | 3.3% |
| Western Africa | 1 | 0.1% | View All 13 Rows |
Sex and Age in Morenci
Sex and Age in Morenci
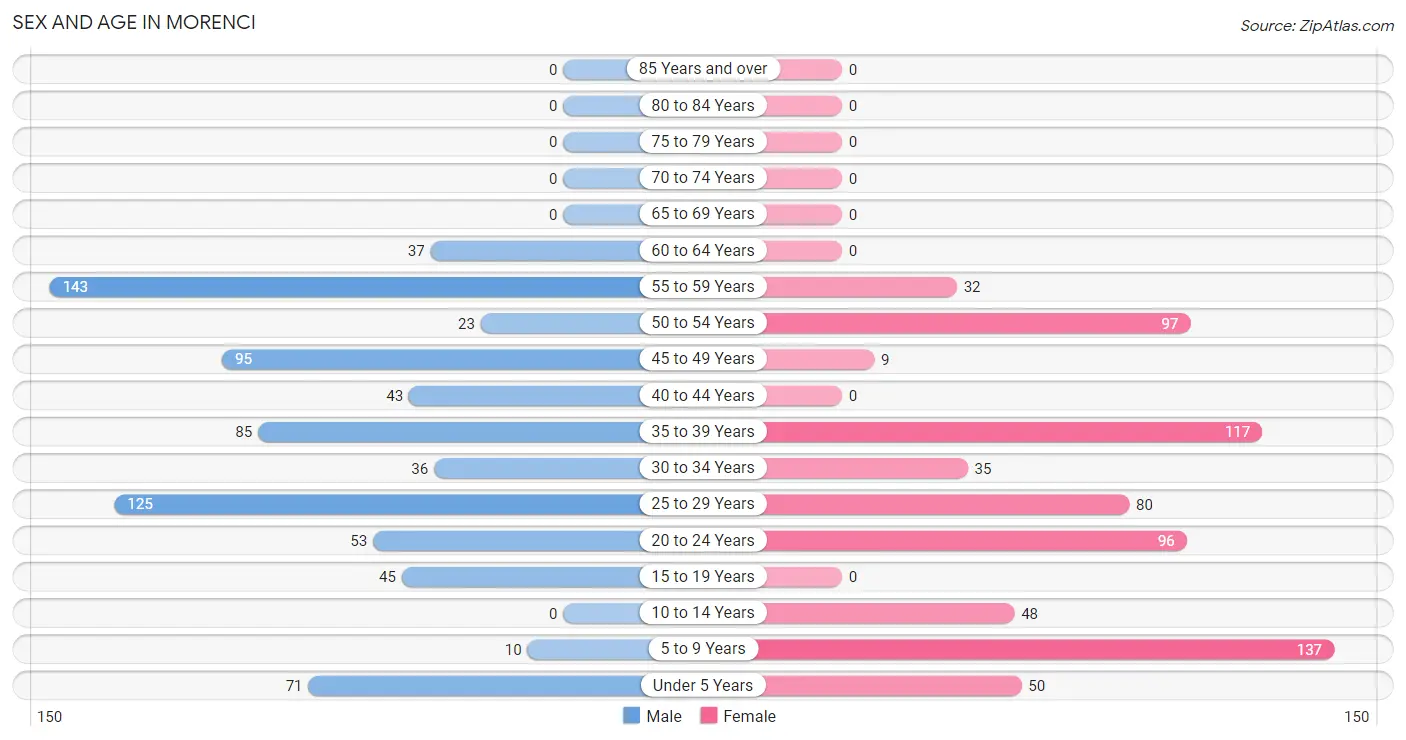
The most populous age groups in Morenci are 55 to 59 Years (143 | 18.7%) for men and 5 to 9 Years (137 | 19.5%) for women.
| Age Bracket | Male | Female |
| Under 5 Years | 71 (9.3%) | 50 (7.1%) |
| 5 to 9 Years | 10 (1.3%) | 137 (19.5%) |
| 10 to 14 Years | 0 (0.0%) | 48 (6.9%) |
| 15 to 19 Years | 45 (5.9%) | 0 (0.0%) |
| 20 to 24 Years | 53 (6.9%) | 96 (13.7%) |
| 25 to 29 Years | 125 (16.3%) | 80 (11.4%) |
| 30 to 34 Years | 36 (4.7%) | 35 (5.0%) |
| 35 to 39 Years | 85 (11.1%) | 117 (16.7%) |
| 40 to 44 Years | 43 (5.6%) | 0 (0.0%) |
| 45 to 49 Years | 95 (12.4%) | 9 (1.3%) |
| 50 to 54 Years | 23 (3.0%) | 97 (13.8%) |
| 55 to 59 Years | 143 (18.7%) | 32 (4.6%) |
| 60 to 64 Years | 37 (4.8%) | 0 (0.0%) |
| 65 to 69 Years | 0 (0.0%) | 0 (0.0%) |
| 70 to 74 Years | 0 (0.0%) | 0 (0.0%) |
| 75 to 79 Years | 0 (0.0%) | 0 (0.0%) |
| 80 to 84 Years | 0 (0.0%) | 0 (0.0%) |
| 85 Years and over | 0 (0.0%) | 0 (0.0%) |
| Total | 766 (100.0%) | 701 (100.0%) |
Families and Households in Morenci
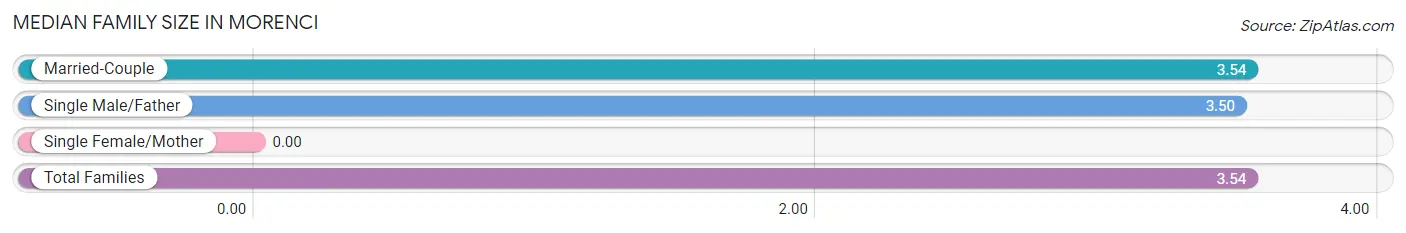
Median Family Size in Morenci
| Family Type | # Families | Family Size |
| Married-Couple | 270 (89.4%) | 3.54 |
| Single Male/Father | 32 (10.6%) | 3.50 |
| Single Female/Mother | 0 (0.0%) | - |
| Total Families | 302 (100.0%) | 3.54 |
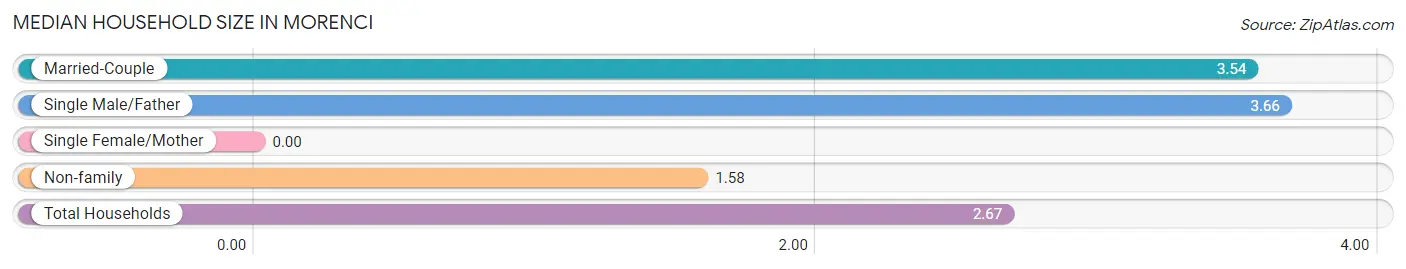
Median Household Size in Morenci
| Household Type | # Households | Household Size |
| Married-Couple | 270 (49.3%) | 3.54 |
| Single Male/Father | 32 (5.8%) | 3.66 |
| Single Female/Mother | 0 (0.0%) | - |
| Non-family | 246 (44.9%) | 1.58 |
| Total Households | 548 (100.0%) | 2.67 |
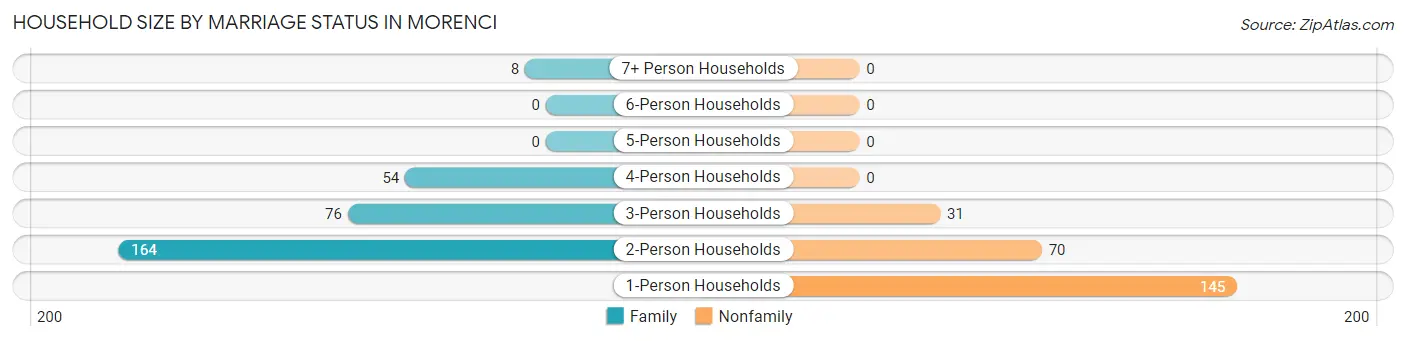
Household Size by Marriage Status in Morenci
Out of a total of 548 households in Morenci, 302 (55.1%) are family households, while 246 (44.9%) are nonfamily households. The most numerous type of family households are 2-person households, comprising 164, and the most common type of nonfamily households are 1-person households, comprising 145.
| Household Size | Family Households | Nonfamily Households |
| 1-Person Households | - | 145 (26.5%) |
| 2-Person Households | 164 (29.9%) | 70 (12.8%) |
| 3-Person Households | 76 (13.9%) | 31 (5.7%) |
| 4-Person Households | 54 (9.9%) | 0 (0.0%) |
| 5-Person Households | 0 (0.0%) | 0 (0.0%) |
| 6-Person Households | 0 (0.0%) | 0 (0.0%) |
| 7+ Person Households | 8 (1.5%) | 0 (0.0%) |
| Total | 302 (55.1%) | 246 (44.9%) |
Female Fertility in Morenci
Fertility by Age in Morenci
Average fertility rate in Morenci is 76.0 births per 1,000 women. Women in the age bracket of 20 to 34 years have the highest fertility rate with 133.0 births per 1,000 women. Women in the age bracket of 20 to 34 years acount for 100.0% of all women with births.
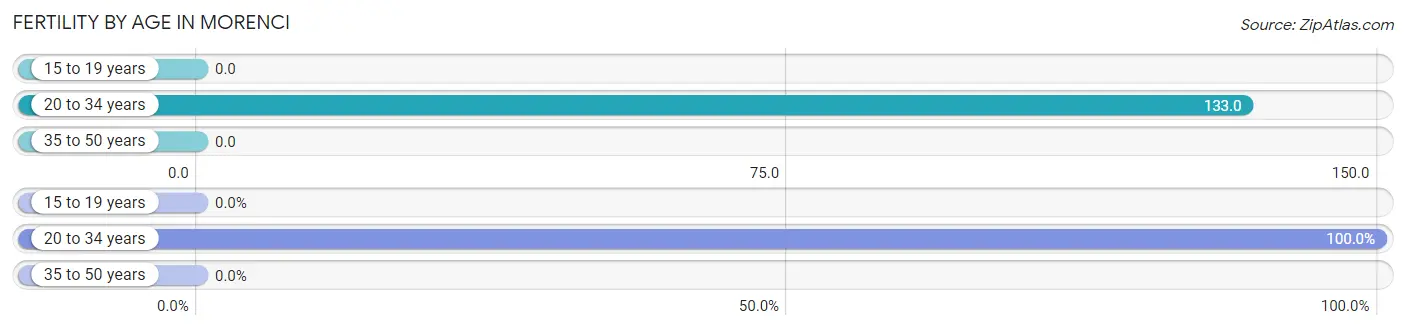
| Age Bracket | Women with Births | Births / 1,000 Women |
| 15 to 19 years | 0 (0.0%) | 0.0 |
| 20 to 34 years | 28 (100.0%) | 133.0 |
| 35 to 50 years | 0 (0.0%) | 0.0 |
| Total | 28 (100.0%) | 76.0 |
Fertility by Age by Marriage Status in Morenci
89.3% of women with births (28) in Morenci are married. The highest percentage of unmarried women with births falls into 20 to 34 years age bracket with 10.7% of them unmarried at the time of birth, while the lowest percentage of unmarried women with births belong to 20 to 34 years age bracket with 10.7% of them unmarried.
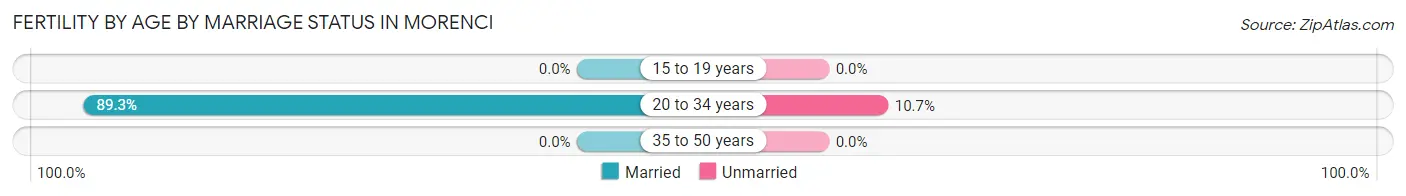
| Age Bracket | Married | Unmarried |
| 15 to 19 years | 0 (0.0%) | 0 (0.0%) |
| 20 to 34 years | 25 (89.3%) | 3 (10.7%) |
| 35 to 50 years | 0 (0.0%) | 0 (0.0%) |
| Total | 25 (89.3%) | 3 (10.7%) |
Fertility by Education in Morenci
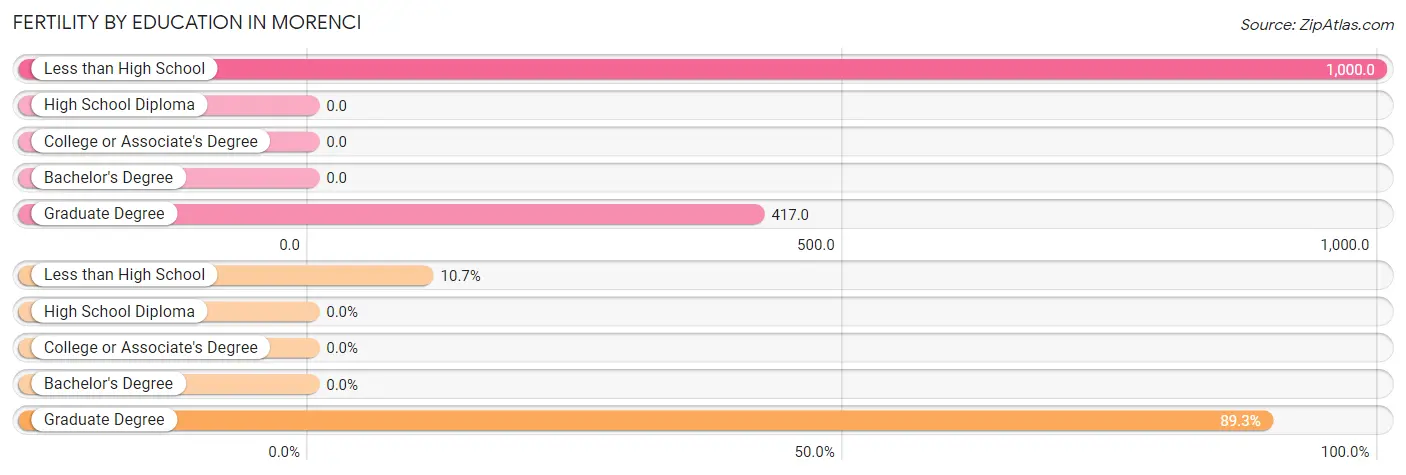
| Educational Attainment | Women with Births | Births / 1,000 Women |
| Less than High School | 3 (10.7%) | 1,000.0 |
| High School Diploma | 0 (0.0%) | 0.0 |
| College or Associate's Degree | 0 (0.0%) | 0.0 |
| Bachelor's Degree | 0 (0.0%) | 0.0 |
| Graduate Degree | 25 (89.3%) | 417.0 |
| Total | 28 (100.0%) | 76.0 |
Fertility by Education by Marriage Status in Morenci
10.7% of women with births in Morenci are unmarried. Women with the educational attainment of graduate degree are most likely to be married with 100.0% of them married at childbirth, while women with the educational attainment of less than high school are least likely to be married with 100.0% of them unmarried at childbirth.
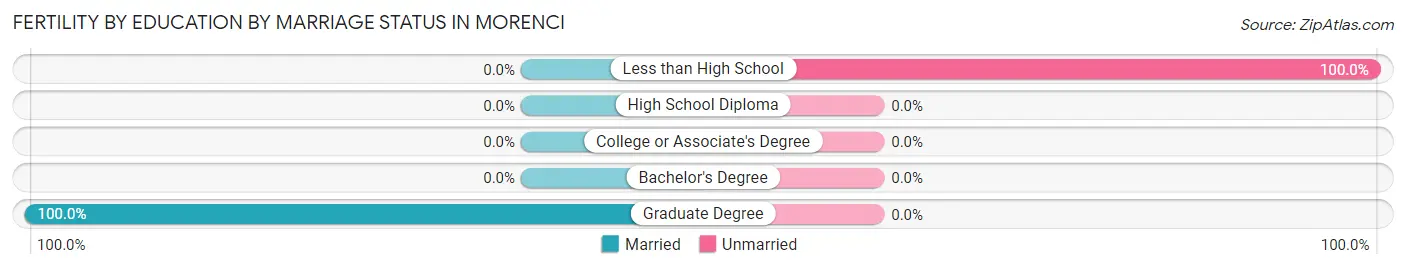
| Educational Attainment | Married | Unmarried |
| Less than High School | 0 (0.0%) | 3 (100.0%) |
| High School Diploma | 0 (0.0%) | 0 (0.0%) |
| College or Associate's Degree | 0 (0.0%) | 0 (0.0%) |
| Bachelor's Degree | 0 (0.0%) | 0 (0.0%) |
| Graduate Degree | 25 (100.0%) | 0 (0.0%) |
| Total | 25 (89.3%) | 3 (10.7%) |
Income in Morenci
Income Overview in Morenci
Per Capita Income in Morenci is $34,656, while median incomes of families and households are $95,000 and $83,144 respectively.
| Characteristic | Number | Measure |
| Per Capita Income | 1,467 | $34,656 |
| Median Family Income | 302 | $95,000 |
| Mean Family Income | 302 | $98,407 |
| Median Household Income | 548 | $83,144 |
| Mean Household Income | 548 | $88,327 |
| Income Deficit | 302 | $0 |
| Wage / Income Gap (%) | 1,467 | 37.99% |
| Wage / Income Gap ($) | 1,467 | 62.01¢ per $1 |
| Gini / Inequality Index | 1,467 | 0.20 |
Earnings by Sex in Morenci
Average Earnings in Morenci are $54,950, $65,991 for men and $40,918 for women, a difference of 38.0%.
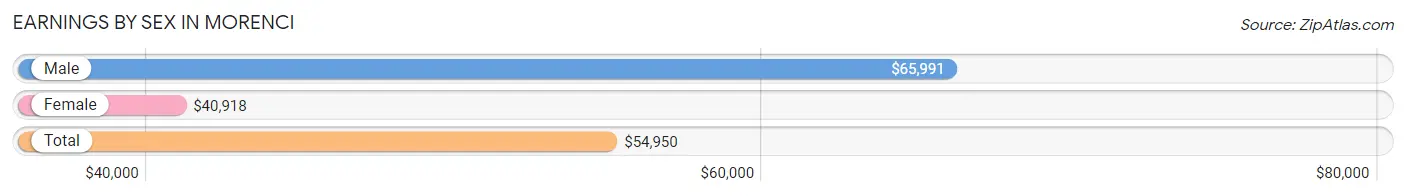
| Sex | Number | Average Earnings |
| Male | 645 (69.9%) | $65,991 |
| Female | 278 (30.1%) | $40,918 |
| Total | 923 (100.0%) | $54,950 |
Earnings by Sex by Income Bracket in Morenci
The most common earnings brackets in Morenci are $75,000 to $99,999 for men (239 | 37.0%) and $50,000 to $54,999 for women (56 | 20.1%).
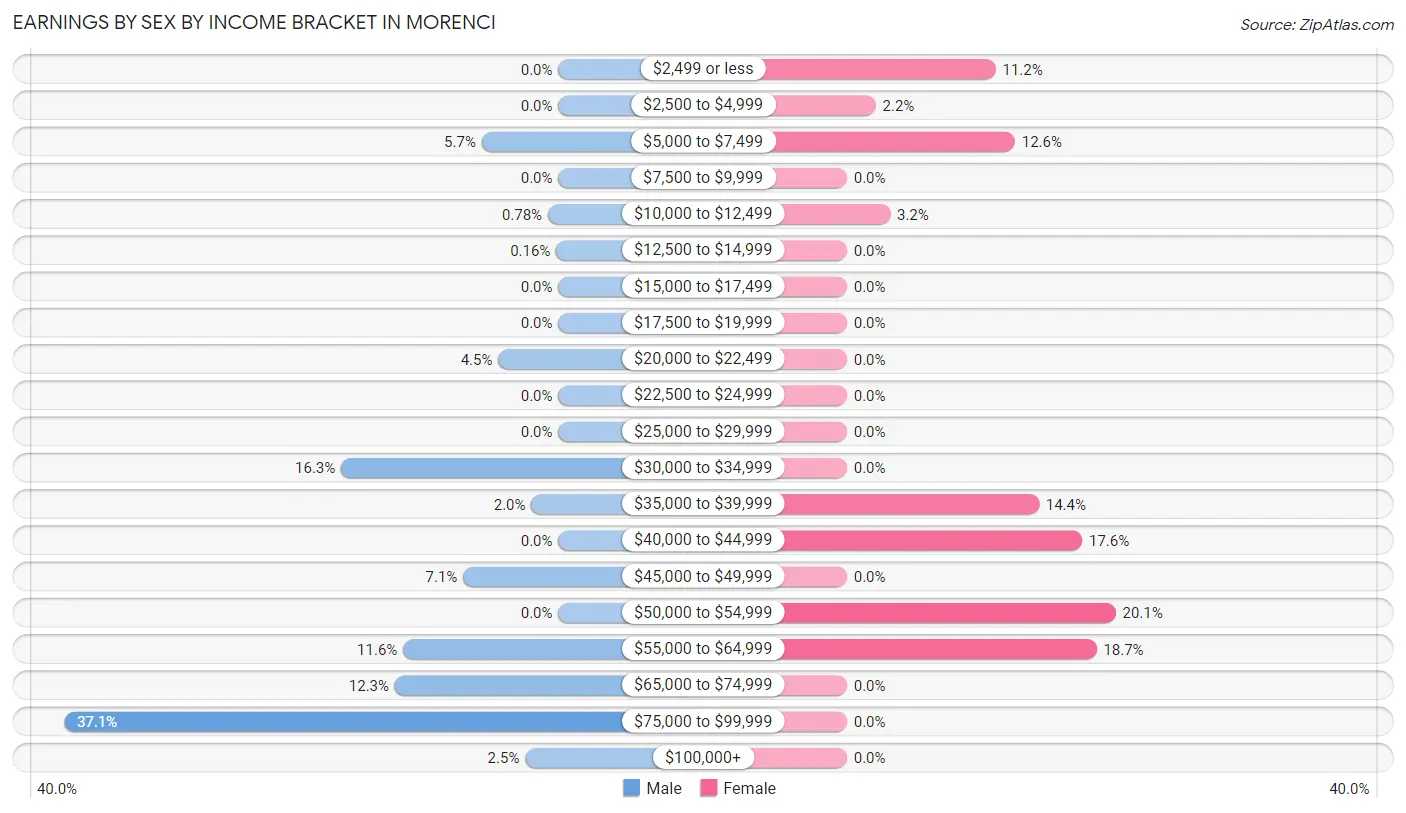
| Income | Male | Female |
| $2,499 or less | 0 (0.0%) | 31 (11.2%) |
| $2,500 to $4,999 | 0 (0.0%) | 6 (2.2%) |
| $5,000 to $7,499 | 37 (5.7%) | 35 (12.6%) |
| $7,500 to $9,999 | 0 (0.0%) | 0 (0.0%) |
| $10,000 to $12,499 | 5 (0.8%) | 9 (3.2%) |
| $12,500 to $14,999 | 1 (0.2%) | 0 (0.0%) |
| $15,000 to $17,499 | 0 (0.0%) | 0 (0.0%) |
| $17,500 to $19,999 | 0 (0.0%) | 0 (0.0%) |
| $20,000 to $22,499 | 29 (4.5%) | 0 (0.0%) |
| $22,500 to $24,999 | 0 (0.0%) | 0 (0.0%) |
| $25,000 to $29,999 | 0 (0.0%) | 0 (0.0%) |
| $30,000 to $34,999 | 105 (16.3%) | 0 (0.0%) |
| $35,000 to $39,999 | 13 (2.0%) | 40 (14.4%) |
| $40,000 to $44,999 | 0 (0.0%) | 49 (17.6%) |
| $45,000 to $49,999 | 46 (7.1%) | 0 (0.0%) |
| $50,000 to $54,999 | 0 (0.0%) | 56 (20.1%) |
| $55,000 to $64,999 | 75 (11.6%) | 52 (18.7%) |
| $65,000 to $74,999 | 79 (12.2%) | 0 (0.0%) |
| $75,000 to $99,999 | 239 (37.0%) | 0 (0.0%) |
| $100,000+ | 16 (2.5%) | 0 (0.0%) |
| Total | 645 (100.0%) | 278 (100.0%) |
Earnings by Sex by Educational Attainment in Morenci
Average earnings in Morenci are $68,427 for men and $40,128 for women, a difference of 41.4%. Men with an educational attainment of bachelor's degree enjoy the highest average annual earnings of $83,867, while those with high school diploma education earn the least with $56,125. Women with an educational attainment of college or associate's degree earn the most with the average annual earnings of $40,893, while those with college or associate's degree education have the smallest earnings of $40,893.
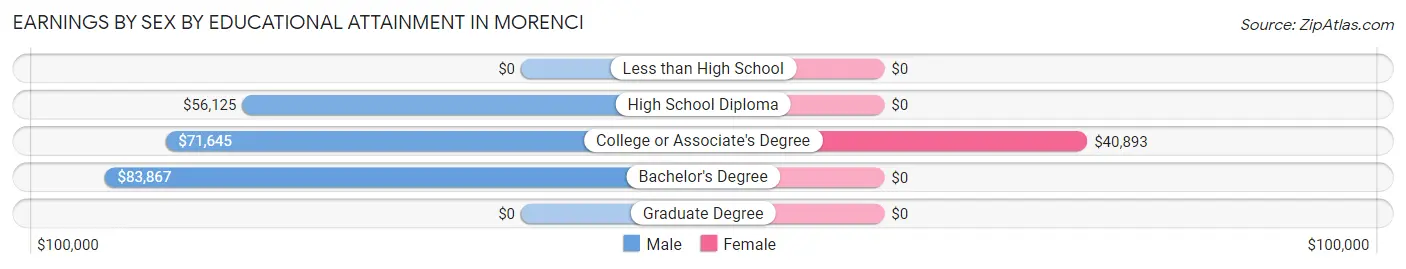
| Educational Attainment | Male Income | Female Income |
| Less than High School | - | - |
| High School Diploma | $56,125 | $0 |
| College or Associate's Degree | $71,645 | $40,893 |
| Bachelor's Degree | $83,867 | $0 |
| Graduate Degree | - | - |
| Total | $68,427 | $40,128 |
Family Income in Morenci
Family Income Brackets in Morenci
According to the Morenci family income data, there are 105 families falling into the $75,000 to $99,999 income range, which is the most common income bracket and makes up 34.8% of all families.
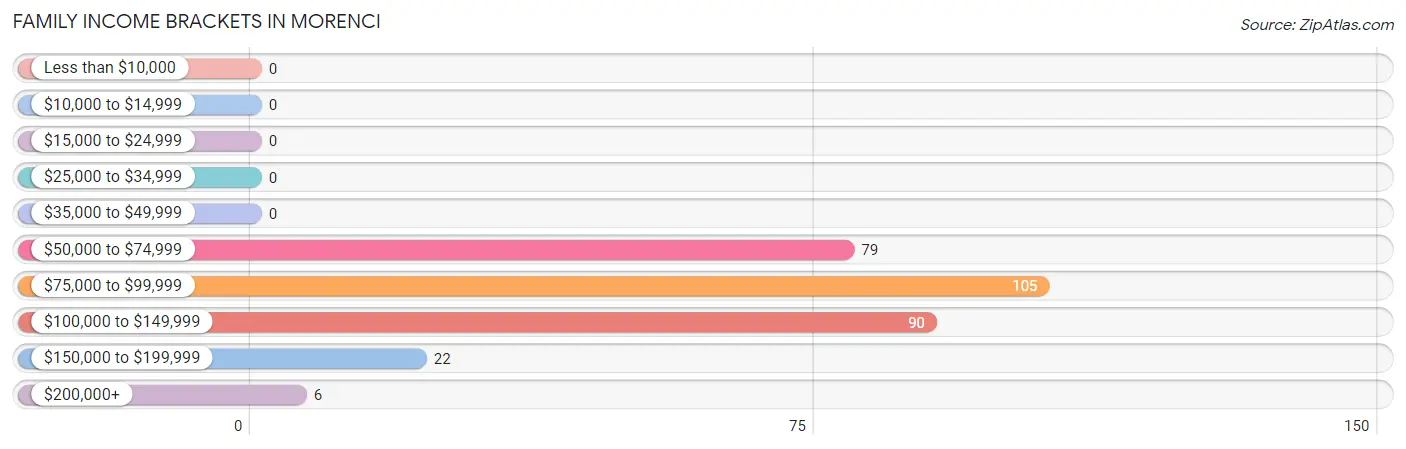
| Income Bracket | # Families | % Families |
| Less than $10,000 | 0 | 0.0% |
| $10,000 to $14,999 | 0 | 0.0% |
| $15,000 to $24,999 | 0 | 0.0% |
| $25,000 to $34,999 | 0 | 0.0% |
| $35,000 to $49,999 | 0 | 0.0% |
| $50,000 to $74,999 | 79 | 26.2% |
| $75,000 to $99,999 | 105 | 34.8% |
| $100,000 to $149,999 | 90 | 29.8% |
| $150,000 to $199,999 | 22 | 7.3% |
| $200,000+ | 6 | 2.0% |
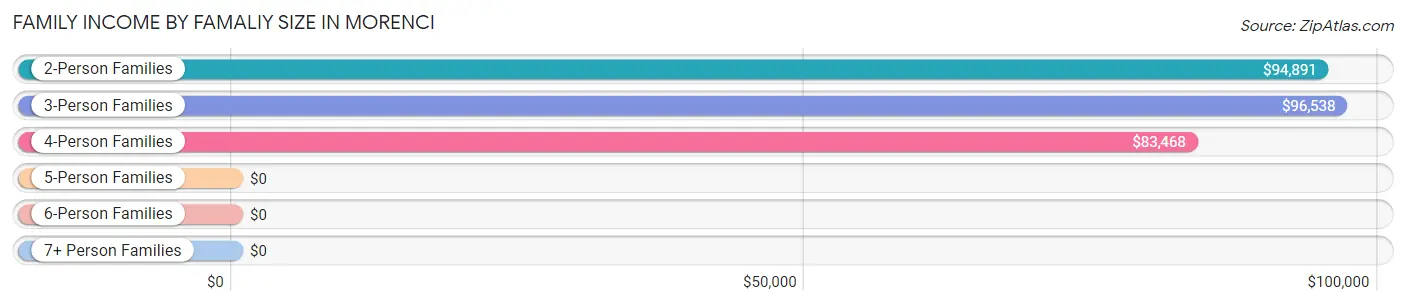
Family Income by Famaliy Size in Morenci
3-person families (76 | 25.2%) account for the highest median family income in Morenci with $96,538 per family, while 2-person families (164 | 54.3%) have the highest median income of $47,446 per family member.
| Income Bracket | # Families | Median Income |
| 2-Person Families | 164 (54.3%) | $94,891 |
| 3-Person Families | 76 (25.2%) | $96,538 |
| 4-Person Families | 54 (17.9%) | $83,468 |
| 5-Person Families | 0 (0.0%) | $0 |
| 6-Person Families | 2 (0.7%) | $0 |
| 7+ Person Families | 6 (2.0%) | $0 |
| Total | 302 (100.0%) | $95,000 |
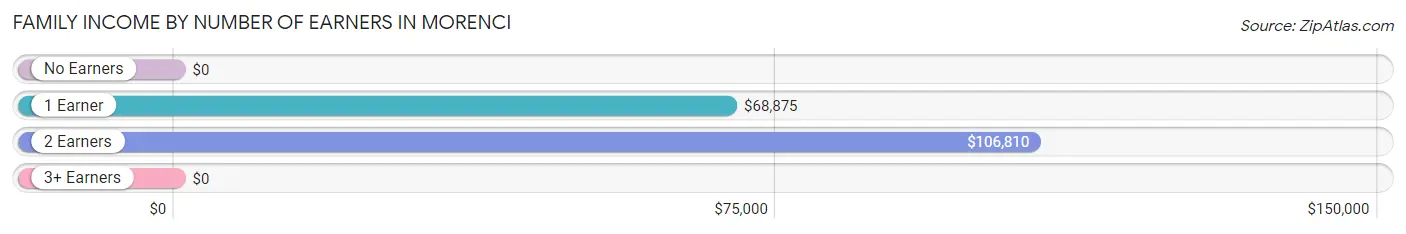
Family Income by Number of Earners in Morenci
| Number of Earners | # Families | Median Income |
| No Earners | 0 (0.0%) | $0 |
| 1 Earner | 131 (43.4%) | $68,875 |
| 2 Earners | 162 (53.6%) | $106,810 |
| 3+ Earners | 9 (3.0%) | $0 |
| Total | 302 (100.0%) | $95,000 |
Household Income in Morenci
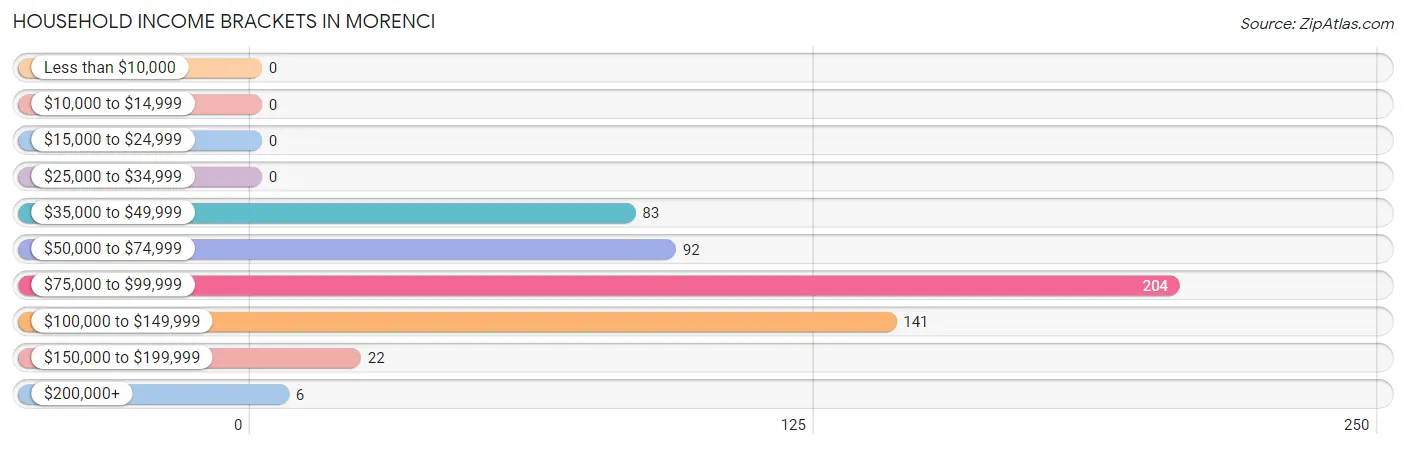
Household Income Brackets in Morenci
With 204 households falling in the category, the $75,000 to $99,999 income range is the most frequent in Morenci, accounting for 37.2% of all households.
| Income Bracket | # Households | % Households |
| Less than $10,000 | 0 | 0.0% |
| $10,000 to $14,999 | 0 | 0.0% |
| $15,000 to $24,999 | 0 | 0.0% |
| $25,000 to $34,999 | 0 | 0.0% |
| $35,000 to $49,999 | 83 | 15.1% |
| $50,000 to $74,999 | 92 | 16.8% |
| $75,000 to $99,999 | 204 | 37.2% |
| $100,000 to $149,999 | 141 | 25.7% |
| $150,000 to $199,999 | 22 | 4.0% |
| $200,000+ | 6 | 1.1% |
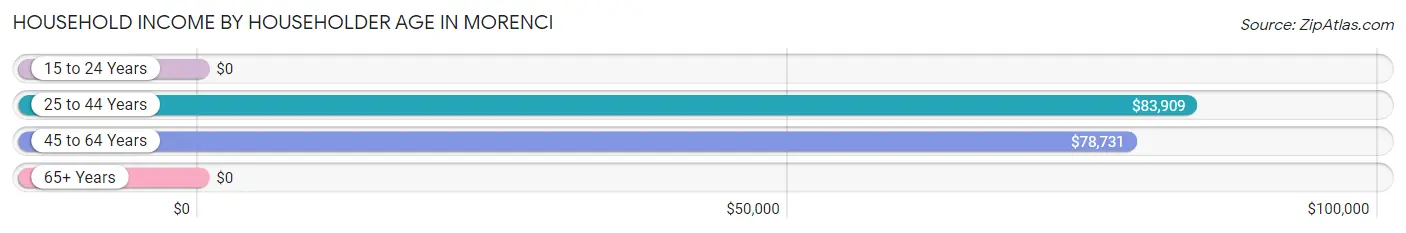
Household Income by Householder Age in Morenci
The median household income in Morenci is $83,144, with the highest median household income of $83,909 found in the 25 to 44 years age bracket for the primary householder. A total of 229 households (41.8%) fall into this category. Meanwhile, the 15 to 24 years age bracket for the primary householder has the lowest median household income of $0, with 31 households (5.7%) in this group.
| Income Bracket | # Households | Median Income |
| 15 to 24 Years | 31 (5.7%) | $0 |
| 25 to 44 Years | 229 (41.8%) | $83,909 |
| 45 to 64 Years | 288 (52.5%) | $78,731 |
| 65+ Years | 0 (0.0%) | $0 |
| Total | 548 (100.0%) | $83,144 |
Poverty in Morenci
Income Below Poverty by Sex and Age in Morenci
With 0.1% poverty level for males and 14.2% for females among the residents of Morenci, 25 to 34 year old males and 18 to 24 year old females are the most vulnerable to poverty, with 1 males (0.6%) and 65 females (67.7%) in their respective age groups living below the poverty level.
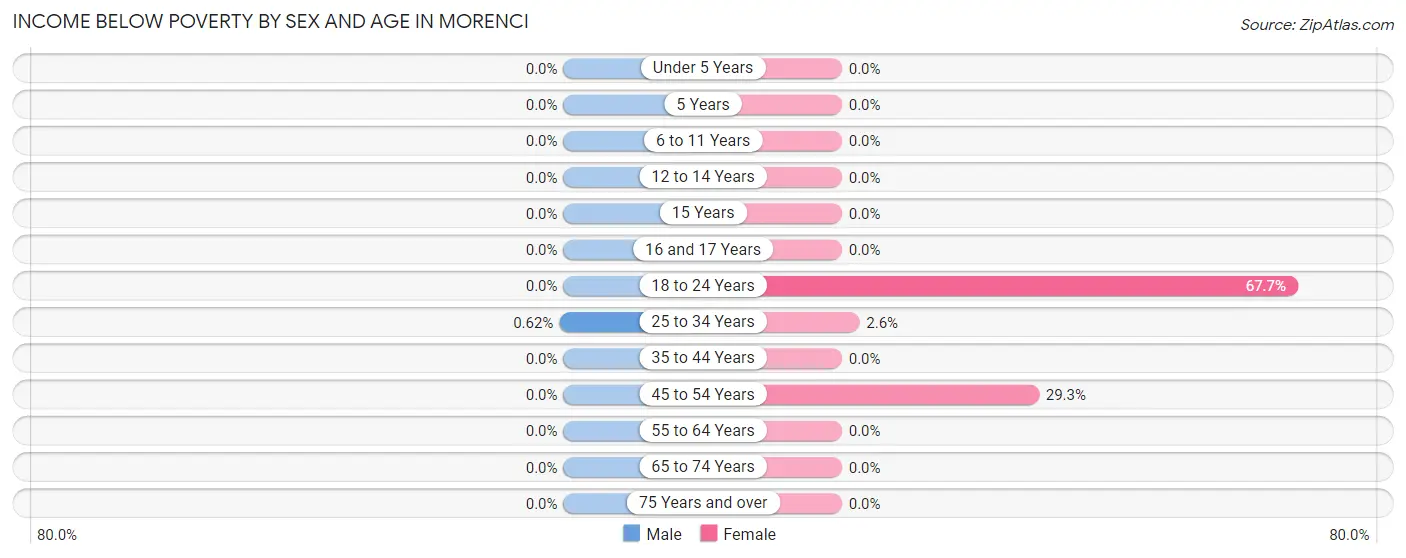
| Age Bracket | Male | Female |
| Under 5 Years | 0 (0.0%) | 0 (0.0%) |
| 5 Years | 0 (0.0%) | 0 (0.0%) |
| 6 to 11 Years | 0 (0.0%) | 0 (0.0%) |
| 12 to 14 Years | 0 (0.0%) | 0 (0.0%) |
| 15 Years | 0 (0.0%) | 0 (0.0%) |
| 16 and 17 Years | 0 (0.0%) | 0 (0.0%) |
| 18 to 24 Years | 0 (0.0%) | 65 (67.7%) |
| 25 to 34 Years | 1 (0.6%) | 3 (2.6%) |
| 35 to 44 Years | 0 (0.0%) | 0 (0.0%) |
| 45 to 54 Years | 0 (0.0%) | 31 (29.2%) |
| 55 to 64 Years | 0 (0.0%) | 0 (0.0%) |
| 65 to 74 Years | 0 (0.0%) | 0 (0.0%) |
| 75 Years and over | 0 (0.0%) | 0 (0.0%) |
| Total | 1 (0.1%) | 99 (14.2%) |
Income Above Poverty by Sex and Age in Morenci
According to the poverty statistics in Morenci, males aged under 5 years and females aged under 5 years are the age groups that are most secure financially, with 100.0% of males and 100.0% of females in these age groups living above the poverty line.
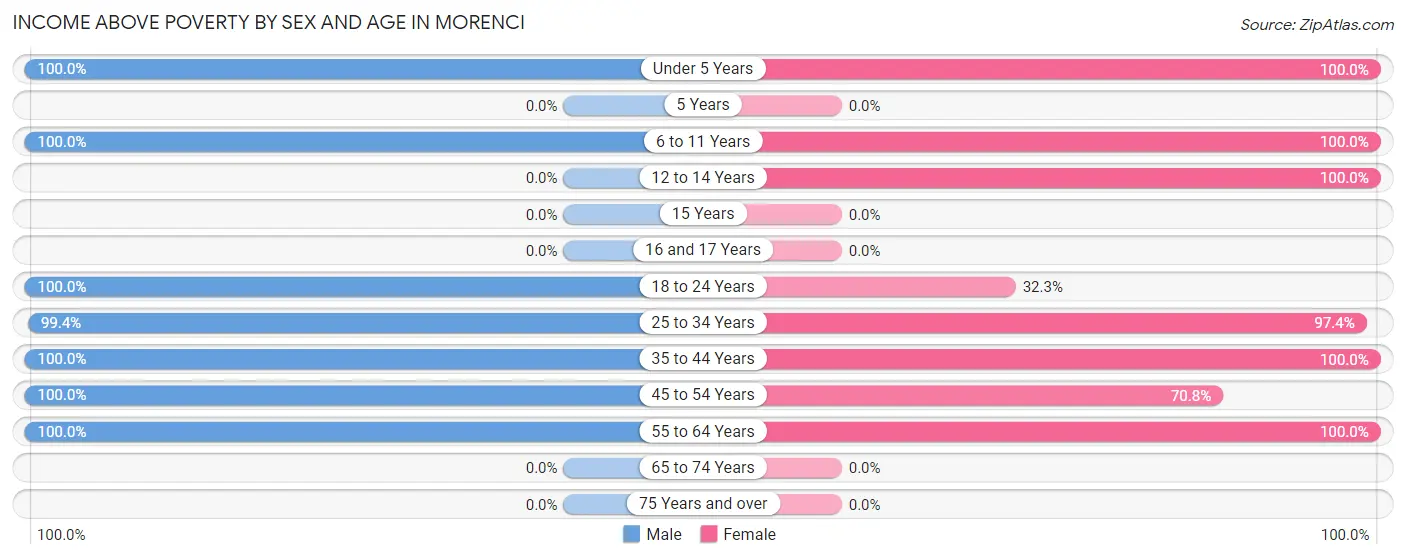
| Age Bracket | Male | Female |
| Under 5 Years | 71 (100.0%) | 48 (100.0%) |
| 5 Years | 0 (0.0%) | 0 (0.0%) |
| 6 to 11 Years | 10 (100.0%) | 151 (100.0%) |
| 12 to 14 Years | 0 (0.0%) | 34 (100.0%) |
| 15 Years | 0 (0.0%) | 0 (0.0%) |
| 16 and 17 Years | 0 (0.0%) | 0 (0.0%) |
| 18 to 24 Years | 98 (100.0%) | 31 (32.3%) |
| 25 to 34 Years | 160 (99.4%) | 112 (97.4%) |
| 35 to 44 Years | 128 (100.0%) | 117 (100.0%) |
| 45 to 54 Years | 118 (100.0%) | 75 (70.8%) |
| 55 to 64 Years | 180 (100.0%) | 32 (100.0%) |
| 65 to 74 Years | 0 (0.0%) | 0 (0.0%) |
| 75 Years and over | 0 (0.0%) | 0 (0.0%) |
| Total | 765 (99.9%) | 600 (85.8%) |
Income Below Poverty Among Married-Couple Families in Morenci
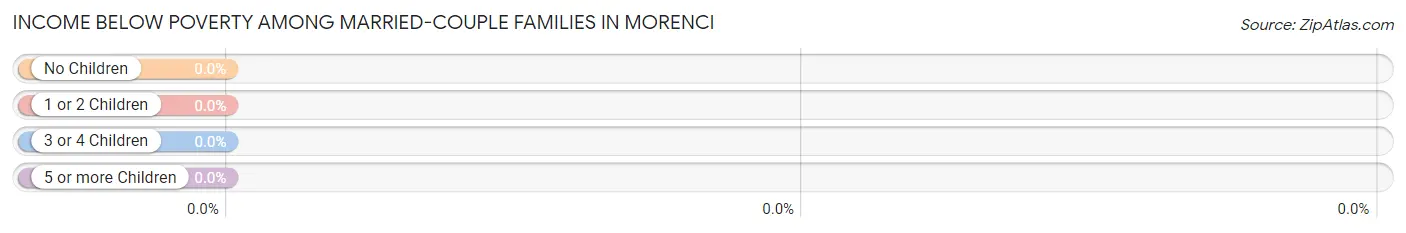
| Children | Above Poverty | Below Poverty |
| No Children | 156 (100.0%) | 0 (0.0%) |
| 1 or 2 Children | 114 (100.0%) | 0 (0.0%) |
| 3 or 4 Children | 0 (0.0%) | 0 (0.0%) |
| 5 or more Children | 0 (0.0%) | 0 (0.0%) |
| Total | 270 (100.0%) | 0 (0.0%) |
Income Below Poverty Among Single-Parent Households in Morenci
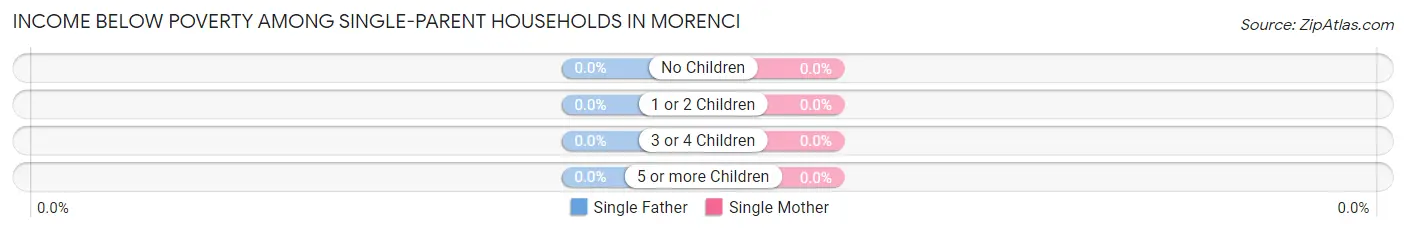
| Children | Single Father | Single Mother |
| No Children | 0 (0.0%) | 0 (0.0%) |
| 1 or 2 Children | 0 (0.0%) | 0 (0.0%) |
| 3 or 4 Children | 0 (0.0%) | 0 (0.0%) |
| 5 or more Children | 0 (0.0%) | 0 (0.0%) |
| Total | 0 (0.0%) | 0 (0.0%) |
Income Below Poverty Among Married-Couple vs Single-Parent Households in Morenci
| Children | Married-Couple Families | Single-Parent Households |
| No Children | 0 (0.0%) | 0 (0.0%) |
| 1 or 2 Children | 0 (0.0%) | 0 (0.0%) |
| 3 or 4 Children | 0 (0.0%) | 0 (0.0%) |
| 5 or more Children | 0 (0.0%) | 0 (0.0%) |
| Total | 0 (0.0%) | 0 (0.0%) |
Employment Characteristics in Morenci
Employment by Class of Employer in Morenci
Among the 915 employed individuals in Morenci, private company employees (713 | 77.9%), self-employed (incorporated) (106 | 11.6%), and local government employees (55 | 6.0%) make up the most common classes of employment.
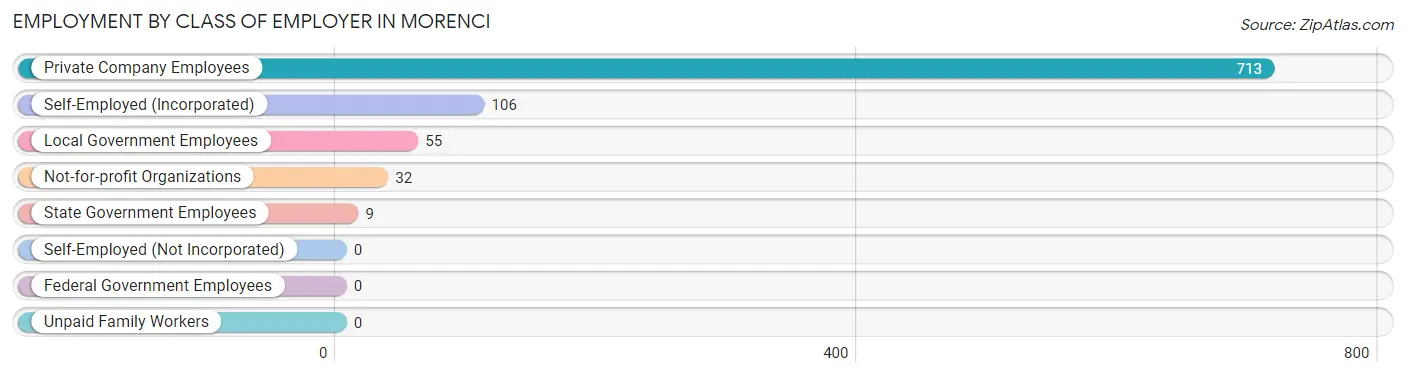
| Employer Class | # Employees | % Employees |
| Private Company Employees | 713 | 77.9% |
| Self-Employed (Incorporated) | 106 | 11.6% |
| Self-Employed (Not Incorporated) | 0 | 0.0% |
| Not-for-profit Organizations | 32 | 3.5% |
| Local Government Employees | 55 | 6.0% |
| State Government Employees | 9 | 1.0% |
| Federal Government Employees | 0 | 0.0% |
| Unpaid Family Workers | 0 | 0.0% |
| Total | 915 | 100.0% |
Employment Status by Age in Morenci
According to the labor force statistics for Morenci, out of the total population over 16 years of age (1,151), 83.2% or 958 individuals are in the labor force, with 4.5% or 43 of them unemployed. The age group with the highest labor force participation rate is 60 to 64 years, with 100.0% or 37 individuals in the labor force. Within the labor force, the 16 to 19 years age range has the highest percentage of unemployed individuals, with 100.0% or 40 of them being unemployed.
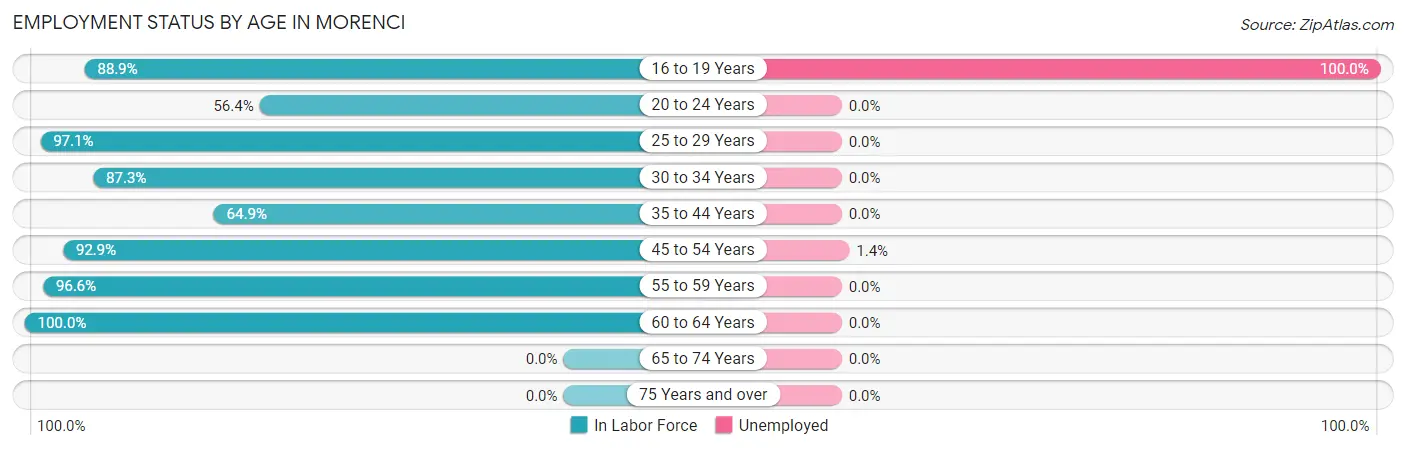
| Age Bracket | In Labor Force | Unemployed |
| 16 to 19 Years | 40 (88.9%) | 40 (100.0%) |
| 20 to 24 Years | 84 (56.4%) | 0 (0.0%) |
| 25 to 29 Years | 199 (97.1%) | 0 (0.0%) |
| 30 to 34 Years | 62 (87.3%) | 0 (0.0%) |
| 35 to 44 Years | 159 (64.9%) | 0 (0.0%) |
| 45 to 54 Years | 208 (92.9%) | 3 (1.4%) |
| 55 to 59 Years | 169 (96.6%) | 0 (0.0%) |
| 60 to 64 Years | 37 (100.0%) | 0 (0.0%) |
| 65 to 74 Years | 0 (0.0%) | 0 (0.0%) |
| 75 Years and over | 0 (0.0%) | 0 (0.0%) |
| Total | 958 (83.2%) | 43 (4.5%) |
Employment Status by Educational Attainment in Morenci
According to labor force statistics for Morenci, 87.1% of individuals (834) out of the total population between 25 and 64 years of age (957) are in the labor force, with 0.4% or 3 of them being unemployed. The group with the highest labor force participation rate are those with the educational attainment of high school diploma, with 97.9% or 274 individuals in the labor force. Within the labor force, individuals with college / associate degree education have the highest percentage of unemployment, with 1.1% or 3 of them being unemployed.
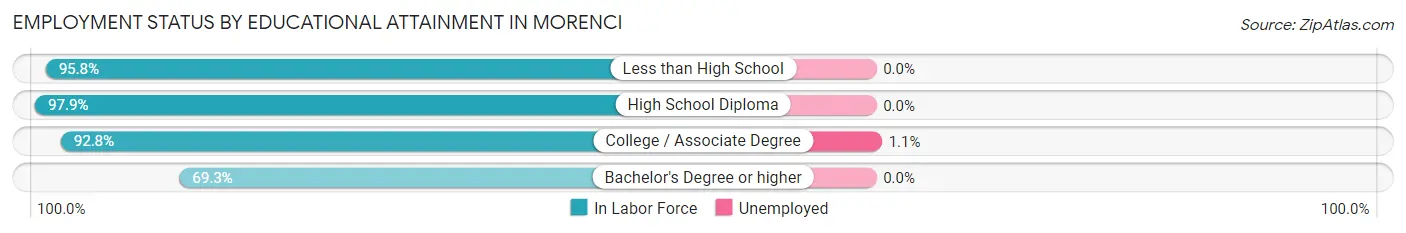
| Educational Attainment | In Labor Force | Unemployed |
| Less than High School | 68 (95.8%) | 0 (0.0%) |
| High School Diploma | 274 (97.9%) | 0 (0.0%) |
| College / Associate Degree | 284 (92.8%) | 3 (1.1%) |
| Bachelor's Degree or higher | 208 (69.3%) | 0 (0.0%) |
| Total | 834 (87.1%) | 4 (0.4%) |
Employment Occupations by Sex in Morenci
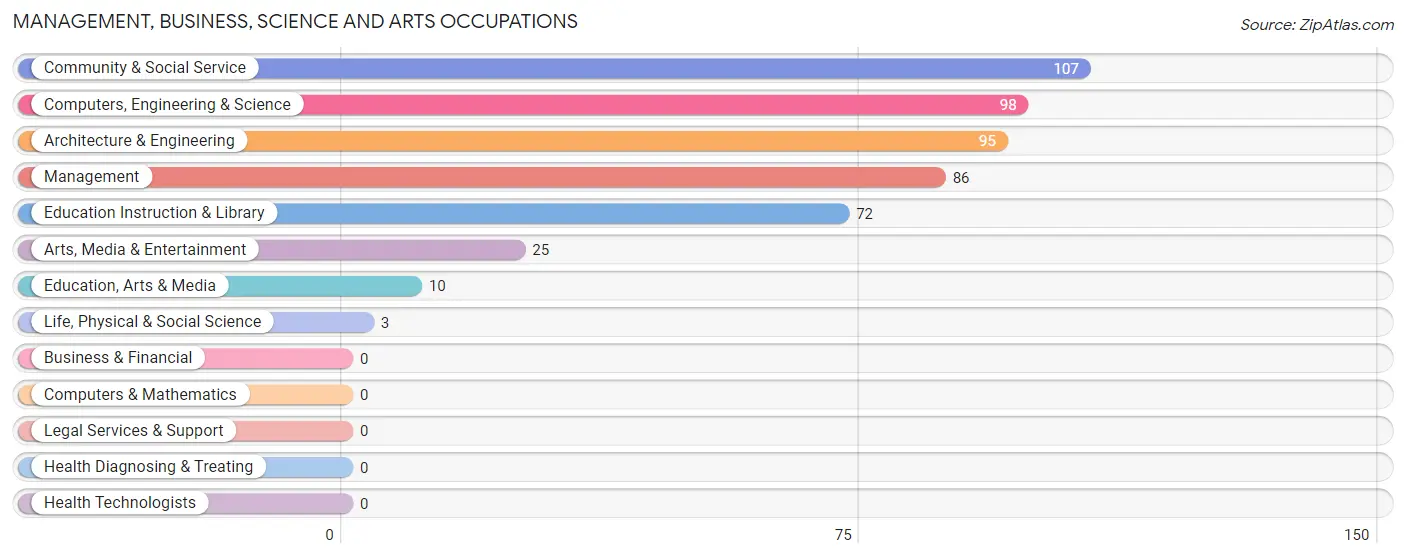
Management, Business, Science and Arts Occupations
The most common Management, Business, Science and Arts occupations in Morenci are Community & Social Service (107 | 11.7%), Computers, Engineering & Science (98 | 10.7%), Architecture & Engineering (95 | 10.4%), Management (86 | 9.4%), and Education Instruction & Library (72 | 7.9%).
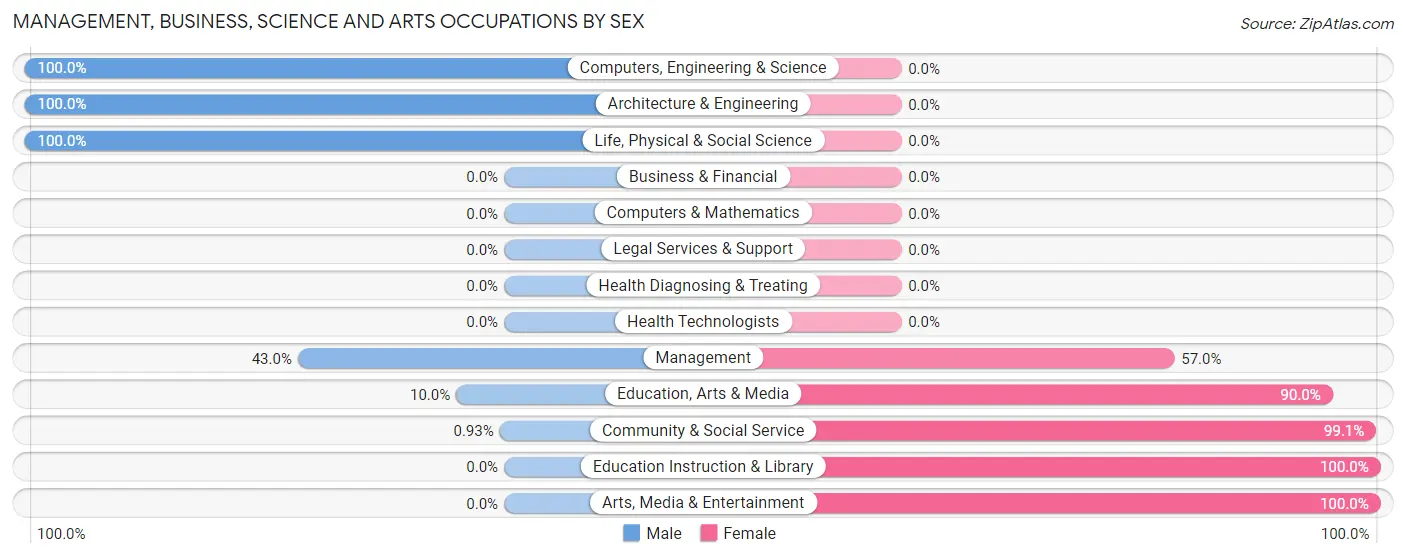
Management, Business, Science and Arts Occupations by Sex
Within the Management, Business, Science and Arts occupations in Morenci, the most male-oriented occupations are Computers, Engineering & Science (100.0%), Architecture & Engineering (100.0%), and Life, Physical & Social Science (100.0%), while the most female-oriented occupations are Education Instruction & Library (100.0%), Arts, Media & Entertainment (100.0%), and Community & Social Service (99.1%).
| Occupation | Male | Female |
| Management | 37 (43.0%) | 49 (57.0%) |
| Business & Financial | 0 (0.0%) | 0 (0.0%) |
| Computers, Engineering & Science | 98 (100.0%) | 0 (0.0%) |
| Computers & Mathematics | 0 (0.0%) | 0 (0.0%) |
| Architecture & Engineering | 95 (100.0%) | 0 (0.0%) |
| Life, Physical & Social Science | 3 (100.0%) | 0 (0.0%) |
| Community & Social Service | 1 (0.9%) | 106 (99.1%) |
| Education, Arts & Media | 1 (10.0%) | 9 (90.0%) |
| Legal Services & Support | 0 (0.0%) | 0 (0.0%) |
| Education Instruction & Library | 0 (0.0%) | 72 (100.0%) |
| Arts, Media & Entertainment | 0 (0.0%) | 25 (100.0%) |
| Health Diagnosing & Treating | 0 (0.0%) | 0 (0.0%) |
| Health Technologists | 0 (0.0%) | 0 (0.0%) |
| Total (Category) | 136 (46.7%) | 155 (53.3%) |
| Total (Overall) | 637 (69.6%) | 278 (30.4%) |
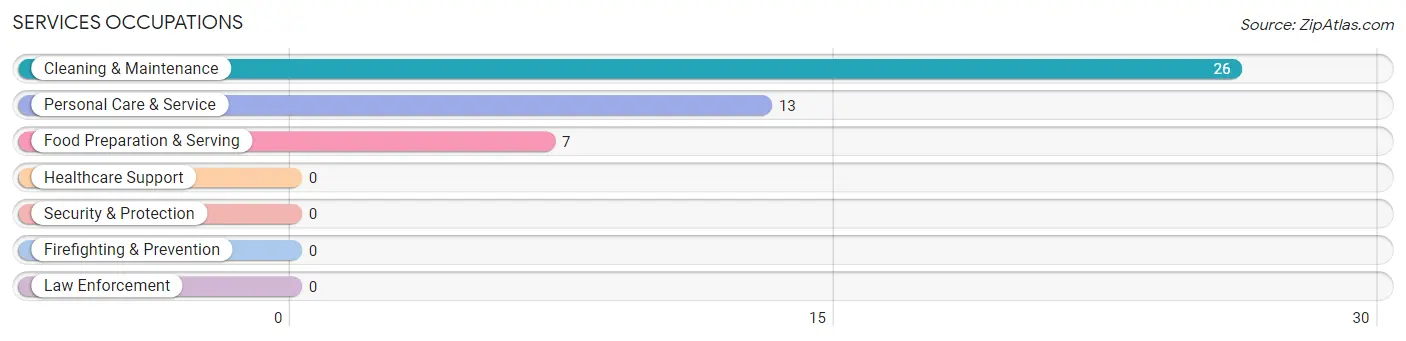
Services Occupations
The most common Services occupations in Morenci are Cleaning & Maintenance (26 | 2.8%), Personal Care & Service (13 | 1.4%), and Food Preparation & Serving (7 | 0.8%).
Services Occupations by Sex
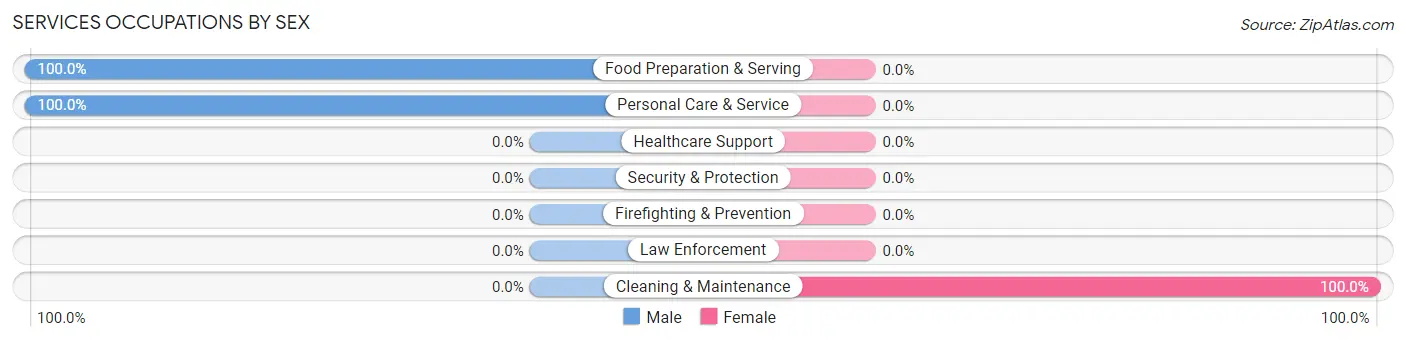
| Occupation | Male | Female |
| Healthcare Support | 0 (0.0%) | 0 (0.0%) |
| Security & Protection | 0 (0.0%) | 0 (0.0%) |
| Firefighting & Prevention | 0 (0.0%) | 0 (0.0%) |
| Law Enforcement | 0 (0.0%) | 0 (0.0%) |
| Food Preparation & Serving | 7 (100.0%) | 0 (0.0%) |
| Cleaning & Maintenance | 0 (0.0%) | 26 (100.0%) |
| Personal Care & Service | 13 (100.0%) | 0 (0.0%) |
| Total (Category) | 20 (43.5%) | 26 (56.5%) |
| Total (Overall) | 637 (69.6%) | 278 (30.4%) |
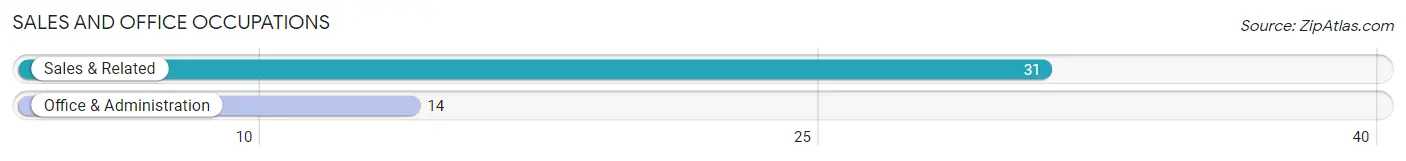
Sales and Office Occupations
The most common Sales and Office occupations in Morenci are Sales & Related (31 | 3.4%), and Office & Administration (14 | 1.5%).
Sales and Office Occupations by Sex
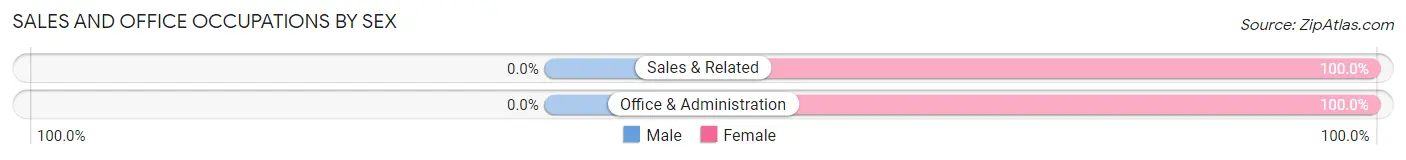
| Occupation | Male | Female |
| Sales & Related | 0 (0.0%) | 31 (100.0%) |
| Office & Administration | 0 (0.0%) | 14 (100.0%) |
| Total (Category) | 0 (0.0%) | 45 (100.0%) |
| Total (Overall) | 637 (69.6%) | 278 (30.4%) |
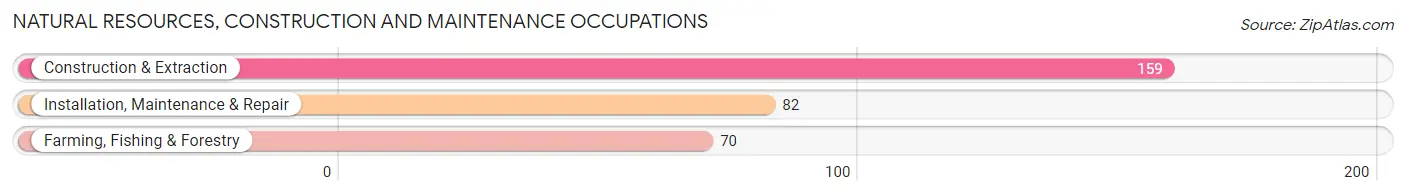
Natural Resources, Construction and Maintenance Occupations
The most common Natural Resources, Construction and Maintenance occupations in Morenci are Construction & Extraction (159 | 17.4%), Installation, Maintenance & Repair (82 | 9.0%), and Farming, Fishing & Forestry (70 | 7.6%).
Natural Resources, Construction and Maintenance Occupations by Sex
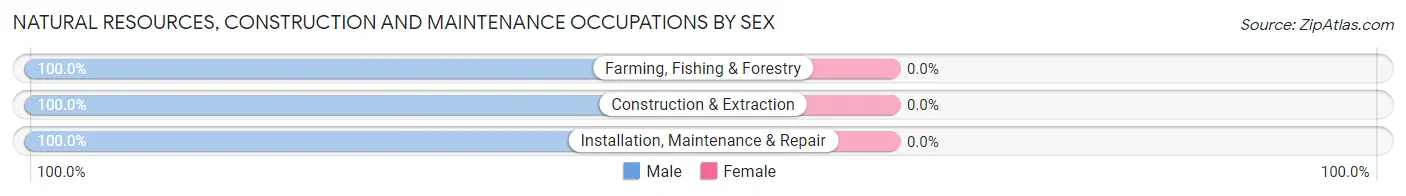
| Occupation | Male | Female |
| Farming, Fishing & Forestry | 70 (100.0%) | 0 (0.0%) |
| Construction & Extraction | 159 (100.0%) | 0 (0.0%) |
| Installation, Maintenance & Repair | 82 (100.0%) | 0 (0.0%) |
| Total (Category) | 311 (100.0%) | 0 (0.0%) |
| Total (Overall) | 637 (69.6%) | 278 (30.4%) |
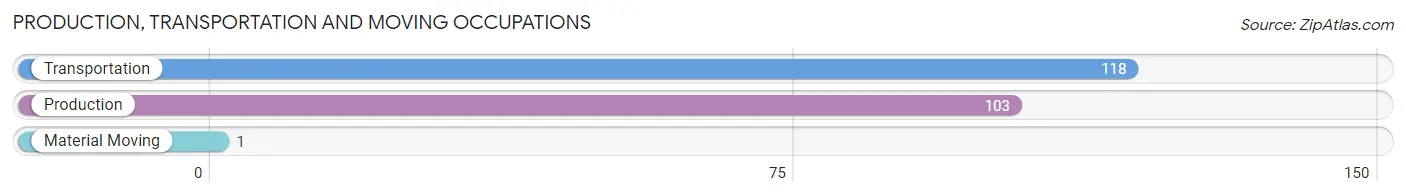
Production, Transportation and Moving Occupations
The most common Production, Transportation and Moving occupations in Morenci are Transportation (118 | 12.9%), Production (103 | 11.3%), and Material Moving (1 | 0.1%).
Production, Transportation and Moving Occupations by Sex
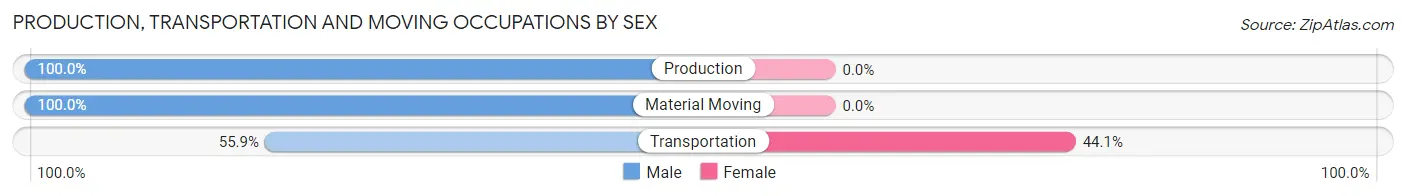
| Occupation | Male | Female |
| Production | 103 (100.0%) | 0 (0.0%) |
| Transportation | 66 (55.9%) | 52 (44.1%) |
| Material Moving | 1 (100.0%) | 0 (0.0%) |
| Total (Category) | 170 (76.6%) | 52 (23.4%) |
| Total (Overall) | 637 (69.6%) | 278 (30.4%) |
Employment Industries by Sex in Morenci
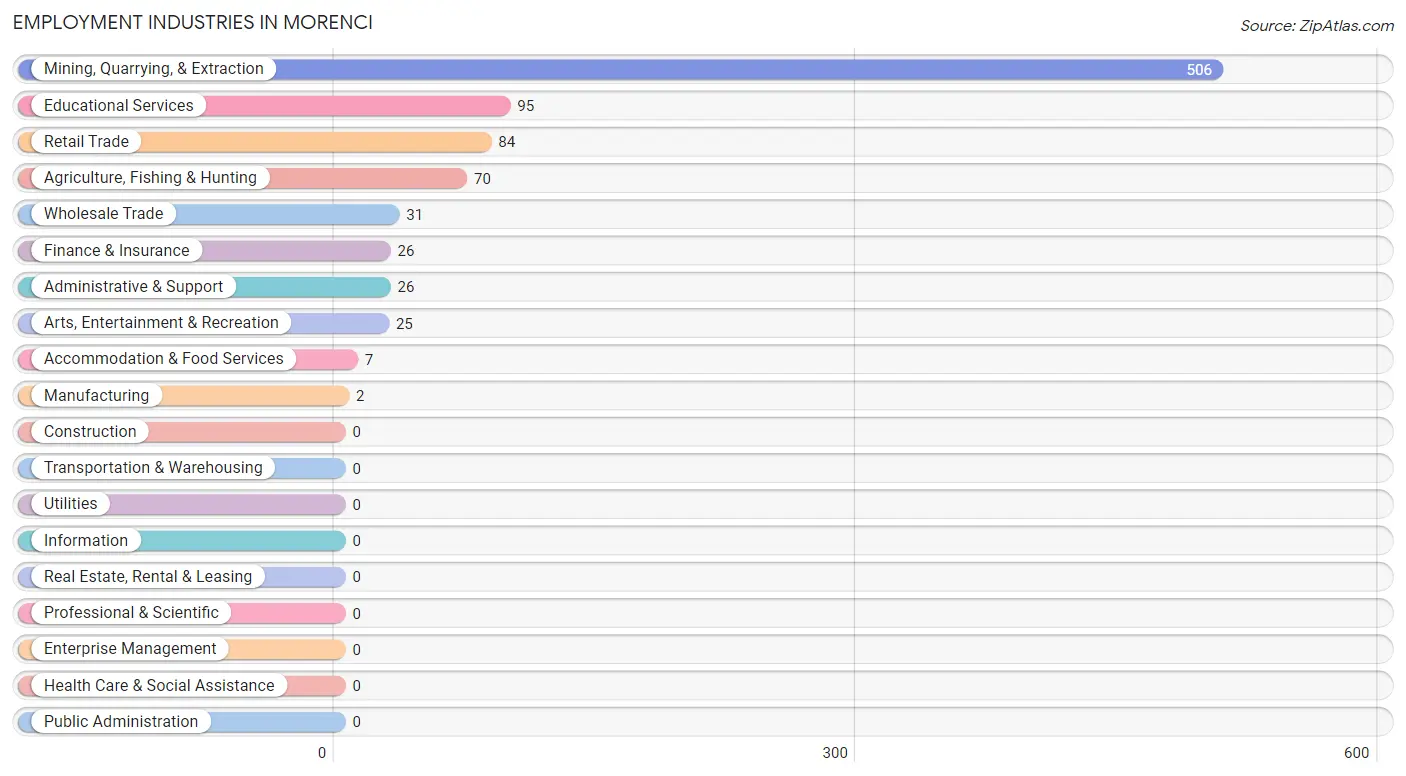
Employment Industries in Morenci
The major employment industries in Morenci include Mining, Quarrying, & Extraction (506 | 55.3%), Educational Services (95 | 10.4%), Retail Trade (84 | 9.2%), Agriculture, Fishing & Hunting (70 | 7.6%), and Wholesale Trade (31 | 3.4%).
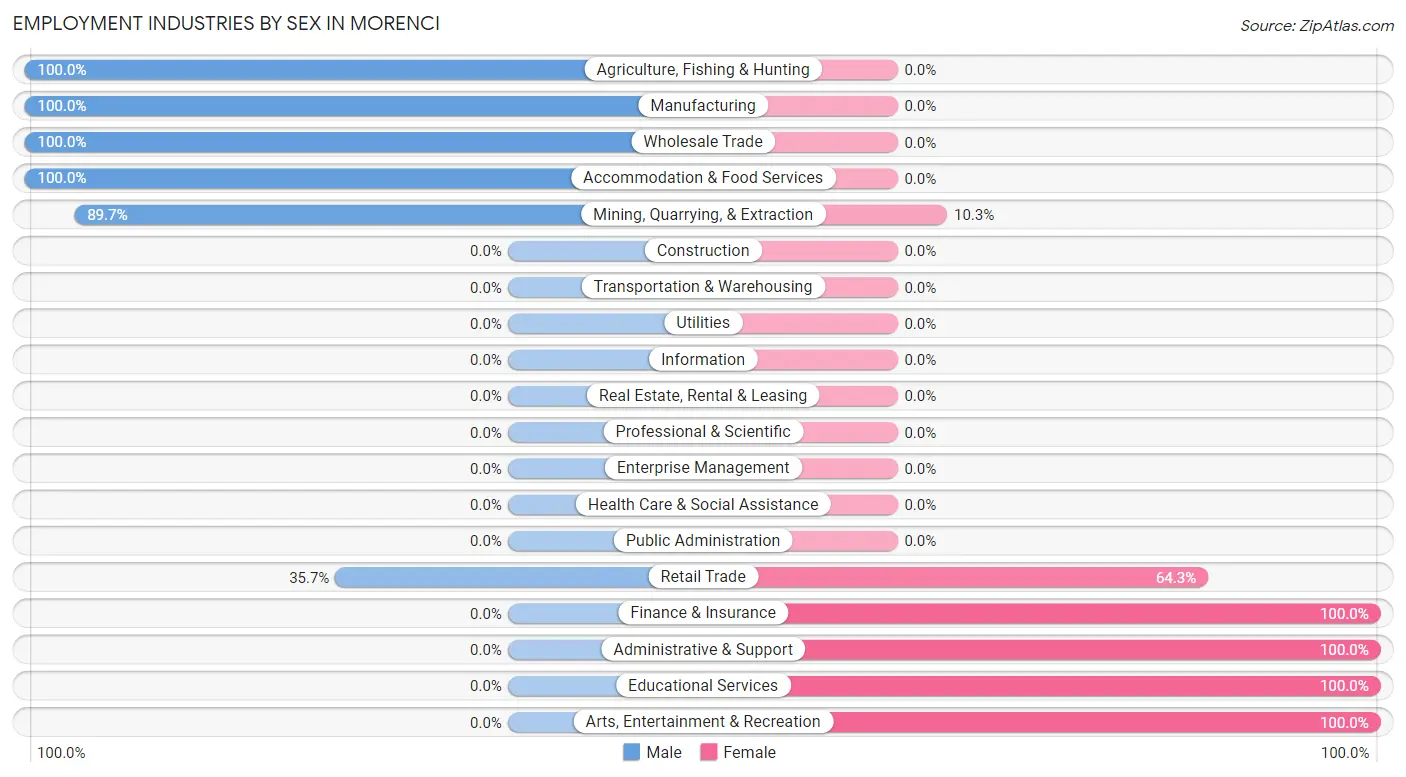
Employment Industries by Sex in Morenci
The Morenci industries that see more men than women are Agriculture, Fishing & Hunting (100.0%), Manufacturing (100.0%), and Wholesale Trade (100.0%), whereas the industries that tend to have a higher number of women are Finance & Insurance (100.0%), Administrative & Support (100.0%), and Educational Services (100.0%).
| Industry | Male | Female |
| Agriculture, Fishing & Hunting | 70 (100.0%) | 0 (0.0%) |
| Mining, Quarrying, & Extraction | 454 (89.7%) | 52 (10.3%) |
| Construction | 0 (0.0%) | 0 (0.0%) |
| Manufacturing | 2 (100.0%) | 0 (0.0%) |
| Wholesale Trade | 31 (100.0%) | 0 (0.0%) |
| Retail Trade | 30 (35.7%) | 54 (64.3%) |
| Transportation & Warehousing | 0 (0.0%) | 0 (0.0%) |
| Utilities | 0 (0.0%) | 0 (0.0%) |
| Information | 0 (0.0%) | 0 (0.0%) |
| Finance & Insurance | 0 (0.0%) | 26 (100.0%) |
| Real Estate, Rental & Leasing | 0 (0.0%) | 0 (0.0%) |
| Professional & Scientific | 0 (0.0%) | 0 (0.0%) |
| Enterprise Management | 0 (0.0%) | 0 (0.0%) |
| Administrative & Support | 0 (0.0%) | 26 (100.0%) |
| Educational Services | 0 (0.0%) | 95 (100.0%) |
| Health Care & Social Assistance | 0 (0.0%) | 0 (0.0%) |
| Arts, Entertainment & Recreation | 0 (0.0%) | 25 (100.0%) |
| Accommodation & Food Services | 7 (100.0%) | 0 (0.0%) |
| Public Administration | 0 (0.0%) | 0 (0.0%) |
| Total | 637 (69.6%) | 278 (30.4%) |
Education in Morenci
School Enrollment in Morenci
The most common levels of schooling among the 287 students in Morenci are elementary school (138 | 48.1%), college / undergraduate (60 | 20.9%), and high school (34 | 11.8%).
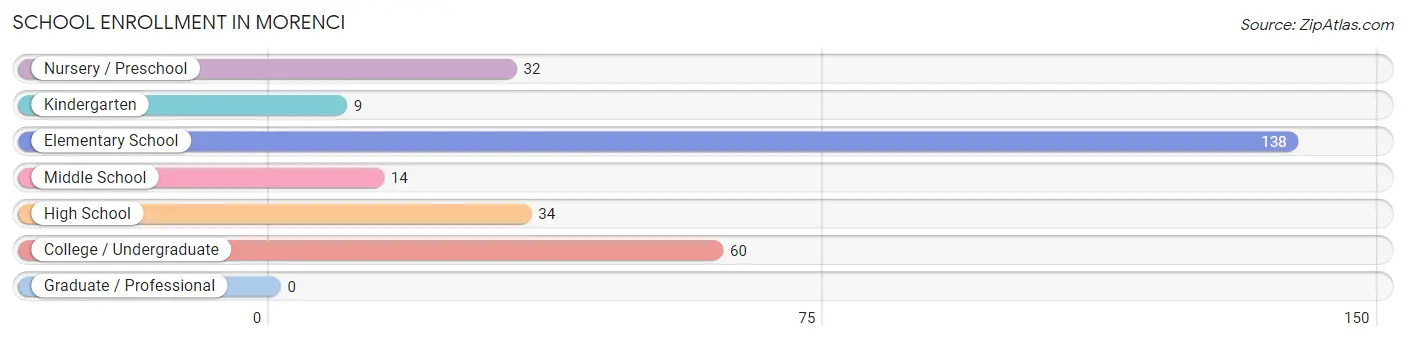
| School Level | # Students | % Students |
| Nursery / Preschool | 32 | 11.2% |
| Kindergarten | 9 | 3.1% |
| Elementary School | 138 | 48.1% |
| Middle School | 14 | 4.9% |
| High School | 34 | 11.8% |
| College / Undergraduate | 60 | 20.9% |
| Graduate / Professional | 0 | 0.0% |
| Total | 287 | 100.0% |
School Enrollment by Age by Funding Source in Morenci
Out of a total of 287 students who are enrolled in schools in Morenci, 58 (20.2%) attend a private institution, while the remaining 229 (79.8%) are enrolled in public schools. The age group of 3 to 4 year olds has the highest likelihood of being enrolled in private schools, with 32 (100.0% in the age bracket) enrolled. Conversely, the age group of 5 to 9 year old has the lowest likelihood of being enrolled in a private school, with 147 (100.0% in the age bracket) attending a public institution.
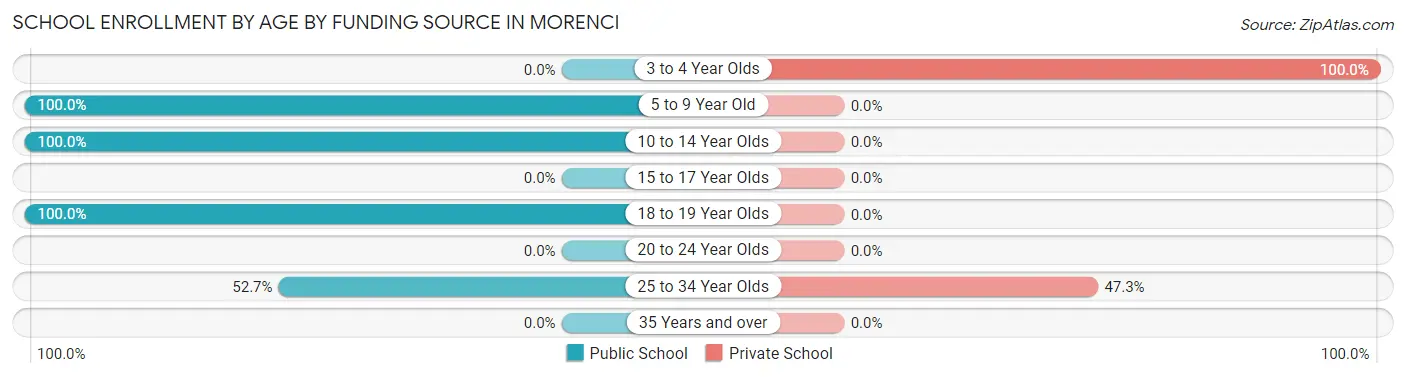
| Age Bracket | Public School | Private School |
| 3 to 4 Year Olds | 0 (0.0%) | 32 (100.0%) |
| 5 to 9 Year Old | 147 (100.0%) | 0 (0.0%) |
| 10 to 14 Year Olds | 48 (100.0%) | 0 (0.0%) |
| 15 to 17 Year Olds | 0 (0.0%) | 0 (0.0%) |
| 18 to 19 Year Olds | 5 (100.0%) | 0 (0.0%) |
| 20 to 24 Year Olds | 0 (0.0%) | 0 (0.0%) |
| 25 to 34 Year Olds | 29 (52.7%) | 26 (47.3%) |
| 35 Years and over | 0 (0.0%) | 0 (0.0%) |
| Total | 229 (79.8%) | 58 (20.2%) |
Educational Attainment by Field of Study in Morenci
Engineering (79 | 25.8%), social sciences (55 | 18.0%), visual & performing arts (37 | 12.1%), education (35 | 11.4%), and business (31 | 10.1%) are the most common fields of study among 306 individuals in Morenci who have obtained a bachelor's degree or higher.
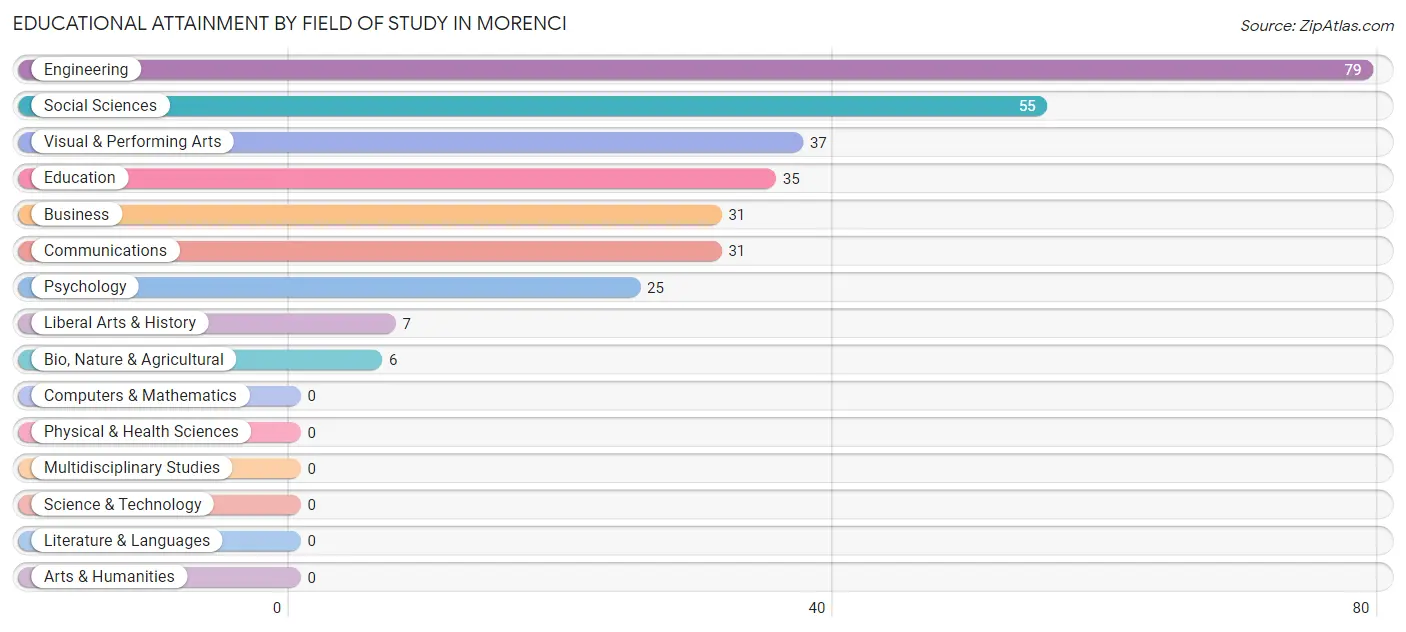
| Field of Study | # Graduates | % Graduates |
| Computers & Mathematics | 0 | 0.0% |
| Bio, Nature & Agricultural | 6 | 2.0% |
| Physical & Health Sciences | 0 | 0.0% |
| Psychology | 25 | 8.2% |
| Social Sciences | 55 | 18.0% |
| Engineering | 79 | 25.8% |
| Multidisciplinary Studies | 0 | 0.0% |
| Science & Technology | 0 | 0.0% |
| Business | 31 | 10.1% |
| Education | 35 | 11.4% |
| Literature & Languages | 0 | 0.0% |
| Liberal Arts & History | 7 | 2.3% |
| Visual & Performing Arts | 37 | 12.1% |
| Communications | 31 | 10.1% |
| Arts & Humanities | 0 | 0.0% |
| Total | 306 | 100.0% |
Transportation & Commute in Morenci
Vehicle Availability by Sex in Morenci
The most prevalent vehicle ownership categories in Morenci are males with 3 vehicles (215, accounting for 33.9%) and females with 3 vehicles (97, making up 77.3%).
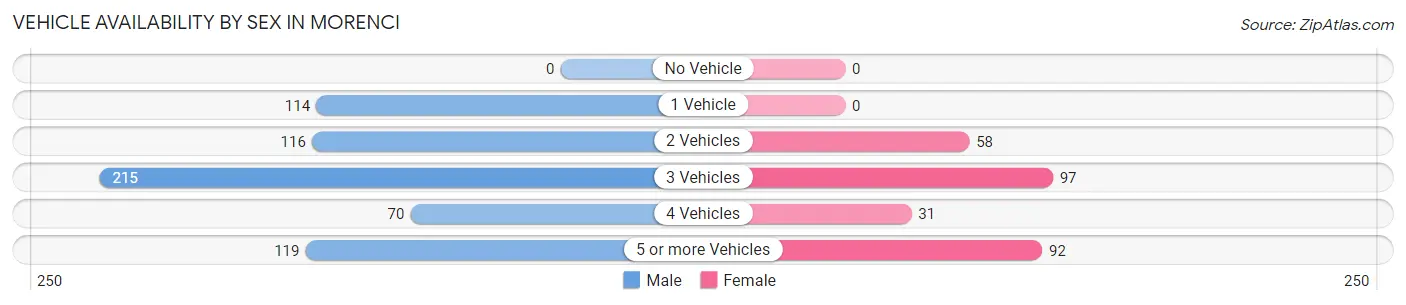
| Vehicles Available | Male | Female |
| No Vehicle | 0 (0.0%) | 0 (0.0%) |
| 1 Vehicle | 114 (18.0%) | 0 (0.0%) |
| 2 Vehicles | 116 (18.3%) | 58 (20.9%) |
| 3 Vehicles | 215 (33.9%) | 97 (34.9%) |
| 4 Vehicles | 70 (11.0%) | 31 (11.2%) |
| 5 or more Vehicles | 119 (18.8%) | 92 (33.1%) |
| Total | 634 (100.0%) | 278 (100.0%) |
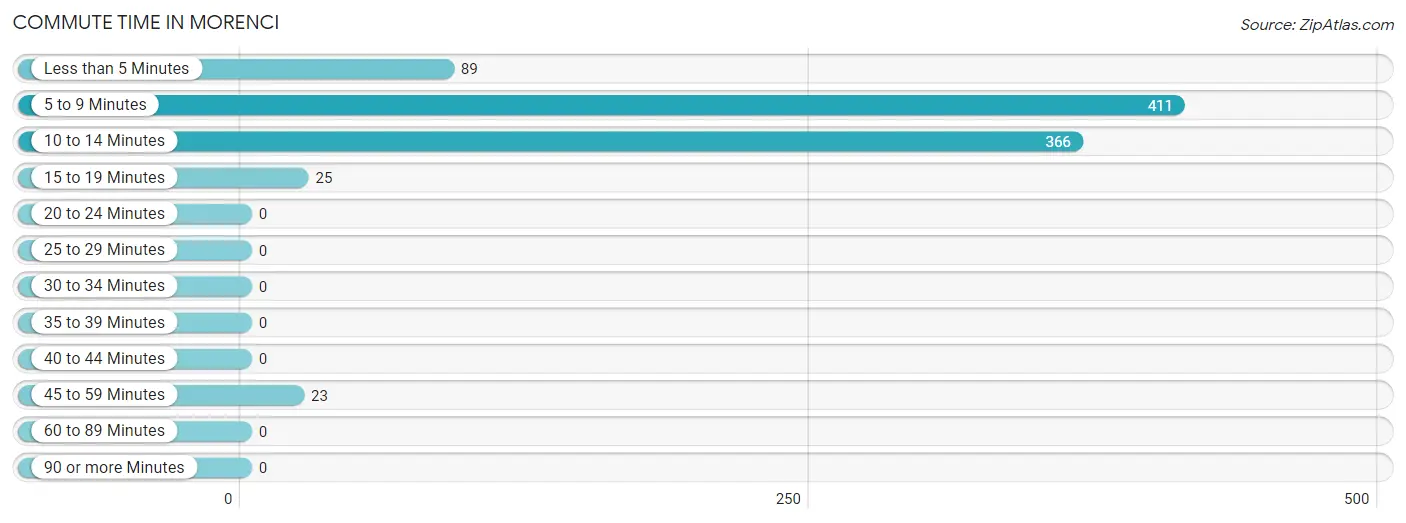
Commute Time in Morenci
The most frequently occuring commute durations in Morenci are 5 to 9 minutes (411 commuters, 45.0%), 10 to 14 minutes (366 commuters, 40.0%), and less than 5 minutes (89 commuters, 9.7%).
| Commute Time | # Commuters | % Commuters |
| Less than 5 Minutes | 89 | 9.7% |
| 5 to 9 Minutes | 411 | 45.0% |
| 10 to 14 Minutes | 366 | 40.0% |
| 15 to 19 Minutes | 25 | 2.7% |
| 20 to 24 Minutes | 0 | 0.0% |
| 25 to 29 Minutes | 0 | 0.0% |
| 30 to 34 Minutes | 0 | 0.0% |
| 35 to 39 Minutes | 0 | 0.0% |
| 40 to 44 Minutes | 0 | 0.0% |
| 45 to 59 Minutes | 23 | 2.5% |
| 60 to 89 Minutes | 0 | 0.0% |
| 90 or more Minutes | 0 | 0.0% |
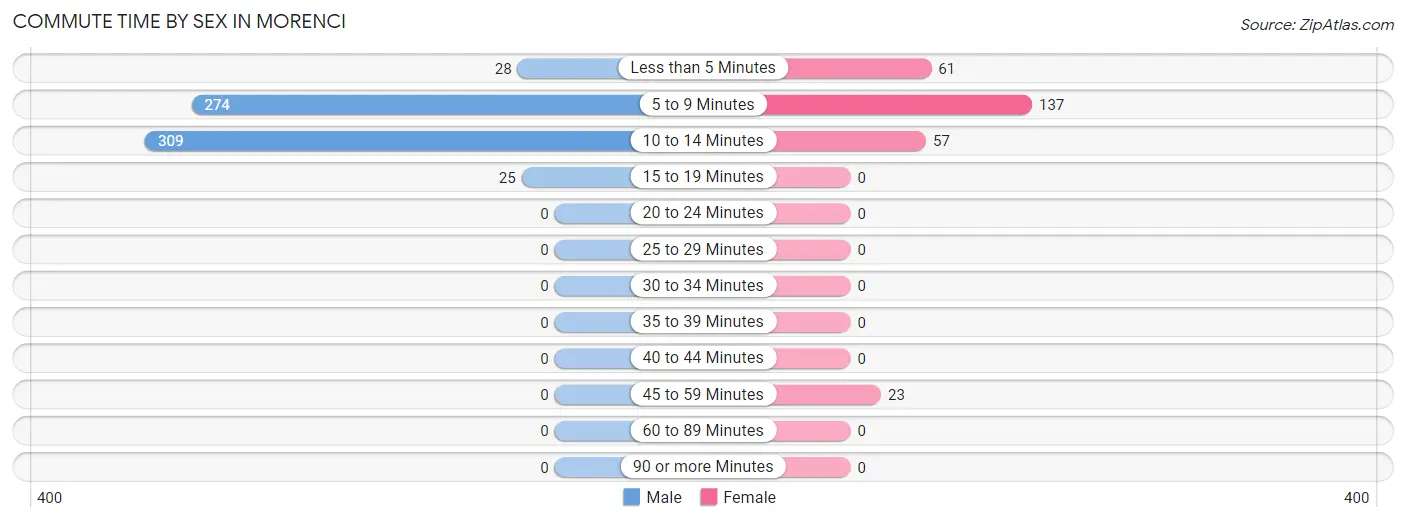
Commute Time by Sex in Morenci
The most common commute times in Morenci are 10 to 14 minutes (309 commuters, 48.6%) for males and 5 to 9 minutes (137 commuters, 49.3%) for females.
| Commute Time | Male | Female |
| Less than 5 Minutes | 28 (4.4%) | 61 (21.9%) |
| 5 to 9 Minutes | 274 (43.1%) | 137 (49.3%) |
| 10 to 14 Minutes | 309 (48.6%) | 57 (20.5%) |
| 15 to 19 Minutes | 25 (3.9%) | 0 (0.0%) |
| 20 to 24 Minutes | 0 (0.0%) | 0 (0.0%) |
| 25 to 29 Minutes | 0 (0.0%) | 0 (0.0%) |
| 30 to 34 Minutes | 0 (0.0%) | 0 (0.0%) |
| 35 to 39 Minutes | 0 (0.0%) | 0 (0.0%) |
| 40 to 44 Minutes | 0 (0.0%) | 0 (0.0%) |
| 45 to 59 Minutes | 0 (0.0%) | 23 (8.3%) |
| 60 to 89 Minutes | 0 (0.0%) | 0 (0.0%) |
| 90 or more Minutes | 0 (0.0%) | 0 (0.0%) |
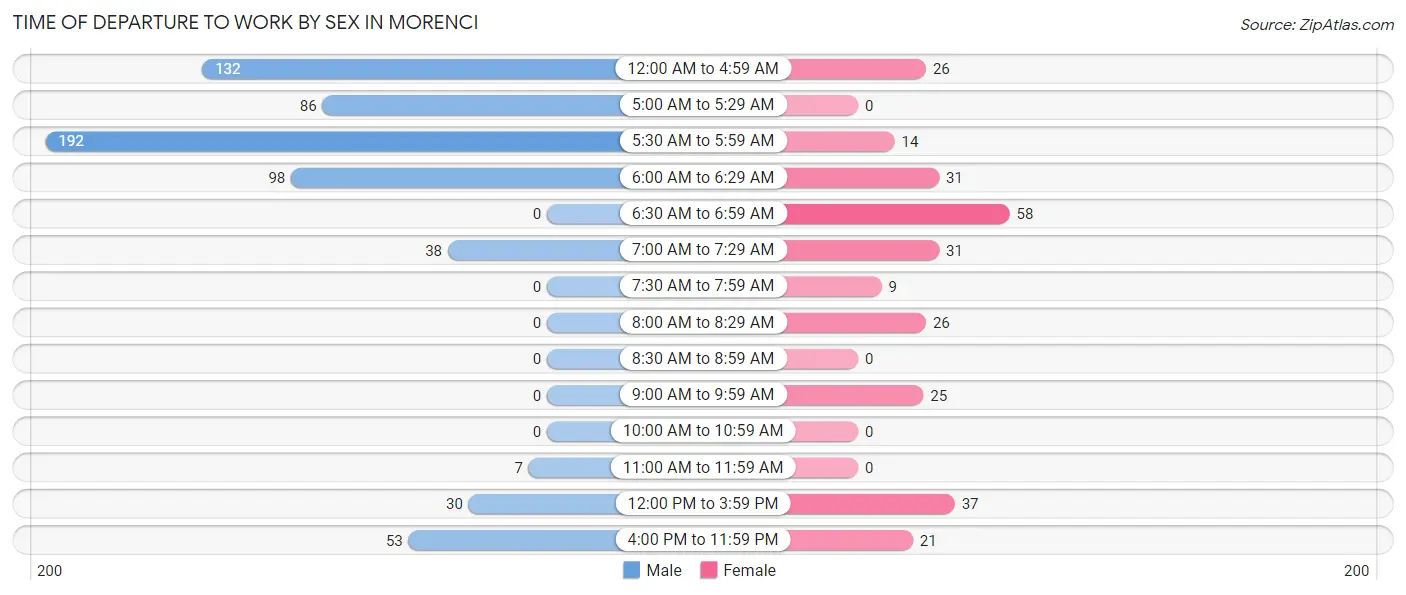
Time of Departure to Work by Sex in Morenci
The most frequent times of departure to work in Morenci are 5:30 AM to 5:59 AM (192, 30.2%) for males and 6:30 AM to 6:59 AM (58, 20.9%) for females.
| Time of Departure | Male | Female |
| 12:00 AM to 4:59 AM | 132 (20.7%) | 26 (9.3%) |
| 5:00 AM to 5:29 AM | 86 (13.5%) | 0 (0.0%) |
| 5:30 AM to 5:59 AM | 192 (30.2%) | 14 (5.0%) |
| 6:00 AM to 6:29 AM | 98 (15.4%) | 31 (11.2%) |
| 6:30 AM to 6:59 AM | 0 (0.0%) | 58 (20.9%) |
| 7:00 AM to 7:29 AM | 38 (6.0%) | 31 (11.2%) |
| 7:30 AM to 7:59 AM | 0 (0.0%) | 9 (3.2%) |
| 8:00 AM to 8:29 AM | 0 (0.0%) | 26 (9.3%) |
| 8:30 AM to 8:59 AM | 0 (0.0%) | 0 (0.0%) |
| 9:00 AM to 9:59 AM | 0 (0.0%) | 25 (9.0%) |
| 10:00 AM to 10:59 AM | 0 (0.0%) | 0 (0.0%) |
| 11:00 AM to 11:59 AM | 7 (1.1%) | 0 (0.0%) |
| 12:00 PM to 3:59 PM | 30 (4.7%) | 37 (13.3%) |
| 4:00 PM to 11:59 PM | 53 (8.3%) | 21 (7.5%) |
| Total | 636 (100.0%) | 278 (100.0%) |
Housing Occupancy in Morenci
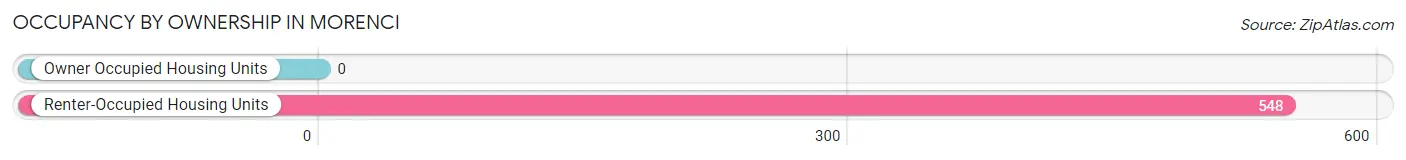
Occupancy by Ownership in Morenci
Of the total 548 dwellings in Morenci, owner-occupied units account for 0 (0.0%), while renter-occupied units make up 548 (100.0%).
| Occupancy | # Housing Units | % Housing Units |
| Owner Occupied Housing Units | 0 | 0.0% |
| Renter-Occupied Housing Units | 548 | 100.0% |
| Total Occupied Housing Units | 548 | 100.0% |
Occupancy by Household Size in Morenci
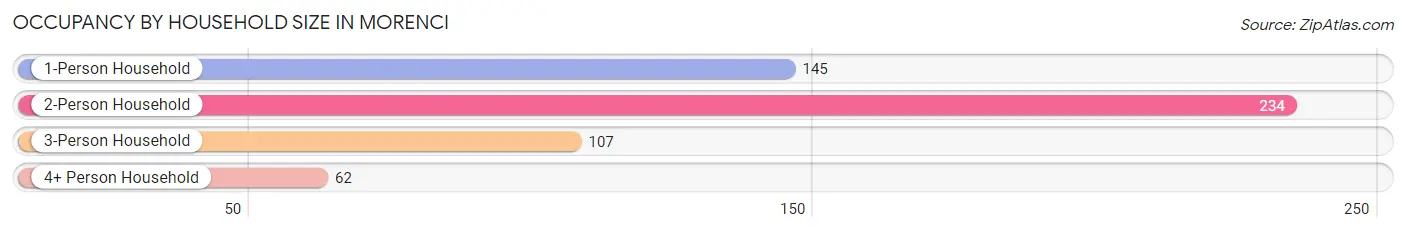
| Household Size | # Housing Units | % Housing Units |
| 1-Person Household | 145 | 26.5% |
| 2-Person Household | 234 | 42.7% |
| 3-Person Household | 107 | 19.5% |
| 4+ Person Household | 62 | 11.3% |
| Total Housing Units | 548 | 100.0% |
Occupancy by Ownership by Household Size in Morenci
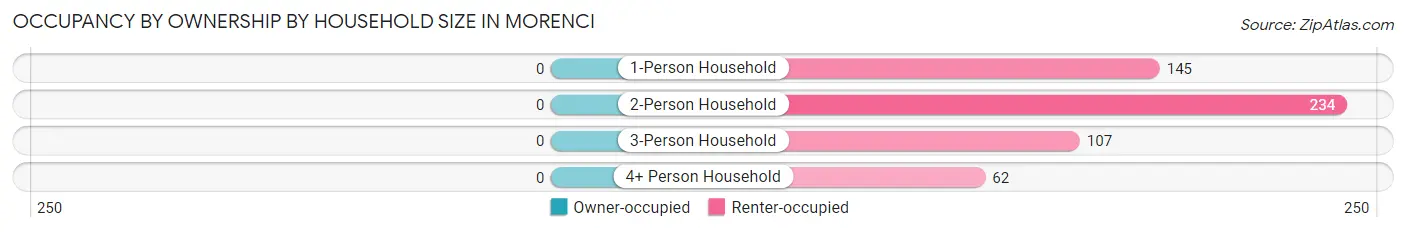
| Household Size | Owner-occupied | Renter-occupied |
| 1-Person Household | 0 (0.0%) | 145 (100.0%) |
| 2-Person Household | 0 (0.0%) | 234 (100.0%) |
| 3-Person Household | 0 (0.0%) | 107 (100.0%) |
| 4+ Person Household | 0 (0.0%) | 62 (100.0%) |
| Total Housing Units | 0 (0.0%) | 548 (100.0%) |
Occupancy by Educational Attainment in Morenci
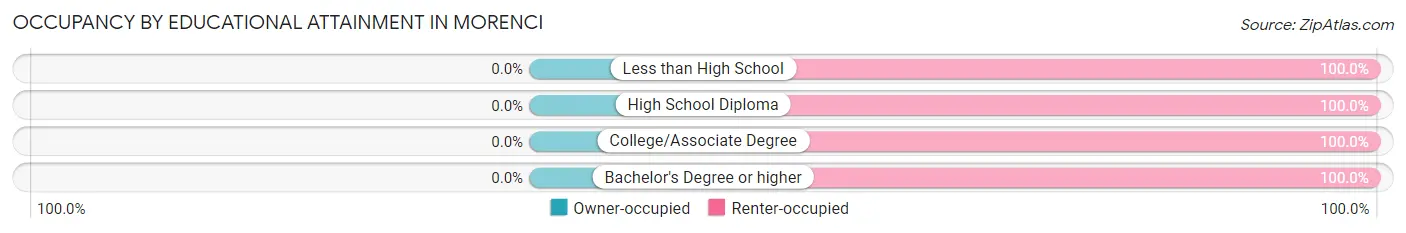
| Household Size | Owner-occupied | Renter-occupied |
| Less than High School | 0 (0.0%) | 67 (100.0%) |
| High School Diploma | 0 (0.0%) | 201 (100.0%) |
| College/Associate Degree | 0 (0.0%) | 170 (100.0%) |
| Bachelor's Degree or higher | 0 (0.0%) | 110 (100.0%) |
Occupancy by Age of Householder in Morenci
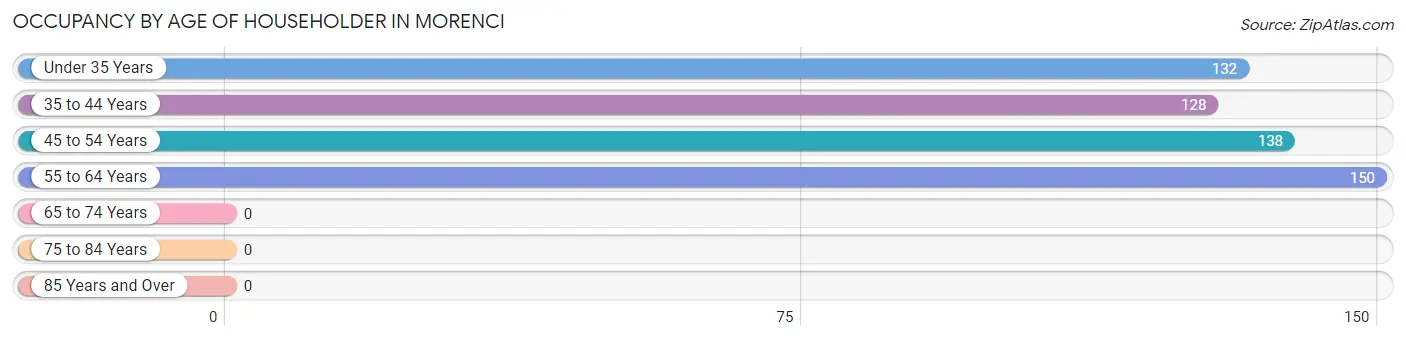
| Age Bracket | # Households | % Households |
| Under 35 Years | 132 | 24.1% |
| 35 to 44 Years | 128 | 23.4% |
| 45 to 54 Years | 138 | 25.2% |
| 55 to 64 Years | 150 | 27.4% |
| 65 to 74 Years | 0 | 0.0% |
| 75 to 84 Years | 0 | 0.0% |
| 85 Years and Over | 0 | 0.0% |
| Total | 548 | 100.0% |
Housing Finances in Morenci
Median Income by Occupancy in Morenci
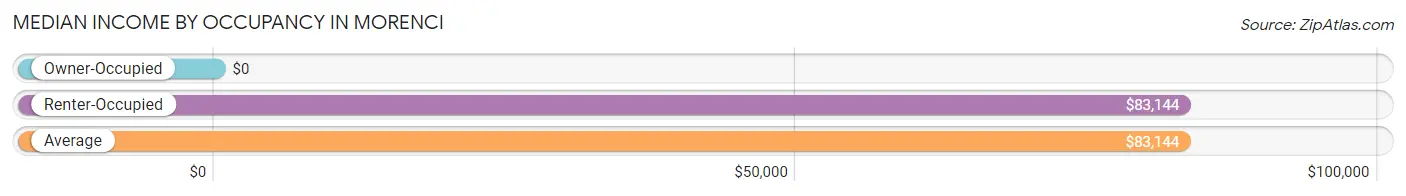
| Occupancy Type | # Households | Median Income |
| Owner-Occupied | 0 (0.0%) | $0 |
| Renter-Occupied | 548 (100.0%) | $83,144 |
| Average | 548 (100.0%) | $83,144 |
Occupancy by Householder Income Bracket in Morenci
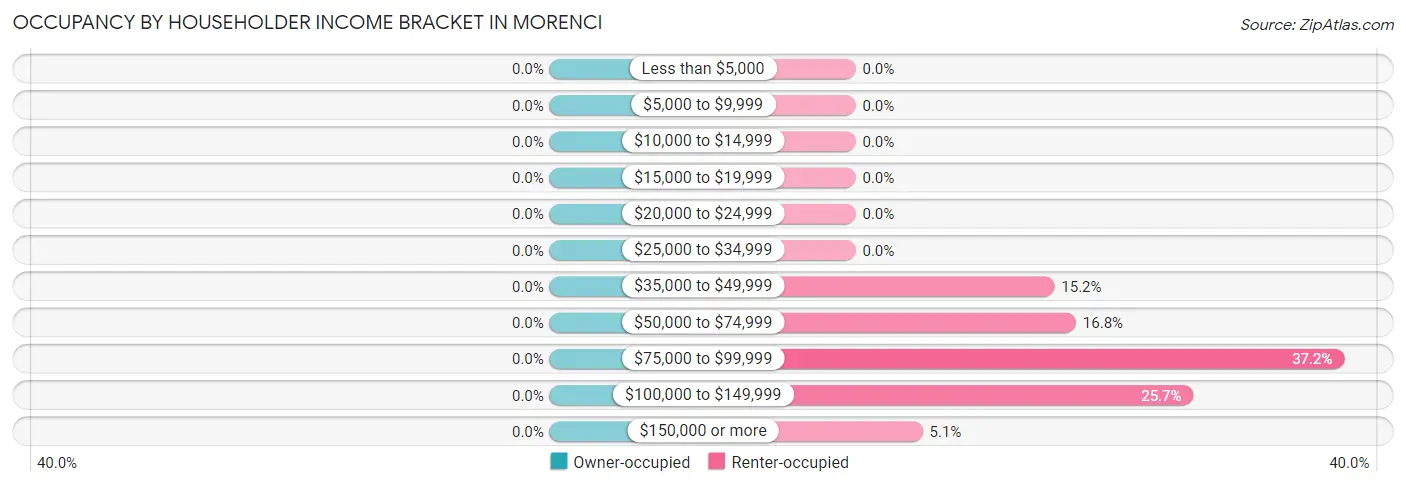
| Income Bracket | Owner-occupied | Renter-occupied |
| Less than $5,000 | 0 (0.0%) | 0 (0.0%) |
| $5,000 to $9,999 | 0 (0.0%) | 0 (0.0%) |
| $10,000 to $14,999 | 0 (0.0%) | 0 (0.0%) |
| $15,000 to $19,999 | 0 (0.0%) | 0 (0.0%) |
| $20,000 to $24,999 | 0 (0.0%) | 0 (0.0%) |
| $25,000 to $34,999 | 0 (0.0%) | 0 (0.0%) |
| $35,000 to $49,999 | 0 (0.0%) | 83 (15.1%) |
| $50,000 to $74,999 | 0 (0.0%) | 92 (16.8%) |
| $75,000 to $99,999 | 0 (0.0%) | 204 (37.2%) |
| $100,000 to $149,999 | 0 (0.0%) | 141 (25.7%) |
| $150,000 or more | 0 (0.0%) | 28 (5.1%) |
| Total | 0 (0.0%) | 548 (100.0%) |
Monthly Housing Cost Tiers in Morenci
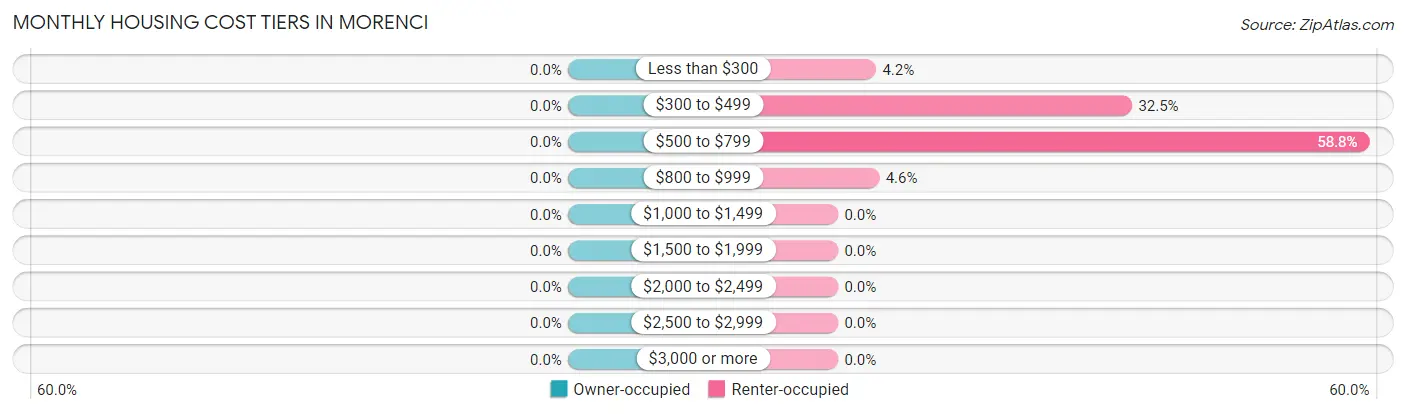
| Monthly Cost | Owner-occupied | Renter-occupied |
| Less than $300 | 0 (0.0%) | 23 (4.2%) |
| $300 to $499 | 0 (0.0%) | 178 (32.5%) |
| $500 to $799 | 0 (0.0%) | 322 (58.8%) |
| $800 to $999 | 0 (0.0%) | 25 (4.6%) |
| $1,000 to $1,499 | 0 (0.0%) | 0 (0.0%) |
| $1,500 to $1,999 | 0 (0.0%) | 0 (0.0%) |
| $2,000 to $2,499 | 0 (0.0%) | 0 (0.0%) |
| $2,500 to $2,999 | 0 (0.0%) | 0 (0.0%) |
| $3,000 or more | 0 (0.0%) | 0 (0.0%) |
| Total | 0 (0.0%) | 548 (100.0%) |
Physical Housing Characteristics in Morenci
Housing Structures in Morenci
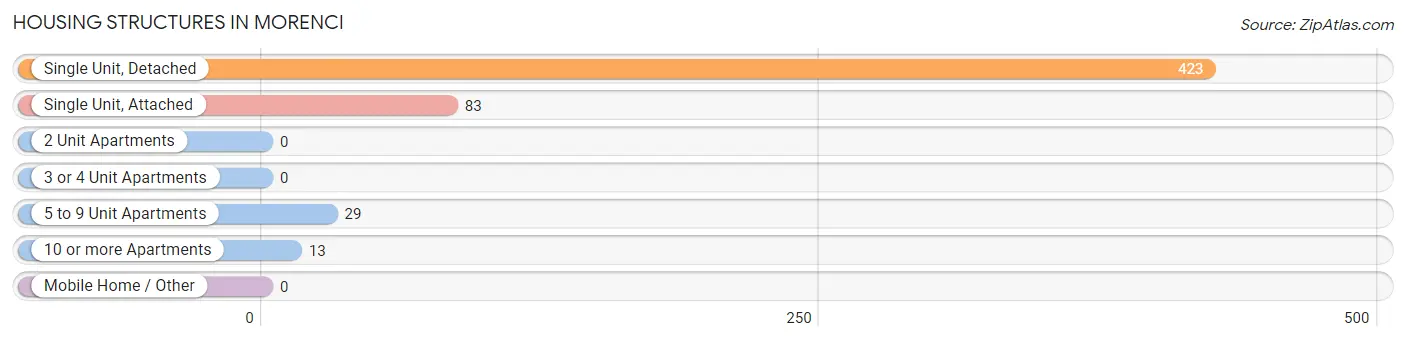
| Structure Type | # Housing Units | % Housing Units |
| Single Unit, Detached | 423 | 77.2% |
| Single Unit, Attached | 83 | 15.1% |
| 2 Unit Apartments | 0 | 0.0% |
| 3 or 4 Unit Apartments | 0 | 0.0% |
| 5 to 9 Unit Apartments | 29 | 5.3% |
| 10 or more Apartments | 13 | 2.4% |
| Mobile Home / Other | 0 | 0.0% |
| Total | 548 | 100.0% |
Housing Structures by Occupancy in Morenci
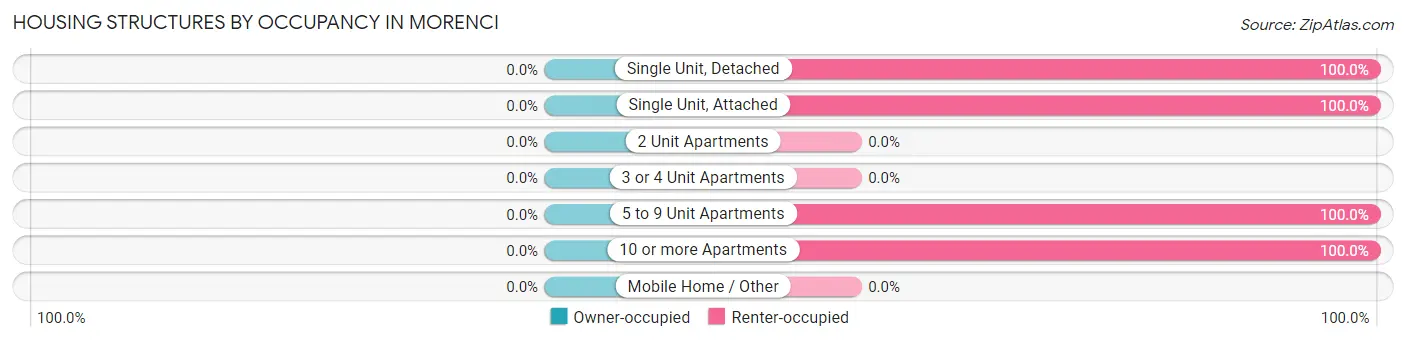
| Structure Type | Owner-occupied | Renter-occupied |
| Single Unit, Detached | 0 (0.0%) | 423 (100.0%) |
| Single Unit, Attached | 0 (0.0%) | 83 (100.0%) |
| 2 Unit Apartments | 0 (0.0%) | 0 (0.0%) |
| 3 or 4 Unit Apartments | 0 (0.0%) | 0 (0.0%) |
| 5 to 9 Unit Apartments | 0 (0.0%) | 29 (100.0%) |
| 10 or more Apartments | 0 (0.0%) | 13 (100.0%) |
| Mobile Home / Other | 0 (0.0%) | 0 (0.0%) |
| Total | 0 (0.0%) | 548 (100.0%) |
Housing Structures by Number of Rooms in Morenci
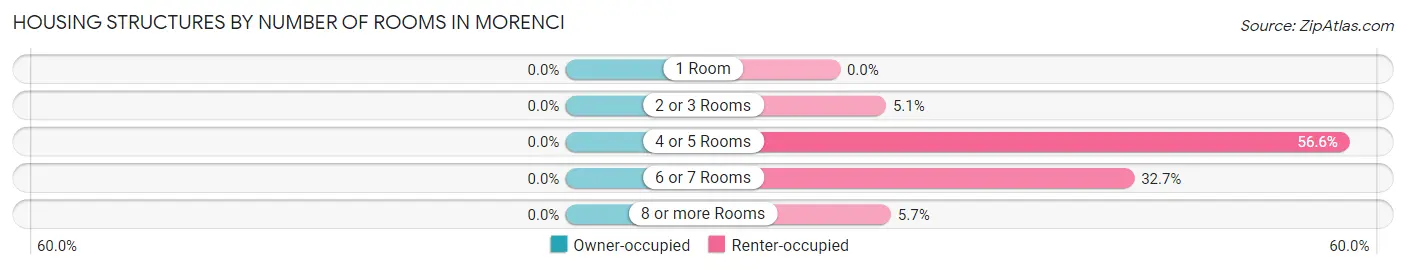
| Number of Rooms | Owner-occupied | Renter-occupied |
| 1 Room | 0 (0.0%) | 0 (0.0%) |
| 2 or 3 Rooms | 0 (0.0%) | 28 (5.1%) |
| 4 or 5 Rooms | 0 (0.0%) | 310 (56.6%) |
| 6 or 7 Rooms | 0 (0.0%) | 179 (32.7%) |
| 8 or more Rooms | 0 (0.0%) | 31 (5.7%) |
| Total | 0 (0.0%) | 548 (100.0%) |
Housing Structure by Heating Type in Morenci
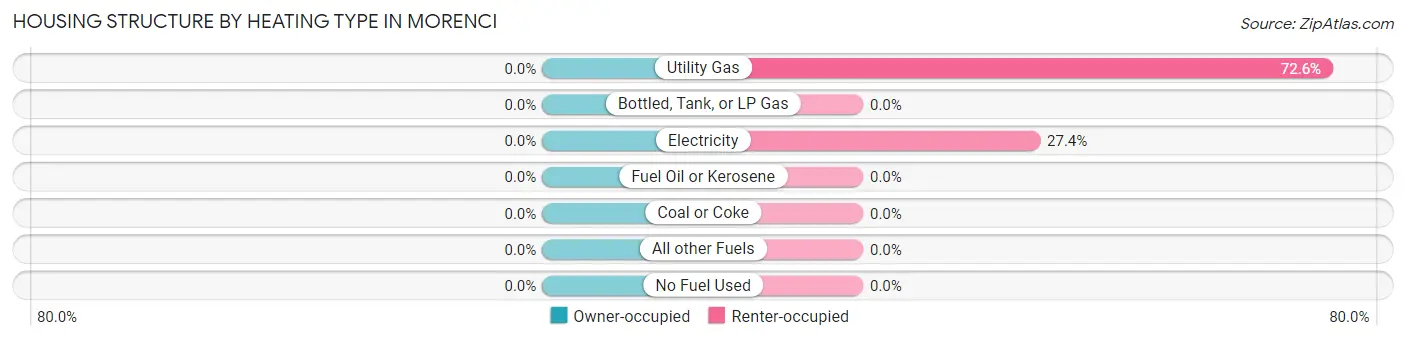
| Heating Type | Owner-occupied | Renter-occupied |
| Utility Gas | 0 (0.0%) | 398 (72.6%) |
| Bottled, Tank, or LP Gas | 0 (0.0%) | 0 (0.0%) |
| Electricity | 0 (0.0%) | 150 (27.4%) |
| Fuel Oil or Kerosene | 0 (0.0%) | 0 (0.0%) |
| Coal or Coke | 0 (0.0%) | 0 (0.0%) |
| All other Fuels | 0 (0.0%) | 0 (0.0%) |
| No Fuel Used | 0 (0.0%) | 0 (0.0%) |
| Total | 0 (0.0%) | 548 (100.0%) |
Household Vehicle Usage in Morenci
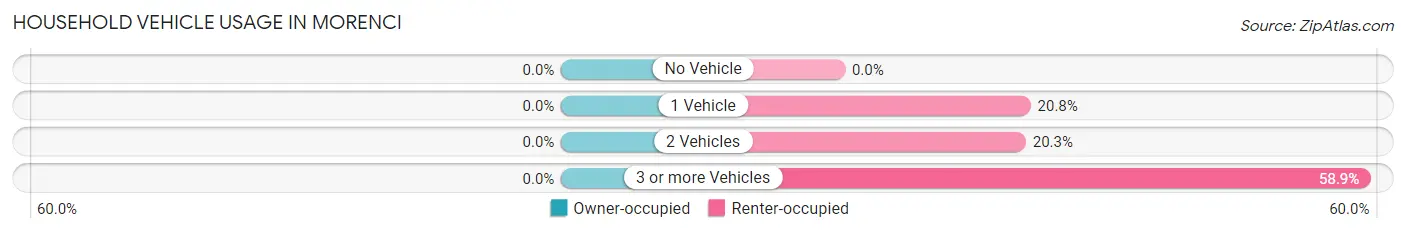
| Vehicles per Household | Owner-occupied | Renter-occupied |
| No Vehicle | 0 (0.0%) | 0 (0.0%) |
| 1 Vehicle | 0 (0.0%) | 114 (20.8%) |
| 2 Vehicles | 0 (0.0%) | 111 (20.3%) |
| 3 or more Vehicles | 0 (0.0%) | 323 (58.9%) |
| Total | 0 (0.0%) | 548 (100.0%) |
Real Estate & Mortgages in Morenci
Real Estate and Mortgage Overview in Morenci
| Characteristic | Without Mortgage | With Mortgage |
| Housing Units | 0 | 0 |
| Median Property Value | - | - |
| Median Household Income | - | - |
| Monthly Housing Costs | - | - |
| Real Estate Taxes | - | - |
Property Value by Mortgage Status in Morenci
| Property Value | Without Mortgage | With Mortgage |
| Less than $50,000 | 0 (0.0%) | 0 (0.0%) |
| $50,000 to $99,999 | 0 (0.0%) | 0 (0.0%) |
| $100,000 to $299,999 | 0 (0.0%) | 0 (0.0%) |
| $300,000 to $499,999 | 0 (0.0%) | 0 (0.0%) |
| $500,000 to $749,999 | 0 (0.0%) | 0 (0.0%) |
| $750,000 to $999,999 | 0 (0.0%) | 0 (0.0%) |
| $1,000,000 or more | 0 (0.0%) | 0 (0.0%) |
| Total | 0 (0.0%) | 0 (0.0%) |
Household Income by Mortgage Status in Morenci
| Household Income | Without Mortgage | With Mortgage |
| Less than $10,000 | 0 (0.0%) | 0 (0.0%) |
| $10,000 to $24,999 | 0 (0.0%) | 0 (0.0%) |
| $25,000 to $34,999 | 0 (0.0%) | 0 (0.0%) |
| $35,000 to $49,999 | 0 (0.0%) | 0 (0.0%) |
| $50,000 to $74,999 | 0 (0.0%) | 0 (0.0%) |
| $75,000 to $99,999 | 0 (0.0%) | 0 (0.0%) |
| $100,000 to $149,999 | 0 (0.0%) | 0 (0.0%) |
| $150,000 or more | 0 (0.0%) | 0 (0.0%) |
| Total | 0 (0.0%) | 0 (0.0%) |
Property Value to Household Income Ratio in Morenci

| Value-to-Income Ratio | Without Mortgage | With Mortgage |
| Less than 2.0x | 0 (0.0%) | 0 (0.0%) |
| 2.0x to 2.9x | 0 (0.0%) | 0 (0.0%) |
| 3.0x to 3.9x | 0 (0.0%) | 0 (0.0%) |
| 4.0x or more | 0 (0.0%) | 0 (0.0%) |
| Total | 0 (0.0%) | 0 (0.0%) |
Real Estate Taxes by Mortgage Status in Morenci
| Property Taxes | Without Mortgage | With Mortgage |
| Less than $800 | 0 (0.0%) | 0 (0.0%) |
| $800 to $1,499 | 0 (0.0%) | 0 (0.0%) |
| $800 to $1,499 | 0 (0.0%) | 0 (0.0%) |
| Total | 0 (0.0%) | 0 (0.0%) |
Health & Disability in Morenci
Health Insurance Coverage by Age in Morenci
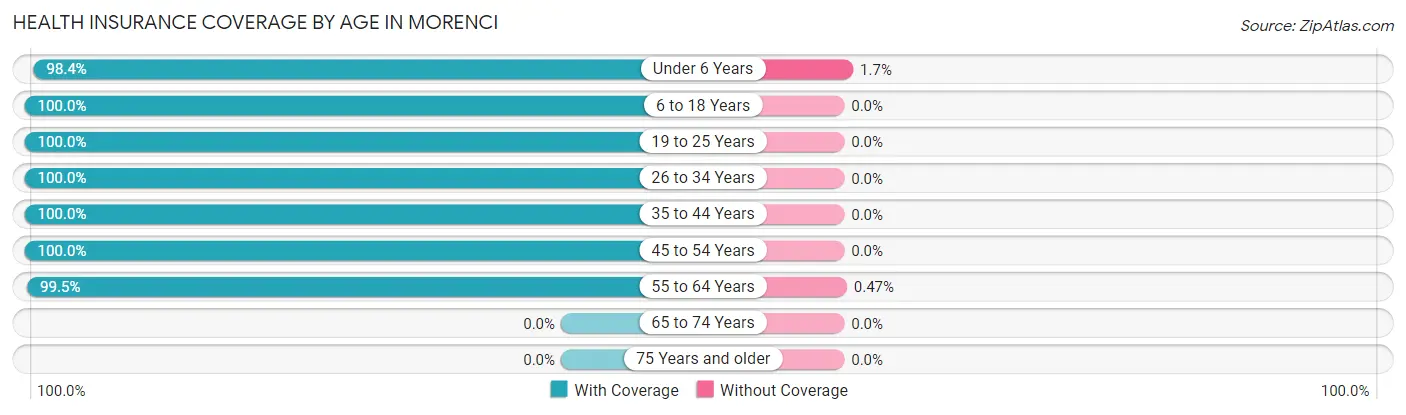
| Age Bracket | With Coverage | Without Coverage |
| Under 6 Years | 119 (98.4%) | 2 (1.7%) |
| 6 to 18 Years | 200 (100.0%) | 0 (0.0%) |
| 19 to 25 Years | 262 (100.0%) | 0 (0.0%) |
| 26 to 34 Years | 203 (100.0%) | 0 (0.0%) |
| 35 to 44 Years | 245 (100.0%) | 0 (0.0%) |
| 45 to 54 Years | 224 (100.0%) | 0 (0.0%) |
| 55 to 64 Years | 211 (99.5%) | 1 (0.5%) |
| 65 to 74 Years | 0 (0.0%) | 0 (0.0%) |
| 75 Years and older | 0 (0.0%) | 0 (0.0%) |
| Total | 1,464 (99.8%) | 3 (0.2%) |
Health Insurance Coverage by Citizenship Status in Morenci
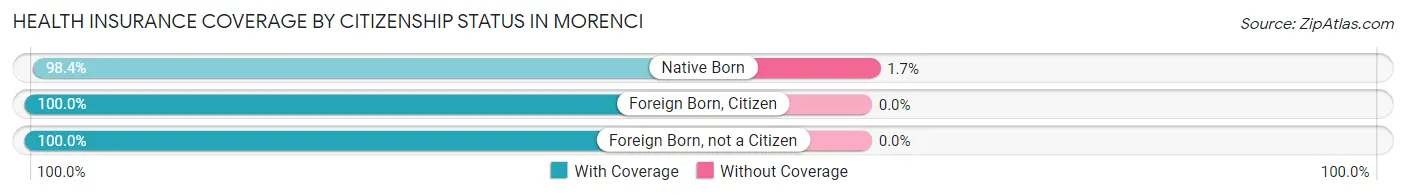
| Citizenship Status | With Coverage | Without Coverage |
| Native Born | 119 (98.4%) | 2 (1.7%) |
| Foreign Born, Citizen | 200 (100.0%) | 0 (0.0%) |
| Foreign Born, not a Citizen | 262 (100.0%) | 0 (0.0%) |
Health Insurance Coverage by Household Income in Morenci
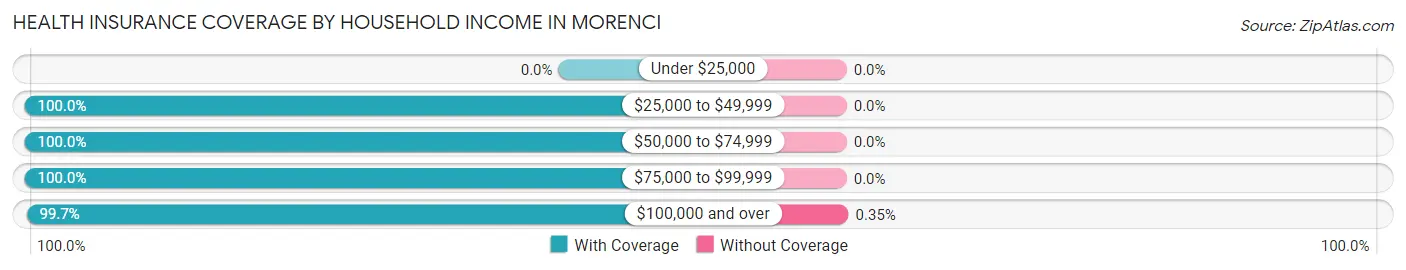
| Household Income | With Coverage | Without Coverage |
| Under $25,000 | 0 (0.0%) | 0 (0.0%) |
| $25,000 to $49,999 | 114 (100.0%) | 0 (0.0%) |
| $50,000 to $74,999 | 264 (100.0%) | 0 (0.0%) |
| $75,000 to $99,999 | 517 (100.0%) | 0 (0.0%) |
| $100,000 and over | 564 (99.7%) | 2 (0.4%) |
Public vs Private Health Insurance Coverage by Age in Morenci
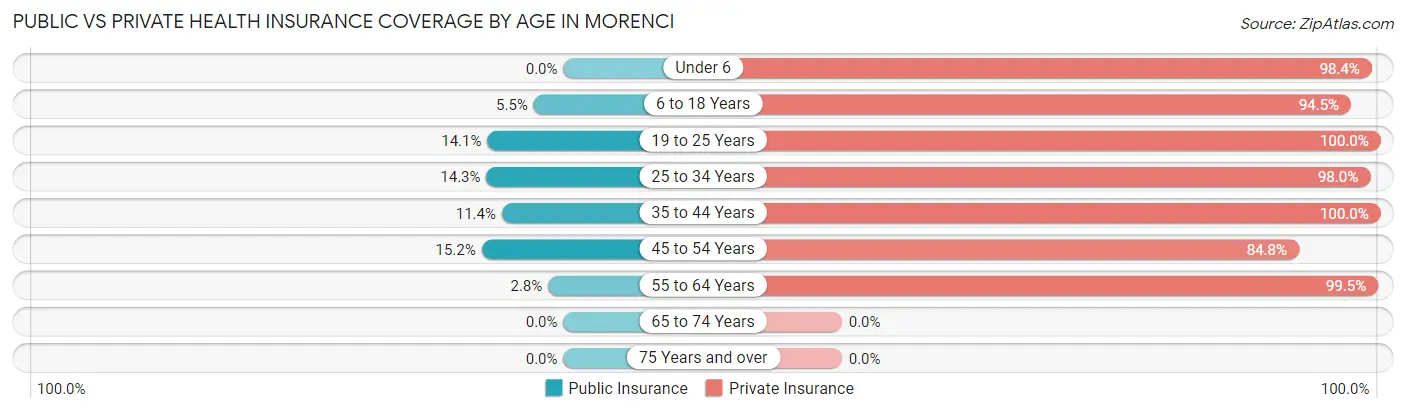
| Age Bracket | Public Insurance | Private Insurance |
| Under 6 | 0 (0.0%) | 119 (98.4%) |
| 6 to 18 Years | 11 (5.5%) | 189 (94.5%) |
| 19 to 25 Years | 37 (14.1%) | 262 (100.0%) |
| 25 to 34 Years | 29 (14.3%) | 199 (98.0%) |
| 35 to 44 Years | 28 (11.4%) | 245 (100.0%) |
| 45 to 54 Years | 34 (15.2%) | 190 (84.8%) |
| 55 to 64 Years | 6 (2.8%) | 211 (99.5%) |
| 65 to 74 Years | 0 (0.0%) | 0 (0.0%) |
| 75 Years and over | 0 (0.0%) | 0 (0.0%) |
| Total | 145 (9.9%) | 1,415 (96.5%) |
Disability Status by Sex by Age in Morenci
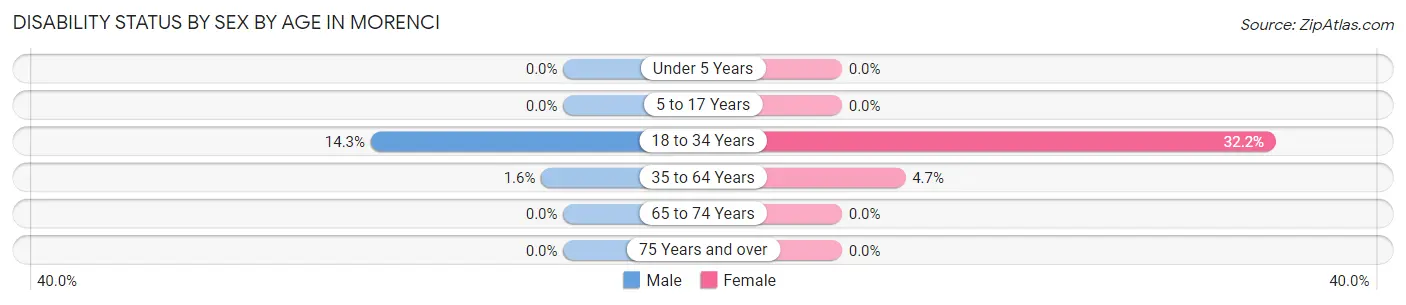
| Age Bracket | Male | Female |
| Under 5 Years | 0 (0.0%) | 0 (0.0%) |
| 5 to 17 Years | 0 (0.0%) | 0 (0.0%) |
| 18 to 34 Years | 37 (14.3%) | 68 (32.2%) |
| 35 to 64 Years | 7 (1.6%) | 12 (4.7%) |
| 65 to 74 Years | 0 (0.0%) | 0 (0.0%) |
| 75 Years and over | 0 (0.0%) | 0 (0.0%) |
Disability Class by Sex by Age in Morenci
Disability Class: Hearing Difficulty
| Age Bracket | Male | Female |
| Under 5 Years | 0 (0.0%) | 0 (0.0%) |
| 5 to 17 Years | 0 (0.0%) | 0 (0.0%) |
| 18 to 34 Years | 0 (0.0%) | 0 (0.0%) |
| 35 to 64 Years | 0 (0.0%) | 0 (0.0%) |
| 65 to 74 Years | 0 (0.0%) | 0 (0.0%) |
| 75 Years and over | 0 (0.0%) | 0 (0.0%) |
Disability Class: Vision Difficulty
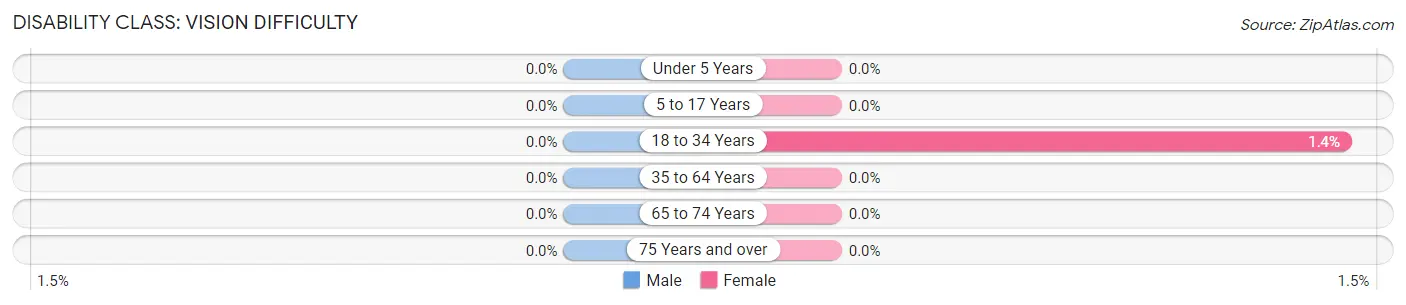
| Age Bracket | Male | Female |
| Under 5 Years | 0 (0.0%) | 0 (0.0%) |
| 5 to 17 Years | 0 (0.0%) | 0 (0.0%) |
| 18 to 34 Years | 0 (0.0%) | 3 (1.4%) |
| 35 to 64 Years | 0 (0.0%) | 0 (0.0%) |
| 65 to 74 Years | 0 (0.0%) | 0 (0.0%) |
| 75 Years and over | 0 (0.0%) | 0 (0.0%) |
Disability Class: Cognitive Difficulty
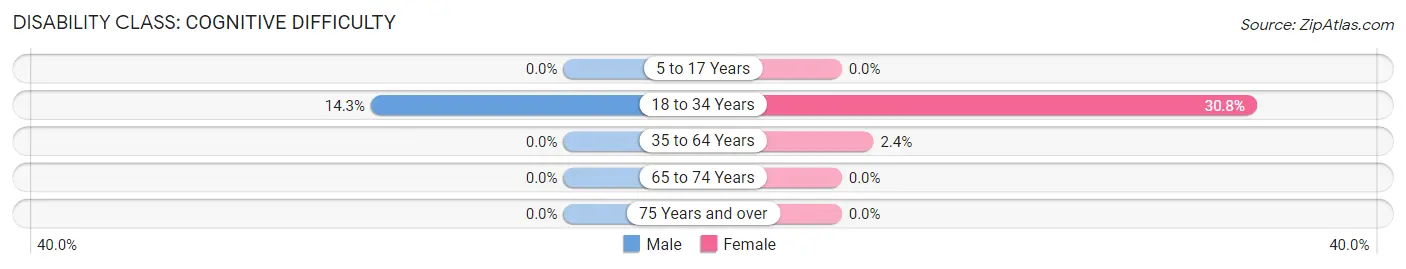
| Age Bracket | Male | Female |
| 5 to 17 Years | 0 (0.0%) | 0 (0.0%) |
| 18 to 34 Years | 37 (14.3%) | 65 (30.8%) |
| 35 to 64 Years | 0 (0.0%) | 6 (2.4%) |
| 65 to 74 Years | 0 (0.0%) | 0 (0.0%) |
| 75 Years and over | 0 (0.0%) | 0 (0.0%) |
Disability Class: Ambulatory Difficulty
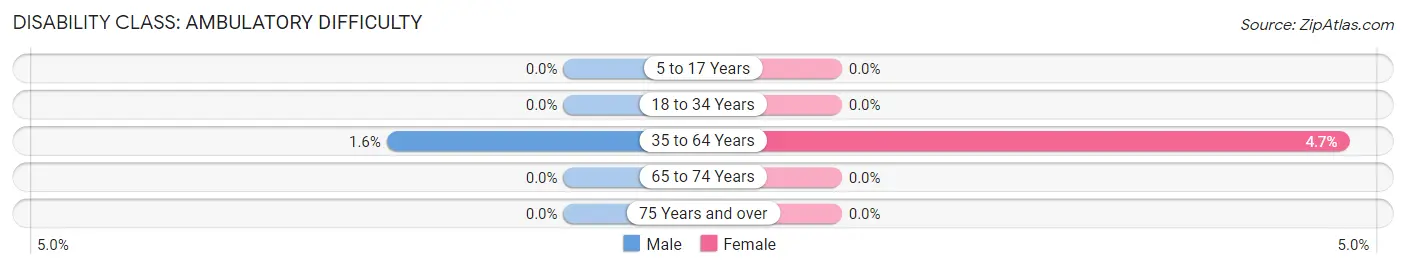
| Age Bracket | Male | Female |
| 5 to 17 Years | 0 (0.0%) | 0 (0.0%) |
| 18 to 34 Years | 0 (0.0%) | 0 (0.0%) |
| 35 to 64 Years | 7 (1.6%) | 12 (4.7%) |
| 65 to 74 Years | 0 (0.0%) | 0 (0.0%) |
| 75 Years and over | 0 (0.0%) | 0 (0.0%) |
Disability Class: Self-Care Difficulty
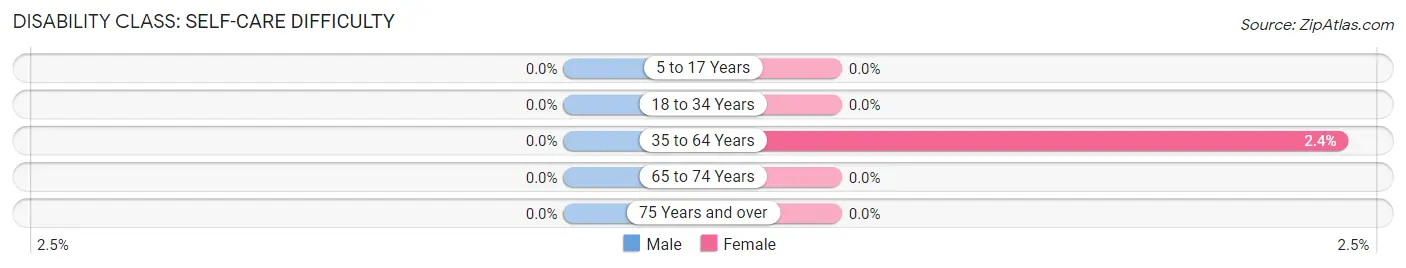
| Age Bracket | Male | Female |
| 5 to 17 Years | 0 (0.0%) | 0 (0.0%) |
| 18 to 34 Years | 0 (0.0%) | 0 (0.0%) |
| 35 to 64 Years | 0 (0.0%) | 6 (2.4%) |
| 65 to 74 Years | 0 (0.0%) | 0 (0.0%) |
| 75 Years and over | 0 (0.0%) | 0 (0.0%) |
Technology Access in Morenci
Computing Device Access in Morenci
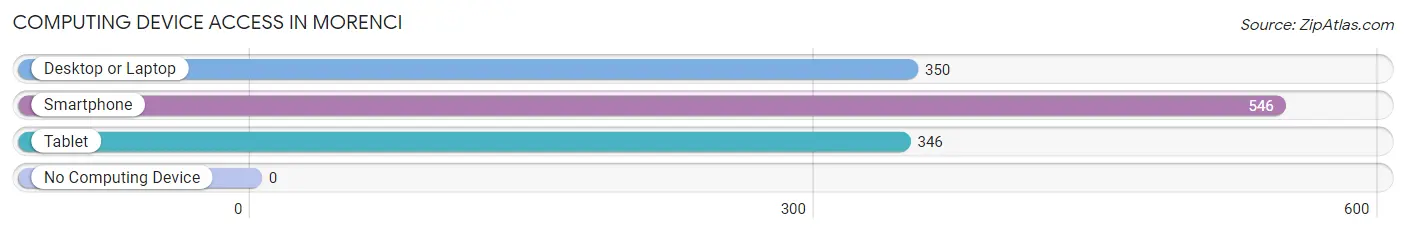
| Device Type | # Households | % Households |
| Desktop or Laptop | 350 | 63.9% |
| Smartphone | 546 | 99.6% |
| Tablet | 346 | 63.1% |
| No Computing Device | 0 | 0.0% |
| Total | 548 | 100.0% |
Internet Access in Morenci
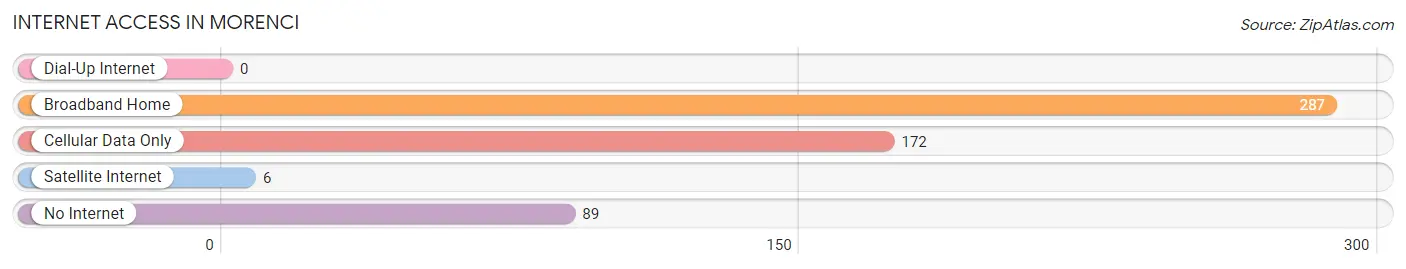
| Internet Type | # Households | % Households |
| Dial-Up Internet | 0 | 0.0% |
| Broadband Home | 287 | 52.4% |
| Cellular Data Only | 172 | 31.4% |
| Satellite Internet | 6 | 1.1% |
| No Internet | 89 | 16.2% |
| Total | 548 | 100.0% |
Morenci Summary
Morenci, Arizona is a small town located in the southeastern corner of the state, near the New Mexico border. It is the largest town in Greenlee County, with a population of 2,837 as of the 2010 census. The town is situated in the foothills of the Coronado National Forest, and is surrounded by mountains and canyons.
History
Morenci was founded in 1872 by a group of miners from nearby Clifton, Arizona. The town was named after the nearby Morenci Mine, which was discovered in 1872 by a group of prospectors. The mine was named after the nearby Morenci Mountains, which were named after the Spanish word for “black”. The town quickly grew as the mine became one of the largest copper producers in the world. By the early 1900s, Morenci had become a bustling mining town with a population of over 5,000.
The town experienced a period of decline in the mid-1900s as the copper industry began to decline. The population dropped to just over 2,000 by the 1980s. However, the town has since experienced a resurgence as the copper industry has rebounded. The population has grown to over 2,800 as of the 2010 census.
Geography
Morenci is located in the southeastern corner of Arizona, near the New Mexico border. The town is situated in the foothills of the Coronado National Forest, and is surrounded by mountains and canyons. The town is located at an elevation of 4,945 feet, and has a total area of 4.2 square miles.
The climate in Morenci is semi-arid, with hot summers and mild winters. The average high temperature in the summer is 95 degrees Fahrenheit, and the average low temperature in the winter is 32 degrees Fahrenheit. The town receives an average of 11 inches of precipitation per year.
Economy
Morenci’s economy is largely based on the copper mining industry. The town is home to the Morenci Mine, which is one of the largest copper producers in the world. The mine is owned by Freeport-McMoRan, and employs over 2,000 people. The town is also home to several other businesses, including a lumber mill, a sawmill, and a smelter.
Demographics
As of the 2010 census, Morenci had a population of 2,837. The racial makeup of the town was 75.3% White, 0.7% African American, 1.2% Native American, 0.2% Asian, 0.1% Pacific Islander, 19.3% from other races, and 3.2% from two or more races. Hispanic or Latino of any race were 44.2% of the population.
The median household income in Morenci was $31,250, and the median family income was $35,417. The per capita income for the town was $14,945. About 18.2% of the population was below the poverty line.
Morenci is served by the Morenci Unified School District, which includes two elementary schools, one middle school, and one high school. The town is also home to a branch of Eastern Arizona College.
Common Questions
What is the Total Population of Morenci?
Total Population of Morenci is 1,467.
What is the Total Male Population of Morenci?
Total Male Population of Morenci is 766.
What is the Total Female Population of Morenci?
Total Female Population of Morenci is 701.
What is the Ratio of Males per 100 Females in Morenci?
There are 109.27 Males per 100 Females in Morenci.
What is the Ratio of Females per 100 Males in Morenci?
There are 91.51 Females per 100 Males in Morenci.
What is the Median Population Age in Morenci?
Median Population Age in Morenci is 31.2 Years.
What is the Average Family Size in Morenci
Average Family Size in Morenci is 3.5 People.
What is the Average Household Size in Morenci
Average Household Size in Morenci is 2.7 People.
What is Per Capita Income in Morenci?
Per Capita income in Morenci is $34,656.
What is the Median Family Income in Morenci?
Median Family Income in Morenci is $95,000.
What is the Median Household income in Morenci?
Median Household Income in Morenci is $83,144.
What is Income or Wage Gap in Morenci?
Income or Wage Gap in Morenci is 38.0%.
Women in Morenci earn 62.0 cents for every dollar earned by a man.
What is Inequality or Gini Index in Morenci?
Inequality or Gini Index in Morenci is 0.20.
How Large is the Labor Force in Morenci?
There are 958 People in the Labor Forcein in Morenci.
What is the Percentage of People in the Labor Force in Morenci?
83.2% of People are in the Labor Force in Morenci.
What is the Unemployment Rate in Morenci?
Unemployment Rate in Morenci is 4.5%.