Sahuarita, AZ
Sahuarita Map
Sahuarita Overview
34,238
TOTAL POPULATION
16,620
MALE POPULATION
17,618
FEMALE POPULATION
94.34
MALES / 100 FEMALES
106.00
FEMALES / 100 MALES
37.1
MEDIAN AGE
3.4
AVG FAMILY SIZE
2.9
AVG HOUSEHOLD SIZE
$38,226
PER CAPITA INCOME
$104,834
AVG FAMILY INCOME
$97,133
AVG HOUSEHOLD INCOME
44.9%
WAGE / INCOME GAP [ % ]
55.1¢/ $1
WAGE / INCOME GAP [ $ ]
0.39
INEQUALITY / GINI INDEX
14,368
LABOR FORCE [ PEOPLE ]
56.1%
PERCENT IN LABOR FORCE
6.7%
UNEMPLOYMENT RATE
Sahuarita Zip Codes
Sahuarita Area Codes
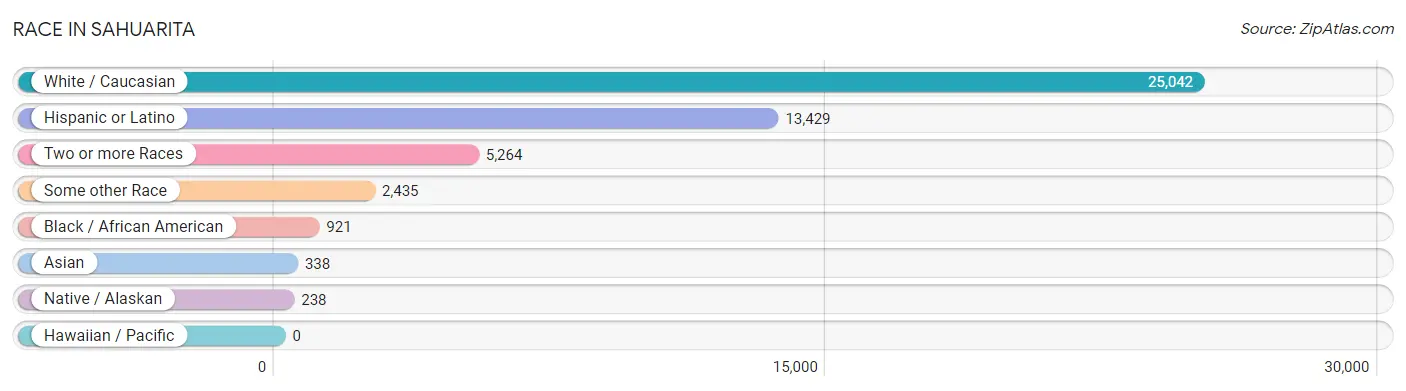
Race in Sahuarita
The most populous races in Sahuarita are White / Caucasian (25,042 | 73.1%), Hispanic or Latino (13,429 | 39.2%), and Two or more Races (5,264 | 15.4%).
| Race | # Population | % Population |
| Asian | 338 | 1.0% |
| Black / African American | 921 | 2.7% |
| Hawaiian / Pacific | 0 | 0.0% |
| Hispanic or Latino | 13,429 | 39.2% |
| Native / Alaskan | 238 | 0.7% |
| White / Caucasian | 25,042 | 73.1% |
| Two or more Races | 5,264 | 15.4% |
| Some other Race | 2,435 | 7.1% |
| Total | 34,238 | 100.0% |
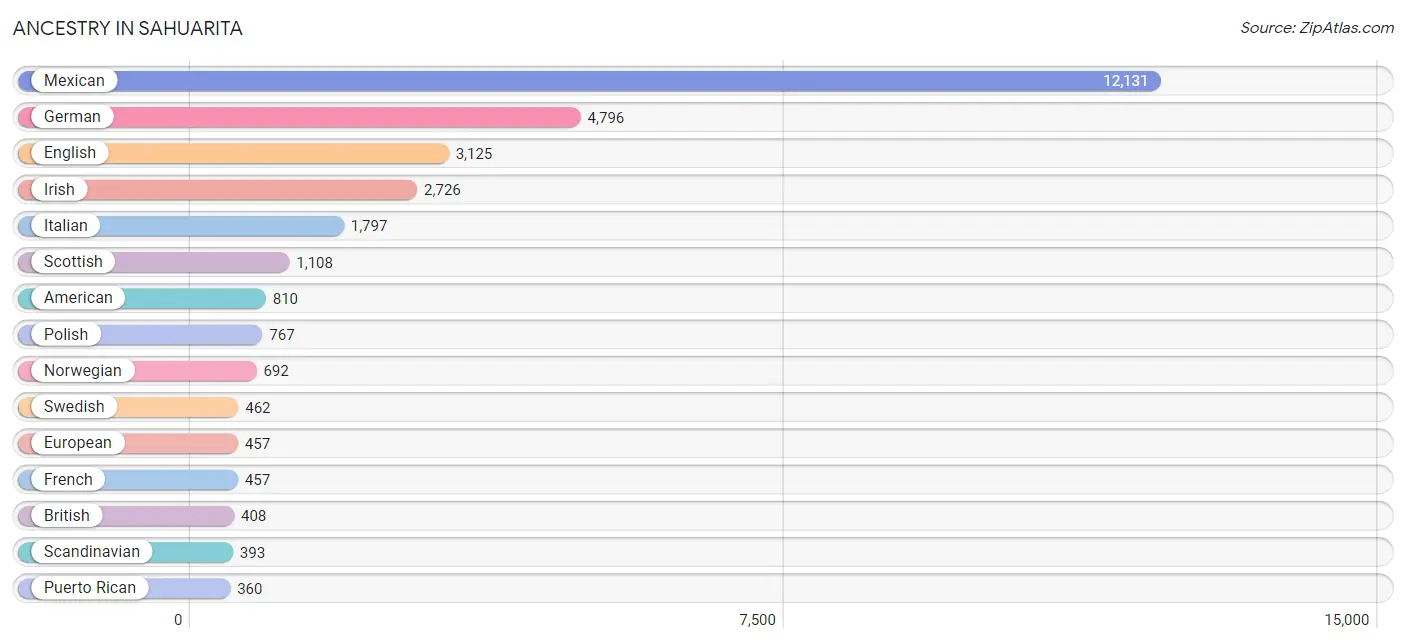
Ancestry in Sahuarita
The most populous ancestries reported in Sahuarita are Mexican (12,131 | 35.4%), German (4,796 | 14.0%), English (3,125 | 9.1%), Irish (2,726 | 8.0%), and Italian (1,797 | 5.2%), together accounting for 71.8% of all Sahuarita residents.
| Ancestry | # Population | % Population |
| African | 40 | 0.1% |
| American | 810 | 2.4% |
| Apache | 56 | 0.2% |
| Arab | 12 | 0.0% |
| Australian | 4 | 0.0% |
| Austrian | 74 | 0.2% |
| Basque | 12 | 0.0% |
| Bhutanese | 119 | 0.4% |
| Bolivian | 40 | 0.1% |
| Brazilian | 11 | 0.0% |
| British | 408 | 1.2% |
| British West Indian | 71 | 0.2% |
| Burmese | 24 | 0.1% |
| Canadian | 26 | 0.1% |
| Celtic | 23 | 0.1% |
| Central American | 19 | 0.1% |
| Central American Indian | 49 | 0.1% |
| Cherokee | 144 | 0.4% |
| Cheyenne | 48 | 0.1% |
| Chippewa | 14 | 0.0% |
| Colombian | 81 | 0.2% |
| Croatian | 135 | 0.4% |
| Cuban | 118 | 0.3% |
| Czech | 48 | 0.1% |
| Czechoslovakian | 37 | 0.1% |
| Danish | 171 | 0.5% |
| Dominican | 324 | 0.9% |
| Dutch | 265 | 0.8% |
| Eastern European | 94 | 0.3% |
| Ecuadorian | 89 | 0.3% |
| English | 3,125 | 9.1% |
| European | 457 | 1.3% |
| Filipino | 144 | 0.4% |
| Finnish | 104 | 0.3% |
| French | 457 | 1.3% |
| French Canadian | 119 | 0.4% |
| German | 4,796 | 14.0% |
| Greek | 174 | 0.5% |
| Guatemalan | 12 | 0.0% |
| Hungarian | 24 | 0.1% |
| Icelander | 14 | 0.0% |
| Indian (Asian) | 90 | 0.3% |
| Inupiat | 59 | 0.2% |
| Iranian | 108 | 0.3% |
| Irish | 2,726 | 8.0% |
| Italian | 1,797 | 5.2% |
| Korean | 152 | 0.4% |
| Lebanese | 12 | 0.0% |
| Lithuanian | 22 | 0.1% |
| Mexican | 12,131 | 35.4% |
| Native Hawaiian | 47 | 0.1% |
| Navajo | 21 | 0.1% |
| Nigerian | 7 | 0.0% |
| Northern European | 36 | 0.1% |
| Norwegian | 692 | 2.0% |
| Pakistani | 11 | 0.0% |
| Panamanian | 7 | 0.0% |
| Polish | 767 | 2.2% |
| Portuguese | 108 | 0.3% |
| Pueblo | 80 | 0.2% |
| Puerto Rican | 360 | 1.1% |
| Romanian | 16 | 0.1% |
| Russian | 250 | 0.7% |
| Scandinavian | 393 | 1.1% |
| Scotch-Irish | 201 | 0.6% |
| Scottish | 1,108 | 3.2% |
| Serbian | 14 | 0.0% |
| Slovak | 60 | 0.2% |
| South American | 218 | 0.6% |
| Spaniard | 78 | 0.2% |
| Spanish | 49 | 0.1% |
| Sri Lankan | 17 | 0.1% |
| Subsaharan African | 113 | 0.3% |
| Swedish | 462 | 1.3% |
| Swiss | 10 | 0.0% |
| Tlingit-Haida | 18 | 0.1% |
| Tohono O'Odham | 192 | 0.6% |
| Trinidadian and Tobagonian | 27 | 0.1% |
| Turkish | 12 | 0.0% |
| Ukrainian | 59 | 0.2% |
| Venezuelan | 8 | 0.0% |
| Welsh | 199 | 0.6% |
| Yaqui | 93 | 0.3% | View All 83 Rows |
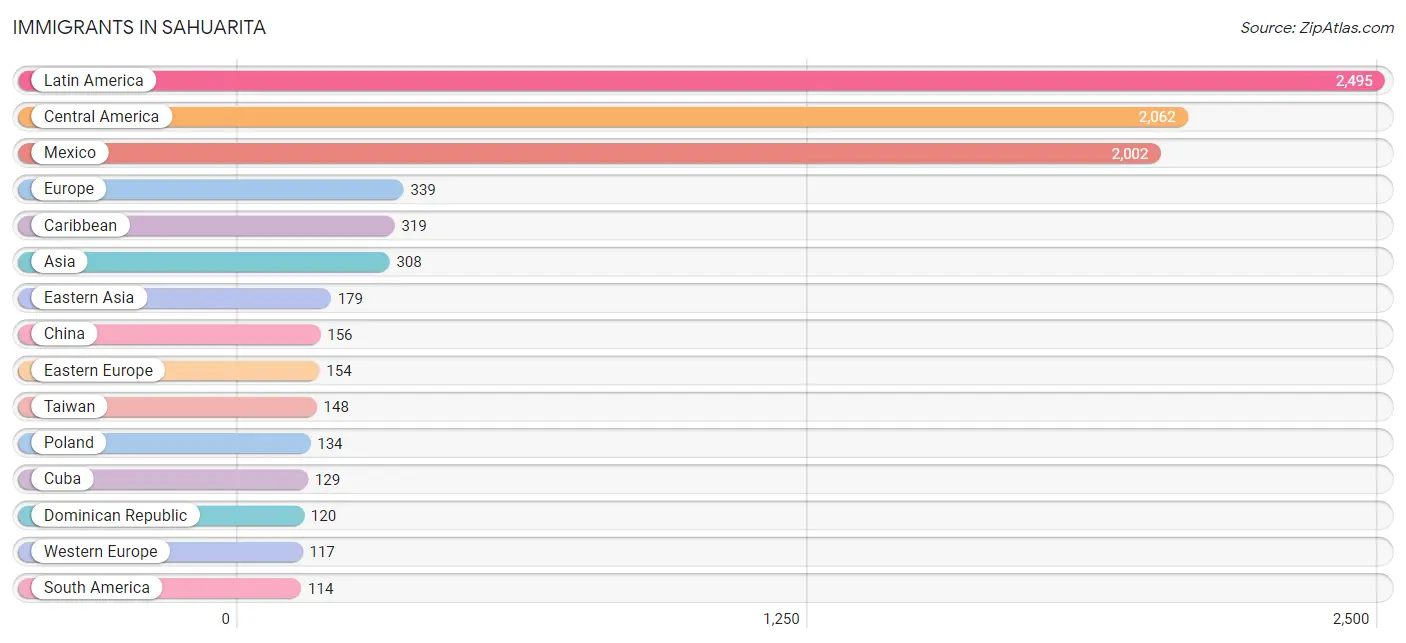
Immigrants in Sahuarita
The most numerous immigrant groups reported in Sahuarita came from Latin America (2,495 | 7.3%), Central America (2,062 | 6.0%), Mexico (2,002 | 5.9%), Europe (339 | 1.0%), and Caribbean (319 | 0.9%), together accounting for 21.1% of all Sahuarita residents.
| Immigration Origin | # Population | % Population |
| Africa | 103 | 0.3% |
| Asia | 308 | 0.9% |
| Austria | 37 | 0.1% |
| Bolivia | 40 | 0.1% |
| Brazil | 11 | 0.0% |
| Canada | 73 | 0.2% |
| Caribbean | 319 | 0.9% |
| Central America | 2,062 | 6.0% |
| China | 156 | 0.5% |
| Colombia | 28 | 0.1% |
| Croatia | 20 | 0.1% |
| Cuba | 129 | 0.4% |
| Dominican Republic | 120 | 0.4% |
| Eastern Africa | 43 | 0.1% |
| Eastern Asia | 179 | 0.5% |
| Eastern Europe | 154 | 0.4% |
| Ecuador | 20 | 0.1% |
| El Salvador | 48 | 0.1% |
| England | 25 | 0.1% |
| Europe | 339 | 1.0% |
| Germany | 80 | 0.2% |
| Guatemala | 12 | 0.0% |
| Iran | 62 | 0.2% |
| Italy | 13 | 0.0% |
| Japan | 12 | 0.0% |
| Korea | 11 | 0.0% |
| Latin America | 2,495 | 7.3% |
| Mexico | 2,002 | 5.9% |
| Middle Africa | 28 | 0.1% |
| Northern Europe | 55 | 0.2% |
| Peru | 15 | 0.0% |
| Philippines | 36 | 0.1% |
| Poland | 134 | 0.4% |
| Scotland | 7 | 0.0% |
| Singapore | 8 | 0.0% |
| South Africa | 32 | 0.1% |
| South America | 114 | 0.3% |
| South Central Asia | 74 | 0.2% |
| South Eastern Asia | 55 | 0.2% |
| Southern Europe | 13 | 0.0% |
| Sri Lanka | 12 | 0.0% |
| Taiwan | 148 | 0.4% |
| Trinidad and Tobago | 58 | 0.2% |
| Vietnam | 11 | 0.0% |
| Western Europe | 117 | 0.3% |
| Zaire | 28 | 0.1% | View All 46 Rows |
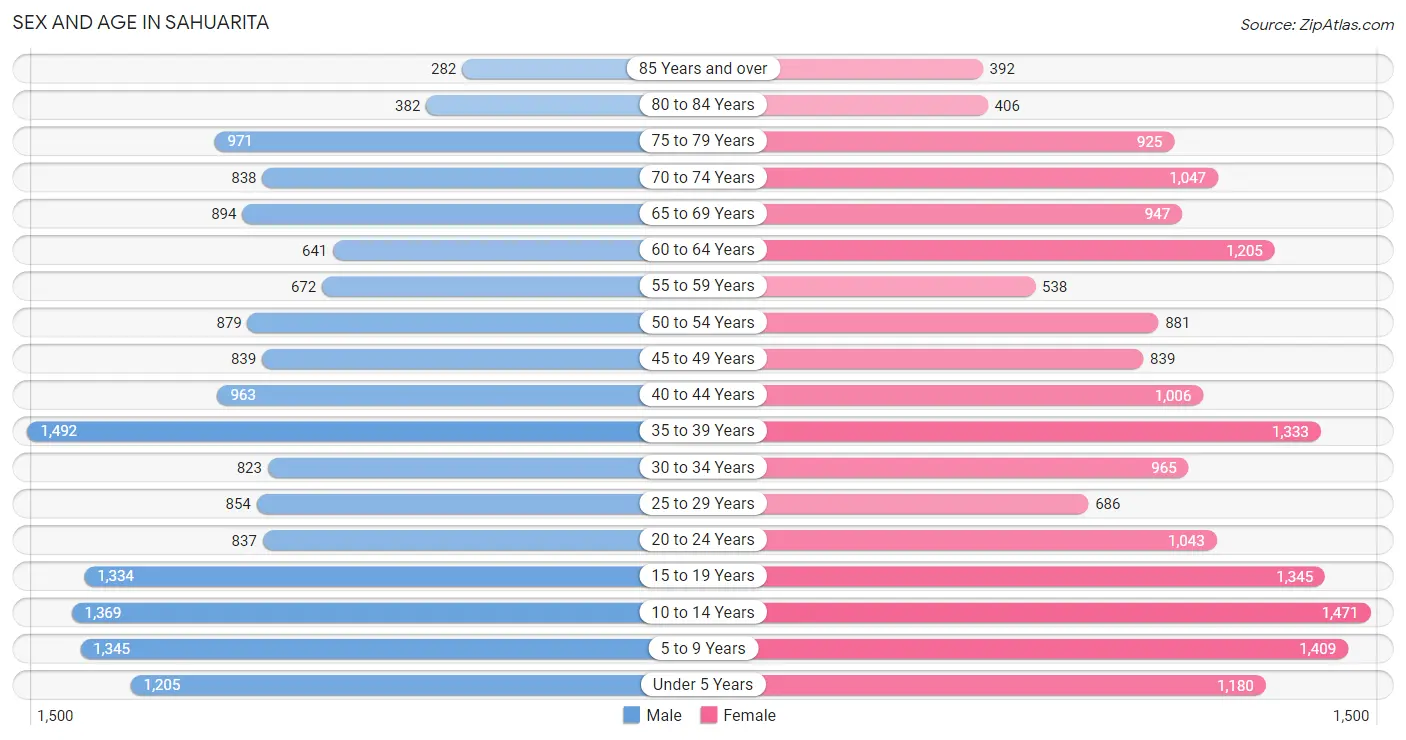
Sex and Age in Sahuarita
Sex and Age in Sahuarita
The most populous age groups in Sahuarita are 35 to 39 Years (1,492 | 9.0%) for men and 10 to 14 Years (1,471 | 8.4%) for women.
| Age Bracket | Male | Female |
| Under 5 Years | 1,205 (7.2%) | 1,180 (6.7%) |
| 5 to 9 Years | 1,345 (8.1%) | 1,409 (8.0%) |
| 10 to 14 Years | 1,369 (8.2%) | 1,471 (8.4%) |
| 15 to 19 Years | 1,334 (8.0%) | 1,345 (7.6%) |
| 20 to 24 Years | 837 (5.0%) | 1,043 (5.9%) |
| 25 to 29 Years | 854 (5.1%) | 686 (3.9%) |
| 30 to 34 Years | 823 (5.0%) | 965 (5.5%) |
| 35 to 39 Years | 1,492 (9.0%) | 1,333 (7.6%) |
| 40 to 44 Years | 963 (5.8%) | 1,006 (5.7%) |
| 45 to 49 Years | 839 (5.1%) | 839 (4.8%) |
| 50 to 54 Years | 879 (5.3%) | 881 (5.0%) |
| 55 to 59 Years | 672 (4.0%) | 538 (3.0%) |
| 60 to 64 Years | 641 (3.9%) | 1,205 (6.8%) |
| 65 to 69 Years | 894 (5.4%) | 947 (5.4%) |
| 70 to 74 Years | 838 (5.0%) | 1,047 (5.9%) |
| 75 to 79 Years | 971 (5.8%) | 925 (5.2%) |
| 80 to 84 Years | 382 (2.3%) | 406 (2.3%) |
| 85 Years and over | 282 (1.7%) | 392 (2.2%) |
| Total | 16,620 (100.0%) | 17,618 (100.0%) |
Families and Households in Sahuarita
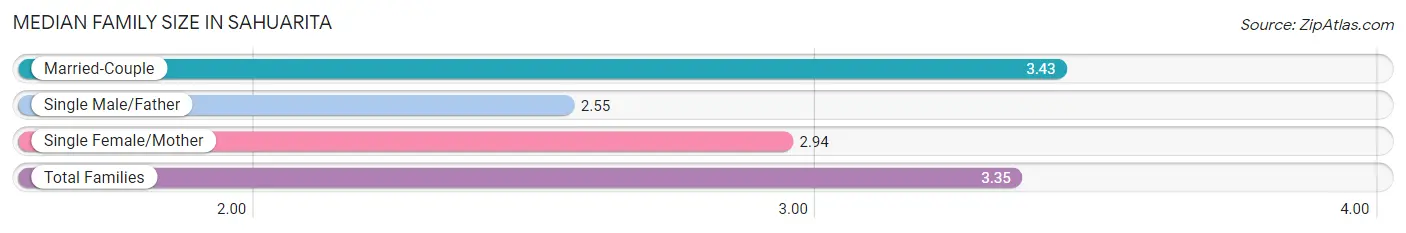
Median Family Size in Sahuarita
The median family size in Sahuarita is 3.35 persons per family, with married-couple families (7,775 | 86.4%) accounting for the largest median family size of 3.43 persons per family. On the other hand, single male/father families (370 | 4.1%) represent the smallest median family size with 2.55 persons per family.
| Family Type | # Families | Family Size |
| Married-Couple | 7,775 (86.4%) | 3.43 |
| Single Male/Father | 370 (4.1%) | 2.55 |
| Single Female/Mother | 851 (9.5%) | 2.94 |
| Total Families | 8,996 (100.0%) | 3.35 |
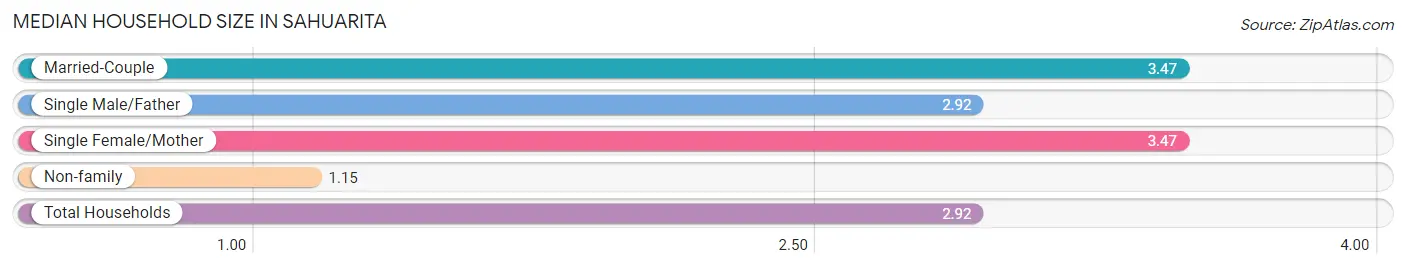
Median Household Size in Sahuarita
The median household size in Sahuarita is 2.92 persons per household, with married-couple households (7,775 | 66.5%) accounting for the largest median household size of 3.47 persons per household. non-family households (2,702 | 23.1%) represent the smallest median household size with 1.15 persons per household.
| Household Type | # Households | Household Size |
| Married-Couple | 7,775 (66.5%) | 3.47 |
| Single Male/Father | 370 (3.2%) | 2.92 |
| Single Female/Mother | 851 (7.3%) | 3.47 |
| Non-family | 2,702 (23.1%) | 1.15 |
| Total Households | 11,698 (100.0%) | 2.92 |
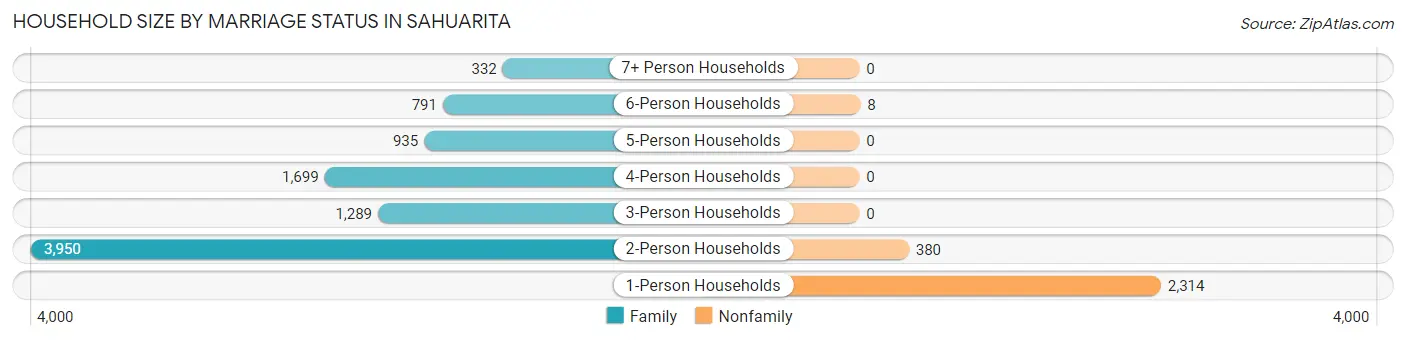
Household Size by Marriage Status in Sahuarita
Out of a total of 11,698 households in Sahuarita, 8,996 (76.9%) are family households, while 2,702 (23.1%) are nonfamily households. The most numerous type of family households are 2-person households, comprising 3,950, and the most common type of nonfamily households are 1-person households, comprising 2,314.
| Household Size | Family Households | Nonfamily Households |
| 1-Person Households | - | 2,314 (19.8%) |
| 2-Person Households | 3,950 (33.8%) | 380 (3.3%) |
| 3-Person Households | 1,289 (11.0%) | 0 (0.0%) |
| 4-Person Households | 1,699 (14.5%) | 0 (0.0%) |
| 5-Person Households | 935 (8.0%) | 0 (0.0%) |
| 6-Person Households | 791 (6.8%) | 8 (0.1%) |
| 7+ Person Households | 332 (2.8%) | 0 (0.0%) |
| Total | 8,996 (76.9%) | 2,702 (23.1%) |
Female Fertility in Sahuarita
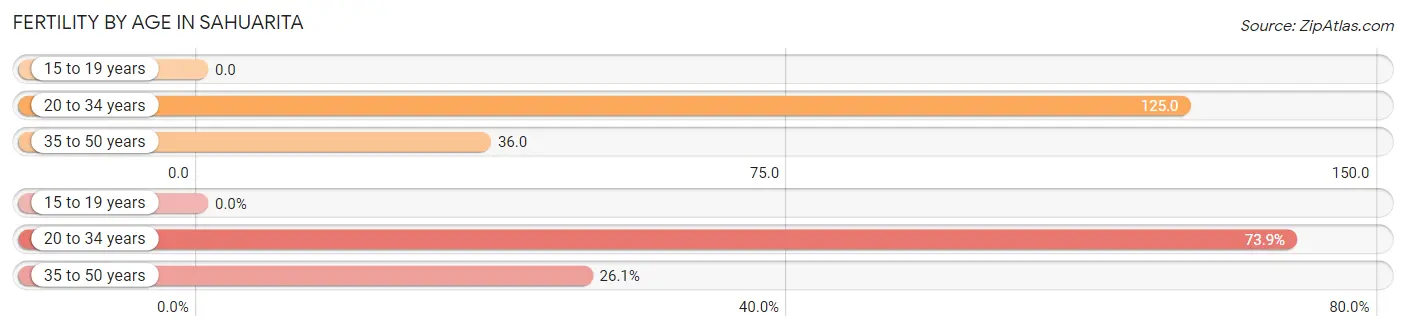
Fertility by Age in Sahuarita
Average fertility rate in Sahuarita is 62.0 births per 1,000 women. Women in the age bracket of 20 to 34 years have the highest fertility rate with 125.0 births per 1,000 women. Women in the age bracket of 20 to 34 years acount for 73.9% of all women with births.
| Age Bracket | Women with Births | Births / 1,000 Women |
| 15 to 19 years | 0 (0.0%) | 0.0 |
| 20 to 34 years | 337 (73.9%) | 125.0 |
| 35 to 50 years | 119 (26.1%) | 36.0 |
| Total | 456 (100.0%) | 62.0 |
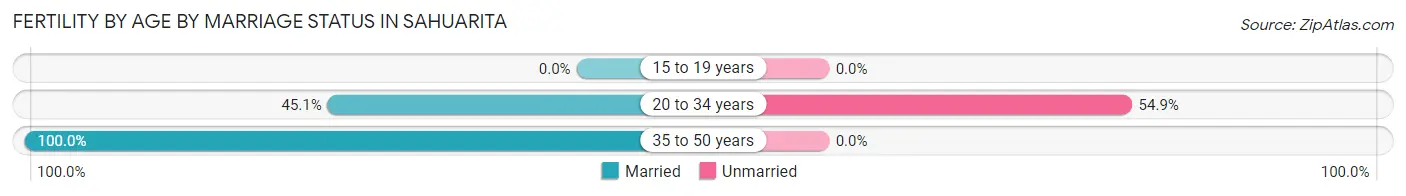
Fertility by Age by Marriage Status in Sahuarita
59.4% of women with births (456) in Sahuarita are married. The highest percentage of unmarried women with births falls into 20 to 34 years age bracket with 54.9% of them unmarried at the time of birth, while the lowest percentage of unmarried women with births belong to 35 to 50 years age bracket with 0.0% of them unmarried.
| Age Bracket | Married | Unmarried |
| 15 to 19 years | 0 (0.0%) | 0 (0.0%) |
| 20 to 34 years | 152 (45.1%) | 185 (54.9%) |
| 35 to 50 years | 119 (100.0%) | 0 (0.0%) |
| Total | 271 (59.4%) | 185 (40.6%) |
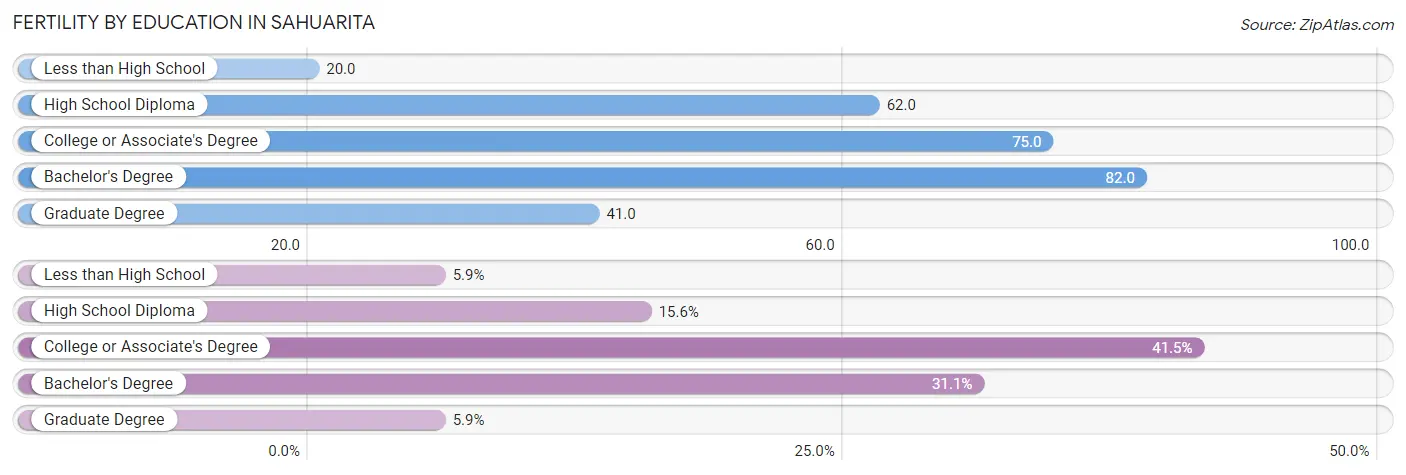
Fertility by Education in Sahuarita
Average fertility rate in Sahuarita is 62.0 births per 1,000 women. Women with the education attainment of bachelor's degree have the highest fertility rate of 82.0 births per 1,000 women, while women with the education attainment of less than high school have the lowest fertility at 20.0 births per 1,000 women. Women with the education attainment of college or associate's degree represent 41.4% of all women with births.
| Educational Attainment | Women with Births | Births / 1,000 Women |
| Less than High School | 27 (5.9%) | 20.0 |
| High School Diploma | 71 (15.6%) | 62.0 |
| College or Associate's Degree | 189 (41.4%) | 75.0 |
| Bachelor's Degree | 142 (31.1%) | 82.0 |
| Graduate Degree | 27 (5.9%) | 41.0 |
| Total | 456 (100.0%) | 62.0 |
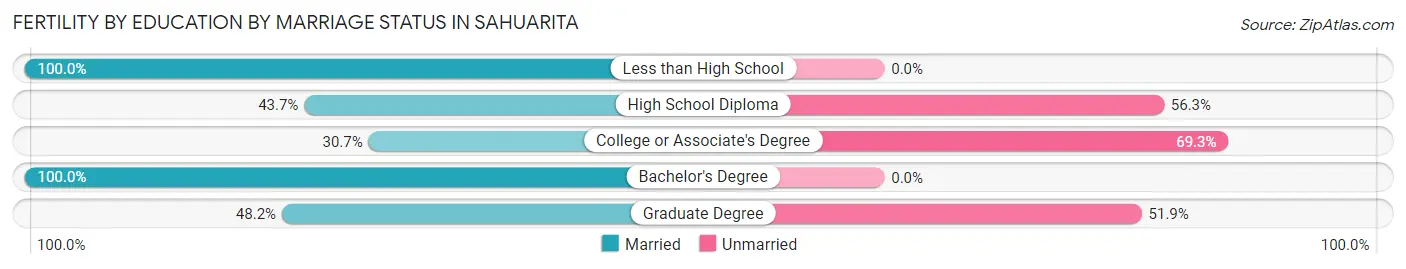
Fertility by Education by Marriage Status in Sahuarita
40.6% of women with births in Sahuarita are unmarried. Women with the educational attainment of less than high school are most likely to be married with 100.0% of them married at childbirth, while women with the educational attainment of college or associate's degree are least likely to be married with 69.3% of them unmarried at childbirth.
| Educational Attainment | Married | Unmarried |
| Less than High School | 27 (100.0%) | 0 (0.0%) |
| High School Diploma | 31 (43.7%) | 40 (56.3%) |
| College or Associate's Degree | 58 (30.7%) | 131 (69.3%) |
| Bachelor's Degree | 142 (100.0%) | 0 (0.0%) |
| Graduate Degree | 13 (48.1%) | 14 (51.8%) |
| Total | 271 (59.4%) | 185 (40.6%) |
Income in Sahuarita
Income Overview in Sahuarita
Per Capita Income in Sahuarita is $38,226, while median incomes of families and households are $104,834 and $97,133 respectively.
| Characteristic | Number | Measure |
| Per Capita Income | 34,238 | $38,226 |
| Median Family Income | 8,996 | $104,834 |
| Mean Family Income | 8,996 | $123,378 |
| Median Household Income | 11,698 | $97,133 |
| Mean Household Income | 11,698 | $111,144 |
| Income Deficit | 8,996 | $0 |
| Wage / Income Gap (%) | 34,238 | 44.89% |
| Wage / Income Gap ($) | 34,238 | 55.11¢ per $1 |
| Gini / Inequality Index | 34,238 | 0.39 |
Earnings by Sex in Sahuarita
Average Earnings in Sahuarita are $45,327, $61,121 for men and $33,686 for women, a difference of 44.9%.
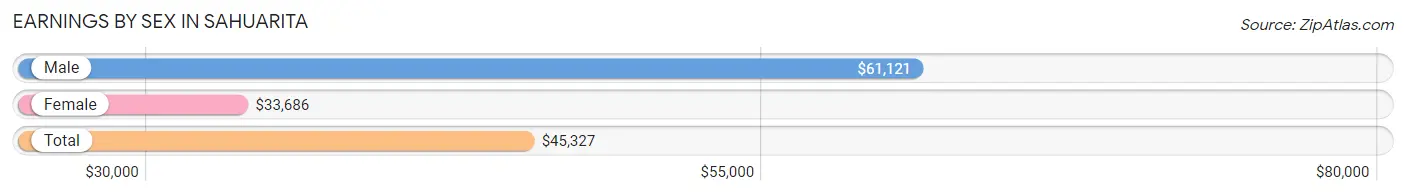
| Sex | Number | Average Earnings |
| Male | 8,160 (54.4%) | $61,121 |
| Female | 6,838 (45.6%) | $33,686 |
| Total | 14,998 (100.0%) | $45,327 |
Earnings by Sex by Income Bracket in Sahuarita
The most common earnings brackets in Sahuarita are $100,000+ for men (2,118 | 26.0%) and $2,499 or less for women (606 | 8.9%).
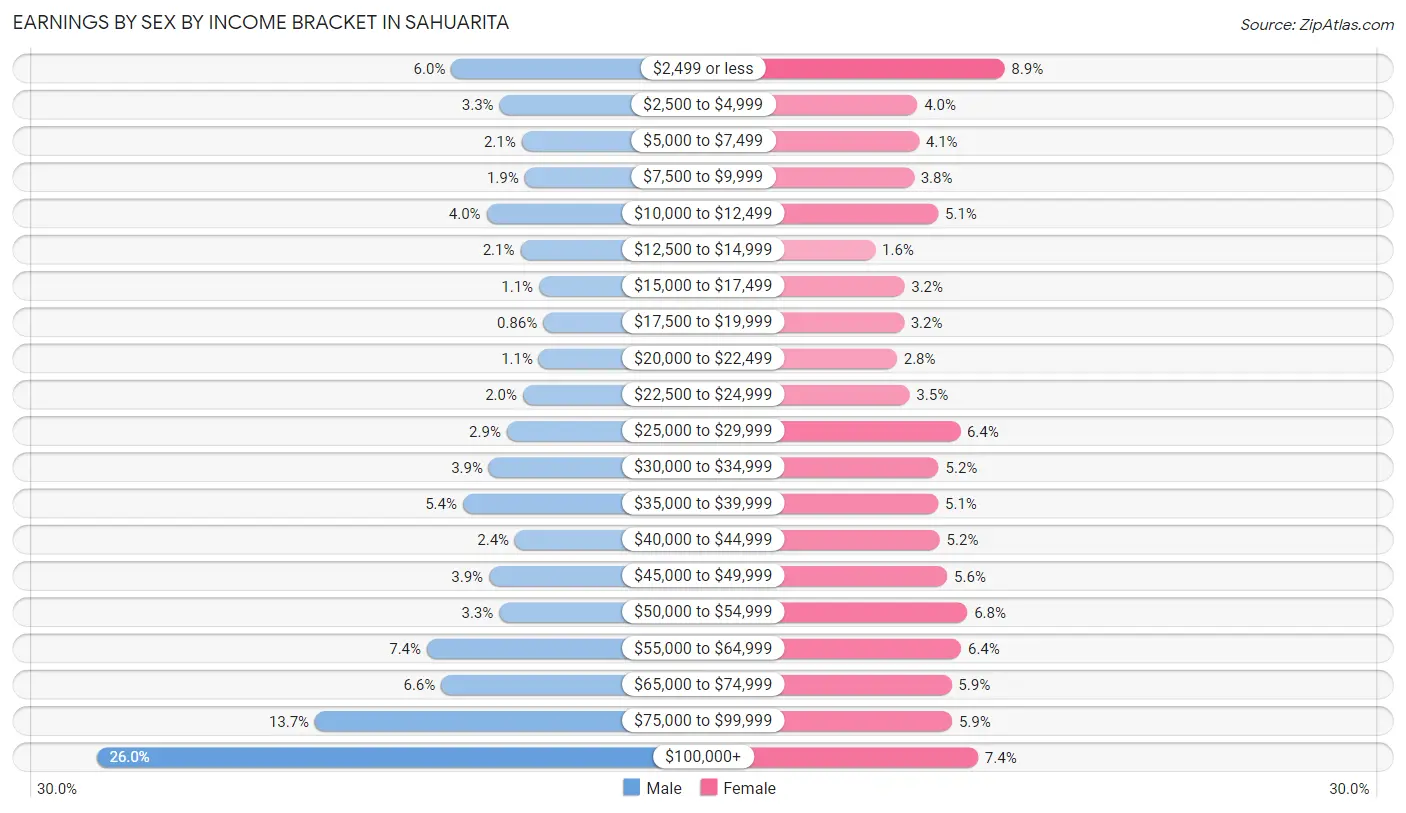
| Income | Male | Female |
| $2,499 or less | 491 (6.0%) | 606 (8.9%) |
| $2,500 to $4,999 | 270 (3.3%) | 271 (4.0%) |
| $5,000 to $7,499 | 169 (2.1%) | 277 (4.1%) |
| $7,500 to $9,999 | 155 (1.9%) | 257 (3.8%) |
| $10,000 to $12,499 | 330 (4.0%) | 351 (5.1%) |
| $12,500 to $14,999 | 175 (2.1%) | 109 (1.6%) |
| $15,000 to $17,499 | 89 (1.1%) | 221 (3.2%) |
| $17,500 to $19,999 | 70 (0.9%) | 219 (3.2%) |
| $20,000 to $22,499 | 90 (1.1%) | 192 (2.8%) |
| $22,500 to $24,999 | 163 (2.0%) | 241 (3.5%) |
| $25,000 to $29,999 | 237 (2.9%) | 435 (6.4%) |
| $30,000 to $34,999 | 319 (3.9%) | 353 (5.2%) |
| $35,000 to $39,999 | 438 (5.4%) | 351 (5.1%) |
| $40,000 to $44,999 | 199 (2.4%) | 357 (5.2%) |
| $45,000 to $49,999 | 318 (3.9%) | 386 (5.6%) |
| $50,000 to $54,999 | 272 (3.3%) | 463 (6.8%) |
| $55,000 to $64,999 | 603 (7.4%) | 439 (6.4%) |
| $65,000 to $74,999 | 538 (6.6%) | 402 (5.9%) |
| $75,000 to $99,999 | 1,116 (13.7%) | 404 (5.9%) |
| $100,000+ | 2,118 (26.0%) | 504 (7.4%) |
| Total | 8,160 (100.0%) | 6,838 (100.0%) |
Earnings by Sex by Educational Attainment in Sahuarita
Average earnings in Sahuarita are $70,239 for men and $39,120 for women, a difference of 44.3%. Men with an educational attainment of graduate degree enjoy the highest average annual earnings of $103,978, while those with less than high school education earn the least with $41,250. Women with an educational attainment of graduate degree earn the most with the average annual earnings of $63,385, while those with less than high school education have the smallest earnings of $24,565.
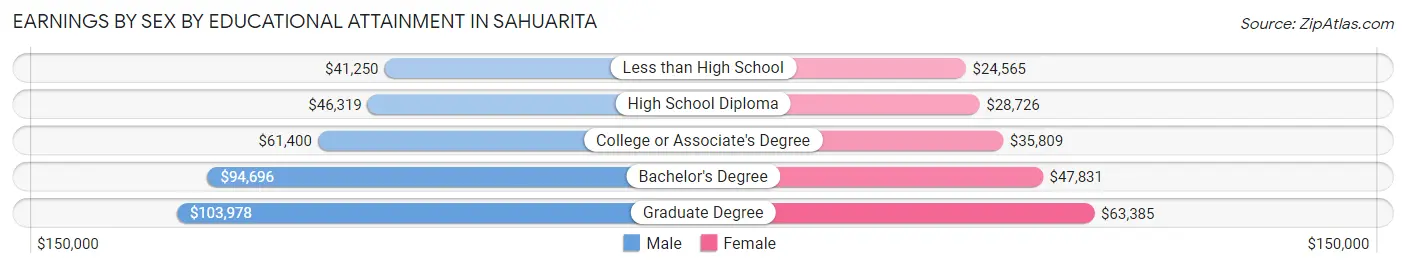
| Educational Attainment | Male Income | Female Income |
| Less than High School | $41,250 | $24,565 |
| High School Diploma | $46,319 | $28,726 |
| College or Associate's Degree | $61,400 | $35,809 |
| Bachelor's Degree | $94,696 | $47,831 |
| Graduate Degree | $103,978 | $63,385 |
| Total | $70,239 | $39,120 |
Family Income in Sahuarita
Family Income Brackets in Sahuarita
According to the Sahuarita family income data, there are 2,735 families falling into the $100,000 to $149,999 income range, which is the most common income bracket and makes up 30.4% of all families.
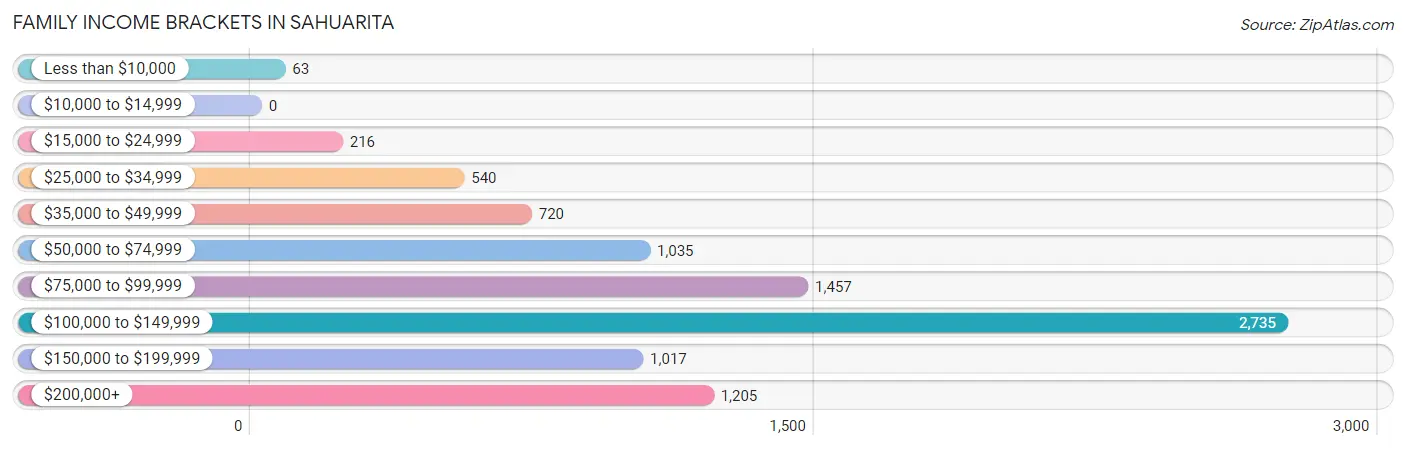
| Income Bracket | # Families | % Families |
| Less than $10,000 | 63 | 0.7% |
| $10,000 to $14,999 | 0 | 0.0% |
| $15,000 to $24,999 | 216 | 2.4% |
| $25,000 to $34,999 | 540 | 6.0% |
| $35,000 to $49,999 | 720 | 8.0% |
| $50,000 to $74,999 | 1,035 | 11.5% |
| $75,000 to $99,999 | 1,457 | 16.2% |
| $100,000 to $149,999 | 2,735 | 30.4% |
| $150,000 to $199,999 | 1,017 | 11.3% |
| $200,000+ | 1,205 | 13.4% |
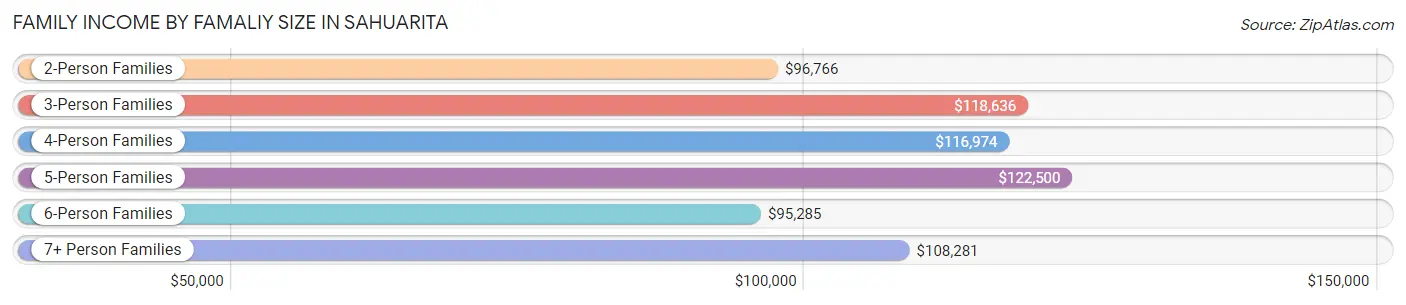
Family Income by Famaliy Size in Sahuarita
5-person families (916 | 10.2%) account for the highest median family income in Sahuarita with $122,500 per family, while 2-person families (4,075 | 45.3%) have the highest median income of $48,383 per family member.
| Income Bracket | # Families | Median Income |
| 2-Person Families | 4,075 (45.3%) | $96,766 |
| 3-Person Families | 1,444 (16.1%) | $118,636 |
| 4-Person Families | 1,581 (17.6%) | $116,974 |
| 5-Person Families | 916 (10.2%) | $122,500 |
| 6-Person Families | 807 (9.0%) | $95,285 |
| 7+ Person Families | 173 (1.9%) | $108,281 |
| Total | 8,996 (100.0%) | $104,834 |
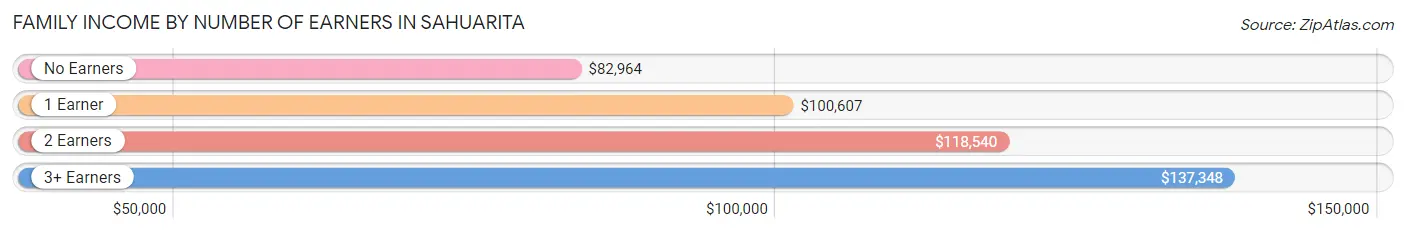
Family Income by Number of Earners in Sahuarita
The median family income in Sahuarita is $104,834, with families comprising 3+ earners (1,006) having the highest median family income of $137,348, while families with no earners (1,972) have the lowest median family income of $82,964, accounting for 11.2% and 21.9% of families, respectively.
| Number of Earners | # Families | Median Income |
| No Earners | 1,972 (21.9%) | $82,964 |
| 1 Earner | 2,616 (29.1%) | $100,607 |
| 2 Earners | 3,402 (37.8%) | $118,540 |
| 3+ Earners | 1,006 (11.2%) | $137,348 |
| Total | 8,996 (100.0%) | $104,834 |
Household Income in Sahuarita
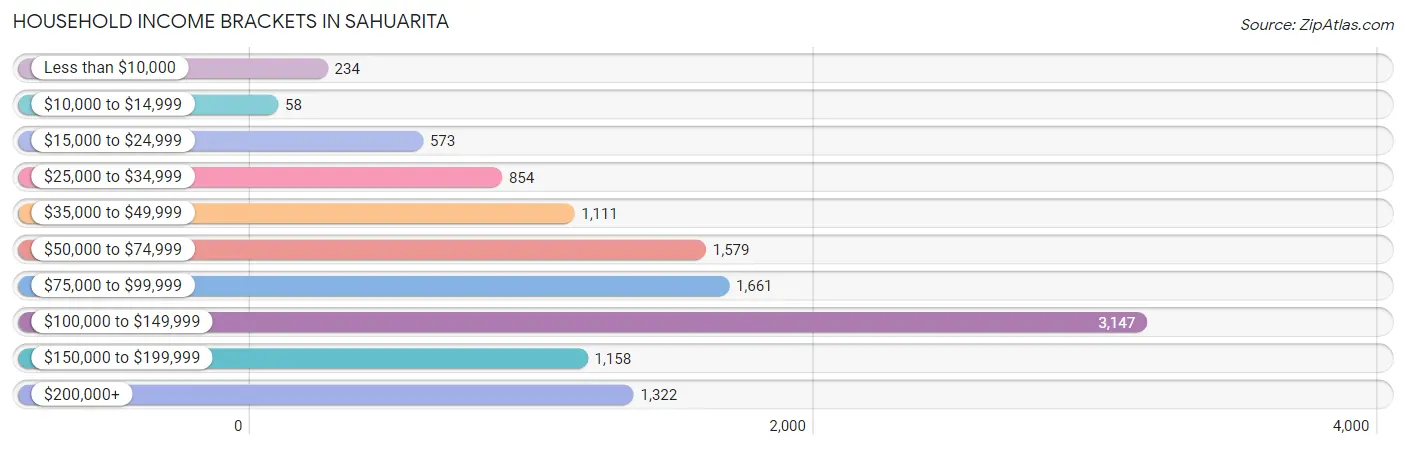
Household Income Brackets in Sahuarita
With 3,147 households falling in the category, the $100,000 to $149,999 income range is the most frequent in Sahuarita, accounting for 26.9% of all households. In contrast, only 58 households (0.5%) fall into the $10,000 to $14,999 income bracket, making it the least populous group.
| Income Bracket | # Households | % Households |
| Less than $10,000 | 234 | 2.0% |
| $10,000 to $14,999 | 58 | 0.5% |
| $15,000 to $24,999 | 573 | 4.9% |
| $25,000 to $34,999 | 854 | 7.3% |
| $35,000 to $49,999 | 1,111 | 9.5% |
| $50,000 to $74,999 | 1,579 | 13.5% |
| $75,000 to $99,999 | 1,661 | 14.2% |
| $100,000 to $149,999 | 3,147 | 26.9% |
| $150,000 to $199,999 | 1,158 | 9.9% |
| $200,000+ | 1,322 | 11.3% |
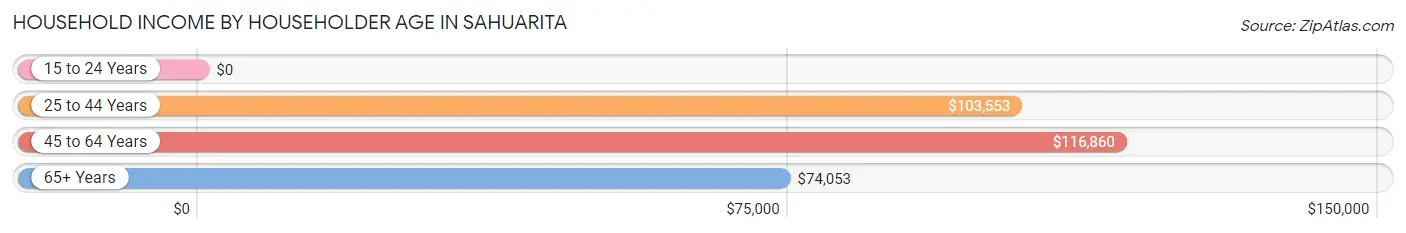
Household Income by Householder Age in Sahuarita
The median household income in Sahuarita is $97,133, with the highest median household income of $116,860 found in the 45 to 64 years age bracket for the primary householder. A total of 3,439 households (29.4%) fall into this category. Meanwhile, the 15 to 24 years age bracket for the primary householder has the lowest median household income of $0, with 105 households (0.9%) in this group.
| Income Bracket | # Households | Median Income |
| 15 to 24 Years | 105 (0.9%) | $0 |
| 25 to 44 Years | 3,882 (33.2%) | $103,553 |
| 45 to 64 Years | 3,439 (29.4%) | $116,860 |
| 65+ Years | 4,272 (36.5%) | $74,053 |
| Total | 11,698 (100.0%) | $97,133 |
Poverty in Sahuarita
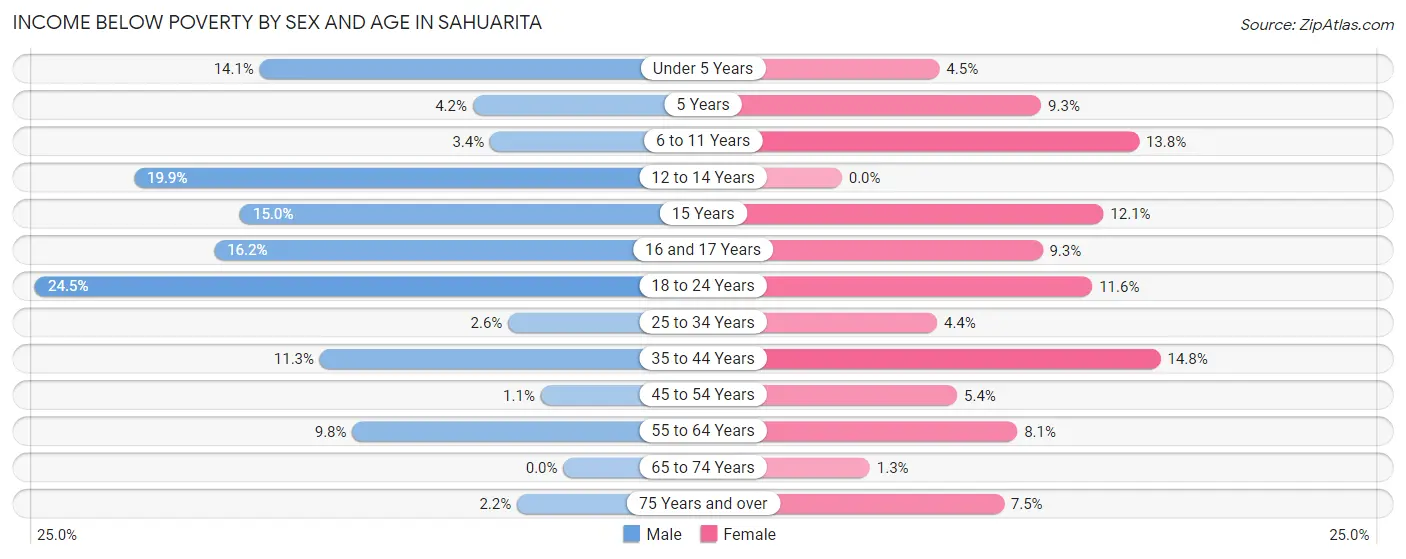
Income Below Poverty by Sex and Age in Sahuarita
With 8.2% poverty level for males and 8.0% for females among the residents of Sahuarita, 18 to 24 year old males and 35 to 44 year old females are the most vulnerable to poverty, with 352 males (24.5%) and 346 females (14.8%) in their respective age groups living below the poverty level.
| Age Bracket | Male | Female |
| Under 5 Years | 161 (14.1%) | 51 (4.5%) |
| 5 Years | 15 (4.2%) | 21 (9.2%) |
| 6 to 11 Years | 53 (3.4%) | 234 (13.8%) |
| 12 to 14 Years | 154 (19.9%) | 0 (0.0%) |
| 15 Years | 39 (15.0%) | 47 (12.1%) |
| 16 and 17 Years | 75 (16.2%) | 38 (9.3%) |
| 18 to 24 Years | 352 (24.5%) | 185 (11.6%) |
| 25 to 34 Years | 43 (2.6%) | 73 (4.4%) |
| 35 to 44 Years | 276 (11.3%) | 346 (14.8%) |
| 45 to 54 Years | 18 (1.1%) | 91 (5.3%) |
| 55 to 64 Years | 127 (9.8%) | 141 (8.1%) |
| 65 to 74 Years | 0 (0.0%) | 26 (1.3%) |
| 75 Years and over | 35 (2.1%) | 129 (7.5%) |
| Total | 1,348 (8.2%) | 1,382 (8.0%) |
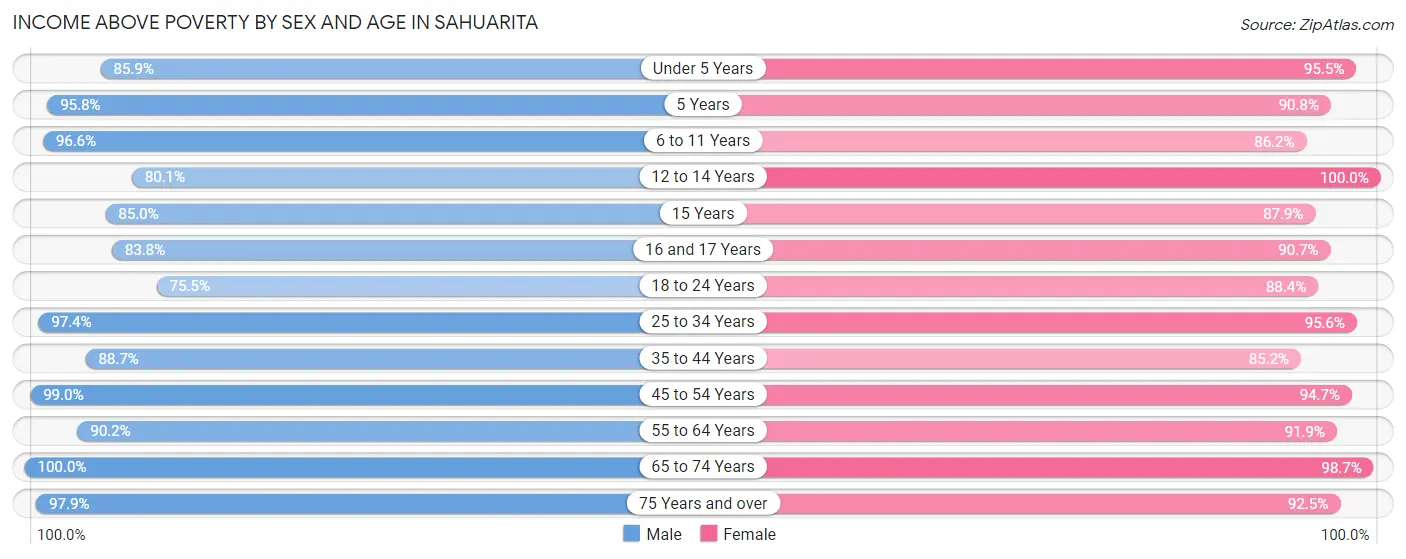
Income Above Poverty by Sex and Age in Sahuarita
According to the poverty statistics in Sahuarita, males aged 65 to 74 years and females aged 12 to 14 years are the age groups that are most secure financially, with 100.0% of males and 100.0% of females in these age groups living above the poverty line.
| Age Bracket | Male | Female |
| Under 5 Years | 982 (85.9%) | 1,075 (95.5%) |
| 5 Years | 342 (95.8%) | 206 (90.7%) |
| 6 to 11 Years | 1,506 (96.6%) | 1,463 (86.2%) |
| 12 to 14 Years | 619 (80.1%) | 817 (100.0%) |
| 15 Years | 221 (85.0%) | 340 (87.9%) |
| 16 and 17 Years | 388 (83.8%) | 370 (90.7%) |
| 18 to 24 Years | 1,084 (75.5%) | 1,407 (88.4%) |
| 25 to 34 Years | 1,634 (97.4%) | 1,578 (95.6%) |
| 35 to 44 Years | 2,167 (88.7%) | 1,993 (85.2%) |
| 45 to 54 Years | 1,700 (99.0%) | 1,609 (94.7%) |
| 55 to 64 Years | 1,170 (90.2%) | 1,592 (91.9%) |
| 65 to 74 Years | 1,732 (100.0%) | 1,968 (98.7%) |
| 75 Years and over | 1,590 (97.9%) | 1,586 (92.5%) |
| Total | 15,135 (91.8%) | 16,004 (92.0%) |
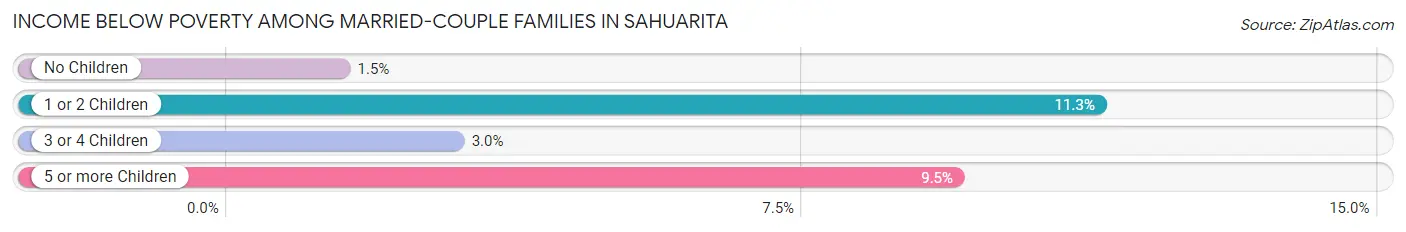
Income Below Poverty Among Married-Couple Families in Sahuarita
The poverty statistics for married-couple families in Sahuarita show that 5.1% or 395 of the total 7,775 families live below the poverty line. Families with 1 or 2 children have the highest poverty rate of 11.3%, comprising of 295 families. On the other hand, families with no children have the lowest poverty rate of 1.5%, which includes 61 families.
| Children | Above Poverty | Below Poverty |
| No Children | 4,098 (98.5%) | 61 (1.5%) |
| 1 or 2 Children | 2,307 (88.7%) | 295 (11.3%) |
| 3 or 4 Children | 851 (97.0%) | 26 (3.0%) |
| 5 or more Children | 124 (90.5%) | 13 (9.5%) |
| Total | 7,380 (94.9%) | 395 (5.1%) |
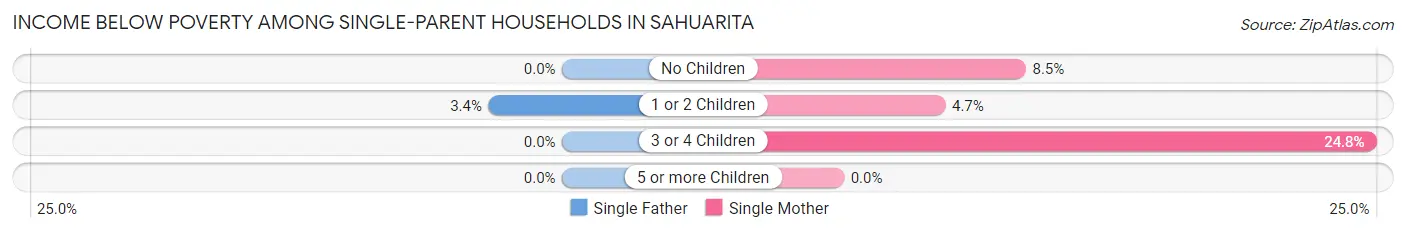
Income Below Poverty Among Single-Parent Households in Sahuarita
According to the poverty data in Sahuarita, 1.6% or 6 single-father households and 9.8% or 83 single-mother households are living below the poverty line. Among single-father households, those with 1 or 2 children have the highest poverty rate, with 6 households (3.4%) experiencing poverty. Likewise, among single-mother households, those with 3 or 4 children have the highest poverty rate, with 31 households (24.8%) falling below the poverty line.
| Children | Single Father | Single Mother |
| No Children | 0 (0.0%) | 40 (8.5%) |
| 1 or 2 Children | 6 (3.4%) | 12 (4.7%) |
| 3 or 4 Children | 0 (0.0%) | 31 (24.8%) |
| 5 or more Children | 0 (0.0%) | 0 (0.0%) |
| Total | 6 (1.6%) | 83 (9.8%) |
Income Below Poverty Among Married-Couple vs Single-Parent Households in Sahuarita
The poverty data for Sahuarita shows that 395 of the married-couple family households (5.1%) and 89 of the single-parent households (7.3%) are living below the poverty level. Within the married-couple family households, those with 1 or 2 children have the highest poverty rate, with 295 households (11.3%) falling below the poverty line. Among the single-parent households, those with 3 or 4 children have the highest poverty rate, with 31 household (22.3%) living below poverty.
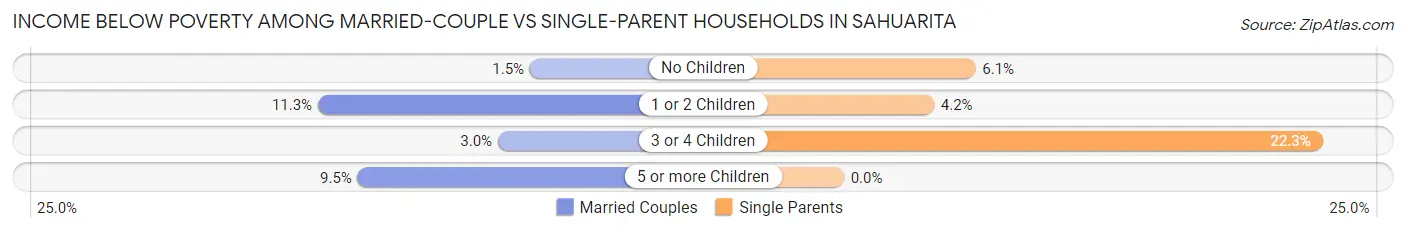
| Children | Married-Couple Families | Single-Parent Households |
| No Children | 61 (1.5%) | 40 (6.1%) |
| 1 or 2 Children | 295 (11.3%) | 18 (4.2%) |
| 3 or 4 Children | 26 (3.0%) | 31 (22.3%) |
| 5 or more Children | 13 (9.5%) | 0 (0.0%) |
| Total | 395 (5.1%) | 89 (7.3%) |
Employment Characteristics in Sahuarita
Employment by Class of Employer in Sahuarita
Among the 13,140 employed individuals in Sahuarita, private company employees (7,852 | 59.8%), federal government employees (1,471 | 11.2%), and not-for-profit organizations (1,034 | 7.9%) make up the most common classes of employment.
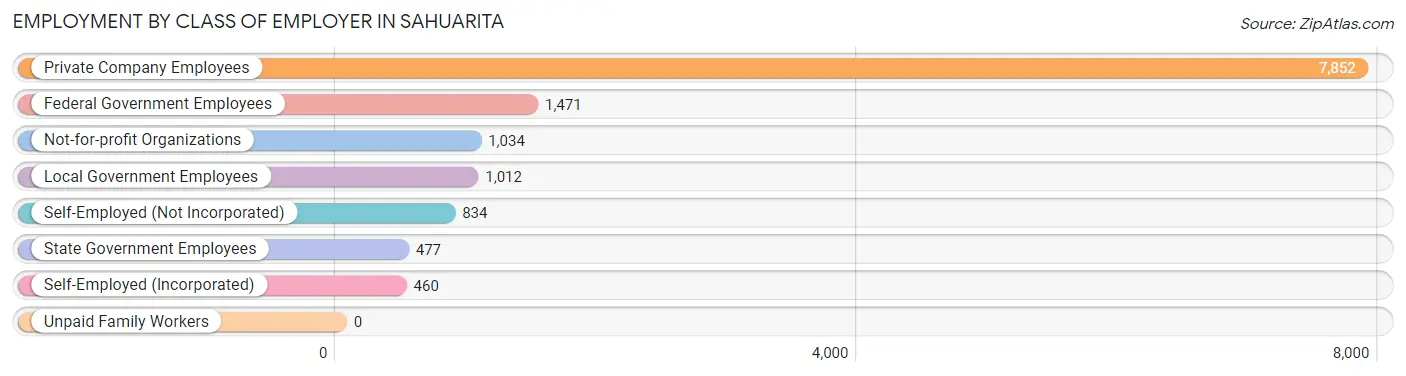
| Employer Class | # Employees | % Employees |
| Private Company Employees | 7,852 | 59.8% |
| Self-Employed (Incorporated) | 460 | 3.5% |
| Self-Employed (Not Incorporated) | 834 | 6.4% |
| Not-for-profit Organizations | 1,034 | 7.9% |
| Local Government Employees | 1,012 | 7.7% |
| State Government Employees | 477 | 3.6% |
| Federal Government Employees | 1,471 | 11.2% |
| Unpaid Family Workers | 0 | 0.0% |
| Total | 13,140 | 100.0% |
Employment Status by Age in Sahuarita
According to the labor force statistics for Sahuarita, out of the total population over 16 years of age (25,612), 56.1% or 14,368 individuals are in the labor force, with 6.7% or 963 of them unemployed. The age group with the highest labor force participation rate is 30 to 34 years, with 81.4% or 1,455 individuals in the labor force. Within the labor force, the 16 to 19 years age range has the highest percentage of unemployed individuals, with 13.8% or 143 of them being unemployed.
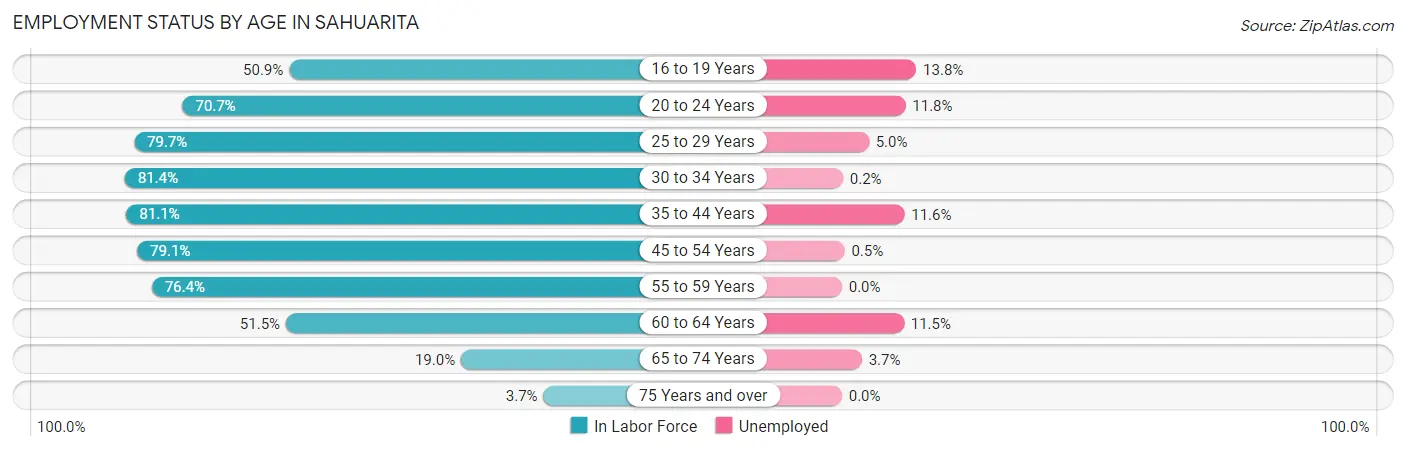
| Age Bracket | In Labor Force | Unemployed |
| 16 to 19 Years | 1,034 (50.9%) | 143 (13.8%) |
| 20 to 24 Years | 1,329 (70.7%) | 157 (11.8%) |
| 25 to 29 Years | 1,227 (79.7%) | 61 (5.0%) |
| 30 to 34 Years | 1,455 (81.4%) | 3 (0.2%) |
| 35 to 44 Years | 3,888 (81.1%) | 451 (11.6%) |
| 45 to 54 Years | 2,719 (79.1%) | 14 (0.5%) |
| 55 to 59 Years | 924 (76.4%) | 0 (0.0%) |
| 60 to 64 Years | 951 (51.5%) | 109 (11.5%) |
| 65 to 74 Years | 708 (19.0%) | 26 (3.7%) |
| 75 Years and over | 124 (3.7%) | 0 (0.0%) |
| Total | 14,368 (56.1%) | 963 (6.7%) |
Employment Status by Educational Attainment in Sahuarita
According to labor force statistics for Sahuarita, 76.4% of individuals (11,167) out of the total population between 25 and 64 years of age (14,616) are in the labor force, with 5.7% or 637 of them being unemployed. The group with the highest labor force participation rate are those with the educational attainment of bachelor's degree or higher, with 83.8% or 4,856 individuals in the labor force. Within the labor force, individuals with high school diploma education have the highest percentage of unemployment, with 7.8% or 166 of them being unemployed.
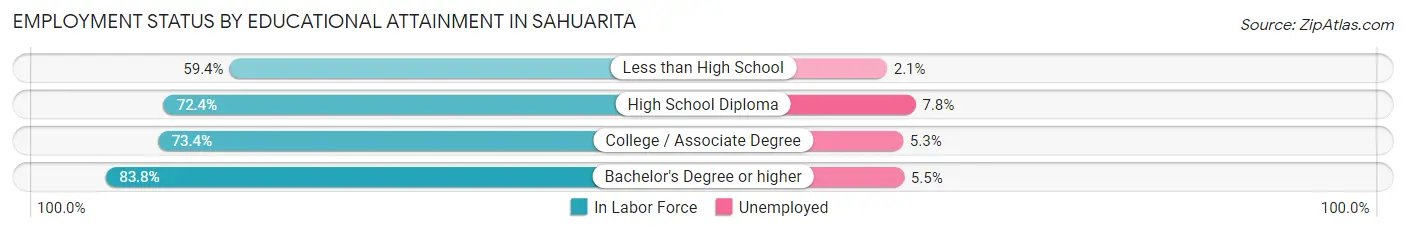
| Educational Attainment | In Labor Force | Unemployed |
| Less than High School | 562 (59.4%) | 20 (2.1%) |
| High School Diploma | 2,129 (72.4%) | 229 (7.8%) |
| College / Associate Degree | 3,622 (73.4%) | 262 (5.3%) |
| Bachelor's Degree or higher | 4,856 (83.8%) | 319 (5.5%) |
| Total | 11,167 (76.4%) | 833 (5.7%) |
Employment Occupations by Sex in Sahuarita
Management, Business, Science and Arts Occupations
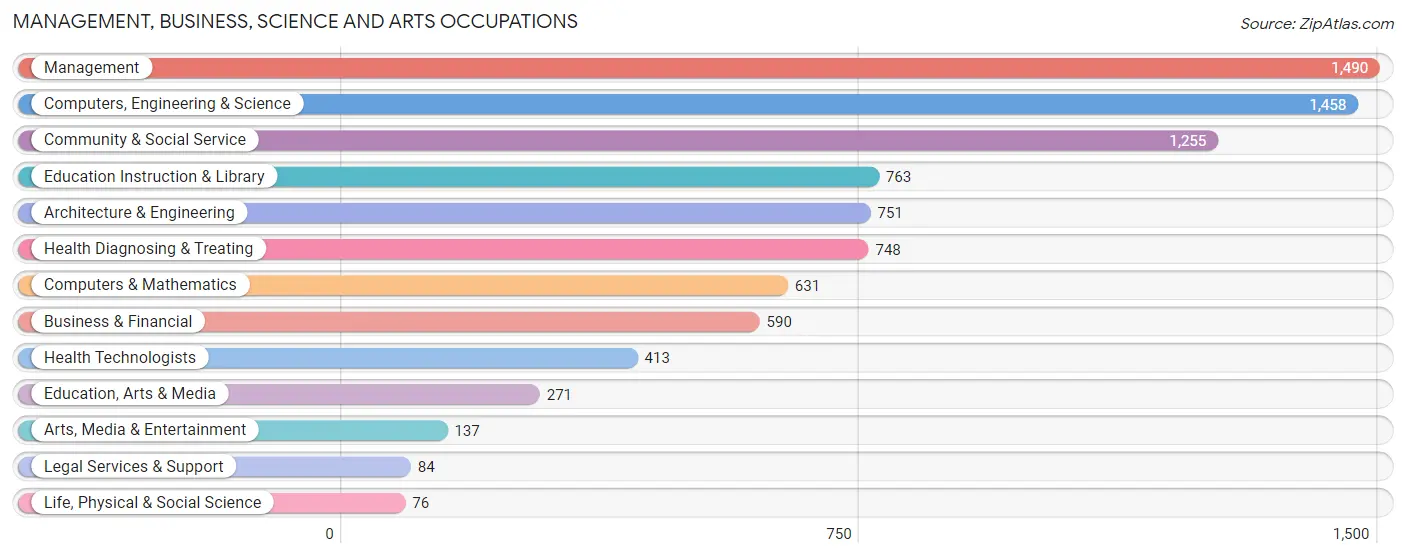
The most common Management, Business, Science and Arts occupations in Sahuarita are Management (1,490 | 11.3%), Computers, Engineering & Science (1,458 | 11.1%), Community & Social Service (1,255 | 9.5%), Education Instruction & Library (763 | 5.8%), and Architecture & Engineering (751 | 5.7%).
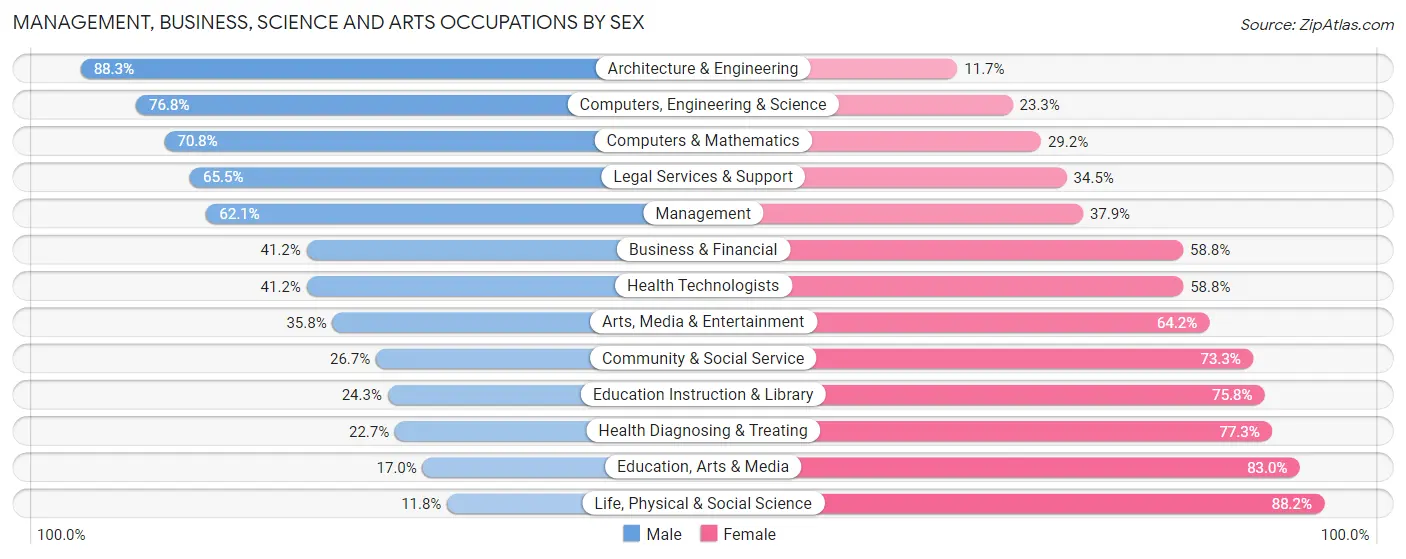
Management, Business, Science and Arts Occupations by Sex
Within the Management, Business, Science and Arts occupations in Sahuarita, the most male-oriented occupations are Architecture & Engineering (88.3%), Computers, Engineering & Science (76.7%), and Computers & Mathematics (70.8%), while the most female-oriented occupations are Life, Physical & Social Science (88.2%), Education, Arts & Media (83.0%), and Health Diagnosing & Treating (77.3%).
| Occupation | Male | Female |
| Management | 925 (62.1%) | 565 (37.9%) |
| Business & Financial | 243 (41.2%) | 347 (58.8%) |
| Computers, Engineering & Science | 1,119 (76.7%) | 339 (23.3%) |
| Computers & Mathematics | 447 (70.8%) | 184 (29.2%) |
| Architecture & Engineering | 663 (88.3%) | 88 (11.7%) |
| Life, Physical & Social Science | 9 (11.8%) | 67 (88.2%) |
| Community & Social Service | 335 (26.7%) | 920 (73.3%) |
| Education, Arts & Media | 46 (17.0%) | 225 (83.0%) |
| Legal Services & Support | 55 (65.5%) | 29 (34.5%) |
| Education Instruction & Library | 185 (24.2%) | 578 (75.7%) |
| Arts, Media & Entertainment | 49 (35.8%) | 88 (64.2%) |
| Health Diagnosing & Treating | 170 (22.7%) | 578 (77.3%) |
| Health Technologists | 170 (41.2%) | 243 (58.8%) |
| Total (Category) | 2,792 (50.4%) | 2,749 (49.6%) |
| Total (Overall) | 7,360 (55.8%) | 5,827 (44.2%) |
Services Occupations
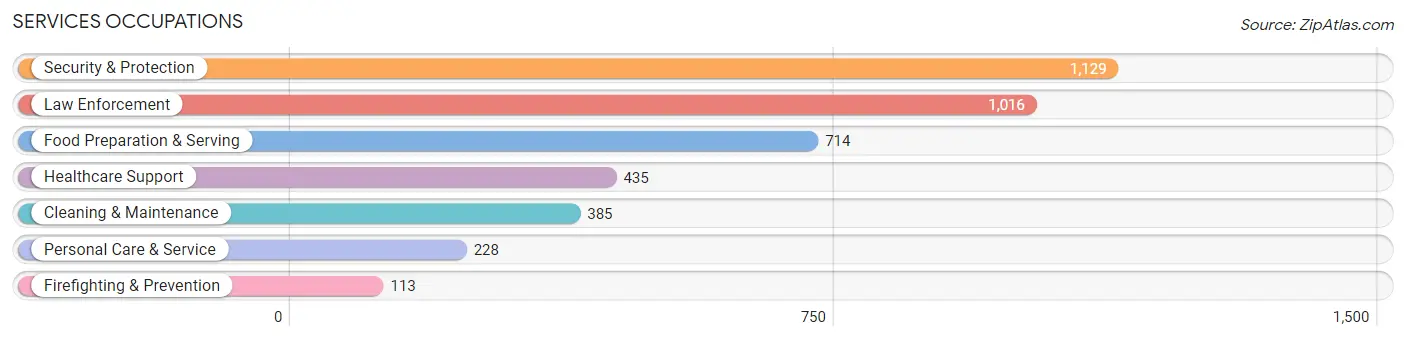
The most common Services occupations in Sahuarita are Security & Protection (1,129 | 8.6%), Law Enforcement (1,016 | 7.7%), Food Preparation & Serving (714 | 5.4%), Healthcare Support (435 | 3.3%), and Cleaning & Maintenance (385 | 2.9%).
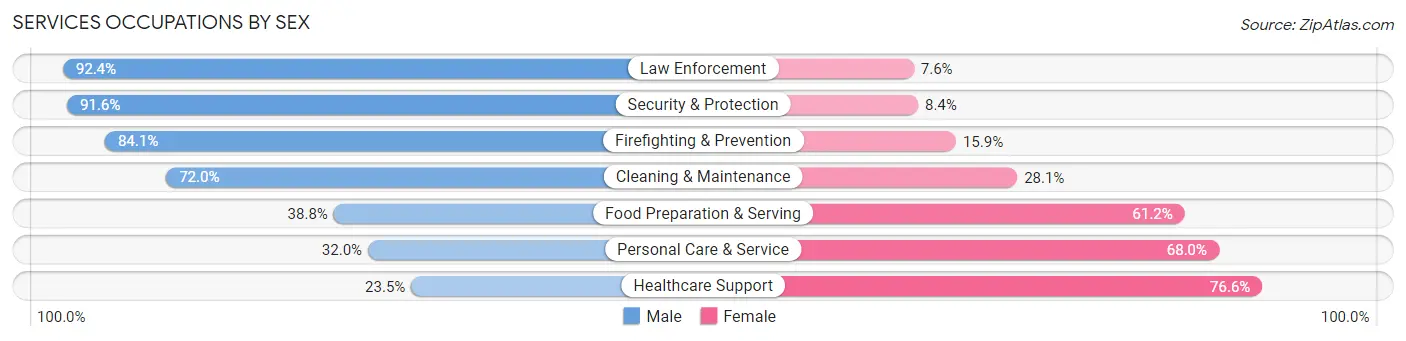
Services Occupations by Sex
Within the Services occupations in Sahuarita, the most male-oriented occupations are Law Enforcement (92.4%), Security & Protection (91.6%), and Firefighting & Prevention (84.1%), while the most female-oriented occupations are Healthcare Support (76.5%), Personal Care & Service (68.0%), and Food Preparation & Serving (61.2%).
| Occupation | Male | Female |
| Healthcare Support | 102 (23.4%) | 333 (76.5%) |
| Security & Protection | 1,034 (91.6%) | 95 (8.4%) |
| Firefighting & Prevention | 95 (84.1%) | 18 (15.9%) |
| Law Enforcement | 939 (92.4%) | 77 (7.6%) |
| Food Preparation & Serving | 277 (38.8%) | 437 (61.2%) |
| Cleaning & Maintenance | 277 (72.0%) | 108 (28.1%) |
| Personal Care & Service | 73 (32.0%) | 155 (68.0%) |
| Total (Category) | 1,763 (61.0%) | 1,128 (39.0%) |
| Total (Overall) | 7,360 (55.8%) | 5,827 (44.2%) |
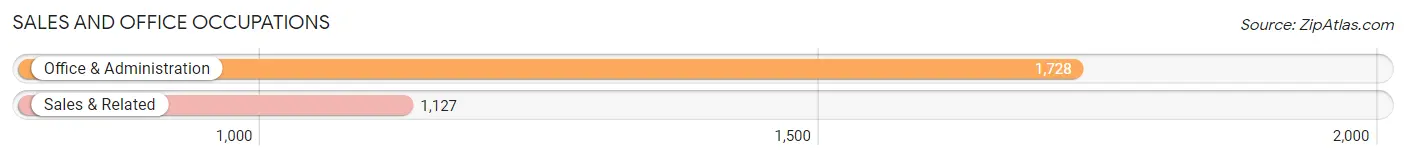
Sales and Office Occupations
The most common Sales and Office occupations in Sahuarita are Office & Administration (1,728 | 13.1%), and Sales & Related (1,127 | 8.6%).
Sales and Office Occupations by Sex
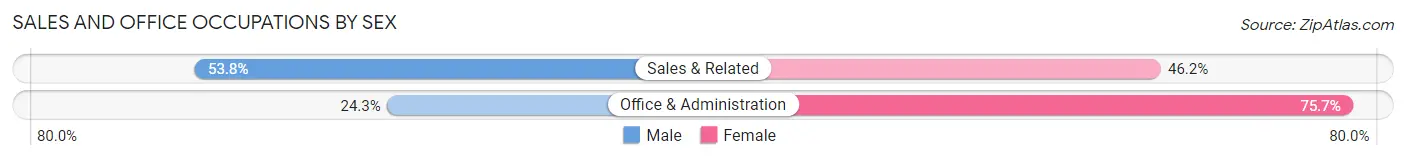
| Occupation | Male | Female |
| Sales & Related | 606 (53.8%) | 521 (46.2%) |
| Office & Administration | 420 (24.3%) | 1,308 (75.7%) |
| Total (Category) | 1,026 (35.9%) | 1,829 (64.1%) |
| Total (Overall) | 7,360 (55.8%) | 5,827 (44.2%) |
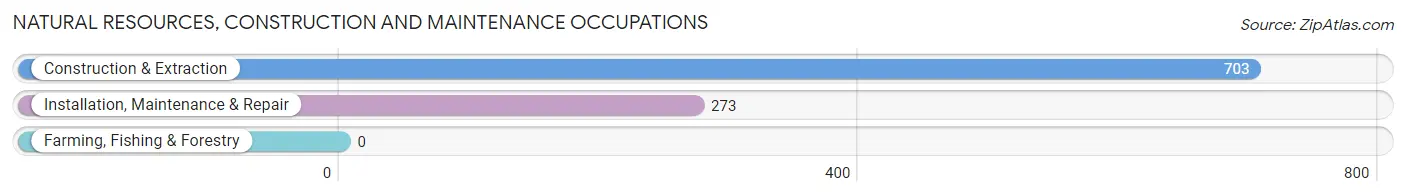
Natural Resources, Construction and Maintenance Occupations
The most common Natural Resources, Construction and Maintenance occupations in Sahuarita are Construction & Extraction (703 | 5.3%), and Installation, Maintenance & Repair (273 | 2.1%).
Natural Resources, Construction and Maintenance Occupations by Sex
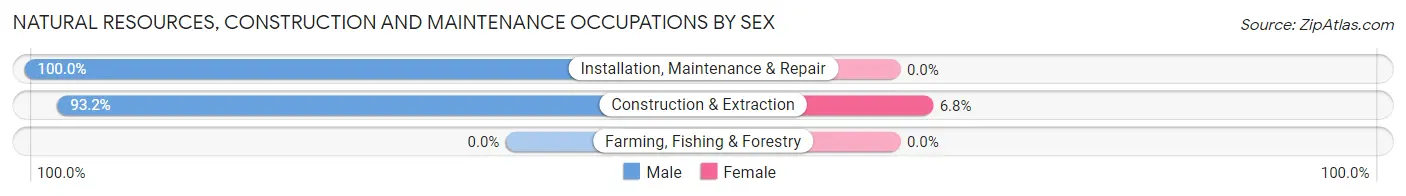
| Occupation | Male | Female |
| Farming, Fishing & Forestry | 0 (0.0%) | 0 (0.0%) |
| Construction & Extraction | 655 (93.2%) | 48 (6.8%) |
| Installation, Maintenance & Repair | 273 (100.0%) | 0 (0.0%) |
| Total (Category) | 928 (95.1%) | 48 (4.9%) |
| Total (Overall) | 7,360 (55.8%) | 5,827 (44.2%) |
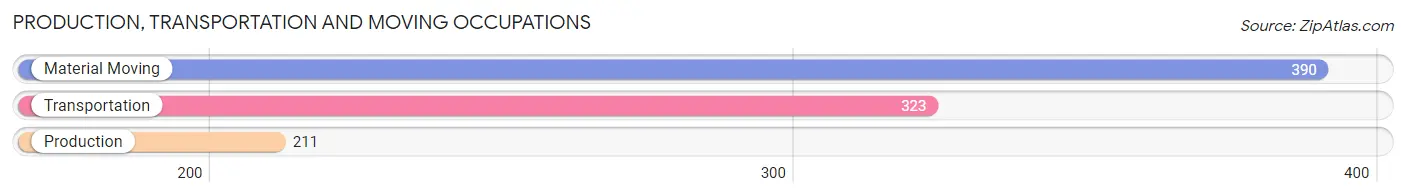
Production, Transportation and Moving Occupations
The most common Production, Transportation and Moving occupations in Sahuarita are Material Moving (390 | 3.0%), Transportation (323 | 2.5%), and Production (211 | 1.6%).
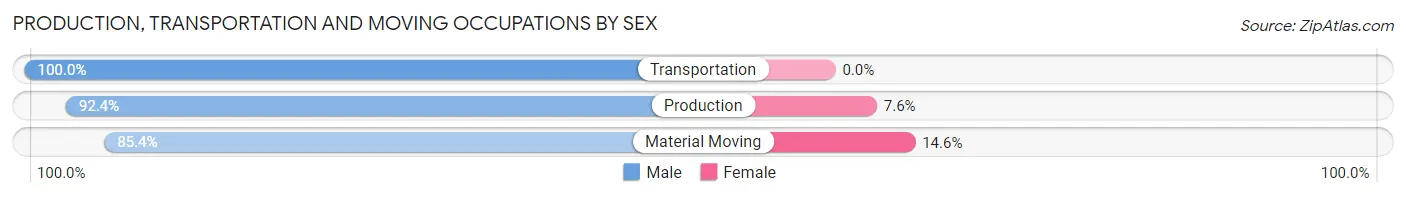
Production, Transportation and Moving Occupations by Sex
| Occupation | Male | Female |
| Production | 195 (92.4%) | 16 (7.6%) |
| Transportation | 323 (100.0%) | 0 (0.0%) |
| Material Moving | 333 (85.4%) | 57 (14.6%) |
| Total (Category) | 851 (92.1%) | 73 (7.9%) |
| Total (Overall) | 7,360 (55.8%) | 5,827 (44.2%) |
Employment Industries by Sex in Sahuarita
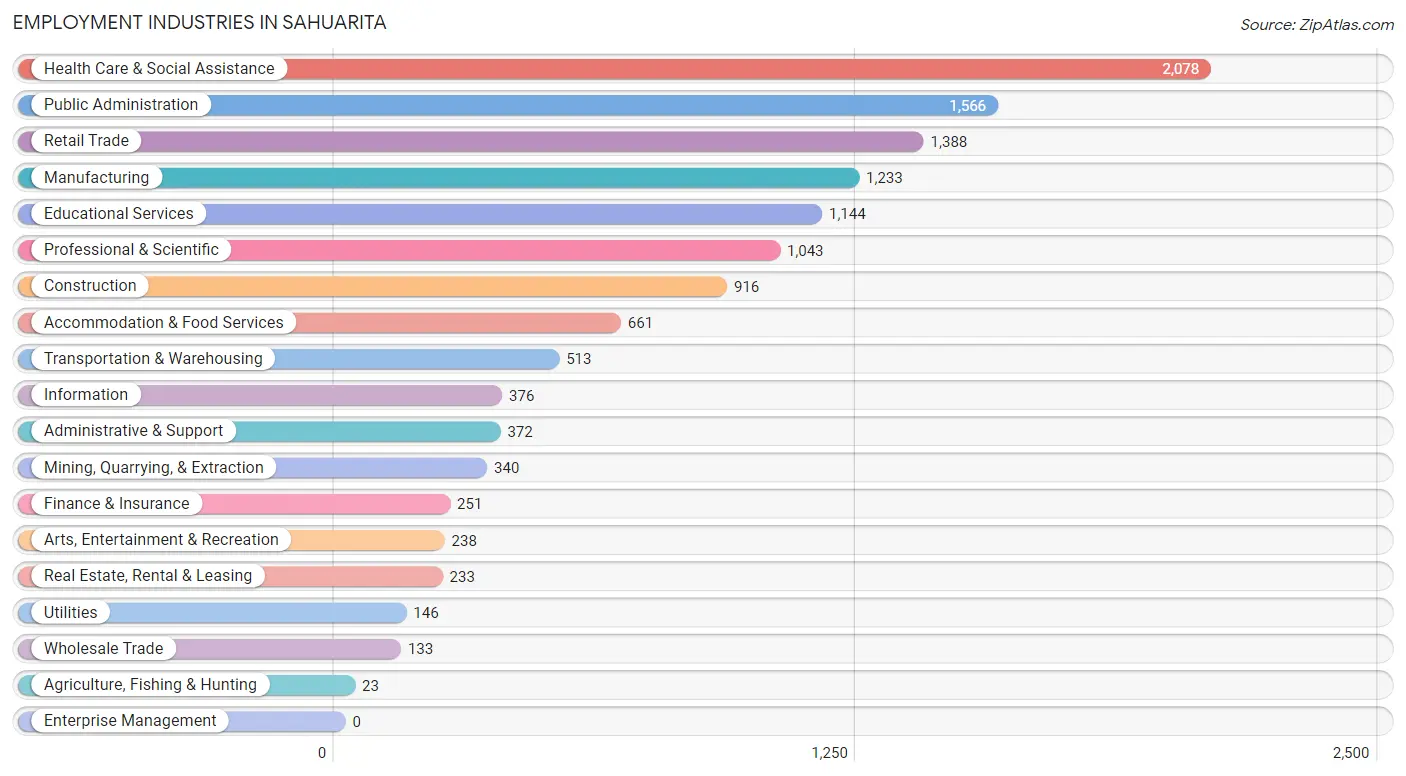
Employment Industries in Sahuarita
The major employment industries in Sahuarita include Health Care & Social Assistance (2,078 | 15.8%), Public Administration (1,566 | 11.9%), Retail Trade (1,388 | 10.5%), Manufacturing (1,233 | 9.3%), and Educational Services (1,144 | 8.7%).
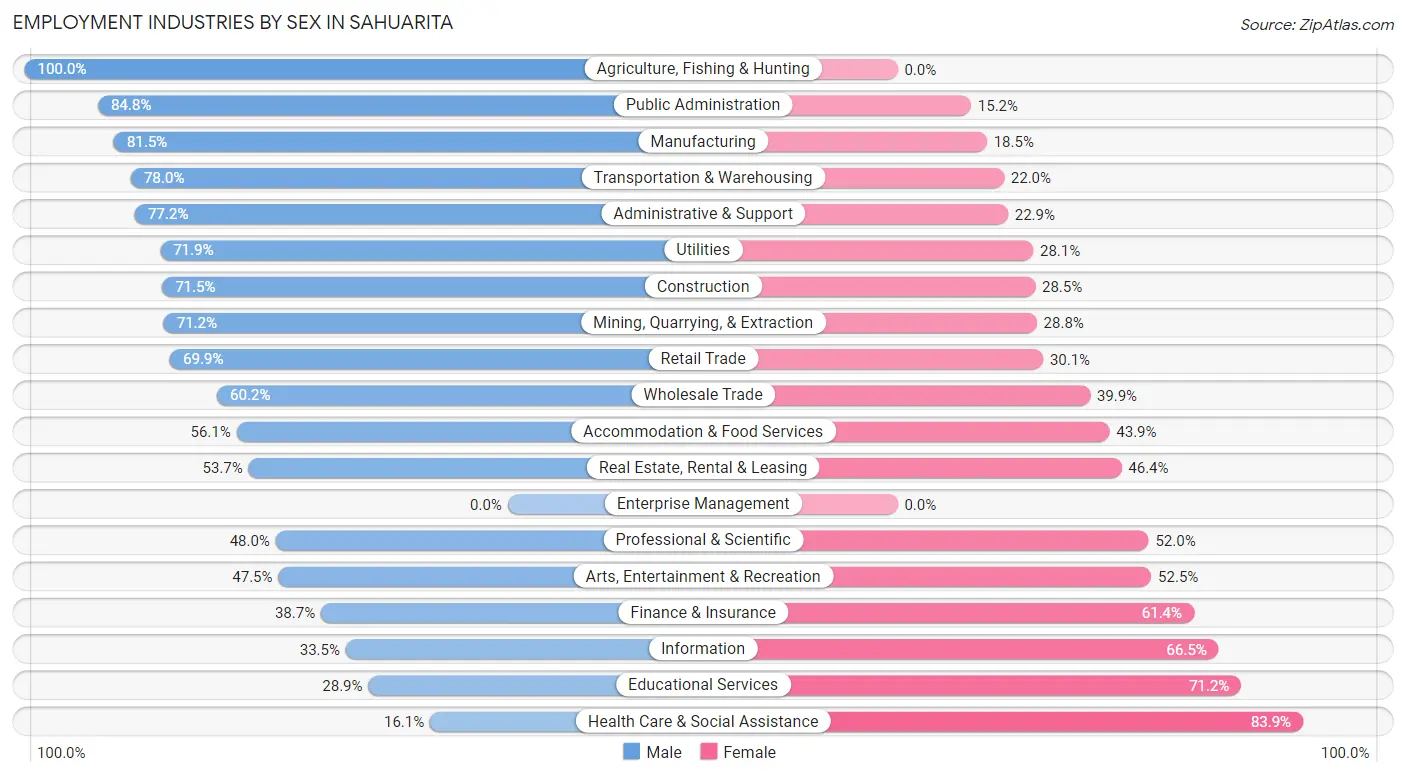
Employment Industries by Sex in Sahuarita
The Sahuarita industries that see more men than women are Agriculture, Fishing & Hunting (100.0%), Public Administration (84.8%), and Manufacturing (81.5%), whereas the industries that tend to have a higher number of women are Health Care & Social Assistance (83.9%), Educational Services (71.2%), and Information (66.5%).
| Industry | Male | Female |
| Agriculture, Fishing & Hunting | 23 (100.0%) | 0 (0.0%) |
| Mining, Quarrying, & Extraction | 242 (71.2%) | 98 (28.8%) |
| Construction | 655 (71.5%) | 261 (28.5%) |
| Manufacturing | 1,005 (81.5%) | 228 (18.5%) |
| Wholesale Trade | 80 (60.2%) | 53 (39.9%) |
| Retail Trade | 970 (69.9%) | 418 (30.1%) |
| Transportation & Warehousing | 400 (78.0%) | 113 (22.0%) |
| Utilities | 105 (71.9%) | 41 (28.1%) |
| Information | 126 (33.5%) | 250 (66.5%) |
| Finance & Insurance | 97 (38.7%) | 154 (61.4%) |
| Real Estate, Rental & Leasing | 125 (53.6%) | 108 (46.4%) |
| Professional & Scientific | 501 (48.0%) | 542 (52.0%) |
| Enterprise Management | 0 (0.0%) | 0 (0.0%) |
| Administrative & Support | 287 (77.1%) | 85 (22.9%) |
| Educational Services | 330 (28.8%) | 814 (71.2%) |
| Health Care & Social Assistance | 334 (16.1%) | 1,744 (83.9%) |
| Arts, Entertainment & Recreation | 113 (47.5%) | 125 (52.5%) |
| Accommodation & Food Services | 371 (56.1%) | 290 (43.9%) |
| Public Administration | 1,328 (84.8%) | 238 (15.2%) |
| Total | 7,360 (55.8%) | 5,827 (44.2%) |
Education in Sahuarita
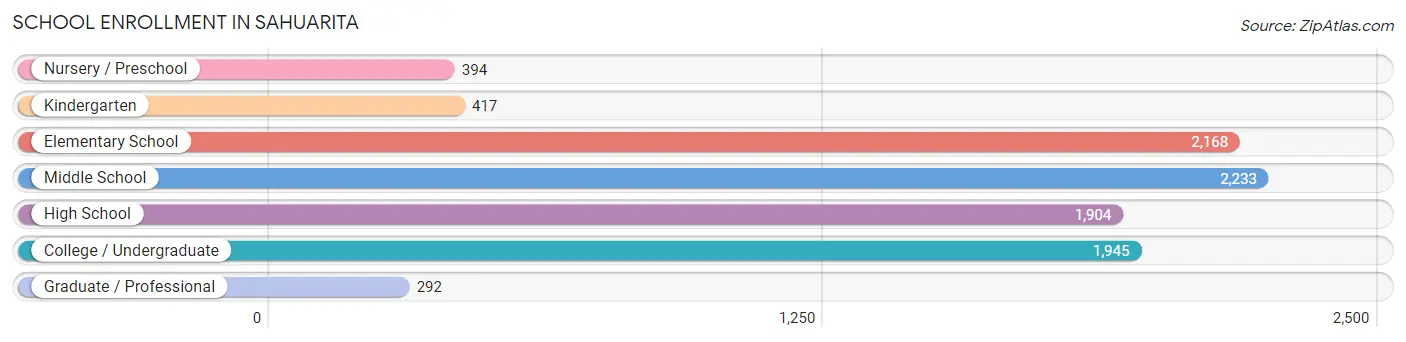
School Enrollment in Sahuarita
The most common levels of schooling among the 9,353 students in Sahuarita are middle school (2,233 | 23.9%), elementary school (2,168 | 23.2%), and college / undergraduate (1,945 | 20.8%).
| School Level | # Students | % Students |
| Nursery / Preschool | 394 | 4.2% |
| Kindergarten | 417 | 4.5% |
| Elementary School | 2,168 | 23.2% |
| Middle School | 2,233 | 23.9% |
| High School | 1,904 | 20.4% |
| College / Undergraduate | 1,945 | 20.8% |
| Graduate / Professional | 292 | 3.1% |
| Total | 9,353 | 100.0% |
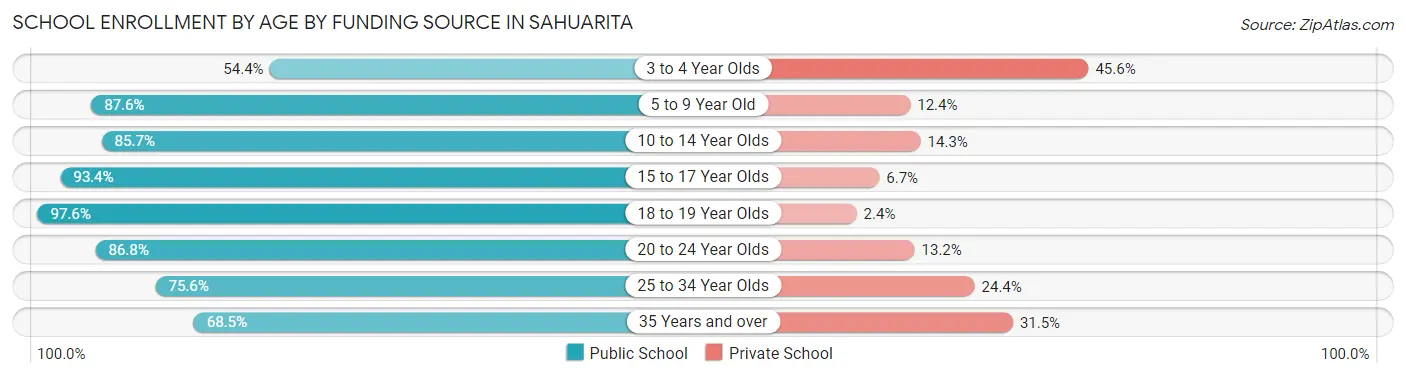
School Enrollment by Age by Funding Source in Sahuarita
Out of a total of 9,353 students who are enrolled in schools in Sahuarita, 1,281 (13.7%) attend a private institution, while the remaining 8,072 (86.3%) are enrolled in public schools. The age group of 3 to 4 year olds has the highest likelihood of being enrolled in private schools, with 88 (45.6% in the age bracket) enrolled. Conversely, the age group of 18 to 19 year olds has the lowest likelihood of being enrolled in a private school, with 767 (97.6% in the age bracket) attending a public institution.
| Age Bracket | Public School | Private School |
| 3 to 4 Year Olds | 105 (54.4%) | 88 (45.6%) |
| 5 to 9 Year Old | 2,181 (87.6%) | 309 (12.4%) |
| 10 to 14 Year Olds | 2,300 (85.7%) | 385 (14.3%) |
| 15 to 17 Year Olds | 1,347 (93.3%) | 96 (6.7%) |
| 18 to 19 Year Olds | 767 (97.6%) | 19 (2.4%) |
| 20 to 24 Year Olds | 670 (86.8%) | 102 (13.2%) |
| 25 to 34 Year Olds | 310 (75.6%) | 100 (24.4%) |
| 35 Years and over | 393 (68.5%) | 181 (31.5%) |
| Total | 8,072 (86.3%) | 1,281 (13.7%) |
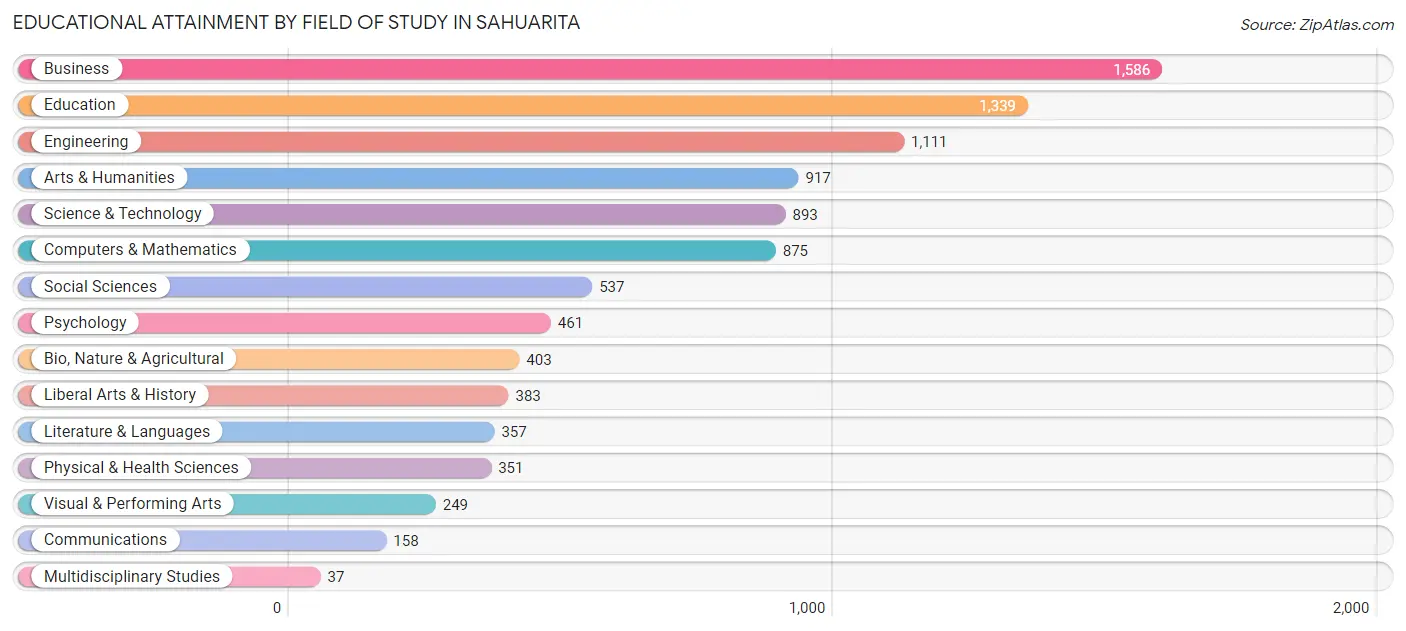
Educational Attainment by Field of Study in Sahuarita
Business (1,586 | 16.4%), education (1,339 | 13.9%), engineering (1,111 | 11.5%), arts & humanities (917 | 9.5%), and science & technology (893 | 9.2%) are the most common fields of study among 9,657 individuals in Sahuarita who have obtained a bachelor's degree or higher.
| Field of Study | # Graduates | % Graduates |
| Computers & Mathematics | 875 | 9.1% |
| Bio, Nature & Agricultural | 403 | 4.2% |
| Physical & Health Sciences | 351 | 3.6% |
| Psychology | 461 | 4.8% |
| Social Sciences | 537 | 5.6% |
| Engineering | 1,111 | 11.5% |
| Multidisciplinary Studies | 37 | 0.4% |
| Science & Technology | 893 | 9.2% |
| Business | 1,586 | 16.4% |
| Education | 1,339 | 13.9% |
| Literature & Languages | 357 | 3.7% |
| Liberal Arts & History | 383 | 4.0% |
| Visual & Performing Arts | 249 | 2.6% |
| Communications | 158 | 1.6% |
| Arts & Humanities | 917 | 9.5% |
| Total | 9,657 | 100.0% |
Transportation & Commute in Sahuarita
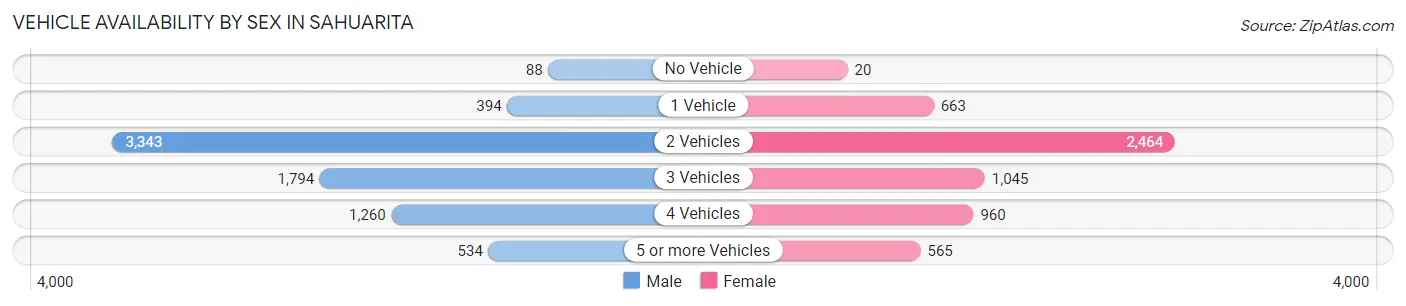
Vehicle Availability by Sex in Sahuarita
The most prevalent vehicle ownership categories in Sahuarita are males with 2 vehicles (3,343, accounting for 45.1%) and females with 2 vehicles (2,464, making up 58.5%).
| Vehicles Available | Male | Female |
| No Vehicle | 88 (1.2%) | 20 (0.4%) |
| 1 Vehicle | 394 (5.3%) | 663 (11.6%) |
| 2 Vehicles | 3,343 (45.1%) | 2,464 (43.1%) |
| 3 Vehicles | 1,794 (24.2%) | 1,045 (18.3%) |
| 4 Vehicles | 1,260 (17.0%) | 960 (16.8%) |
| 5 or more Vehicles | 534 (7.2%) | 565 (9.9%) |
| Total | 7,413 (100.0%) | 5,717 (100.0%) |
Commute Time in Sahuarita
The most frequently occuring commute durations in Sahuarita are 20 to 24 minutes (1,750 commuters, 15.2%), 30 to 34 minutes (1,718 commuters, 14.9%), and 25 to 29 minutes (1,480 commuters, 12.9%).
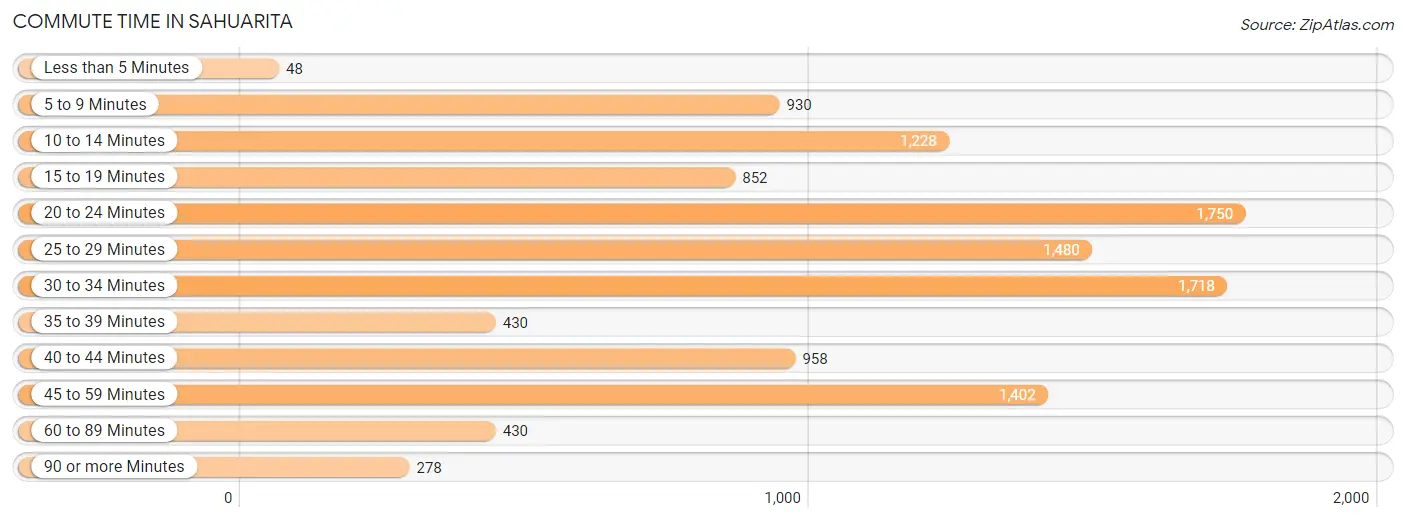
| Commute Time | # Commuters | % Commuters |
| Less than 5 Minutes | 48 | 0.4% |
| 5 to 9 Minutes | 930 | 8.1% |
| 10 to 14 Minutes | 1,228 | 10.7% |
| 15 to 19 Minutes | 852 | 7.4% |
| 20 to 24 Minutes | 1,750 | 15.2% |
| 25 to 29 Minutes | 1,480 | 12.9% |
| 30 to 34 Minutes | 1,718 | 14.9% |
| 35 to 39 Minutes | 430 | 3.7% |
| 40 to 44 Minutes | 958 | 8.3% |
| 45 to 59 Minutes | 1,402 | 12.2% |
| 60 to 89 Minutes | 430 | 3.7% |
| 90 or more Minutes | 278 | 2.4% |
Commute Time by Sex in Sahuarita
The most common commute times in Sahuarita are 30 to 34 minutes (1,049 commuters, 16.5%) for males and 20 to 24 minutes (914 commuters, 17.8%) for females.
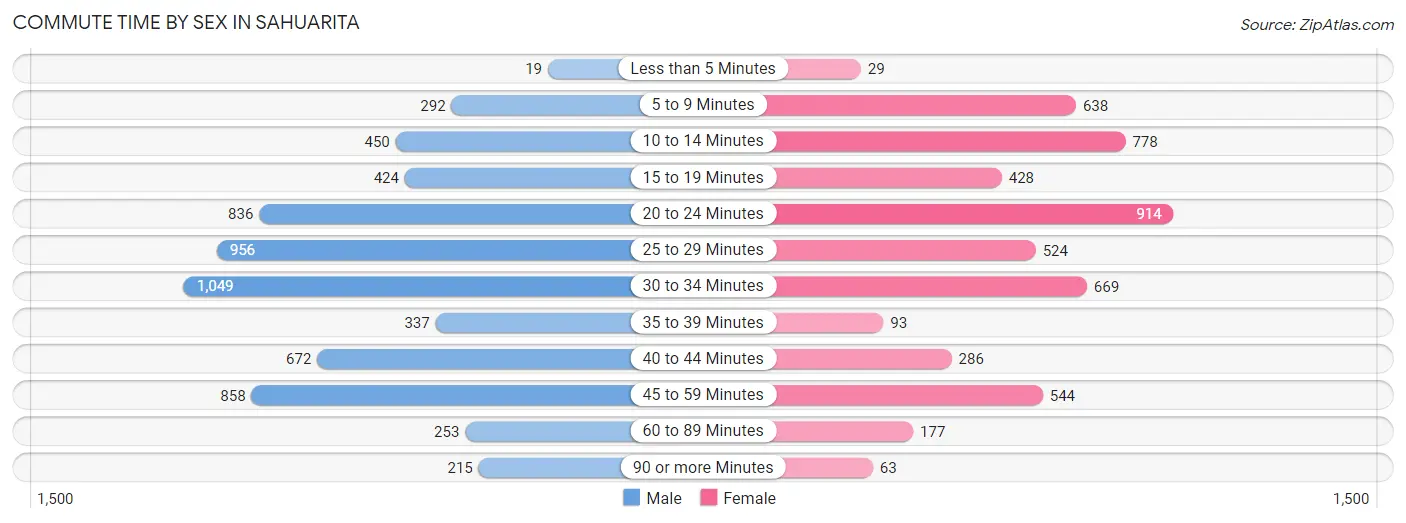
| Commute Time | Male | Female |
| Less than 5 Minutes | 19 (0.3%) | 29 (0.6%) |
| 5 to 9 Minutes | 292 (4.6%) | 638 (12.4%) |
| 10 to 14 Minutes | 450 (7.1%) | 778 (15.1%) |
| 15 to 19 Minutes | 424 (6.7%) | 428 (8.3%) |
| 20 to 24 Minutes | 836 (13.1%) | 914 (17.8%) |
| 25 to 29 Minutes | 956 (15.0%) | 524 (10.2%) |
| 30 to 34 Minutes | 1,049 (16.5%) | 669 (13.0%) |
| 35 to 39 Minutes | 337 (5.3%) | 93 (1.8%) |
| 40 to 44 Minutes | 672 (10.6%) | 286 (5.6%) |
| 45 to 59 Minutes | 858 (13.5%) | 544 (10.6%) |
| 60 to 89 Minutes | 253 (4.0%) | 177 (3.4%) |
| 90 or more Minutes | 215 (3.4%) | 63 (1.2%) |
Time of Departure to Work by Sex in Sahuarita
The most frequent times of departure to work in Sahuarita are 7:00 AM to 7:29 AM (1,318, 20.7%) for males and 7:30 AM to 7:59 AM (875, 17.0%) for females.
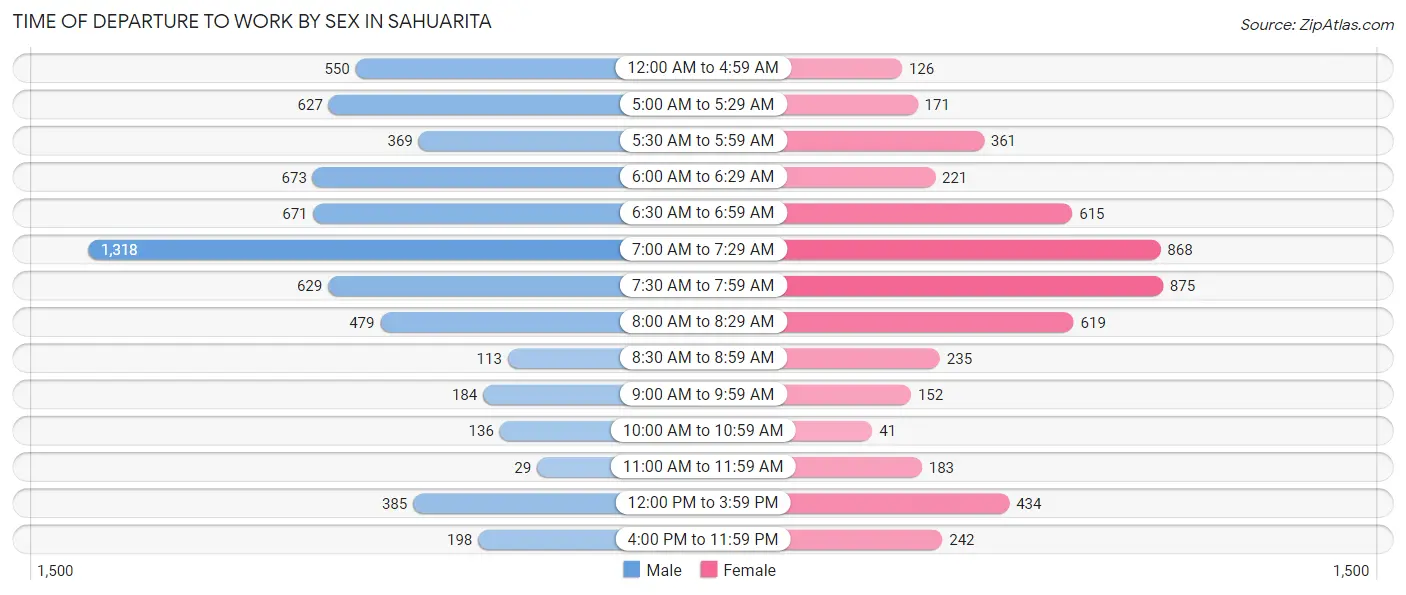
| Time of Departure | Male | Female |
| 12:00 AM to 4:59 AM | 550 (8.6%) | 126 (2.5%) |
| 5:00 AM to 5:29 AM | 627 (9.9%) | 171 (3.3%) |
| 5:30 AM to 5:59 AM | 369 (5.8%) | 361 (7.0%) |
| 6:00 AM to 6:29 AM | 673 (10.6%) | 221 (4.3%) |
| 6:30 AM to 6:59 AM | 671 (10.5%) | 615 (12.0%) |
| 7:00 AM to 7:29 AM | 1,318 (20.7%) | 868 (16.9%) |
| 7:30 AM to 7:59 AM | 629 (9.9%) | 875 (17.0%) |
| 8:00 AM to 8:29 AM | 479 (7.5%) | 619 (12.0%) |
| 8:30 AM to 8:59 AM | 113 (1.8%) | 235 (4.6%) |
| 9:00 AM to 9:59 AM | 184 (2.9%) | 152 (3.0%) |
| 10:00 AM to 10:59 AM | 136 (2.1%) | 41 (0.8%) |
| 11:00 AM to 11:59 AM | 29 (0.5%) | 183 (3.6%) |
| 12:00 PM to 3:59 PM | 385 (6.0%) | 434 (8.4%) |
| 4:00 PM to 11:59 PM | 198 (3.1%) | 242 (4.7%) |
| Total | 6,361 (100.0%) | 5,143 (100.0%) |
Housing Occupancy in Sahuarita
Occupancy by Ownership in Sahuarita
Of the total 11,698 dwellings in Sahuarita, owner-occupied units account for 9,420 (80.5%), while renter-occupied units make up 2,278 (19.5%).
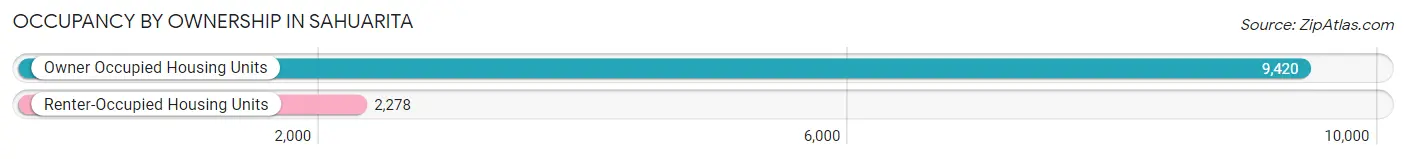
| Occupancy | # Housing Units | % Housing Units |
| Owner Occupied Housing Units | 9,420 | 80.5% |
| Renter-Occupied Housing Units | 2,278 | 19.5% |
| Total Occupied Housing Units | 11,698 | 100.0% |
Occupancy by Household Size in Sahuarita
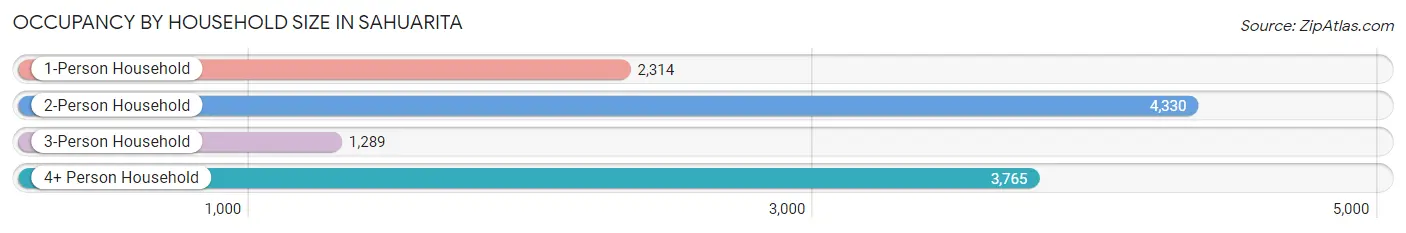
| Household Size | # Housing Units | % Housing Units |
| 1-Person Household | 2,314 | 19.8% |
| 2-Person Household | 4,330 | 37.0% |
| 3-Person Household | 1,289 | 11.0% |
| 4+ Person Household | 3,765 | 32.2% |
| Total Housing Units | 11,698 | 100.0% |
Occupancy by Ownership by Household Size in Sahuarita
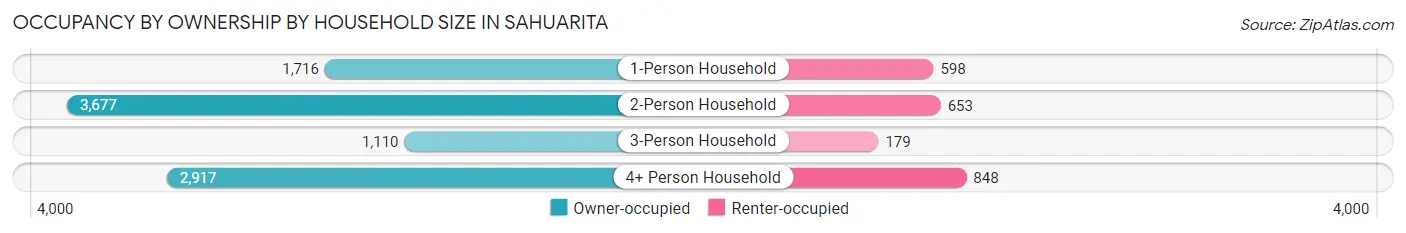
| Household Size | Owner-occupied | Renter-occupied |
| 1-Person Household | 1,716 (74.2%) | 598 (25.8%) |
| 2-Person Household | 3,677 (84.9%) | 653 (15.1%) |
| 3-Person Household | 1,110 (86.1%) | 179 (13.9%) |
| 4+ Person Household | 2,917 (77.5%) | 848 (22.5%) |
| Total Housing Units | 9,420 (80.5%) | 2,278 (19.5%) |
Occupancy by Educational Attainment in Sahuarita
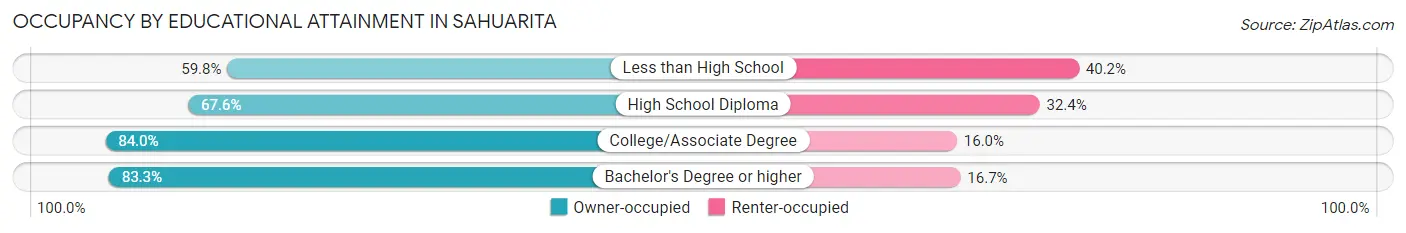
| Household Size | Owner-occupied | Renter-occupied |
| Less than High School | 253 (59.8%) | 170 (40.2%) |
| High School Diploma | 1,087 (67.6%) | 521 (32.4%) |
| College/Associate Degree | 3,298 (84.0%) | 628 (16.0%) |
| Bachelor's Degree or higher | 4,782 (83.3%) | 959 (16.7%) |
Occupancy by Age of Householder in Sahuarita
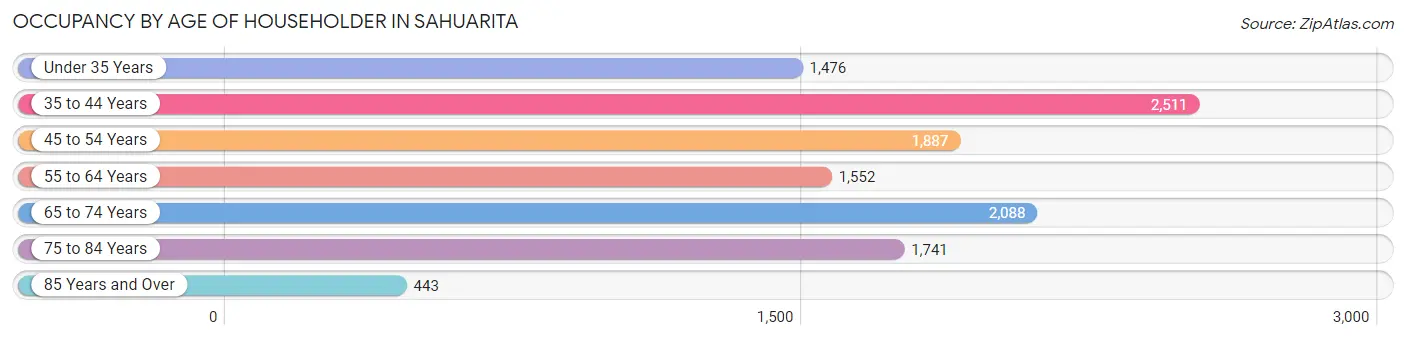
| Age Bracket | # Households | % Households |
| Under 35 Years | 1,476 | 12.6% |
| 35 to 44 Years | 2,511 | 21.5% |
| 45 to 54 Years | 1,887 | 16.1% |
| 55 to 64 Years | 1,552 | 13.3% |
| 65 to 74 Years | 2,088 | 17.8% |
| 75 to 84 Years | 1,741 | 14.9% |
| 85 Years and Over | 443 | 3.8% |
| Total | 11,698 | 100.0% |
Housing Finances in Sahuarita
Median Income by Occupancy in Sahuarita
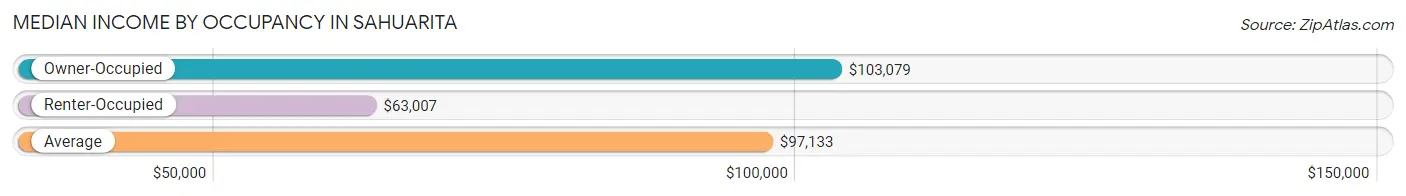
| Occupancy Type | # Households | Median Income |
| Owner-Occupied | 9,420 (80.5%) | $103,079 |
| Renter-Occupied | 2,278 (19.5%) | $63,007 |
| Average | 11,698 (100.0%) | $97,133 |
Occupancy by Householder Income Bracket in Sahuarita
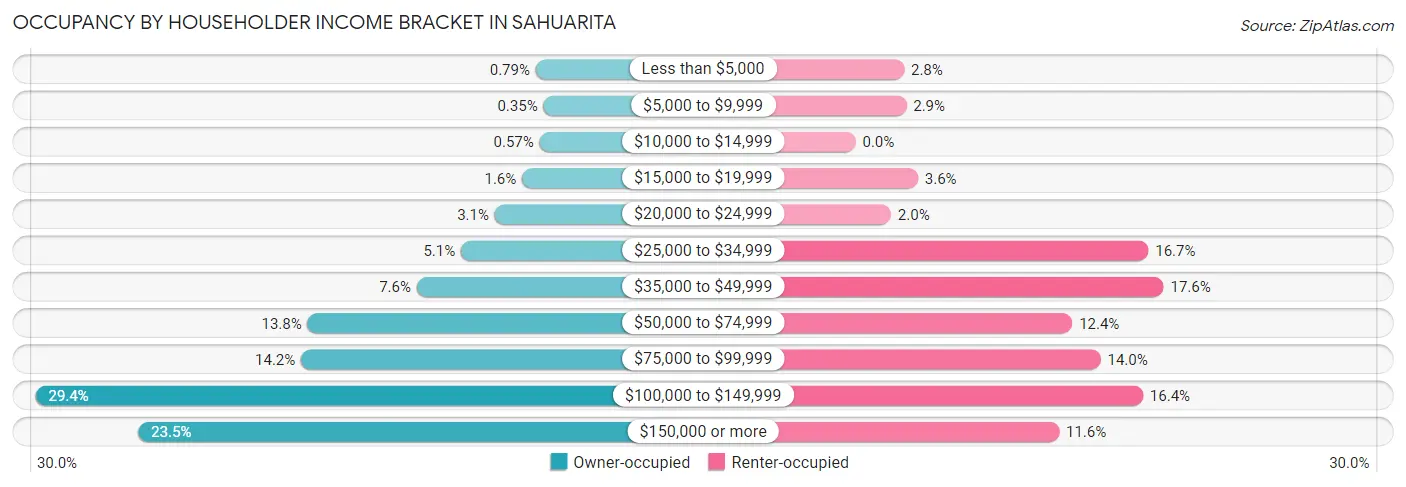
| Income Bracket | Owner-occupied | Renter-occupied |
| Less than $5,000 | 74 (0.8%) | 63 (2.8%) |
| $5,000 to $9,999 | 33 (0.4%) | 66 (2.9%) |
| $10,000 to $14,999 | 54 (0.6%) | 0 (0.0%) |
| $15,000 to $19,999 | 148 (1.6%) | 81 (3.6%) |
| $20,000 to $24,999 | 295 (3.1%) | 46 (2.0%) |
| $25,000 to $34,999 | 477 (5.1%) | 381 (16.7%) |
| $35,000 to $49,999 | 715 (7.6%) | 401 (17.6%) |
| $50,000 to $74,999 | 1,303 (13.8%) | 282 (12.4%) |
| $75,000 to $99,999 | 1,338 (14.2%) | 319 (14.0%) |
| $100,000 to $149,999 | 2,768 (29.4%) | 374 (16.4%) |
| $150,000 or more | 2,215 (23.5%) | 265 (11.6%) |
| Total | 9,420 (100.0%) | 2,278 (100.0%) |
Monthly Housing Cost Tiers in Sahuarita
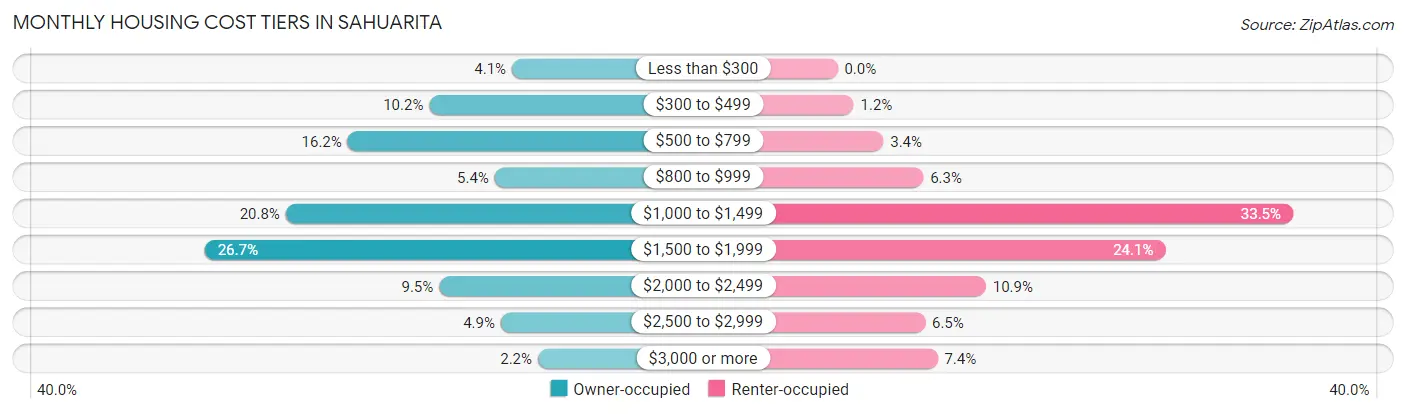
| Monthly Cost | Owner-occupied | Renter-occupied |
| Less than $300 | 387 (4.1%) | 0 (0.0%) |
| $300 to $499 | 961 (10.2%) | 27 (1.2%) |
| $500 to $799 | 1,527 (16.2%) | 77 (3.4%) |
| $800 to $999 | 507 (5.4%) | 144 (6.3%) |
| $1,000 to $1,499 | 1,957 (20.8%) | 764 (33.5%) |
| $1,500 to $1,999 | 2,518 (26.7%) | 550 (24.1%) |
| $2,000 to $2,499 | 892 (9.5%) | 249 (10.9%) |
| $2,500 to $2,999 | 464 (4.9%) | 147 (6.5%) |
| $3,000 or more | 207 (2.2%) | 168 (7.4%) |
| Total | 9,420 (100.0%) | 2,278 (100.0%) |
Physical Housing Characteristics in Sahuarita
Housing Structures in Sahuarita
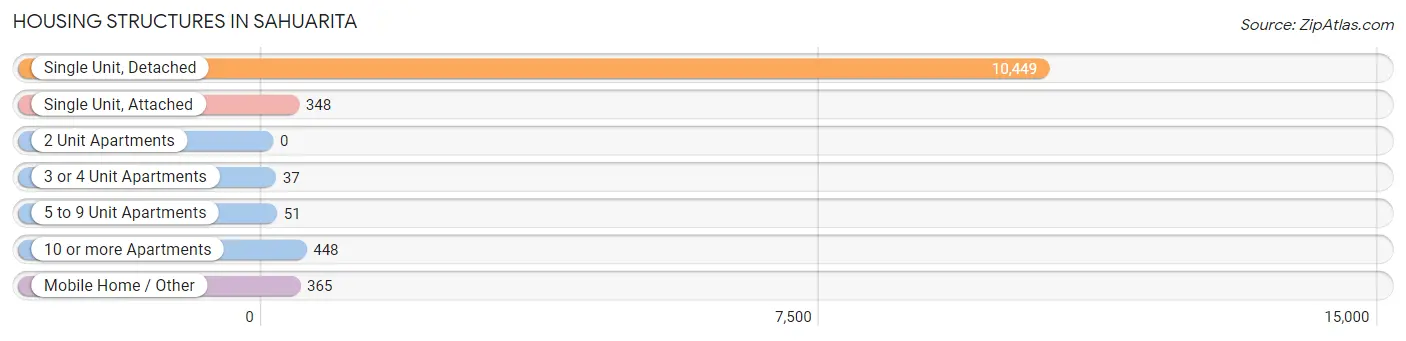
| Structure Type | # Housing Units | % Housing Units |
| Single Unit, Detached | 10,449 | 89.3% |
| Single Unit, Attached | 348 | 3.0% |
| 2 Unit Apartments | 0 | 0.0% |
| 3 or 4 Unit Apartments | 37 | 0.3% |
| 5 to 9 Unit Apartments | 51 | 0.4% |
| 10 or more Apartments | 448 | 3.8% |
| Mobile Home / Other | 365 | 3.1% |
| Total | 11,698 | 100.0% |
Housing Structures by Occupancy in Sahuarita
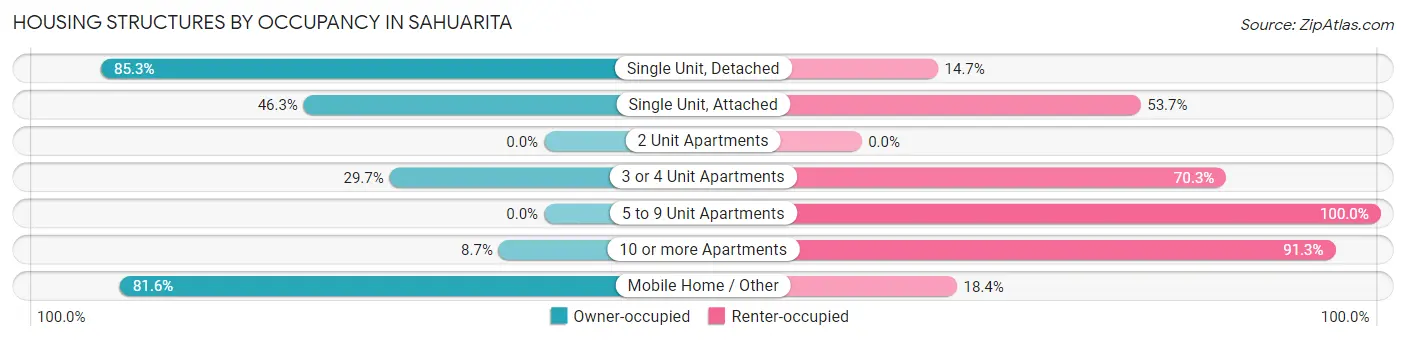
| Structure Type | Owner-occupied | Renter-occupied |
| Single Unit, Detached | 8,911 (85.3%) | 1,538 (14.7%) |
| Single Unit, Attached | 161 (46.3%) | 187 (53.7%) |
| 2 Unit Apartments | 0 (0.0%) | 0 (0.0%) |
| 3 or 4 Unit Apartments | 11 (29.7%) | 26 (70.3%) |
| 5 to 9 Unit Apartments | 0 (0.0%) | 51 (100.0%) |
| 10 or more Apartments | 39 (8.7%) | 409 (91.3%) |
| Mobile Home / Other | 298 (81.6%) | 67 (18.4%) |
| Total | 9,420 (80.5%) | 2,278 (19.5%) |
Housing Structures by Number of Rooms in Sahuarita
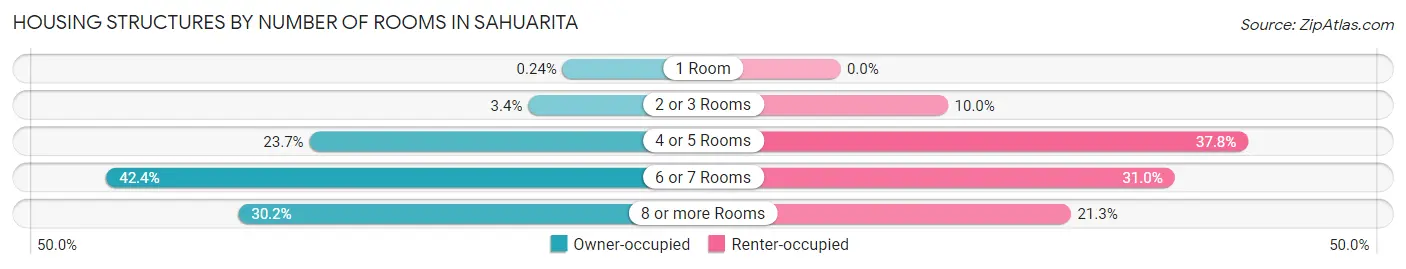
| Number of Rooms | Owner-occupied | Renter-occupied |
| 1 Room | 23 (0.2%) | 0 (0.0%) |
| 2 or 3 Rooms | 322 (3.4%) | 227 (10.0%) |
| 4 or 5 Rooms | 2,229 (23.7%) | 860 (37.8%) |
| 6 or 7 Rooms | 3,998 (42.4%) | 705 (30.9%) |
| 8 or more Rooms | 2,848 (30.2%) | 486 (21.3%) |
| Total | 9,420 (100.0%) | 2,278 (100.0%) |
Housing Structure by Heating Type in Sahuarita
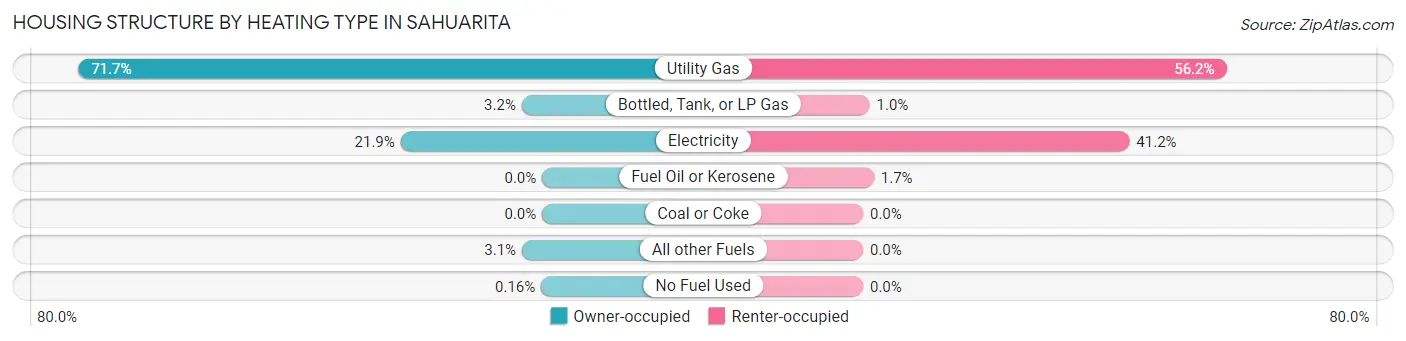
| Heating Type | Owner-occupied | Renter-occupied |
| Utility Gas | 6,754 (71.7%) | 1,279 (56.1%) |
| Bottled, Tank, or LP Gas | 297 (3.2%) | 23 (1.0%) |
| Electricity | 2,060 (21.9%) | 938 (41.2%) |
| Fuel Oil or Kerosene | 0 (0.0%) | 38 (1.7%) |
| Coal or Coke | 0 (0.0%) | 0 (0.0%) |
| All other Fuels | 294 (3.1%) | 0 (0.0%) |
| No Fuel Used | 15 (0.2%) | 0 (0.0%) |
| Total | 9,420 (100.0%) | 2,278 (100.0%) |
Household Vehicle Usage in Sahuarita
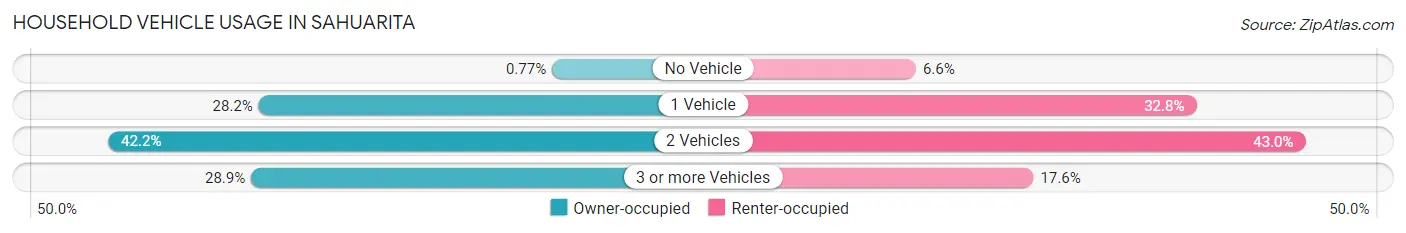
| Vehicles per Household | Owner-occupied | Renter-occupied |
| No Vehicle | 73 (0.8%) | 151 (6.6%) |
| 1 Vehicle | 2,652 (28.1%) | 747 (32.8%) |
| 2 Vehicles | 3,976 (42.2%) | 979 (43.0%) |
| 3 or more Vehicles | 2,719 (28.9%) | 401 (17.6%) |
| Total | 9,420 (100.0%) | 2,278 (100.0%) |
Real Estate & Mortgages in Sahuarita
Real Estate and Mortgage Overview in Sahuarita
| Characteristic | Without Mortgage | With Mortgage |
| Housing Units | 2,881 | 6,539 |
| Median Property Value | $311,300 | $315,700 |
| Median Household Income | $84,365 | $1,709 |
| Monthly Housing Costs | $522 | $191 |
| Real Estate Taxes | $2,610 | $63 |
Property Value by Mortgage Status in Sahuarita
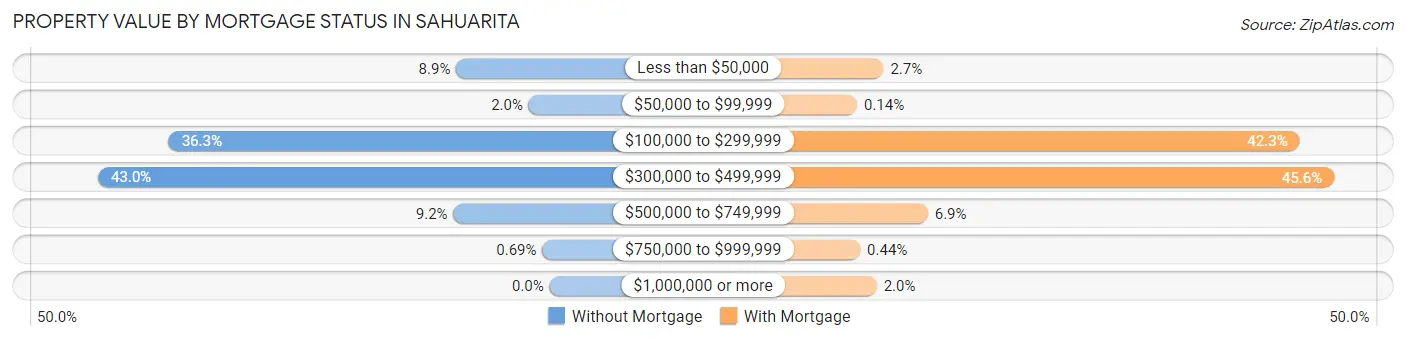
| Property Value | Without Mortgage | With Mortgage |
| Less than $50,000 | 256 (8.9%) | 174 (2.7%) |
| $50,000 to $99,999 | 57 (2.0%) | 9 (0.1%) |
| $100,000 to $299,999 | 1,045 (36.3%) | 2,765 (42.3%) |
| $300,000 to $499,999 | 1,239 (43.0%) | 2,980 (45.6%) |
| $500,000 to $749,999 | 264 (9.2%) | 450 (6.9%) |
| $750,000 to $999,999 | 20 (0.7%) | 29 (0.4%) |
| $1,000,000 or more | 0 (0.0%) | 132 (2.0%) |
| Total | 2,881 (100.0%) | 6,539 (100.0%) |
Household Income by Mortgage Status in Sahuarita
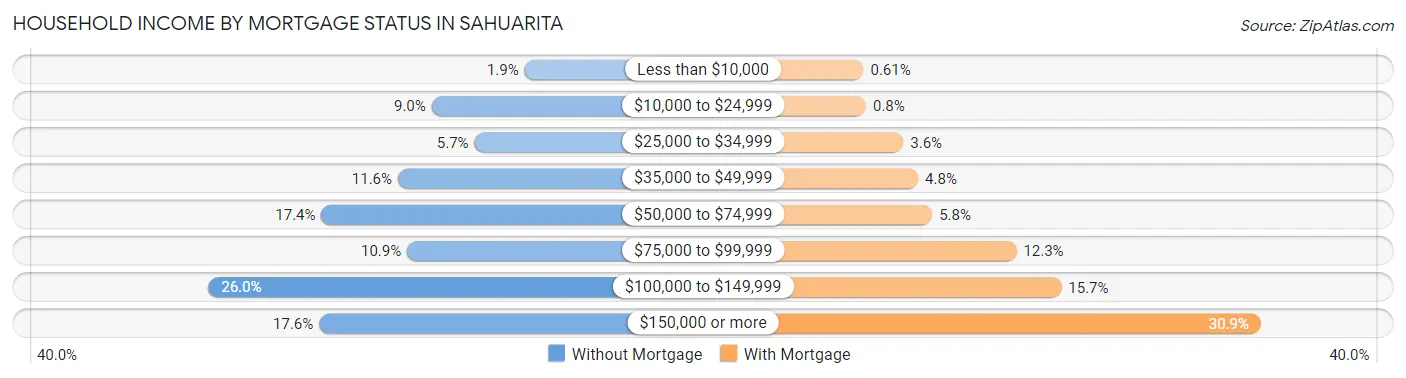
| Household Income | Without Mortgage | With Mortgage |
| Less than $10,000 | 55 (1.9%) | 40 (0.6%) |
| $10,000 to $24,999 | 259 (9.0%) | 52 (0.8%) |
| $25,000 to $34,999 | 165 (5.7%) | 238 (3.6%) |
| $35,000 to $49,999 | 333 (11.6%) | 312 (4.8%) |
| $50,000 to $74,999 | 501 (17.4%) | 382 (5.8%) |
| $75,000 to $99,999 | 313 (10.9%) | 802 (12.3%) |
| $100,000 to $149,999 | 749 (26.0%) | 1,025 (15.7%) |
| $150,000 or more | 506 (17.6%) | 2,019 (30.9%) |
| Total | 2,881 (100.0%) | 6,539 (100.0%) |
Property Value to Household Income Ratio in Sahuarita
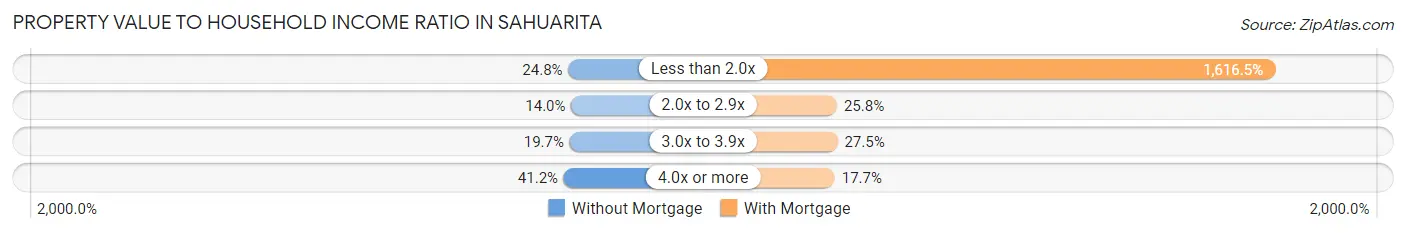
| Value-to-Income Ratio | Without Mortgage | With Mortgage |
| Less than 2.0x | 713 (24.7%) | 105,700 (1,616.5%) |
| 2.0x to 2.9x | 404 (14.0%) | 1,684 (25.8%) |
| 3.0x to 3.9x | 566 (19.7%) | 1,796 (27.5%) |
| 4.0x or more | 1,187 (41.2%) | 1,158 (17.7%) |
| Total | 2,881 (100.0%) | 6,539 (100.0%) |
Real Estate Taxes by Mortgage Status in Sahuarita
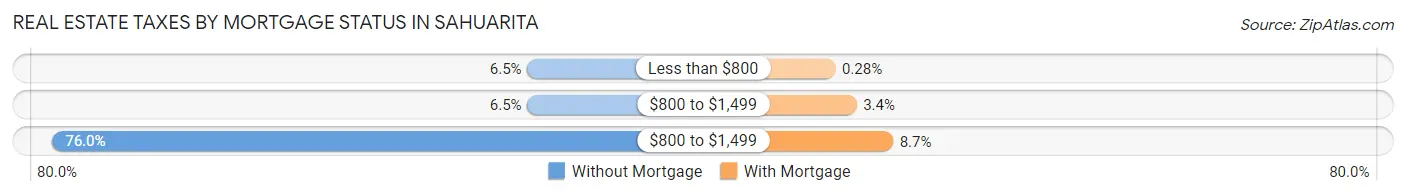
| Property Taxes | Without Mortgage | With Mortgage |
| Less than $800 | 188 (6.5%) | 18 (0.3%) |
| $800 to $1,499 | 188 (6.5%) | 221 (3.4%) |
| $800 to $1,499 | 2,188 (75.9%) | 570 (8.7%) |
| Total | 2,881 (100.0%) | 6,539 (100.0%) |
Health & Disability in Sahuarita
Health Insurance Coverage by Age in Sahuarita
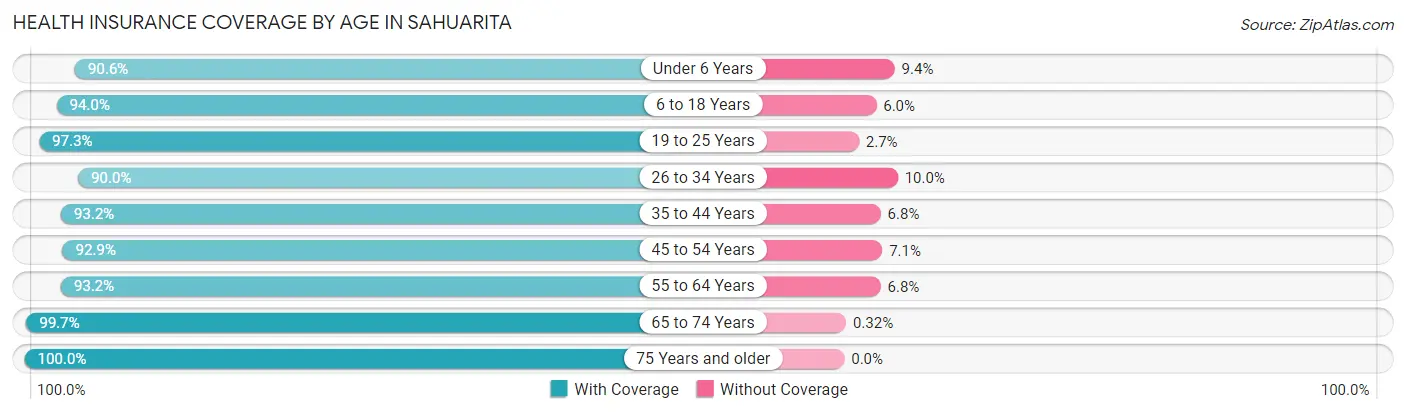
| Age Bracket | With Coverage | Without Coverage |
| Under 6 Years | 2,713 (90.6%) | 281 (9.4%) |
| 6 to 18 Years | 6,988 (94.0%) | 443 (6.0%) |
| 19 to 25 Years | 2,183 (97.3%) | 61 (2.7%) |
| 26 to 34 Years | 2,730 (90.0%) | 302 (10.0%) |
| 35 to 44 Years | 4,412 (93.2%) | 321 (6.8%) |
| 45 to 54 Years | 3,150 (92.9%) | 240 (7.1%) |
| 55 to 64 Years | 2,825 (93.2%) | 205 (6.8%) |
| 65 to 74 Years | 3,714 (99.7%) | 12 (0.3%) |
| 75 Years and older | 3,340 (100.0%) | 0 (0.0%) |
| Total | 32,055 (94.5%) | 1,865 (5.5%) |
Health Insurance Coverage by Citizenship Status in Sahuarita
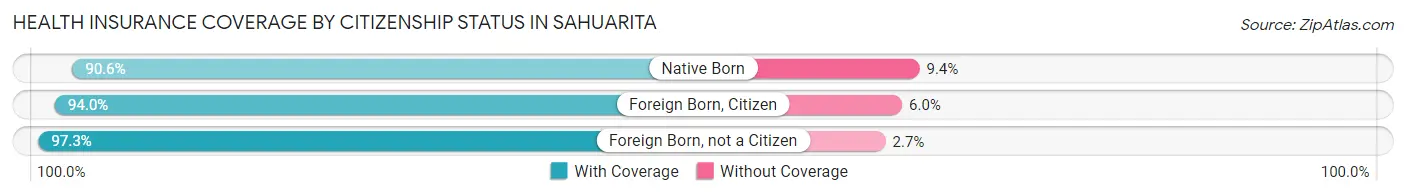
| Citizenship Status | With Coverage | Without Coverage |
| Native Born | 2,713 (90.6%) | 281 (9.4%) |
| Foreign Born, Citizen | 6,988 (94.0%) | 443 (6.0%) |
| Foreign Born, not a Citizen | 2,183 (97.3%) | 61 (2.7%) |
Health Insurance Coverage by Household Income in Sahuarita
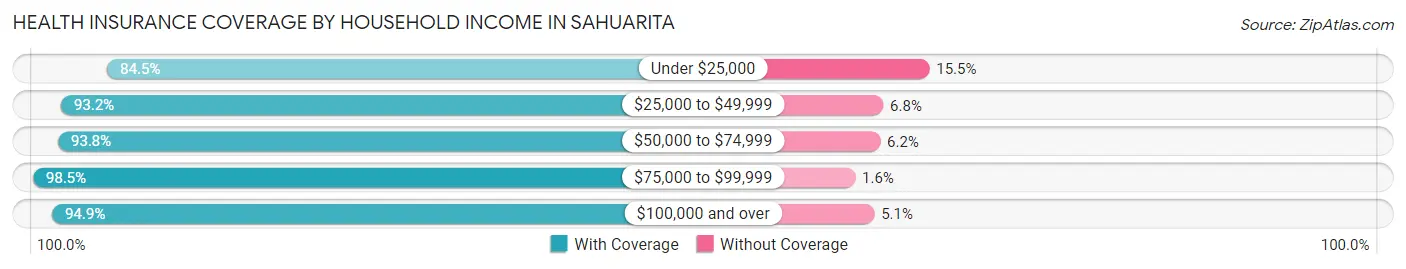
| Household Income | With Coverage | Without Coverage |
| Under $25,000 | 1,307 (84.5%) | 239 (15.5%) |
| $25,000 to $49,999 | 5,104 (93.2%) | 373 (6.8%) |
| $50,000 to $74,999 | 3,336 (93.8%) | 222 (6.2%) |
| $75,000 to $99,999 | 4,635 (98.5%) | 73 (1.5%) |
| $100,000 and over | 17,658 (94.9%) | 956 (5.1%) |
Public vs Private Health Insurance Coverage by Age in Sahuarita
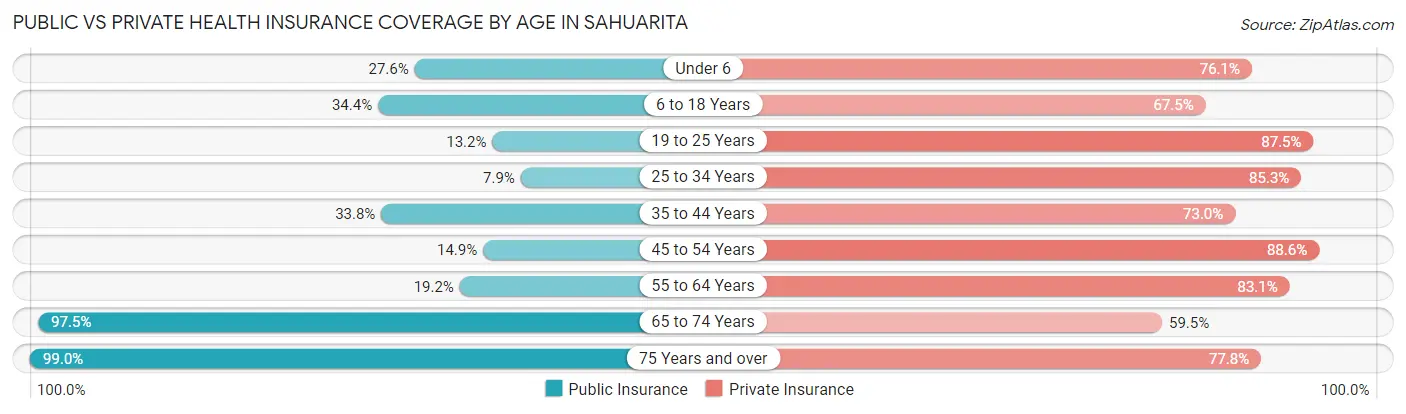
| Age Bracket | Public Insurance | Private Insurance |
| Under 6 | 827 (27.6%) | 2,278 (76.1%) |
| 6 to 18 Years | 2,557 (34.4%) | 5,017 (67.5%) |
| 19 to 25 Years | 296 (13.2%) | 1,964 (87.5%) |
| 25 to 34 Years | 240 (7.9%) | 2,585 (85.3%) |
| 35 to 44 Years | 1,600 (33.8%) | 3,455 (73.0%) |
| 45 to 54 Years | 505 (14.9%) | 3,003 (88.6%) |
| 55 to 64 Years | 583 (19.2%) | 2,518 (83.1%) |
| 65 to 74 Years | 3,633 (97.5%) | 2,215 (59.5%) |
| 75 Years and over | 3,307 (99.0%) | 2,599 (77.8%) |
| Total | 13,548 (39.9%) | 25,634 (75.6%) |
Disability Status by Sex by Age in Sahuarita
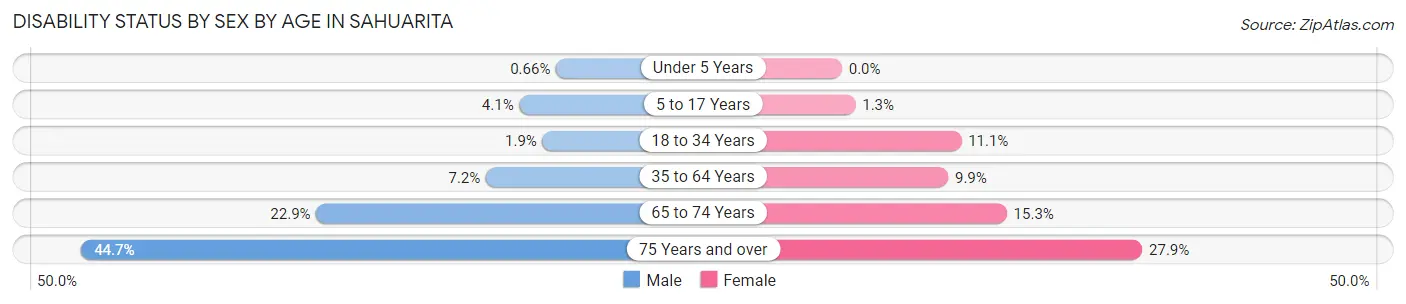
| Age Bracket | Male | Female |
| Under 5 Years | 8 (0.7%) | 0 (0.0%) |
| 5 to 17 Years | 140 (4.1%) | 46 (1.3%) |
| 18 to 34 Years | 59 (1.9%) | 347 (11.1%) |
| 35 to 64 Years | 386 (7.2%) | 569 (9.9%) |
| 65 to 74 Years | 397 (22.9%) | 305 (15.3%) |
| 75 Years and over | 727 (44.7%) | 478 (27.9%) |
Disability Class by Sex by Age in Sahuarita
Disability Class: Hearing Difficulty
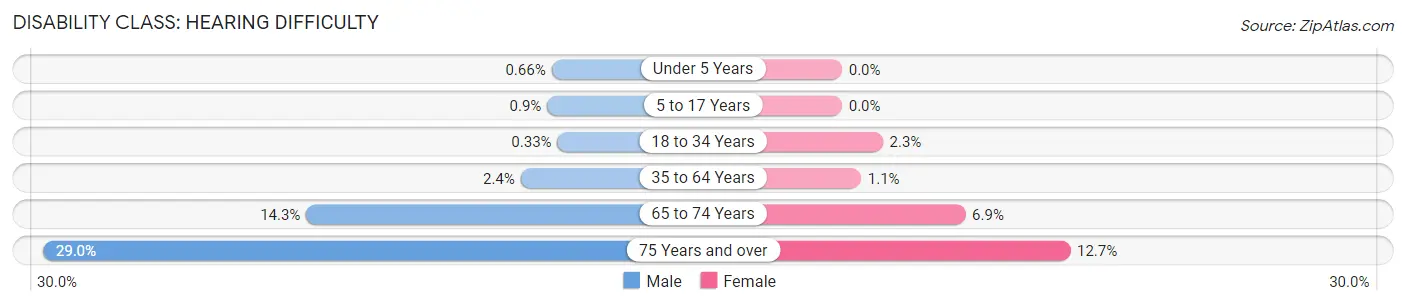
| Age Bracket | Male | Female |
| Under 5 Years | 8 (0.7%) | 0 (0.0%) |
| 5 to 17 Years | 31 (0.9%) | 0 (0.0%) |
| 18 to 34 Years | 10 (0.3%) | 71 (2.3%) |
| 35 to 64 Years | 128 (2.4%) | 61 (1.1%) |
| 65 to 74 Years | 248 (14.3%) | 137 (6.9%) |
| 75 Years and over | 471 (29.0%) | 218 (12.7%) |
Disability Class: Vision Difficulty
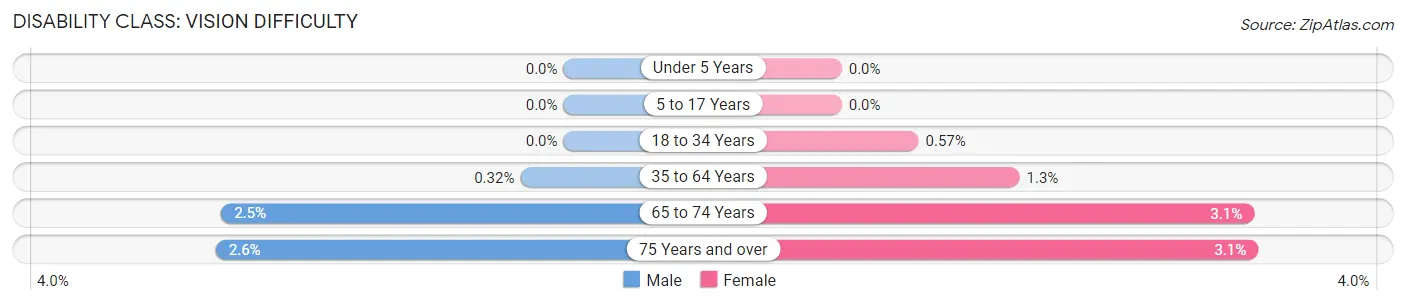
| Age Bracket | Male | Female |
| Under 5 Years | 0 (0.0%) | 0 (0.0%) |
| 5 to 17 Years | 0 (0.0%) | 0 (0.0%) |
| 18 to 34 Years | 0 (0.0%) | 18 (0.6%) |
| 35 to 64 Years | 17 (0.3%) | 76 (1.3%) |
| 65 to 74 Years | 44 (2.5%) | 61 (3.1%) |
| 75 Years and over | 42 (2.6%) | 53 (3.1%) |
Disability Class: Cognitive Difficulty
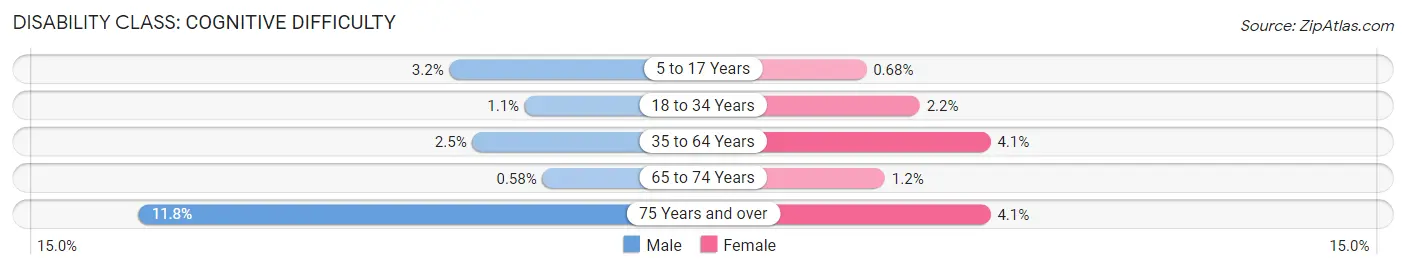
| Age Bracket | Male | Female |
| 5 to 17 Years | 109 (3.2%) | 25 (0.7%) |
| 18 to 34 Years | 33 (1.1%) | 68 (2.2%) |
| 35 to 64 Years | 136 (2.5%) | 239 (4.1%) |
| 65 to 74 Years | 10 (0.6%) | 24 (1.2%) |
| 75 Years and over | 192 (11.8%) | 71 (4.1%) |
Disability Class: Ambulatory Difficulty
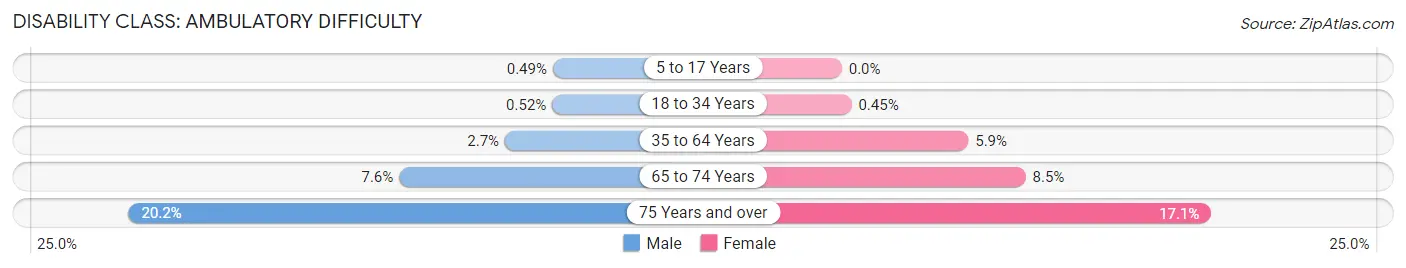
| Age Bracket | Male | Female |
| 5 to 17 Years | 17 (0.5%) | 0 (0.0%) |
| 18 to 34 Years | 16 (0.5%) | 14 (0.4%) |
| 35 to 64 Years | 146 (2.7%) | 339 (5.9%) |
| 65 to 74 Years | 132 (7.6%) | 170 (8.5%) |
| 75 Years and over | 328 (20.2%) | 294 (17.1%) |
Disability Class: Self-Care Difficulty
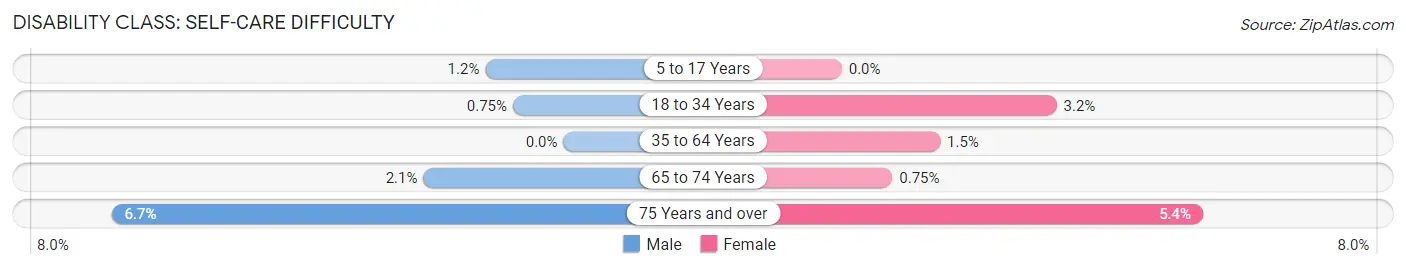
| Age Bracket | Male | Female |
| 5 to 17 Years | 40 (1.2%) | 0 (0.0%) |
| 18 to 34 Years | 23 (0.7%) | 100 (3.2%) |
| 35 to 64 Years | 0 (0.0%) | 84 (1.5%) |
| 65 to 74 Years | 36 (2.1%) | 15 (0.7%) |
| 75 Years and over | 109 (6.7%) | 92 (5.4%) |
Technology Access in Sahuarita
Computing Device Access in Sahuarita
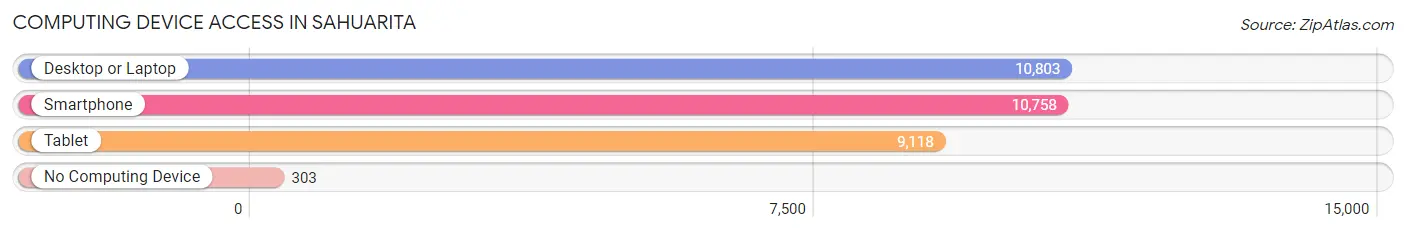
| Device Type | # Households | % Households |
| Desktop or Laptop | 10,803 | 92.3% |
| Smartphone | 10,758 | 92.0% |
| Tablet | 9,118 | 77.9% |
| No Computing Device | 303 | 2.6% |
| Total | 11,698 | 100.0% |
Internet Access in Sahuarita
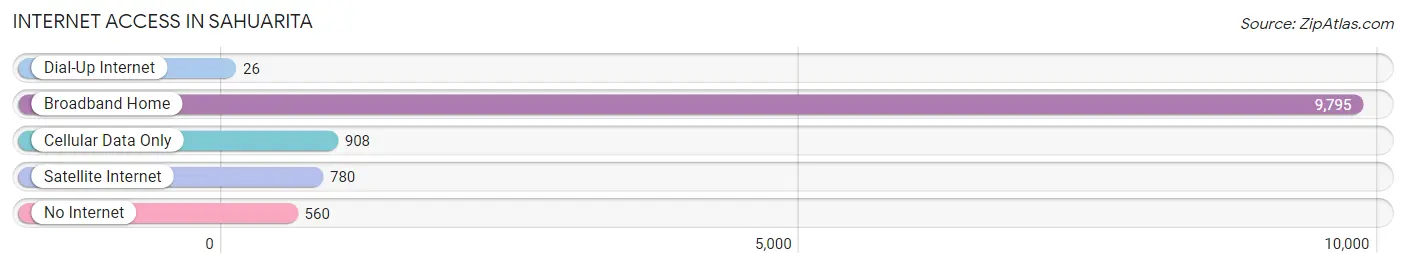
| Internet Type | # Households | % Households |
| Dial-Up Internet | 26 | 0.2% |
| Broadband Home | 9,795 | 83.7% |
| Cellular Data Only | 908 | 7.8% |
| Satellite Internet | 780 | 6.7% |
| No Internet | 560 | 4.8% |
| Total | 11,698 | 100.0% |
Sahuarita Summary
Sahuarita, Arizona is a small town located in Pima County, Arizona, about 30 miles south of Tucson. It is situated in the Santa Cruz Valley, which is part of the Sonoran Desert. The town was founded in 1911 and has a population of about 25,000 people.
History
Sahuarita was originally inhabited by the Tohono O’odham people, who were the first to settle in the area. The town was founded in 1911 by a group of ranchers who were looking for a place to raise cattle. The name Sahuarita comes from the Tohono O’odham word for “little saguaro”, which is a type of cactus that grows in the area.
In the early 1900s, the town was a small farming community, with a few stores and a post office. In the 1950s, the town began to grow as more people moved to the area. In the 1960s, the town was incorporated and the population began to grow rapidly.
Geography
Sahuarita is located in the Santa Cruz Valley, which is part of the Sonoran Desert. The town is situated at an elevation of 2,400 feet and is surrounded by mountains. The Santa Cruz River runs through the town, providing a source of water for the area.
The climate in Sahuarita is hot and dry, with temperatures ranging from the mid-90s in the summer to the mid-50s in the winter. The town receives an average of 11 inches of rain per year.
Economy
The economy of Sahuarita is largely based on agriculture and tourism. The town is home to several large farms, which produce a variety of crops, including cotton, alfalfa, and wheat. The town is also home to several wineries, which produce a variety of wines.
Tourism is also an important part of the economy. The town is home to several golf courses, as well as a number of parks and recreational areas. The town is also home to several museums, including the Sahuarita Historical Museum and the Sahuarita Railroad Museum.
Demographics
As of the 2010 census, the population of Sahuarita was 25,259. The town is predominantly white, with a population that is 79.3% white, 8.2% Hispanic or Latino, 5.2% Native American, and 4.3% Asian. The median household income in the town is $50,945, and the median home value is $179,400.
Sahuarita is a small town with a rich history and a vibrant economy. The town is home to a diverse population and offers a variety of recreational activities and attractions. The town is a great place to live, work, and play.
Common Questions
What is the Total Population of Sahuarita?
Total Population of Sahuarita is 34,238.
What is the Total Male Population of Sahuarita?
Total Male Population of Sahuarita is 16,620.
What is the Total Female Population of Sahuarita?
Total Female Population of Sahuarita is 17,618.
What is the Ratio of Males per 100 Females in Sahuarita?
There are 94.34 Males per 100 Females in Sahuarita.
What is the Ratio of Females per 100 Males in Sahuarita?
There are 106.00 Females per 100 Males in Sahuarita.
What is the Median Population Age in Sahuarita?
Median Population Age in Sahuarita is 37.1 Years.
What is the Average Family Size in Sahuarita
Average Family Size in Sahuarita is 3.4 People.
What is the Average Household Size in Sahuarita
Average Household Size in Sahuarita is 2.9 People.
What is Per Capita Income in Sahuarita?
Per Capita income in Sahuarita is $38,226.
What is the Median Family Income in Sahuarita?
Median Family Income in Sahuarita is $104,834.
What is the Median Household income in Sahuarita?
Median Household Income in Sahuarita is $97,133.
What is Income or Wage Gap in Sahuarita?
Income or Wage Gap in Sahuarita is 44.9%.
Women in Sahuarita earn 55.1 cents for every dollar earned by a man.
What is Inequality or Gini Index in Sahuarita?
Inequality or Gini Index in Sahuarita is 0.39.
How Large is the Labor Force in Sahuarita?
There are 14,368 People in the Labor Forcein in Sahuarita.
What is the Percentage of People in the Labor Force in Sahuarita?
56.1% of People are in the Labor Force in Sahuarita.
What is the Unemployment Rate in Sahuarita?
Unemployment Rate in Sahuarita is 6.7%.