Strawberry, AZ
Strawberry Map
Strawberry Overview
1,003
TOTAL POPULATION
492
MALE POPULATION
511
FEMALE POPULATION
96.28
MALES / 100 FEMALES
103.86
FEMALES / 100 MALES
63.7
MEDIAN AGE
2.4
AVG FAMILY SIZE
1.9
AVG HOUSEHOLD SIZE
$37,432
PER CAPITA INCOME
$70,938
AVG FAMILY INCOME
$43,083
AVG HOUSEHOLD INCOME
0.44
INEQUALITY / GINI INDEX
355
LABOR FORCE [ PEOPLE ]
39.4%
PERCENT IN LABOR FORCE
Strawberry Area Codes
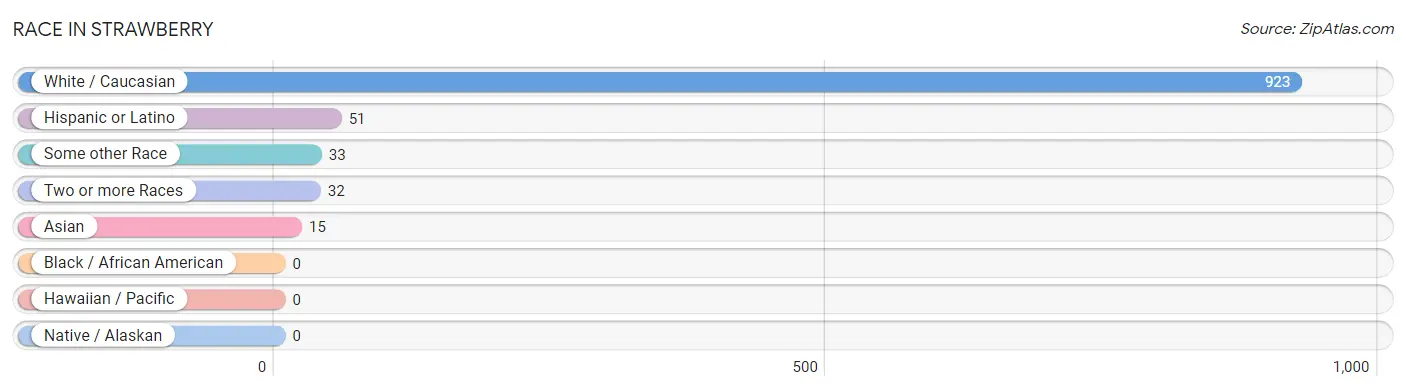
Race in Strawberry
The most populous races in Strawberry are White / Caucasian (923 | 92.0%), Hispanic or Latino (51 | 5.1%), and Some other Race (33 | 3.3%).
| Race | # Population | % Population |
| Asian | 15 | 1.5% |
| Black / African American | 0 | 0.0% |
| Hawaiian / Pacific | 0 | 0.0% |
| Hispanic or Latino | 51 | 5.1% |
| Native / Alaskan | 0 | 0.0% |
| White / Caucasian | 923 | 92.0% |
| Two or more Races | 32 | 3.2% |
| Some other Race | 33 | 3.3% |
| Total | 1,003 | 100.0% |
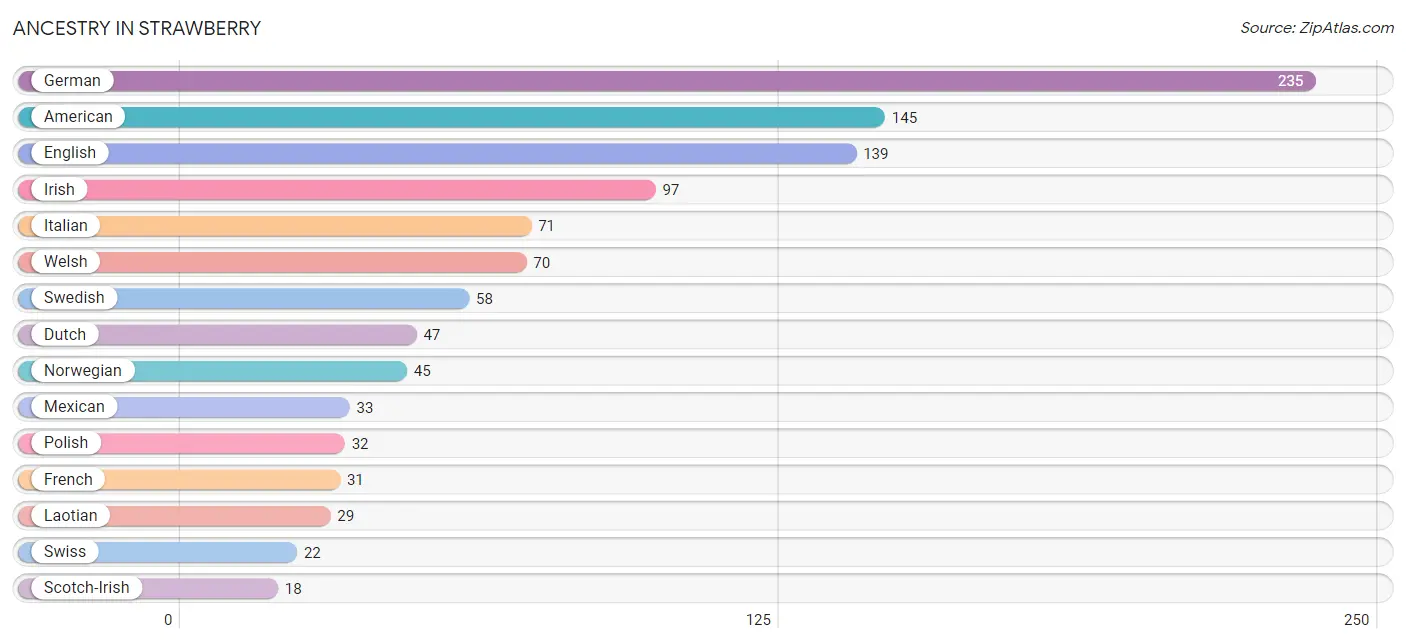
Ancestry in Strawberry
The most populous ancestries reported in Strawberry are German (235 | 23.4%), American (145 | 14.5%), English (139 | 13.9%), Irish (97 | 9.7%), and Italian (71 | 7.1%), together accounting for 68.5% of all Strawberry residents.
| Ancestry | # Population | % Population |
| American | 145 | 14.5% |
| Dutch | 47 | 4.7% |
| English | 139 | 13.9% |
| European | 10 | 1.0% |
| French | 31 | 3.1% |
| French Canadian | 8 | 0.8% |
| German | 235 | 23.4% |
| Irish | 97 | 9.7% |
| Italian | 71 | 7.1% |
| Laotian | 29 | 2.9% |
| Mexican | 33 | 3.3% |
| Norwegian | 45 | 4.5% |
| Polish | 32 | 3.2% |
| Scandinavian | 10 | 1.0% |
| Scotch-Irish | 18 | 1.8% |
| Scottish | 9 | 0.9% |
| Spaniard | 16 | 1.6% |
| Spanish | 2 | 0.2% |
| Swedish | 58 | 5.8% |
| Swiss | 22 | 2.2% |
| Welsh | 70 | 7.0% | View All 21 Rows |
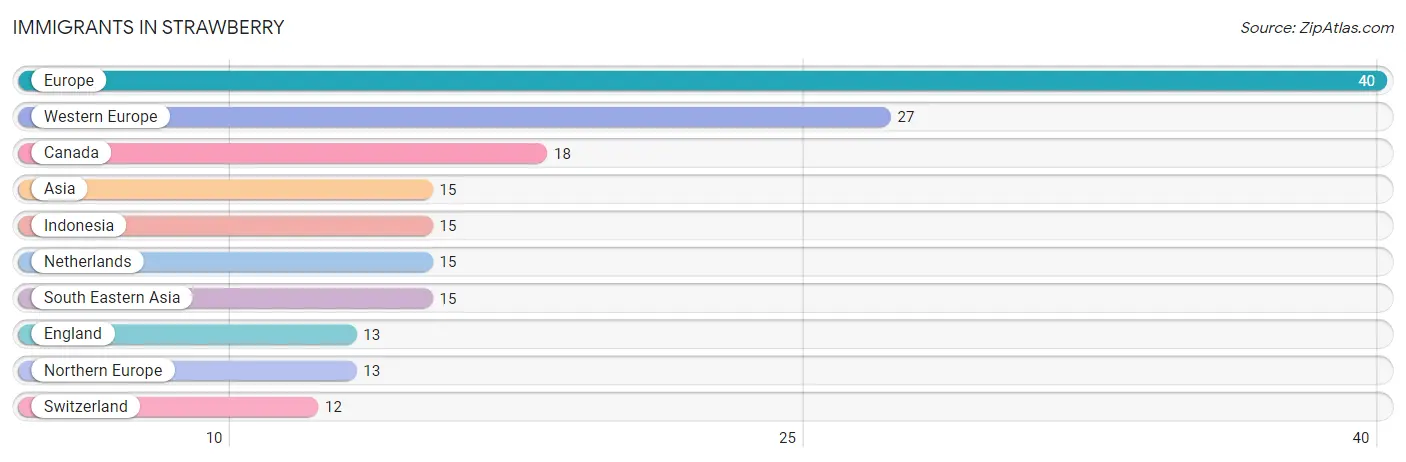
Immigrants in Strawberry
The most numerous immigrant groups reported in Strawberry came from Europe (40 | 4.0%), Western Europe (27 | 2.7%), Canada (18 | 1.8%), Asia (15 | 1.5%), and Indonesia (15 | 1.5%), together accounting for 11.5% of all Strawberry residents.
| Immigration Origin | # Population | % Population |
| Asia | 15 | 1.5% |
| Canada | 18 | 1.8% |
| England | 13 | 1.3% |
| Europe | 40 | 4.0% |
| Indonesia | 15 | 1.5% |
| Netherlands | 15 | 1.5% |
| Northern Europe | 13 | 1.3% |
| South Eastern Asia | 15 | 1.5% |
| Switzerland | 12 | 1.2% |
| Western Europe | 27 | 2.7% | View All 10 Rows |
Sex and Age in Strawberry
Sex and Age in Strawberry
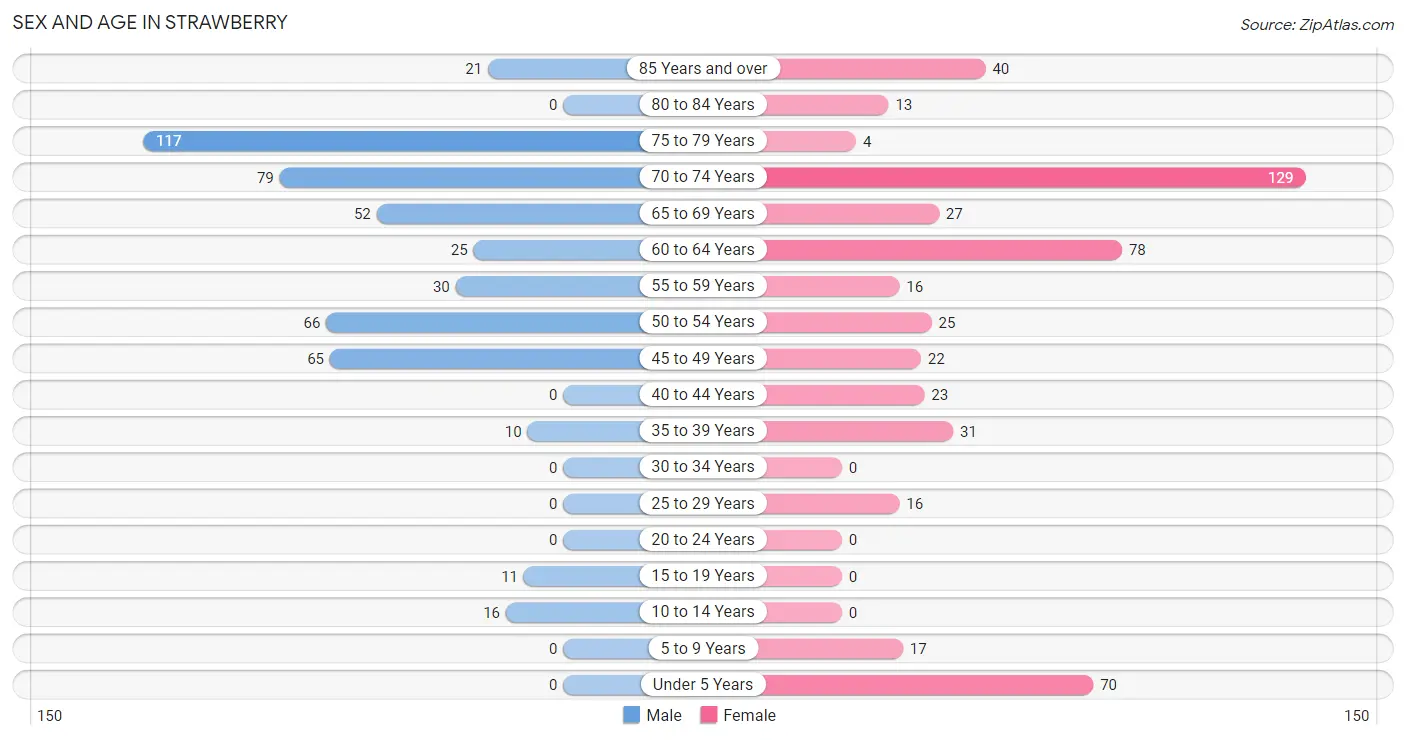
The most populous age groups in Strawberry are 75 to 79 Years (117 | 23.8%) for men and 70 to 74 Years (129 | 25.2%) for women.
| Age Bracket | Male | Female |
| Under 5 Years | 0 (0.0%) | 70 (13.7%) |
| 5 to 9 Years | 0 (0.0%) | 17 (3.3%) |
| 10 to 14 Years | 16 (3.3%) | 0 (0.0%) |
| 15 to 19 Years | 11 (2.2%) | 0 (0.0%) |
| 20 to 24 Years | 0 (0.0%) | 0 (0.0%) |
| 25 to 29 Years | 0 (0.0%) | 16 (3.1%) |
| 30 to 34 Years | 0 (0.0%) | 0 (0.0%) |
| 35 to 39 Years | 10 (2.0%) | 31 (6.1%) |
| 40 to 44 Years | 0 (0.0%) | 23 (4.5%) |
| 45 to 49 Years | 65 (13.2%) | 22 (4.3%) |
| 50 to 54 Years | 66 (13.4%) | 25 (4.9%) |
| 55 to 59 Years | 30 (6.1%) | 16 (3.1%) |
| 60 to 64 Years | 25 (5.1%) | 78 (15.3%) |
| 65 to 69 Years | 52 (10.6%) | 27 (5.3%) |
| 70 to 74 Years | 79 (16.1%) | 129 (25.2%) |
| 75 to 79 Years | 117 (23.8%) | 4 (0.8%) |
| 80 to 84 Years | 0 (0.0%) | 13 (2.5%) |
| 85 Years and over | 21 (4.3%) | 40 (7.8%) |
| Total | 492 (100.0%) | 511 (100.0%) |
Families and Households in Strawberry
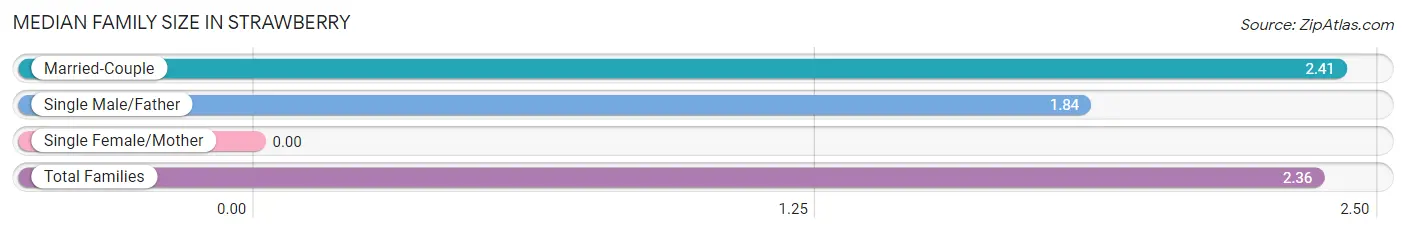
Median Family Size in Strawberry
| Family Type | # Families | Family Size |
| Married-Couple | 310 (92.5%) | 2.41 |
| Single Male/Father | 25 (7.5%) | 1.84 |
| Single Female/Mother | 0 (0.0%) | - |
| Total Families | 335 (100.0%) | 2.36 |
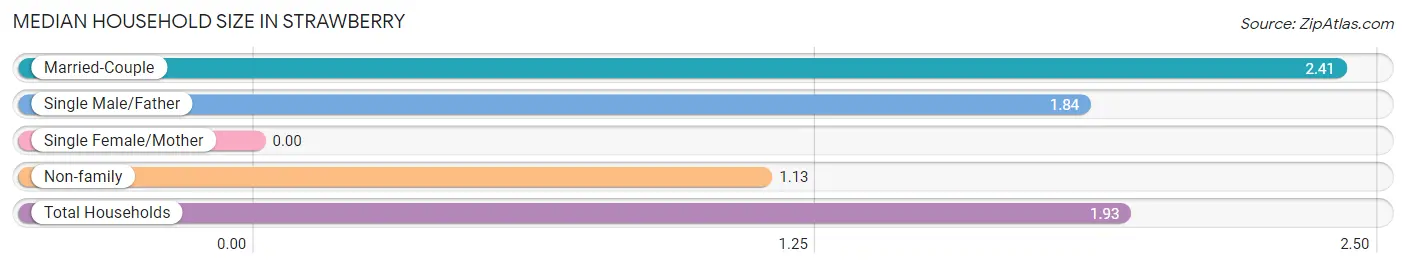
Median Household Size in Strawberry
| Household Type | # Households | Household Size |
| Married-Couple | 310 (59.5%) | 2.41 |
| Single Male/Father | 25 (4.8%) | 1.84 |
| Single Female/Mother | 0 (0.0%) | - |
| Non-family | 186 (35.7%) | 1.13 |
| Total Households | 521 (100.0%) | 1.93 |
Household Size by Marriage Status in Strawberry
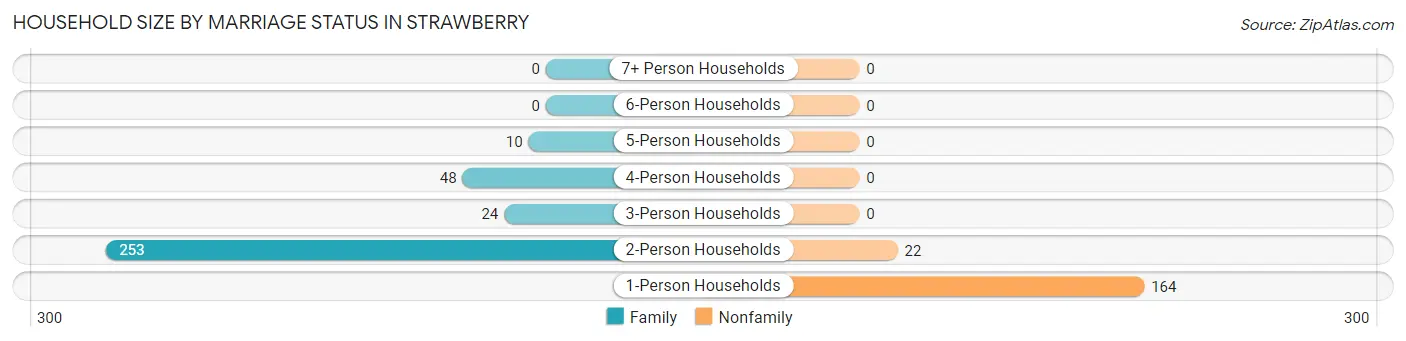
Out of a total of 521 households in Strawberry, 335 (64.3%) are family households, while 186 (35.7%) are nonfamily households. The most numerous type of family households are 2-person households, comprising 253, and the most common type of nonfamily households are 1-person households, comprising 164.
| Household Size | Family Households | Nonfamily Households |
| 1-Person Households | - | 164 (31.5%) |
| 2-Person Households | 253 (48.6%) | 22 (4.2%) |
| 3-Person Households | 24 (4.6%) | 0 (0.0%) |
| 4-Person Households | 48 (9.2%) | 0 (0.0%) |
| 5-Person Households | 10 (1.9%) | 0 (0.0%) |
| 6-Person Households | 0 (0.0%) | 0 (0.0%) |
| 7+ Person Households | 0 (0.0%) | 0 (0.0%) |
| Total | 335 (64.3%) | 186 (35.7%) |
Female Fertility in Strawberry
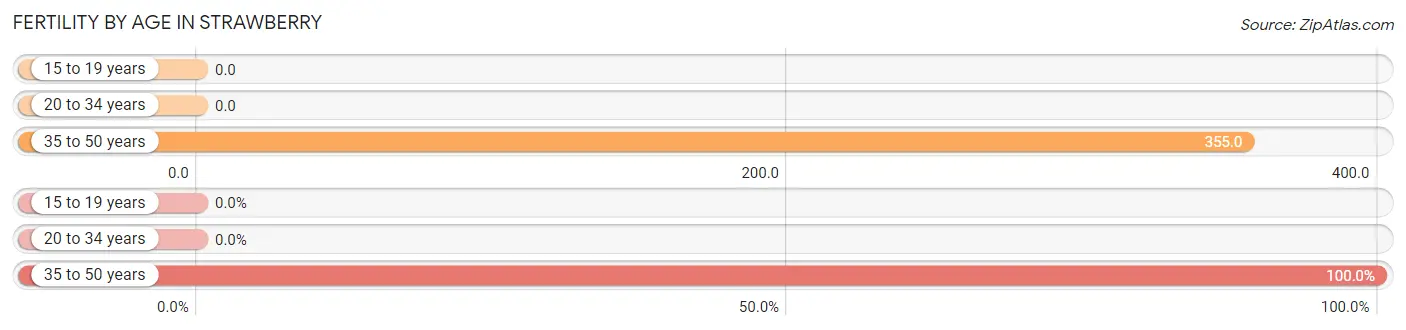
Fertility by Age in Strawberry
Average fertility rate in Strawberry is 293.0 births per 1,000 women. Women in the age bracket of 35 to 50 years have the highest fertility rate with 355.0 births per 1,000 women. Women in the age bracket of 35 to 50 years acount for 100.0% of all women with births.
| Age Bracket | Women with Births | Births / 1,000 Women |
| 15 to 19 years | 0 (0.0%) | 0.0 |
| 20 to 34 years | 0 (0.0%) | 0.0 |
| 35 to 50 years | 27 (100.0%) | 355.0 |
| Total | 27 (100.0%) | 293.0 |
Fertility by Age by Marriage Status in Strawberry
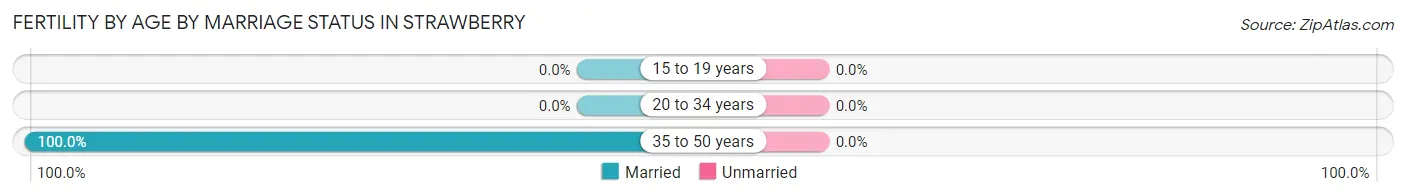
| Age Bracket | Married | Unmarried |
| 15 to 19 years | 0 (0.0%) | 0 (0.0%) |
| 20 to 34 years | 0 (0.0%) | 0 (0.0%) |
| 35 to 50 years | 27 (100.0%) | 0 (0.0%) |
| Total | 27 (100.0%) | 0 (0.0%) |
Fertility by Education in Strawberry
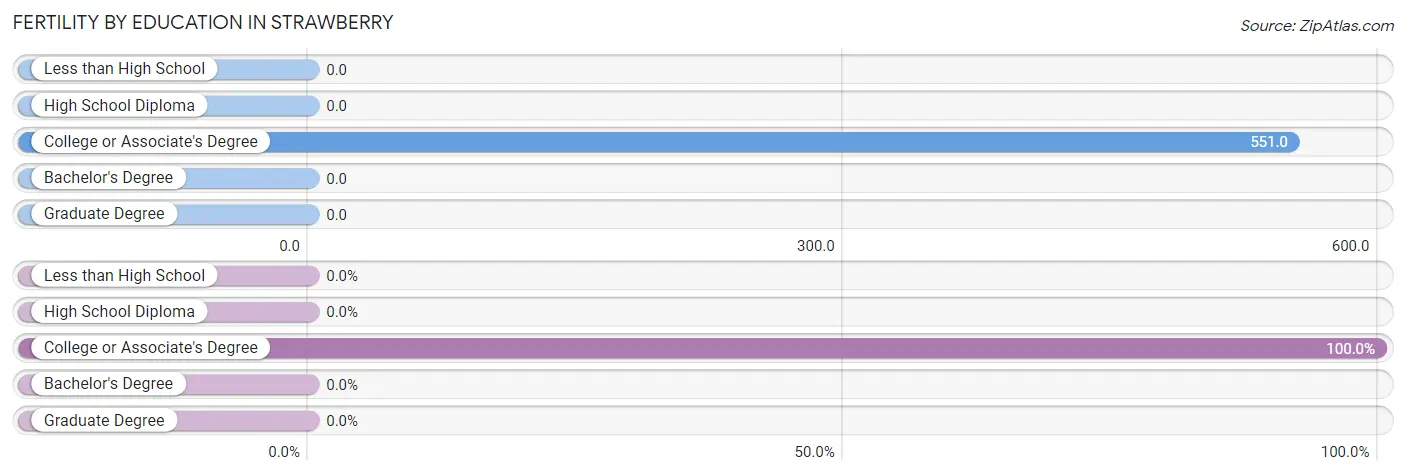
| Educational Attainment | Women with Births | Births / 1,000 Women |
| Less than High School | 0 (0.0%) | 0.0 |
| High School Diploma | 0 (0.0%) | 0.0 |
| College or Associate's Degree | 27 (100.0%) | 551.0 |
| Bachelor's Degree | 0 (0.0%) | 0.0 |
| Graduate Degree | 0 (0.0%) | 0.0 |
| Total | 27 (100.0%) | 293.0 |
Fertility by Education by Marriage Status in Strawberry
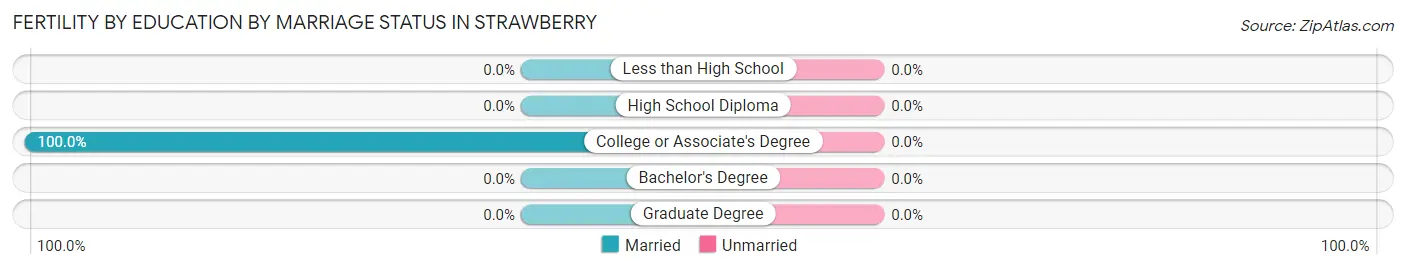
| Educational Attainment | Married | Unmarried |
| Less than High School | 0 (0.0%) | 0 (0.0%) |
| High School Diploma | 0 (0.0%) | 0 (0.0%) |
| College or Associate's Degree | 27 (100.0%) | 0 (0.0%) |
| Bachelor's Degree | 0 (0.0%) | 0 (0.0%) |
| Graduate Degree | 0 (0.0%) | 0 (0.0%) |
| Total | 27 (100.0%) | 0 (0.0%) |
Income in Strawberry
Income Overview in Strawberry
Per Capita Income in Strawberry is $37,432, while median incomes of families and households are $70,938 and $43,083 respectively.
| Characteristic | Number | Measure |
| Per Capita Income | 1,003 | $37,432 |
| Median Family Income | 335 | $70,938 |
| Mean Family Income | 335 | $91,044 |
| Median Household Income | 521 | $43,083 |
| Mean Household Income | 521 | $68,929 |
| Income Deficit | 335 | $0 |
| Wage / Income Gap (%) | 1,003 | 0.00% |
| Wage / Income Gap ($) | 1,003 | 100.00¢ per $1 |
| Gini / Inequality Index | 1,003 | 0.44 |
Earnings by Sex in Strawberry
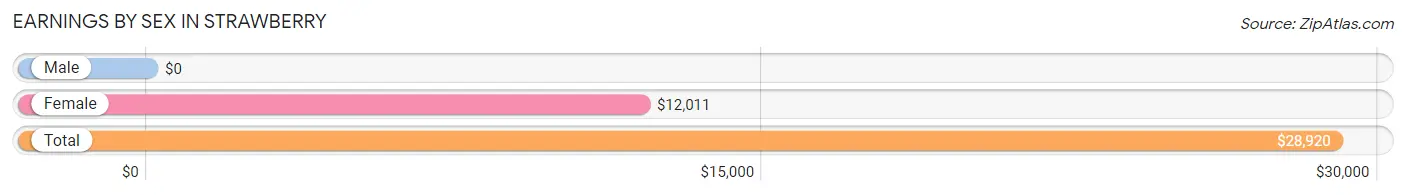
| Sex | Number | Average Earnings |
| Male | 229 (59.3%) | $0 |
| Female | 157 (40.7%) | $12,011 |
| Total | 386 (100.0%) | $28,920 |
Earnings by Sex by Income Bracket in Strawberry
The most common earnings brackets in Strawberry are $25,000 to $29,999 for men (71 | 31.0%) and $2,499 or less for women (31 | 19.8%).
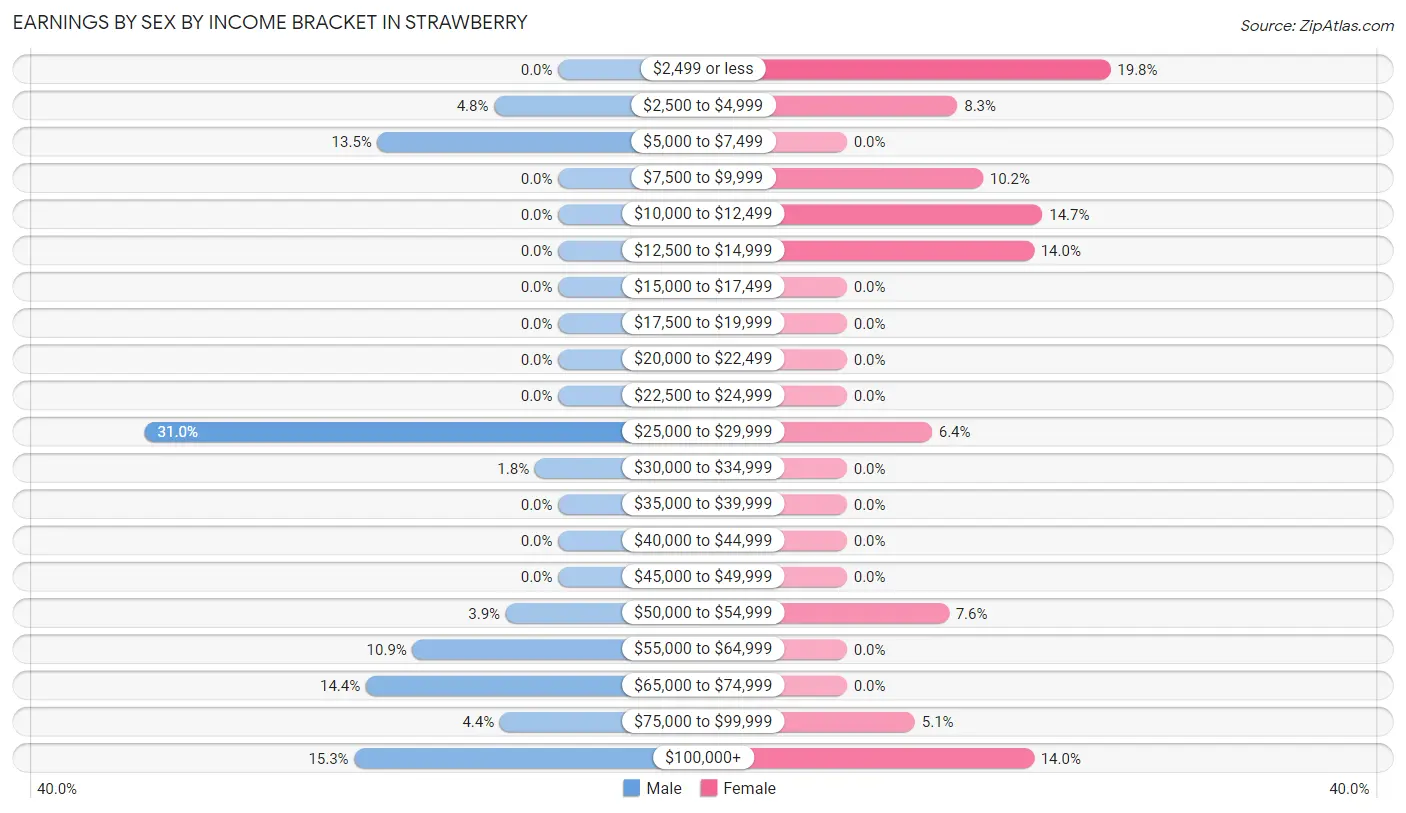
| Income | Male | Female |
| $2,499 or less | 0 (0.0%) | 31 (19.8%) |
| $2,500 to $4,999 | 11 (4.8%) | 13 (8.3%) |
| $5,000 to $7,499 | 31 (13.5%) | 0 (0.0%) |
| $7,500 to $9,999 | 0 (0.0%) | 16 (10.2%) |
| $10,000 to $12,499 | 0 (0.0%) | 23 (14.6%) |
| $12,500 to $14,999 | 0 (0.0%) | 22 (14.0%) |
| $15,000 to $17,499 | 0 (0.0%) | 0 (0.0%) |
| $17,500 to $19,999 | 0 (0.0%) | 0 (0.0%) |
| $20,000 to $22,499 | 0 (0.0%) | 0 (0.0%) |
| $22,500 to $24,999 | 0 (0.0%) | 0 (0.0%) |
| $25,000 to $29,999 | 71 (31.0%) | 10 (6.4%) |
| $30,000 to $34,999 | 4 (1.8%) | 0 (0.0%) |
| $35,000 to $39,999 | 0 (0.0%) | 0 (0.0%) |
| $40,000 to $44,999 | 0 (0.0%) | 0 (0.0%) |
| $45,000 to $49,999 | 0 (0.0%) | 0 (0.0%) |
| $50,000 to $54,999 | 9 (3.9%) | 12 (7.6%) |
| $55,000 to $64,999 | 25 (10.9%) | 0 (0.0%) |
| $65,000 to $74,999 | 33 (14.4%) | 0 (0.0%) |
| $75,000 to $99,999 | 10 (4.4%) | 8 (5.1%) |
| $100,000+ | 35 (15.3%) | 22 (14.0%) |
| Total | 229 (100.0%) | 157 (100.0%) |
Earnings by Sex by Educational Attainment in Strawberry
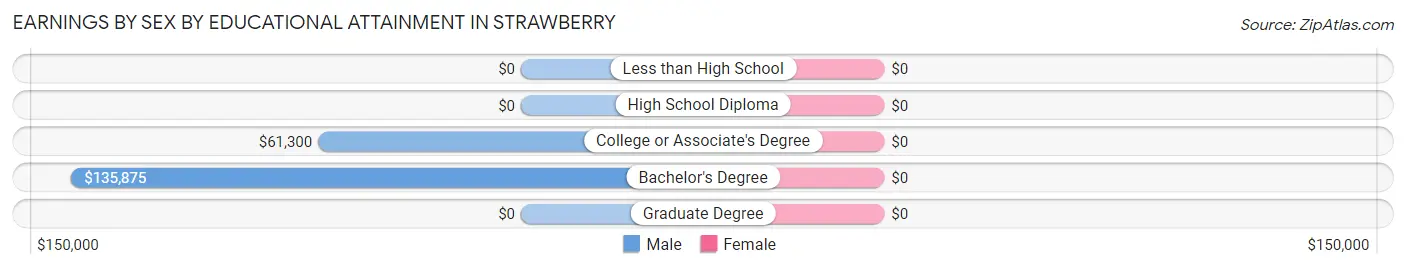
| Educational Attainment | Male Income | Female Income |
| Less than High School | - | - |
| High School Diploma | - | - |
| College or Associate's Degree | $61,300 | $0 |
| Bachelor's Degree | $135,875 | $0 |
| Graduate Degree | - | - |
| Total | $53,333 | $12,011 |
Family Income in Strawberry
Family Income Brackets in Strawberry
According to the Strawberry family income data, there are 117 families falling into the $35,000 to $49,999 income range, which is the most common income bracket and makes up 34.9% of all families.
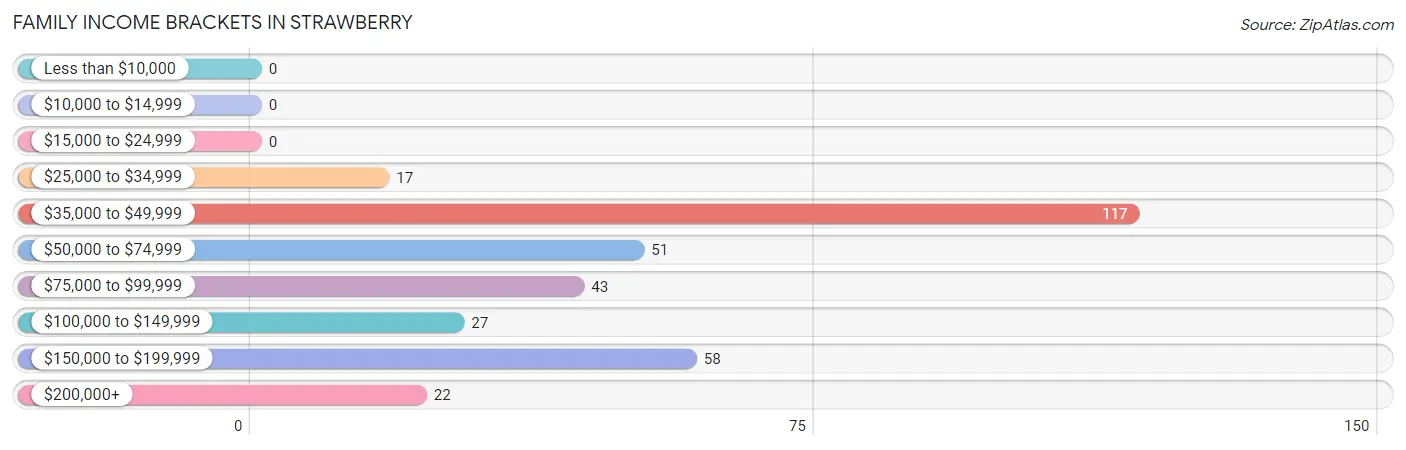
| Income Bracket | # Families | % Families |
| Less than $10,000 | 0 | 0.0% |
| $10,000 to $14,999 | 0 | 0.0% |
| $15,000 to $24,999 | 0 | 0.0% |
| $25,000 to $34,999 | 17 | 5.1% |
| $35,000 to $49,999 | 117 | 34.9% |
| $50,000 to $74,999 | 51 | 15.2% |
| $75,000 to $99,999 | 43 | 12.8% |
| $100,000 to $149,999 | 27 | 8.1% |
| $150,000 to $199,999 | 58 | 17.3% |
| $200,000+ | 22 | 6.6% |
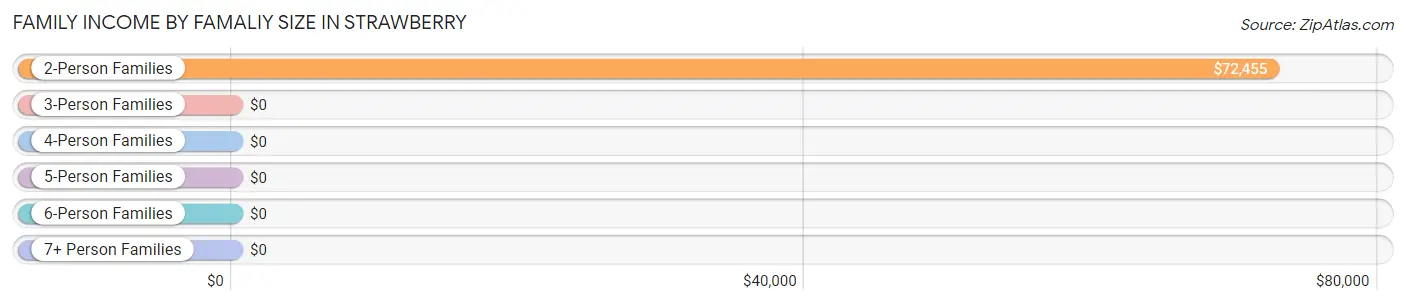
Family Income by Famaliy Size in Strawberry
2-person families (253 | 75.5%) account for the highest median family income in Strawberry with $72,455 per family, while 2-person families (253 | 75.5%) have the highest median income of $36,228 per family member.
| Income Bracket | # Families | Median Income |
| 2-Person Families | 253 (75.5%) | $72,455 |
| 3-Person Families | 24 (7.2%) | $0 |
| 4-Person Families | 48 (14.3%) | $0 |
| 5-Person Families | 10 (3.0%) | $0 |
| 6-Person Families | 0 (0.0%) | $0 |
| 7+ Person Families | 0 (0.0%) | $0 |
| Total | 335 (100.0%) | $70,938 |
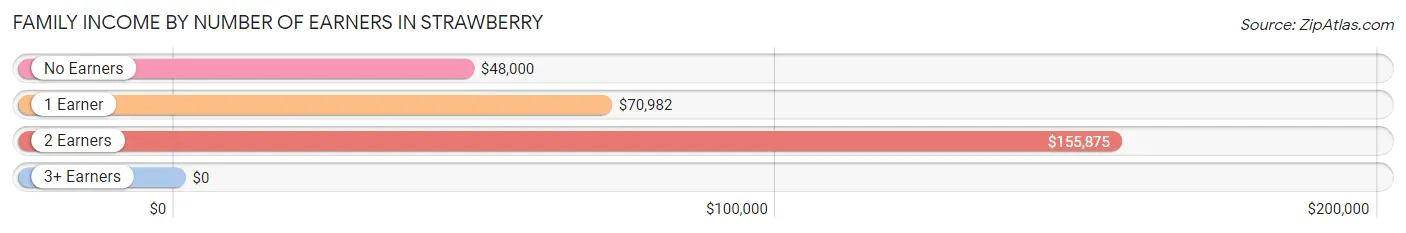
Family Income by Number of Earners in Strawberry
| Number of Earners | # Families | Median Income |
| No Earners | 124 (37.0%) | $48,000 |
| 1 Earner | 142 (42.4%) | $70,982 |
| 2 Earners | 69 (20.6%) | $155,875 |
| 3+ Earners | 0 (0.0%) | $0 |
| Total | 335 (100.0%) | $70,938 |
Household Income in Strawberry
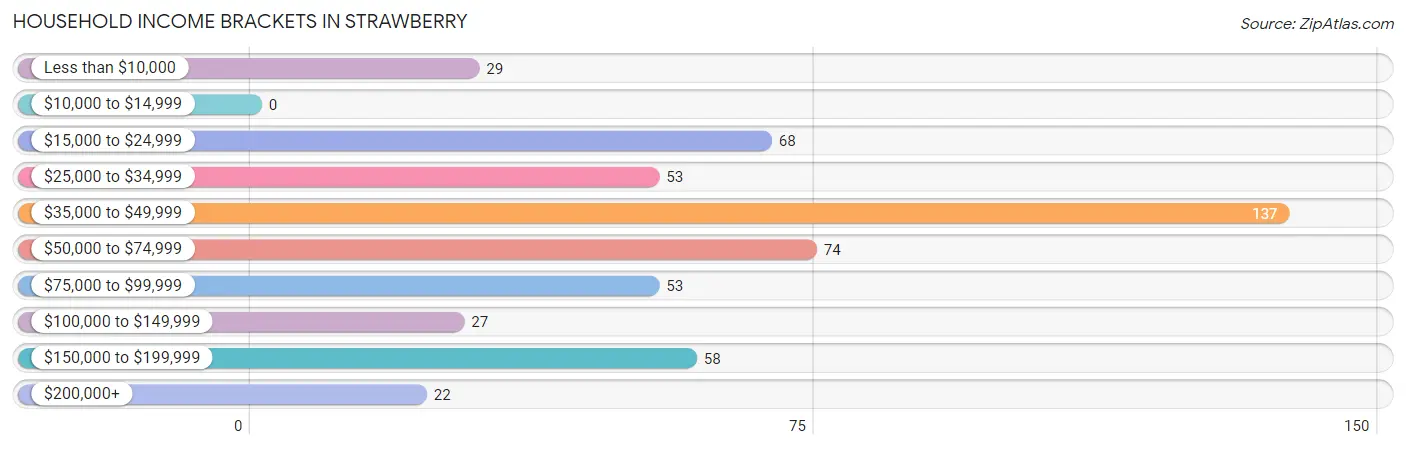
Household Income Brackets in Strawberry
With 137 households falling in the category, the $35,000 to $49,999 income range is the most frequent in Strawberry, accounting for 26.3% of all households.
| Income Bracket | # Households | % Households |
| Less than $10,000 | 29 | 5.6% |
| $10,000 to $14,999 | 0 | 0.0% |
| $15,000 to $24,999 | 68 | 13.1% |
| $25,000 to $34,999 | 53 | 10.2% |
| $35,000 to $49,999 | 137 | 26.3% |
| $50,000 to $74,999 | 74 | 14.2% |
| $75,000 to $99,999 | 53 | 10.2% |
| $100,000 to $149,999 | 27 | 5.2% |
| $150,000 to $199,999 | 58 | 11.1% |
| $200,000+ | 22 | 4.2% |
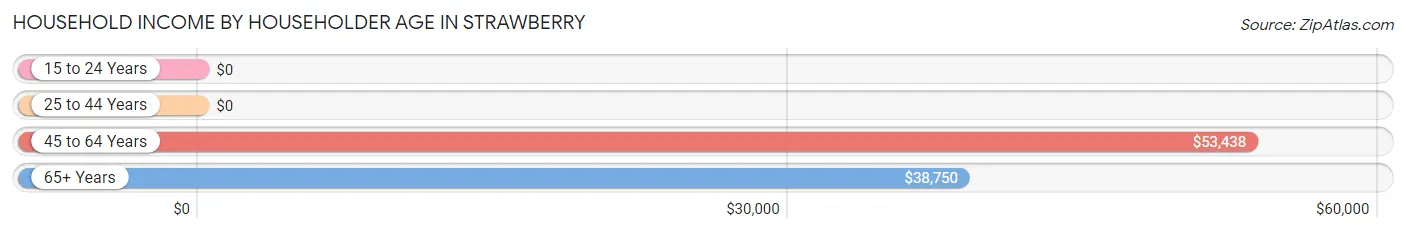
Household Income by Householder Age in Strawberry
The median household income in Strawberry is $43,083, with the highest median household income of $53,438 found in the 45 to 64 years age bracket for the primary householder. A total of 199 households (38.2%) fall into this category.
| Income Bracket | # Households | Median Income |
| 15 to 24 Years | 0 (0.0%) | $0 |
| 25 to 44 Years | 26 (5.0%) | $0 |
| 45 to 64 Years | 199 (38.2%) | $53,438 |
| 65+ Years | 296 (56.8%) | $38,750 |
| Total | 521 (100.0%) | $43,083 |
Poverty in Strawberry
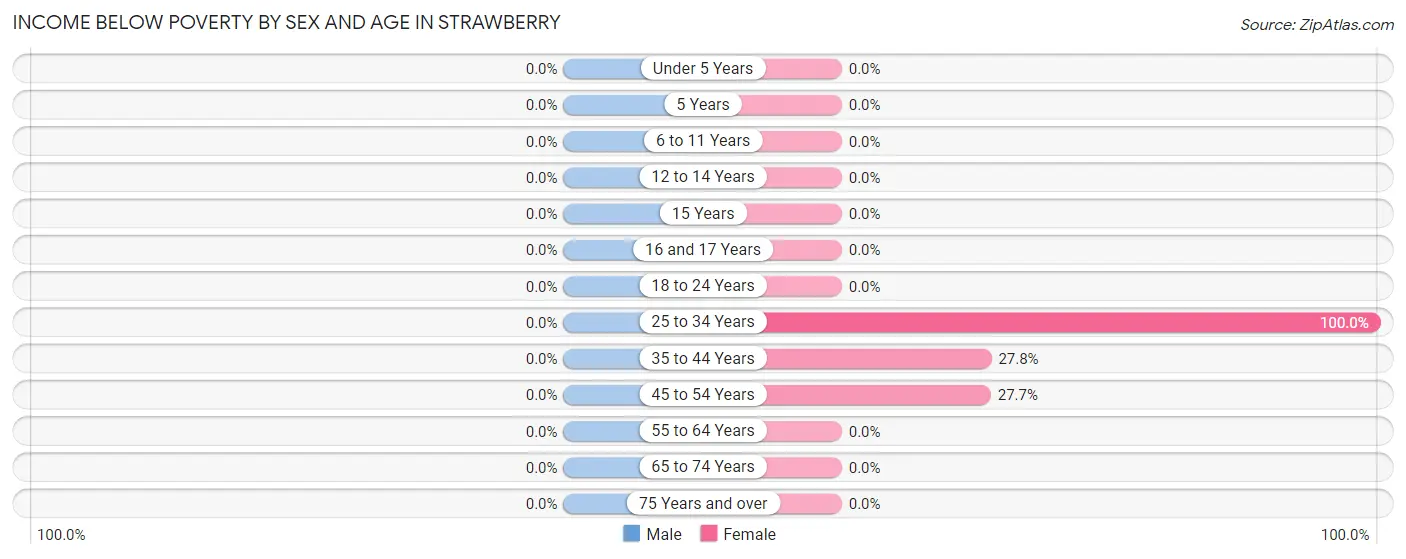
Income Below Poverty by Sex and Age in Strawberry
| Age Bracket | Male | Female |
| Under 5 Years | 0 (0.0%) | 0 (0.0%) |
| 5 Years | 0 (0.0%) | 0 (0.0%) |
| 6 to 11 Years | 0 (0.0%) | 0 (0.0%) |
| 12 to 14 Years | 0 (0.0%) | 0 (0.0%) |
| 15 Years | 0 (0.0%) | 0 (0.0%) |
| 16 and 17 Years | 0 (0.0%) | 0 (0.0%) |
| 18 to 24 Years | 0 (0.0%) | 0 (0.0%) |
| 25 to 34 Years | 0 (0.0%) | 16 (100.0%) |
| 35 to 44 Years | 0 (0.0%) | 15 (27.8%) |
| 45 to 54 Years | 0 (0.0%) | 13 (27.7%) |
| 55 to 64 Years | 0 (0.0%) | 0 (0.0%) |
| 65 to 74 Years | 0 (0.0%) | 0 (0.0%) |
| 75 Years and over | 0 (0.0%) | 0 (0.0%) |
| Total | 0 (0.0%) | 44 (8.6%) |
Income Above Poverty by Sex and Age in Strawberry
According to the poverty statistics in Strawberry, males aged 12 to 14 years and females aged under 5 years are the age groups that are most secure financially, with 100.0% of males and 100.0% of females in these age groups living above the poverty line.

| Age Bracket | Male | Female |
| Under 5 Years | 0 (0.0%) | 70 (100.0%) |
| 5 Years | 0 (0.0%) | 0 (0.0%) |
| 6 to 11 Years | 0 (0.0%) | 17 (100.0%) |
| 12 to 14 Years | 16 (100.0%) | 0 (0.0%) |
| 15 Years | 0 (0.0%) | 0 (0.0%) |
| 16 and 17 Years | 11 (100.0%) | 0 (0.0%) |
| 18 to 24 Years | 0 (0.0%) | 0 (0.0%) |
| 25 to 34 Years | 0 (0.0%) | 0 (0.0%) |
| 35 to 44 Years | 10 (100.0%) | 39 (72.2%) |
| 45 to 54 Years | 131 (100.0%) | 34 (72.3%) |
| 55 to 64 Years | 55 (100.0%) | 94 (100.0%) |
| 65 to 74 Years | 131 (100.0%) | 156 (100.0%) |
| 75 Years and over | 138 (100.0%) | 57 (100.0%) |
| Total | 492 (100.0%) | 467 (91.4%) |
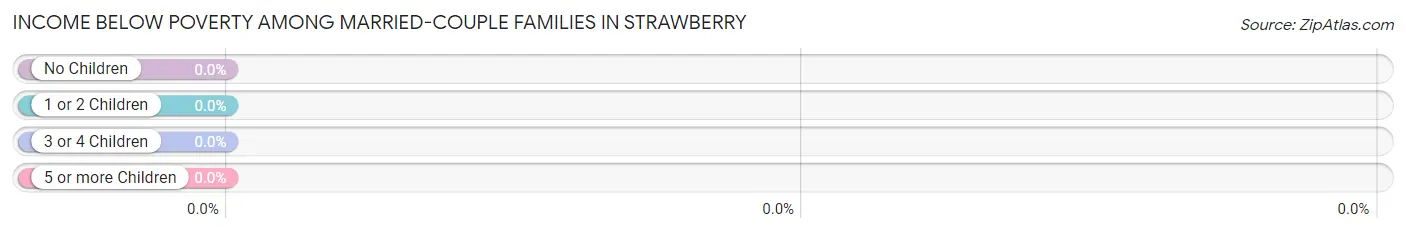
Income Below Poverty Among Married-Couple Families in Strawberry
| Children | Above Poverty | Below Poverty |
| No Children | 242 (100.0%) | 0 (0.0%) |
| 1 or 2 Children | 58 (100.0%) | 0 (0.0%) |
| 3 or 4 Children | 10 (100.0%) | 0 (0.0%) |
| 5 or more Children | 0 (0.0%) | 0 (0.0%) |
| Total | 310 (100.0%) | 0 (0.0%) |
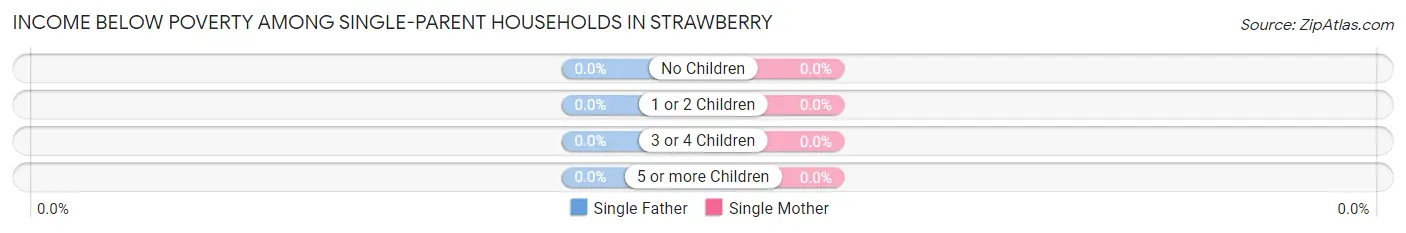
Income Below Poverty Among Single-Parent Households in Strawberry
| Children | Single Father | Single Mother |
| No Children | 0 (0.0%) | 0 (0.0%) |
| 1 or 2 Children | 0 (0.0%) | 0 (0.0%) |
| 3 or 4 Children | 0 (0.0%) | 0 (0.0%) |
| 5 or more Children | 0 (0.0%) | 0 (0.0%) |
| Total | 0 (0.0%) | 0 (0.0%) |
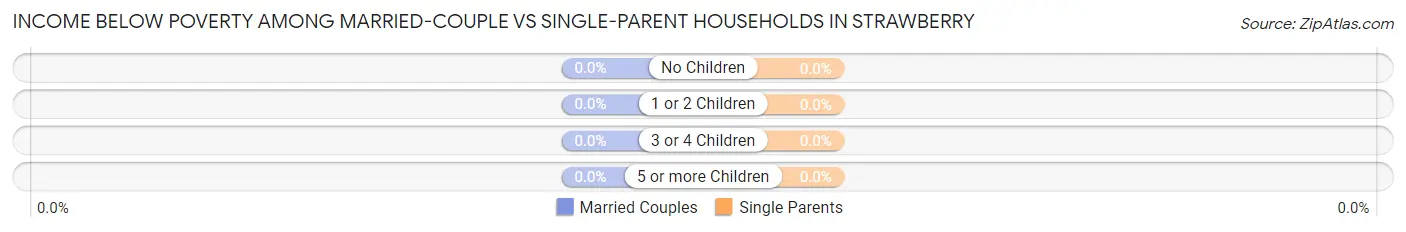
Income Below Poverty Among Married-Couple vs Single-Parent Households in Strawberry
| Children | Married-Couple Families | Single-Parent Households |
| No Children | 0 (0.0%) | 0 (0.0%) |
| 1 or 2 Children | 0 (0.0%) | 0 (0.0%) |
| 3 or 4 Children | 0 (0.0%) | 0 (0.0%) |
| 5 or more Children | 0 (0.0%) | 0 (0.0%) |
| Total | 0 (0.0%) | 0 (0.0%) |
Employment Characteristics in Strawberry
Employment by Class of Employer in Strawberry
Among the 339 employed individuals in Strawberry, private company employees (110 | 32.5%), self-employed (incorporated) (87 | 25.7%), and local government employees (65 | 19.2%) make up the most common classes of employment.
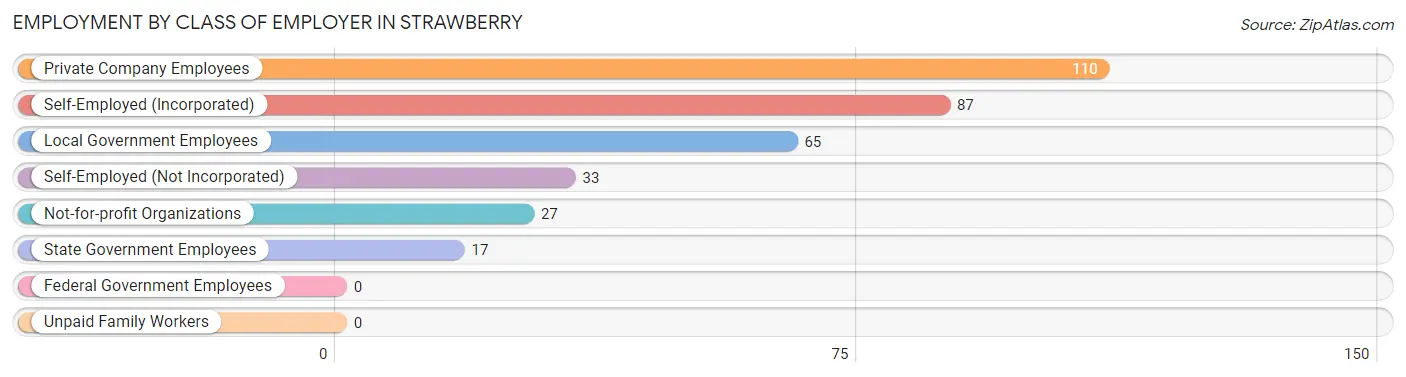
| Employer Class | # Employees | % Employees |
| Private Company Employees | 110 | 32.5% |
| Self-Employed (Incorporated) | 87 | 25.7% |
| Self-Employed (Not Incorporated) | 33 | 9.7% |
| Not-for-profit Organizations | 27 | 8.0% |
| Local Government Employees | 65 | 19.2% |
| State Government Employees | 17 | 5.0% |
| Federal Government Employees | 0 | 0.0% |
| Unpaid Family Workers | 0 | 0.0% |
| Total | 339 | 100.0% |
Employment Status by Age in Strawberry
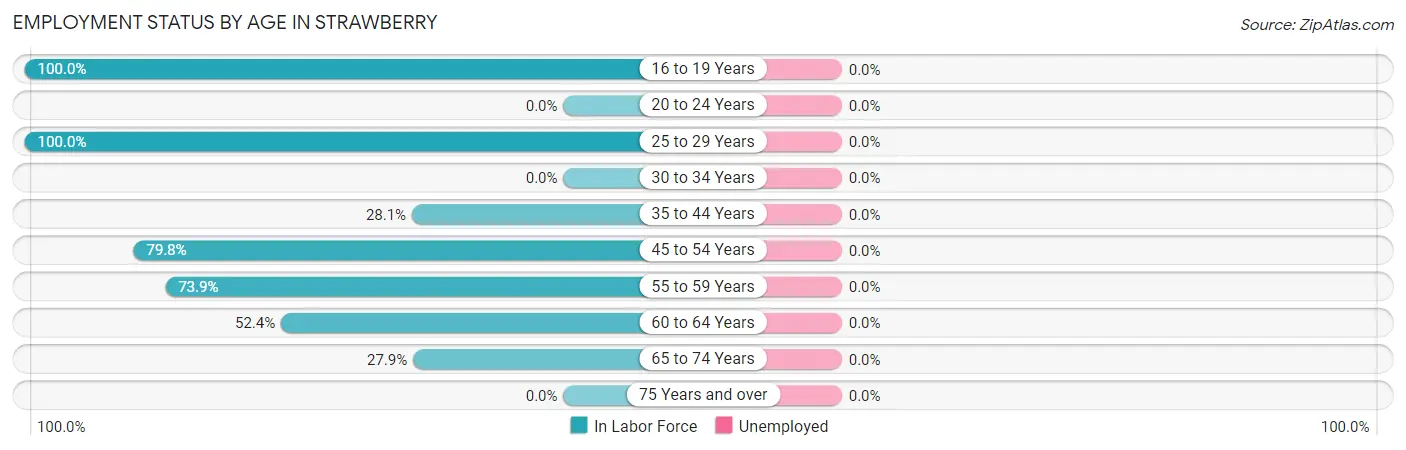
| Age Bracket | In Labor Force | Unemployed |
| 16 to 19 Years | 11 (100.0%) | 0 (0.0%) |
| 20 to 24 Years | 0 (0.0%) | 0 (0.0%) |
| 25 to 29 Years | 16 (100.0%) | 0 (0.0%) |
| 30 to 34 Years | 0 (0.0%) | 0 (0.0%) |
| 35 to 44 Years | 18 (28.1%) | 0 (0.0%) |
| 45 to 54 Years | 142 (79.8%) | 0 (0.0%) |
| 55 to 59 Years | 34 (73.9%) | 0 (0.0%) |
| 60 to 64 Years | 54 (52.4%) | 0 (0.0%) |
| 65 to 74 Years | 80 (27.9%) | 0 (0.0%) |
| 75 Years and over | 0 (0.0%) | 0 (0.0%) |
| Total | 355 (39.4%) | 0 (0.0%) |
Employment Status by Educational Attainment in Strawberry
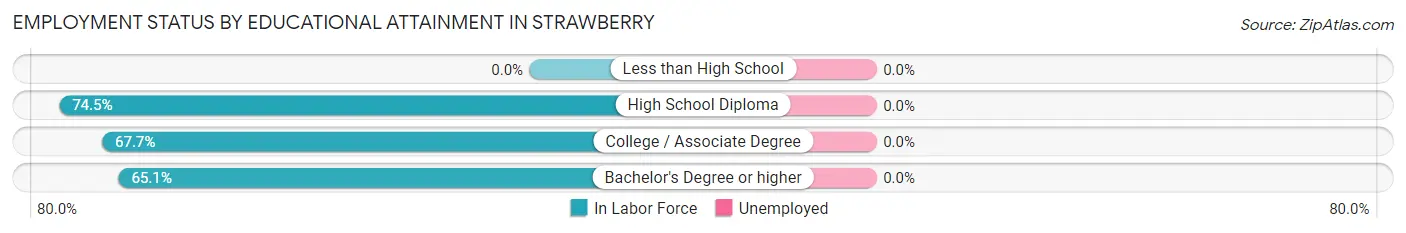
| Educational Attainment | In Labor Force | Unemployed |
| Less than High School | 0 (0.0%) | 0 (0.0%) |
| High School Diploma | 111 (74.5%) | 0 (0.0%) |
| College / Associate Degree | 84 (67.7%) | 0 (0.0%) |
| Bachelor's Degree or higher | 69 (65.1%) | 0 (0.0%) |
| Total | 264 (64.9%) | 0 (0.0%) |
Employment Occupations by Sex in Strawberry
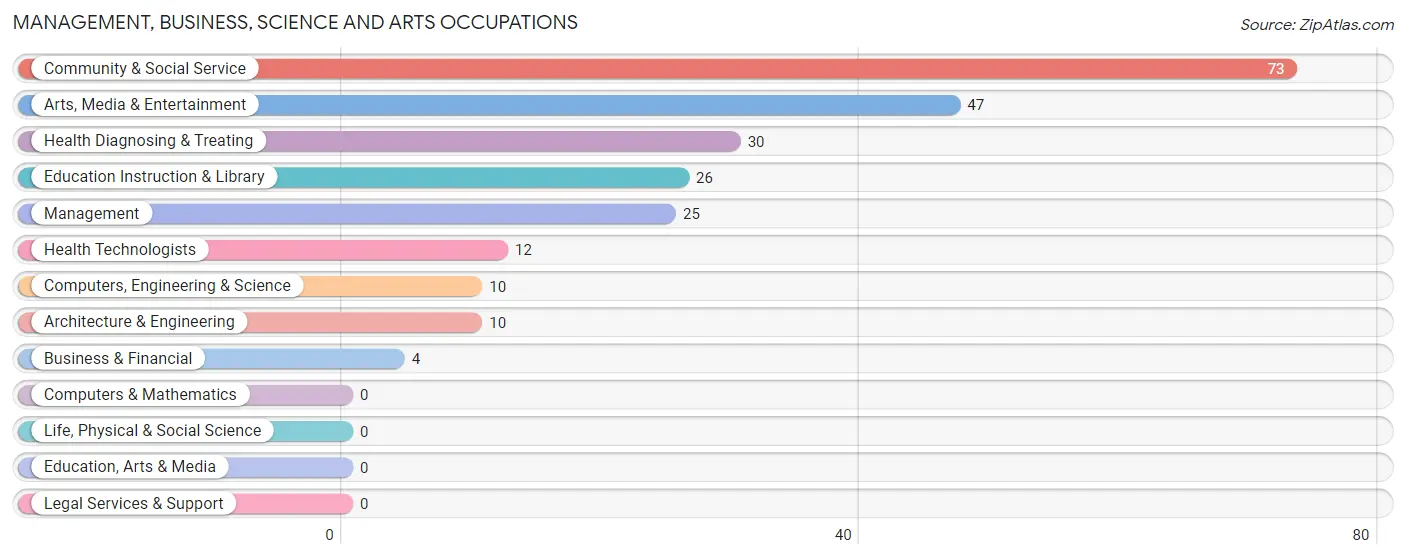
Management, Business, Science and Arts Occupations
The most common Management, Business, Science and Arts occupations in Strawberry are Community & Social Service (73 | 20.6%), Arts, Media & Entertainment (47 | 13.2%), Health Diagnosing & Treating (30 | 8.5%), Education Instruction & Library (26 | 7.3%), and Management (25 | 7.0%).
Management, Business, Science and Arts Occupations by Sex
Within the Management, Business, Science and Arts occupations in Strawberry, the most male-oriented occupations are Management (100.0%), Computers, Engineering & Science (100.0%), and Architecture & Engineering (100.0%), while the most female-oriented occupations are Business & Financial (100.0%), Health Diagnosing & Treating (100.0%), and Health Technologists (100.0%).
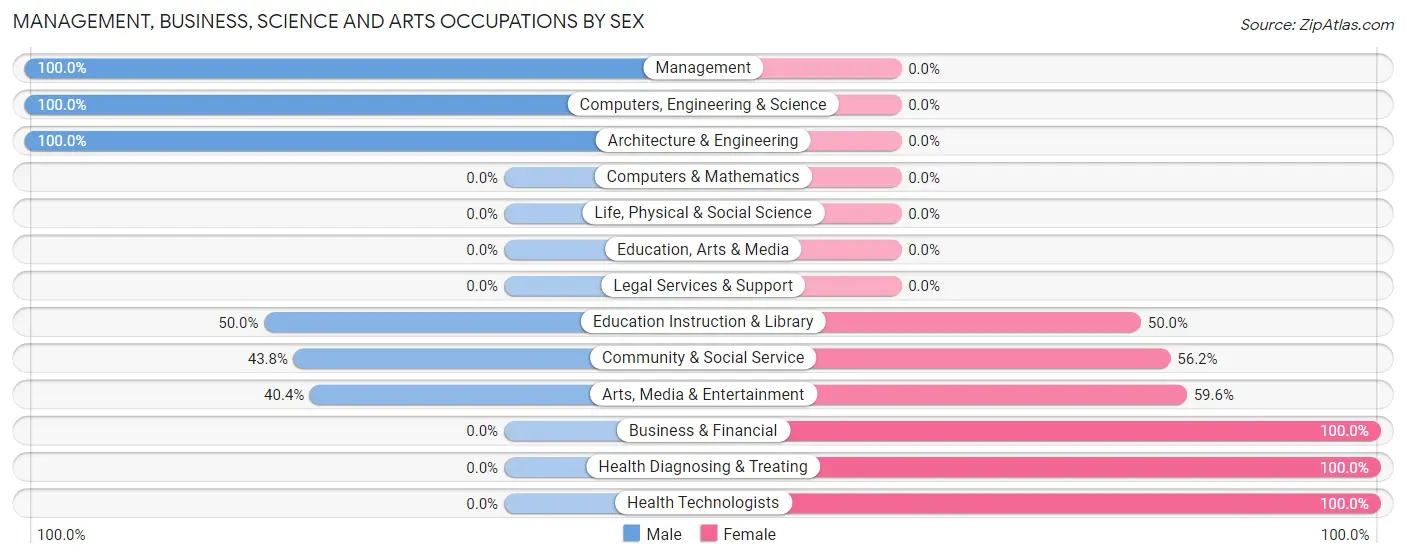
| Occupation | Male | Female |
| Management | 25 (100.0%) | 0 (0.0%) |
| Business & Financial | 0 (0.0%) | 4 (100.0%) |
| Computers, Engineering & Science | 10 (100.0%) | 0 (0.0%) |
| Computers & Mathematics | 0 (0.0%) | 0 (0.0%) |
| Architecture & Engineering | 10 (100.0%) | 0 (0.0%) |
| Life, Physical & Social Science | 0 (0.0%) | 0 (0.0%) |
| Community & Social Service | 32 (43.8%) | 41 (56.2%) |
| Education, Arts & Media | 0 (0.0%) | 0 (0.0%) |
| Legal Services & Support | 0 (0.0%) | 0 (0.0%) |
| Education Instruction & Library | 13 (50.0%) | 13 (50.0%) |
| Arts, Media & Entertainment | 19 (40.4%) | 28 (59.6%) |
| Health Diagnosing & Treating | 0 (0.0%) | 30 (100.0%) |
| Health Technologists | 0 (0.0%) | 12 (100.0%) |
| Total (Category) | 67 (47.2%) | 75 (52.8%) |
| Total (Overall) | 229 (64.5%) | 126 (35.5%) |
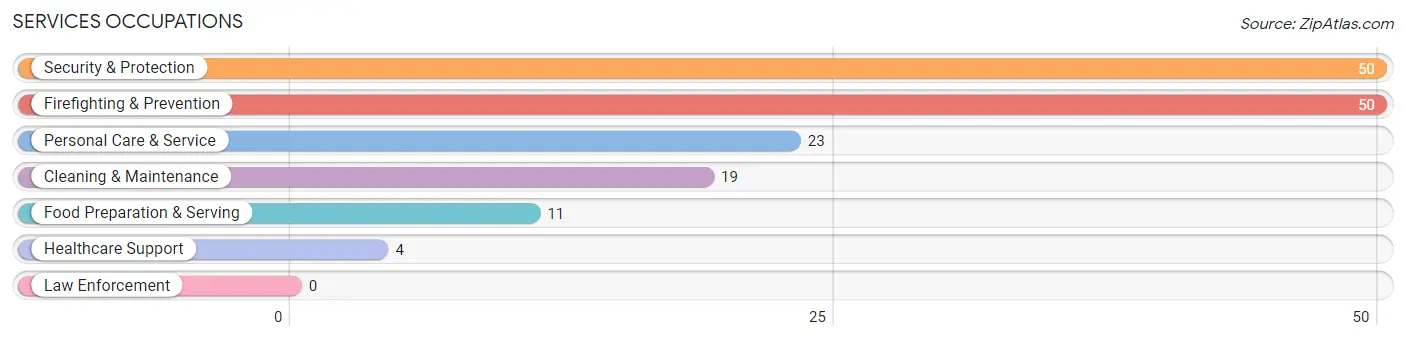
Services Occupations
The most common Services occupations in Strawberry are Security & Protection (50 | 14.1%), Firefighting & Prevention (50 | 14.1%), Personal Care & Service (23 | 6.5%), Cleaning & Maintenance (19 | 5.3%), and Food Preparation & Serving (11 | 3.1%).
Services Occupations by Sex
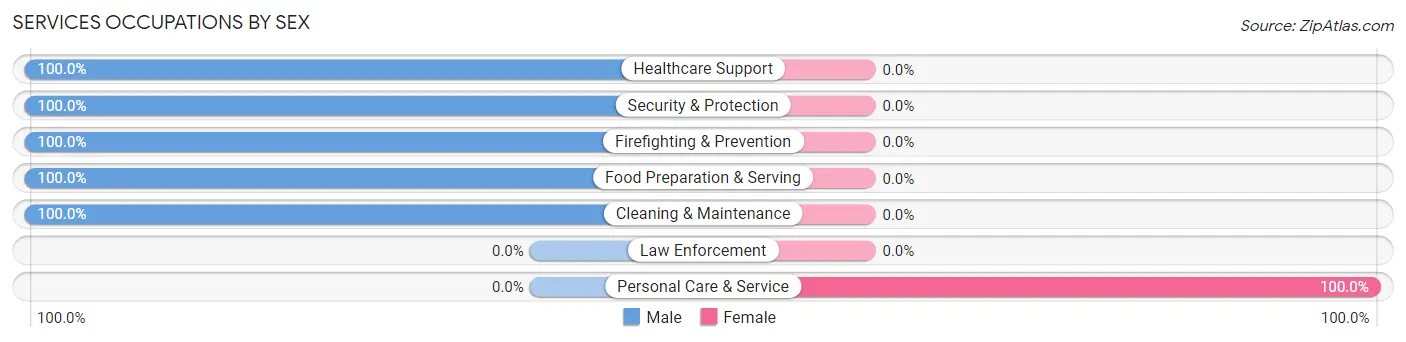
| Occupation | Male | Female |
| Healthcare Support | 4 (100.0%) | 0 (0.0%) |
| Security & Protection | 50 (100.0%) | 0 (0.0%) |
| Firefighting & Prevention | 50 (100.0%) | 0 (0.0%) |
| Law Enforcement | 0 (0.0%) | 0 (0.0%) |
| Food Preparation & Serving | 11 (100.0%) | 0 (0.0%) |
| Cleaning & Maintenance | 19 (100.0%) | 0 (0.0%) |
| Personal Care & Service | 0 (0.0%) | 23 (100.0%) |
| Total (Category) | 84 (78.5%) | 23 (21.5%) |
| Total (Overall) | 229 (64.5%) | 126 (35.5%) |
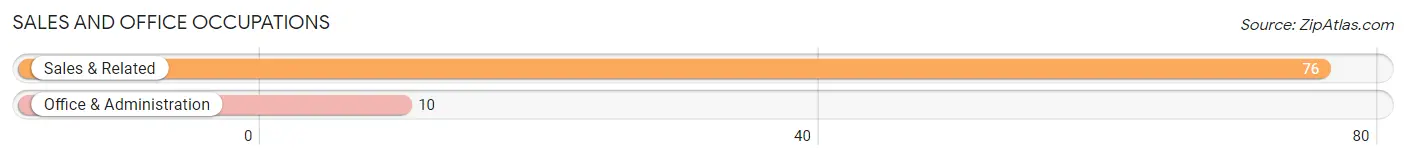
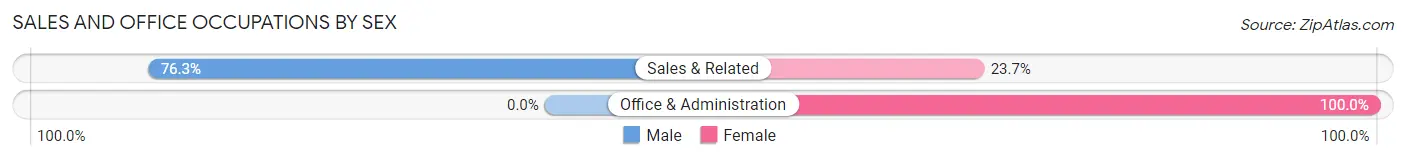
Sales and Office Occupations
The most common Sales and Office occupations in Strawberry are Sales & Related (76 | 21.4%), and Office & Administration (10 | 2.8%).
Sales and Office Occupations by Sex
| Occupation | Male | Female |
| Sales & Related | 58 (76.3%) | 18 (23.7%) |
| Office & Administration | 0 (0.0%) | 10 (100.0%) |
| Total (Category) | 58 (67.4%) | 28 (32.6%) |
| Total (Overall) | 229 (64.5%) | 126 (35.5%) |
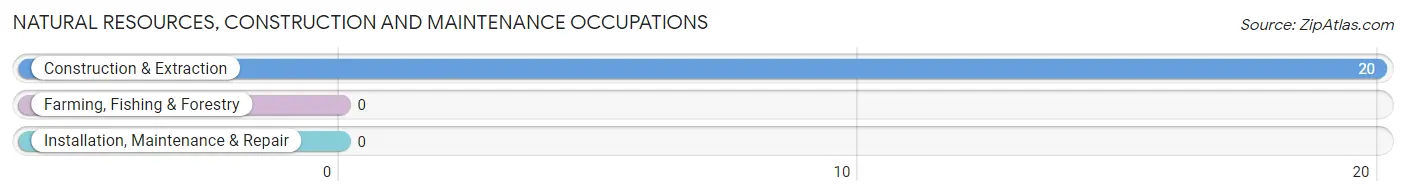
Natural Resources, Construction and Maintenance Occupations
The most common Natural Resources, Construction and Maintenance occupations in Strawberry are , and Construction & Extraction (20 | 5.6%).
Natural Resources, Construction and Maintenance Occupations by Sex
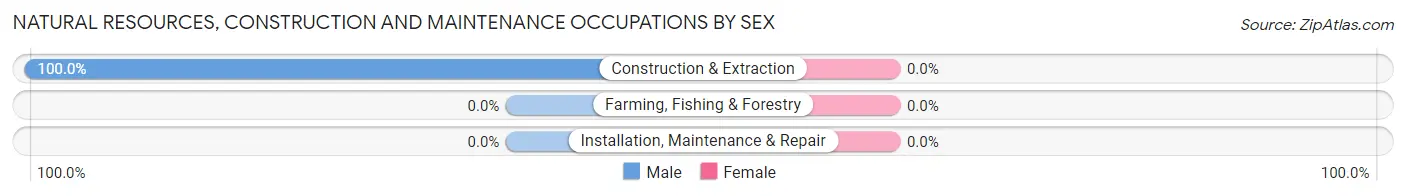
| Occupation | Male | Female |
| Farming, Fishing & Forestry | 0 (0.0%) | 0 (0.0%) |
| Construction & Extraction | 20 (100.0%) | 0 (0.0%) |
| Installation, Maintenance & Repair | 0 (0.0%) | 0 (0.0%) |
| Total (Category) | 20 (100.0%) | 0 (0.0%) |
| Total (Overall) | 229 (64.5%) | 126 (35.5%) |
Production, Transportation and Moving Occupations
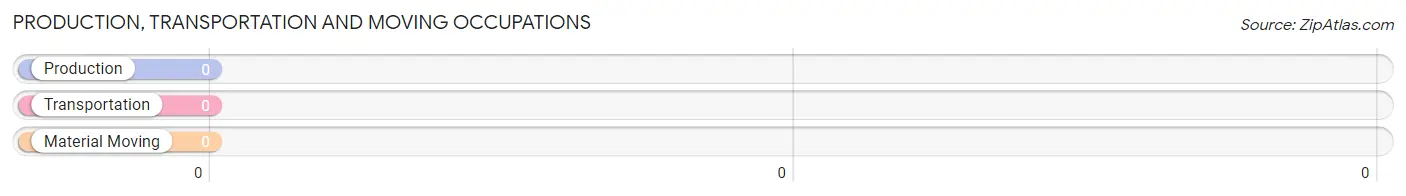
Production, Transportation and Moving Occupations by Sex
| Occupation | Male | Female |
| Production | 0 (0.0%) | 0 (0.0%) |
| Transportation | 0 (0.0%) | 0 (0.0%) |
| Material Moving | 0 (0.0%) | 0 (0.0%) |
| Total (Category) | 0 (0.0%) | 0 (0.0%) |
| Total (Overall) | 229 (64.5%) | 126 (35.5%) |
Employment Industries by Sex in Strawberry
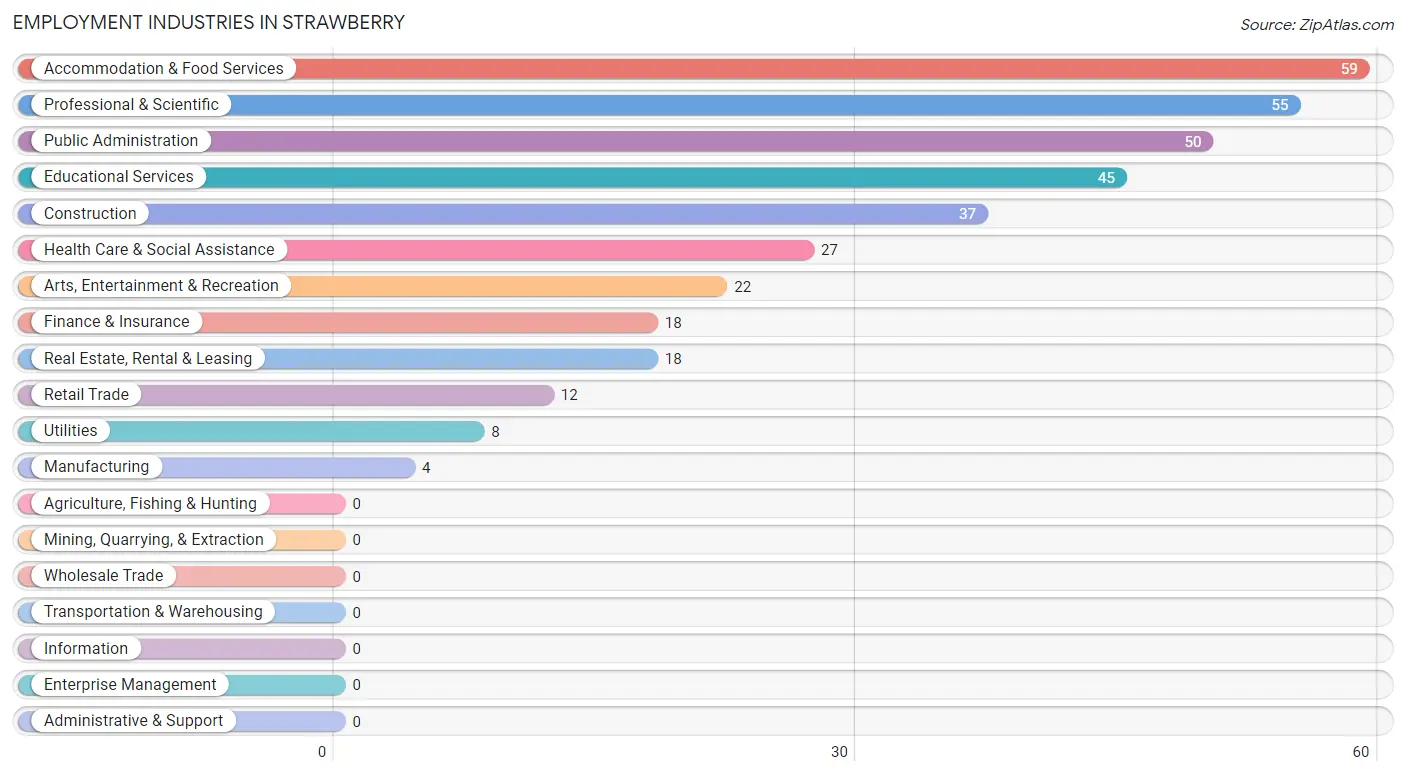
Employment Industries in Strawberry
The major employment industries in Strawberry include Accommodation & Food Services (59 | 16.6%), Professional & Scientific (55 | 15.5%), Public Administration (50 | 14.1%), Educational Services (45 | 12.7%), and Construction (37 | 10.4%).
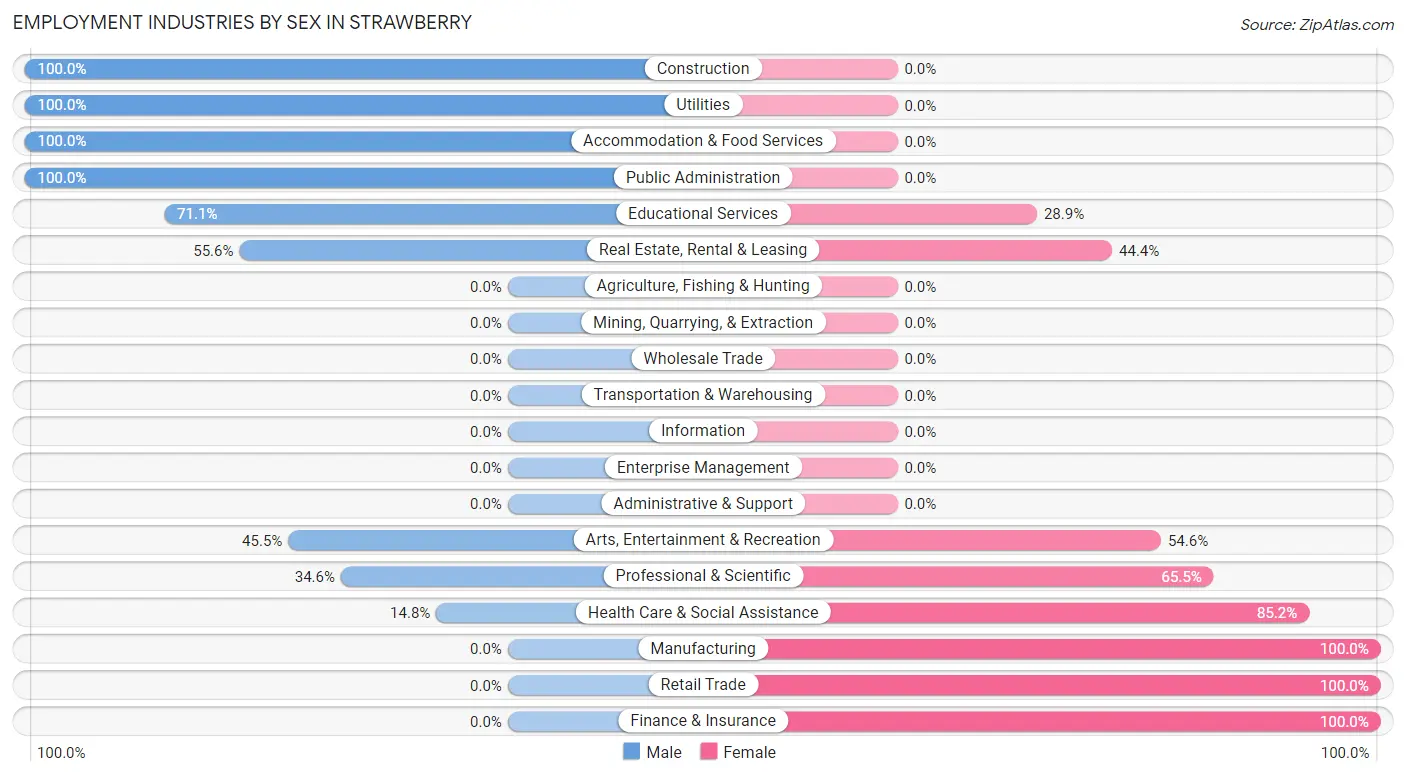
Employment Industries by Sex in Strawberry
The Strawberry industries that see more men than women are Construction (100.0%), Utilities (100.0%), and Accommodation & Food Services (100.0%), whereas the industries that tend to have a higher number of women are Manufacturing (100.0%), Retail Trade (100.0%), and Finance & Insurance (100.0%).
| Industry | Male | Female |
| Agriculture, Fishing & Hunting | 0 (0.0%) | 0 (0.0%) |
| Mining, Quarrying, & Extraction | 0 (0.0%) | 0 (0.0%) |
| Construction | 37 (100.0%) | 0 (0.0%) |
| Manufacturing | 0 (0.0%) | 4 (100.0%) |
| Wholesale Trade | 0 (0.0%) | 0 (0.0%) |
| Retail Trade | 0 (0.0%) | 12 (100.0%) |
| Transportation & Warehousing | 0 (0.0%) | 0 (0.0%) |
| Utilities | 8 (100.0%) | 0 (0.0%) |
| Information | 0 (0.0%) | 0 (0.0%) |
| Finance & Insurance | 0 (0.0%) | 18 (100.0%) |
| Real Estate, Rental & Leasing | 10 (55.6%) | 8 (44.4%) |
| Professional & Scientific | 19 (34.5%) | 36 (65.4%) |
| Enterprise Management | 0 (0.0%) | 0 (0.0%) |
| Administrative & Support | 0 (0.0%) | 0 (0.0%) |
| Educational Services | 32 (71.1%) | 13 (28.9%) |
| Health Care & Social Assistance | 4 (14.8%) | 23 (85.2%) |
| Arts, Entertainment & Recreation | 10 (45.5%) | 12 (54.5%) |
| Accommodation & Food Services | 59 (100.0%) | 0 (0.0%) |
| Public Administration | 50 (100.0%) | 0 (0.0%) |
| Total | 229 (64.5%) | 126 (35.5%) |
Education in Strawberry
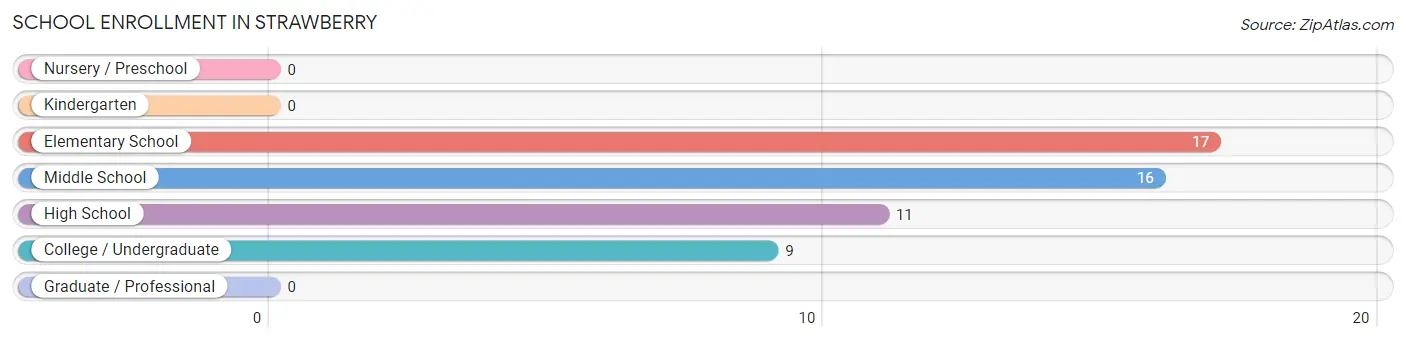
School Enrollment in Strawberry
The most common levels of schooling among the 53 students in Strawberry are elementary school (17 | 32.1%), middle school (16 | 30.2%), and high school (11 | 20.7%).
| School Level | # Students | % Students |
| Nursery / Preschool | 0 | 0.0% |
| Kindergarten | 0 | 0.0% |
| Elementary School | 17 | 32.1% |
| Middle School | 16 | 30.2% |
| High School | 11 | 20.7% |
| College / Undergraduate | 9 | 17.0% |
| Graduate / Professional | 0 | 0.0% |
| Total | 53 | 100.0% |
School Enrollment by Age by Funding Source in Strawberry
Out of a total of 53 students who are enrolled in schools in Strawberry, 33 (62.3%) attend a private institution, while the remaining 20 (37.7%) are enrolled in public schools. The age group of 5 to 9 year old has the highest likelihood of being enrolled in private schools, with 17 (100.0% in the age bracket) enrolled. Conversely, the age group of 15 to 17 year olds has the lowest likelihood of being enrolled in a private school, with 11 (100.0% in the age bracket) attending a public institution.
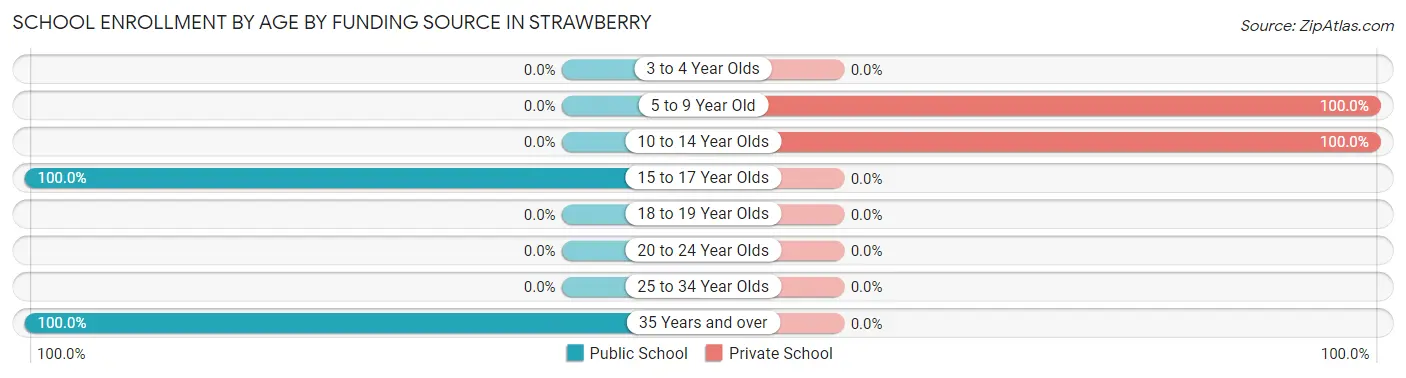
| Age Bracket | Public School | Private School |
| 3 to 4 Year Olds | 0 (0.0%) | 0 (0.0%) |
| 5 to 9 Year Old | 0 (0.0%) | 17 (100.0%) |
| 10 to 14 Year Olds | 0 (0.0%) | 16 (100.0%) |
| 15 to 17 Year Olds | 11 (100.0%) | 0 (0.0%) |
| 18 to 19 Year Olds | 0 (0.0%) | 0 (0.0%) |
| 20 to 24 Year Olds | 0 (0.0%) | 0 (0.0%) |
| 25 to 34 Year Olds | 0 (0.0%) | 0 (0.0%) |
| 35 Years and over | 9 (100.0%) | 0 (0.0%) |
| Total | 20 (37.7%) | 33 (62.3%) |
Educational Attainment by Field of Study in Strawberry
Business (60 | 25.6%), education (47 | 20.1%), visual & performing arts (39 | 16.7%), science & technology (28 | 12.0%), and arts & humanities (17 | 7.3%) are the most common fields of study among 234 individuals in Strawberry who have obtained a bachelor's degree or higher.
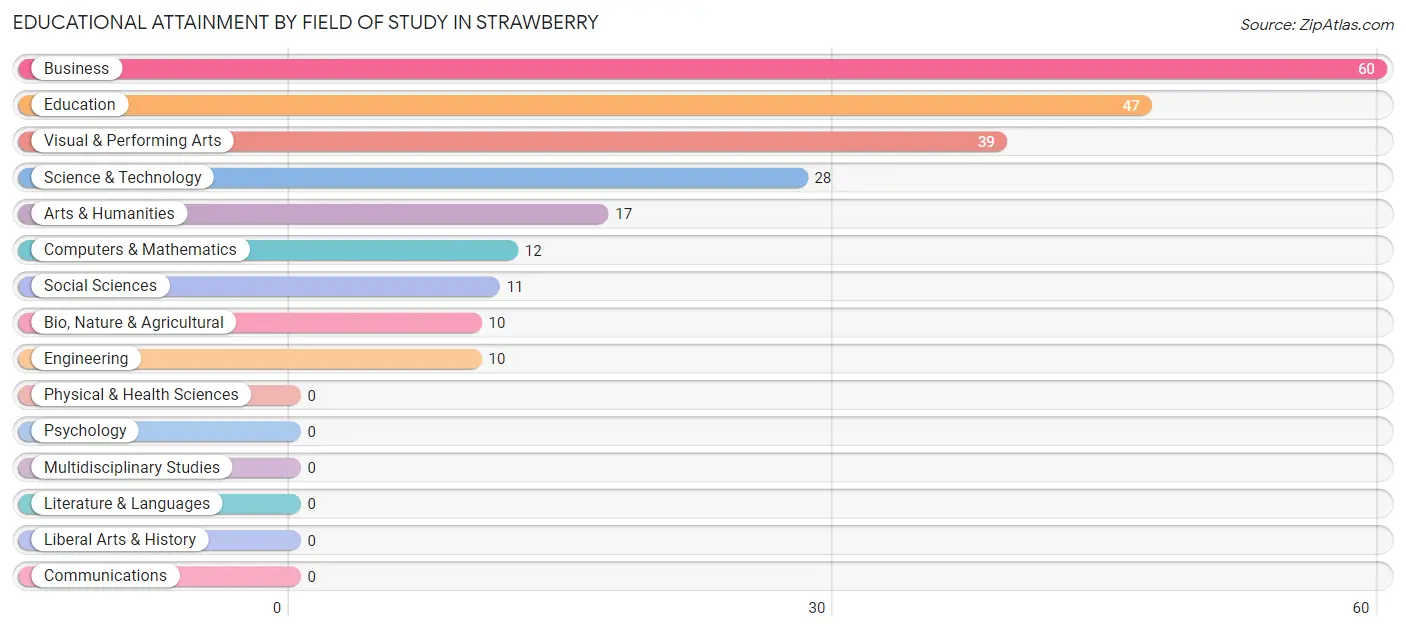
| Field of Study | # Graduates | % Graduates |
| Computers & Mathematics | 12 | 5.1% |
| Bio, Nature & Agricultural | 10 | 4.3% |
| Physical & Health Sciences | 0 | 0.0% |
| Psychology | 0 | 0.0% |
| Social Sciences | 11 | 4.7% |
| Engineering | 10 | 4.3% |
| Multidisciplinary Studies | 0 | 0.0% |
| Science & Technology | 28 | 12.0% |
| Business | 60 | 25.6% |
| Education | 47 | 20.1% |
| Literature & Languages | 0 | 0.0% |
| Liberal Arts & History | 0 | 0.0% |
| Visual & Performing Arts | 39 | 16.7% |
| Communications | 0 | 0.0% |
| Arts & Humanities | 17 | 7.3% |
| Total | 234 | 100.0% |
Transportation & Commute in Strawberry
Vehicle Availability by Sex in Strawberry
The most prevalent vehicle ownership categories in Strawberry are males with 2 vehicles (120, accounting for 52.4%) and females with 2 vehicles (61, making up 109.1%).
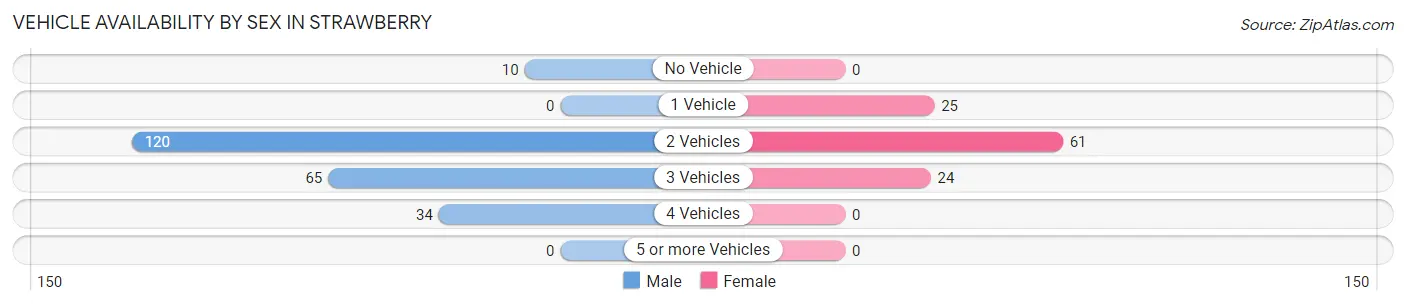
| Vehicles Available | Male | Female |
| No Vehicle | 10 (4.4%) | 0 (0.0%) |
| 1 Vehicle | 0 (0.0%) | 25 (22.7%) |
| 2 Vehicles | 120 (52.4%) | 61 (55.4%) |
| 3 Vehicles | 65 (28.4%) | 24 (21.8%) |
| 4 Vehicles | 34 (14.8%) | 0 (0.0%) |
| 5 or more Vehicles | 0 (0.0%) | 0 (0.0%) |
| Total | 229 (100.0%) | 110 (100.0%) |
Commute Time in Strawberry
The most frequently occuring commute durations in Strawberry are 90 or more minutes (50 commuters, 22.1%), 30 to 34 minutes (49 commuters, 21.7%), and 60 to 89 minutes (37 commuters, 16.4%).
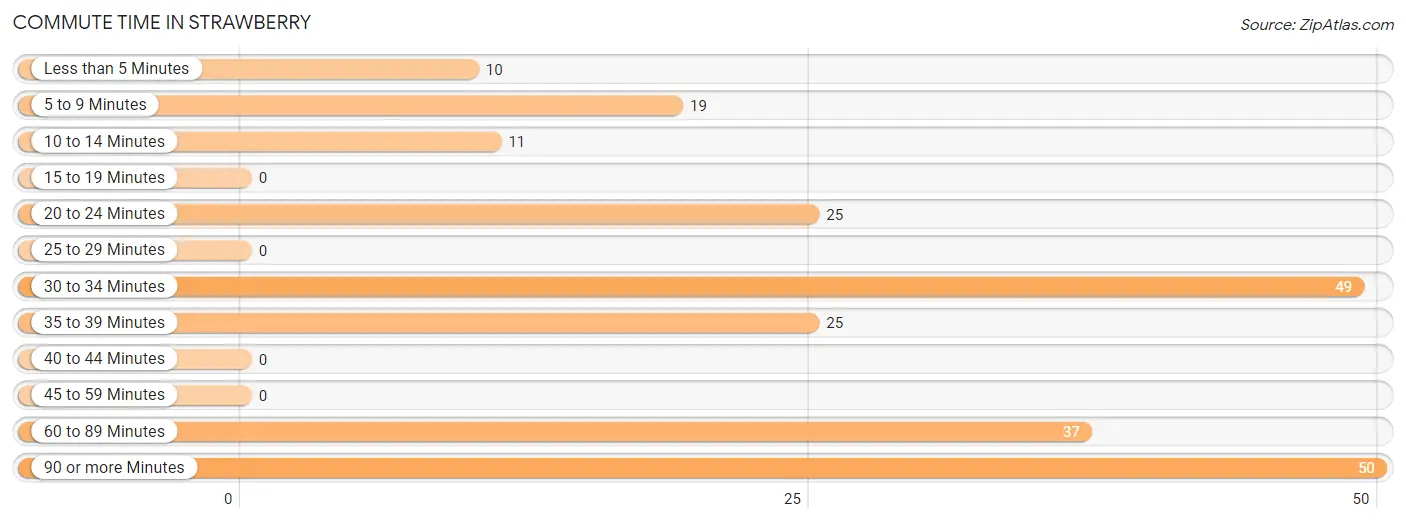
| Commute Time | # Commuters | % Commuters |
| Less than 5 Minutes | 10 | 4.4% |
| 5 to 9 Minutes | 19 | 8.4% |
| 10 to 14 Minutes | 11 | 4.9% |
| 15 to 19 Minutes | 0 | 0.0% |
| 20 to 24 Minutes | 25 | 11.1% |
| 25 to 29 Minutes | 0 | 0.0% |
| 30 to 34 Minutes | 49 | 21.7% |
| 35 to 39 Minutes | 25 | 11.1% |
| 40 to 44 Minutes | 0 | 0.0% |
| 45 to 59 Minutes | 0 | 0.0% |
| 60 to 89 Minutes | 37 | 16.4% |
| 90 or more Minutes | 50 | 22.1% |
Commute Time by Sex in Strawberry
The most common commute times in Strawberry are 90 or more minutes (50 commuters, 29.9%) for males and 20 to 24 minutes (25 commuters, 42.4%) for females.
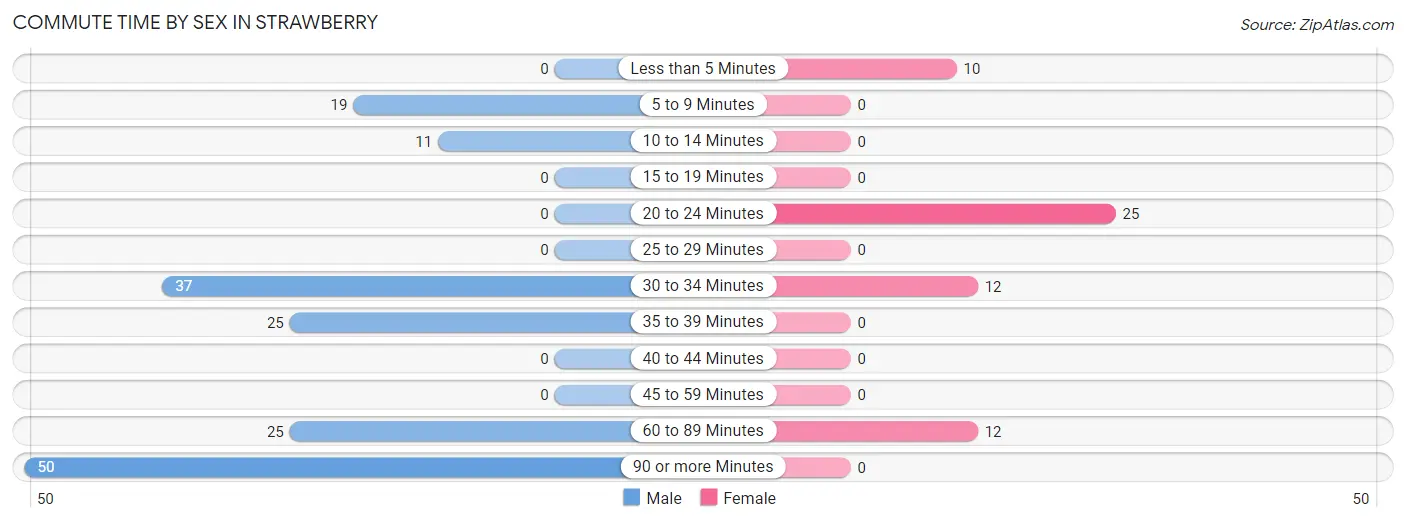
| Commute Time | Male | Female |
| Less than 5 Minutes | 0 (0.0%) | 10 (17.0%) |
| 5 to 9 Minutes | 19 (11.4%) | 0 (0.0%) |
| 10 to 14 Minutes | 11 (6.6%) | 0 (0.0%) |
| 15 to 19 Minutes | 0 (0.0%) | 0 (0.0%) |
| 20 to 24 Minutes | 0 (0.0%) | 25 (42.4%) |
| 25 to 29 Minutes | 0 (0.0%) | 0 (0.0%) |
| 30 to 34 Minutes | 37 (22.2%) | 12 (20.3%) |
| 35 to 39 Minutes | 25 (15.0%) | 0 (0.0%) |
| 40 to 44 Minutes | 0 (0.0%) | 0 (0.0%) |
| 45 to 59 Minutes | 0 (0.0%) | 0 (0.0%) |
| 60 to 89 Minutes | 25 (15.0%) | 12 (20.3%) |
| 90 or more Minutes | 50 (29.9%) | 0 (0.0%) |
Time of Departure to Work by Sex in Strawberry
The most frequent times of departure to work in Strawberry are 5:00 AM to 5:29 AM (33, 19.8%) for males and 8:00 AM to 8:29 AM (25, 42.4%) for females.
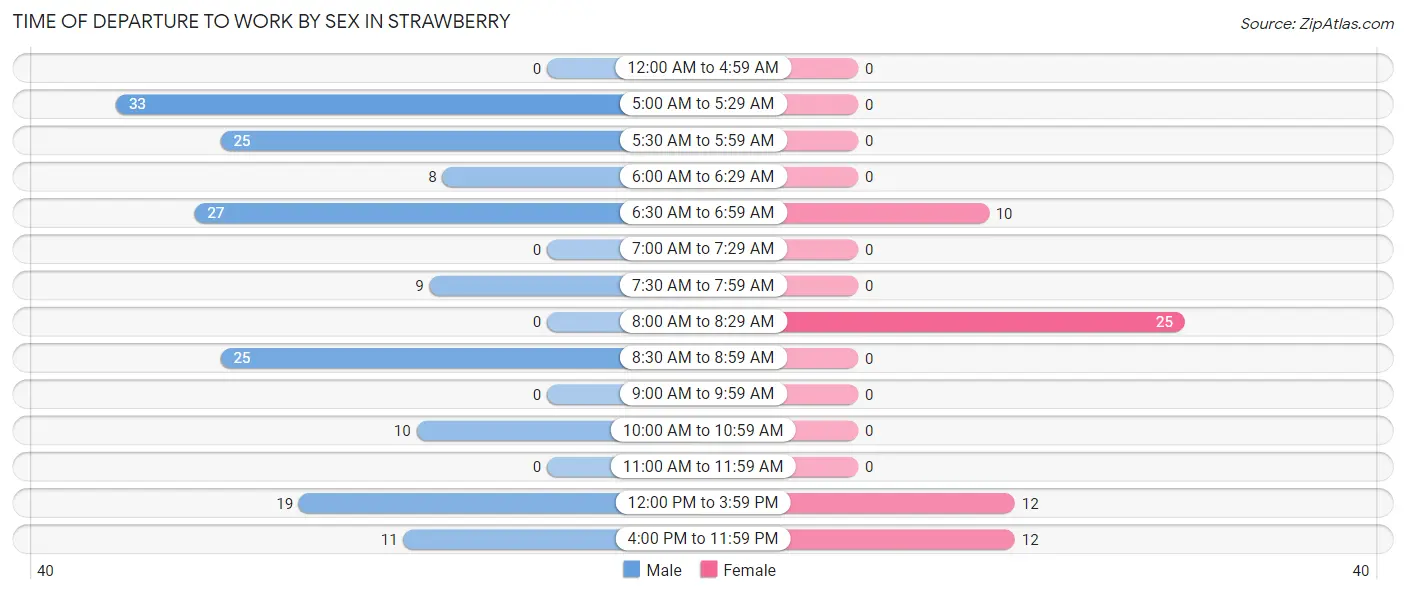
| Time of Departure | Male | Female |
| 12:00 AM to 4:59 AM | 0 (0.0%) | 0 (0.0%) |
| 5:00 AM to 5:29 AM | 33 (19.8%) | 0 (0.0%) |
| 5:30 AM to 5:59 AM | 25 (15.0%) | 0 (0.0%) |
| 6:00 AM to 6:29 AM | 8 (4.8%) | 0 (0.0%) |
| 6:30 AM to 6:59 AM | 27 (16.2%) | 10 (17.0%) |
| 7:00 AM to 7:29 AM | 0 (0.0%) | 0 (0.0%) |
| 7:30 AM to 7:59 AM | 9 (5.4%) | 0 (0.0%) |
| 8:00 AM to 8:29 AM | 0 (0.0%) | 25 (42.4%) |
| 8:30 AM to 8:59 AM | 25 (15.0%) | 0 (0.0%) |
| 9:00 AM to 9:59 AM | 0 (0.0%) | 0 (0.0%) |
| 10:00 AM to 10:59 AM | 10 (6.0%) | 0 (0.0%) |
| 11:00 AM to 11:59 AM | 0 (0.0%) | 0 (0.0%) |
| 12:00 PM to 3:59 PM | 19 (11.4%) | 12 (20.3%) |
| 4:00 PM to 11:59 PM | 11 (6.6%) | 12 (20.3%) |
| Total | 167 (100.0%) | 59 (100.0%) |
Housing Occupancy in Strawberry
Occupancy by Ownership in Strawberry
Of the total 521 dwellings in Strawberry, owner-occupied units account for 487 (93.5%), while renter-occupied units make up 34 (6.5%).
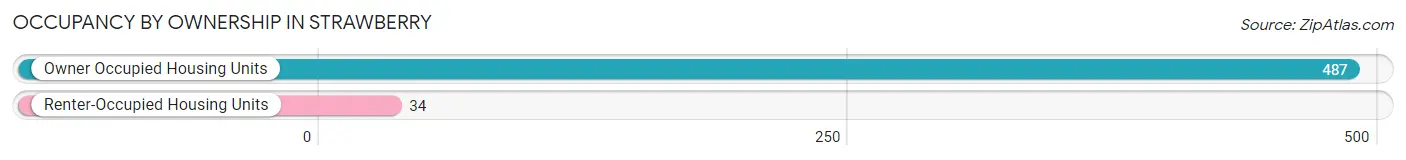
| Occupancy | # Housing Units | % Housing Units |
| Owner Occupied Housing Units | 487 | 93.5% |
| Renter-Occupied Housing Units | 34 | 6.5% |
| Total Occupied Housing Units | 521 | 100.0% |
Occupancy by Household Size in Strawberry
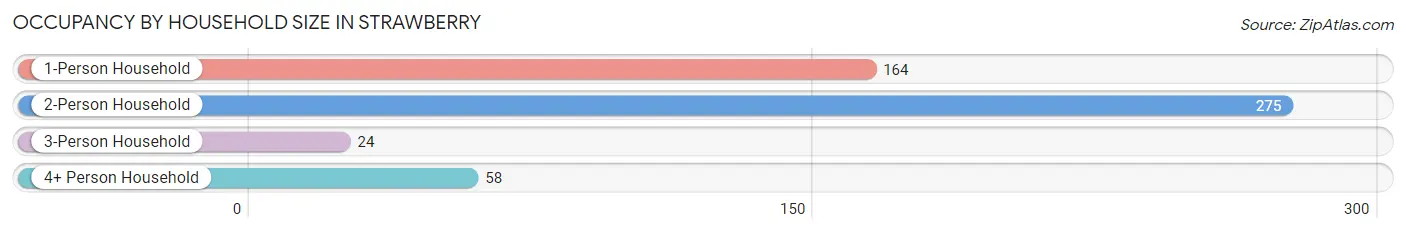
| Household Size | # Housing Units | % Housing Units |
| 1-Person Household | 164 | 31.5% |
| 2-Person Household | 275 | 52.8% |
| 3-Person Household | 24 | 4.6% |
| 4+ Person Household | 58 | 11.1% |
| Total Housing Units | 521 | 100.0% |
Occupancy by Ownership by Household Size in Strawberry
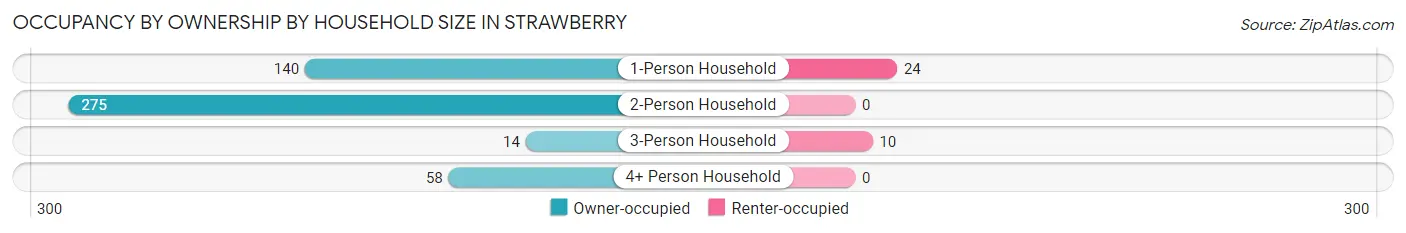
| Household Size | Owner-occupied | Renter-occupied |
| 1-Person Household | 140 (85.4%) | 24 (14.6%) |
| 2-Person Household | 275 (100.0%) | 0 (0.0%) |
| 3-Person Household | 14 (58.3%) | 10 (41.7%) |
| 4+ Person Household | 58 (100.0%) | 0 (0.0%) |
| Total Housing Units | 487 (93.5%) | 34 (6.5%) |
Occupancy by Educational Attainment in Strawberry
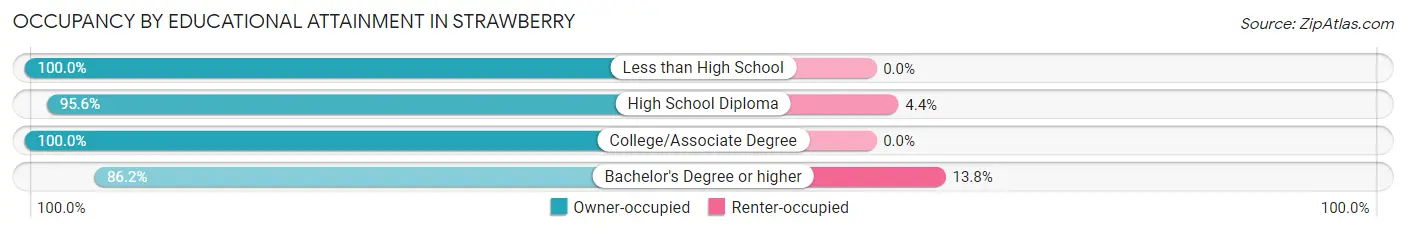
| Household Size | Owner-occupied | Renter-occupied |
| Less than High School | 29 (100.0%) | 0 (0.0%) |
| High School Diploma | 174 (95.6%) | 8 (4.4%) |
| College/Associate Degree | 121 (100.0%) | 0 (0.0%) |
| Bachelor's Degree or higher | 163 (86.2%) | 26 (13.8%) |
Occupancy by Age of Householder in Strawberry
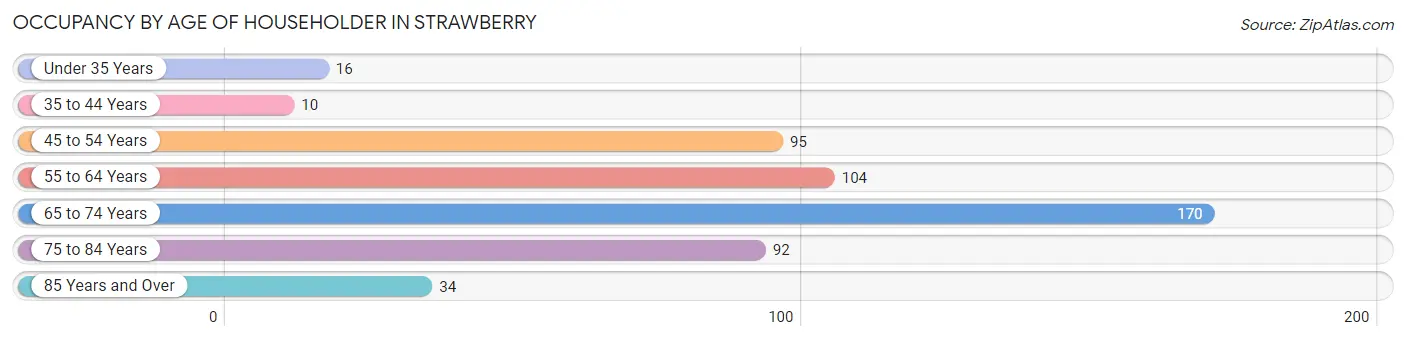
| Age Bracket | # Households | % Households |
| Under 35 Years | 16 | 3.1% |
| 35 to 44 Years | 10 | 1.9% |
| 45 to 54 Years | 95 | 18.2% |
| 55 to 64 Years | 104 | 20.0% |
| 65 to 74 Years | 170 | 32.6% |
| 75 to 84 Years | 92 | 17.7% |
| 85 Years and Over | 34 | 6.5% |
| Total | 521 | 100.0% |
Housing Finances in Strawberry
Median Income by Occupancy in Strawberry
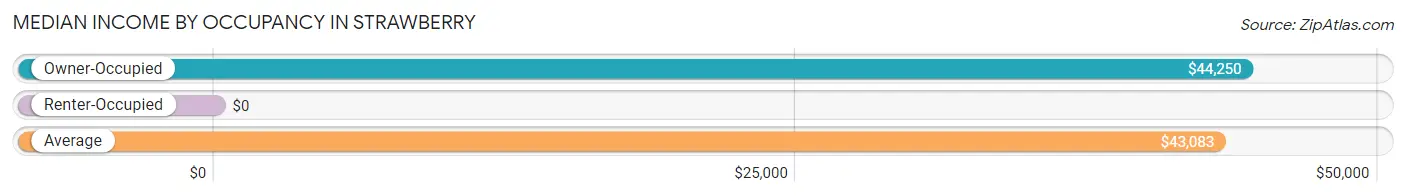
| Occupancy Type | # Households | Median Income |
| Owner-Occupied | 487 (93.5%) | $44,250 |
| Renter-Occupied | 34 (6.5%) | $0 |
| Average | 521 (100.0%) | $43,083 |
Occupancy by Householder Income Bracket in Strawberry
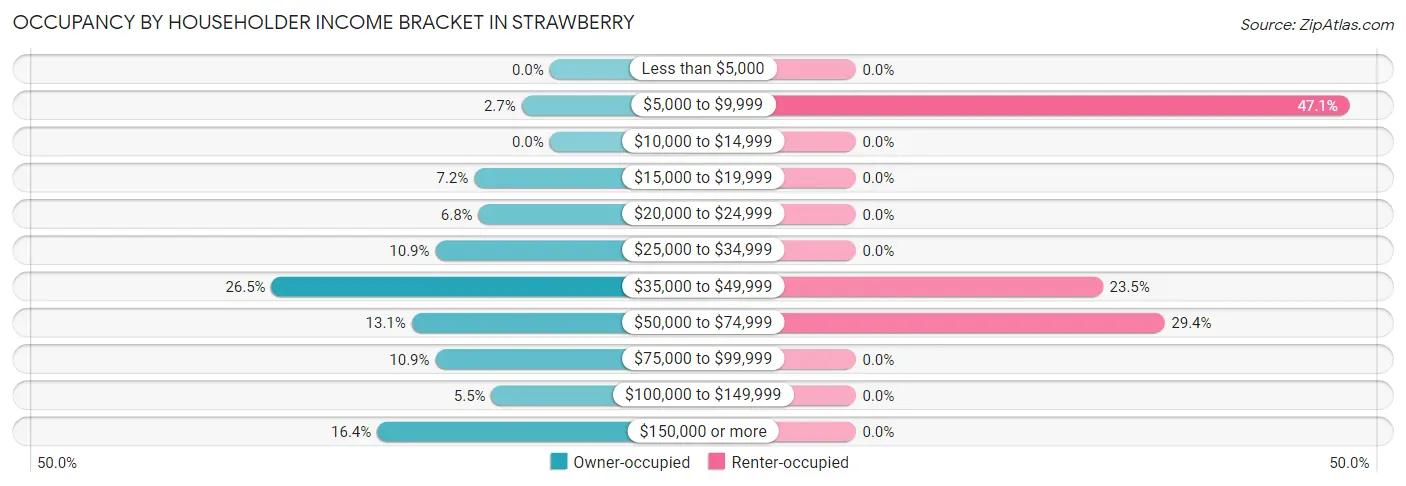
| Income Bracket | Owner-occupied | Renter-occupied |
| Less than $5,000 | 0 (0.0%) | 0 (0.0%) |
| $5,000 to $9,999 | 13 (2.7%) | 16 (47.1%) |
| $10,000 to $14,999 | 0 (0.0%) | 0 (0.0%) |
| $15,000 to $19,999 | 35 (7.2%) | 0 (0.0%) |
| $20,000 to $24,999 | 33 (6.8%) | 0 (0.0%) |
| $25,000 to $34,999 | 53 (10.9%) | 0 (0.0%) |
| $35,000 to $49,999 | 129 (26.5%) | 8 (23.5%) |
| $50,000 to $74,999 | 64 (13.1%) | 10 (29.4%) |
| $75,000 to $99,999 | 53 (10.9%) | 0 (0.0%) |
| $100,000 to $149,999 | 27 (5.5%) | 0 (0.0%) |
| $150,000 or more | 80 (16.4%) | 0 (0.0%) |
| Total | 487 (100.0%) | 34 (100.0%) |
Monthly Housing Cost Tiers in Strawberry
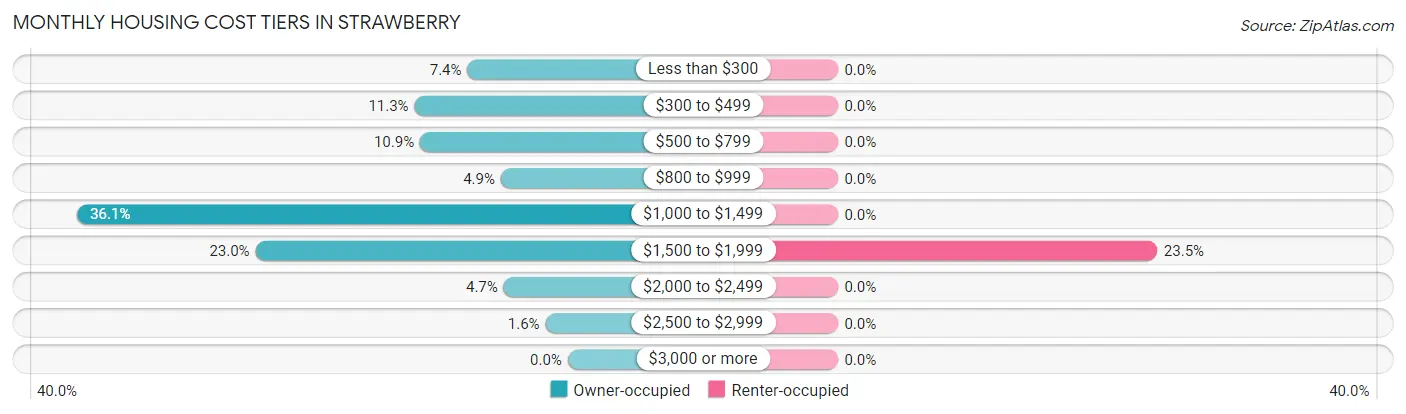
| Monthly Cost | Owner-occupied | Renter-occupied |
| Less than $300 | 36 (7.4%) | 0 (0.0%) |
| $300 to $499 | 55 (11.3%) | 0 (0.0%) |
| $500 to $799 | 53 (10.9%) | 0 (0.0%) |
| $800 to $999 | 24 (4.9%) | 0 (0.0%) |
| $1,000 to $1,499 | 176 (36.1%) | 0 (0.0%) |
| $1,500 to $1,999 | 112 (23.0%) | 8 (23.5%) |
| $2,000 to $2,499 | 23 (4.7%) | 0 (0.0%) |
| $2,500 to $2,999 | 8 (1.6%) | 0 (0.0%) |
| $3,000 or more | 0 (0.0%) | 0 (0.0%) |
| Total | 487 (100.0%) | 34 (100.0%) |
Physical Housing Characteristics in Strawberry
Housing Structures in Strawberry
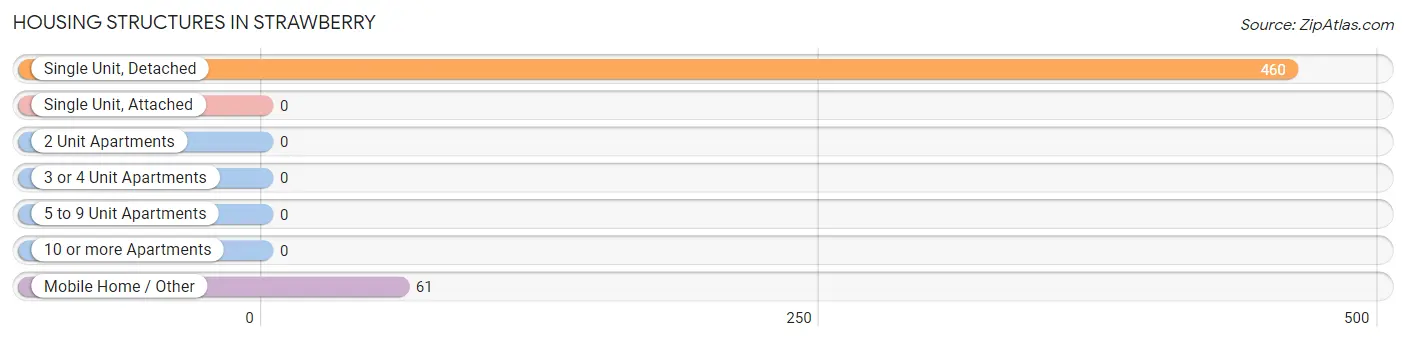
| Structure Type | # Housing Units | % Housing Units |
| Single Unit, Detached | 460 | 88.3% |
| Single Unit, Attached | 0 | 0.0% |
| 2 Unit Apartments | 0 | 0.0% |
| 3 or 4 Unit Apartments | 0 | 0.0% |
| 5 to 9 Unit Apartments | 0 | 0.0% |
| 10 or more Apartments | 0 | 0.0% |
| Mobile Home / Other | 61 | 11.7% |
| Total | 521 | 100.0% |
Housing Structures by Occupancy in Strawberry
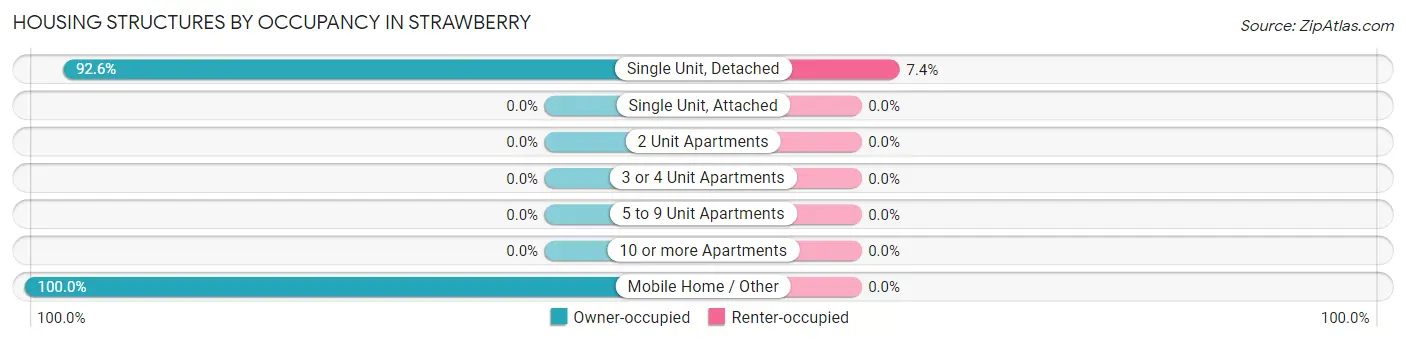
| Structure Type | Owner-occupied | Renter-occupied |
| Single Unit, Detached | 426 (92.6%) | 34 (7.4%) |
| Single Unit, Attached | 0 (0.0%) | 0 (0.0%) |
| 2 Unit Apartments | 0 (0.0%) | 0 (0.0%) |
| 3 or 4 Unit Apartments | 0 (0.0%) | 0 (0.0%) |
| 5 to 9 Unit Apartments | 0 (0.0%) | 0 (0.0%) |
| 10 or more Apartments | 0 (0.0%) | 0 (0.0%) |
| Mobile Home / Other | 61 (100.0%) | 0 (0.0%) |
| Total | 487 (93.5%) | 34 (6.5%) |
Housing Structures by Number of Rooms in Strawberry
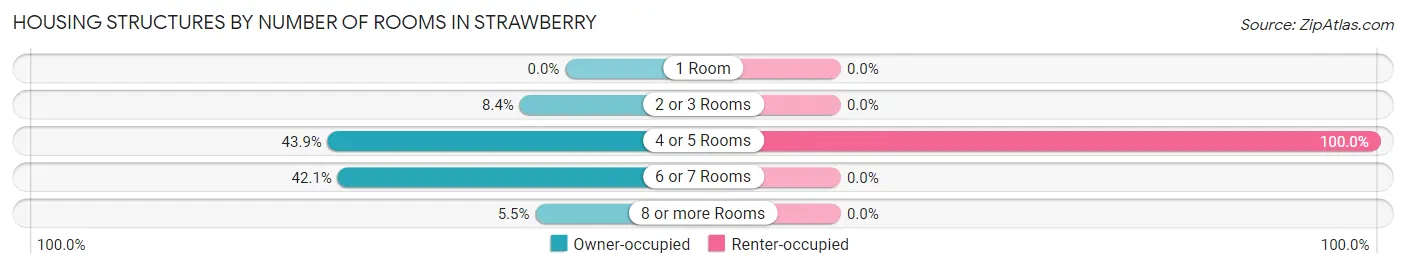
| Number of Rooms | Owner-occupied | Renter-occupied |
| 1 Room | 0 (0.0%) | 0 (0.0%) |
| 2 or 3 Rooms | 41 (8.4%) | 0 (0.0%) |
| 4 or 5 Rooms | 214 (43.9%) | 34 (100.0%) |
| 6 or 7 Rooms | 205 (42.1%) | 0 (0.0%) |
| 8 or more Rooms | 27 (5.5%) | 0 (0.0%) |
| Total | 487 (100.0%) | 34 (100.0%) |
Housing Structure by Heating Type in Strawberry
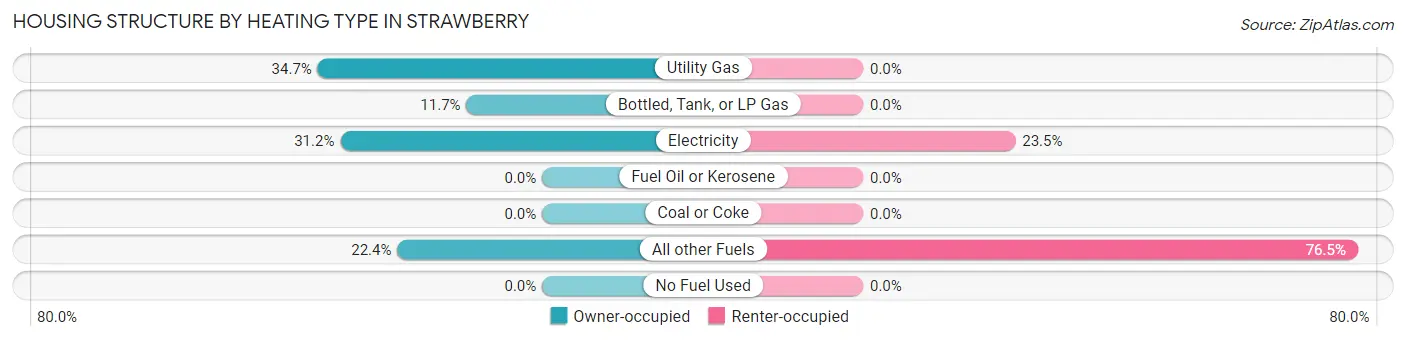
| Heating Type | Owner-occupied | Renter-occupied |
| Utility Gas | 169 (34.7%) | 0 (0.0%) |
| Bottled, Tank, or LP Gas | 57 (11.7%) | 0 (0.0%) |
| Electricity | 152 (31.2%) | 8 (23.5%) |
| Fuel Oil or Kerosene | 0 (0.0%) | 0 (0.0%) |
| Coal or Coke | 0 (0.0%) | 0 (0.0%) |
| All other Fuels | 109 (22.4%) | 26 (76.5%) |
| No Fuel Used | 0 (0.0%) | 0 (0.0%) |
| Total | 487 (100.0%) | 34 (100.0%) |
Household Vehicle Usage in Strawberry
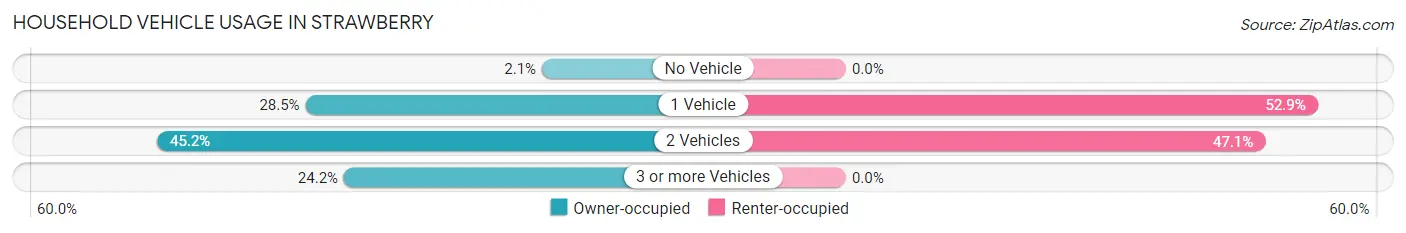
| Vehicles per Household | Owner-occupied | Renter-occupied |
| No Vehicle | 10 (2.1%) | 0 (0.0%) |
| 1 Vehicle | 139 (28.5%) | 18 (52.9%) |
| 2 Vehicles | 220 (45.2%) | 16 (47.1%) |
| 3 or more Vehicles | 118 (24.2%) | 0 (0.0%) |
| Total | 487 (100.0%) | 34 (100.0%) |
Real Estate & Mortgages in Strawberry
Real Estate and Mortgage Overview in Strawberry
| Characteristic | Without Mortgage | With Mortgage |
| Housing Units | 157 | 330 |
| Median Property Value | $235,500 | $339,800 |
| Median Household Income | $36,509 | $70 |
| Monthly Housing Costs | $422 | $0 |
| Real Estate Taxes | $2,210 | $27 |
Property Value by Mortgage Status in Strawberry
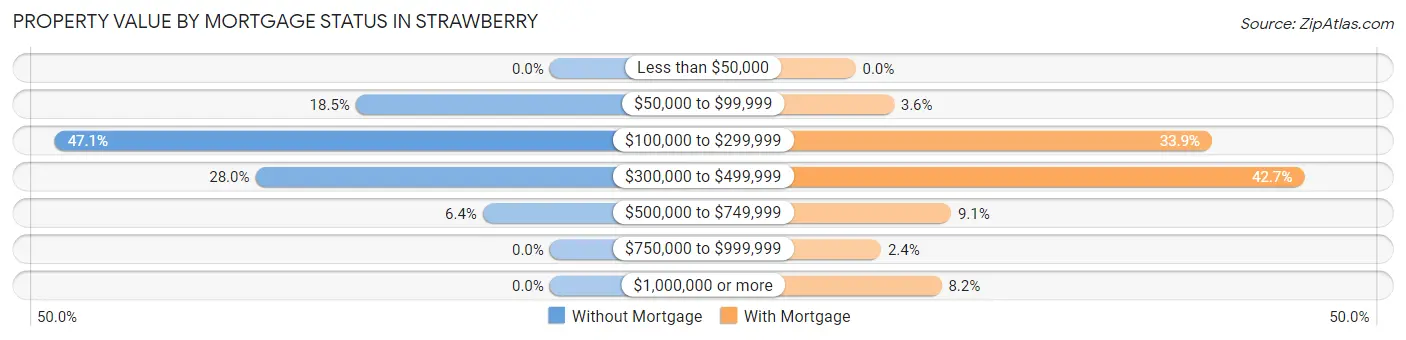
| Property Value | Without Mortgage | With Mortgage |
| Less than $50,000 | 0 (0.0%) | 0 (0.0%) |
| $50,000 to $99,999 | 29 (18.5%) | 12 (3.6%) |
| $100,000 to $299,999 | 74 (47.1%) | 112 (33.9%) |
| $300,000 to $499,999 | 44 (28.0%) | 141 (42.7%) |
| $500,000 to $749,999 | 10 (6.4%) | 30 (9.1%) |
| $750,000 to $999,999 | 0 (0.0%) | 8 (2.4%) |
| $1,000,000 or more | 0 (0.0%) | 27 (8.2%) |
| Total | 157 (100.0%) | 330 (100.0%) |
Household Income by Mortgage Status in Strawberry
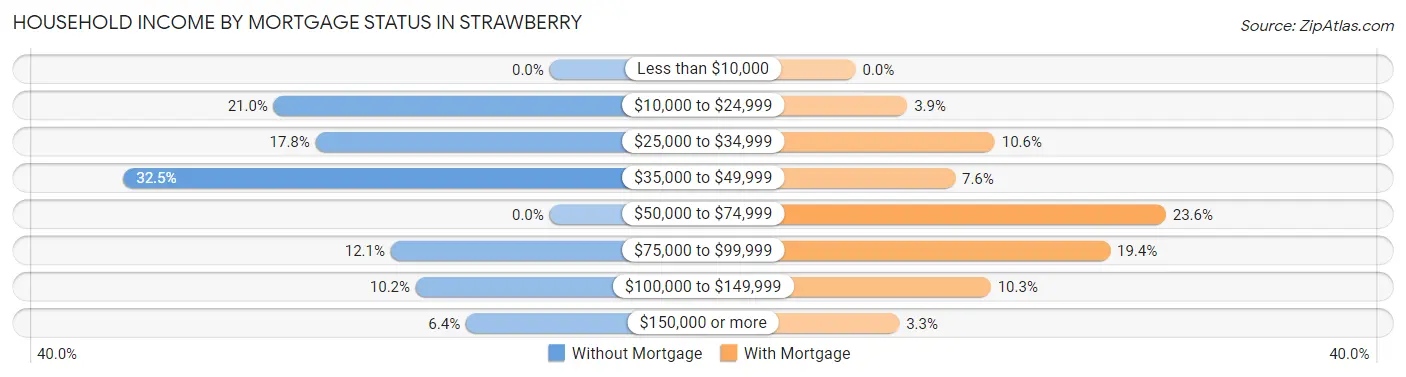
| Household Income | Without Mortgage | With Mortgage |
| Less than $10,000 | 0 (0.0%) | 0 (0.0%) |
| $10,000 to $24,999 | 33 (21.0%) | 13 (3.9%) |
| $25,000 to $34,999 | 28 (17.8%) | 35 (10.6%) |
| $35,000 to $49,999 | 51 (32.5%) | 25 (7.6%) |
| $50,000 to $74,999 | 0 (0.0%) | 78 (23.6%) |
| $75,000 to $99,999 | 19 (12.1%) | 64 (19.4%) |
| $100,000 to $149,999 | 16 (10.2%) | 34 (10.3%) |
| $150,000 or more | 10 (6.4%) | 11 (3.3%) |
| Total | 157 (100.0%) | 330 (100.0%) |
Property Value to Household Income Ratio in Strawberry
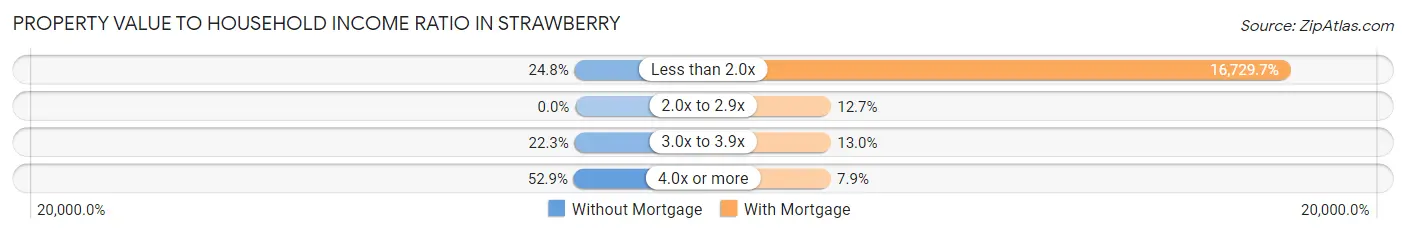
| Value-to-Income Ratio | Without Mortgage | With Mortgage |
| Less than 2.0x | 39 (24.8%) | 55,208 (16,729.7%) |
| 2.0x to 2.9x | 0 (0.0%) | 42 (12.7%) |
| 3.0x to 3.9x | 35 (22.3%) | 43 (13.0%) |
| 4.0x or more | 83 (52.9%) | 26 (7.9%) |
| Total | 157 (100.0%) | 330 (100.0%) |
Real Estate Taxes by Mortgage Status in Strawberry
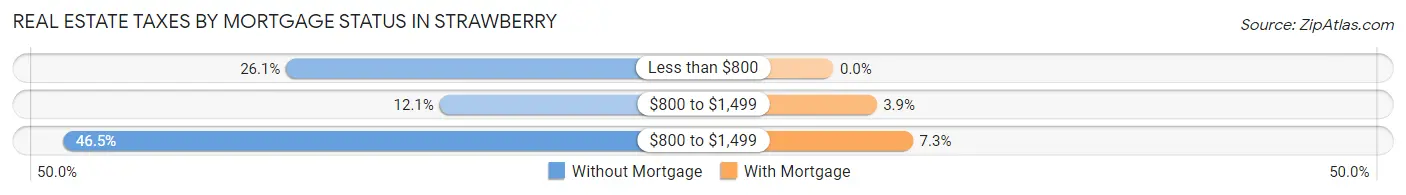
| Property Taxes | Without Mortgage | With Mortgage |
| Less than $800 | 41 (26.1%) | 0 (0.0%) |
| $800 to $1,499 | 19 (12.1%) | 13 (3.9%) |
| $800 to $1,499 | 73 (46.5%) | 24 (7.3%) |
| Total | 157 (100.0%) | 330 (100.0%) |
Health & Disability in Strawberry
Health Insurance Coverage by Age in Strawberry
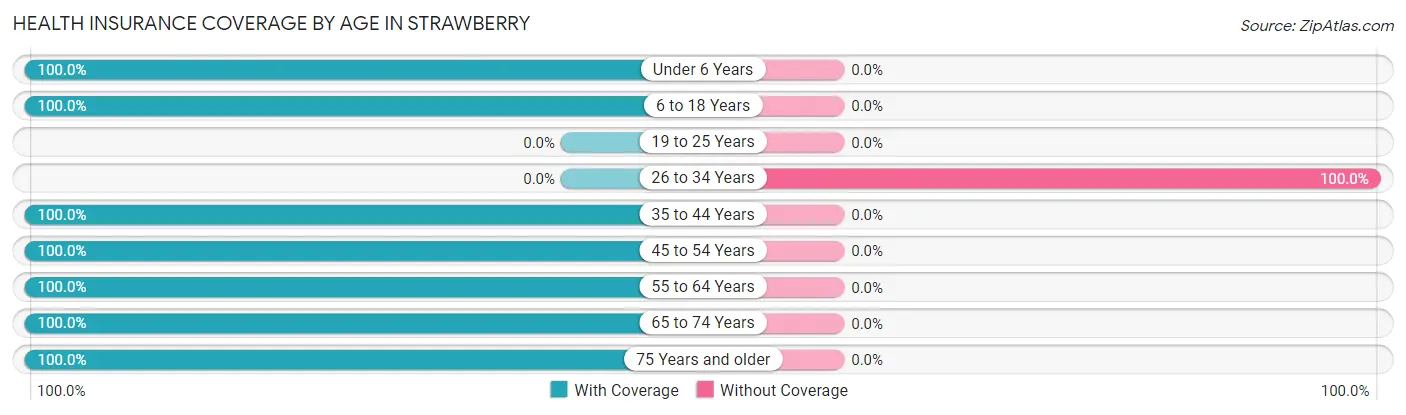
| Age Bracket | With Coverage | Without Coverage |
| Under 6 Years | 70 (100.0%) | 0 (0.0%) |
| 6 to 18 Years | 44 (100.0%) | 0 (0.0%) |
| 19 to 25 Years | 0 (0.0%) | 0 (0.0%) |
| 26 to 34 Years | 0 (0.0%) | 16 (100.0%) |
| 35 to 44 Years | 64 (100.0%) | 0 (0.0%) |
| 45 to 54 Years | 178 (100.0%) | 0 (0.0%) |
| 55 to 64 Years | 149 (100.0%) | 0 (0.0%) |
| 65 to 74 Years | 287 (100.0%) | 0 (0.0%) |
| 75 Years and older | 195 (100.0%) | 0 (0.0%) |
| Total | 987 (98.4%) | 16 (1.6%) |
Health Insurance Coverage by Citizenship Status in Strawberry
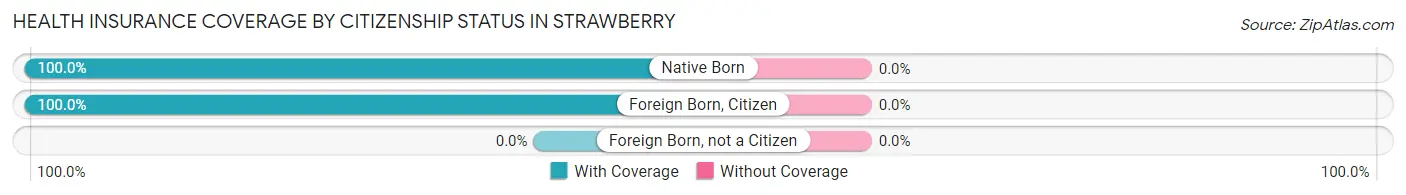
| Citizenship Status | With Coverage | Without Coverage |
| Native Born | 70 (100.0%) | 0 (0.0%) |
| Foreign Born, Citizen | 44 (100.0%) | 0 (0.0%) |
| Foreign Born, not a Citizen | 0 (0.0%) | 0 (0.0%) |
Health Insurance Coverage by Household Income in Strawberry
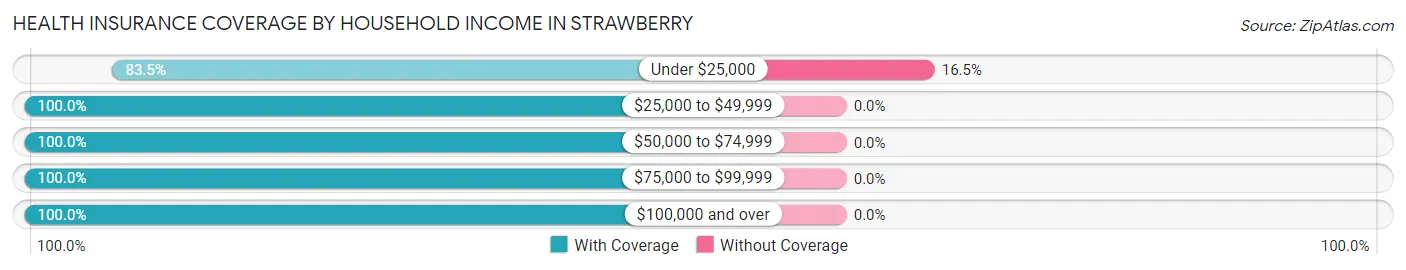
| Household Income | With Coverage | Without Coverage |
| Under $25,000 | 81 (83.5%) | 16 (16.5%) |
| $25,000 to $49,999 | 390 (100.0%) | 0 (0.0%) |
| $50,000 to $74,999 | 120 (100.0%) | 0 (0.0%) |
| $75,000 to $99,999 | 133 (100.0%) | 0 (0.0%) |
| $100,000 and over | 263 (100.0%) | 0 (0.0%) |
Public vs Private Health Insurance Coverage by Age in Strawberry
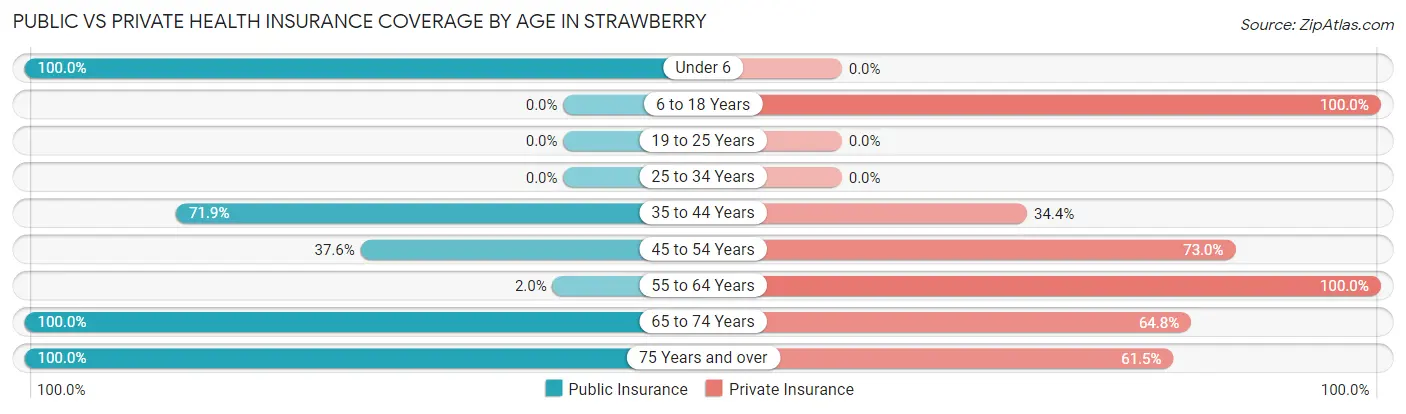
| Age Bracket | Public Insurance | Private Insurance |
| Under 6 | 70 (100.0%) | 0 (0.0%) |
| 6 to 18 Years | 0 (0.0%) | 44 (100.0%) |
| 19 to 25 Years | 0 (0.0%) | 0 (0.0%) |
| 25 to 34 Years | 0 (0.0%) | 0 (0.0%) |
| 35 to 44 Years | 46 (71.9%) | 22 (34.4%) |
| 45 to 54 Years | 67 (37.6%) | 130 (73.0%) |
| 55 to 64 Years | 3 (2.0%) | 149 (100.0%) |
| 65 to 74 Years | 287 (100.0%) | 186 (64.8%) |
| 75 Years and over | 195 (100.0%) | 120 (61.5%) |
| Total | 668 (66.6%) | 651 (64.9%) |
Disability Status by Sex by Age in Strawberry
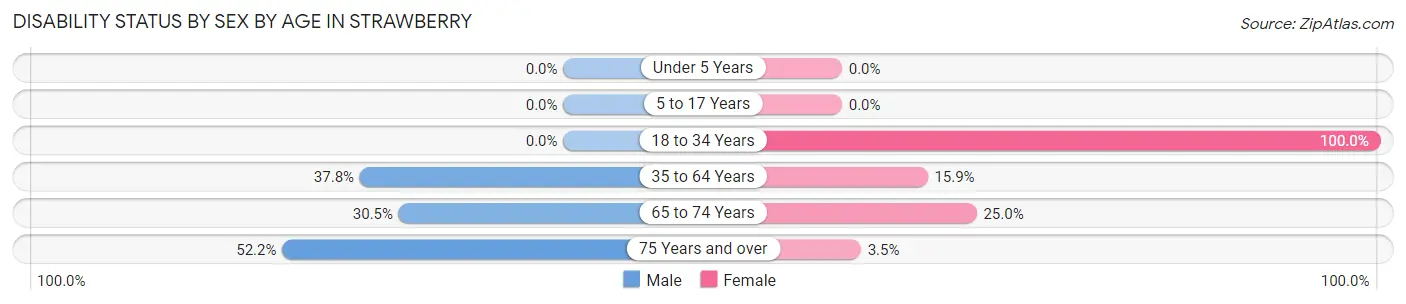
| Age Bracket | Male | Female |
| Under 5 Years | 0 (0.0%) | 0 (0.0%) |
| 5 to 17 Years | 0 (0.0%) | 0 (0.0%) |
| 18 to 34 Years | 0 (0.0%) | 16 (100.0%) |
| 35 to 64 Years | 74 (37.8%) | 31 (15.9%) |
| 65 to 74 Years | 40 (30.5%) | 39 (25.0%) |
| 75 Years and over | 72 (52.2%) | 2 (3.5%) |
Disability Class by Sex by Age in Strawberry
Disability Class: Hearing Difficulty
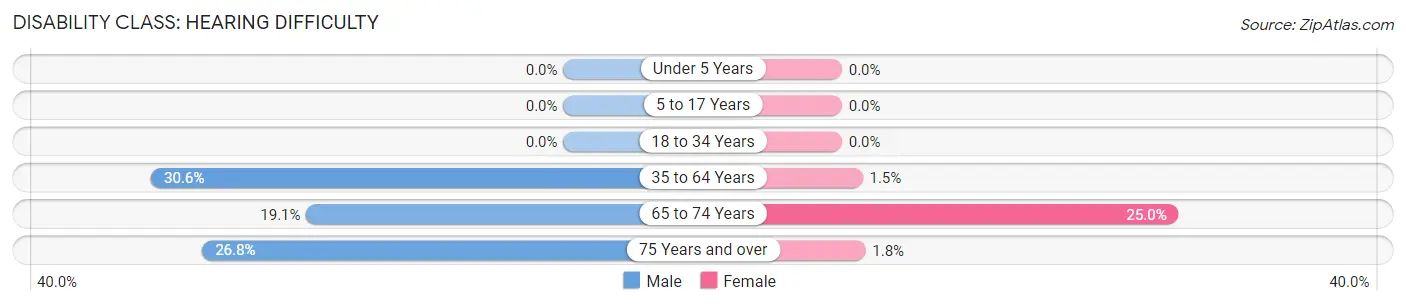
| Age Bracket | Male | Female |
| Under 5 Years | 0 (0.0%) | 0 (0.0%) |
| 5 to 17 Years | 0 (0.0%) | 0 (0.0%) |
| 18 to 34 Years | 0 (0.0%) | 0 (0.0%) |
| 35 to 64 Years | 60 (30.6%) | 3 (1.5%) |
| 65 to 74 Years | 25 (19.1%) | 39 (25.0%) |
| 75 Years and over | 37 (26.8%) | 1 (1.8%) |
Disability Class: Vision Difficulty
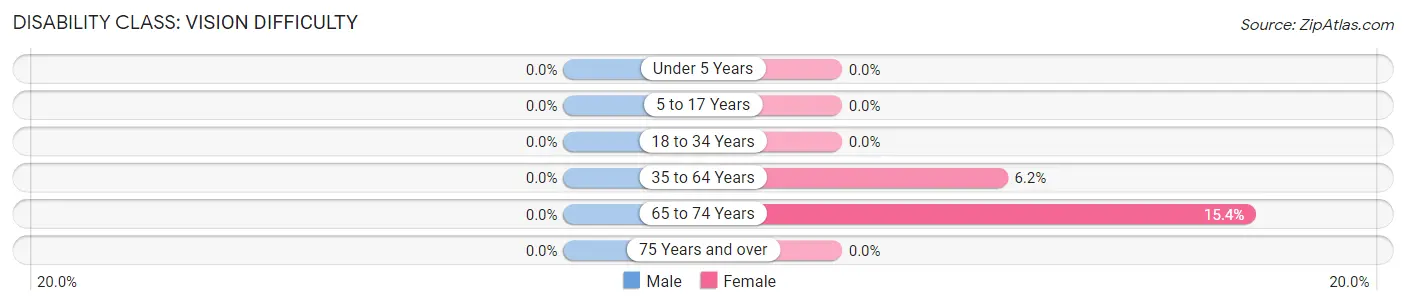
| Age Bracket | Male | Female |
| Under 5 Years | 0 (0.0%) | 0 (0.0%) |
| 5 to 17 Years | 0 (0.0%) | 0 (0.0%) |
| 18 to 34 Years | 0 (0.0%) | 0 (0.0%) |
| 35 to 64 Years | 0 (0.0%) | 12 (6.1%) |
| 65 to 74 Years | 0 (0.0%) | 24 (15.4%) |
| 75 Years and over | 0 (0.0%) | 0 (0.0%) |
Disability Class: Cognitive Difficulty
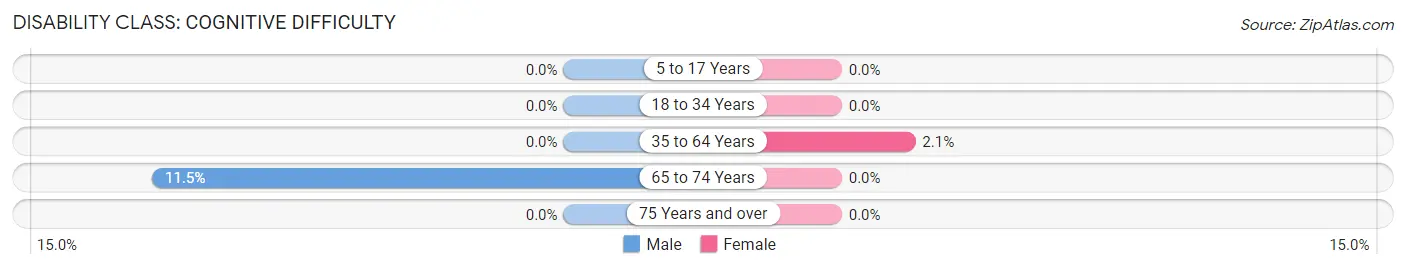
| Age Bracket | Male | Female |
| 5 to 17 Years | 0 (0.0%) | 0 (0.0%) |
| 18 to 34 Years | 0 (0.0%) | 0 (0.0%) |
| 35 to 64 Years | 0 (0.0%) | 4 (2.1%) |
| 65 to 74 Years | 15 (11.5%) | 0 (0.0%) |
| 75 Years and over | 0 (0.0%) | 0 (0.0%) |
Disability Class: Ambulatory Difficulty
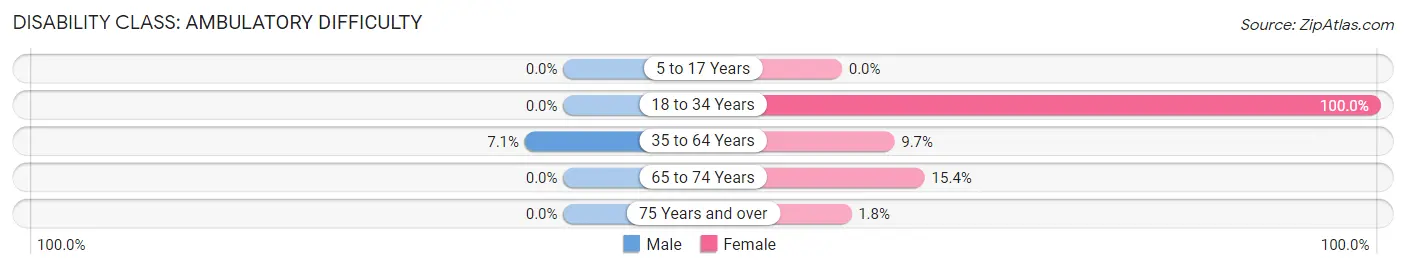
| Age Bracket | Male | Female |
| 5 to 17 Years | 0 (0.0%) | 0 (0.0%) |
| 18 to 34 Years | 0 (0.0%) | 16 (100.0%) |
| 35 to 64 Years | 14 (7.1%) | 19 (9.7%) |
| 65 to 74 Years | 0 (0.0%) | 24 (15.4%) |
| 75 Years and over | 0 (0.0%) | 1 (1.8%) |
Disability Class: Self-Care Difficulty
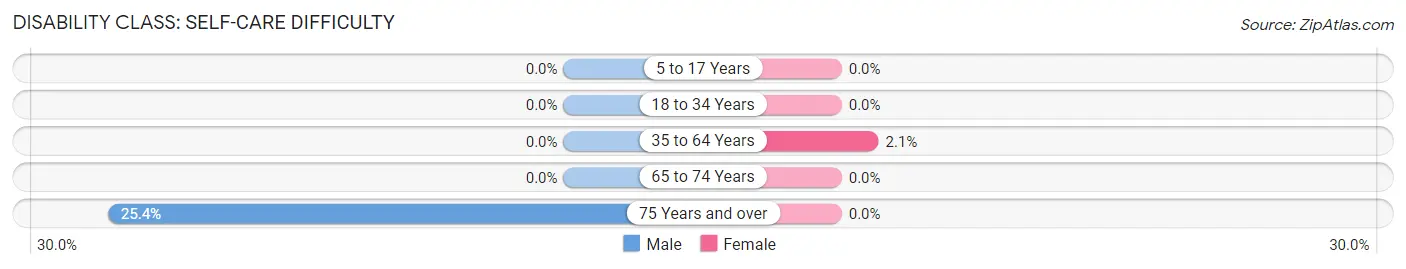
| Age Bracket | Male | Female |
| 5 to 17 Years | 0 (0.0%) | 0 (0.0%) |
| 18 to 34 Years | 0 (0.0%) | 0 (0.0%) |
| 35 to 64 Years | 0 (0.0%) | 4 (2.1%) |
| 65 to 74 Years | 0 (0.0%) | 0 (0.0%) |
| 75 Years and over | 35 (25.4%) | 0 (0.0%) |
Technology Access in Strawberry
Computing Device Access in Strawberry
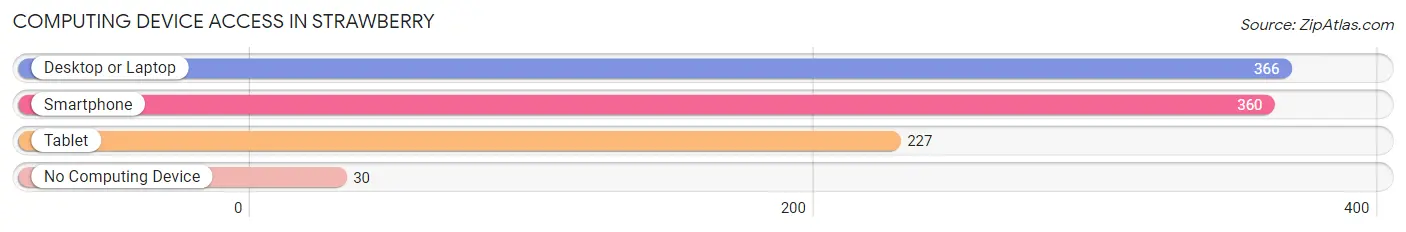
| Device Type | # Households | % Households |
| Desktop or Laptop | 366 | 70.3% |
| Smartphone | 360 | 69.1% |
| Tablet | 227 | 43.6% |
| No Computing Device | 30 | 5.8% |
| Total | 521 | 100.0% |
Internet Access in Strawberry
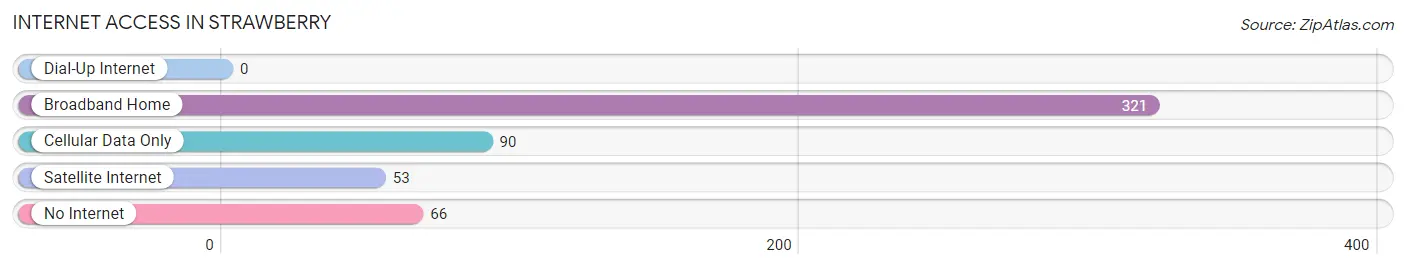
| Internet Type | # Households | % Households |
| Dial-Up Internet | 0 | 0.0% |
| Broadband Home | 321 | 61.6% |
| Cellular Data Only | 90 | 17.3% |
| Satellite Internet | 53 | 10.2% |
| No Internet | 66 | 12.7% |
| Total | 521 | 100.0% |
Strawberry Summary
Strawberry, Arizona is a small unincorporated community located in the Mogollon Rim region of Gila County, Arizona. It is situated in the Tonto National Forest, approximately 80 miles northeast of Phoenix. The town is located at an elevation of 5,400 feet and is surrounded by the beautiful Mogollon Rim Mountains.
History
Strawberry was first settled in the late 1800s by ranchers and farmers. The town was named after the wild strawberries that grew in the area. In the early 1900s, the town was a popular stop for travelers on the Apache Trail. The town was also home to a stagecoach stop, a post office, and a general store.
In the 1920s, the town began to grow as a tourist destination. The Strawberry Lodge was built in 1925 and was a popular destination for fishing, hunting, and camping. The lodge was destroyed by a fire in the 1950s.
In the 1950s, the town began to decline as the popularity of the Apache Trail decreased. The post office closed in the 1960s and the general store closed in the 1970s.
Geography
Strawberry is located in the Mogollon Rim region of Gila County, Arizona. It is situated in the Tonto National Forest, approximately 80 miles northeast of Phoenix. The town is located at an elevation of 5,400 feet and is surrounded by the beautiful Mogollon Rim Mountains.
The town is located in a valley surrounded by the Mogollon Rim Mountains. The area is known for its scenic beauty and is a popular destination for camping, hiking, and fishing.
Economy
Strawberry is a small, rural community with a population of approximately 500 people. The town is primarily a tourist destination and is home to several resorts, campgrounds, and restaurants. The town is also home to a few small businesses, including a general store, a gas station, and a post office.
The town is also home to the Strawberry School District, which serves the local community. The district includes two elementary schools, a middle school, and a high school.
Demographics
As of the 2010 census, the population of Strawberry was 498. The racial makeup of the town was 95.2% White, 0.2% African American, 0.8% Native American, 0.2% Asian, 0.2% Pacific Islander, 1.2% from other races, and 2.2% from two or more races. Hispanic or Latino of any race were 4.2% of the population.
The median household income in Strawberry was $37,500, and the median family income was $41,250. The per capita income for the town was $17,845. About 11.2% of families and 14.2% of the population were below the poverty line, including 18.2% of those under age 18 and none of those age 65 or over.
Common Questions
What is the Total Population of Strawberry?
Total Population of Strawberry is 1,003.
What is the Total Male Population of Strawberry?
Total Male Population of Strawberry is 492.
What is the Total Female Population of Strawberry?
Total Female Population of Strawberry is 511.
What is the Ratio of Males per 100 Females in Strawberry?
There are 96.28 Males per 100 Females in Strawberry.
What is the Ratio of Females per 100 Males in Strawberry?
There are 103.86 Females per 100 Males in Strawberry.
What is the Median Population Age in Strawberry?
Median Population Age in Strawberry is 63.7 Years.
What is the Average Family Size in Strawberry
Average Family Size in Strawberry is 2.4 People.
What is the Average Household Size in Strawberry
Average Household Size in Strawberry is 1.9 People.
What is Per Capita Income in Strawberry?
Per Capita income in Strawberry is $37,432.
What is the Median Family Income in Strawberry?
Median Family Income in Strawberry is $70,938.
What is the Median Household income in Strawberry?
Median Household Income in Strawberry is $43,083.
What is Inequality or Gini Index in Strawberry?
Inequality or Gini Index in Strawberry is 0.44.
How Large is the Labor Force in Strawberry?
There are 355 People in the Labor Forcein in Strawberry.
What is the Percentage of People in the Labor Force in Strawberry?
39.4% of People are in the Labor Force in Strawberry.