Zip Codes with the Highest Percentage of Population Employed in Architecture & Engineering in San Tan Valley, AZ
RELATED REPORTS & OPTIONS
Architecture & Engineering
San Tan Valley
Compare Zip Codes
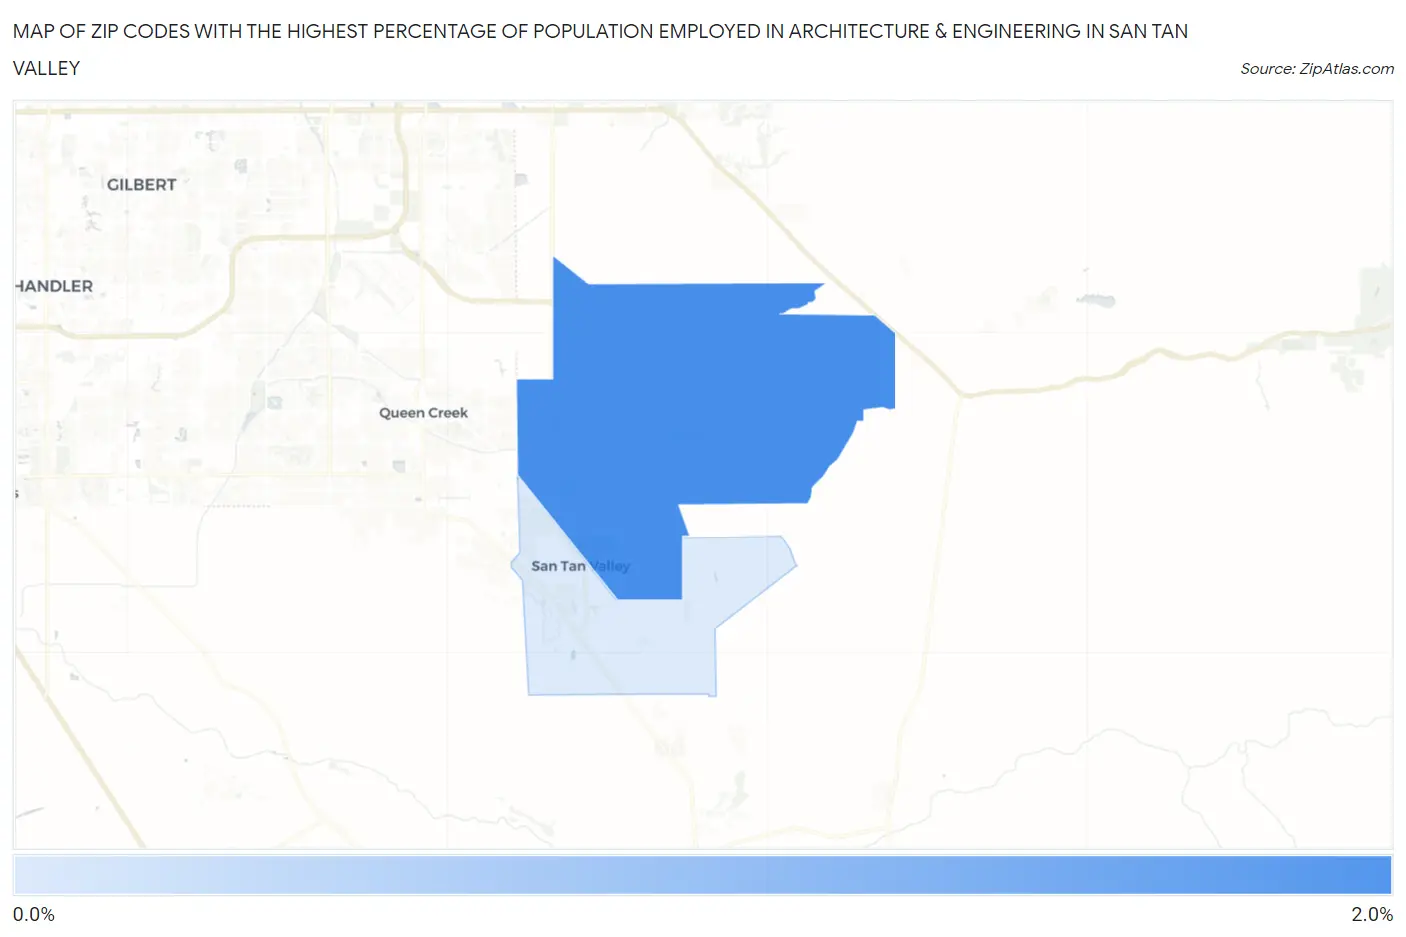
Map of Zip Codes with the Highest Percentage of Population Employed in Architecture & Engineering in San Tan Valley
0.0%
2.0%
Zip Codes with the Highest Percentage of Population Employed in Architecture & Engineering in San Tan Valley, AZ
| Zip Code | % Employed | vs State | vs National | |
| 1. | 85140 | 1.7% | 2.4%(-0.718)#174 | 2.1%(-0.475)#11,668 |
| 2. | 85143 | 0.93% | 2.4%(-1.46)#233 | 2.1%(-1.22)#17,095 |
1
Common Questions
What are the Top Zip Codes with the Highest Percentage of Population Employed in Architecture & Engineering in San Tan Valley, AZ?
Top Zip Codes with the Highest Percentage of Population Employed in Architecture & Engineering in San Tan Valley, AZ are:
What zip code has the Highest Percentage of Population Employed in Architecture & Engineering in San Tan Valley, AZ?
85140 has the Highest Percentage of Population Employed in Architecture & Engineering in San Tan Valley, AZ with 1.7%.
What is the Percentage of Population Employed in Architecture & Engineering in San Tan Valley, AZ?
Percentage of Population Employed in Architecture & Engineering in San Tan Valley is 1.4%.
What is the Percentage of Population Employed in Architecture & Engineering in Arizona?
Percentage of Population Employed in Architecture & Engineering in Arizona is 2.4%.
What is the Percentage of Population Employed in Architecture & Engineering in the United States?
Percentage of Population Employed in Architecture & Engineering in the United States is 2.1%.