San Jose, AZ
San Jose Map
San Jose Overview
614
TOTAL POPULATION
279
MALE POPULATION
335
FEMALE POPULATION
83.28
MALES / 100 FEMALES
120.07
FEMALES / 100 MALES
35.5
MEDIAN AGE
3.7
AVG FAMILY SIZE
3.1
AVG HOUSEHOLD SIZE
$25,860
PER CAPITA INCOME
$72,143
AVG FAMILY INCOME
$58,295
AVG HOUSEHOLD INCOME
77.5%
WAGE / INCOME GAP [ % ]
22.5¢/ $1
WAGE / INCOME GAP [ $ ]
0.39
INEQUALITY / GINI INDEX
240
LABOR FORCE [ PEOPLE ]
52.9%
PERCENT IN LABOR FORCE
2.1%
UNEMPLOYMENT RATE
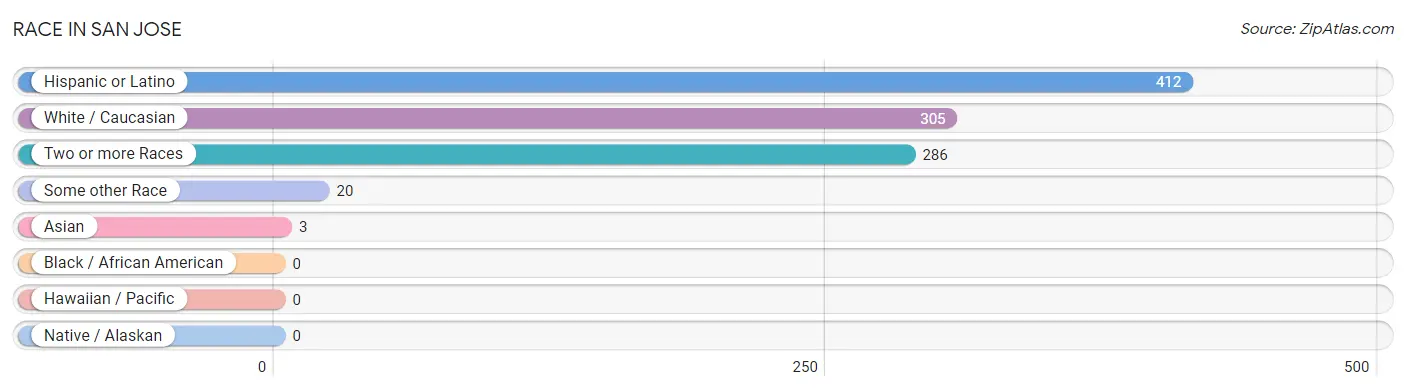
Race in San Jose
The most populous races in San Jose are Hispanic or Latino (412 | 67.1%), White / Caucasian (305 | 49.7%), and Two or more Races (286 | 46.6%).
| Race | # Population | % Population |
| Asian | 3 | 0.5% |
| Black / African American | 0 | 0.0% |
| Hawaiian / Pacific | 0 | 0.0% |
| Hispanic or Latino | 412 | 67.1% |
| Native / Alaskan | 0 | 0.0% |
| White / Caucasian | 305 | 49.7% |
| Two or more Races | 286 | 46.6% |
| Some other Race | 20 | 3.3% |
| Total | 614 | 100.0% |
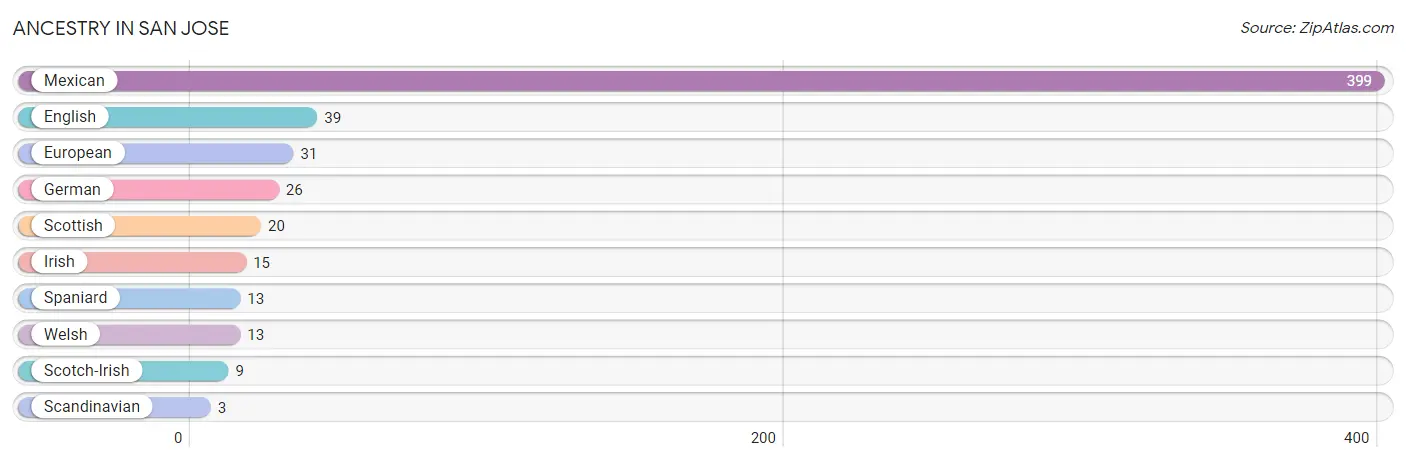
Ancestry in San Jose
The most populous ancestries reported in San Jose are Mexican (399 | 65.0%), English (39 | 6.4%), European (31 | 5.1%), German (26 | 4.2%), and Scottish (20 | 3.3%), together accounting for 83.9% of all San Jose residents.
| Ancestry | # Population | % Population |
| English | 39 | 6.4% |
| European | 31 | 5.1% |
| German | 26 | 4.2% |
| Irish | 15 | 2.4% |
| Mexican | 399 | 65.0% |
| Scandinavian | 3 | 0.5% |
| Scotch-Irish | 9 | 1.5% |
| Scottish | 20 | 3.3% |
| Spaniard | 13 | 2.1% |
| Welsh | 13 | 2.1% | View All 10 Rows |
Immigrants in San Jose

| Immigration Origin | # Population | % Population | View All 0 Rows |
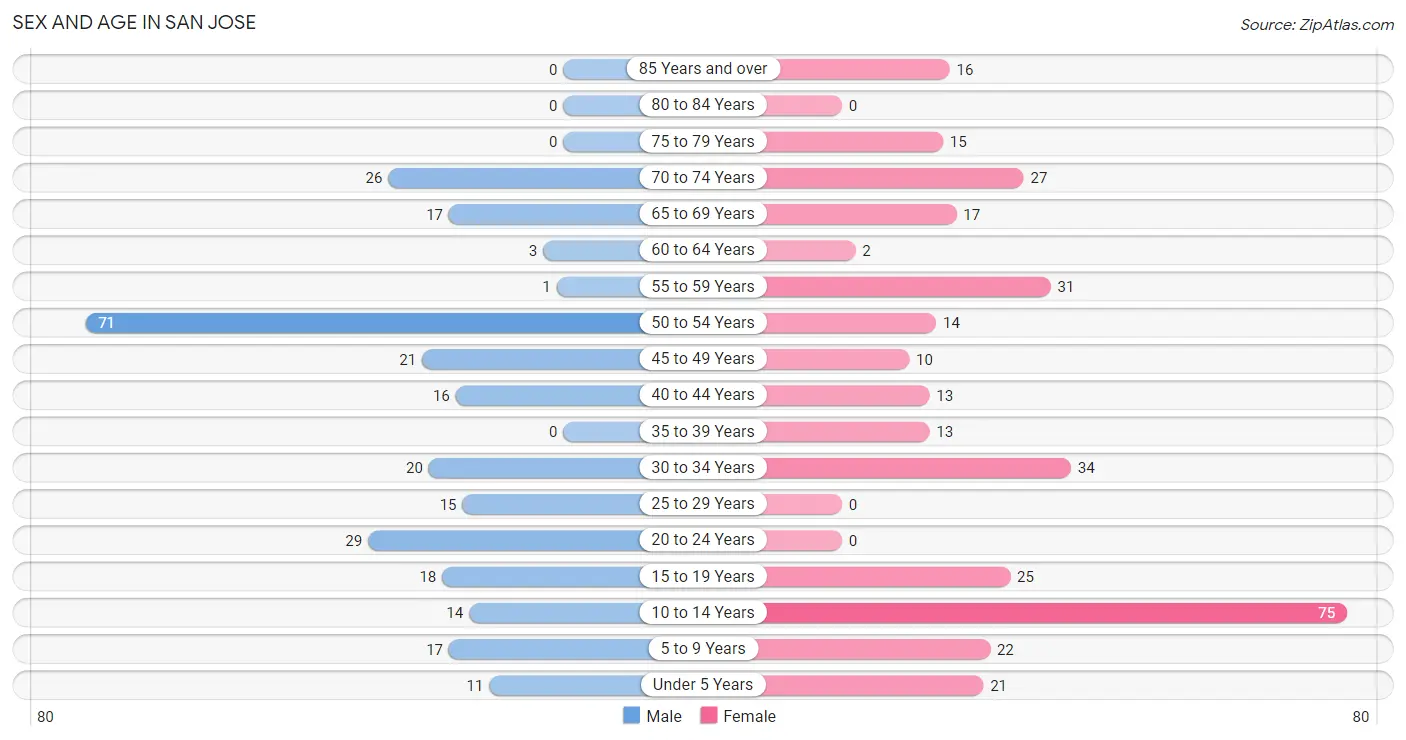
Sex and Age in San Jose
Sex and Age in San Jose
The most populous age groups in San Jose are 50 to 54 Years (71 | 25.5%) for men and 10 to 14 Years (75 | 22.4%) for women.
| Age Bracket | Male | Female |
| Under 5 Years | 11 (3.9%) | 21 (6.3%) |
| 5 to 9 Years | 17 (6.1%) | 22 (6.6%) |
| 10 to 14 Years | 14 (5.0%) | 75 (22.4%) |
| 15 to 19 Years | 18 (6.5%) | 25 (7.5%) |
| 20 to 24 Years | 29 (10.4%) | 0 (0.0%) |
| 25 to 29 Years | 15 (5.4%) | 0 (0.0%) |
| 30 to 34 Years | 20 (7.2%) | 34 (10.2%) |
| 35 to 39 Years | 0 (0.0%) | 13 (3.9%) |
| 40 to 44 Years | 16 (5.7%) | 13 (3.9%) |
| 45 to 49 Years | 21 (7.5%) | 10 (3.0%) |
| 50 to 54 Years | 71 (25.5%) | 14 (4.2%) |
| 55 to 59 Years | 1 (0.4%) | 31 (9.2%) |
| 60 to 64 Years | 3 (1.1%) | 2 (0.6%) |
| 65 to 69 Years | 17 (6.1%) | 17 (5.1%) |
| 70 to 74 Years | 26 (9.3%) | 27 (8.1%) |
| 75 to 79 Years | 0 (0.0%) | 15 (4.5%) |
| 80 to 84 Years | 0 (0.0%) | 0 (0.0%) |
| 85 Years and over | 0 (0.0%) | 16 (4.8%) |
| Total | 279 (100.0%) | 335 (100.0%) |
Families and Households in San Jose
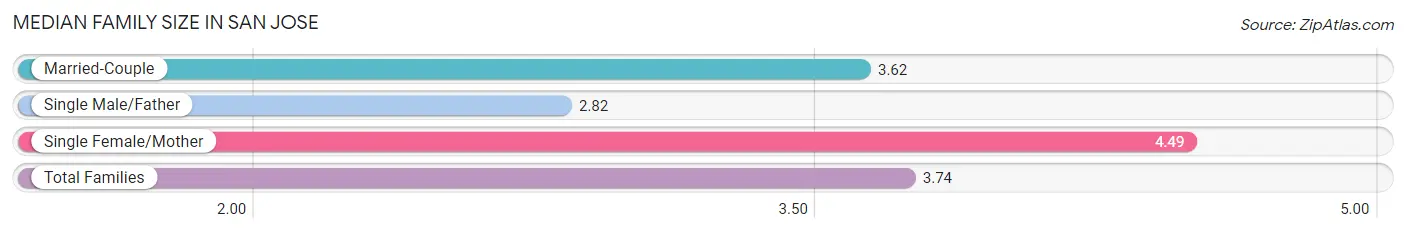
Median Family Size in San Jose
The median family size in San Jose is 3.74 persons per family, with single female/mother families (41 | 27.3%) accounting for the largest median family size of 4.49 persons per family. On the other hand, single male/father families (22 | 14.7%) represent the smallest median family size with 2.82 persons per family.
| Family Type | # Families | Family Size |
| Married-Couple | 87 (58.0%) | 3.62 |
| Single Male/Father | 22 (14.7%) | 2.82 |
| Single Female/Mother | 41 (27.3%) | 4.49 |
| Total Families | 150 (100.0%) | 3.74 |
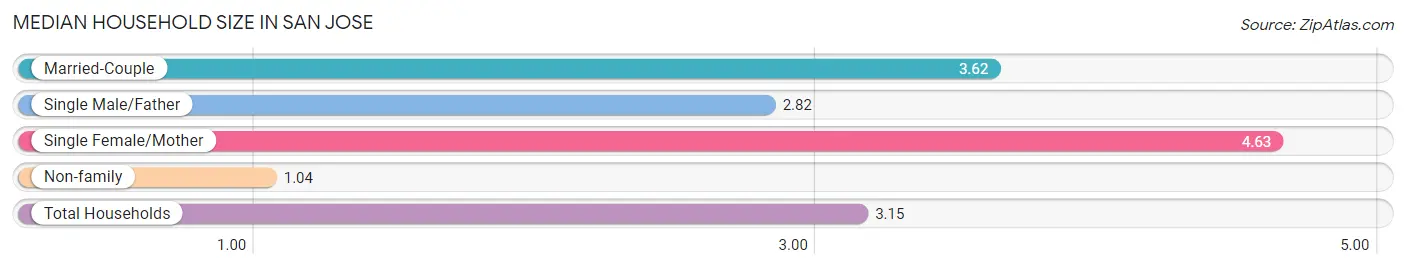
Median Household Size in San Jose
The median household size in San Jose is 3.15 persons per household, with single female/mother households (41 | 21.0%) accounting for the largest median household size of 4.63 persons per household. non-family households (45 | 23.1%) represent the smallest median household size with 1.04 persons per household.
| Household Type | # Households | Household Size |
| Married-Couple | 87 (44.6%) | 3.62 |
| Single Male/Father | 22 (11.3%) | 2.82 |
| Single Female/Mother | 41 (21.0%) | 4.63 |
| Non-family | 45 (23.1%) | 1.04 |
| Total Households | 195 (100.0%) | 3.15 |
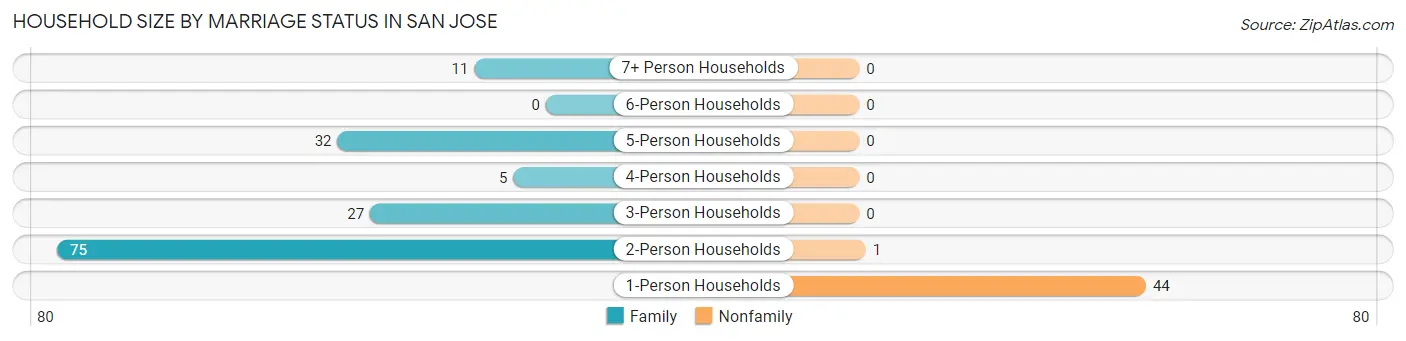
Household Size by Marriage Status in San Jose
Out of a total of 195 households in San Jose, 150 (76.9%) are family households, while 45 (23.1%) are nonfamily households. The most numerous type of family households are 2-person households, comprising 75, and the most common type of nonfamily households are 1-person households, comprising 44.
| Household Size | Family Households | Nonfamily Households |
| 1-Person Households | - | 44 (22.6%) |
| 2-Person Households | 75 (38.5%) | 1 (0.5%) |
| 3-Person Households | 27 (13.9%) | 0 (0.0%) |
| 4-Person Households | 5 (2.6%) | 0 (0.0%) |
| 5-Person Households | 32 (16.4%) | 0 (0.0%) |
| 6-Person Households | 0 (0.0%) | 0 (0.0%) |
| 7+ Person Households | 11 (5.6%) | 0 (0.0%) |
| Total | 150 (76.9%) | 45 (23.1%) |
Female Fertility in San Jose
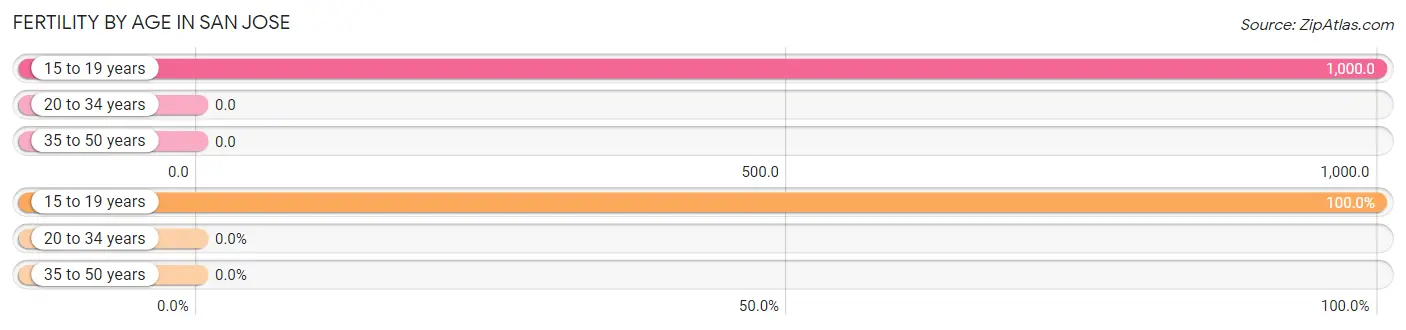
Fertility by Age in San Jose
Average fertility rate in San Jose is 263.0 births per 1,000 women. Women in the age bracket of 15 to 19 years have the highest fertility rate with 1,000.0 births per 1,000 women. Women in the age bracket of 15 to 19 years acount for 100.0% of all women with births.
| Age Bracket | Women with Births | Births / 1,000 Women |
| 15 to 19 years | 25 (100.0%) | 1,000.0 |
| 20 to 34 years | 0 (0.0%) | 0.0 |
| 35 to 50 years | 0 (0.0%) | 0.0 |
| Total | 25 (100.0%) | 263.0 |
Fertility by Age by Marriage Status in San Jose
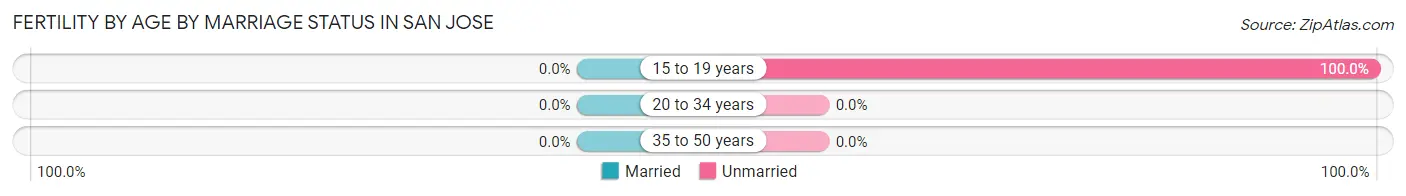
| Age Bracket | Married | Unmarried |
| 15 to 19 years | 0 (0.0%) | 25 (100.0%) |
| 20 to 34 years | 0 (0.0%) | 0 (0.0%) |
| 35 to 50 years | 0 (0.0%) | 0 (0.0%) |
| Total | 0 (0.0%) | 25 (100.0%) |
Fertility by Education in San Jose
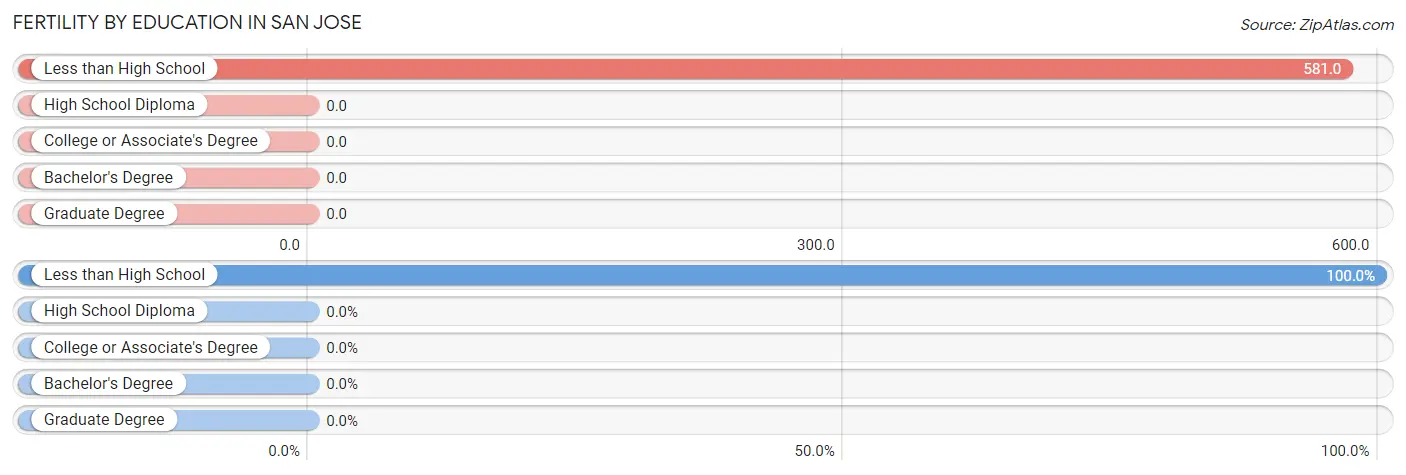
| Educational Attainment | Women with Births | Births / 1,000 Women |
| Less than High School | 25 (100.0%) | 581.0 |
| High School Diploma | 0 (0.0%) | 0.0 |
| College or Associate's Degree | 0 (0.0%) | 0.0 |
| Bachelor's Degree | 0 (0.0%) | 0.0 |
| Graduate Degree | 0 (0.0%) | 0.0 |
| Total | 25 (100.0%) | 263.0 |
Fertility by Education by Marriage Status in San Jose
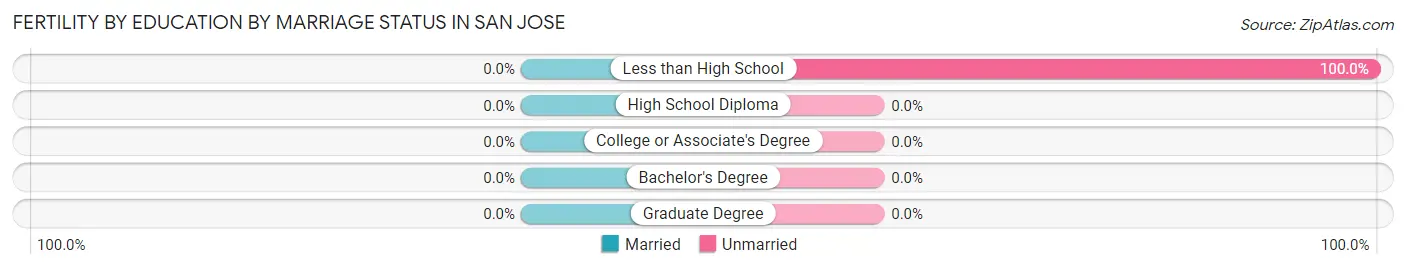
| Educational Attainment | Married | Unmarried |
| Less than High School | 0 (0.0%) | 25 (100.0%) |
| High School Diploma | 0 (0.0%) | 0 (0.0%) |
| College or Associate's Degree | 0 (0.0%) | 0 (0.0%) |
| Bachelor's Degree | 0 (0.0%) | 0 (0.0%) |
| Graduate Degree | 0 (0.0%) | 0 (0.0%) |
| Total | 0 (0.0%) | 25 (100.0%) |
Income in San Jose
Income Overview in San Jose
Per Capita Income in San Jose is $25,860, while median incomes of families and households are $72,143 and $58,295 respectively.
| Characteristic | Number | Measure |
| Per Capita Income | 614 | $25,860 |
| Median Family Income | 150 | $72,143 |
| Mean Family Income | 150 | $84,236 |
| Median Household Income | 195 | $58,295 |
| Mean Household Income | 195 | $72,822 |
| Income Deficit | 150 | $0 |
| Wage / Income Gap (%) | 614 | 77.52% |
| Wage / Income Gap ($) | 614 | 22.48¢ per $1 |
| Gini / Inequality Index | 614 | 0.39 |
Earnings by Sex in San Jose
Average Earnings in San Jose are $42,540, $50,474 for men and $11,346 for women, a difference of 77.5%.
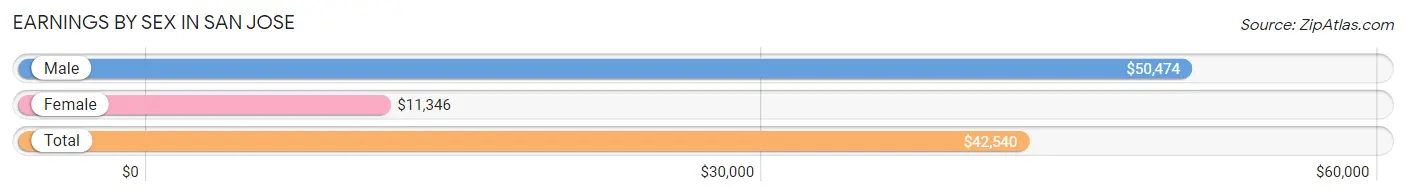
| Sex | Number | Average Earnings |
| Male | 187 (65.2%) | $50,474 |
| Female | 100 (34.8%) | $11,346 |
| Total | 287 (100.0%) | $42,540 |
Earnings by Sex by Income Bracket in San Jose
The most common earnings brackets in San Jose are $75,000 to $99,999 for men (52 | 27.8%) and $2,499 or less for women (25 | 25.0%).
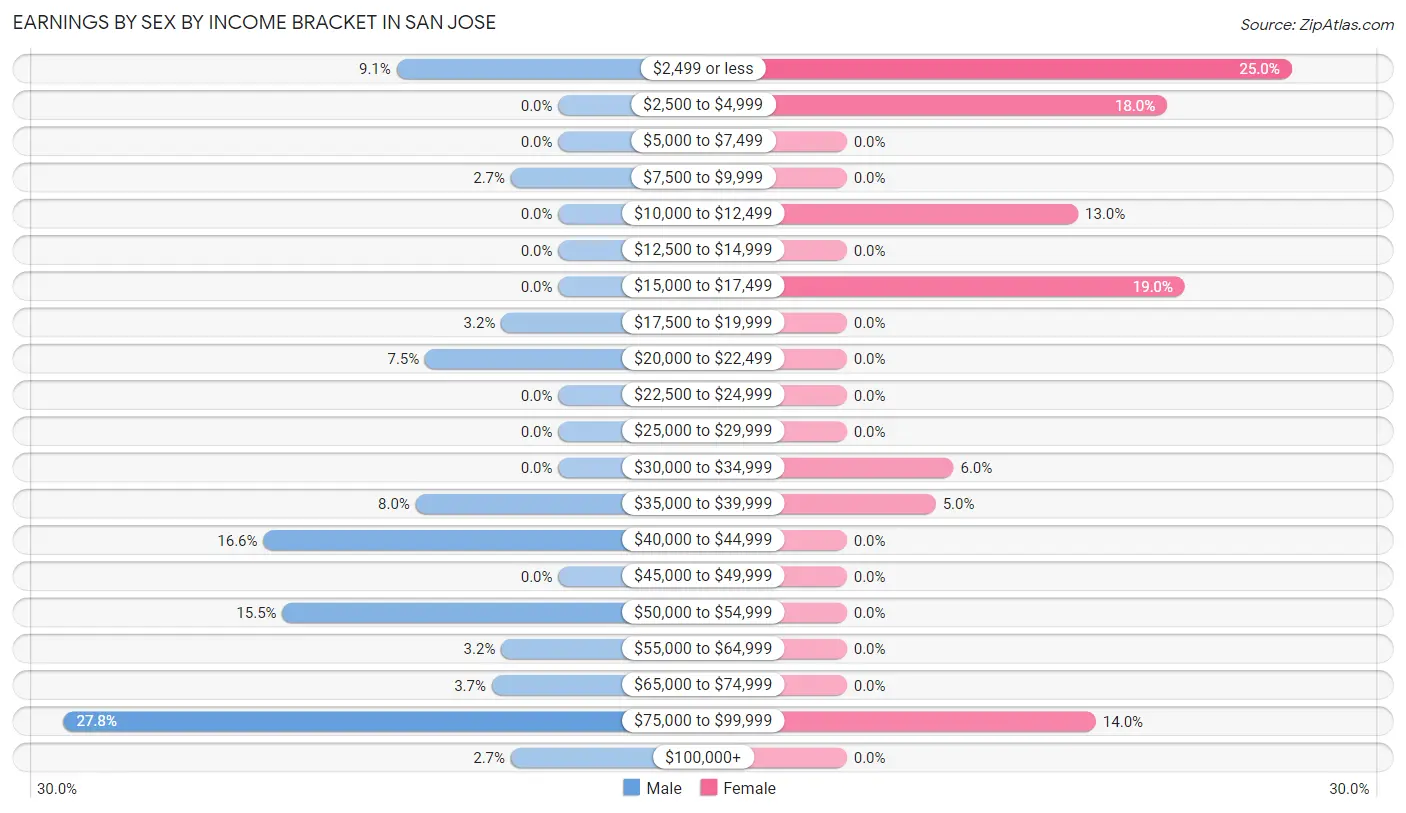
| Income | Male | Female |
| $2,499 or less | 17 (9.1%) | 25 (25.0%) |
| $2,500 to $4,999 | 0 (0.0%) | 18 (18.0%) |
| $5,000 to $7,499 | 0 (0.0%) | 0 (0.0%) |
| $7,500 to $9,999 | 5 (2.7%) | 0 (0.0%) |
| $10,000 to $12,499 | 0 (0.0%) | 13 (13.0%) |
| $12,500 to $14,999 | 0 (0.0%) | 0 (0.0%) |
| $15,000 to $17,499 | 0 (0.0%) | 19 (19.0%) |
| $17,500 to $19,999 | 6 (3.2%) | 0 (0.0%) |
| $20,000 to $22,499 | 14 (7.5%) | 0 (0.0%) |
| $22,500 to $24,999 | 0 (0.0%) | 0 (0.0%) |
| $25,000 to $29,999 | 0 (0.0%) | 0 (0.0%) |
| $30,000 to $34,999 | 0 (0.0%) | 6 (6.0%) |
| $35,000 to $39,999 | 15 (8.0%) | 5 (5.0%) |
| $40,000 to $44,999 | 31 (16.6%) | 0 (0.0%) |
| $45,000 to $49,999 | 0 (0.0%) | 0 (0.0%) |
| $50,000 to $54,999 | 29 (15.5%) | 0 (0.0%) |
| $55,000 to $64,999 | 6 (3.2%) | 0 (0.0%) |
| $65,000 to $74,999 | 7 (3.7%) | 0 (0.0%) |
| $75,000 to $99,999 | 52 (27.8%) | 14 (14.0%) |
| $100,000+ | 5 (2.7%) | 0 (0.0%) |
| Total | 187 (100.0%) | 100 (100.0%) |
Earnings by Sex by Educational Attainment in San Jose
| Educational Attainment | Male Income | Female Income |
| Less than High School | - | - |
| High School Diploma | - | - |
| College or Associate's Degree | - | - |
| Bachelor's Degree | - | - |
| Graduate Degree | - | - |
| Total | $44,274 | $0 |
Family Income in San Jose
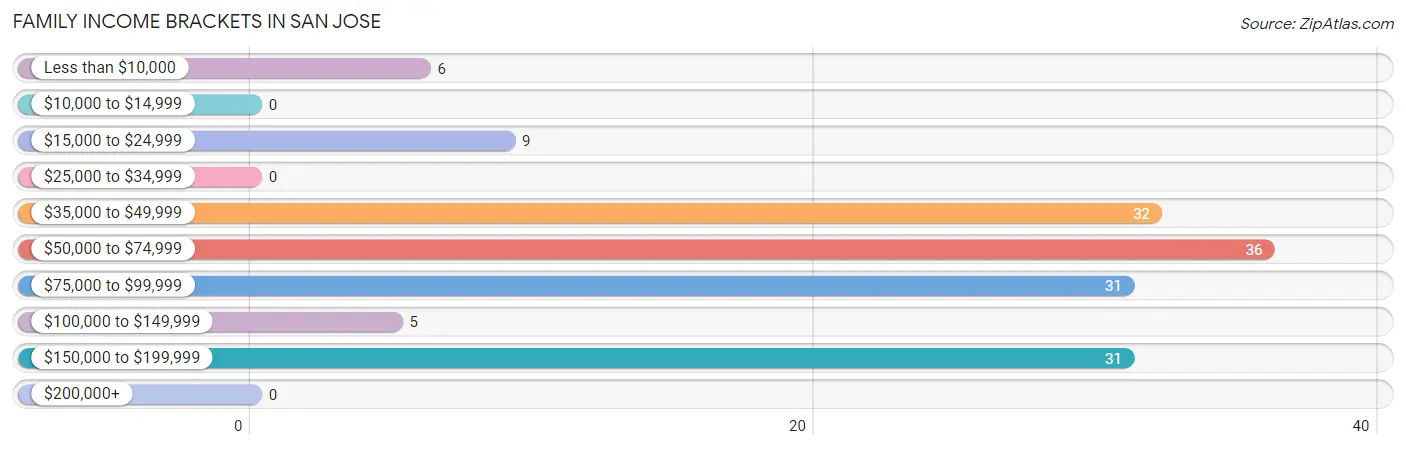
Family Income Brackets in San Jose
According to the San Jose family income data, there are 36 families falling into the $50,000 to $74,999 income range, which is the most common income bracket and makes up 24.0% of all families.
| Income Bracket | # Families | % Families |
| Less than $10,000 | 6 | 4.0% |
| $10,000 to $14,999 | 0 | 0.0% |
| $15,000 to $24,999 | 9 | 6.0% |
| $25,000 to $34,999 | 0 | 0.0% |
| $35,000 to $49,999 | 32 | 21.3% |
| $50,000 to $74,999 | 36 | 24.0% |
| $75,000 to $99,999 | 31 | 20.7% |
| $100,000 to $149,999 | 5 | 3.3% |
| $150,000 to $199,999 | 31 | 20.7% |
| $200,000+ | 0 | 0.0% |
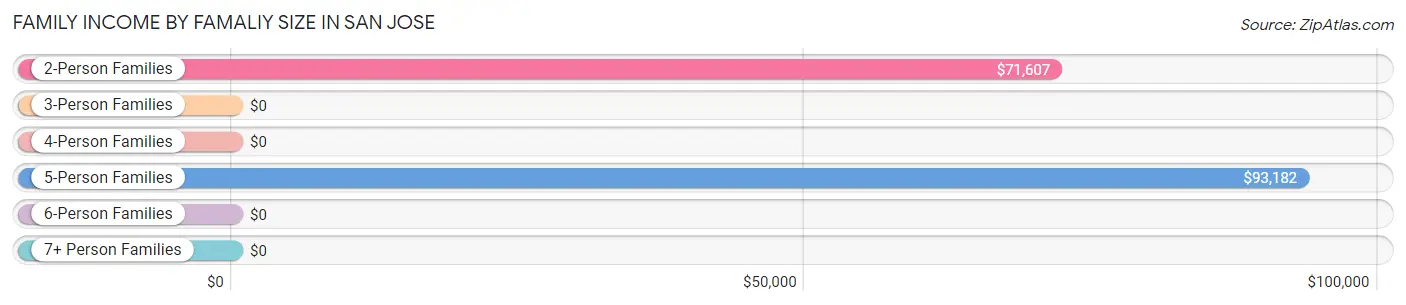
Family Income by Famaliy Size in San Jose
5-person families (26 | 17.3%) account for the highest median family income in San Jose with $93,182 per family, while 2-person families (75 | 50.0%) have the highest median income of $35,804 per family member.
| Income Bracket | # Families | Median Income |
| 2-Person Families | 75 (50.0%) | $71,607 |
| 3-Person Families | 27 (18.0%) | $0 |
| 4-Person Families | 11 (7.3%) | $0 |
| 5-Person Families | 26 (17.3%) | $93,182 |
| 6-Person Families | 0 (0.0%) | $0 |
| 7+ Person Families | 11 (7.3%) | $0 |
| Total | 150 (100.0%) | $72,143 |
Family Income by Number of Earners in San Jose
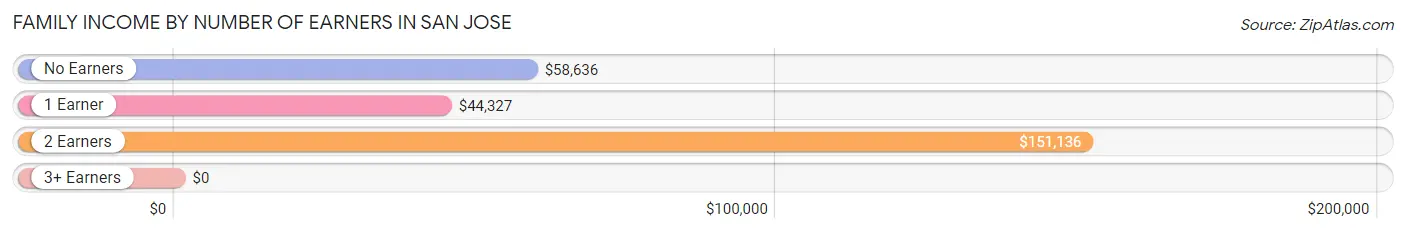
| Number of Earners | # Families | Median Income |
| No Earners | 22 (14.7%) | $58,636 |
| 1 Earner | 65 (43.3%) | $44,327 |
| 2 Earners | 52 (34.7%) | $151,136 |
| 3+ Earners | 11 (7.3%) | $0 |
| Total | 150 (100.0%) | $72,143 |
Household Income in San Jose
Household Income Brackets in San Jose
With 42 households falling in the category, the $50,000 to $74,999 income range is the most frequent in San Jose, accounting for 21.5% of all households.
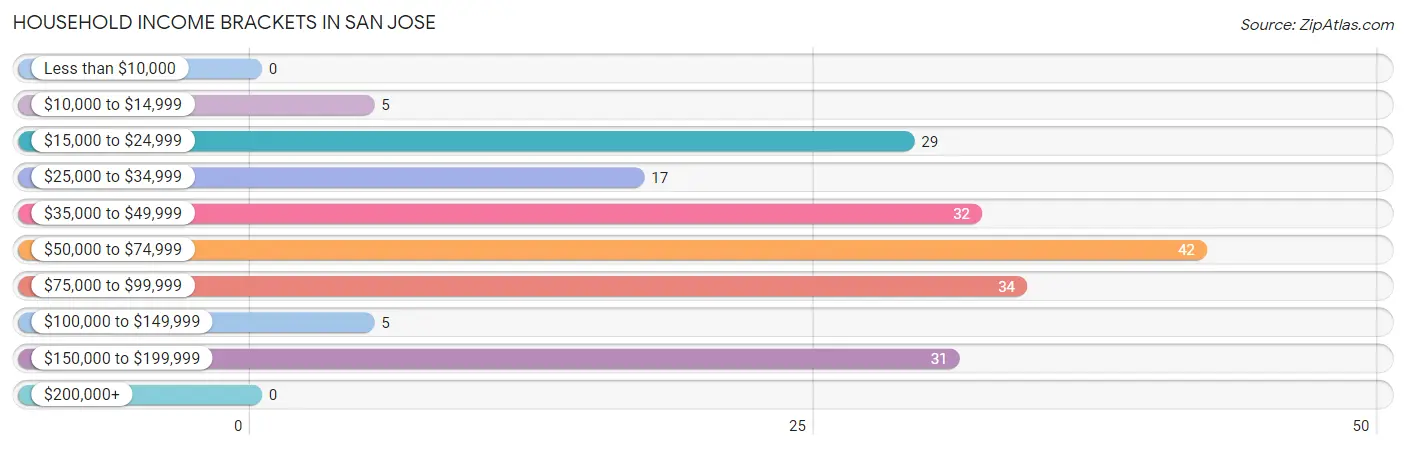
| Income Bracket | # Households | % Households |
| Less than $10,000 | 0 | 0.0% |
| $10,000 to $14,999 | 5 | 2.6% |
| $15,000 to $24,999 | 29 | 14.9% |
| $25,000 to $34,999 | 17 | 8.7% |
| $35,000 to $49,999 | 32 | 16.4% |
| $50,000 to $74,999 | 42 | 21.5% |
| $75,000 to $99,999 | 34 | 17.4% |
| $100,000 to $149,999 | 5 | 2.6% |
| $150,000 to $199,999 | 31 | 15.9% |
| $200,000+ | 0 | 0.0% |
Household Income by Householder Age in San Jose
The median household income in San Jose is $58,295, with the highest median household income of $57,614 found in the 65+ years age bracket for the primary householder. A total of 97 households (49.7%) fall into this category.
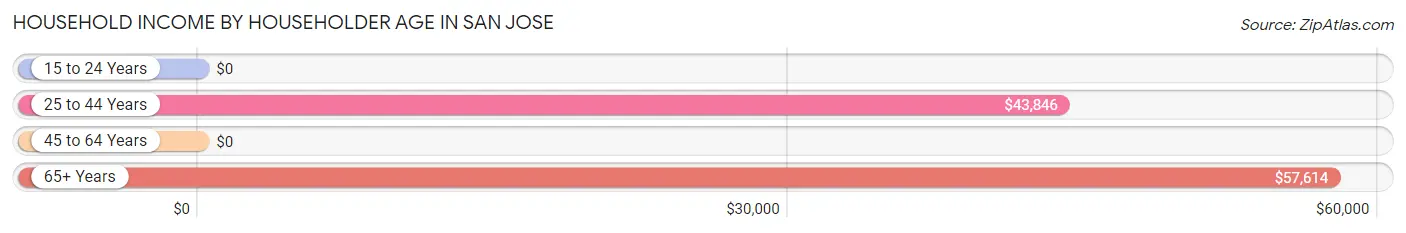
| Income Bracket | # Households | Median Income |
| 15 to 24 Years | 0 (0.0%) | $0 |
| 25 to 44 Years | 34 (17.4%) | $43,846 |
| 45 to 64 Years | 64 (32.8%) | $0 |
| 65+ Years | 97 (49.7%) | $57,614 |
| Total | 195 (100.0%) | $58,295 |
Poverty in San Jose
Income Below Poverty by Sex and Age in San Jose
With 1.8% poverty level for males and 5.1% for females among the residents of San Jose, 6 to 11 year old males and under 5 year old females are the most vulnerable to poverty, with 5 males (29.4%) and 5 females (23.8%) in their respective age groups living below the poverty level.
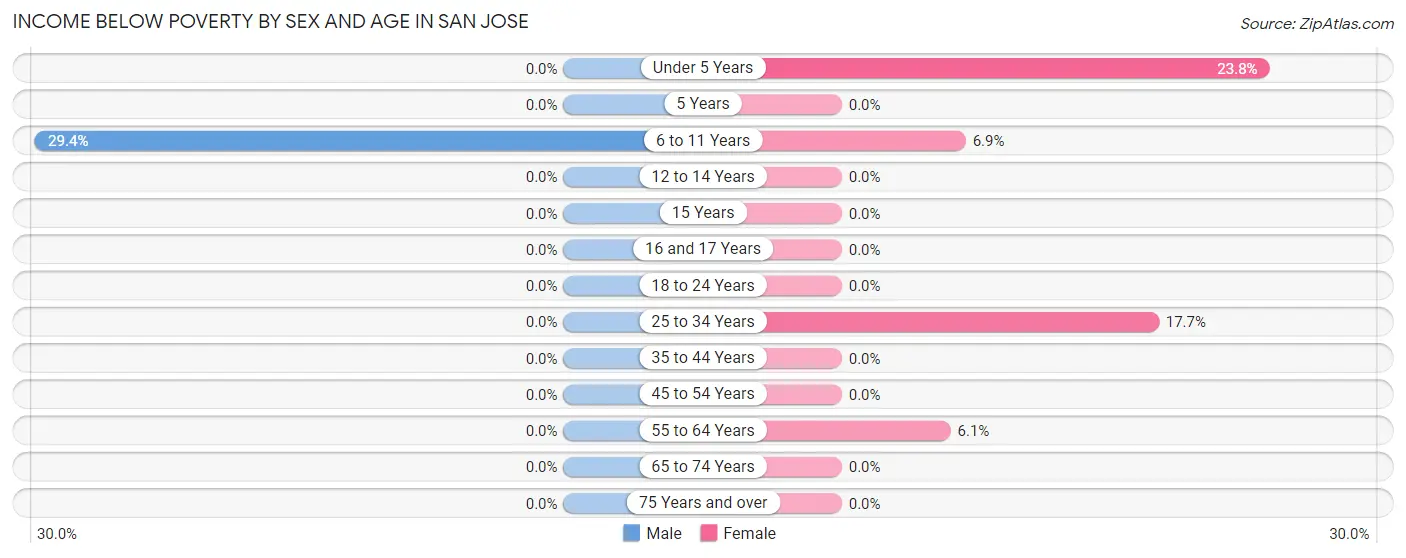
| Age Bracket | Male | Female |
| Under 5 Years | 0 (0.0%) | 5 (23.8%) |
| 5 Years | 0 (0.0%) | 0 (0.0%) |
| 6 to 11 Years | 5 (29.4%) | 4 (6.9%) |
| 12 to 14 Years | 0 (0.0%) | 0 (0.0%) |
| 15 Years | 0 (0.0%) | 0 (0.0%) |
| 16 and 17 Years | 0 (0.0%) | 0 (0.0%) |
| 18 to 24 Years | 0 (0.0%) | 0 (0.0%) |
| 25 to 34 Years | 0 (0.0%) | 6 (17.6%) |
| 35 to 44 Years | 0 (0.0%) | 0 (0.0%) |
| 45 to 54 Years | 0 (0.0%) | 0 (0.0%) |
| 55 to 64 Years | 0 (0.0%) | 2 (6.1%) |
| 65 to 74 Years | 0 (0.0%) | 0 (0.0%) |
| 75 Years and over | 0 (0.0%) | 0 (0.0%) |
| Total | 5 (1.8%) | 17 (5.1%) |
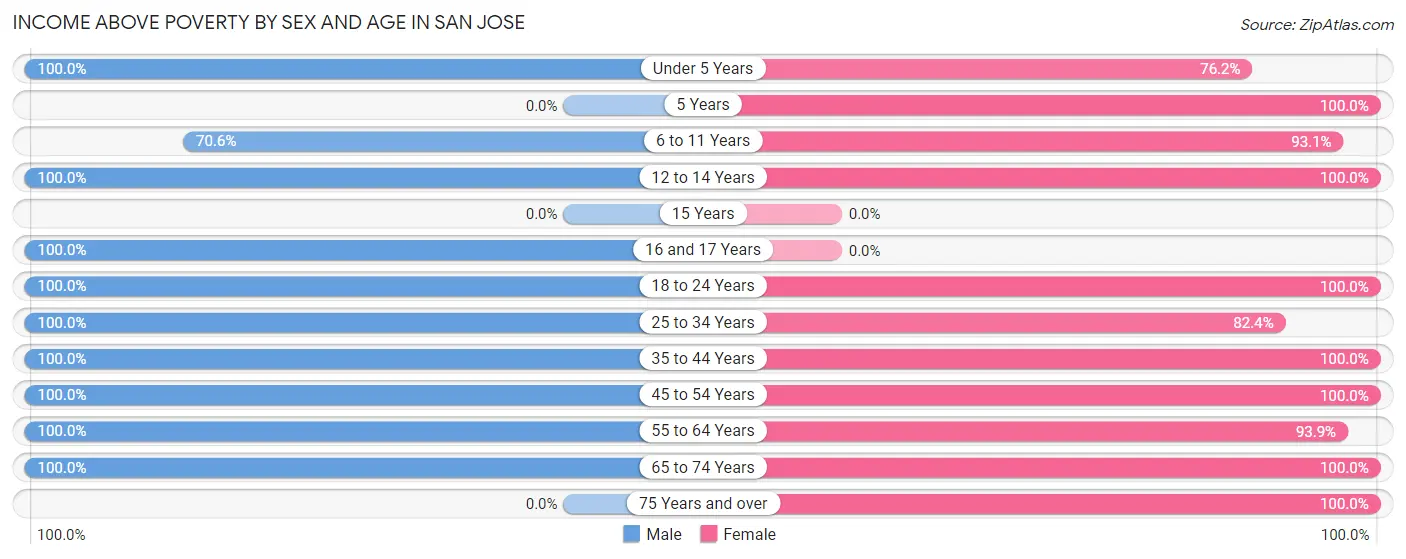
Income Above Poverty by Sex and Age in San Jose
According to the poverty statistics in San Jose, males aged under 5 years and females aged 5 years are the age groups that are most secure financially, with 100.0% of males and 100.0% of females in these age groups living above the poverty line.
| Age Bracket | Male | Female |
| Under 5 Years | 11 (100.0%) | 16 (76.2%) |
| 5 Years | 0 (0.0%) | 12 (100.0%) |
| 6 to 11 Years | 12 (70.6%) | 54 (93.1%) |
| 12 to 14 Years | 14 (100.0%) | 27 (100.0%) |
| 15 Years | 0 (0.0%) | 0 (0.0%) |
| 16 and 17 Years | 18 (100.0%) | 0 (0.0%) |
| 18 to 24 Years | 29 (100.0%) | 25 (100.0%) |
| 25 to 34 Years | 35 (100.0%) | 28 (82.4%) |
| 35 to 44 Years | 16 (100.0%) | 26 (100.0%) |
| 45 to 54 Years | 92 (100.0%) | 24 (100.0%) |
| 55 to 64 Years | 4 (100.0%) | 31 (93.9%) |
| 65 to 74 Years | 43 (100.0%) | 44 (100.0%) |
| 75 Years and over | 0 (0.0%) | 31 (100.0%) |
| Total | 274 (98.2%) | 318 (94.9%) |
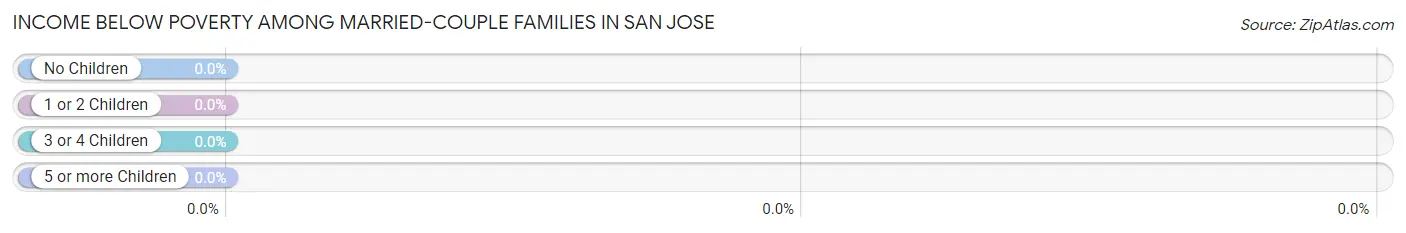
Income Below Poverty Among Married-Couple Families in San Jose
| Children | Above Poverty | Below Poverty |
| No Children | 54 (100.0%) | 0 (0.0%) |
| 1 or 2 Children | 18 (100.0%) | 0 (0.0%) |
| 3 or 4 Children | 15 (100.0%) | 0 (0.0%) |
| 5 or more Children | 0 (0.0%) | 0 (0.0%) |
| Total | 87 (100.0%) | 0 (0.0%) |
Income Below Poverty Among Single-Parent Households in San Jose
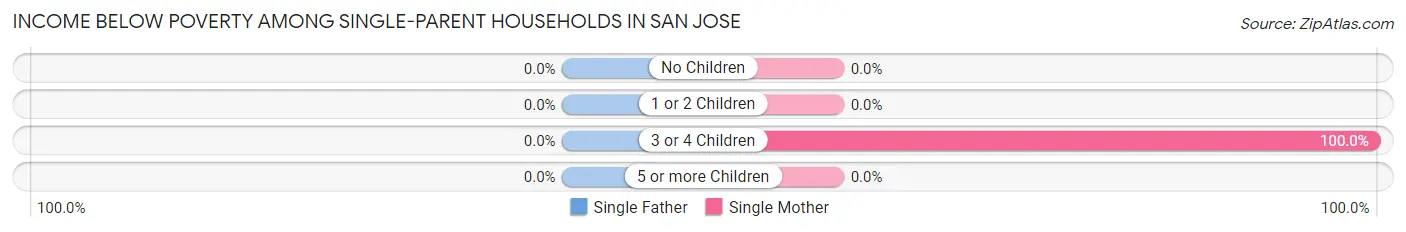
| Children | Single Father | Single Mother |
| No Children | 0 (0.0%) | 0 (0.0%) |
| 1 or 2 Children | 0 (0.0%) | 0 (0.0%) |
| 3 or 4 Children | 0 (0.0%) | 6 (100.0%) |
| 5 or more Children | 0 (0.0%) | 0 (0.0%) |
| Total | 0 (0.0%) | 6 (14.6%) |
Income Below Poverty Among Married-Couple vs Single-Parent Households in San Jose
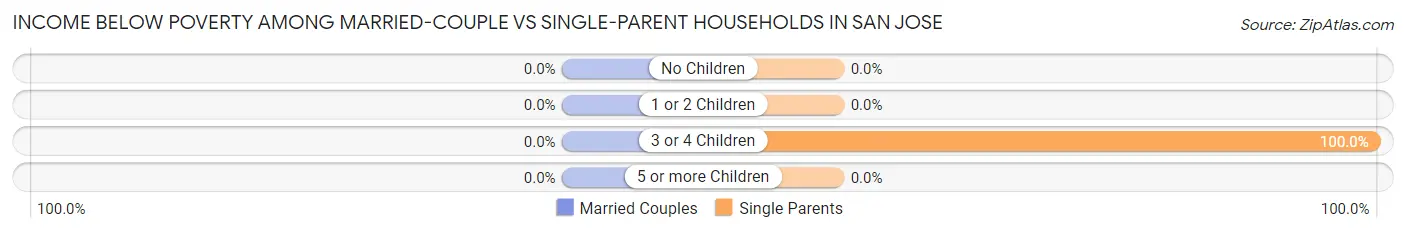
| Children | Married-Couple Families | Single-Parent Households |
| No Children | 0 (0.0%) | 0 (0.0%) |
| 1 or 2 Children | 0 (0.0%) | 0 (0.0%) |
| 3 or 4 Children | 0 (0.0%) | 6 (100.0%) |
| 5 or more Children | 0 (0.0%) | 0 (0.0%) |
| Total | 0 (0.0%) | 6 (9.5%) |
Employment Characteristics in San Jose
Employment by Class of Employer in San Jose
Among the 235 employed individuals in San Jose, private company employees (148 | 63.0%), not-for-profit organizations (38 | 16.2%), and self-employed (not incorporated) (28 | 11.9%) make up the most common classes of employment.
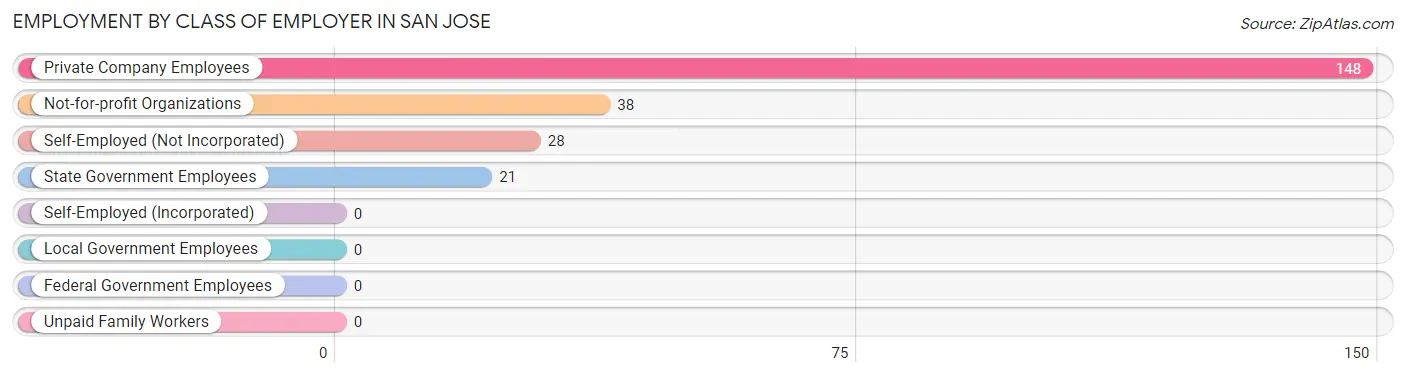
| Employer Class | # Employees | % Employees |
| Private Company Employees | 148 | 63.0% |
| Self-Employed (Incorporated) | 0 | 0.0% |
| Self-Employed (Not Incorporated) | 28 | 11.9% |
| Not-for-profit Organizations | 38 | 16.2% |
| Local Government Employees | 0 | 0.0% |
| State Government Employees | 21 | 8.9% |
| Federal Government Employees | 0 | 0.0% |
| Unpaid Family Workers | 0 | 0.0% |
| Total | 235 | 100.0% |
Employment Status by Age in San Jose
According to the labor force statistics for San Jose, out of the total population over 16 years of age (454), 52.9% or 240 individuals are in the labor force, with 2.1% or 5 of them unemployed. The age group with the highest labor force participation rate is 20 to 24 years, with 100.0% or 29 individuals in the labor force. Within the labor force, the 35 to 44 years age range has the highest percentage of unemployed individuals, with 17.2% or 5 of them being unemployed.
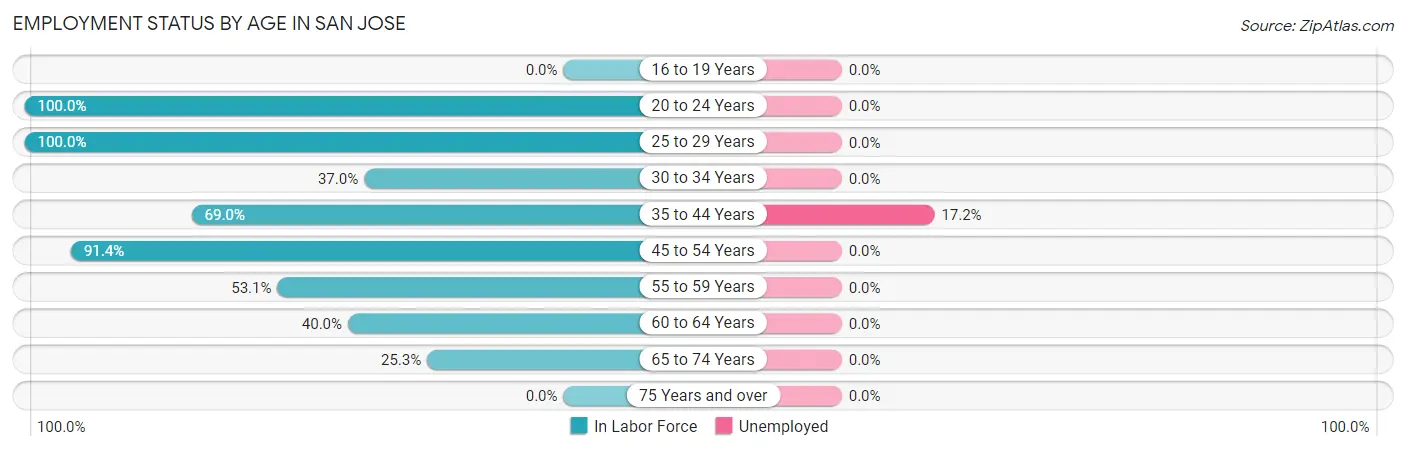
| Age Bracket | In Labor Force | Unemployed |
| 16 to 19 Years | 0 (0.0%) | 0 (0.0%) |
| 20 to 24 Years | 29 (100.0%) | 0 (0.0%) |
| 25 to 29 Years | 15 (100.0%) | 0 (0.0%) |
| 30 to 34 Years | 20 (37.0%) | 0 (0.0%) |
| 35 to 44 Years | 29 (69.0%) | 5 (17.2%) |
| 45 to 54 Years | 106 (91.4%) | 0 (0.0%) |
| 55 to 59 Years | 17 (53.1%) | 0 (0.0%) |
| 60 to 64 Years | 2 (40.0%) | 0 (0.0%) |
| 65 to 74 Years | 22 (25.3%) | 0 (0.0%) |
| 75 Years and over | 0 (0.0%) | 0 (0.0%) |
| Total | 240 (52.9%) | 5 (2.1%) |
Employment Status by Educational Attainment in San Jose
According to labor force statistics for San Jose, 71.6% of individuals (189) out of the total population between 25 and 64 years of age (264) are in the labor force, with 2.6% or 5 of them being unemployed. The group with the highest labor force participation rate are those with the educational attainment of bachelor's degree or higher, with 100.0% or 5 individuals in the labor force. Within the labor force, individuals with college / associate degree education have the highest percentage of unemployment, with 5.2% or 5 of them being unemployed.
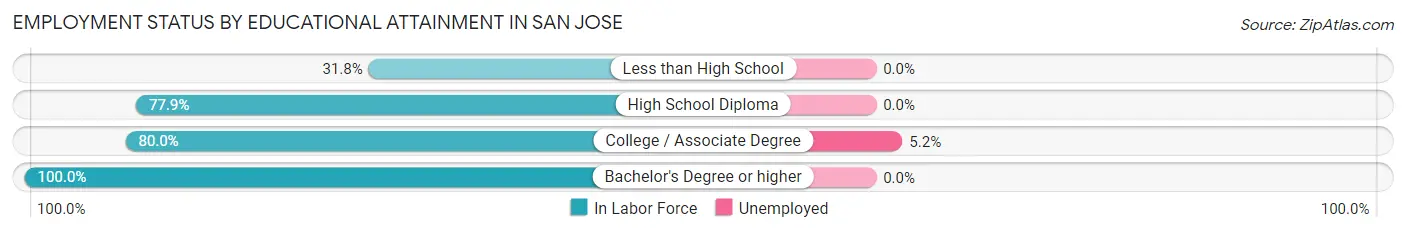
| Educational Attainment | In Labor Force | Unemployed |
| Less than High School | 14 (31.8%) | 0 (0.0%) |
| High School Diploma | 74 (77.9%) | 0 (0.0%) |
| College / Associate Degree | 96 (80.0%) | 6 (5.2%) |
| Bachelor's Degree or higher | 5 (100.0%) | 0 (0.0%) |
| Total | 189 (71.6%) | 7 (2.6%) |
Employment Occupations by Sex in San Jose
Management, Business, Science and Arts Occupations
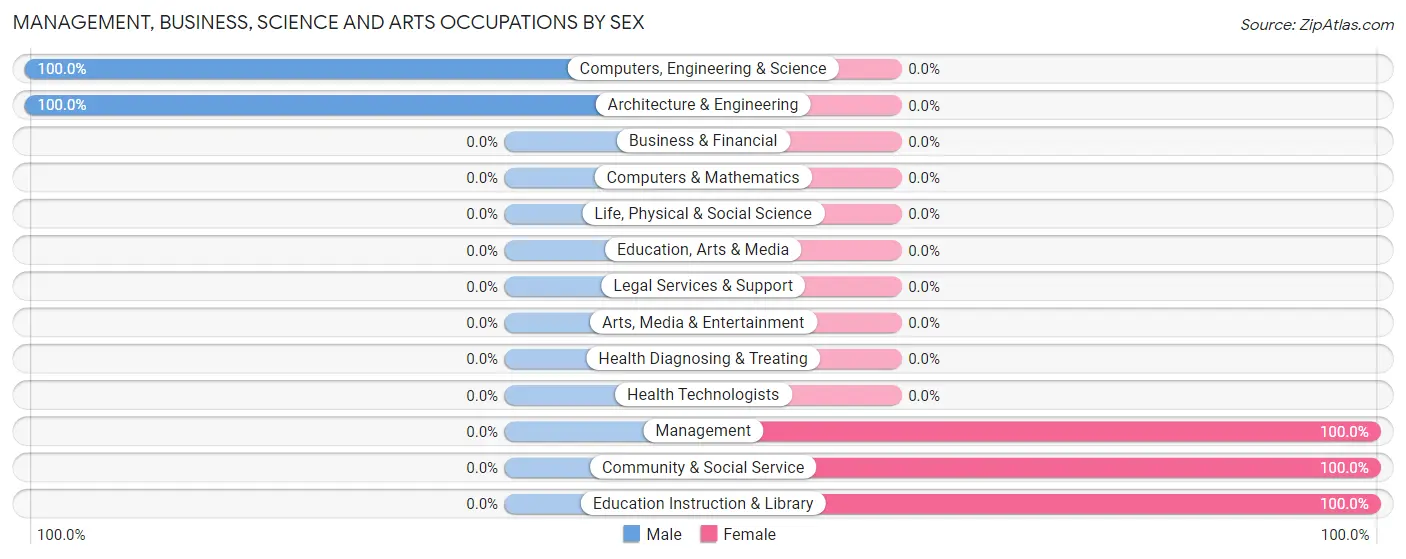
The most common Management, Business, Science and Arts occupations in San Jose are Computers, Engineering & Science (20 | 8.5%), Architecture & Engineering (20 | 8.5%), Management (11 | 4.7%), Community & Social Service (5 | 2.1%), and Education Instruction & Library (5 | 2.1%).
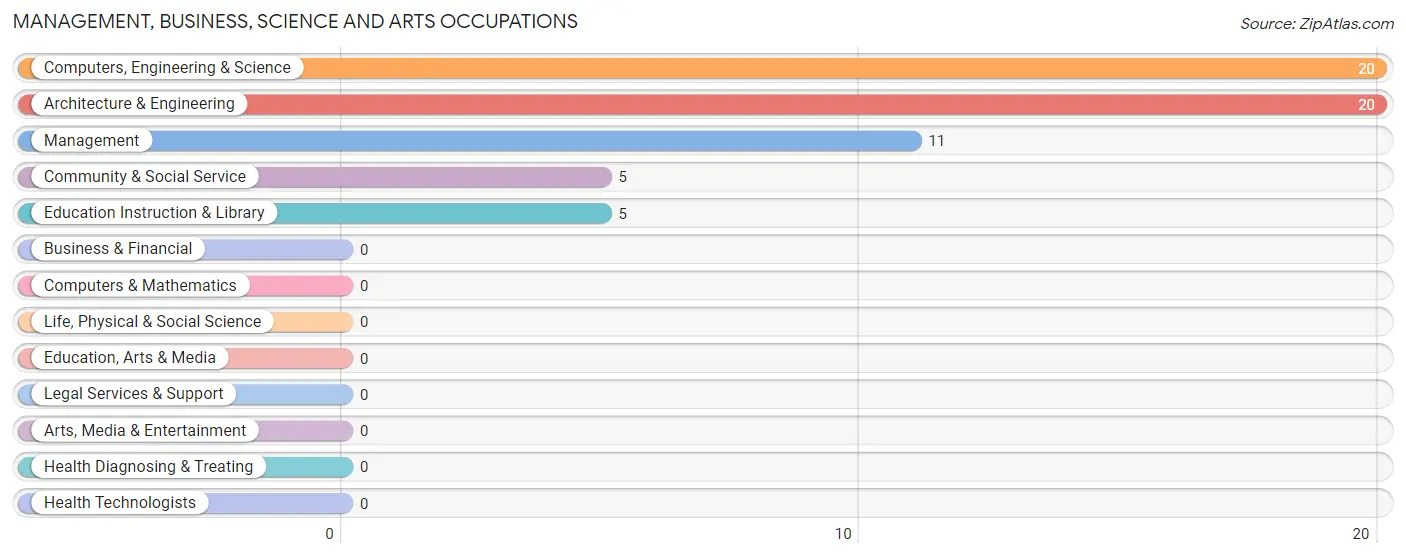
Management, Business, Science and Arts Occupations by Sex
Within the Management, Business, Science and Arts occupations in San Jose, the most male-oriented occupations are Computers, Engineering & Science (100.0%), and Architecture & Engineering (100.0%), while the most female-oriented occupations are Management (100.0%), Community & Social Service (100.0%), and Education Instruction & Library (100.0%).
| Occupation | Male | Female |
| Management | 0 (0.0%) | 11 (100.0%) |
| Business & Financial | 0 (0.0%) | 0 (0.0%) |
| Computers, Engineering & Science | 20 (100.0%) | 0 (0.0%) |
| Computers & Mathematics | 0 (0.0%) | 0 (0.0%) |
| Architecture & Engineering | 20 (100.0%) | 0 (0.0%) |
| Life, Physical & Social Science | 0 (0.0%) | 0 (0.0%) |
| Community & Social Service | 0 (0.0%) | 5 (100.0%) |
| Education, Arts & Media | 0 (0.0%) | 0 (0.0%) |
| Legal Services & Support | 0 (0.0%) | 0 (0.0%) |
| Education Instruction & Library | 0 (0.0%) | 5 (100.0%) |
| Arts, Media & Entertainment | 0 (0.0%) | 0 (0.0%) |
| Health Diagnosing & Treating | 0 (0.0%) | 0 (0.0%) |
| Health Technologists | 0 (0.0%) | 0 (0.0%) |
| Total (Category) | 20 (55.6%) | 16 (44.4%) |
| Total (Overall) | 178 (75.7%) | 57 (24.3%) |
Services Occupations
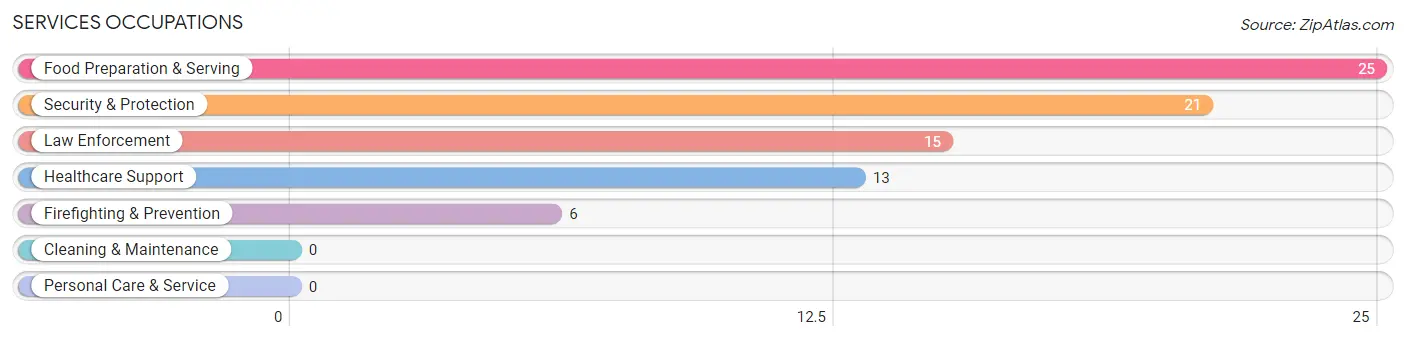
The most common Services occupations in San Jose are Food Preparation & Serving (25 | 10.6%), Security & Protection (21 | 8.9%), Law Enforcement (15 | 6.4%), Healthcare Support (13 | 5.5%), and Firefighting & Prevention (6 | 2.5%).
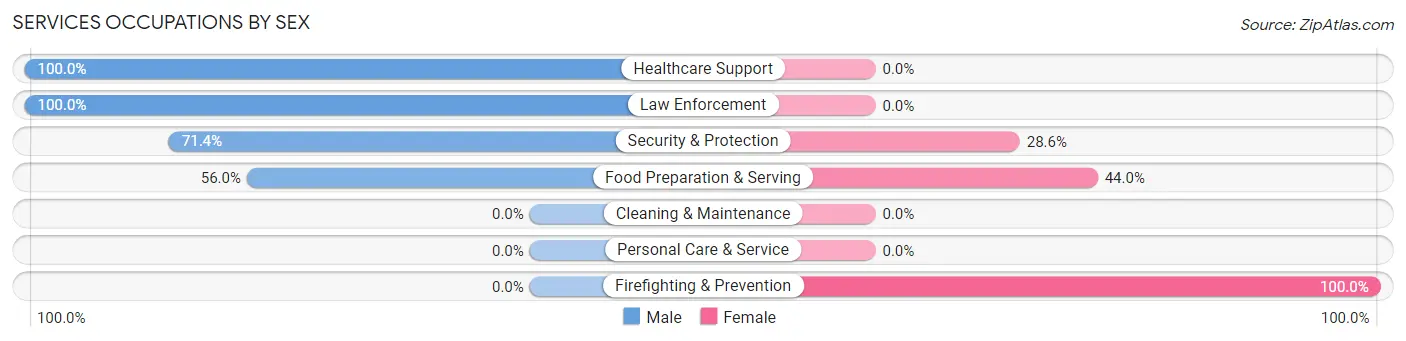
Services Occupations by Sex
Within the Services occupations in San Jose, the most male-oriented occupations are Healthcare Support (100.0%), Law Enforcement (100.0%), and Security & Protection (71.4%), while the most female-oriented occupations are Firefighting & Prevention (100.0%), Food Preparation & Serving (44.0%), and Security & Protection (28.6%).
| Occupation | Male | Female |
| Healthcare Support | 13 (100.0%) | 0 (0.0%) |
| Security & Protection | 15 (71.4%) | 6 (28.6%) |
| Firefighting & Prevention | 0 (0.0%) | 6 (100.0%) |
| Law Enforcement | 15 (100.0%) | 0 (0.0%) |
| Food Preparation & Serving | 14 (56.0%) | 11 (44.0%) |
| Cleaning & Maintenance | 0 (0.0%) | 0 (0.0%) |
| Personal Care & Service | 0 (0.0%) | 0 (0.0%) |
| Total (Category) | 42 (71.2%) | 17 (28.8%) |
| Total (Overall) | 178 (75.7%) | 57 (24.3%) |
Sales and Office Occupations
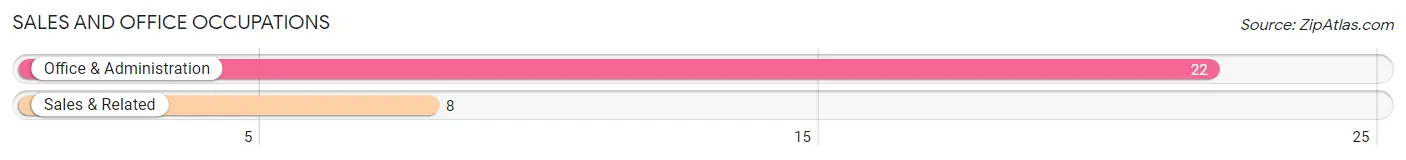
The most common Sales and Office occupations in San Jose are Office & Administration (22 | 9.4%), and Sales & Related (8 | 3.4%).
Sales and Office Occupations by Sex
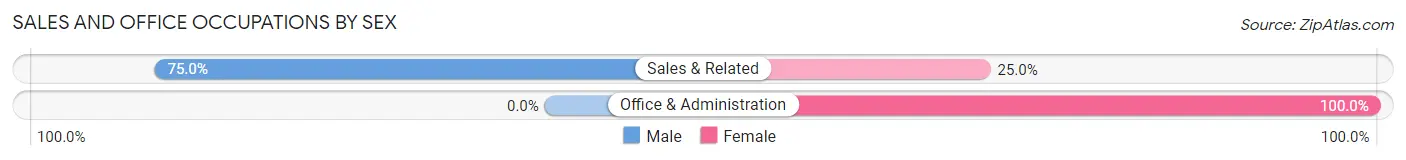
| Occupation | Male | Female |
| Sales & Related | 6 (75.0%) | 2 (25.0%) |
| Office & Administration | 0 (0.0%) | 22 (100.0%) |
| Total (Category) | 6 (20.0%) | 24 (80.0%) |
| Total (Overall) | 178 (75.7%) | 57 (24.3%) |
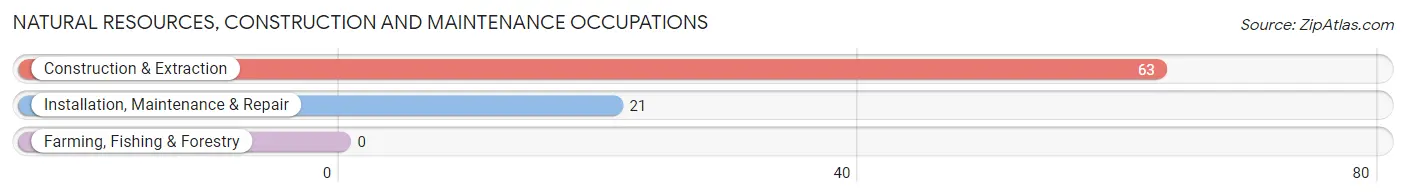
Natural Resources, Construction and Maintenance Occupations
The most common Natural Resources, Construction and Maintenance occupations in San Jose are Construction & Extraction (63 | 26.8%), and Installation, Maintenance & Repair (21 | 8.9%).
Natural Resources, Construction and Maintenance Occupations by Sex
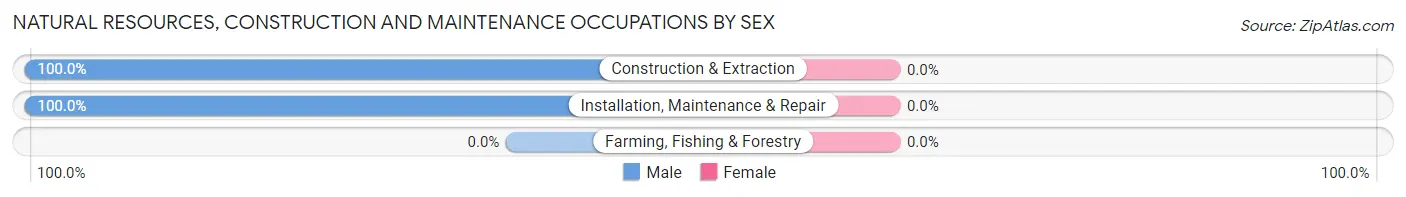
| Occupation | Male | Female |
| Farming, Fishing & Forestry | 0 (0.0%) | 0 (0.0%) |
| Construction & Extraction | 63 (100.0%) | 0 (0.0%) |
| Installation, Maintenance & Repair | 21 (100.0%) | 0 (0.0%) |
| Total (Category) | 84 (100.0%) | 0 (0.0%) |
| Total (Overall) | 178 (75.7%) | 57 (24.3%) |
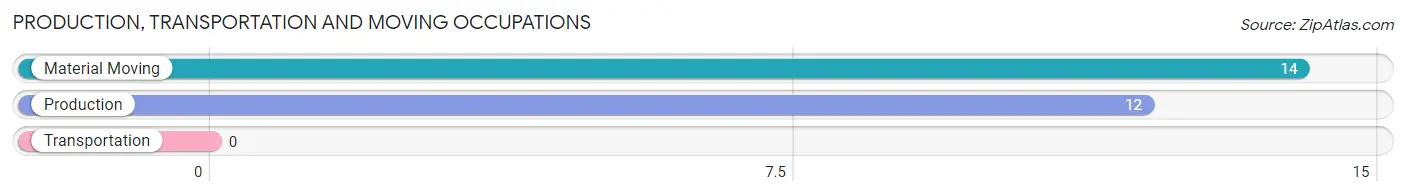
Production, Transportation and Moving Occupations
The most common Production, Transportation and Moving occupations in San Jose are Material Moving (14 | 6.0%), and Production (12 | 5.1%).
Production, Transportation and Moving Occupations by Sex
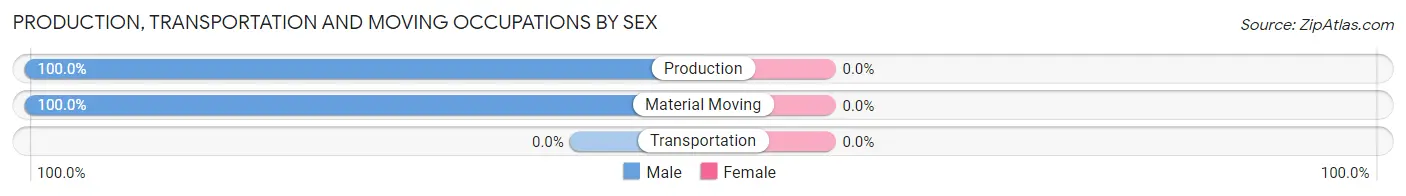
| Occupation | Male | Female |
| Production | 12 (100.0%) | 0 (0.0%) |
| Transportation | 0 (0.0%) | 0 (0.0%) |
| Material Moving | 14 (100.0%) | 0 (0.0%) |
| Total (Category) | 26 (100.0%) | 0 (0.0%) |
| Total (Overall) | 178 (75.7%) | 57 (24.3%) |
Employment Industries by Sex in San Jose
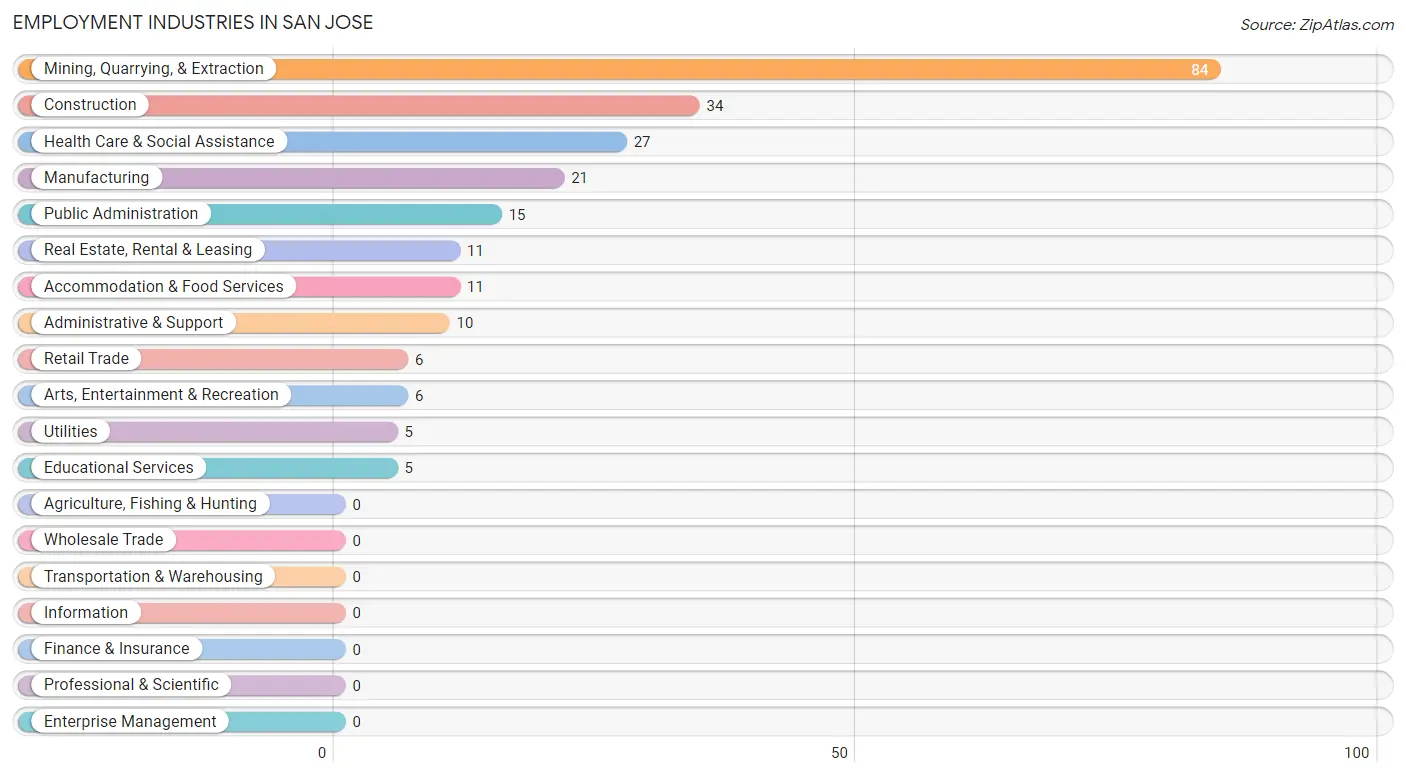
Employment Industries in San Jose
The major employment industries in San Jose include Mining, Quarrying, & Extraction (84 | 35.7%), Construction (34 | 14.5%), Health Care & Social Assistance (27 | 11.5%), Manufacturing (21 | 8.9%), and Public Administration (15 | 6.4%).
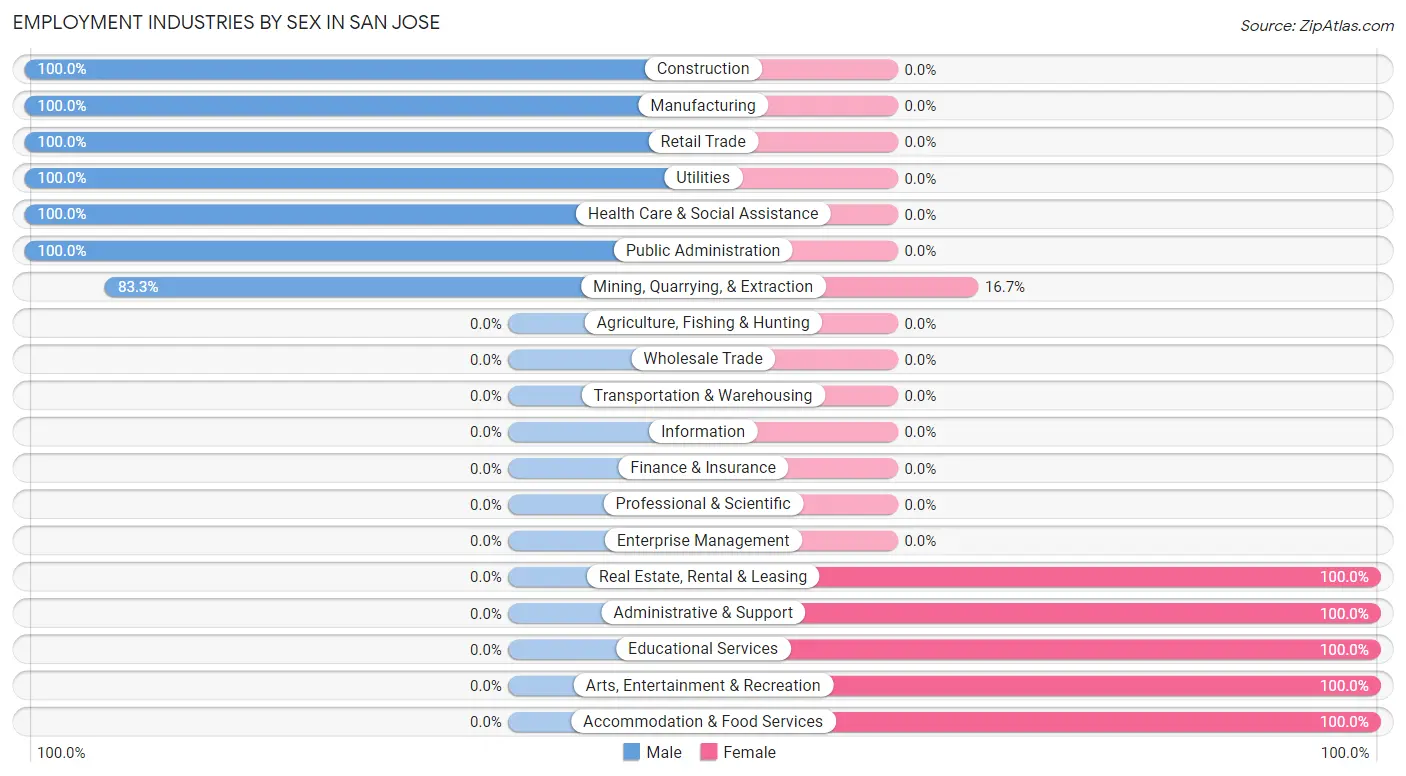
Employment Industries by Sex in San Jose
The San Jose industries that see more men than women are Construction (100.0%), Manufacturing (100.0%), and Retail Trade (100.0%), whereas the industries that tend to have a higher number of women are Real Estate, Rental & Leasing (100.0%), Administrative & Support (100.0%), and Educational Services (100.0%).
| Industry | Male | Female |
| Agriculture, Fishing & Hunting | 0 (0.0%) | 0 (0.0%) |
| Mining, Quarrying, & Extraction | 70 (83.3%) | 14 (16.7%) |
| Construction | 34 (100.0%) | 0 (0.0%) |
| Manufacturing | 21 (100.0%) | 0 (0.0%) |
| Wholesale Trade | 0 (0.0%) | 0 (0.0%) |
| Retail Trade | 6 (100.0%) | 0 (0.0%) |
| Transportation & Warehousing | 0 (0.0%) | 0 (0.0%) |
| Utilities | 5 (100.0%) | 0 (0.0%) |
| Information | 0 (0.0%) | 0 (0.0%) |
| Finance & Insurance | 0 (0.0%) | 0 (0.0%) |
| Real Estate, Rental & Leasing | 0 (0.0%) | 11 (100.0%) |
| Professional & Scientific | 0 (0.0%) | 0 (0.0%) |
| Enterprise Management | 0 (0.0%) | 0 (0.0%) |
| Administrative & Support | 0 (0.0%) | 10 (100.0%) |
| Educational Services | 0 (0.0%) | 5 (100.0%) |
| Health Care & Social Assistance | 27 (100.0%) | 0 (0.0%) |
| Arts, Entertainment & Recreation | 0 (0.0%) | 6 (100.0%) |
| Accommodation & Food Services | 0 (0.0%) | 11 (100.0%) |
| Public Administration | 15 (100.0%) | 0 (0.0%) |
| Total | 178 (75.7%) | 57 (24.3%) |
Education in San Jose
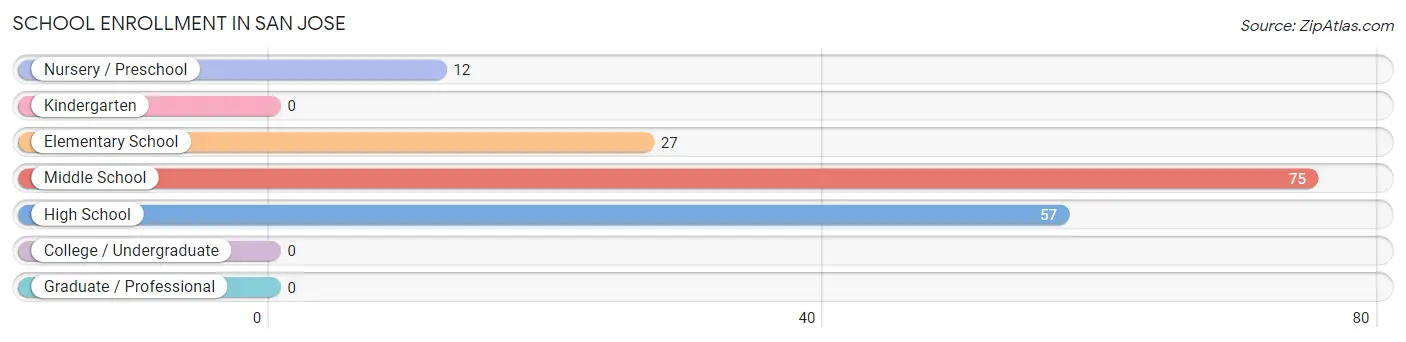
School Enrollment in San Jose
The most common levels of schooling among the 171 students in San Jose are middle school (75 | 43.9%), high school (57 | 33.3%), and elementary school (27 | 15.8%).
| School Level | # Students | % Students |
| Nursery / Preschool | 12 | 7.0% |
| Kindergarten | 0 | 0.0% |
| Elementary School | 27 | 15.8% |
| Middle School | 75 | 43.9% |
| High School | 57 | 33.3% |
| College / Undergraduate | 0 | 0.0% |
| Graduate / Professional | 0 | 0.0% |
| Total | 171 | 100.0% |
School Enrollment by Age by Funding Source in San Jose
Out of a total of 171 students who are enrolled in schools in San Jose, 24 (14.0%) attend a private institution, while the remaining 147 (86.0%) are enrolled in public schools. The age group of 10 to 14 year olds has the highest likelihood of being enrolled in private schools, with 24 (27.0% in the age bracket) enrolled. Conversely, the age group of 5 to 9 year old has the lowest likelihood of being enrolled in a private school, with 39 (100.0% in the age bracket) attending a public institution.
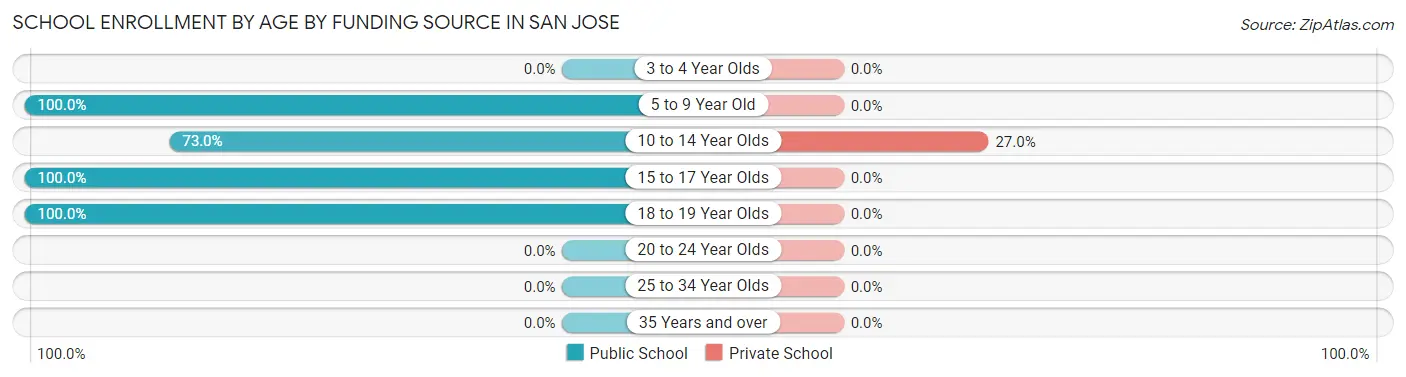
| Age Bracket | Public School | Private School |
| 3 to 4 Year Olds | 0 (0.0%) | 0 (0.0%) |
| 5 to 9 Year Old | 39 (100.0%) | 0 (0.0%) |
| 10 to 14 Year Olds | 65 (73.0%) | 24 (27.0%) |
| 15 to 17 Year Olds | 18 (100.0%) | 0 (0.0%) |
| 18 to 19 Year Olds | 25 (100.0%) | 0 (0.0%) |
| 20 to 24 Year Olds | 0 (0.0%) | 0 (0.0%) |
| 25 to 34 Year Olds | 0 (0.0%) | 0 (0.0%) |
| 35 Years and over | 0 (0.0%) | 0 (0.0%) |
| Total | 147 (86.0%) | 24 (14.0%) |
Educational Attainment by Field of Study in San Jose
Arts & humanities (11 | 68.8%), and education (5 | 31.2%) are the most common fields of study among 16 individuals in San Jose who have obtained a bachelor's degree or higher.
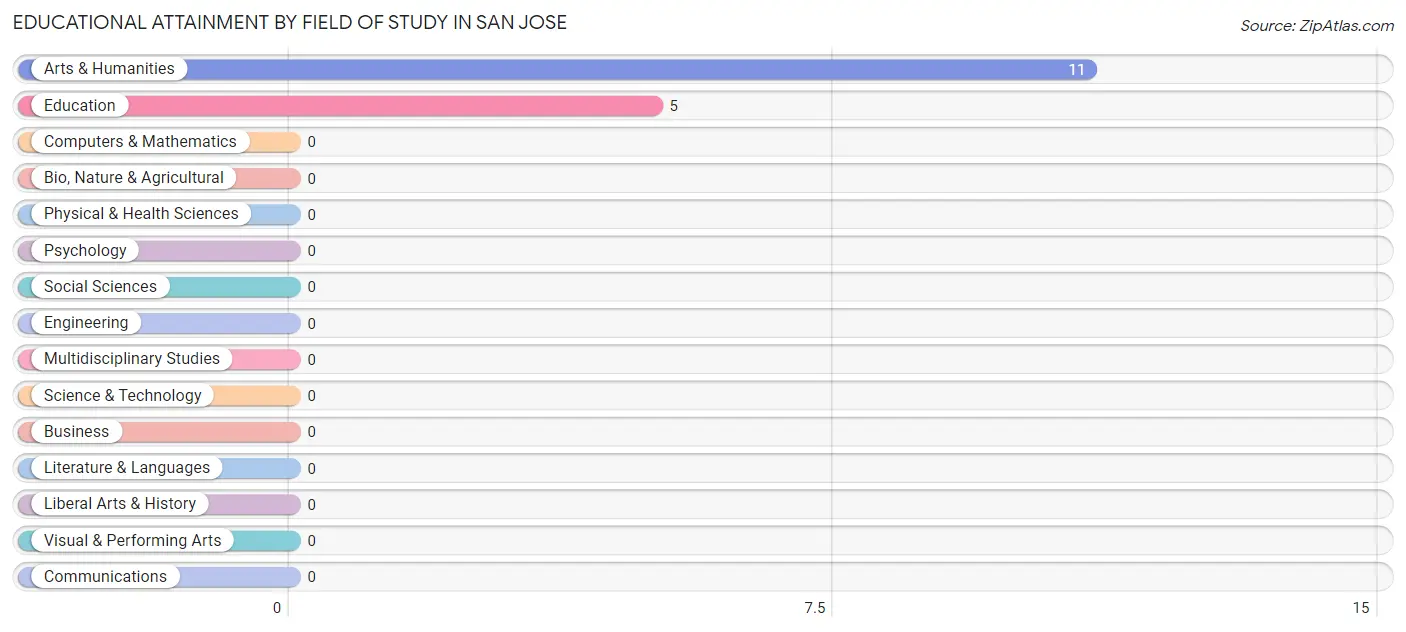
| Field of Study | # Graduates | % Graduates |
| Computers & Mathematics | 0 | 0.0% |
| Bio, Nature & Agricultural | 0 | 0.0% |
| Physical & Health Sciences | 0 | 0.0% |
| Psychology | 0 | 0.0% |
| Social Sciences | 0 | 0.0% |
| Engineering | 0 | 0.0% |
| Multidisciplinary Studies | 0 | 0.0% |
| Science & Technology | 0 | 0.0% |
| Business | 0 | 0.0% |
| Education | 5 | 31.2% |
| Literature & Languages | 0 | 0.0% |
| Liberal Arts & History | 0 | 0.0% |
| Visual & Performing Arts | 0 | 0.0% |
| Communications | 0 | 0.0% |
| Arts & Humanities | 11 | 68.8% |
| Total | 16 | 100.0% |
Transportation & Commute in San Jose
Vehicle Availability by Sex in San Jose
The most prevalent vehicle ownership categories in San Jose are males with 2 vehicles (53, accounting for 29.8%) and females with 2 vehicles (16, making up 93.0%).
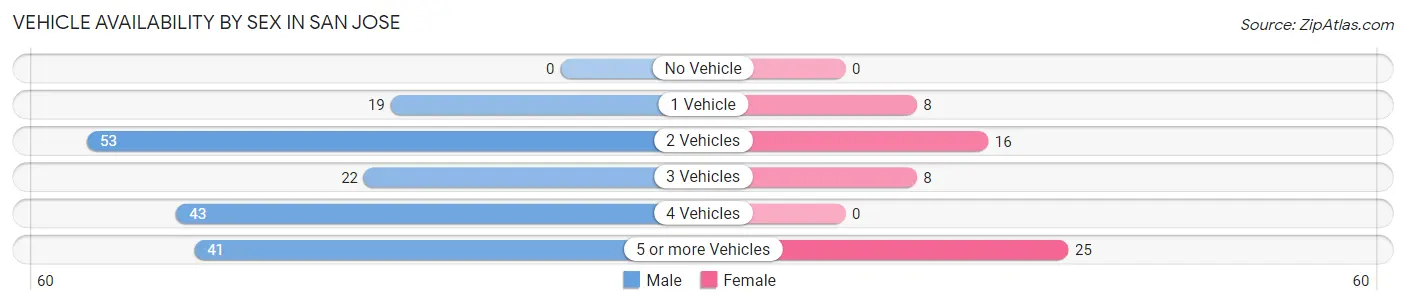
| Vehicles Available | Male | Female |
| No Vehicle | 0 (0.0%) | 0 (0.0%) |
| 1 Vehicle | 19 (10.7%) | 8 (14.0%) |
| 2 Vehicles | 53 (29.8%) | 16 (28.1%) |
| 3 Vehicles | 22 (12.4%) | 8 (14.0%) |
| 4 Vehicles | 43 (24.2%) | 0 (0.0%) |
| 5 or more Vehicles | 41 (23.0%) | 25 (43.9%) |
| Total | 178 (100.0%) | 57 (100.0%) |
Commute Time in San Jose
The most frequently occuring commute durations in San Jose are 20 to 24 minutes (51 commuters, 26.4%), 45 to 59 minutes (36 commuters, 18.6%), and 15 to 19 minutes (34 commuters, 17.6%).
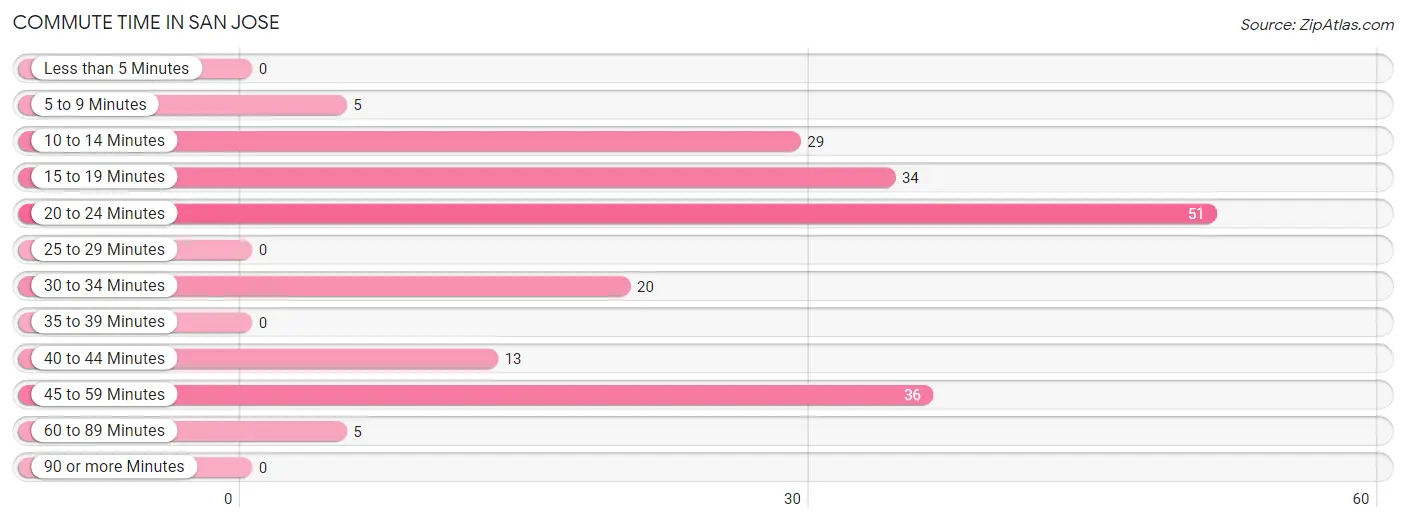
| Commute Time | # Commuters | % Commuters |
| Less than 5 Minutes | 0 | 0.0% |
| 5 to 9 Minutes | 5 | 2.6% |
| 10 to 14 Minutes | 29 | 15.0% |
| 15 to 19 Minutes | 34 | 17.6% |
| 20 to 24 Minutes | 51 | 26.4% |
| 25 to 29 Minutes | 0 | 0.0% |
| 30 to 34 Minutes | 20 | 10.4% |
| 35 to 39 Minutes | 0 | 0.0% |
| 40 to 44 Minutes | 13 | 6.7% |
| 45 to 59 Minutes | 36 | 18.6% |
| 60 to 89 Minutes | 5 | 2.6% |
| 90 or more Minutes | 0 | 0.0% |
Commute Time by Sex in San Jose
The most common commute times in San Jose are 20 to 24 minutes (29 commuters, 21.3%) for males and 20 to 24 minutes (22 commuters, 38.6%) for females.
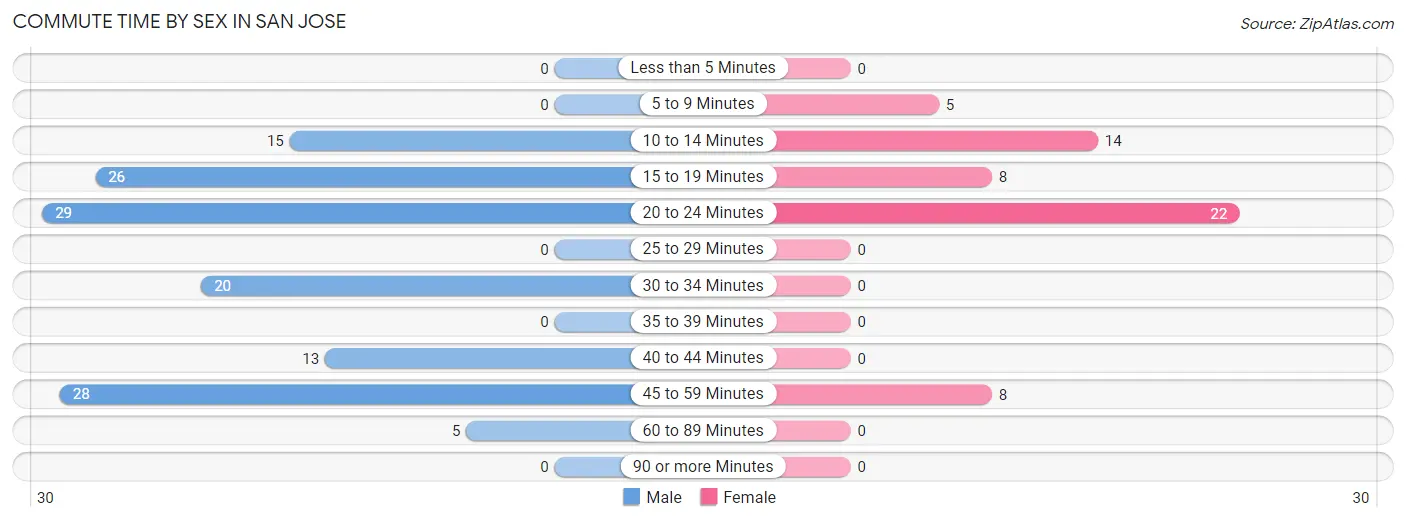
| Commute Time | Male | Female |
| Less than 5 Minutes | 0 (0.0%) | 0 (0.0%) |
| 5 to 9 Minutes | 0 (0.0%) | 5 (8.8%) |
| 10 to 14 Minutes | 15 (11.0%) | 14 (24.6%) |
| 15 to 19 Minutes | 26 (19.1%) | 8 (14.0%) |
| 20 to 24 Minutes | 29 (21.3%) | 22 (38.6%) |
| 25 to 29 Minutes | 0 (0.0%) | 0 (0.0%) |
| 30 to 34 Minutes | 20 (14.7%) | 0 (0.0%) |
| 35 to 39 Minutes | 0 (0.0%) | 0 (0.0%) |
| 40 to 44 Minutes | 13 (9.6%) | 0 (0.0%) |
| 45 to 59 Minutes | 28 (20.6%) | 8 (14.0%) |
| 60 to 89 Minutes | 5 (3.7%) | 0 (0.0%) |
| 90 or more Minutes | 0 (0.0%) | 0 (0.0%) |
Time of Departure to Work by Sex in San Jose
The most frequent times of departure to work in San Jose are 5:30 AM to 5:59 AM (36, 26.5%) for males and 6:30 AM to 6:59 AM (14, 24.6%) for females.
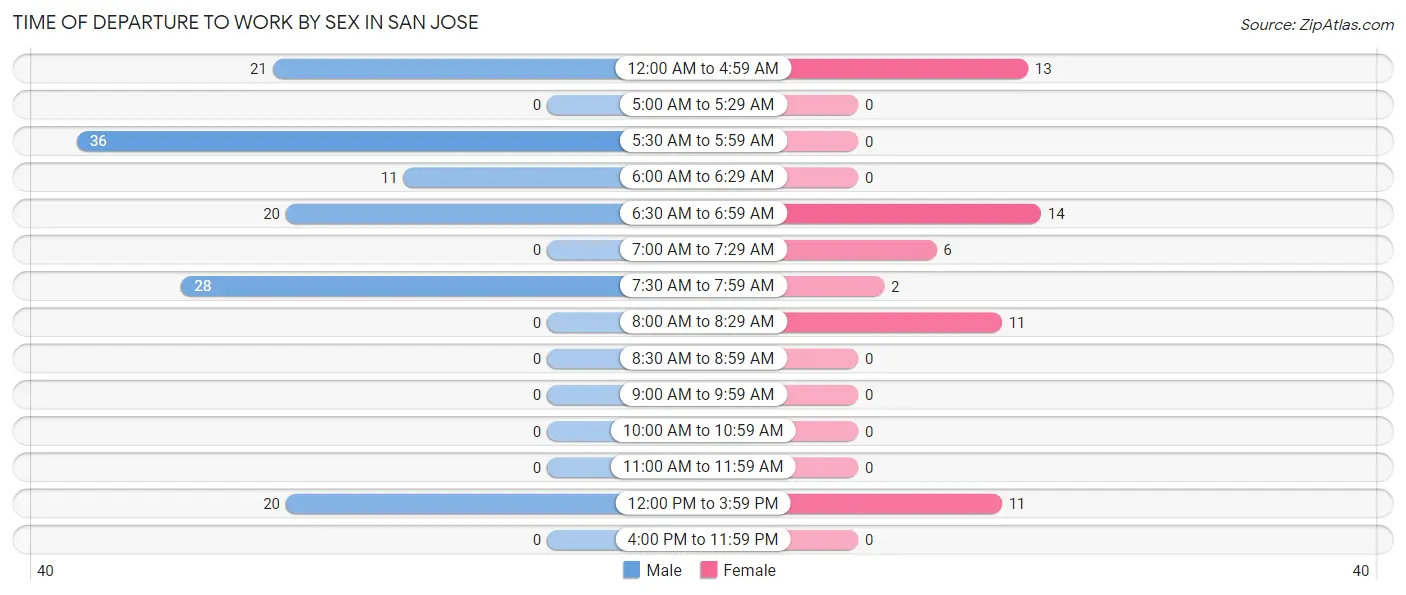
| Time of Departure | Male | Female |
| 12:00 AM to 4:59 AM | 21 (15.4%) | 13 (22.8%) |
| 5:00 AM to 5:29 AM | 0 (0.0%) | 0 (0.0%) |
| 5:30 AM to 5:59 AM | 36 (26.5%) | 0 (0.0%) |
| 6:00 AM to 6:29 AM | 11 (8.1%) | 0 (0.0%) |
| 6:30 AM to 6:59 AM | 20 (14.7%) | 14 (24.6%) |
| 7:00 AM to 7:29 AM | 0 (0.0%) | 6 (10.5%) |
| 7:30 AM to 7:59 AM | 28 (20.6%) | 2 (3.5%) |
| 8:00 AM to 8:29 AM | 0 (0.0%) | 11 (19.3%) |
| 8:30 AM to 8:59 AM | 0 (0.0%) | 0 (0.0%) |
| 9:00 AM to 9:59 AM | 0 (0.0%) | 0 (0.0%) |
| 10:00 AM to 10:59 AM | 0 (0.0%) | 0 (0.0%) |
| 11:00 AM to 11:59 AM | 0 (0.0%) | 0 (0.0%) |
| 12:00 PM to 3:59 PM | 20 (14.7%) | 11 (19.3%) |
| 4:00 PM to 11:59 PM | 0 (0.0%) | 0 (0.0%) |
| Total | 136 (100.0%) | 57 (100.0%) |
Housing Occupancy in San Jose
Occupancy by Ownership in San Jose
Of the total 195 dwellings in San Jose, owner-occupied units account for 171 (87.7%), while renter-occupied units make up 24 (12.3%).
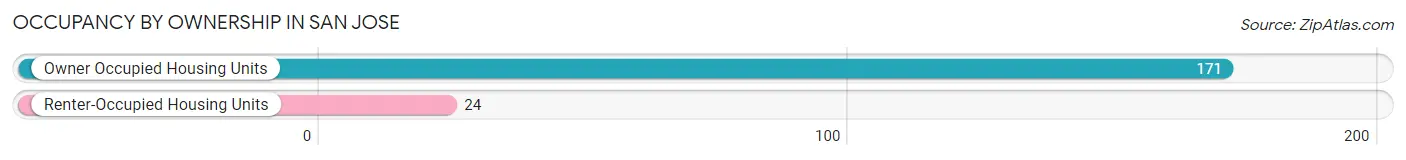
| Occupancy | # Housing Units | % Housing Units |
| Owner Occupied Housing Units | 171 | 87.7% |
| Renter-Occupied Housing Units | 24 | 12.3% |
| Total Occupied Housing Units | 195 | 100.0% |
Occupancy by Household Size in San Jose
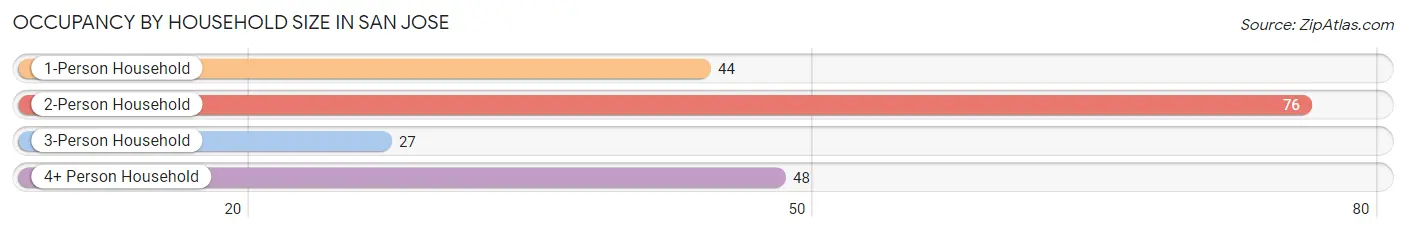
| Household Size | # Housing Units | % Housing Units |
| 1-Person Household | 44 | 22.6% |
| 2-Person Household | 76 | 39.0% |
| 3-Person Household | 27 | 13.9% |
| 4+ Person Household | 48 | 24.6% |
| Total Housing Units | 195 | 100.0% |
Occupancy by Ownership by Household Size in San Jose
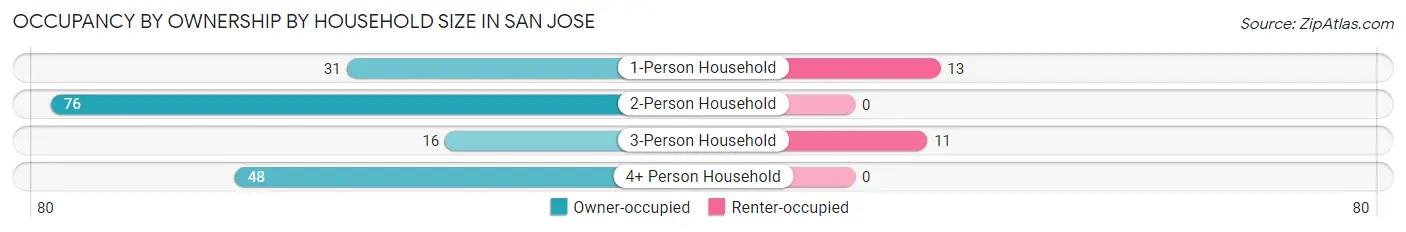
| Household Size | Owner-occupied | Renter-occupied |
| 1-Person Household | 31 (70.5%) | 13 (29.5%) |
| 2-Person Household | 76 (100.0%) | 0 (0.0%) |
| 3-Person Household | 16 (59.3%) | 11 (40.7%) |
| 4+ Person Household | 48 (100.0%) | 0 (0.0%) |
| Total Housing Units | 171 (87.7%) | 24 (12.3%) |
Occupancy by Educational Attainment in San Jose
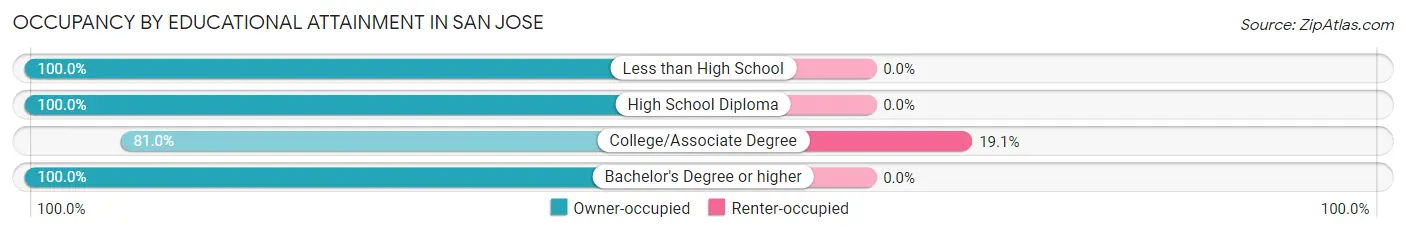
| Household Size | Owner-occupied | Renter-occupied |
| Less than High School | 16 (100.0%) | 0 (0.0%) |
| High School Diploma | 37 (100.0%) | 0 (0.0%) |
| College/Associate Degree | 102 (80.9%) | 24 (19.1%) |
| Bachelor's Degree or higher | 16 (100.0%) | 0 (0.0%) |
Occupancy by Age of Householder in San Jose
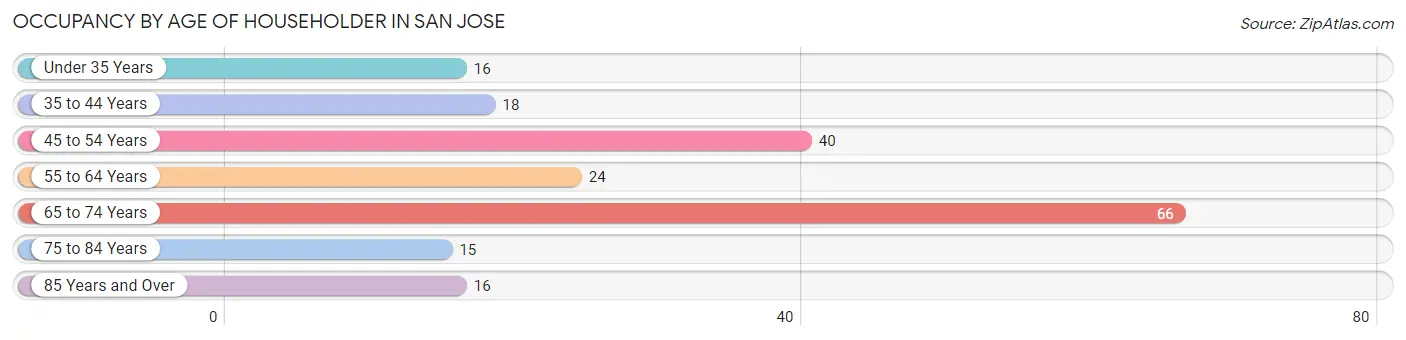
| Age Bracket | # Households | % Households |
| Under 35 Years | 16 | 8.2% |
| 35 to 44 Years | 18 | 9.2% |
| 45 to 54 Years | 40 | 20.5% |
| 55 to 64 Years | 24 | 12.3% |
| 65 to 74 Years | 66 | 33.9% |
| 75 to 84 Years | 15 | 7.7% |
| 85 Years and Over | 16 | 8.2% |
| Total | 195 | 100.0% |
Housing Finances in San Jose
Median Income by Occupancy in San Jose
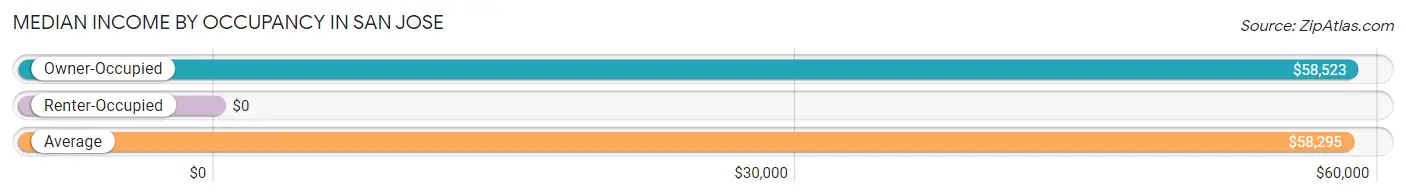
| Occupancy Type | # Households | Median Income |
| Owner-Occupied | 171 (87.7%) | $58,523 |
| Renter-Occupied | 24 (12.3%) | $0 |
| Average | 195 (100.0%) | $58,295 |
Occupancy by Householder Income Bracket in San Jose
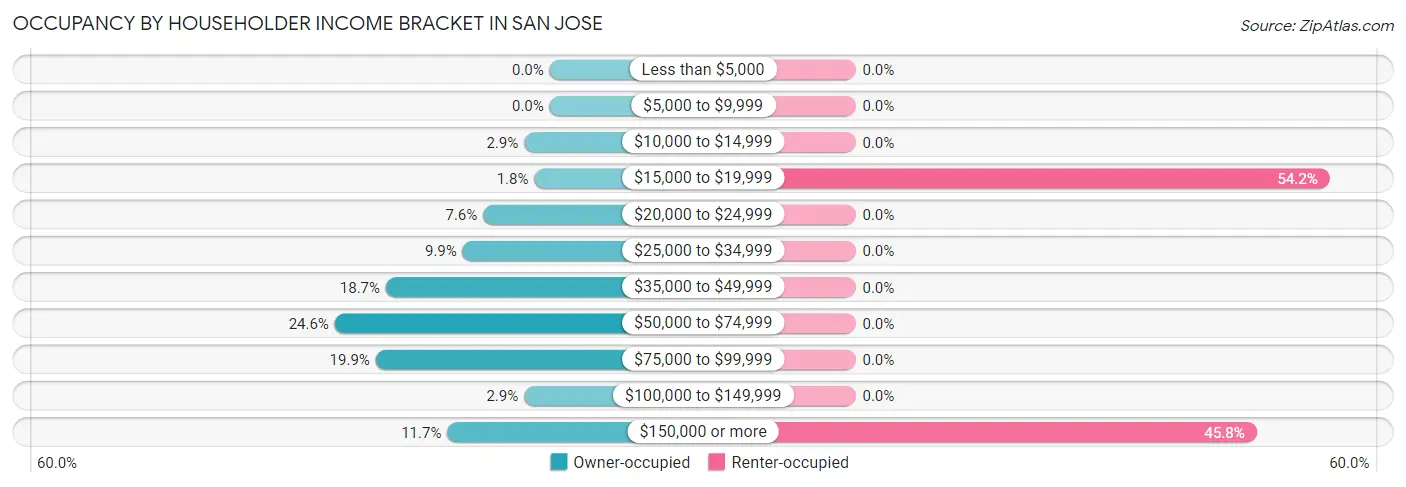
| Income Bracket | Owner-occupied | Renter-occupied |
| Less than $5,000 | 0 (0.0%) | 0 (0.0%) |
| $5,000 to $9,999 | 0 (0.0%) | 0 (0.0%) |
| $10,000 to $14,999 | 5 (2.9%) | 0 (0.0%) |
| $15,000 to $19,999 | 3 (1.8%) | 13 (54.2%) |
| $20,000 to $24,999 | 13 (7.6%) | 0 (0.0%) |
| $25,000 to $34,999 | 17 (9.9%) | 0 (0.0%) |
| $35,000 to $49,999 | 32 (18.7%) | 0 (0.0%) |
| $50,000 to $74,999 | 42 (24.6%) | 0 (0.0%) |
| $75,000 to $99,999 | 34 (19.9%) | 0 (0.0%) |
| $100,000 to $149,999 | 5 (2.9%) | 0 (0.0%) |
| $150,000 or more | 20 (11.7%) | 11 (45.8%) |
| Total | 171 (100.0%) | 24 (100.0%) |
Monthly Housing Cost Tiers in San Jose
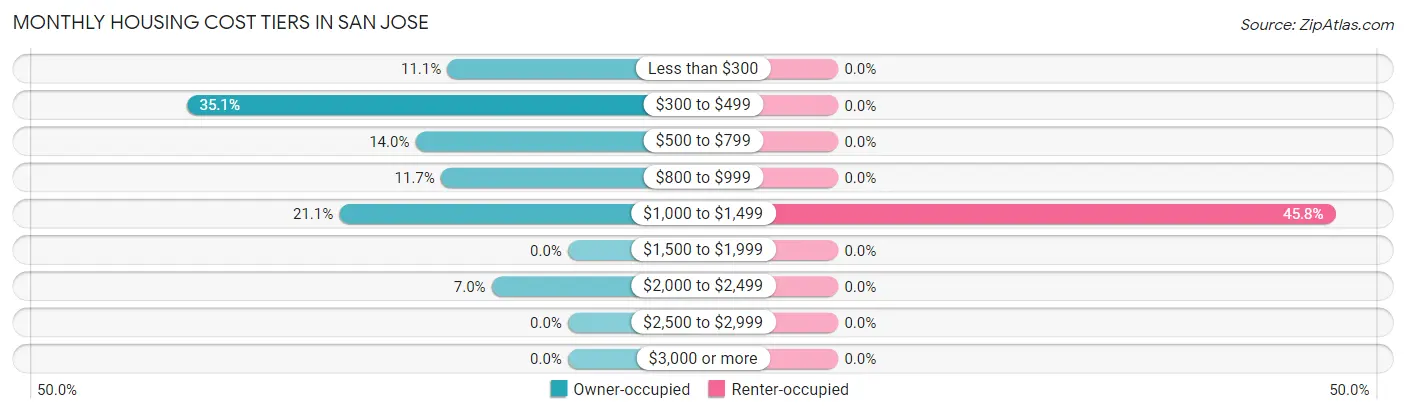
| Monthly Cost | Owner-occupied | Renter-occupied |
| Less than $300 | 19 (11.1%) | 0 (0.0%) |
| $300 to $499 | 60 (35.1%) | 0 (0.0%) |
| $500 to $799 | 24 (14.0%) | 0 (0.0%) |
| $800 to $999 | 20 (11.7%) | 0 (0.0%) |
| $1,000 to $1,499 | 36 (21.0%) | 11 (45.8%) |
| $1,500 to $1,999 | 0 (0.0%) | 0 (0.0%) |
| $2,000 to $2,499 | 12 (7.0%) | 0 (0.0%) |
| $2,500 to $2,999 | 0 (0.0%) | 0 (0.0%) |
| $3,000 or more | 0 (0.0%) | 0 (0.0%) |
| Total | 171 (100.0%) | 24 (100.0%) |
Physical Housing Characteristics in San Jose
Housing Structures in San Jose
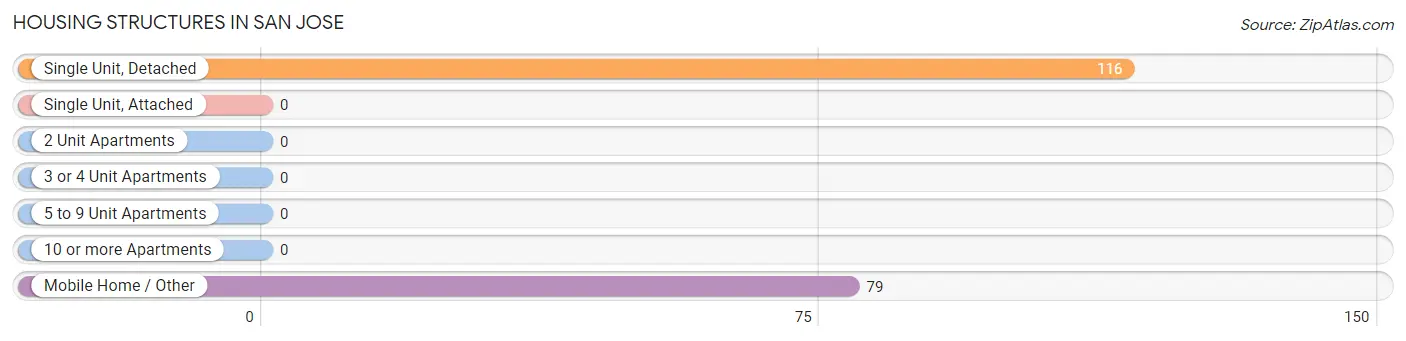
| Structure Type | # Housing Units | % Housing Units |
| Single Unit, Detached | 116 | 59.5% |
| Single Unit, Attached | 0 | 0.0% |
| 2 Unit Apartments | 0 | 0.0% |
| 3 or 4 Unit Apartments | 0 | 0.0% |
| 5 to 9 Unit Apartments | 0 | 0.0% |
| 10 or more Apartments | 0 | 0.0% |
| Mobile Home / Other | 79 | 40.5% |
| Total | 195 | 100.0% |
Housing Structures by Occupancy in San Jose
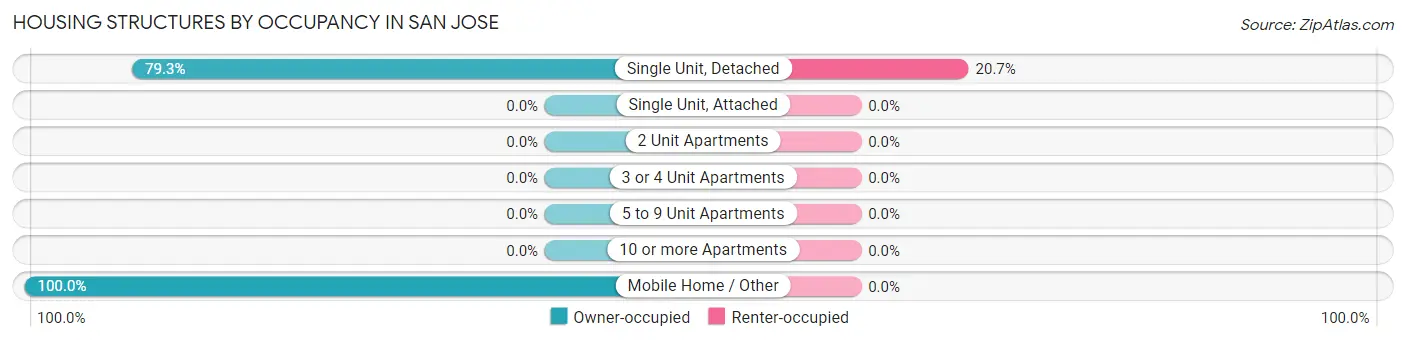
| Structure Type | Owner-occupied | Renter-occupied |
| Single Unit, Detached | 92 (79.3%) | 24 (20.7%) |
| Single Unit, Attached | 0 (0.0%) | 0 (0.0%) |
| 2 Unit Apartments | 0 (0.0%) | 0 (0.0%) |
| 3 or 4 Unit Apartments | 0 (0.0%) | 0 (0.0%) |
| 5 to 9 Unit Apartments | 0 (0.0%) | 0 (0.0%) |
| 10 or more Apartments | 0 (0.0%) | 0 (0.0%) |
| Mobile Home / Other | 79 (100.0%) | 0 (0.0%) |
| Total | 171 (87.7%) | 24 (12.3%) |
Housing Structures by Number of Rooms in San Jose
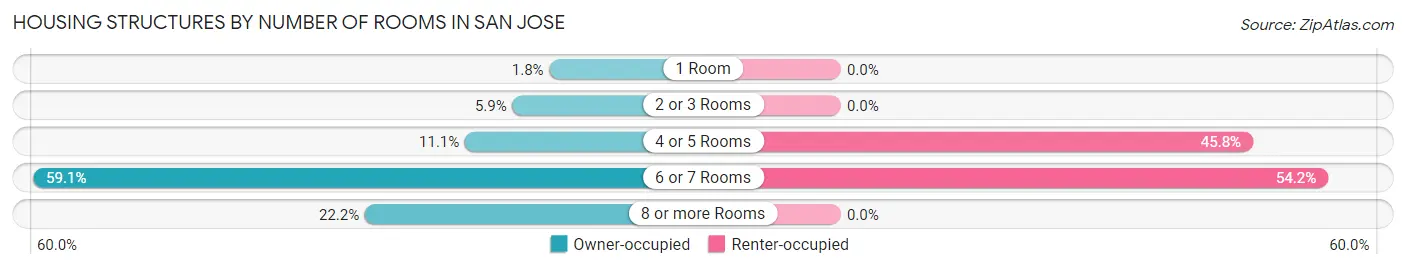
| Number of Rooms | Owner-occupied | Renter-occupied |
| 1 Room | 3 (1.8%) | 0 (0.0%) |
| 2 or 3 Rooms | 10 (5.9%) | 0 (0.0%) |
| 4 or 5 Rooms | 19 (11.1%) | 11 (45.8%) |
| 6 or 7 Rooms | 101 (59.1%) | 13 (54.2%) |
| 8 or more Rooms | 38 (22.2%) | 0 (0.0%) |
| Total | 171 (100.0%) | 24 (100.0%) |
Housing Structure by Heating Type in San Jose
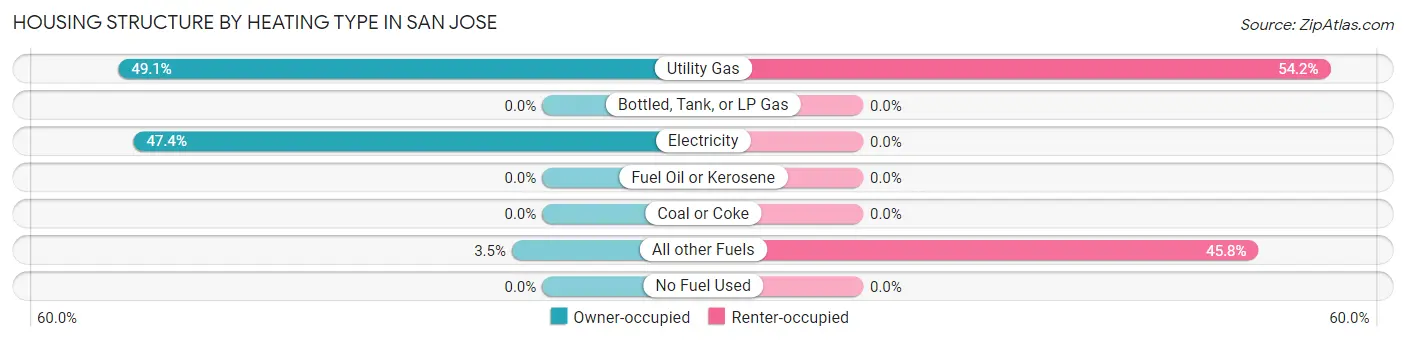
| Heating Type | Owner-occupied | Renter-occupied |
| Utility Gas | 84 (49.1%) | 13 (54.2%) |
| Bottled, Tank, or LP Gas | 0 (0.0%) | 0 (0.0%) |
| Electricity | 81 (47.4%) | 0 (0.0%) |
| Fuel Oil or Kerosene | 0 (0.0%) | 0 (0.0%) |
| Coal or Coke | 0 (0.0%) | 0 (0.0%) |
| All other Fuels | 6 (3.5%) | 11 (45.8%) |
| No Fuel Used | 0 (0.0%) | 0 (0.0%) |
| Total | 171 (100.0%) | 24 (100.0%) |
Household Vehicle Usage in San Jose
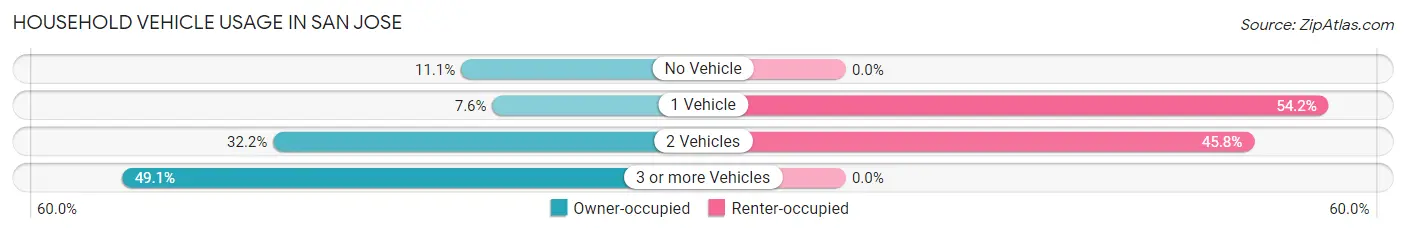
| Vehicles per Household | Owner-occupied | Renter-occupied |
| No Vehicle | 19 (11.1%) | 0 (0.0%) |
| 1 Vehicle | 13 (7.6%) | 13 (54.2%) |
| 2 Vehicles | 55 (32.2%) | 11 (45.8%) |
| 3 or more Vehicles | 84 (49.1%) | 0 (0.0%) |
| Total | 171 (100.0%) | 24 (100.0%) |
Real Estate & Mortgages in San Jose
Real Estate and Mortgage Overview in San Jose
| Characteristic | Without Mortgage | With Mortgage |
| Housing Units | 72 | 99 |
| Median Property Value | $92,800 | $227,500 |
| Median Household Income | $56,250 | $20 |
| Monthly Housing Costs | $418 | $0 |
| Real Estate Taxes | - | - |
Property Value by Mortgage Status in San Jose
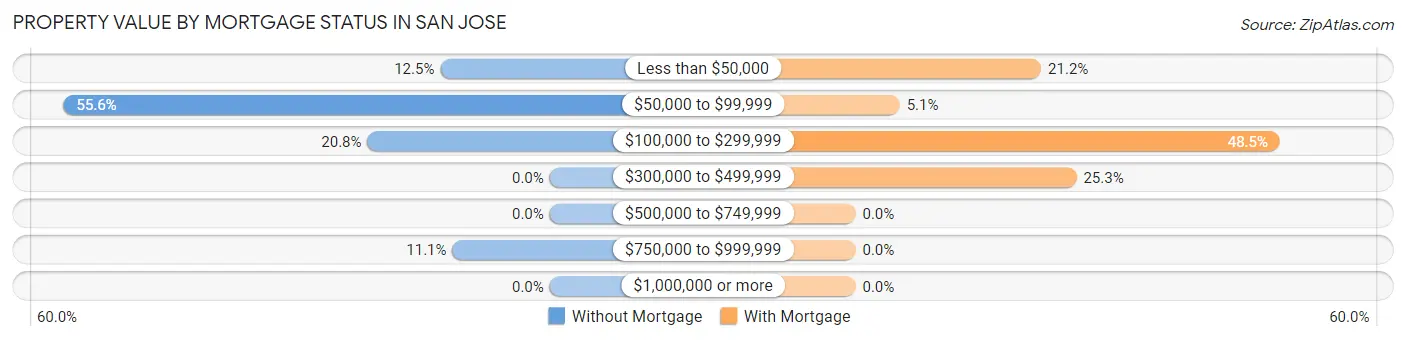
| Property Value | Without Mortgage | With Mortgage |
| Less than $50,000 | 9 (12.5%) | 21 (21.2%) |
| $50,000 to $99,999 | 40 (55.6%) | 5 (5.1%) |
| $100,000 to $299,999 | 15 (20.8%) | 48 (48.5%) |
| $300,000 to $499,999 | 0 (0.0%) | 25 (25.3%) |
| $500,000 to $749,999 | 0 (0.0%) | 0 (0.0%) |
| $750,000 to $999,999 | 8 (11.1%) | 0 (0.0%) |
| $1,000,000 or more | 0 (0.0%) | 0 (0.0%) |
| Total | 72 (100.0%) | 99 (100.0%) |
Household Income by Mortgage Status in San Jose
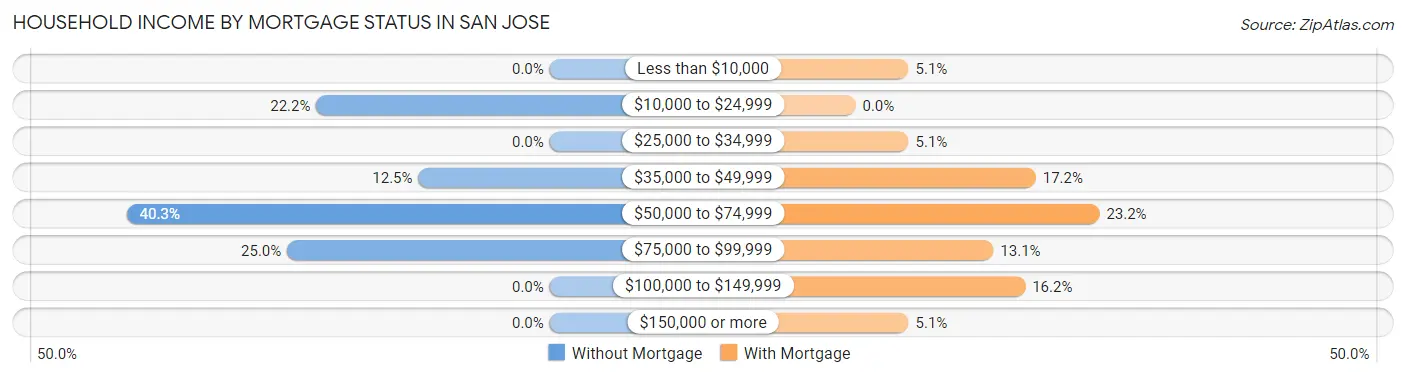
| Household Income | Without Mortgage | With Mortgage |
| Less than $10,000 | 0 (0.0%) | 5 (5.1%) |
| $10,000 to $24,999 | 16 (22.2%) | 0 (0.0%) |
| $25,000 to $34,999 | 0 (0.0%) | 5 (5.1%) |
| $35,000 to $49,999 | 9 (12.5%) | 17 (17.2%) |
| $50,000 to $74,999 | 29 (40.3%) | 23 (23.2%) |
| $75,000 to $99,999 | 18 (25.0%) | 13 (13.1%) |
| $100,000 to $149,999 | 0 (0.0%) | 16 (16.2%) |
| $150,000 or more | 0 (0.0%) | 5 (5.1%) |
| Total | 72 (100.0%) | 99 (100.0%) |
Property Value to Household Income Ratio in San Jose
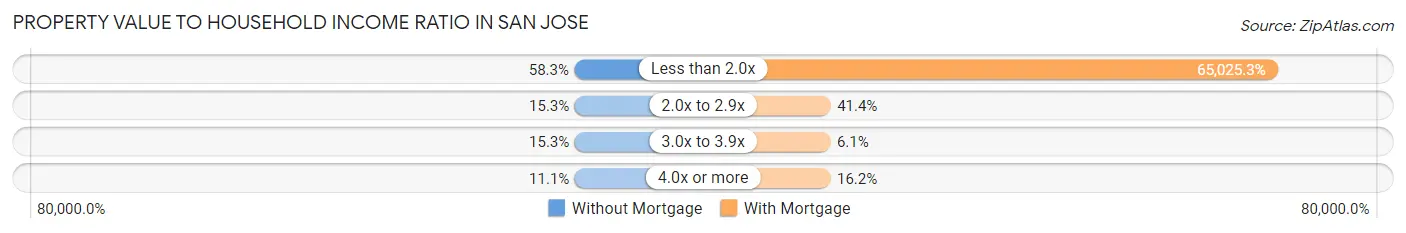
| Value-to-Income Ratio | Without Mortgage | With Mortgage |
| Less than 2.0x | 42 (58.3%) | 64,375 (65,025.3%) |
| 2.0x to 2.9x | 11 (15.3%) | 41 (41.4%) |
| 3.0x to 3.9x | 11 (15.3%) | 6 (6.1%) |
| 4.0x or more | 8 (11.1%) | 16 (16.2%) |
| Total | 72 (100.0%) | 99 (100.0%) |
Real Estate Taxes by Mortgage Status in San Jose
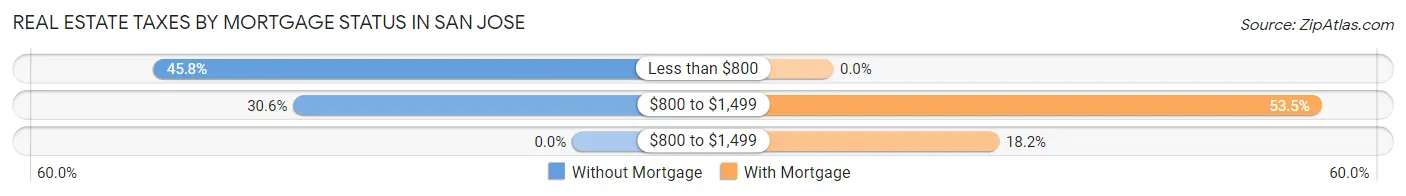
| Property Taxes | Without Mortgage | With Mortgage |
| Less than $800 | 33 (45.8%) | 0 (0.0%) |
| $800 to $1,499 | 22 (30.6%) | 53 (53.5%) |
| $800 to $1,499 | 0 (0.0%) | 18 (18.2%) |
| Total | 72 (100.0%) | 99 (100.0%) |
Health & Disability in San Jose
Health Insurance Coverage by Age in San Jose
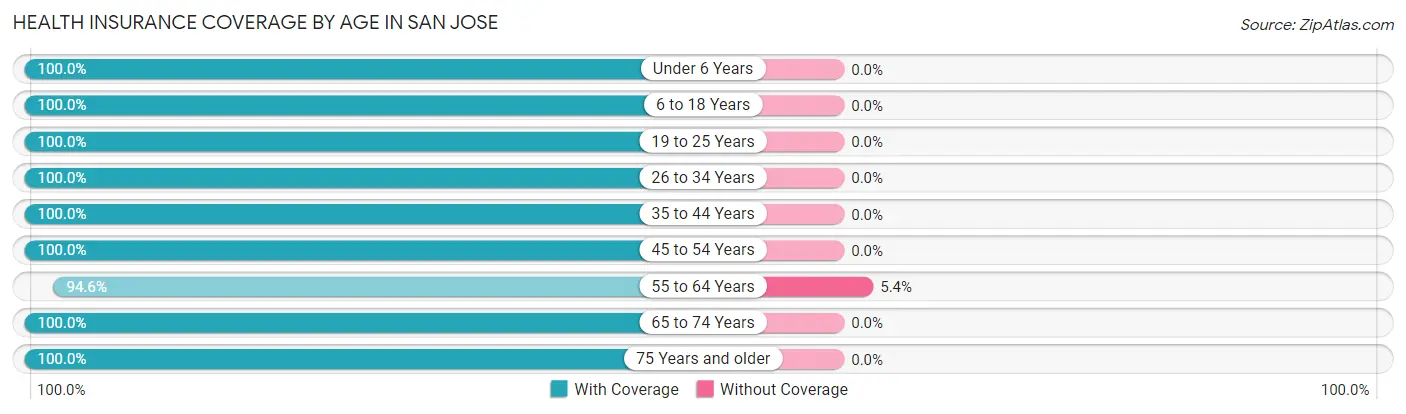
| Age Bracket | With Coverage | Without Coverage |
| Under 6 Years | 44 (100.0%) | 0 (0.0%) |
| 6 to 18 Years | 159 (100.0%) | 0 (0.0%) |
| 19 to 25 Years | 29 (100.0%) | 0 (0.0%) |
| 26 to 34 Years | 69 (100.0%) | 0 (0.0%) |
| 35 to 44 Years | 42 (100.0%) | 0 (0.0%) |
| 45 to 54 Years | 116 (100.0%) | 0 (0.0%) |
| 55 to 64 Years | 35 (94.6%) | 2 (5.4%) |
| 65 to 74 Years | 87 (100.0%) | 0 (0.0%) |
| 75 Years and older | 31 (100.0%) | 0 (0.0%) |
| Total | 612 (99.7%) | 2 (0.3%) |
Health Insurance Coverage by Citizenship Status in San Jose
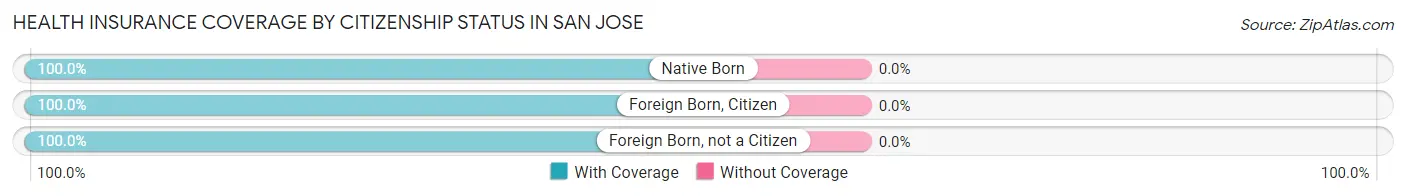
| Citizenship Status | With Coverage | Without Coverage |
| Native Born | 44 (100.0%) | 0 (0.0%) |
| Foreign Born, Citizen | 159 (100.0%) | 0 (0.0%) |
| Foreign Born, not a Citizen | 29 (100.0%) | 0 (0.0%) |
Health Insurance Coverage by Household Income in San Jose
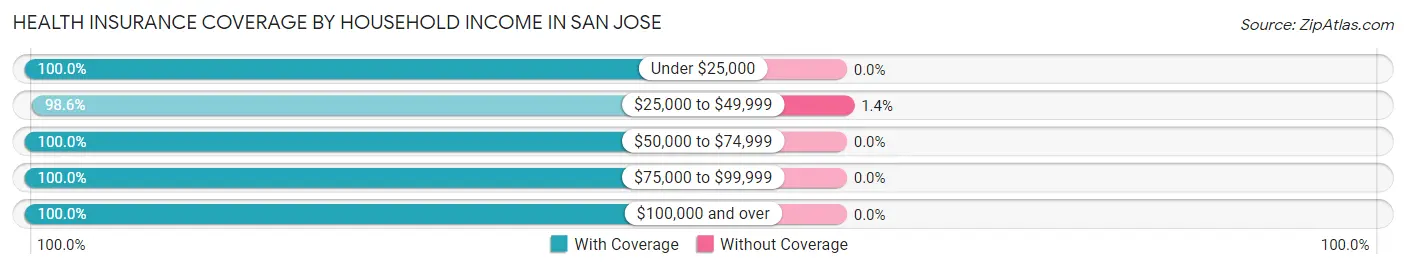
| Household Income | With Coverage | Without Coverage |
| Under $25,000 | 48 (100.0%) | 0 (0.0%) |
| $25,000 to $49,999 | 142 (98.6%) | 2 (1.4%) |
| $50,000 to $74,999 | 172 (100.0%) | 0 (0.0%) |
| $75,000 to $99,999 | 146 (100.0%) | 0 (0.0%) |
| $100,000 and over | 104 (100.0%) | 0 (0.0%) |
Public vs Private Health Insurance Coverage by Age in San Jose
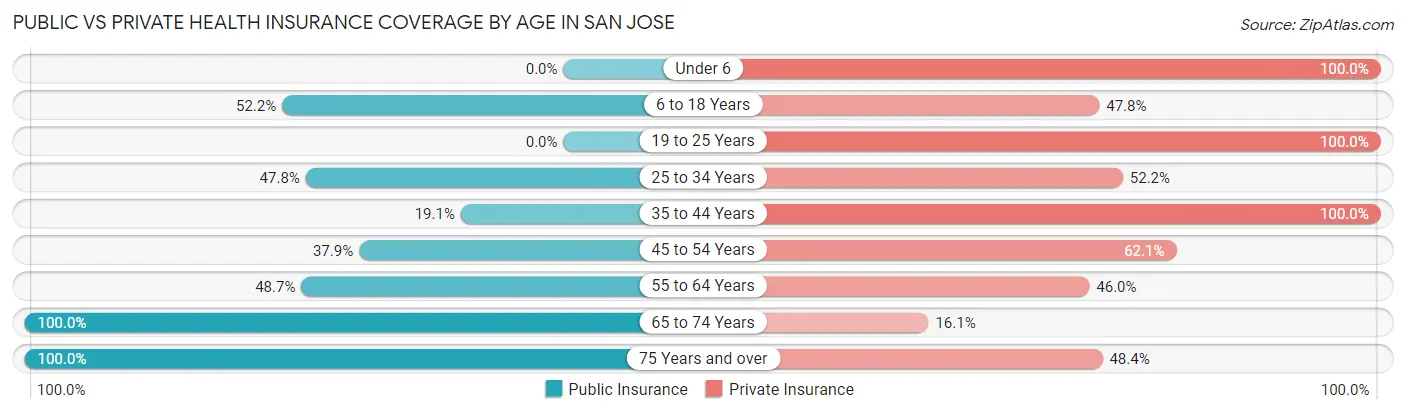
| Age Bracket | Public Insurance | Private Insurance |
| Under 6 | 0 (0.0%) | 44 (100.0%) |
| 6 to 18 Years | 83 (52.2%) | 76 (47.8%) |
| 19 to 25 Years | 0 (0.0%) | 29 (100.0%) |
| 25 to 34 Years | 33 (47.8%) | 36 (52.2%) |
| 35 to 44 Years | 8 (19.1%) | 42 (100.0%) |
| 45 to 54 Years | 44 (37.9%) | 72 (62.1%) |
| 55 to 64 Years | 18 (48.6%) | 17 (46.0%) |
| 65 to 74 Years | 87 (100.0%) | 14 (16.1%) |
| 75 Years and over | 31 (100.0%) | 15 (48.4%) |
| Total | 304 (49.5%) | 345 (56.2%) |
Disability Status by Sex by Age in San Jose
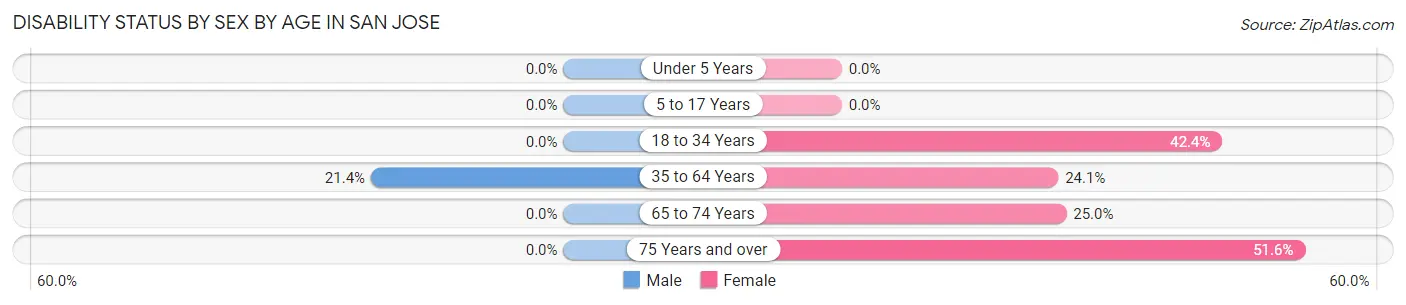
| Age Bracket | Male | Female |
| Under 5 Years | 0 (0.0%) | 0 (0.0%) |
| 5 to 17 Years | 0 (0.0%) | 0 (0.0%) |
| 18 to 34 Years | 0 (0.0%) | 25 (42.4%) |
| 35 to 64 Years | 24 (21.4%) | 20 (24.1%) |
| 65 to 74 Years | 0 (0.0%) | 11 (25.0%) |
| 75 Years and over | 0 (0.0%) | 16 (51.6%) |
Disability Class by Sex by Age in San Jose
Disability Class: Hearing Difficulty
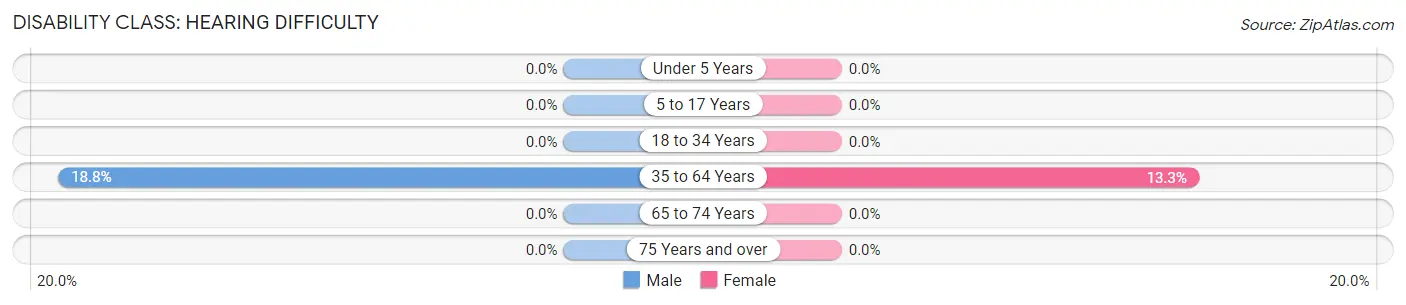
| Age Bracket | Male | Female |
| Under 5 Years | 0 (0.0%) | 0 (0.0%) |
| 5 to 17 Years | 0 (0.0%) | 0 (0.0%) |
| 18 to 34 Years | 0 (0.0%) | 0 (0.0%) |
| 35 to 64 Years | 21 (18.8%) | 11 (13.3%) |
| 65 to 74 Years | 0 (0.0%) | 0 (0.0%) |
| 75 Years and over | 0 (0.0%) | 0 (0.0%) |
Disability Class: Vision Difficulty
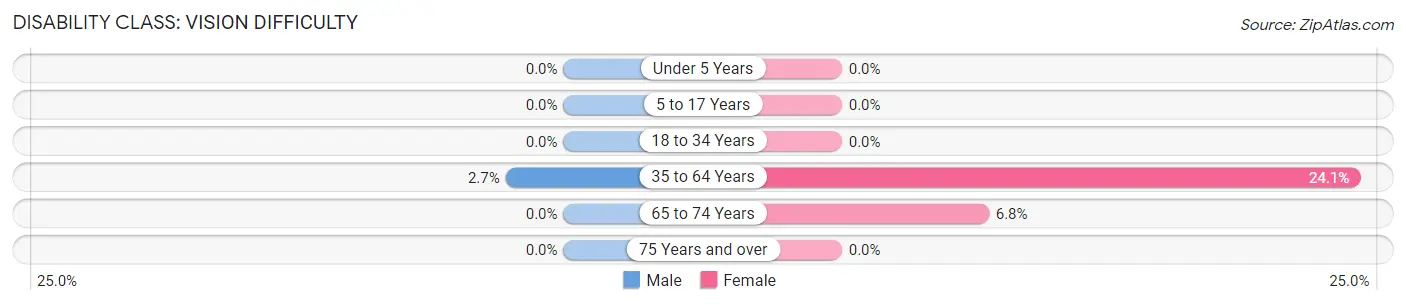
| Age Bracket | Male | Female |
| Under 5 Years | 0 (0.0%) | 0 (0.0%) |
| 5 to 17 Years | 0 (0.0%) | 0 (0.0%) |
| 18 to 34 Years | 0 (0.0%) | 0 (0.0%) |
| 35 to 64 Years | 3 (2.7%) | 20 (24.1%) |
| 65 to 74 Years | 0 (0.0%) | 3 (6.8%) |
| 75 Years and over | 0 (0.0%) | 0 (0.0%) |
Disability Class: Cognitive Difficulty
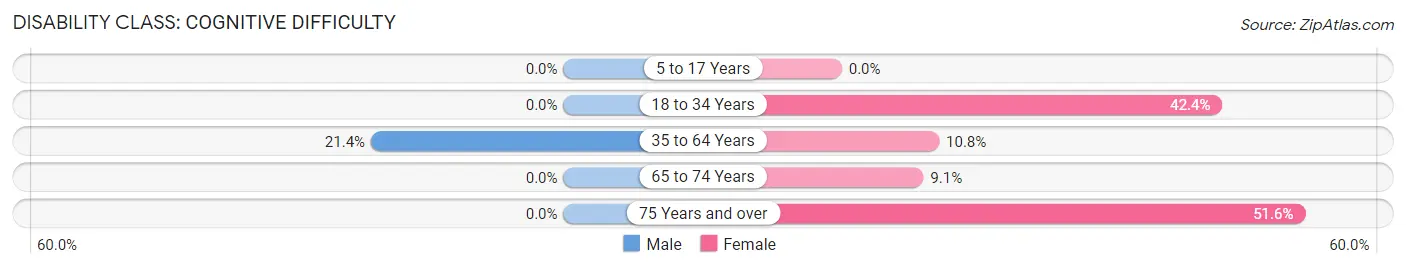
| Age Bracket | Male | Female |
| 5 to 17 Years | 0 (0.0%) | 0 (0.0%) |
| 18 to 34 Years | 0 (0.0%) | 25 (42.4%) |
| 35 to 64 Years | 24 (21.4%) | 9 (10.8%) |
| 65 to 74 Years | 0 (0.0%) | 4 (9.1%) |
| 75 Years and over | 0 (0.0%) | 16 (51.6%) |
Disability Class: Ambulatory Difficulty
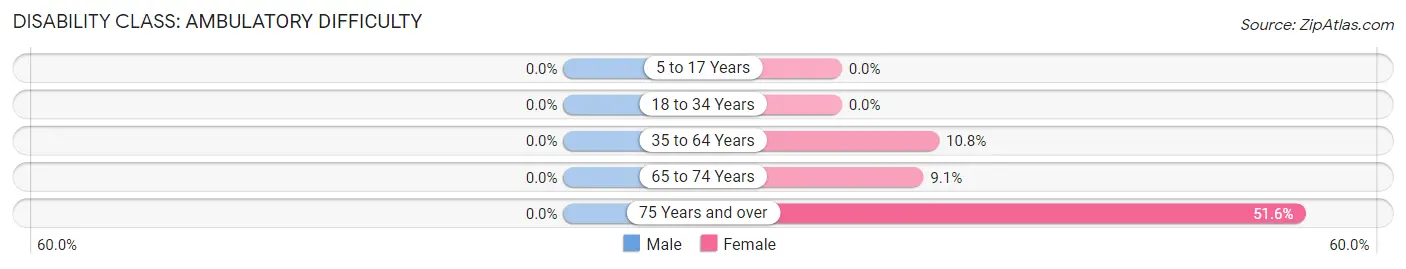
| Age Bracket | Male | Female |
| 5 to 17 Years | 0 (0.0%) | 0 (0.0%) |
| 18 to 34 Years | 0 (0.0%) | 0 (0.0%) |
| 35 to 64 Years | 0 (0.0%) | 9 (10.8%) |
| 65 to 74 Years | 0 (0.0%) | 4 (9.1%) |
| 75 Years and over | 0 (0.0%) | 16 (51.6%) |
Disability Class: Self-Care Difficulty
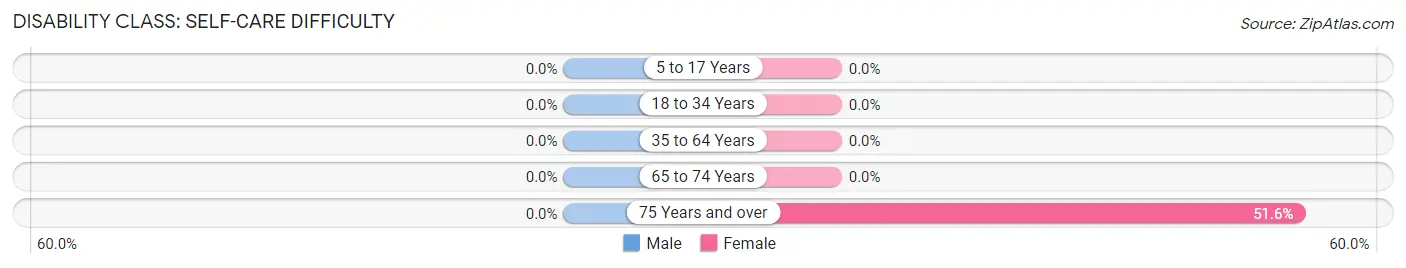
| Age Bracket | Male | Female |
| 5 to 17 Years | 0 (0.0%) | 0 (0.0%) |
| 18 to 34 Years | 0 (0.0%) | 0 (0.0%) |
| 35 to 64 Years | 0 (0.0%) | 0 (0.0%) |
| 65 to 74 Years | 0 (0.0%) | 0 (0.0%) |
| 75 Years and over | 0 (0.0%) | 16 (51.6%) |
Technology Access in San Jose
Computing Device Access in San Jose
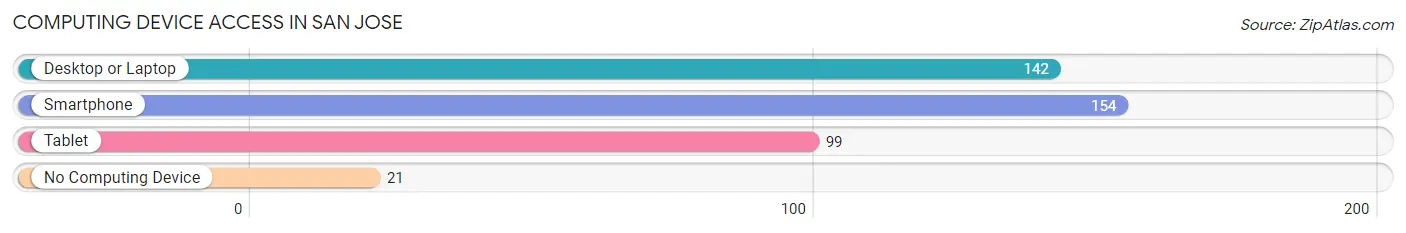
| Device Type | # Households | % Households |
| Desktop or Laptop | 142 | 72.8% |
| Smartphone | 154 | 79.0% |
| Tablet | 99 | 50.8% |
| No Computing Device | 21 | 10.8% |
| Total | 195 | 100.0% |
Internet Access in San Jose
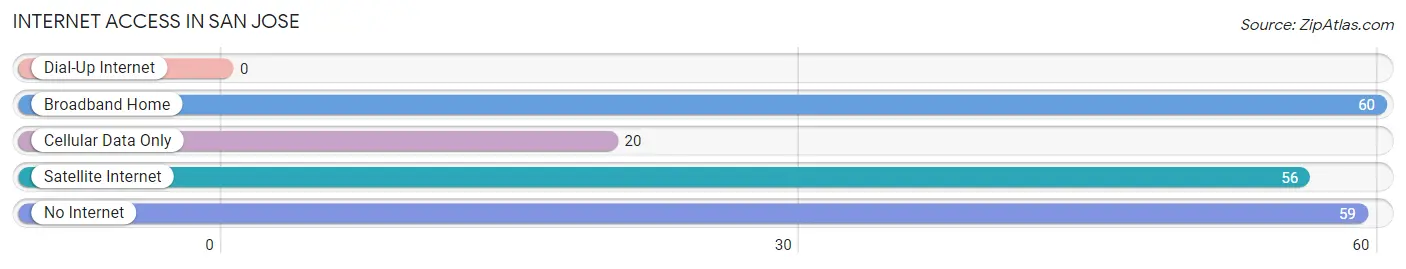
| Internet Type | # Households | % Households |
| Dial-Up Internet | 0 | 0.0% |
| Broadband Home | 60 | 30.8% |
| Cellular Data Only | 20 | 10.3% |
| Satellite Internet | 56 | 28.7% |
| No Internet | 59 | 30.3% |
| Total | 195 | 100.0% |
San Jose Summary
San Jose, Arizona is a small town located in Santa Cruz County, Arizona. It is situated in the Santa Cruz Valley, which is part of the Sonoran Desert. The town is located about 25 miles south of Tucson and is home to a population of approximately 1,500 people.
History
San Jose was founded in 1854 by a group of Mexican settlers who were looking for a place to settle and farm. The town was originally called San Jose de la Frontera, which translates to “St. Joseph of the Frontier.” The settlers were attracted to the area because of its fertile soil and abundant water supply. The town was officially incorporated in 1877 and was named after the patron saint of the settlers, St. Joseph.
In the late 1800s, San Jose was a thriving agricultural community. The town was known for its production of wheat, corn, and other crops. The town also had a thriving livestock industry, with cattle, sheep, and horses being raised in the area.
In the early 1900s, San Jose began to experience a decline in its agricultural industry. This was due to the introduction of new farming techniques and the introduction of new crops, such as cotton and alfalfa. The town also experienced a decline in its population, as many of the settlers moved away to find work in other parts of the state.
Geography
San Jose is located in the Santa Cruz Valley, which is part of the Sonoran Desert. The town is situated at an elevation of 2,400 feet and is surrounded by mountains on all sides. The town is located about 25 miles south of Tucson and is home to a population of approximately 1,500 people.
The climate in San Jose is hot and dry, with temperatures ranging from the mid-90s in the summer to the mid-50s in the winter. The town receives an average of 8 inches of rain per year.
Economy
San Jose’s economy is largely based on agriculture. The town is known for its production of wheat, corn, and other crops. The town also has a thriving livestock industry, with cattle, sheep, and horses being raised in the area.
The town also has a small tourism industry, with visitors coming to the area to enjoy the desert scenery and to visit the nearby San Xavier Mission. The town also has a few small businesses, such as restaurants, shops, and a gas station.
Demographics
As of the 2010 census, San Jose had a population of 1,500 people. The racial makeup of the town was 94.7% White, 0.7% African American, 0.7% Native American, 0.7% Asian, 0.7% from other races, and 2.7% from two or more races. Hispanic or Latino of any race were 4.7% of the population.
The median income for a household in San Jose was $30,000, and the median income for a family was $35,000. The per capita income for the town was $14,000. About 15.7% of families and 18.7% of the population were below the poverty line, including 25.7% of those under age 18 and none of those age 65 or over.
Common Questions
What is the Total Population of San Jose?
Total Population of San Jose is 614.
What is the Total Male Population of San Jose?
Total Male Population of San Jose is 279.
What is the Total Female Population of San Jose?
Total Female Population of San Jose is 335.
What is the Ratio of Males per 100 Females in San Jose?
There are 83.28 Males per 100 Females in San Jose.
What is the Ratio of Females per 100 Males in San Jose?
There are 120.07 Females per 100 Males in San Jose.
What is the Median Population Age in San Jose?
Median Population Age in San Jose is 35.5 Years.
What is the Average Family Size in San Jose
Average Family Size in San Jose is 3.7 People.
What is the Average Household Size in San Jose
Average Household Size in San Jose is 3.1 People.
What is Per Capita Income in San Jose?
Per Capita income in San Jose is $25,860.
What is the Median Family Income in San Jose?
Median Family Income in San Jose is $72,143.
What is the Median Household income in San Jose?
Median Household Income in San Jose is $58,295.
What is Income or Wage Gap in San Jose?
Income or Wage Gap in San Jose is 77.5%.
Women in San Jose earn 22.5 cents for every dollar earned by a man.
What is Inequality or Gini Index in San Jose?
Inequality or Gini Index in San Jose is 0.39.
How Large is the Labor Force in San Jose?
There are 240 People in the Labor Forcein in San Jose.
What is the Percentage of People in the Labor Force in San Jose?
52.9% of People are in the Labor Force in San Jose.
What is the Unemployment Rate in San Jose?
Unemployment Rate in San Jose is 2.1%.