Maricopa, AZ
Maricopa Map
Maricopa Overview
59,605
TOTAL POPULATION
29,359
MALE POPULATION
30,246
FEMALE POPULATION
97.07
MALES / 100 FEMALES
103.02
FEMALES / 100 MALES
35.7
MEDIAN AGE
3.4
AVG FAMILY SIZE
3.2
AVG HOUSEHOLD SIZE
$33,574
PER CAPITA INCOME
$90,720
AVG FAMILY INCOME
$88,795
AVG HOUSEHOLD INCOME
21.2%
WAGE / INCOME GAP [ % ]
78.8¢/ $1
WAGE / INCOME GAP [ $ ]
$11,740
FAMILY INCOME DEFICIT
0.34
INEQUALITY / GINI INDEX
28,895
LABOR FORCE [ PEOPLE ]
64.6%
PERCENT IN LABOR FORCE
3.5%
UNEMPLOYMENT RATE
Maricopa Area Codes
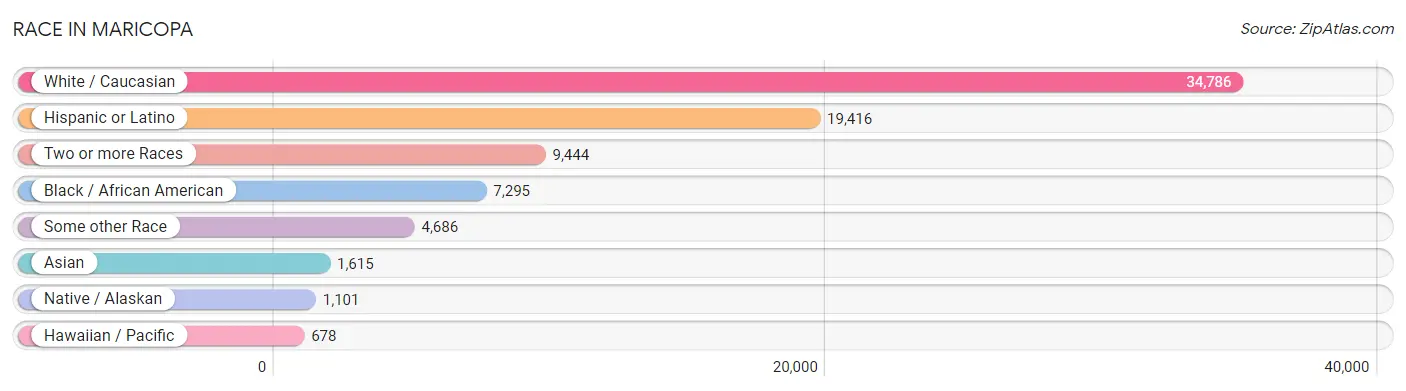
Race in Maricopa
The most populous races in Maricopa are White / Caucasian (34,786 | 58.4%), Hispanic or Latino (19,416 | 32.6%), and Two or more Races (9,444 | 15.8%).
| Race | # Population | % Population |
| Asian | 1,615 | 2.7% |
| Black / African American | 7,295 | 12.2% |
| Hawaiian / Pacific | 678 | 1.1% |
| Hispanic or Latino | 19,416 | 32.6% |
| Native / Alaskan | 1,101 | 1.8% |
| White / Caucasian | 34,786 | 58.4% |
| Two or more Races | 9,444 | 15.8% |
| Some other Race | 4,686 | 7.9% |
| Total | 59,605 | 100.0% |
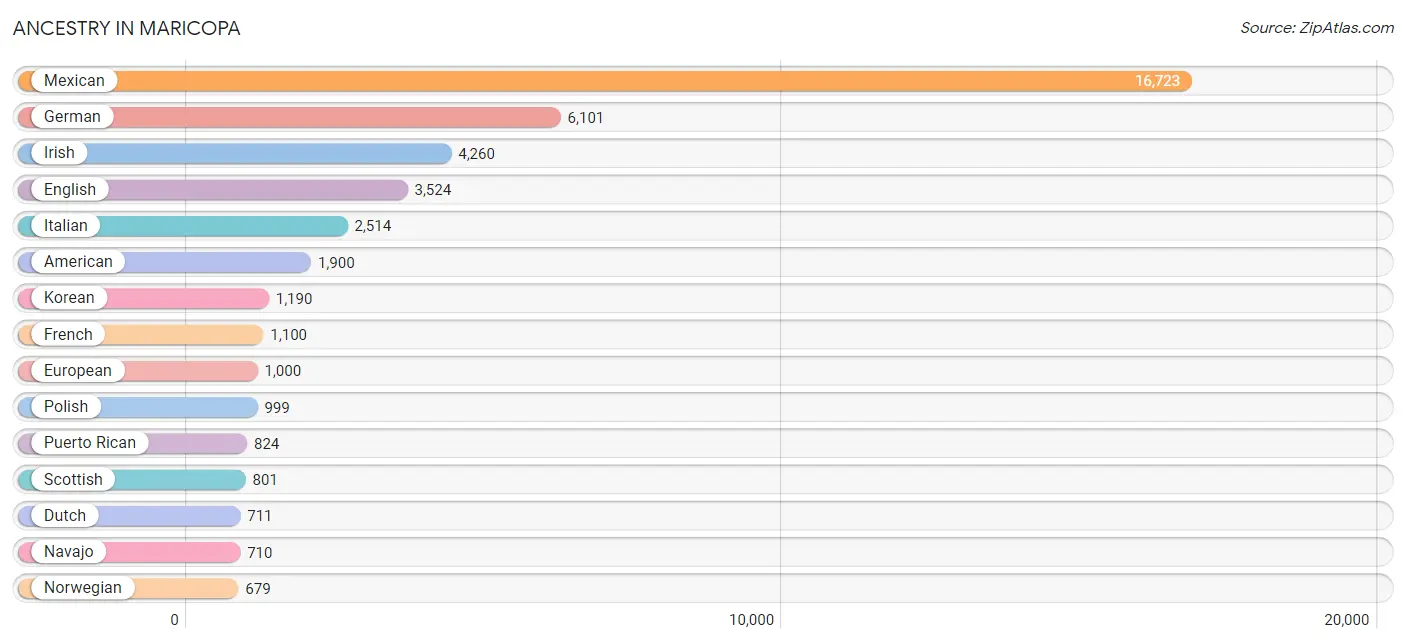
Ancestry in Maricopa
The most populous ancestries reported in Maricopa are Mexican (16,723 | 28.1%), German (6,101 | 10.2%), Irish (4,260 | 7.1%), English (3,524 | 5.9%), and Italian (2,514 | 4.2%), together accounting for 55.6% of all Maricopa residents.
| Ancestry | # Population | % Population |
| African | 356 | 0.6% |
| American | 1,900 | 3.2% |
| Apache | 77 | 0.1% |
| Arab | 193 | 0.3% |
| Armenian | 15 | 0.0% |
| Assyrian / Chaldean / Syriac | 5 | 0.0% |
| Australian | 18 | 0.0% |
| Austrian | 43 | 0.1% |
| Basque | 7 | 0.0% |
| Belgian | 10 | 0.0% |
| Belizean | 30 | 0.1% |
| Bhutanese | 276 | 0.5% |
| Blackfeet | 197 | 0.3% |
| Brazilian | 12 | 0.0% |
| British | 319 | 0.5% |
| Burmese | 409 | 0.7% |
| Cambodian | 23 | 0.0% |
| Canadian | 125 | 0.2% |
| Central American | 509 | 0.9% |
| Central American Indian | 20 | 0.0% |
| Cherokee | 403 | 0.7% |
| Chickasaw | 101 | 0.2% |
| Chilean | 34 | 0.1% |
| Chippewa | 21 | 0.0% |
| Choctaw | 3 | 0.0% |
| Colombian | 45 | 0.1% |
| Comanche | 9 | 0.0% |
| Croatian | 24 | 0.0% |
| Cuban | 181 | 0.3% |
| Czech | 239 | 0.4% |
| Czechoslovakian | 28 | 0.1% |
| Danish | 332 | 0.6% |
| Dutch | 711 | 1.2% |
| Eastern European | 67 | 0.1% |
| Ecuadorian | 142 | 0.2% |
| English | 3,524 | 5.9% |
| European | 1,000 | 1.7% |
| Finnish | 55 | 0.1% |
| French | 1,100 | 1.8% |
| French Canadian | 121 | 0.2% |
| German | 6,101 | 10.2% |
| Greek | 52 | 0.1% |
| Guamanian / Chamorro | 305 | 0.5% |
| Guatemalan | 252 | 0.4% |
| Haitian | 65 | 0.1% |
| Honduran | 87 | 0.2% |
| Hungarian | 155 | 0.3% |
| Indian (Asian) | 209 | 0.4% |
| Iranian | 15 | 0.0% |
| Iraqi | 24 | 0.0% |
| Irish | 4,260 | 7.1% |
| Iroquois | 4 | 0.0% |
| Israeli | 23 | 0.0% |
| Italian | 2,514 | 4.2% |
| Jamaican | 30 | 0.1% |
| Kenyan | 6 | 0.0% |
| Korean | 1,190 | 2.0% |
| Laotian | 152 | 0.3% |
| Latvian | 8 | 0.0% |
| Lebanese | 33 | 0.1% |
| Liberian | 47 | 0.1% |
| Lithuanian | 45 | 0.1% |
| Macedonian | 40 | 0.1% |
| Malaysian | 33 | 0.1% |
| Mexican | 16,723 | 28.1% |
| Mexican American Indian | 34 | 0.1% |
| Native Hawaiian | 520 | 0.9% |
| Navajo | 710 | 1.2% |
| New Zealander | 14 | 0.0% |
| Nicaraguan | 49 | 0.1% |
| Nigerian | 76 | 0.1% |
| Northern European | 60 | 0.1% |
| Norwegian | 679 | 1.1% |
| Osage | 18 | 0.0% |
| Palestinian | 93 | 0.2% |
| Panamanian | 10 | 0.0% |
| Pennsylvania German | 7 | 0.0% |
| Peruvian | 57 | 0.1% |
| Pima | 82 | 0.1% |
| Polish | 999 | 1.7% |
| Portuguese | 73 | 0.1% |
| Pueblo | 44 | 0.1% |
| Puerto Rican | 824 | 1.4% |
| Romanian | 151 | 0.3% |
| Russian | 433 | 0.7% |
| Salvadoran | 81 | 0.1% |
| Samoan | 238 | 0.4% |
| Scandinavian | 354 | 0.6% |
| Scotch-Irish | 174 | 0.3% |
| Scottish | 801 | 1.3% |
| Serbian | 97 | 0.2% |
| Sioux | 71 | 0.1% |
| Slovak | 24 | 0.0% |
| Slovene | 19 | 0.0% |
| South American | 279 | 0.5% |
| Spaniard | 80 | 0.1% |
| Spanish | 263 | 0.4% |
| Sri Lankan | 269 | 0.4% |
| Subsaharan African | 485 | 0.8% |
| Swedish | 497 | 0.8% |
| Swiss | 113 | 0.2% |
| Syrian | 14 | 0.0% |
| Thai | 347 | 0.6% |
| Tohono O'Odham | 79 | 0.1% |
| Tongan | 459 | 0.8% |
| Ukrainian | 126 | 0.2% |
| Venezuelan | 1 | 0.0% |
| Welsh | 201 | 0.3% |
| West Indian | 20 | 0.0% |
| Yaqui | 31 | 0.1% |
| Yugoslavian | 19 | 0.0% |
| Yuman | 73 | 0.1% | View All 112 Rows |
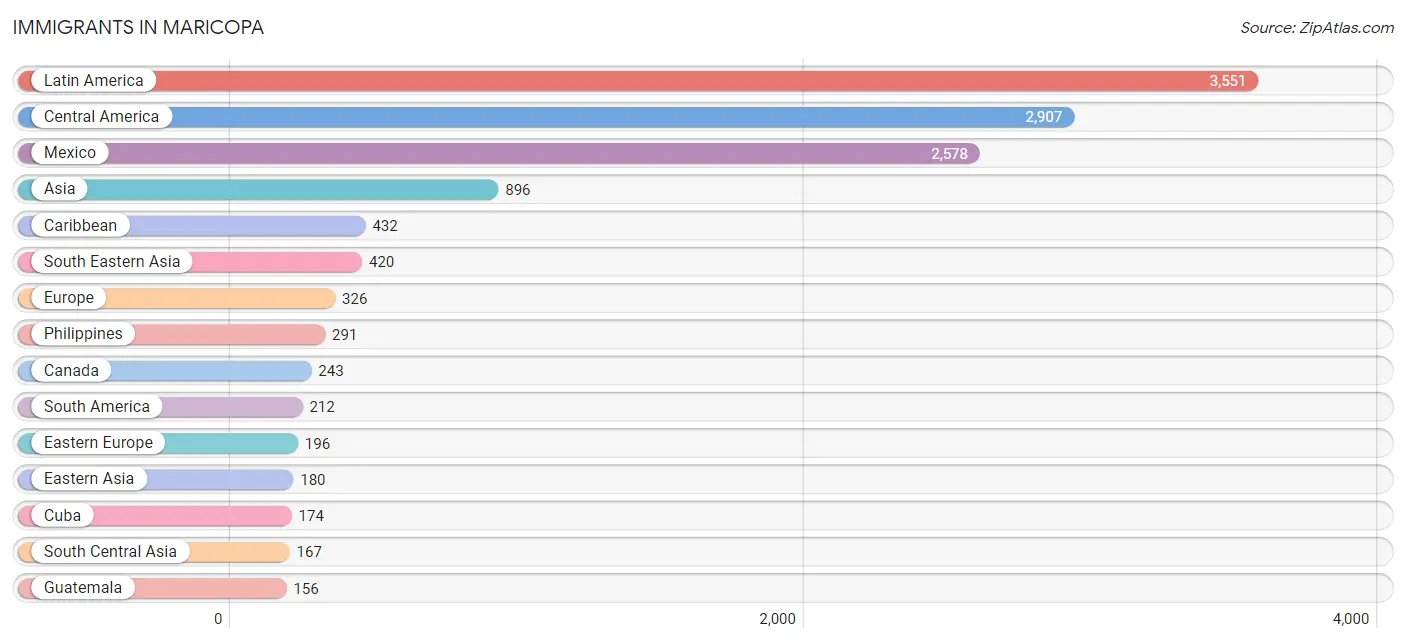
Immigrants in Maricopa
The most numerous immigrant groups reported in Maricopa came from Latin America (3,551 | 6.0%), Central America (2,907 | 4.9%), Mexico (2,578 | 4.3%), Asia (896 | 1.5%), and Caribbean (432 | 0.7%), together accounting for 17.4% of all Maricopa residents.
| Immigration Origin | # Population | % Population |
| Africa | 136 | 0.2% |
| Asia | 896 | 1.5% |
| Australia | 7 | 0.0% |
| Belize | 30 | 0.1% |
| Brazil | 43 | 0.1% |
| Canada | 243 | 0.4% |
| Caribbean | 432 | 0.7% |
| Central America | 2,907 | 4.9% |
| Chile | 34 | 0.1% |
| Colombia | 38 | 0.1% |
| Cuba | 174 | 0.3% |
| Czechoslovakia | 5 | 0.0% |
| Eastern Africa | 22 | 0.0% |
| Eastern Asia | 180 | 0.3% |
| Eastern Europe | 196 | 0.3% |
| Ecuador | 95 | 0.2% |
| El Salvador | 70 | 0.1% |
| England | 16 | 0.0% |
| Europe | 326 | 0.5% |
| Germany | 42 | 0.1% |
| Guatemala | 156 | 0.3% |
| Haiti | 92 | 0.2% |
| Honduras | 61 | 0.1% |
| India | 152 | 0.3% |
| Iran | 8 | 0.0% |
| Iraq | 24 | 0.0% |
| Israel | 23 | 0.0% |
| Italy | 10 | 0.0% |
| Jamaica | 104 | 0.2% |
| Japan | 51 | 0.1% |
| Kenya | 6 | 0.0% |
| Korea | 106 | 0.2% |
| Laos | 52 | 0.1% |
| Latin America | 3,551 | 6.0% |
| Lebanon | 19 | 0.0% |
| Liberia | 47 | 0.1% |
| Malaysia | 5 | 0.0% |
| Mexico | 2,578 | 4.3% |
| Nigeria | 28 | 0.1% |
| Northern Africa | 14 | 0.0% |
| Northern Europe | 66 | 0.1% |
| Oceania | 105 | 0.2% |
| Pakistan | 7 | 0.0% |
| Peru | 2 | 0.0% |
| Philippines | 291 | 0.5% |
| Poland | 87 | 0.2% |
| Portugal | 12 | 0.0% |
| Romania | 47 | 0.1% |
| Russia | 10 | 0.0% |
| Sierra Leone | 24 | 0.0% |
| South America | 212 | 0.4% |
| South Central Asia | 167 | 0.3% |
| South Eastern Asia | 420 | 0.7% |
| Southern Europe | 22 | 0.0% |
| Sweden | 13 | 0.0% |
| Syria | 14 | 0.0% |
| Trinidad and Tobago | 62 | 0.1% |
| Uganda | 8 | 0.0% |
| Ukraine | 20 | 0.0% |
| Vietnam | 72 | 0.1% |
| Western Africa | 99 | 0.2% |
| Western Asia | 80 | 0.1% |
| Western Europe | 42 | 0.1% | View All 63 Rows |
Sex and Age in Maricopa
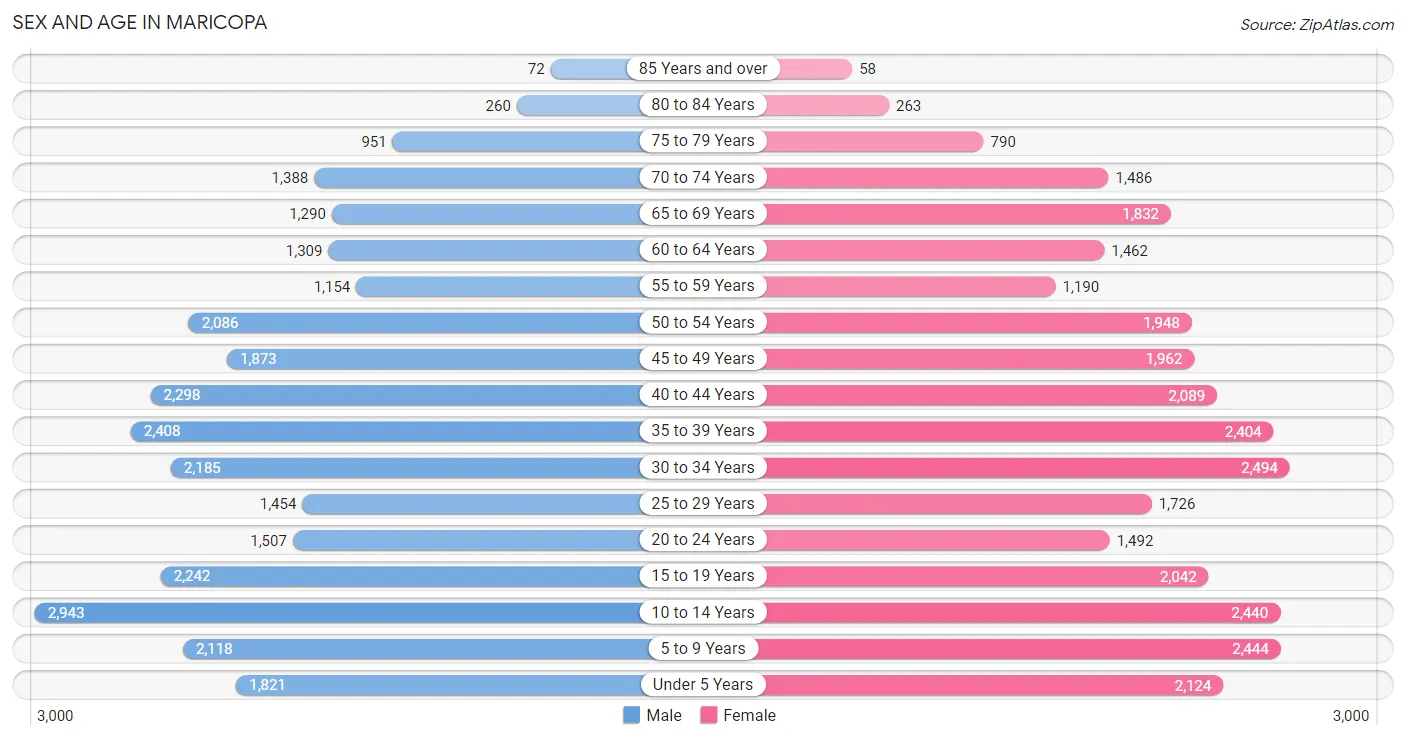
Sex and Age in Maricopa
The most populous age groups in Maricopa are 10 to 14 Years (2,943 | 10.0%) for men and 30 to 34 Years (2,494 | 8.3%) for women.
| Age Bracket | Male | Female |
| Under 5 Years | 1,821 (6.2%) | 2,124 (7.0%) |
| 5 to 9 Years | 2,118 (7.2%) | 2,444 (8.1%) |
| 10 to 14 Years | 2,943 (10.0%) | 2,440 (8.1%) |
| 15 to 19 Years | 2,242 (7.6%) | 2,042 (6.8%) |
| 20 to 24 Years | 1,507 (5.1%) | 1,492 (4.9%) |
| 25 to 29 Years | 1,454 (5.0%) | 1,726 (5.7%) |
| 30 to 34 Years | 2,185 (7.4%) | 2,494 (8.3%) |
| 35 to 39 Years | 2,408 (8.2%) | 2,404 (8.0%) |
| 40 to 44 Years | 2,298 (7.8%) | 2,089 (6.9%) |
| 45 to 49 Years | 1,873 (6.4%) | 1,962 (6.5%) |
| 50 to 54 Years | 2,086 (7.1%) | 1,948 (6.4%) |
| 55 to 59 Years | 1,154 (3.9%) | 1,190 (3.9%) |
| 60 to 64 Years | 1,309 (4.5%) | 1,462 (4.8%) |
| 65 to 69 Years | 1,290 (4.4%) | 1,832 (6.1%) |
| 70 to 74 Years | 1,388 (4.7%) | 1,486 (4.9%) |
| 75 to 79 Years | 951 (3.2%) | 790 (2.6%) |
| 80 to 84 Years | 260 (0.9%) | 263 (0.9%) |
| 85 Years and over | 72 (0.3%) | 58 (0.2%) |
| Total | 29,359 (100.0%) | 30,246 (100.0%) |
Families and Households in Maricopa
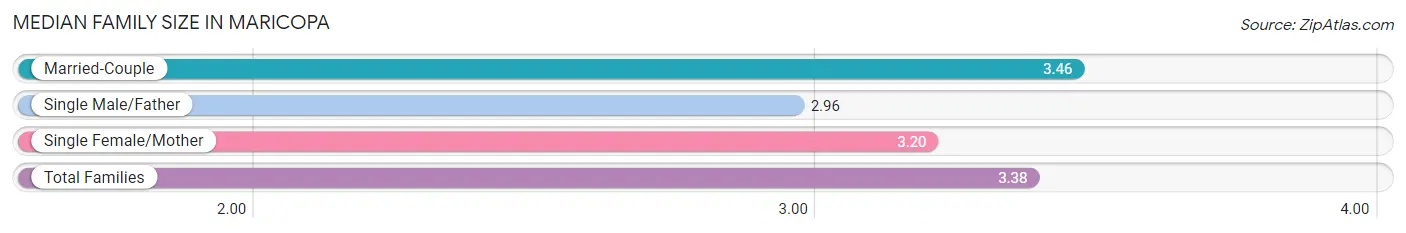
Median Family Size in Maricopa
The median family size in Maricopa is 3.38 persons per family, with married-couple families (11,698 | 76.1%) accounting for the largest median family size of 3.46 persons per family. On the other hand, single male/father families (1,409 | 9.2%) represent the smallest median family size with 2.96 persons per family.
| Family Type | # Families | Family Size |
| Married-Couple | 11,698 (76.1%) | 3.46 |
| Single Male/Father | 1,409 (9.2%) | 2.96 |
| Single Female/Mother | 2,273 (14.8%) | 3.20 |
| Total Families | 15,380 (100.0%) | 3.38 |
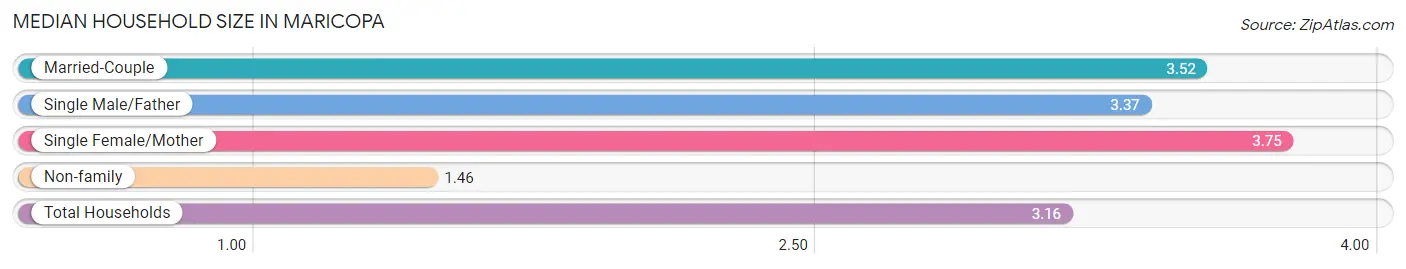
Median Household Size in Maricopa
The median household size in Maricopa is 3.16 persons per household, with single female/mother households (2,273 | 12.0%) accounting for the largest median household size of 3.75 persons per household. non-family households (3,489 | 18.5%) represent the smallest median household size with 1.46 persons per household.
| Household Type | # Households | Household Size |
| Married-Couple | 11,698 (62.0%) | 3.52 |
| Single Male/Father | 1,409 (7.5%) | 3.37 |
| Single Female/Mother | 2,273 (12.0%) | 3.75 |
| Non-family | 3,489 (18.5%) | 1.46 |
| Total Households | 18,869 (100.0%) | 3.16 |
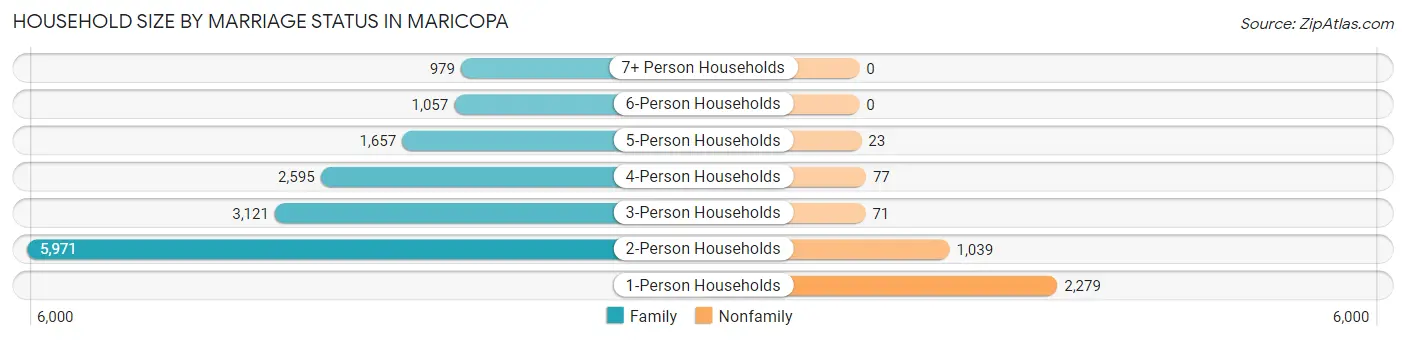
Household Size by Marriage Status in Maricopa
Out of a total of 18,869 households in Maricopa, 15,380 (81.5%) are family households, while 3,489 (18.5%) are nonfamily households. The most numerous type of family households are 2-person households, comprising 5,971, and the most common type of nonfamily households are 1-person households, comprising 2,279.
| Household Size | Family Households | Nonfamily Households |
| 1-Person Households | - | 2,279 (12.1%) |
| 2-Person Households | 5,971 (31.6%) | 1,039 (5.5%) |
| 3-Person Households | 3,121 (16.5%) | 71 (0.4%) |
| 4-Person Households | 2,595 (13.8%) | 77 (0.4%) |
| 5-Person Households | 1,657 (8.8%) | 23 (0.1%) |
| 6-Person Households | 1,057 (5.6%) | 0 (0.0%) |
| 7+ Person Households | 979 (5.2%) | 0 (0.0%) |
| Total | 15,380 (81.5%) | 3,489 (18.5%) |
Female Fertility in Maricopa
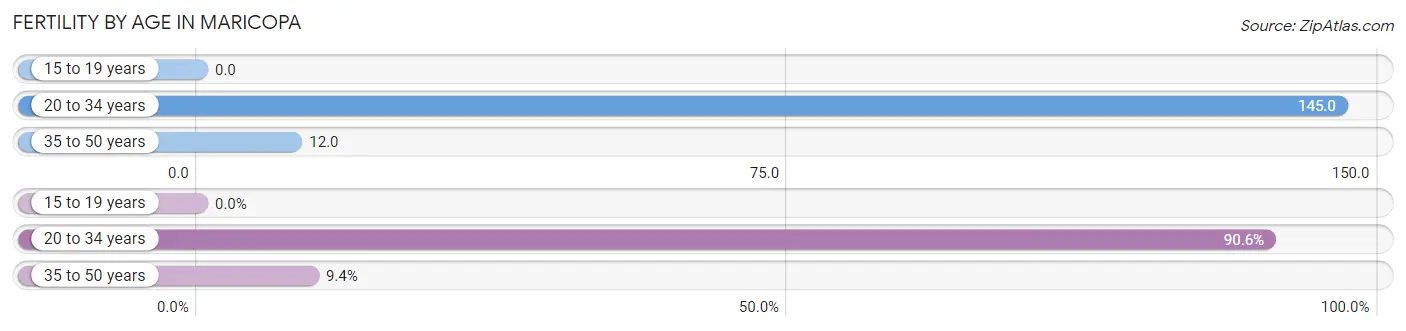
Fertility by Age in Maricopa
Average fertility rate in Maricopa is 62.0 births per 1,000 women. Women in the age bracket of 20 to 34 years have the highest fertility rate with 145.0 births per 1,000 women. Women in the age bracket of 20 to 34 years acount for 90.6% of all women with births.
| Age Bracket | Women with Births | Births / 1,000 Women |
| 15 to 19 years | 0 (0.0%) | 0.0 |
| 20 to 34 years | 828 (90.6%) | 145.0 |
| 35 to 50 years | 86 (9.4%) | 12.0 |
| Total | 914 (100.0%) | 62.0 |
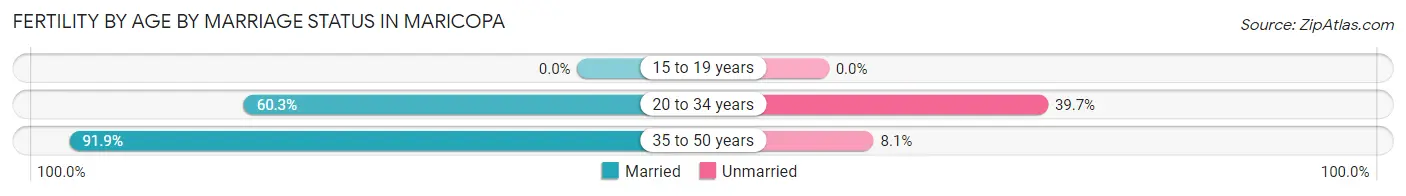
Fertility by Age by Marriage Status in Maricopa
63.2% of women with births (914) in Maricopa are married. The highest percentage of unmarried women with births falls into 20 to 34 years age bracket with 39.7% of them unmarried at the time of birth, while the lowest percentage of unmarried women with births belong to 35 to 50 years age bracket with 8.1% of them unmarried.
| Age Bracket | Married | Unmarried |
| 15 to 19 years | 0 (0.0%) | 0 (0.0%) |
| 20 to 34 years | 499 (60.3%) | 329 (39.7%) |
| 35 to 50 years | 79 (91.9%) | 7 (8.1%) |
| Total | 578 (63.2%) | 336 (36.8%) |
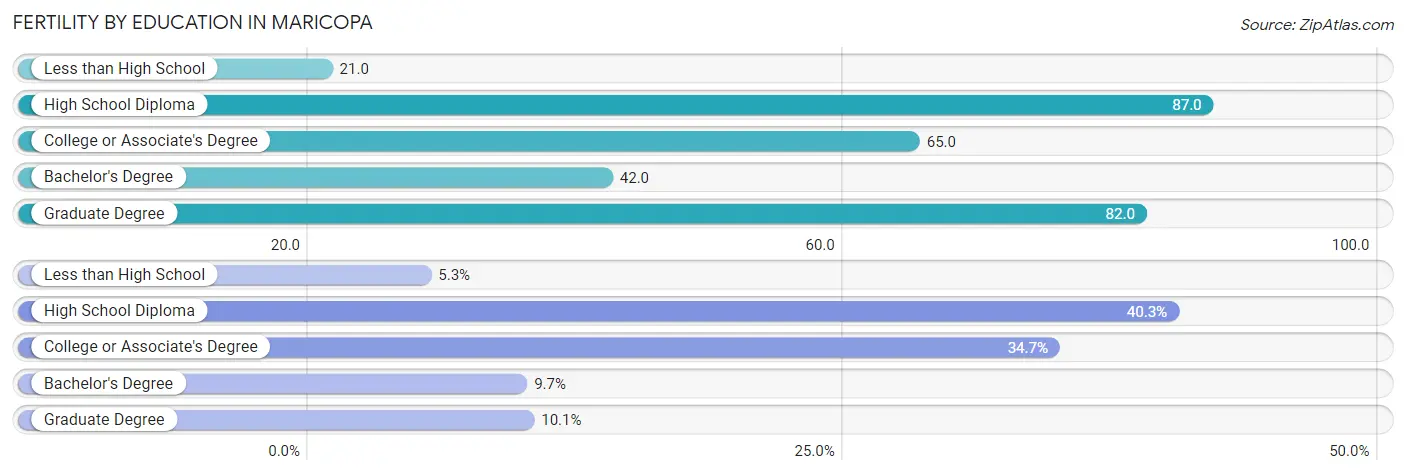
Fertility by Education in Maricopa
Average fertility rate in Maricopa is 62.0 births per 1,000 women. Women with the education attainment of high school diploma have the highest fertility rate of 87.0 births per 1,000 women, while women with the education attainment of less than high school have the lowest fertility at 21.0 births per 1,000 women. Women with the education attainment of high school diploma represent 40.3% of all women with births.
| Educational Attainment | Women with Births | Births / 1,000 Women |
| Less than High School | 48 (5.2%) | 21.0 |
| High School Diploma | 368 (40.3%) | 87.0 |
| College or Associate's Degree | 317 (34.7%) | 65.0 |
| Bachelor's Degree | 89 (9.7%) | 42.0 |
| Graduate Degree | 92 (10.1%) | 82.0 |
| Total | 914 (100.0%) | 62.0 |
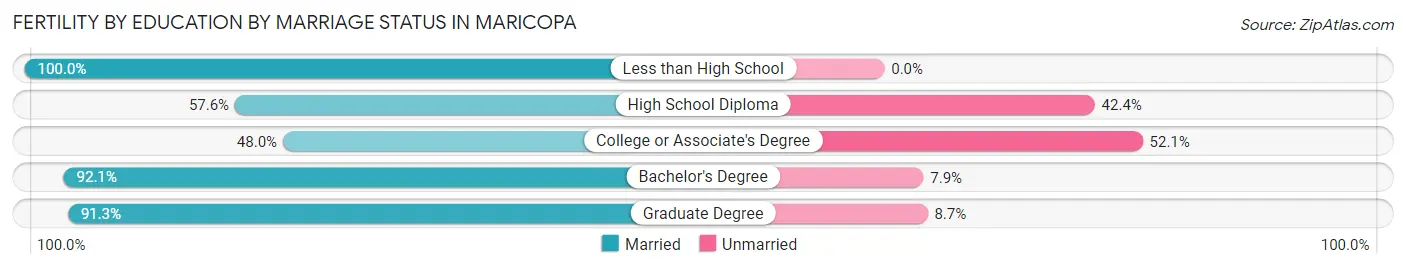
Fertility by Education by Marriage Status in Maricopa
36.8% of women with births in Maricopa are unmarried. Women with the educational attainment of less than high school are most likely to be married with 100.0% of them married at childbirth, while women with the educational attainment of college or associate's degree are least likely to be married with 52.0% of them unmarried at childbirth.
| Educational Attainment | Married | Unmarried |
| Less than High School | 48 (100.0%) | 0 (0.0%) |
| High School Diploma | 212 (57.6%) | 156 (42.4%) |
| College or Associate's Degree | 152 (47.9%) | 165 (52.0%) |
| Bachelor's Degree | 82 (92.1%) | 7 (7.9%) |
| Graduate Degree | 84 (91.3%) | 8 (8.7%) |
| Total | 578 (63.2%) | 336 (36.8%) |
Income in Maricopa
Income Overview in Maricopa
Per Capita Income in Maricopa is $33,574, while median incomes of families and households are $90,720 and $88,795 respectively.
| Characteristic | Number | Measure |
| Per Capita Income | 59,605 | $33,574 |
| Median Family Income | 15,380 | $90,720 |
| Mean Family Income | 15,380 | $104,900 |
| Median Household Income | 18,869 | $88,795 |
| Mean Household Income | 18,869 | $102,330 |
| Income Deficit | 15,380 | $11,740 |
| Wage / Income Gap (%) | 59,605 | 21.23% |
| Wage / Income Gap ($) | 59,605 | 78.77¢ per $1 |
| Gini / Inequality Index | 59,605 | 0.34 |
Earnings by Sex in Maricopa
Average Earnings in Maricopa are $47,469, $53,254 for men and $41,947 for women, a difference of 21.2%.
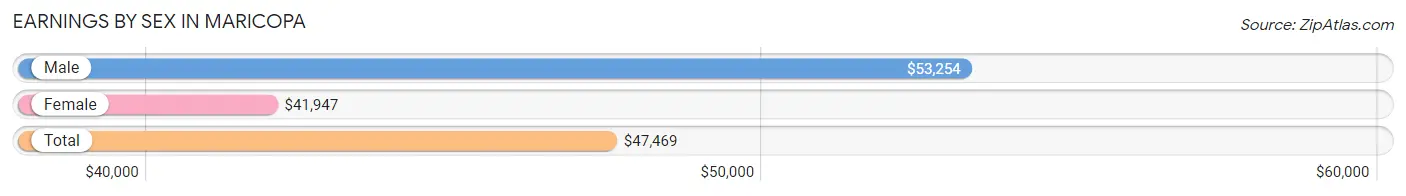
| Sex | Number | Average Earnings |
| Male | 16,120 (54.1%) | $53,254 |
| Female | 13,648 (45.9%) | $41,947 |
| Total | 29,768 (100.0%) | $47,469 |
Earnings by Sex by Income Bracket in Maricopa
The most common earnings brackets in Maricopa are $100,000+ for men (2,519 | 15.6%) and $40,000 to $44,999 for women (1,191 | 8.7%).
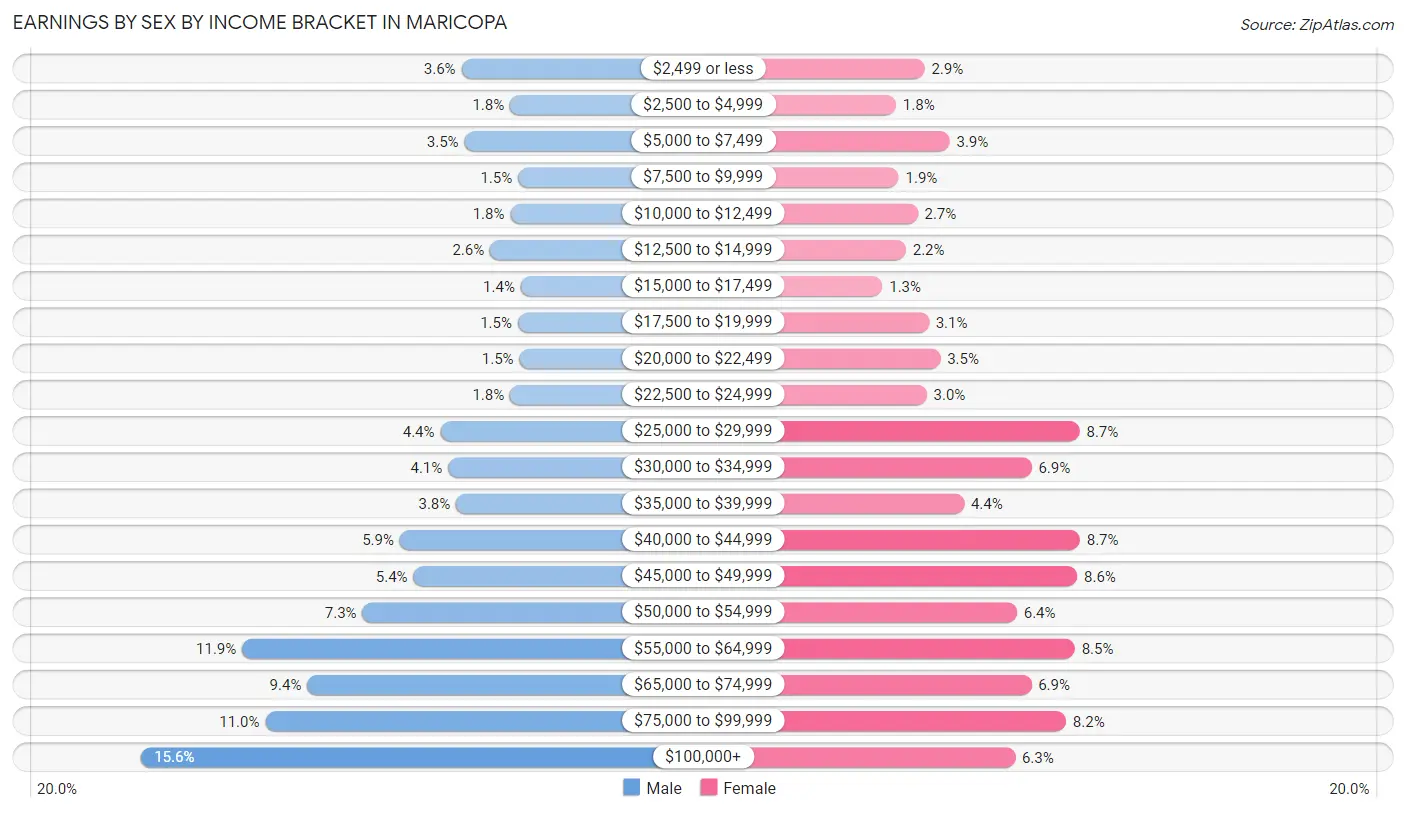
| Income | Male | Female |
| $2,499 or less | 585 (3.6%) | 397 (2.9%) |
| $2,500 to $4,999 | 292 (1.8%) | 251 (1.8%) |
| $5,000 to $7,499 | 567 (3.5%) | 525 (3.8%) |
| $7,500 to $9,999 | 244 (1.5%) | 265 (1.9%) |
| $10,000 to $12,499 | 290 (1.8%) | 362 (2.6%) |
| $12,500 to $14,999 | 412 (2.6%) | 301 (2.2%) |
| $15,000 to $17,499 | 227 (1.4%) | 181 (1.3%) |
| $17,500 to $19,999 | 245 (1.5%) | 419 (3.1%) |
| $20,000 to $22,499 | 236 (1.5%) | 478 (3.5%) |
| $22,500 to $24,999 | 292 (1.8%) | 408 (3.0%) |
| $25,000 to $29,999 | 712 (4.4%) | 1,190 (8.7%) |
| $30,000 to $34,999 | 666 (4.1%) | 944 (6.9%) |
| $35,000 to $39,999 | 618 (3.8%) | 599 (4.4%) |
| $40,000 to $44,999 | 958 (5.9%) | 1,191 (8.7%) |
| $45,000 to $49,999 | 875 (5.4%) | 1,178 (8.6%) |
| $50,000 to $54,999 | 1,184 (7.3%) | 870 (6.4%) |
| $55,000 to $64,999 | 1,911 (11.8%) | 1,165 (8.5%) |
| $65,000 to $74,999 | 1,517 (9.4%) | 943 (6.9%) |
| $75,000 to $99,999 | 1,770 (11.0%) | 1,121 (8.2%) |
| $100,000+ | 2,519 (15.6%) | 860 (6.3%) |
| Total | 16,120 (100.0%) | 13,648 (100.0%) |
Earnings by Sex by Educational Attainment in Maricopa
Average earnings in Maricopa are $58,628 for men and $45,357 for women, a difference of 22.6%. Men with an educational attainment of graduate degree enjoy the highest average annual earnings of $91,652, while those with less than high school education earn the least with $44,223. Women with an educational attainment of graduate degree earn the most with the average annual earnings of $61,678, while those with less than high school education have the smallest earnings of $30,240.
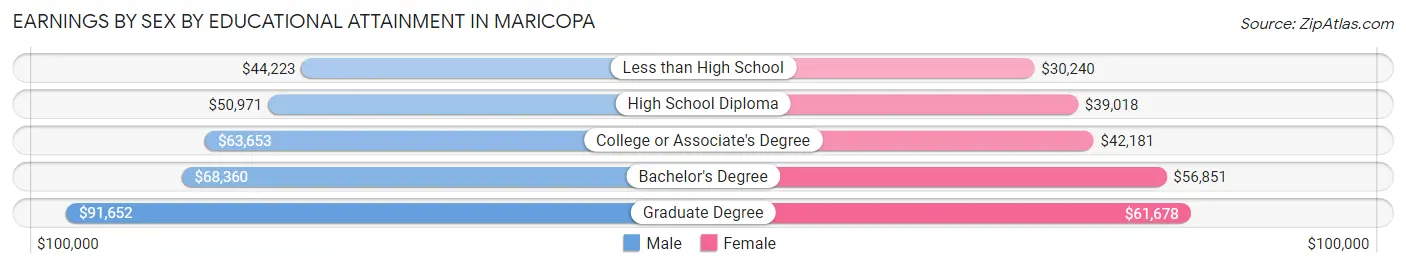
| Educational Attainment | Male Income | Female Income |
| Less than High School | $44,223 | $30,240 |
| High School Diploma | $50,971 | $39,018 |
| College or Associate's Degree | $63,653 | $42,181 |
| Bachelor's Degree | $68,360 | $56,851 |
| Graduate Degree | $91,652 | $61,678 |
| Total | $58,628 | $45,357 |
Family Income in Maricopa
Family Income Brackets in Maricopa
According to the Maricopa family income data, there are 4,076 families falling into the $100,000 to $149,999 income range, which is the most common income bracket and makes up 26.5% of all families. Conversely, the $10,000 to $14,999 income bracket is the least frequent group with only 169 families (1.1%) belonging to this category.
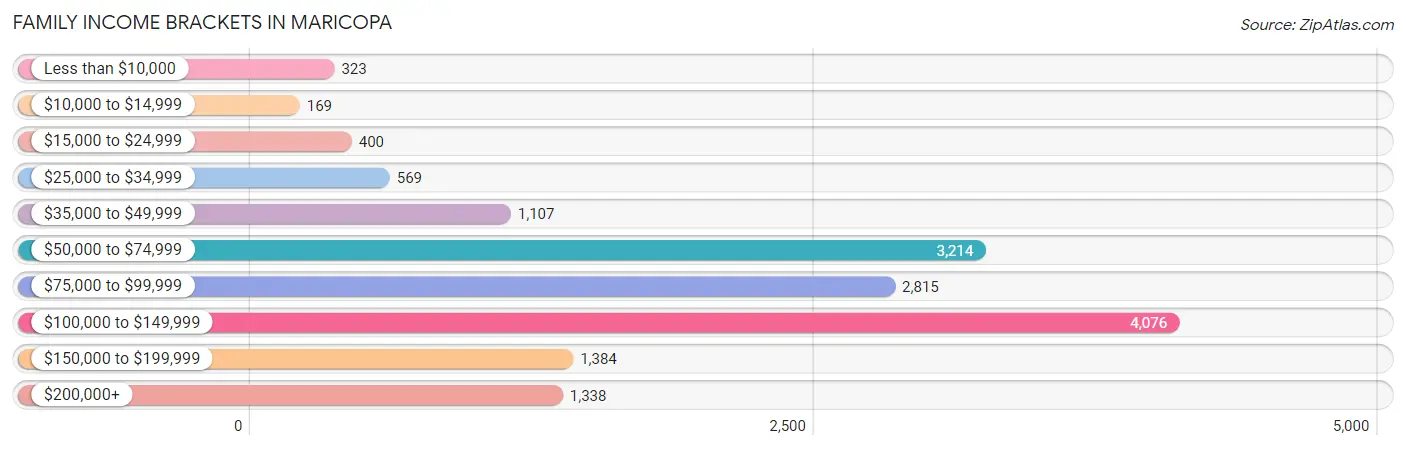
| Income Bracket | # Families | % Families |
| Less than $10,000 | 323 | 2.1% |
| $10,000 to $14,999 | 169 | 1.1% |
| $15,000 to $24,999 | 400 | 2.6% |
| $25,000 to $34,999 | 569 | 3.7% |
| $35,000 to $49,999 | 1,107 | 7.2% |
| $50,000 to $74,999 | 3,214 | 20.9% |
| $75,000 to $99,999 | 2,815 | 18.3% |
| $100,000 to $149,999 | 4,076 | 26.5% |
| $150,000 to $199,999 | 1,384 | 9.0% |
| $200,000+ | 1,338 | 8.7% |
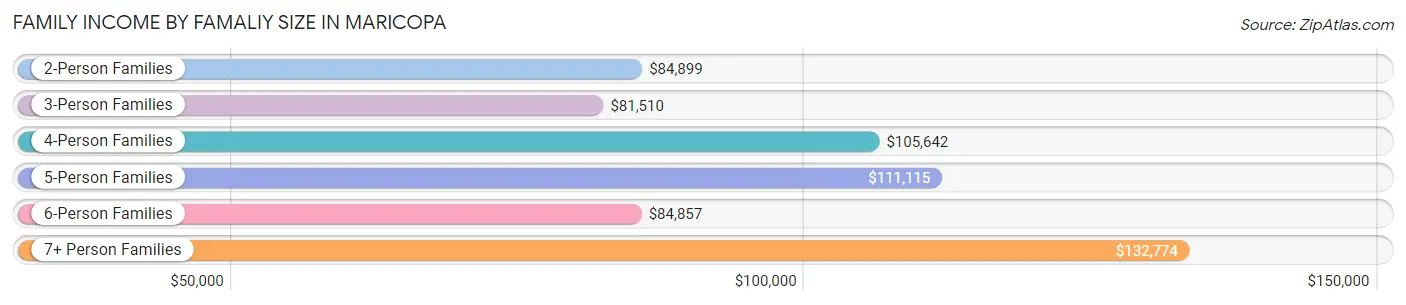
Family Income by Famaliy Size in Maricopa
7+ person families (822 | 5.3%) account for the highest median family income in Maricopa with $132,774 per family, while 2-person families (6,706 | 43.6%) have the highest median income of $42,450 per family member.
| Income Bracket | # Families | Median Income |
| 2-Person Families | 6,706 (43.6%) | $84,899 |
| 3-Person Families | 2,977 (19.4%) | $81,510 |
| 4-Person Families | 2,386 (15.5%) | $105,642 |
| 5-Person Families | 1,365 (8.9%) | $111,115 |
| 6-Person Families | 1,124 (7.3%) | $84,857 |
| 7+ Person Families | 822 (5.3%) | $132,774 |
| Total | 15,380 (100.0%) | $90,720 |
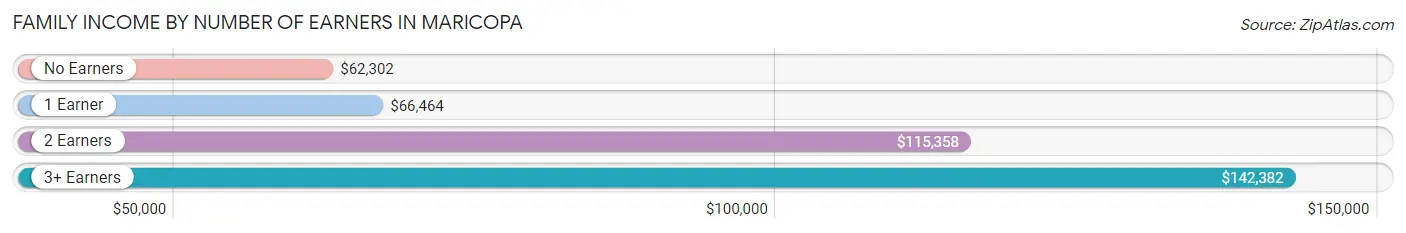
Family Income by Number of Earners in Maricopa
The median family income in Maricopa is $90,720, with families comprising 3+ earners (1,861) having the highest median family income of $142,382, while families with no earners (2,268) have the lowest median family income of $62,302, accounting for 12.1% and 14.7% of families, respectively.
| Number of Earners | # Families | Median Income |
| No Earners | 2,268 (14.7%) | $62,302 |
| 1 Earner | 5,376 (34.9%) | $66,464 |
| 2 Earners | 5,875 (38.2%) | $115,358 |
| 3+ Earners | 1,861 (12.1%) | $142,382 |
| Total | 15,380 (100.0%) | $90,720 |
Household Income in Maricopa
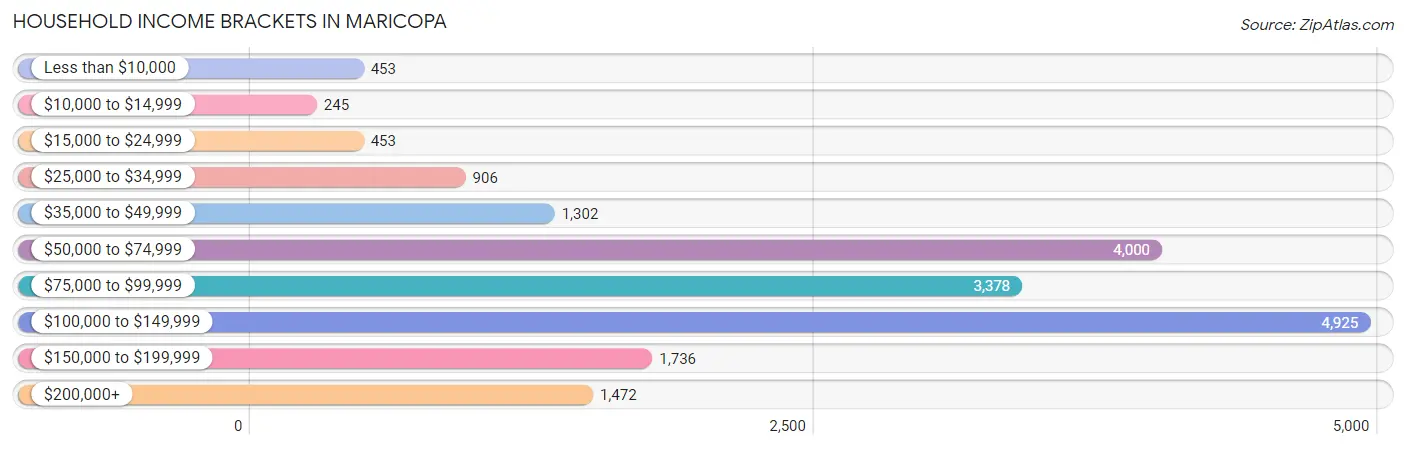
Household Income Brackets in Maricopa
With 4,925 households falling in the category, the $100,000 to $149,999 income range is the most frequent in Maricopa, accounting for 26.1% of all households. In contrast, only 245 households (1.3%) fall into the $10,000 to $14,999 income bracket, making it the least populous group.
| Income Bracket | # Households | % Households |
| Less than $10,000 | 453 | 2.4% |
| $10,000 to $14,999 | 245 | 1.3% |
| $15,000 to $24,999 | 453 | 2.4% |
| $25,000 to $34,999 | 906 | 4.8% |
| $35,000 to $49,999 | 1,302 | 6.9% |
| $50,000 to $74,999 | 4,000 | 21.2% |
| $75,000 to $99,999 | 3,378 | 17.9% |
| $100,000 to $149,999 | 4,925 | 26.1% |
| $150,000 to $199,999 | 1,736 | 9.2% |
| $200,000+ | 1,472 | 7.8% |
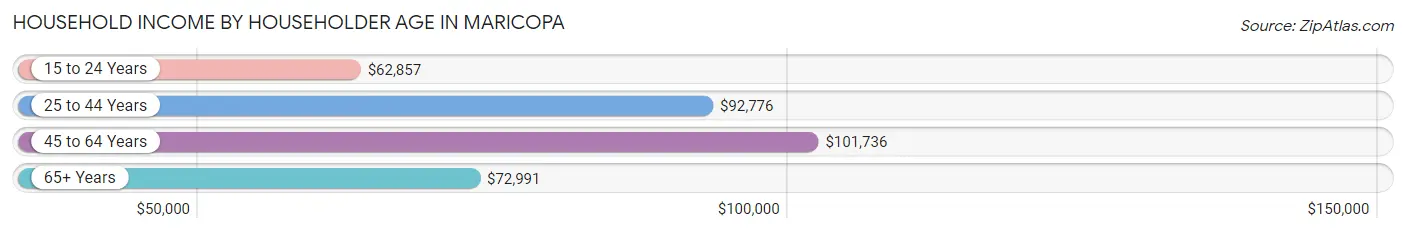
Household Income by Householder Age in Maricopa
The median household income in Maricopa is $88,795, with the highest median household income of $101,736 found in the 45 to 64 years age bracket for the primary householder. A total of 6,228 households (33.0%) fall into this category. Meanwhile, the 15 to 24 years age bracket for the primary householder has the lowest median household income of $62,857, with 262 households (1.4%) in this group.
| Income Bracket | # Households | Median Income |
| 15 to 24 Years | 262 (1.4%) | $62,857 |
| 25 to 44 Years | 7,880 (41.8%) | $92,776 |
| 45 to 64 Years | 6,228 (33.0%) | $101,736 |
| 65+ Years | 4,499 (23.8%) | $72,991 |
| Total | 18,869 (100.0%) | $88,795 |
Poverty in Maricopa
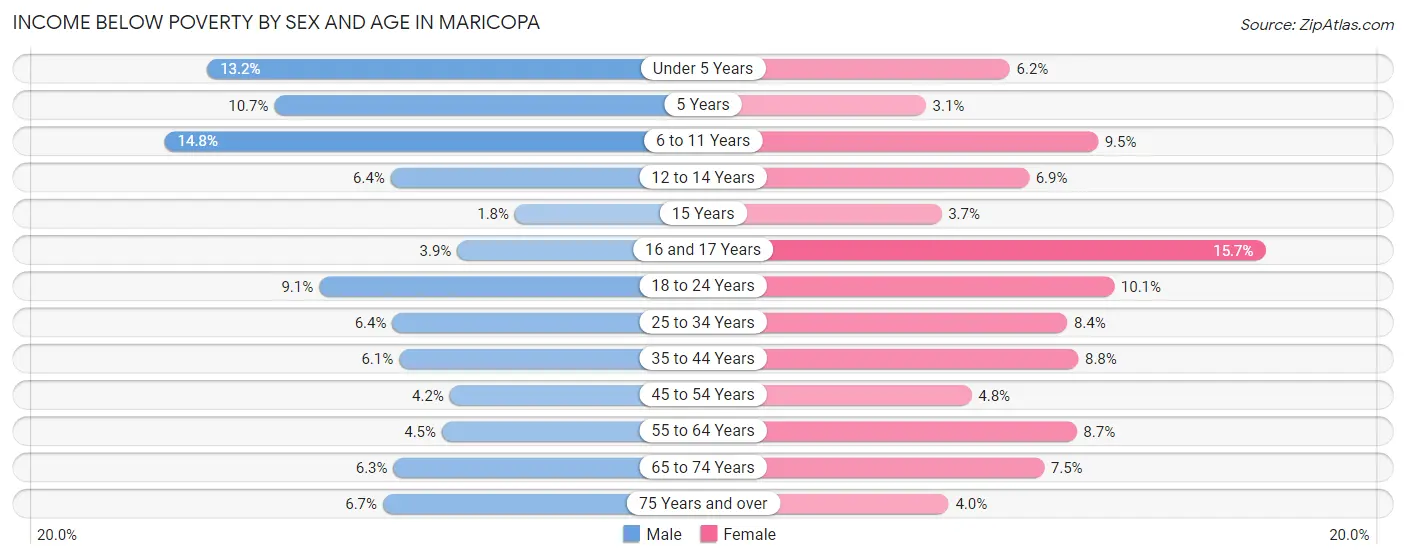
Income Below Poverty by Sex and Age in Maricopa
With 7.2% poverty level for males and 7.8% for females among the residents of Maricopa, 6 to 11 year old males and 16 and 17 year old females are the most vulnerable to poverty, with 376 males (14.8%) and 130 females (15.7%) in their respective age groups living below the poverty level.
| Age Bracket | Male | Female |
| Under 5 Years | 219 (13.2%) | 127 (6.2%) |
| 5 Years | 57 (10.7%) | 7 (3.1%) |
| 6 to 11 Years | 376 (14.8%) | 282 (9.5%) |
| 12 to 14 Years | 112 (6.4%) | 105 (6.9%) |
| 15 Years | 7 (1.8%) | 22 (3.7%) |
| 16 and 17 Years | 39 (3.9%) | 130 (15.7%) |
| 18 to 24 Years | 215 (9.1%) | 213 (10.1%) |
| 25 to 34 Years | 231 (6.4%) | 353 (8.4%) |
| 35 to 44 Years | 287 (6.1%) | 394 (8.8%) |
| 45 to 54 Years | 167 (4.2%) | 188 (4.8%) |
| 55 to 64 Years | 111 (4.5%) | 231 (8.7%) |
| 65 to 74 Years | 169 (6.3%) | 249 (7.5%) |
| 75 Years and over | 86 (6.7%) | 44 (4.0%) |
| Total | 2,076 (7.2%) | 2,345 (7.8%) |
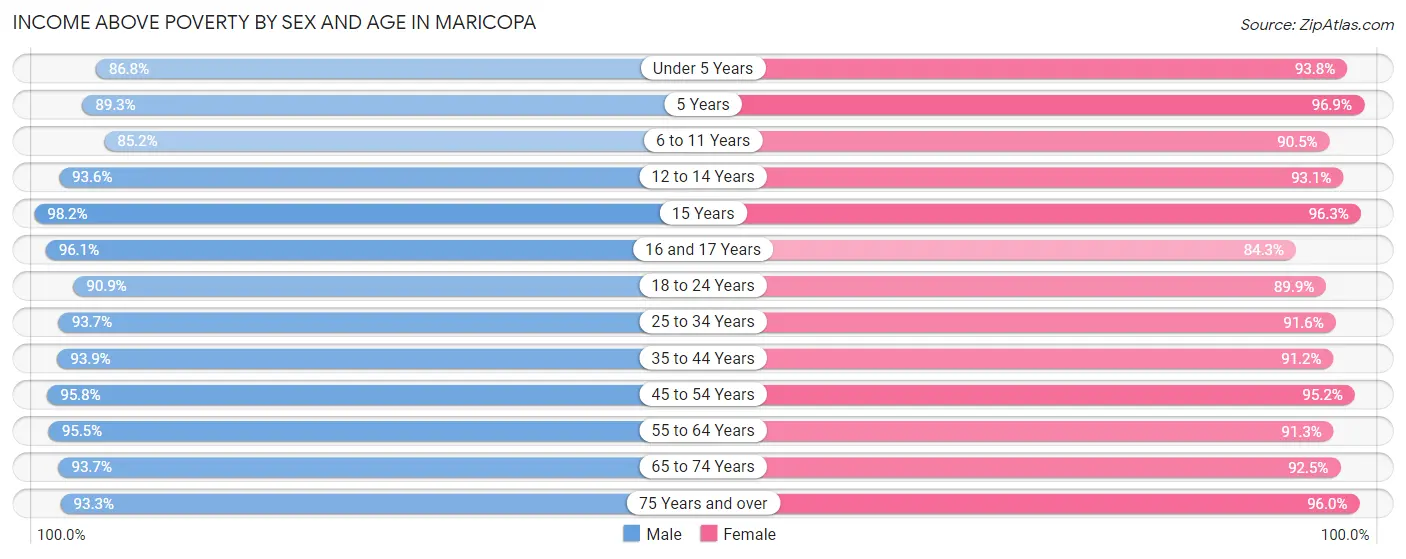
Income Above Poverty by Sex and Age in Maricopa
According to the poverty statistics in Maricopa, males aged 15 years and females aged 5 years are the age groups that are most secure financially, with 98.2% of males and 96.9% of females in these age groups living above the poverty line.
| Age Bracket | Male | Female |
| Under 5 Years | 1,437 (86.8%) | 1,912 (93.8%) |
| 5 Years | 474 (89.3%) | 218 (96.9%) |
| 6 to 11 Years | 2,164 (85.2%) | 2,685 (90.5%) |
| 12 to 14 Years | 1,636 (93.6%) | 1,407 (93.1%) |
| 15 Years | 382 (98.2%) | 575 (96.3%) |
| 16 and 17 Years | 951 (96.1%) | 697 (84.3%) |
| 18 to 24 Years | 2,155 (90.9%) | 1,896 (89.9%) |
| 25 to 34 Years | 3,408 (93.6%) | 3,867 (91.6%) |
| 35 to 44 Years | 4,419 (93.9%) | 4,099 (91.2%) |
| 45 to 54 Years | 3,792 (95.8%) | 3,722 (95.2%) |
| 55 to 64 Years | 2,352 (95.5%) | 2,421 (91.3%) |
| 65 to 74 Years | 2,509 (93.7%) | 3,069 (92.5%) |
| 75 Years and over | 1,197 (93.3%) | 1,067 (96.0%) |
| Total | 26,876 (92.8%) | 27,635 (92.2%) |
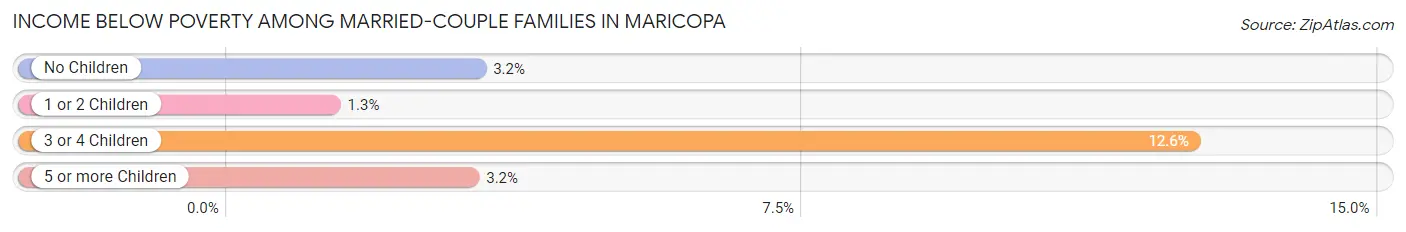
Income Below Poverty Among Married-Couple Families in Maricopa
The poverty statistics for married-couple families in Maricopa show that 4.0% or 469 of the total 11,698 families live below the poverty line. Families with 3 or 4 children have the highest poverty rate of 12.6%, comprising of 210 families. On the other hand, families with 1 or 2 children have the lowest poverty rate of 1.3%, which includes 46 families.
| Children | Above Poverty | Below Poverty |
| No Children | 6,070 (96.8%) | 203 (3.2%) |
| 1 or 2 Children | 3,392 (98.7%) | 46 (1.3%) |
| 3 or 4 Children | 1,460 (87.4%) | 210 (12.6%) |
| 5 or more Children | 307 (96.9%) | 10 (3.2%) |
| Total | 11,229 (96.0%) | 469 (4.0%) |
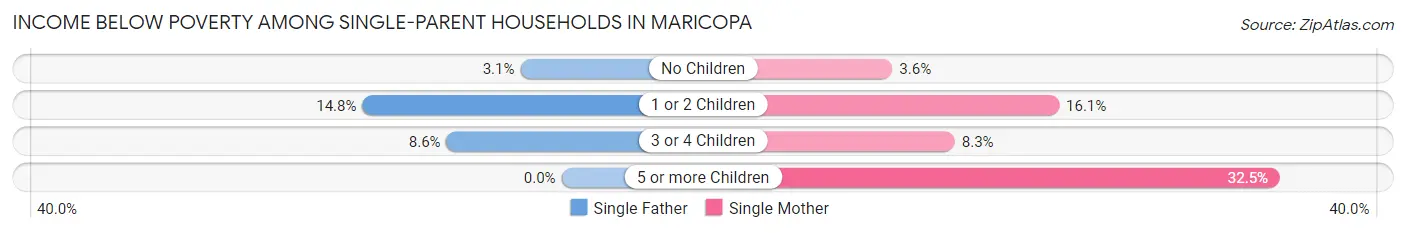
Income Below Poverty Among Single-Parent Households in Maricopa
According to the poverty data in Maricopa, 11.1% or 156 single-father households and 12.1% or 276 single-mother households are living below the poverty line. Among single-father households, those with 1 or 2 children have the highest poverty rate, with 135 households (14.8%) experiencing poverty. Likewise, among single-mother households, those with 5 or more children have the highest poverty rate, with 13 households (32.5%) falling below the poverty line.
| Children | Single Father | Single Mother |
| No Children | 12 (3.1%) | 24 (3.6%) |
| 1 or 2 Children | 135 (14.8%) | 225 (16.1%) |
| 3 or 4 Children | 9 (8.6%) | 14 (8.3%) |
| 5 or more Children | 0 (0.0%) | 13 (32.5%) |
| Total | 156 (11.1%) | 276 (12.1%) |
Income Below Poverty Among Married-Couple vs Single-Parent Households in Maricopa
The poverty data for Maricopa shows that 469 of the married-couple family households (4.0%) and 432 of the single-parent households (11.7%) are living below the poverty level. Within the married-couple family households, those with 3 or 4 children have the highest poverty rate, with 210 households (12.6%) falling below the poverty line. Among the single-parent households, those with 5 or more children have the highest poverty rate, with 13 household (30.2%) living below poverty.
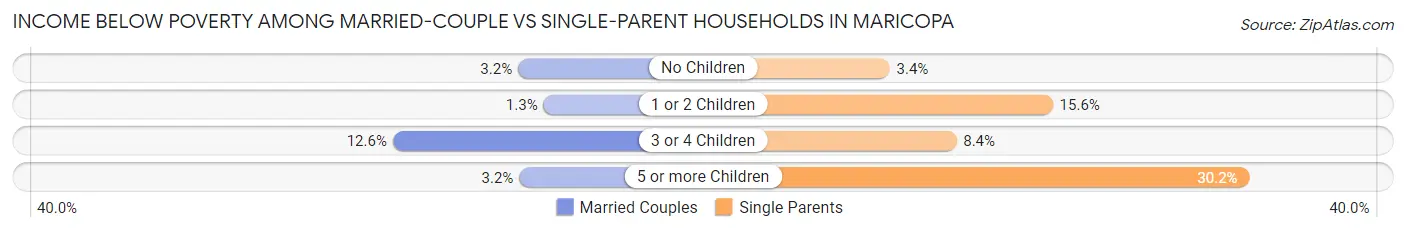
| Children | Married-Couple Families | Single-Parent Households |
| No Children | 203 (3.2%) | 36 (3.4%) |
| 1 or 2 Children | 46 (1.3%) | 360 (15.6%) |
| 3 or 4 Children | 210 (12.6%) | 23 (8.4%) |
| 5 or more Children | 10 (3.2%) | 13 (30.2%) |
| Total | 469 (4.0%) | 432 (11.7%) |
Employment Characteristics in Maricopa
Employment by Class of Employer in Maricopa
Among the 27,333 employed individuals in Maricopa, private company employees (19,981 | 73.1%), local government employees (1,909 | 7.0%), and not-for-profit organizations (1,770 | 6.5%) make up the most common classes of employment.
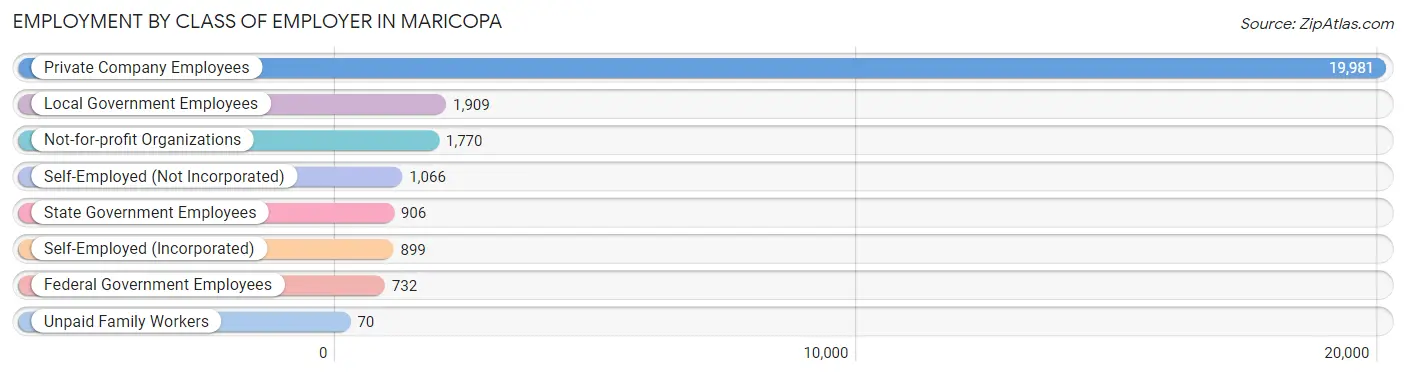
| Employer Class | # Employees | % Employees |
| Private Company Employees | 19,981 | 73.1% |
| Self-Employed (Incorporated) | 899 | 3.3% |
| Self-Employed (Not Incorporated) | 1,066 | 3.9% |
| Not-for-profit Organizations | 1,770 | 6.5% |
| Local Government Employees | 1,909 | 7.0% |
| State Government Employees | 906 | 3.3% |
| Federal Government Employees | 732 | 2.7% |
| Unpaid Family Workers | 70 | 0.3% |
| Total | 27,333 | 100.0% |
Employment Status by Age in Maricopa
According to the labor force statistics for Maricopa, out of the total population over 16 years of age (44,729), 64.6% or 28,895 individuals are in the labor force, with 3.5% or 1,011 of them unemployed. The age group with the highest labor force participation rate is 35 to 44 years, with 86.4% or 7,948 individuals in the labor force. Within the labor force, the 75 years and over age range has the highest percentage of unemployed individuals, with 49.8% or 100 of them being unemployed.
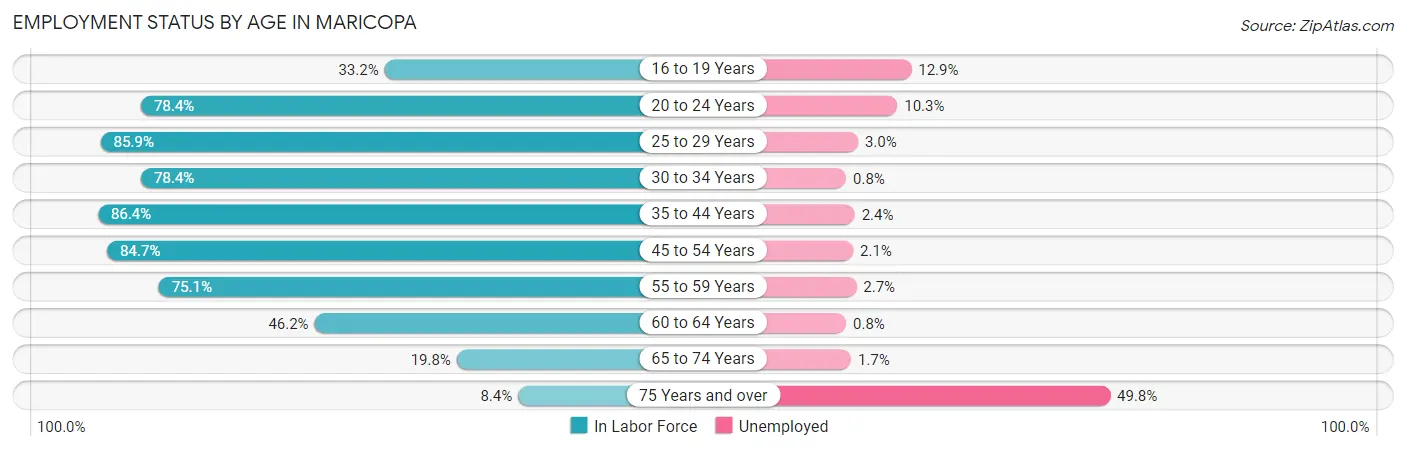
| Age Bracket | In Labor Force | Unemployed |
| 16 to 19 Years | 1,095 (33.2%) | 141 (12.9%) |
| 20 to 24 Years | 2,351 (78.4%) | 242 (10.3%) |
| 25 to 29 Years | 2,732 (85.9%) | 82 (3.0%) |
| 30 to 34 Years | 3,668 (78.4%) | 29 (0.8%) |
| 35 to 44 Years | 7,948 (86.4%) | 191 (2.4%) |
| 45 to 54 Years | 6,665 (84.7%) | 140 (2.1%) |
| 55 to 59 Years | 1,760 (75.1%) | 48 (2.7%) |
| 60 to 64 Years | 1,280 (46.2%) | 10 (0.8%) |
| 65 to 74 Years | 1,187 (19.8%) | 20 (1.7%) |
| 75 Years and over | 201 (8.4%) | 100 (49.8%) |
| Total | 28,895 (64.6%) | 1,011 (3.5%) |
Employment Status by Educational Attainment in Maricopa
According to labor force statistics for Maricopa, 80.1% of individuals (24,064) out of the total population between 25 and 64 years of age (30,042) are in the labor force, with 2.1% or 505 of them being unemployed. The group with the highest labor force participation rate are those with the educational attainment of bachelor's degree or higher, with 85.7% or 6,094 individuals in the labor force. Within the labor force, individuals with high school diploma education have the highest percentage of unemployment, with 3.0% or 213 of them being unemployed.
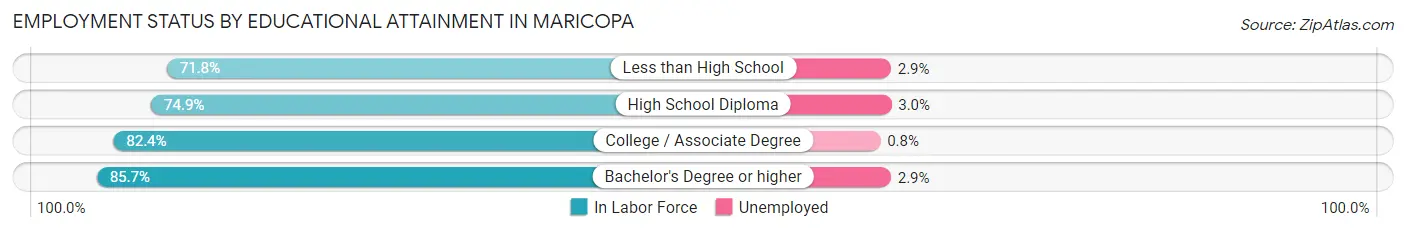
| Educational Attainment | In Labor Force | Unemployed |
| Less than High School | 1,469 (71.8%) | 59 (2.9%) |
| High School Diploma | 7,088 (74.9%) | 284 (3.0%) |
| College / Associate Degree | 9,412 (82.4%) | 91 (0.8%) |
| Bachelor's Degree or higher | 6,094 (85.7%) | 206 (2.9%) |
| Total | 24,064 (80.1%) | 631 (2.1%) |
Employment Occupations by Sex in Maricopa
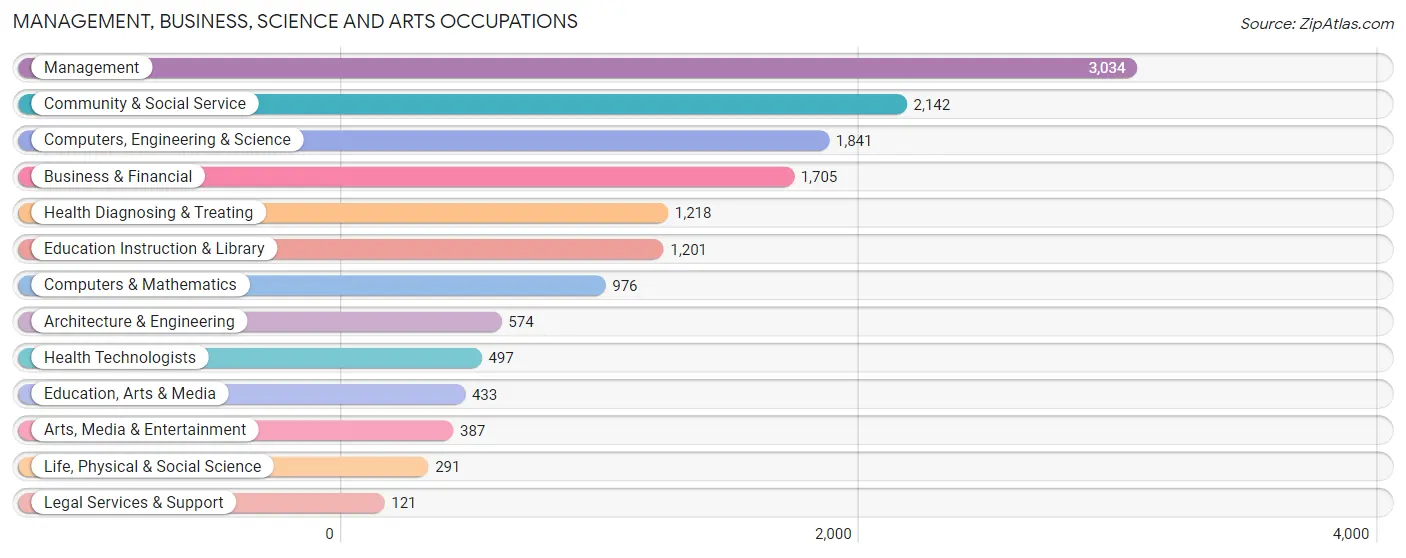
Management, Business, Science and Arts Occupations
The most common Management, Business, Science and Arts occupations in Maricopa are Management (3,034 | 10.9%), Community & Social Service (2,142 | 7.7%), Computers, Engineering & Science (1,841 | 6.6%), Business & Financial (1,705 | 6.1%), and Health Diagnosing & Treating (1,218 | 4.4%).
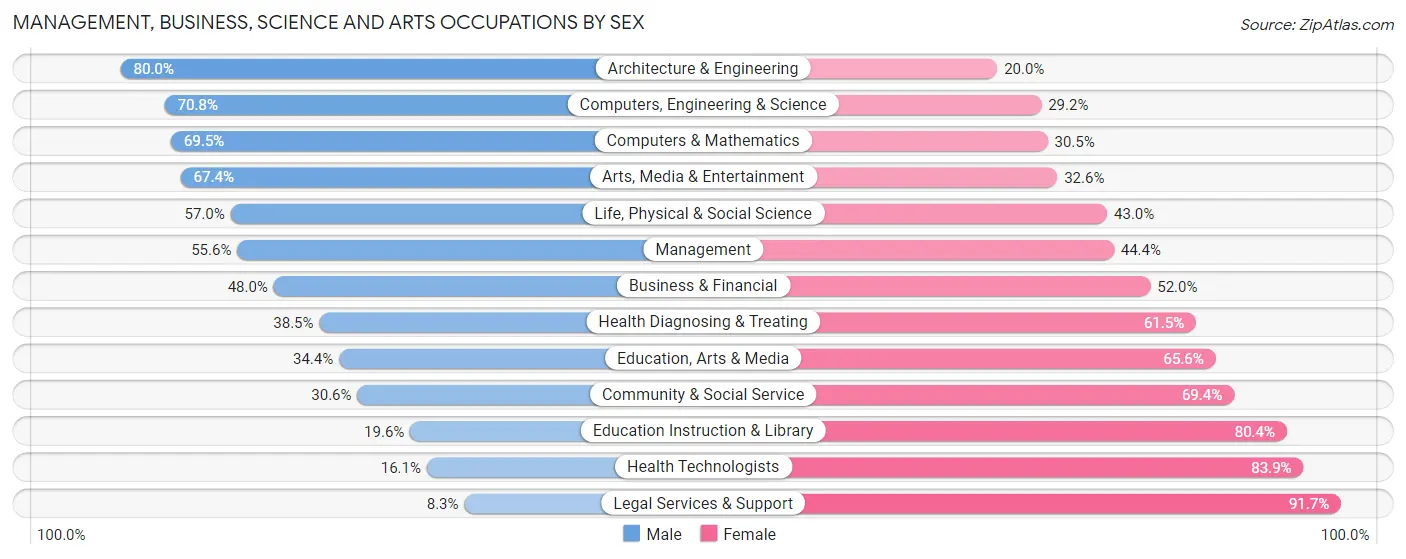
Management, Business, Science and Arts Occupations by Sex
Within the Management, Business, Science and Arts occupations in Maricopa, the most male-oriented occupations are Architecture & Engineering (80.0%), Computers, Engineering & Science (70.8%), and Computers & Mathematics (69.5%), while the most female-oriented occupations are Legal Services & Support (91.7%), Health Technologists (83.9%), and Education Instruction & Library (80.4%).
| Occupation | Male | Female |
| Management | 1,688 (55.6%) | 1,346 (44.4%) |
| Business & Financial | 819 (48.0%) | 886 (52.0%) |
| Computers, Engineering & Science | 1,303 (70.8%) | 538 (29.2%) |
| Computers & Mathematics | 678 (69.5%) | 298 (30.5%) |
| Architecture & Engineering | 459 (80.0%) | 115 (20.0%) |
| Life, Physical & Social Science | 166 (57.0%) | 125 (43.0%) |
| Community & Social Service | 655 (30.6%) | 1,487 (69.4%) |
| Education, Arts & Media | 149 (34.4%) | 284 (65.6%) |
| Legal Services & Support | 10 (8.3%) | 111 (91.7%) |
| Education Instruction & Library | 235 (19.6%) | 966 (80.4%) |
| Arts, Media & Entertainment | 261 (67.4%) | 126 (32.6%) |
| Health Diagnosing & Treating | 469 (38.5%) | 749 (61.5%) |
| Health Technologists | 80 (16.1%) | 417 (83.9%) |
| Total (Category) | 4,934 (49.6%) | 5,006 (50.4%) |
| Total (Overall) | 15,066 (54.2%) | 12,727 (45.8%) |
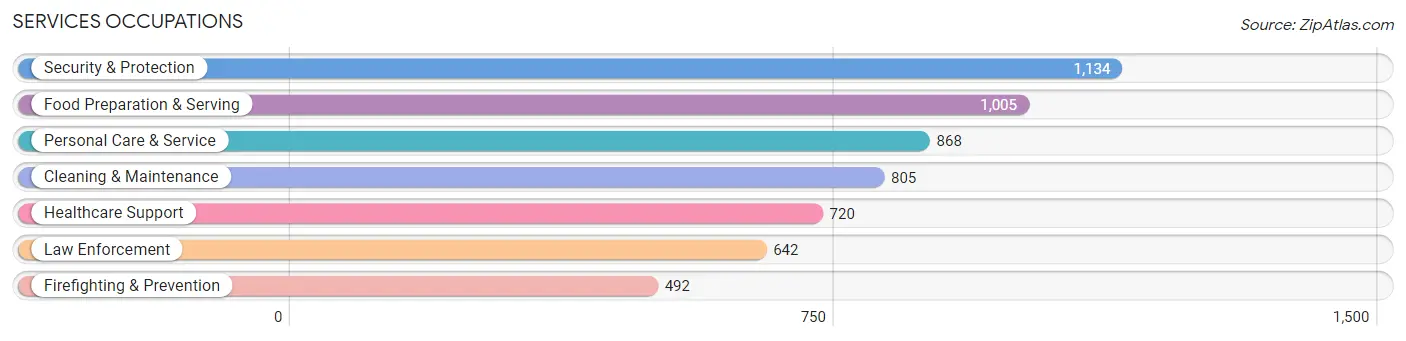
Services Occupations
The most common Services occupations in Maricopa are Security & Protection (1,134 | 4.1%), Food Preparation & Serving (1,005 | 3.6%), Personal Care & Service (868 | 3.1%), Cleaning & Maintenance (805 | 2.9%), and Healthcare Support (720 | 2.6%).
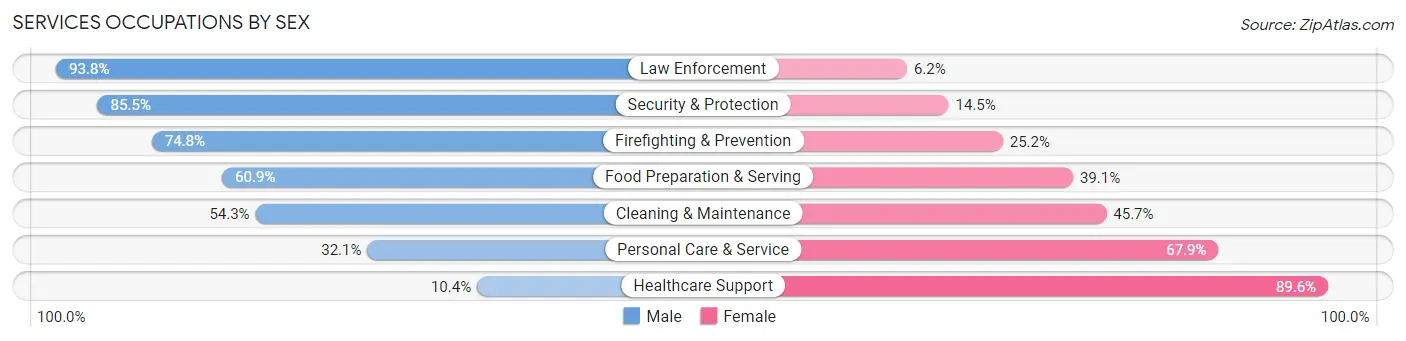
Services Occupations by Sex
Within the Services occupations in Maricopa, the most male-oriented occupations are Law Enforcement (93.8%), Security & Protection (85.5%), and Firefighting & Prevention (74.8%), while the most female-oriented occupations are Healthcare Support (89.6%), Personal Care & Service (67.9%), and Cleaning & Maintenance (45.7%).
| Occupation | Male | Female |
| Healthcare Support | 75 (10.4%) | 645 (89.6%) |
| Security & Protection | 970 (85.5%) | 164 (14.5%) |
| Firefighting & Prevention | 368 (74.8%) | 124 (25.2%) |
| Law Enforcement | 602 (93.8%) | 40 (6.2%) |
| Food Preparation & Serving | 612 (60.9%) | 393 (39.1%) |
| Cleaning & Maintenance | 437 (54.3%) | 368 (45.7%) |
| Personal Care & Service | 279 (32.1%) | 589 (67.9%) |
| Total (Category) | 2,373 (52.4%) | 2,159 (47.6%) |
| Total (Overall) | 15,066 (54.2%) | 12,727 (45.8%) |
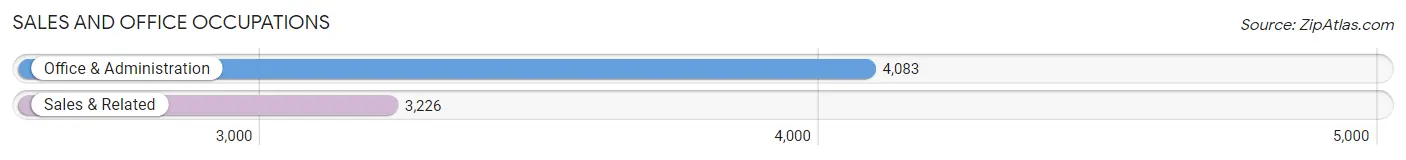
Sales and Office Occupations
The most common Sales and Office occupations in Maricopa are Office & Administration (4,083 | 14.7%), and Sales & Related (3,226 | 11.6%).
Sales and Office Occupations by Sex
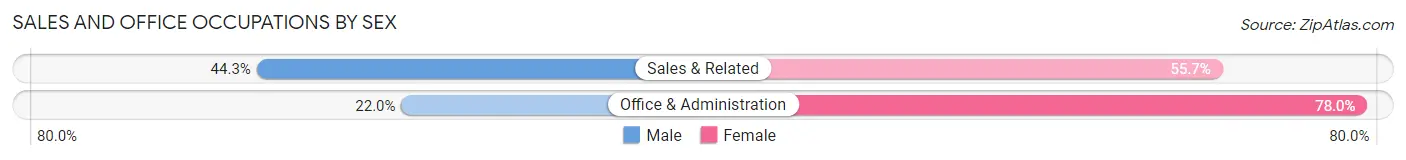
| Occupation | Male | Female |
| Sales & Related | 1,429 (44.3%) | 1,797 (55.7%) |
| Office & Administration | 900 (22.0%) | 3,183 (78.0%) |
| Total (Category) | 2,329 (31.9%) | 4,980 (68.1%) |
| Total (Overall) | 15,066 (54.2%) | 12,727 (45.8%) |
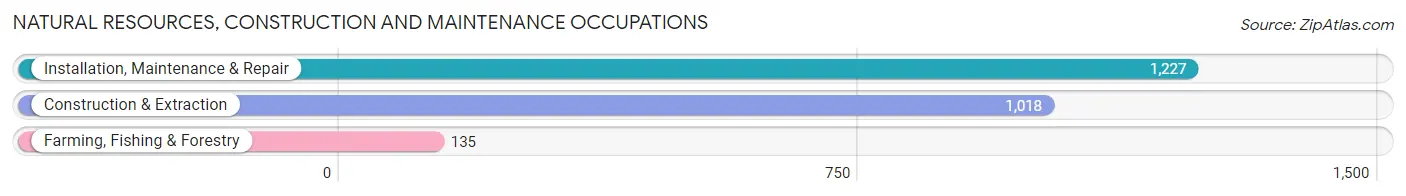
Natural Resources, Construction and Maintenance Occupations
The most common Natural Resources, Construction and Maintenance occupations in Maricopa are Installation, Maintenance & Repair (1,227 | 4.4%), Construction & Extraction (1,018 | 3.7%), and Farming, Fishing & Forestry (135 | 0.5%).
Natural Resources, Construction and Maintenance Occupations by Sex
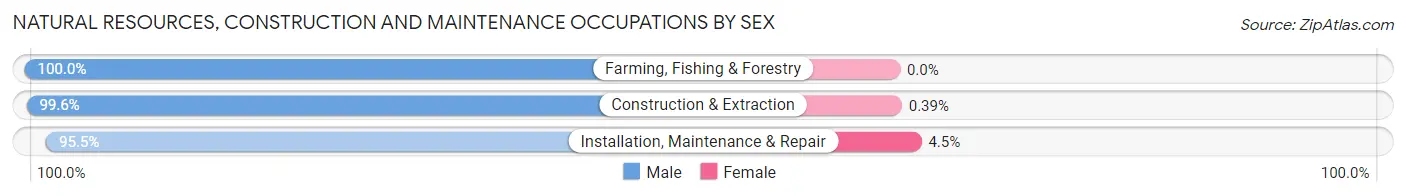
| Occupation | Male | Female |
| Farming, Fishing & Forestry | 135 (100.0%) | 0 (0.0%) |
| Construction & Extraction | 1,014 (99.6%) | 4 (0.4%) |
| Installation, Maintenance & Repair | 1,172 (95.5%) | 55 (4.5%) |
| Total (Category) | 2,321 (97.5%) | 59 (2.5%) |
| Total (Overall) | 15,066 (54.2%) | 12,727 (45.8%) |
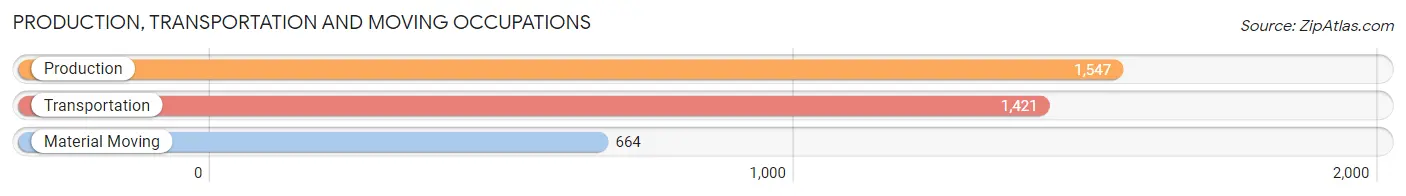
Production, Transportation and Moving Occupations
The most common Production, Transportation and Moving occupations in Maricopa are Production (1,547 | 5.6%), Transportation (1,421 | 5.1%), and Material Moving (664 | 2.4%).
Production, Transportation and Moving Occupations by Sex
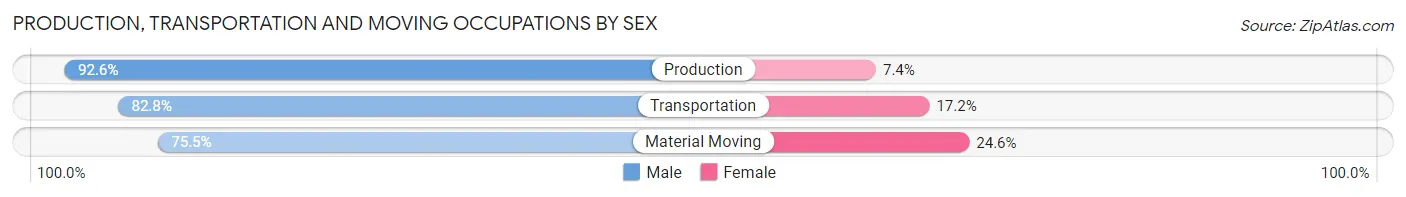
| Occupation | Male | Female |
| Production | 1,432 (92.6%) | 115 (7.4%) |
| Transportation | 1,176 (82.8%) | 245 (17.2%) |
| Material Moving | 501 (75.4%) | 163 (24.5%) |
| Total (Category) | 3,109 (85.6%) | 523 (14.4%) |
| Total (Overall) | 15,066 (54.2%) | 12,727 (45.8%) |
Employment Industries by Sex in Maricopa
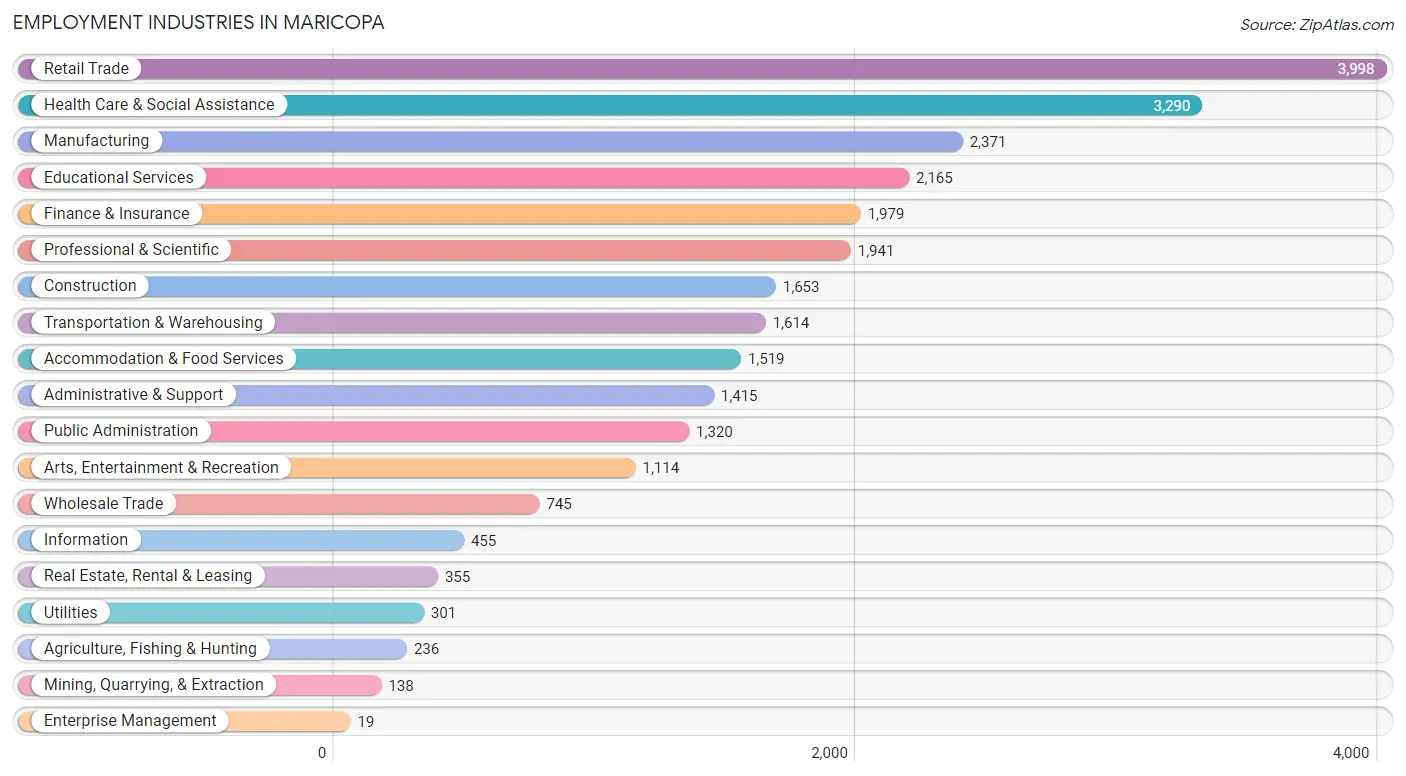
Employment Industries in Maricopa
The major employment industries in Maricopa include Retail Trade (3,998 | 14.4%), Health Care & Social Assistance (3,290 | 11.8%), Manufacturing (2,371 | 8.5%), Educational Services (2,165 | 7.8%), and Finance & Insurance (1,979 | 7.1%).
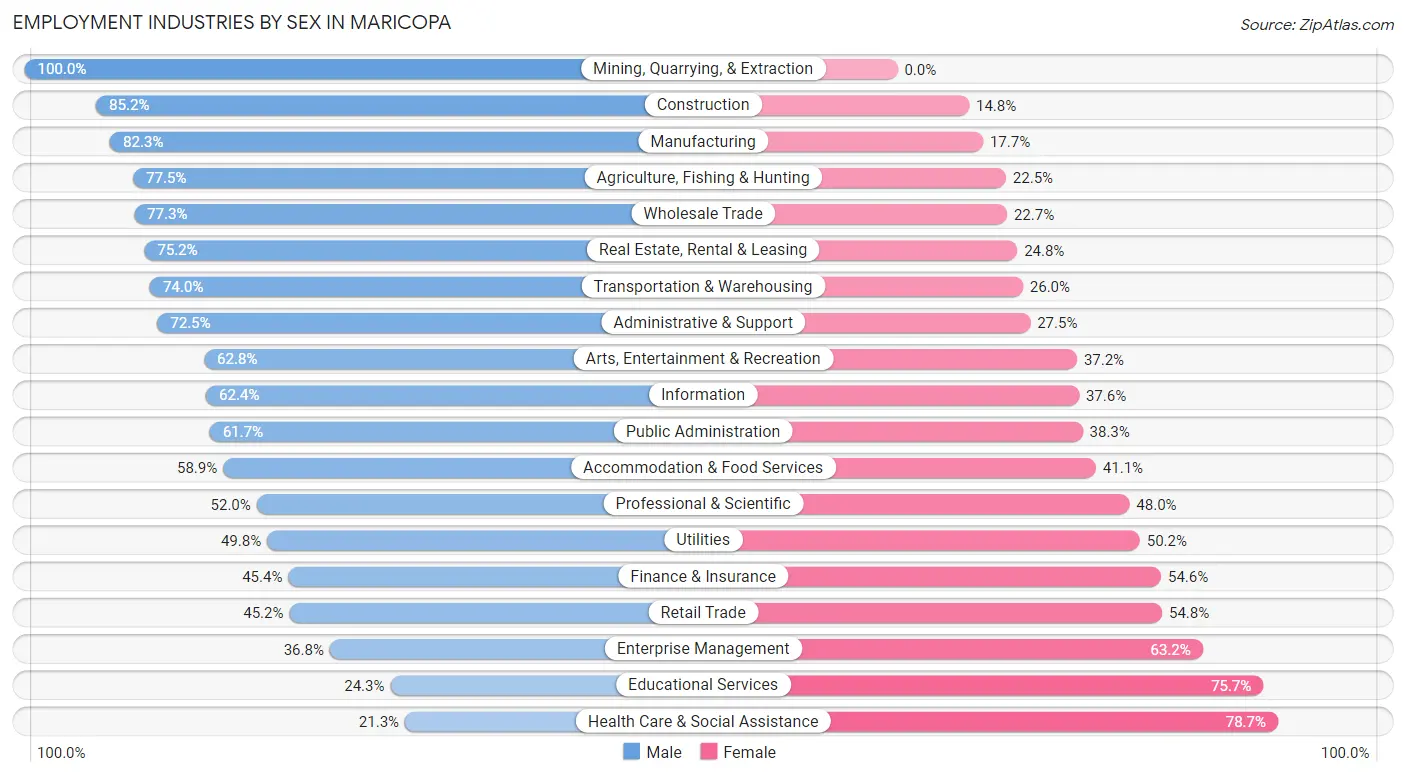
Employment Industries by Sex in Maricopa
The Maricopa industries that see more men than women are Mining, Quarrying, & Extraction (100.0%), Construction (85.2%), and Manufacturing (82.3%), whereas the industries that tend to have a higher number of women are Health Care & Social Assistance (78.7%), Educational Services (75.7%), and Enterprise Management (63.2%).
| Industry | Male | Female |
| Agriculture, Fishing & Hunting | 183 (77.5%) | 53 (22.5%) |
| Mining, Quarrying, & Extraction | 138 (100.0%) | 0 (0.0%) |
| Construction | 1,408 (85.2%) | 245 (14.8%) |
| Manufacturing | 1,951 (82.3%) | 420 (17.7%) |
| Wholesale Trade | 576 (77.3%) | 169 (22.7%) |
| Retail Trade | 1,808 (45.2%) | 2,190 (54.8%) |
| Transportation & Warehousing | 1,195 (74.0%) | 419 (26.0%) |
| Utilities | 150 (49.8%) | 151 (50.2%) |
| Information | 284 (62.4%) | 171 (37.6%) |
| Finance & Insurance | 899 (45.4%) | 1,080 (54.6%) |
| Real Estate, Rental & Leasing | 267 (75.2%) | 88 (24.8%) |
| Professional & Scientific | 1,009 (52.0%) | 932 (48.0%) |
| Enterprise Management | 7 (36.8%) | 12 (63.2%) |
| Administrative & Support | 1,026 (72.5%) | 389 (27.5%) |
| Educational Services | 526 (24.3%) | 1,639 (75.7%) |
| Health Care & Social Assistance | 700 (21.3%) | 2,590 (78.7%) |
| Arts, Entertainment & Recreation | 700 (62.8%) | 414 (37.2%) |
| Accommodation & Food Services | 895 (58.9%) | 624 (41.1%) |
| Public Administration | 814 (61.7%) | 506 (38.3%) |
| Total | 15,066 (54.2%) | 12,727 (45.8%) |
Education in Maricopa
School Enrollment in Maricopa
The most common levels of schooling among the 16,038 students in Maricopa are middle school (4,225 | 26.3%), high school (4,150 | 25.9%), and elementary school (3,339 | 20.8%).
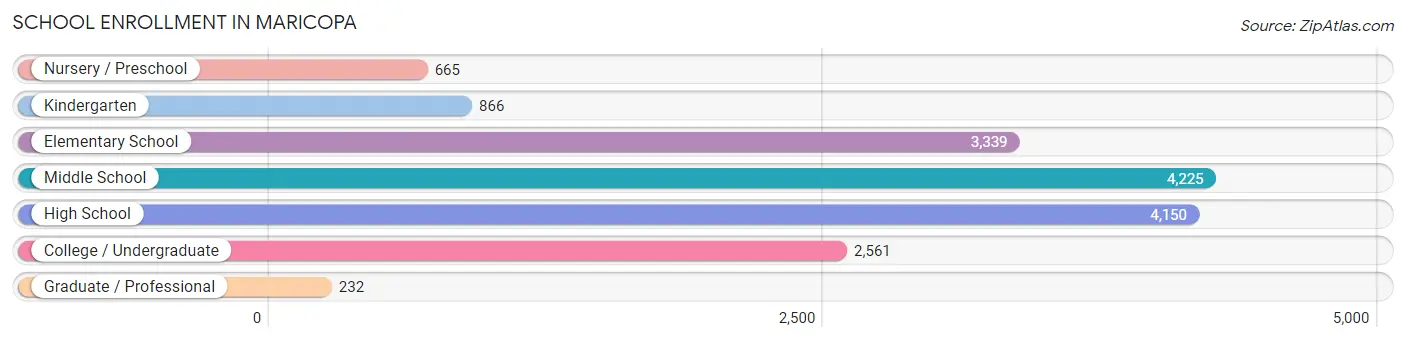
| School Level | # Students | % Students |
| Nursery / Preschool | 665 | 4.2% |
| Kindergarten | 866 | 5.4% |
| Elementary School | 3,339 | 20.8% |
| Middle School | 4,225 | 26.3% |
| High School | 4,150 | 25.9% |
| College / Undergraduate | 2,561 | 16.0% |
| Graduate / Professional | 232 | 1.5% |
| Total | 16,038 | 100.0% |
School Enrollment by Age by Funding Source in Maricopa
Out of a total of 16,038 students who are enrolled in schools in Maricopa, 2,598 (16.2%) attend a private institution, while the remaining 13,440 (83.8%) are enrolled in public schools. The age group of 3 to 4 year olds has the highest likelihood of being enrolled in private schools, with 257 (39.7% in the age bracket) enrolled. Conversely, the age group of 15 to 17 year olds has the lowest likelihood of being enrolled in a private school, with 2,512 (92.5% in the age bracket) attending a public institution.
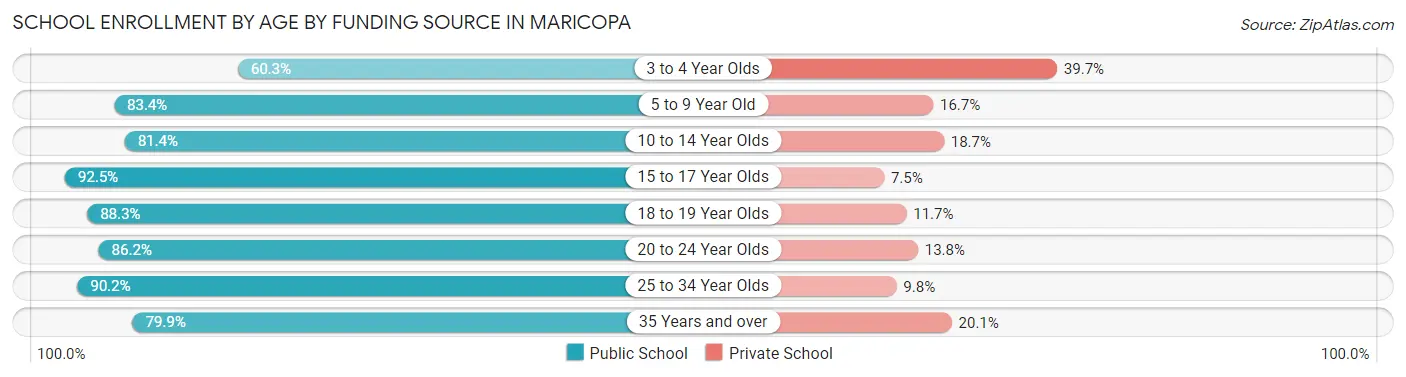
| Age Bracket | Public School | Private School |
| 3 to 4 Year Olds | 390 (60.3%) | 257 (39.7%) |
| 5 to 9 Year Old | 3,295 (83.4%) | 658 (16.7%) |
| 10 to 14 Year Olds | 4,271 (81.4%) | 979 (18.6%) |
| 15 to 17 Year Olds | 2,512 (92.5%) | 204 (7.5%) |
| 18 to 19 Year Olds | 954 (88.3%) | 126 (11.7%) |
| 20 to 24 Year Olds | 787 (86.2%) | 126 (13.8%) |
| 25 to 34 Year Olds | 441 (90.2%) | 48 (9.8%) |
| 35 Years and over | 791 (79.9%) | 199 (20.1%) |
| Total | 13,440 (83.8%) | 2,598 (16.2%) |
Educational Attainment by Field of Study in Maricopa
Business (2,498 | 26.2%), education (915 | 9.6%), science & technology (860 | 9.0%), computers & mathematics (662 | 6.9%), and arts & humanities (630 | 6.6%) are the most common fields of study among 9,534 individuals in Maricopa who have obtained a bachelor's degree or higher.
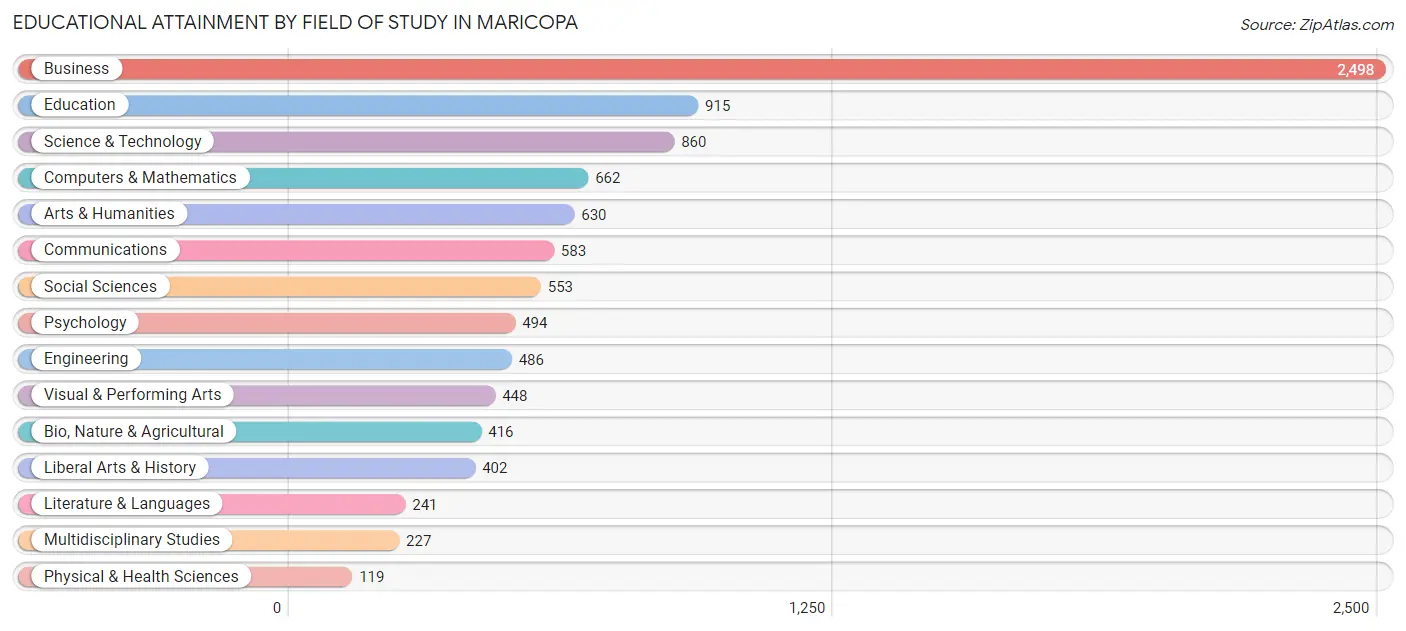
| Field of Study | # Graduates | % Graduates |
| Computers & Mathematics | 662 | 6.9% |
| Bio, Nature & Agricultural | 416 | 4.4% |
| Physical & Health Sciences | 119 | 1.3% |
| Psychology | 494 | 5.2% |
| Social Sciences | 553 | 5.8% |
| Engineering | 486 | 5.1% |
| Multidisciplinary Studies | 227 | 2.4% |
| Science & Technology | 860 | 9.0% |
| Business | 2,498 | 26.2% |
| Education | 915 | 9.6% |
| Literature & Languages | 241 | 2.5% |
| Liberal Arts & History | 402 | 4.2% |
| Visual & Performing Arts | 448 | 4.7% |
| Communications | 583 | 6.1% |
| Arts & Humanities | 630 | 6.6% |
| Total | 9,534 | 100.0% |
Transportation & Commute in Maricopa
Vehicle Availability by Sex in Maricopa
The most prevalent vehicle ownership categories in Maricopa are males with 2 vehicles (7,194, accounting for 48.1%) and females with 2 vehicles (5,377, making up 58.2%).
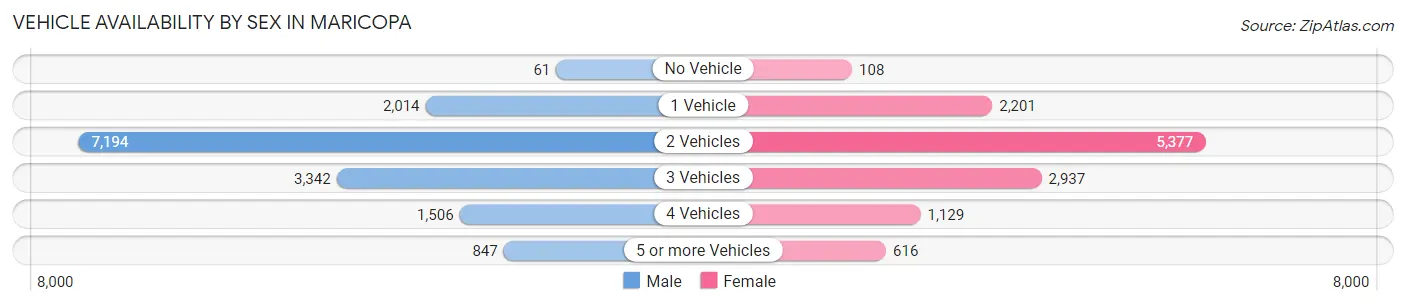
| Vehicles Available | Male | Female |
| No Vehicle | 61 (0.4%) | 108 (0.9%) |
| 1 Vehicle | 2,014 (13.5%) | 2,201 (17.8%) |
| 2 Vehicles | 7,194 (48.1%) | 5,377 (43.5%) |
| 3 Vehicles | 3,342 (22.3%) | 2,937 (23.7%) |
| 4 Vehicles | 1,506 (10.1%) | 1,129 (9.1%) |
| 5 or more Vehicles | 847 (5.7%) | 616 (5.0%) |
| Total | 14,964 (100.0%) | 12,368 (100.0%) |
Commute Time in Maricopa
The most frequently occuring commute durations in Maricopa are 45 to 59 minutes (4,409 commuters, 19.4%), 30 to 34 minutes (3,309 commuters, 14.5%), and 60 to 89 minutes (3,306 commuters, 14.5%).
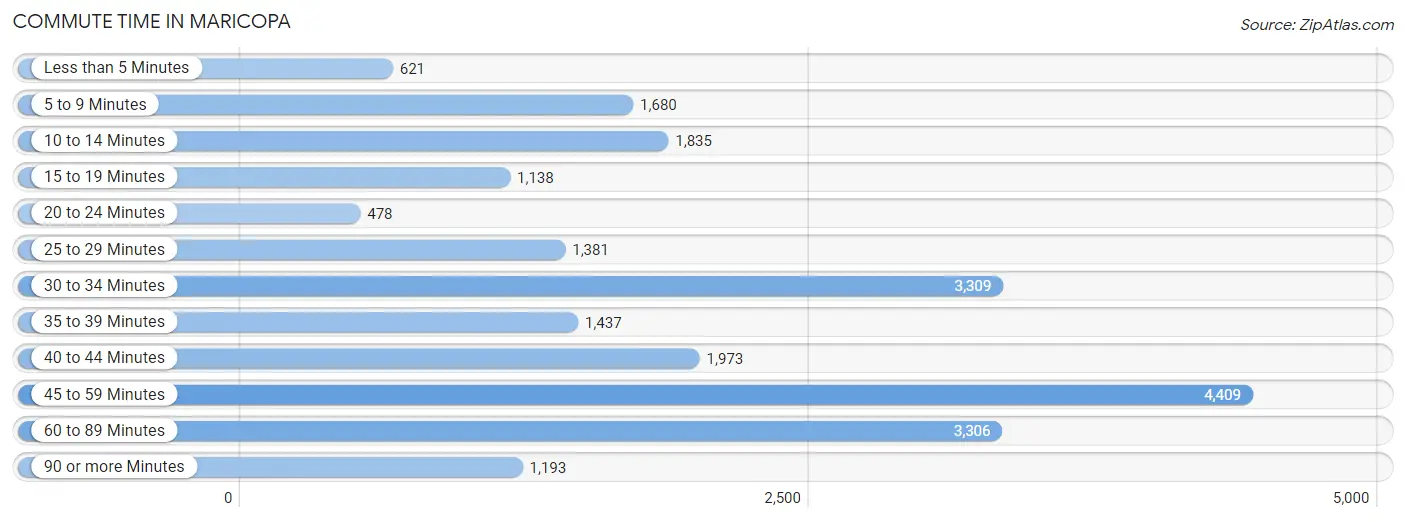
| Commute Time | # Commuters | % Commuters |
| Less than 5 Minutes | 621 | 2.7% |
| 5 to 9 Minutes | 1,680 | 7.4% |
| 10 to 14 Minutes | 1,835 | 8.1% |
| 15 to 19 Minutes | 1,138 | 5.0% |
| 20 to 24 Minutes | 478 | 2.1% |
| 25 to 29 Minutes | 1,381 | 6.1% |
| 30 to 34 Minutes | 3,309 | 14.5% |
| 35 to 39 Minutes | 1,437 | 6.3% |
| 40 to 44 Minutes | 1,973 | 8.7% |
| 45 to 59 Minutes | 4,409 | 19.4% |
| 60 to 89 Minutes | 3,306 | 14.5% |
| 90 or more Minutes | 1,193 | 5.2% |
Commute Time by Sex in Maricopa
The most common commute times in Maricopa are 45 to 59 minutes (2,503 commuters, 19.6%) for males and 45 to 59 minutes (1,906 commuters, 19.1%) for females.
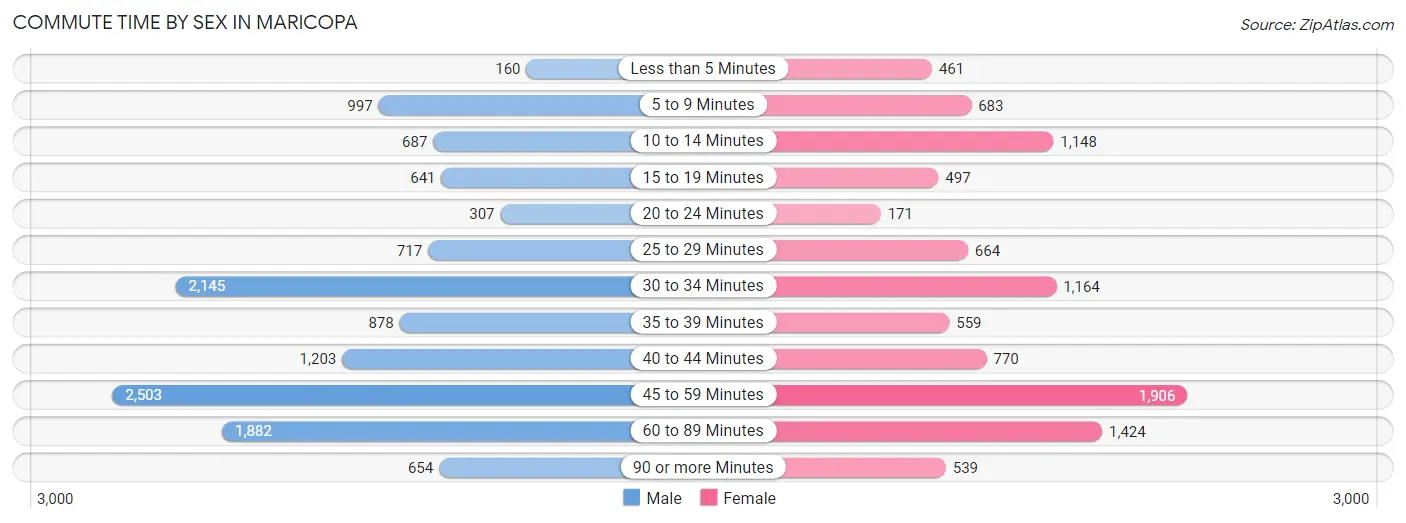
| Commute Time | Male | Female |
| Less than 5 Minutes | 160 (1.3%) | 461 (4.6%) |
| 5 to 9 Minutes | 997 (7.8%) | 683 (6.8%) |
| 10 to 14 Minutes | 687 (5.4%) | 1,148 (11.5%) |
| 15 to 19 Minutes | 641 (5.0%) | 497 (5.0%) |
| 20 to 24 Minutes | 307 (2.4%) | 171 (1.7%) |
| 25 to 29 Minutes | 717 (5.6%) | 664 (6.7%) |
| 30 to 34 Minutes | 2,145 (16.8%) | 1,164 (11.7%) |
| 35 to 39 Minutes | 878 (6.9%) | 559 (5.6%) |
| 40 to 44 Minutes | 1,203 (9.4%) | 770 (7.7%) |
| 45 to 59 Minutes | 2,503 (19.6%) | 1,906 (19.1%) |
| 60 to 89 Minutes | 1,882 (14.7%) | 1,424 (14.3%) |
| 90 or more Minutes | 654 (5.1%) | 539 (5.4%) |
Time of Departure to Work by Sex in Maricopa
The most frequent times of departure to work in Maricopa are 12:00 AM to 4:59 AM (2,684, 21.0%) for males and 7:00 AM to 7:29 AM (1,804, 18.1%) for females.
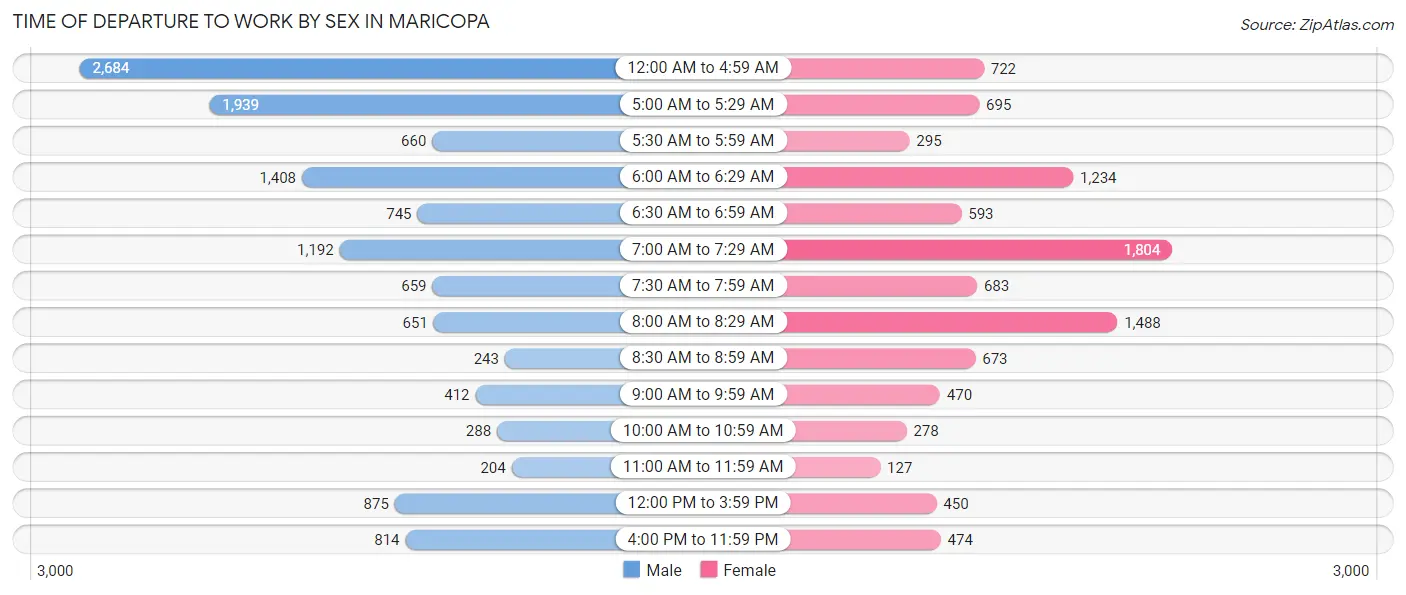
| Time of Departure | Male | Female |
| 12:00 AM to 4:59 AM | 2,684 (21.0%) | 722 (7.2%) |
| 5:00 AM to 5:29 AM | 1,939 (15.2%) | 695 (7.0%) |
| 5:30 AM to 5:59 AM | 660 (5.2%) | 295 (2.9%) |
| 6:00 AM to 6:29 AM | 1,408 (11.0%) | 1,234 (12.4%) |
| 6:30 AM to 6:59 AM | 745 (5.8%) | 593 (5.9%) |
| 7:00 AM to 7:29 AM | 1,192 (9.3%) | 1,804 (18.1%) |
| 7:30 AM to 7:59 AM | 659 (5.2%) | 683 (6.8%) |
| 8:00 AM to 8:29 AM | 651 (5.1%) | 1,488 (14.9%) |
| 8:30 AM to 8:59 AM | 243 (1.9%) | 673 (6.7%) |
| 9:00 AM to 9:59 AM | 412 (3.2%) | 470 (4.7%) |
| 10:00 AM to 10:59 AM | 288 (2.2%) | 278 (2.8%) |
| 11:00 AM to 11:59 AM | 204 (1.6%) | 127 (1.3%) |
| 12:00 PM to 3:59 PM | 875 (6.9%) | 450 (4.5%) |
| 4:00 PM to 11:59 PM | 814 (6.4%) | 474 (4.8%) |
| Total | 12,774 (100.0%) | 9,986 (100.0%) |
Housing Occupancy in Maricopa
Occupancy by Ownership in Maricopa
Of the total 18,869 dwellings in Maricopa, owner-occupied units account for 15,636 (82.9%), while renter-occupied units make up 3,233 (17.1%).
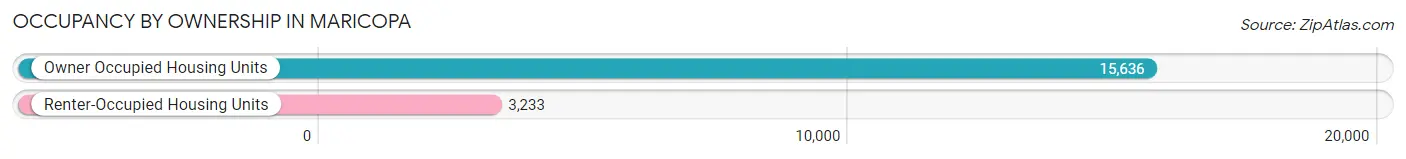
| Occupancy | # Housing Units | % Housing Units |
| Owner Occupied Housing Units | 15,636 | 82.9% |
| Renter-Occupied Housing Units | 3,233 | 17.1% |
| Total Occupied Housing Units | 18,869 | 100.0% |
Occupancy by Household Size in Maricopa
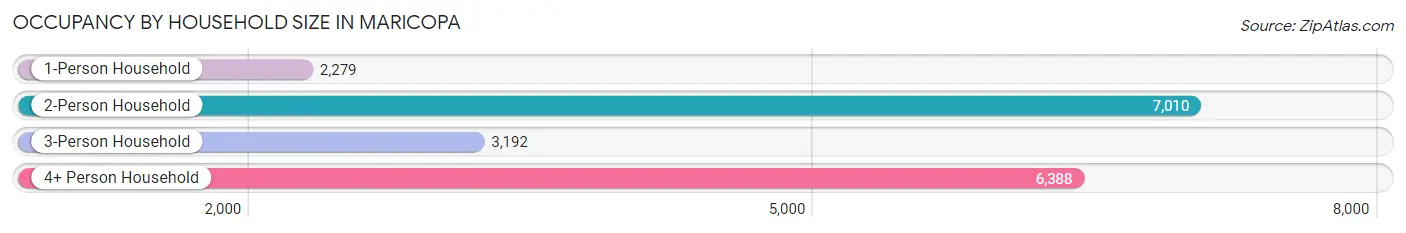
| Household Size | # Housing Units | % Housing Units |
| 1-Person Household | 2,279 | 12.1% |
| 2-Person Household | 7,010 | 37.1% |
| 3-Person Household | 3,192 | 16.9% |
| 4+ Person Household | 6,388 | 33.9% |
| Total Housing Units | 18,869 | 100.0% |
Occupancy by Ownership by Household Size in Maricopa
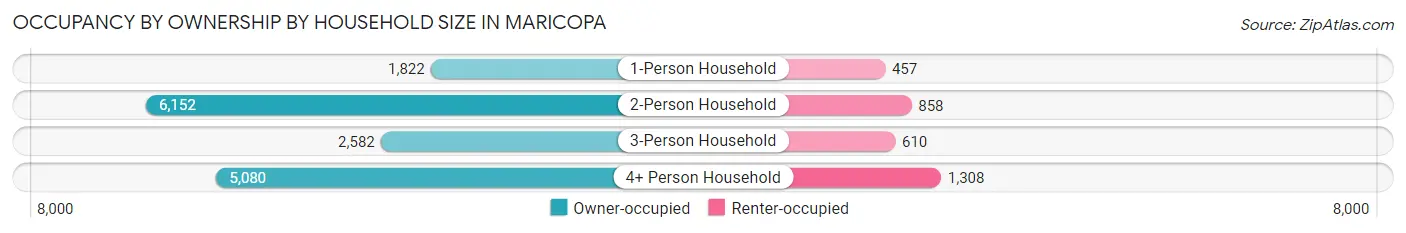
| Household Size | Owner-occupied | Renter-occupied |
| 1-Person Household | 1,822 (79.9%) | 457 (20.1%) |
| 2-Person Household | 6,152 (87.8%) | 858 (12.2%) |
| 3-Person Household | 2,582 (80.9%) | 610 (19.1%) |
| 4+ Person Household | 5,080 (79.5%) | 1,308 (20.5%) |
| Total Housing Units | 15,636 (82.9%) | 3,233 (17.1%) |
Occupancy by Educational Attainment in Maricopa
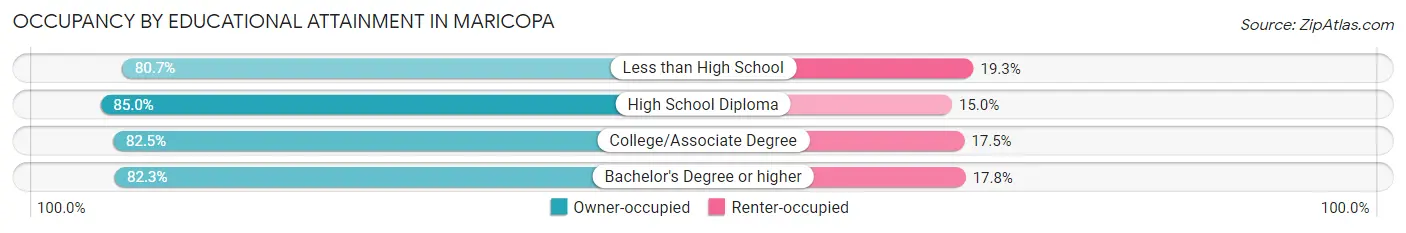
| Household Size | Owner-occupied | Renter-occupied |
| Less than High School | 857 (80.7%) | 205 (19.3%) |
| High School Diploma | 3,498 (85.0%) | 619 (15.0%) |
| College/Associate Degree | 6,836 (82.5%) | 1,450 (17.5%) |
| Bachelor's Degree or higher | 4,445 (82.3%) | 959 (17.7%) |
Occupancy by Age of Householder in Maricopa
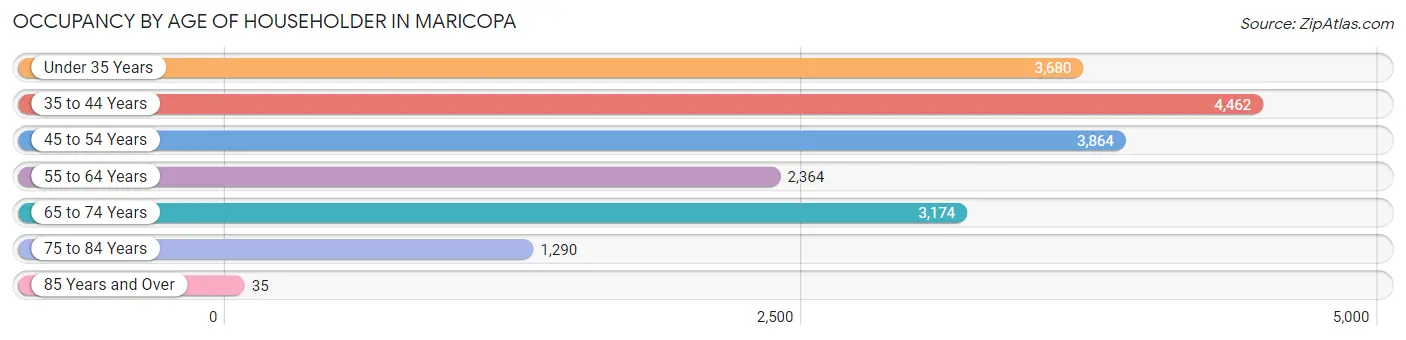
| Age Bracket | # Households | % Households |
| Under 35 Years | 3,680 | 19.5% |
| 35 to 44 Years | 4,462 | 23.6% |
| 45 to 54 Years | 3,864 | 20.5% |
| 55 to 64 Years | 2,364 | 12.5% |
| 65 to 74 Years | 3,174 | 16.8% |
| 75 to 84 Years | 1,290 | 6.8% |
| 85 Years and Over | 35 | 0.2% |
| Total | 18,869 | 100.0% |
Housing Finances in Maricopa
Median Income by Occupancy in Maricopa
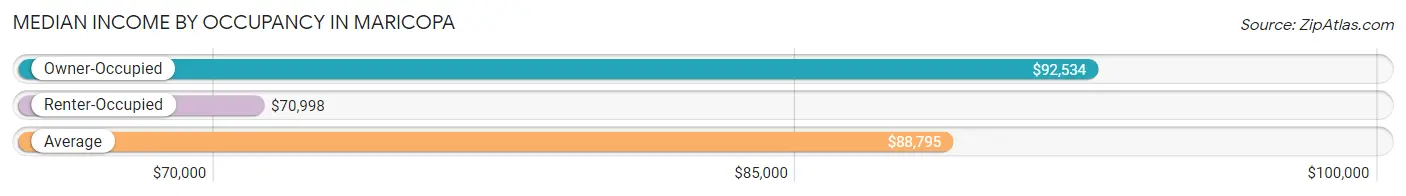
| Occupancy Type | # Households | Median Income |
| Owner-Occupied | 15,636 (82.9%) | $92,534 |
| Renter-Occupied | 3,233 (17.1%) | $70,998 |
| Average | 18,869 (100.0%) | $88,795 |
Occupancy by Householder Income Bracket in Maricopa
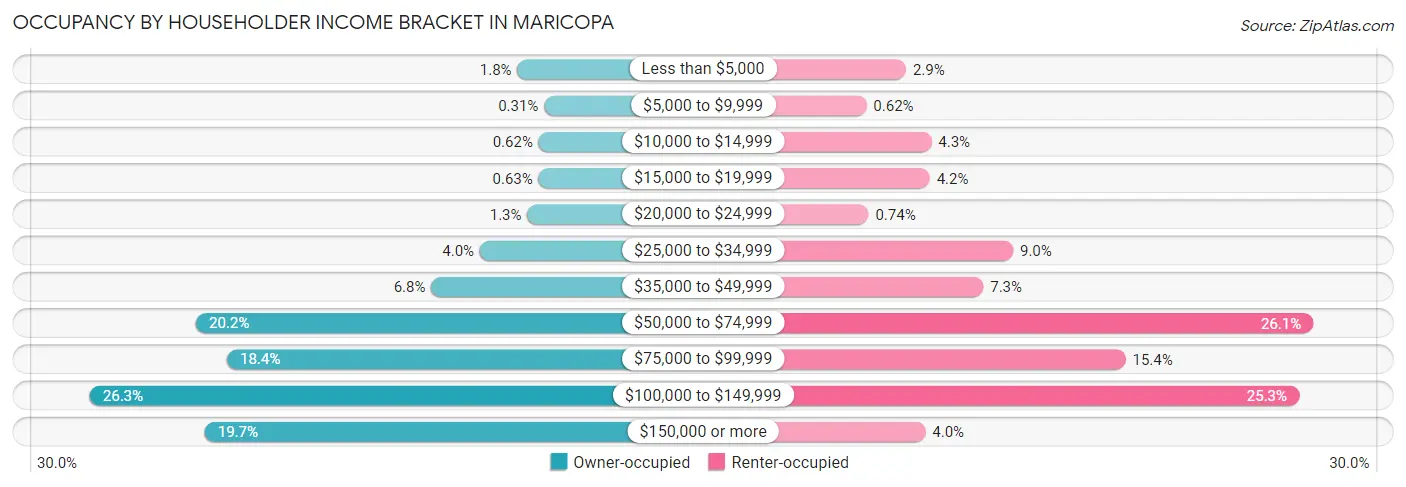
| Income Bracket | Owner-occupied | Renter-occupied |
| Less than $5,000 | 288 (1.8%) | 93 (2.9%) |
| $5,000 to $9,999 | 48 (0.3%) | 20 (0.6%) |
| $10,000 to $14,999 | 97 (0.6%) | 140 (4.3%) |
| $15,000 to $19,999 | 98 (0.6%) | 137 (4.2%) |
| $20,000 to $24,999 | 199 (1.3%) | 24 (0.7%) |
| $25,000 to $34,999 | 623 (4.0%) | 291 (9.0%) |
| $35,000 to $49,999 | 1,057 (6.8%) | 236 (7.3%) |
| $50,000 to $74,999 | 3,158 (20.2%) | 845 (26.1%) |
| $75,000 to $99,999 | 2,881 (18.4%) | 499 (15.4%) |
| $100,000 to $149,999 | 4,107 (26.3%) | 819 (25.3%) |
| $150,000 or more | 3,080 (19.7%) | 129 (4.0%) |
| Total | 15,636 (100.0%) | 3,233 (100.0%) |
Monthly Housing Cost Tiers in Maricopa
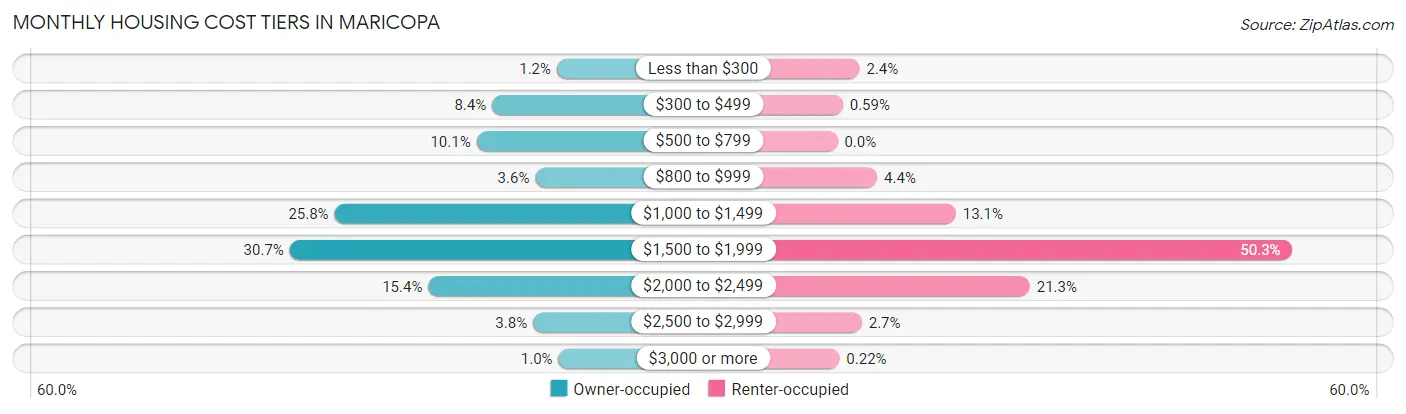
| Monthly Cost | Owner-occupied | Renter-occupied |
| Less than $300 | 187 (1.2%) | 79 (2.4%) |
| $300 to $499 | 1,307 (8.4%) | 19 (0.6%) |
| $500 to $799 | 1,576 (10.1%) | 0 (0.0%) |
| $800 to $999 | 561 (3.6%) | 142 (4.4%) |
| $1,000 to $1,499 | 4,030 (25.8%) | 423 (13.1%) |
| $1,500 to $1,999 | 4,804 (30.7%) | 1,625 (50.3%) |
| $2,000 to $2,499 | 2,410 (15.4%) | 687 (21.2%) |
| $2,500 to $2,999 | 600 (3.8%) | 87 (2.7%) |
| $3,000 or more | 161 (1.0%) | 7 (0.2%) |
| Total | 15,636 (100.0%) | 3,233 (100.0%) |
Physical Housing Characteristics in Maricopa
Housing Structures in Maricopa
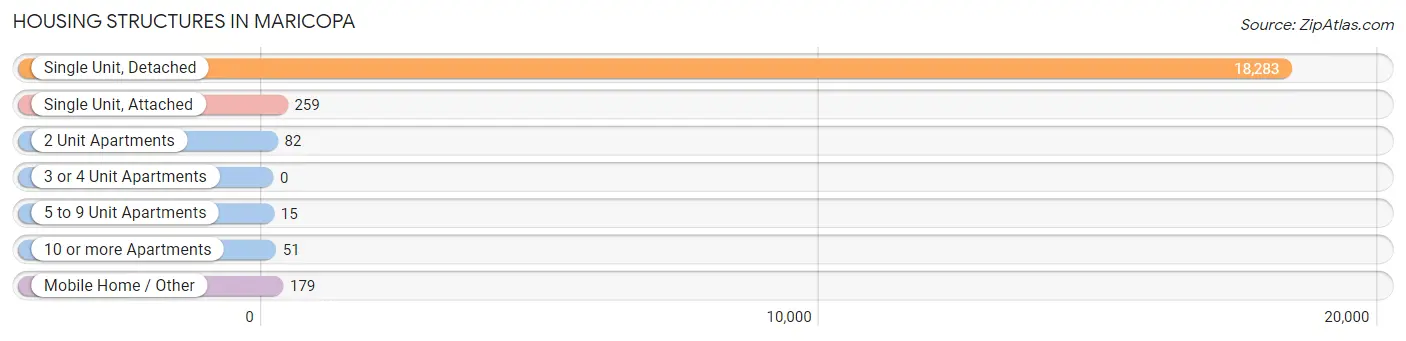
| Structure Type | # Housing Units | % Housing Units |
| Single Unit, Detached | 18,283 | 96.9% |
| Single Unit, Attached | 259 | 1.4% |
| 2 Unit Apartments | 82 | 0.4% |
| 3 or 4 Unit Apartments | 0 | 0.0% |
| 5 to 9 Unit Apartments | 15 | 0.1% |
| 10 or more Apartments | 51 | 0.3% |
| Mobile Home / Other | 179 | 0.9% |
| Total | 18,869 | 100.0% |
Housing Structures by Occupancy in Maricopa
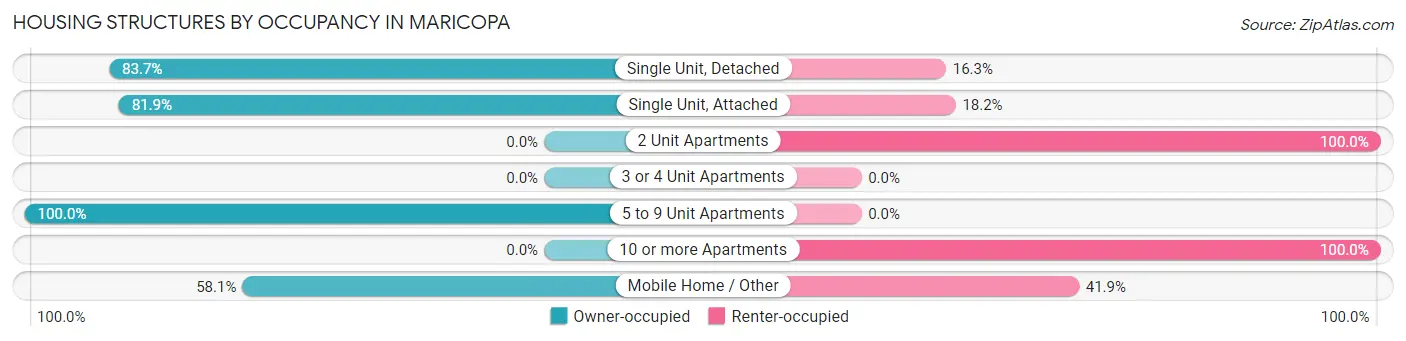
| Structure Type | Owner-occupied | Renter-occupied |
| Single Unit, Detached | 15,305 (83.7%) | 2,978 (16.3%) |
| Single Unit, Attached | 212 (81.9%) | 47 (18.1%) |
| 2 Unit Apartments | 0 (0.0%) | 82 (100.0%) |
| 3 or 4 Unit Apartments | 0 (0.0%) | 0 (0.0%) |
| 5 to 9 Unit Apartments | 15 (100.0%) | 0 (0.0%) |
| 10 or more Apartments | 0 (0.0%) | 51 (100.0%) |
| Mobile Home / Other | 104 (58.1%) | 75 (41.9%) |
| Total | 15,636 (82.9%) | 3,233 (17.1%) |
Housing Structures by Number of Rooms in Maricopa
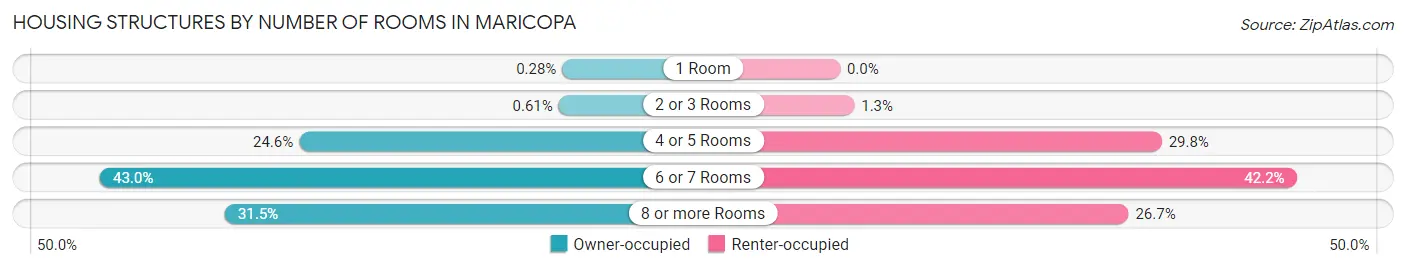
| Number of Rooms | Owner-occupied | Renter-occupied |
| 1 Room | 43 (0.3%) | 0 (0.0%) |
| 2 or 3 Rooms | 96 (0.6%) | 43 (1.3%) |
| 4 or 5 Rooms | 3,850 (24.6%) | 962 (29.8%) |
| 6 or 7 Rooms | 6,726 (43.0%) | 1,365 (42.2%) |
| 8 or more Rooms | 4,921 (31.5%) | 863 (26.7%) |
| Total | 15,636 (100.0%) | 3,233 (100.0%) |
Housing Structure by Heating Type in Maricopa
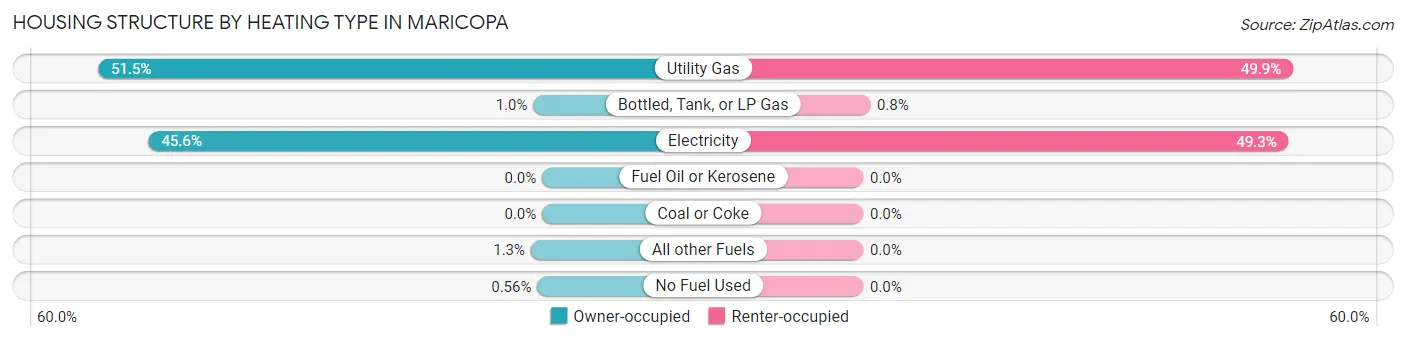
| Heating Type | Owner-occupied | Renter-occupied |
| Utility Gas | 8,050 (51.5%) | 1,612 (49.9%) |
| Bottled, Tank, or LP Gas | 160 (1.0%) | 26 (0.8%) |
| Electricity | 7,134 (45.6%) | 1,595 (49.3%) |
| Fuel Oil or Kerosene | 0 (0.0%) | 0 (0.0%) |
| Coal or Coke | 0 (0.0%) | 0 (0.0%) |
| All other Fuels | 204 (1.3%) | 0 (0.0%) |
| No Fuel Used | 88 (0.6%) | 0 (0.0%) |
| Total | 15,636 (100.0%) | 3,233 (100.0%) |
Household Vehicle Usage in Maricopa
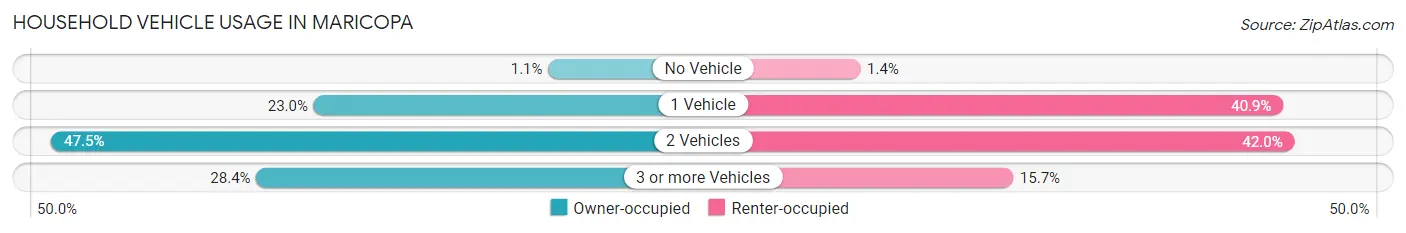
| Vehicles per Household | Owner-occupied | Renter-occupied |
| No Vehicle | 173 (1.1%) | 46 (1.4%) |
| 1 Vehicle | 3,597 (23.0%) | 1,323 (40.9%) |
| 2 Vehicles | 7,431 (47.5%) | 1,357 (42.0%) |
| 3 or more Vehicles | 4,435 (28.4%) | 507 (15.7%) |
| Total | 15,636 (100.0%) | 3,233 (100.0%) |
Real Estate & Mortgages in Maricopa
Real Estate and Mortgage Overview in Maricopa
| Characteristic | Without Mortgage | With Mortgage |
| Housing Units | 2,933 | 12,703 |
| Median Property Value | $273,600 | $296,400 |
| Median Household Income | $67,212 | $2,764 |
| Monthly Housing Costs | $501 | $161 |
| Real Estate Taxes | $2,070 | $230 |
Property Value by Mortgage Status in Maricopa
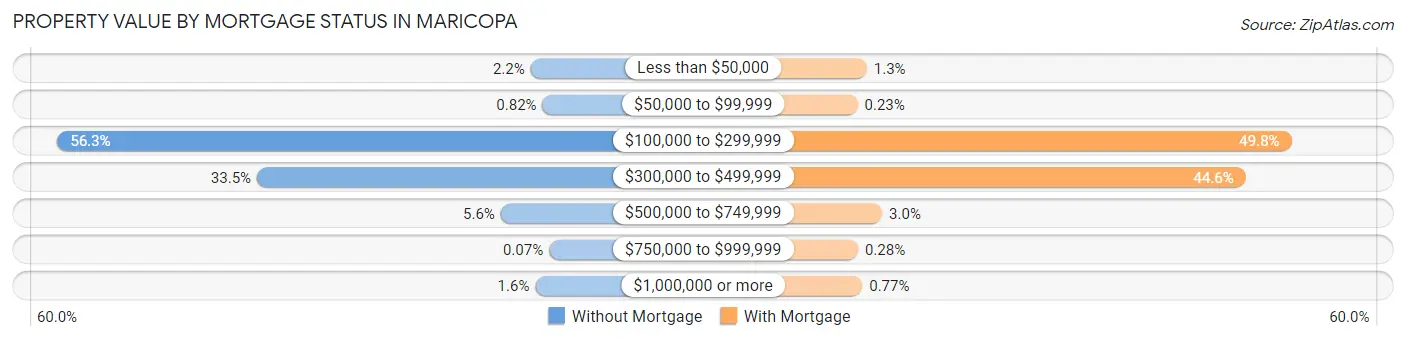
| Property Value | Without Mortgage | With Mortgage |
| Less than $50,000 | 64 (2.2%) | 164 (1.3%) |
| $50,000 to $99,999 | 24 (0.8%) | 29 (0.2%) |
| $100,000 to $299,999 | 1,650 (56.3%) | 6,327 (49.8%) |
| $300,000 to $499,999 | 981 (33.5%) | 5,663 (44.6%) |
| $500,000 to $749,999 | 164 (5.6%) | 386 (3.0%) |
| $750,000 to $999,999 | 2 (0.1%) | 36 (0.3%) |
| $1,000,000 or more | 48 (1.6%) | 98 (0.8%) |
| Total | 2,933 (100.0%) | 12,703 (100.0%) |
Household Income by Mortgage Status in Maricopa
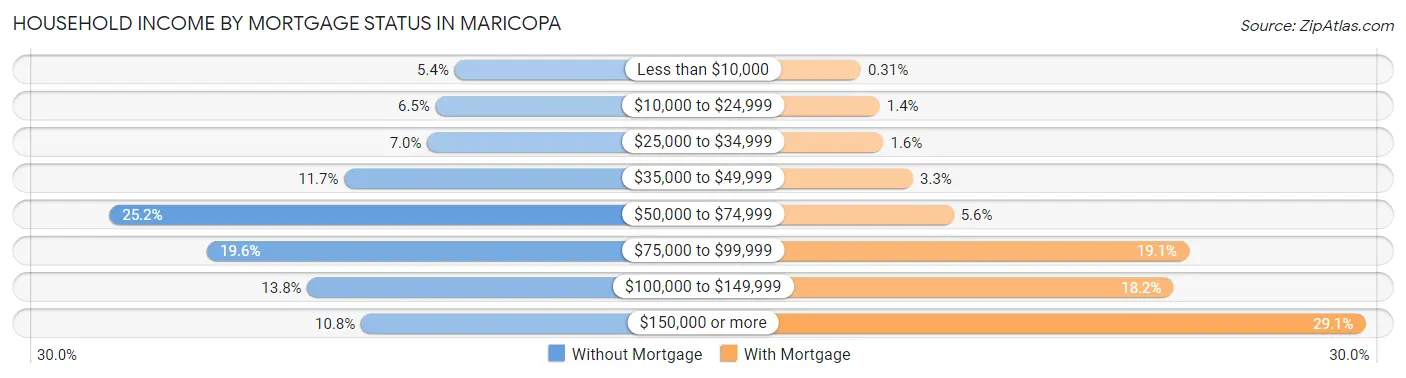
| Household Income | Without Mortgage | With Mortgage |
| Less than $10,000 | 159 (5.4%) | 40 (0.3%) |
| $10,000 to $24,999 | 191 (6.5%) | 177 (1.4%) |
| $25,000 to $34,999 | 205 (7.0%) | 203 (1.6%) |
| $35,000 to $49,999 | 344 (11.7%) | 418 (3.3%) |
| $50,000 to $74,999 | 738 (25.2%) | 713 (5.6%) |
| $75,000 to $99,999 | 574 (19.6%) | 2,420 (19.1%) |
| $100,000 to $149,999 | 406 (13.8%) | 2,307 (18.2%) |
| $150,000 or more | 316 (10.8%) | 3,701 (29.1%) |
| Total | 2,933 (100.0%) | 12,703 (100.0%) |
Property Value to Household Income Ratio in Maricopa
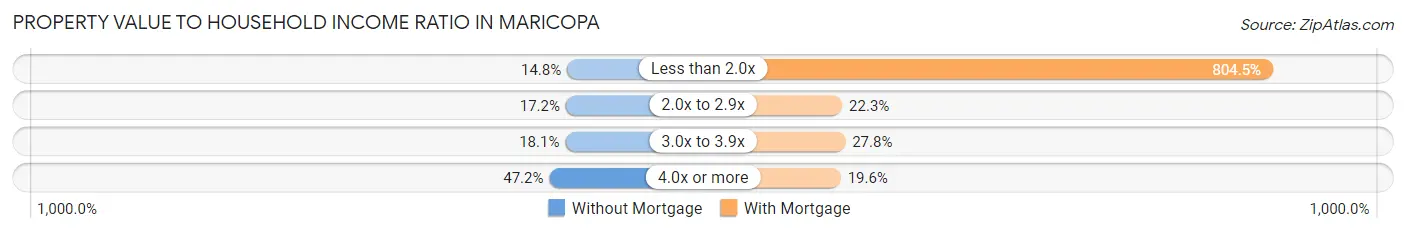
| Value-to-Income Ratio | Without Mortgage | With Mortgage |
| Less than 2.0x | 435 (14.8%) | 102,200 (804.5%) |
| 2.0x to 2.9x | 503 (17.2%) | 2,829 (22.3%) |
| 3.0x to 3.9x | 531 (18.1%) | 3,535 (27.8%) |
| 4.0x or more | 1,383 (47.1%) | 2,486 (19.6%) |
| Total | 2,933 (100.0%) | 12,703 (100.0%) |
Real Estate Taxes by Mortgage Status in Maricopa
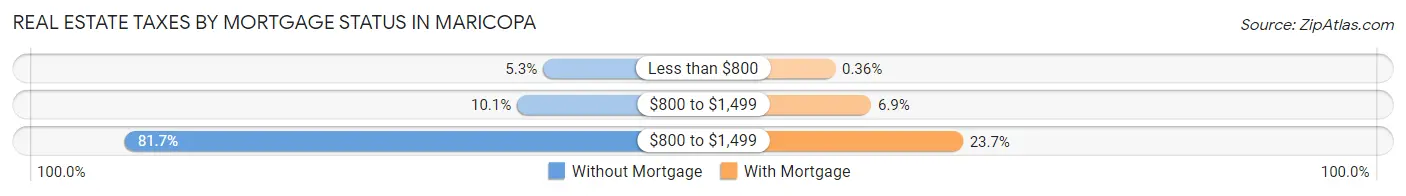
| Property Taxes | Without Mortgage | With Mortgage |
| Less than $800 | 156 (5.3%) | 46 (0.4%) |
| $800 to $1,499 | 295 (10.1%) | 881 (6.9%) |
| $800 to $1,499 | 2,396 (81.7%) | 3,008 (23.7%) |
| Total | 2,933 (100.0%) | 12,703 (100.0%) |
Health & Disability in Maricopa
Health Insurance Coverage by Age in Maricopa
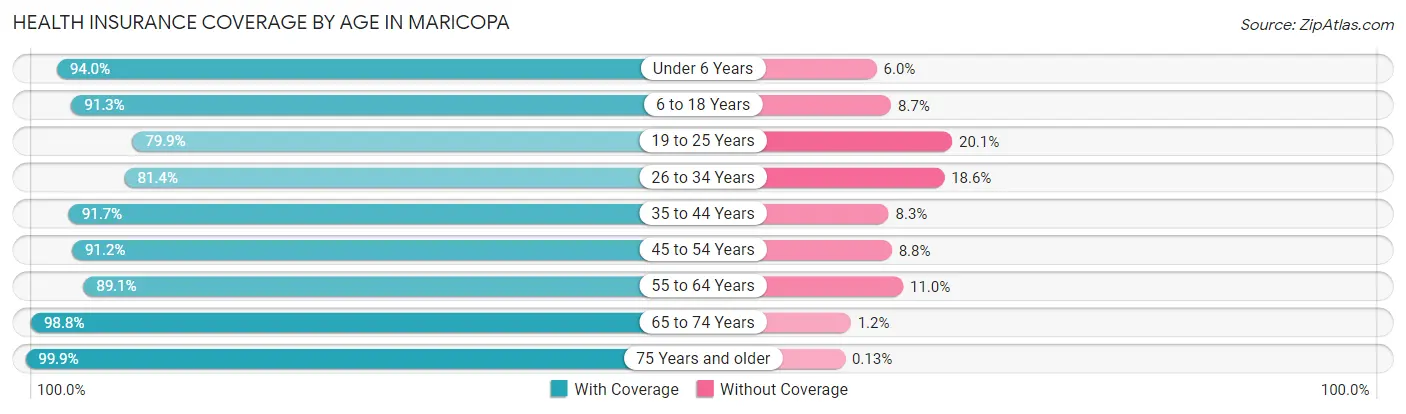
| Age Bracket | With Coverage | Without Coverage |
| Under 6 Years | 4,464 (94.0%) | 286 (6.0%) |
| 6 to 18 Years | 11,801 (91.3%) | 1,129 (8.7%) |
| 19 to 25 Years | 3,164 (79.9%) | 796 (20.1%) |
| 26 to 34 Years | 5,966 (81.4%) | 1,366 (18.6%) |
| 35 to 44 Years | 8,398 (91.7%) | 756 (8.3%) |
| 45 to 54 Years | 7,173 (91.2%) | 696 (8.8%) |
| 55 to 64 Years | 4,555 (89.0%) | 560 (11.0%) |
| 65 to 74 Years | 5,924 (98.8%) | 72 (1.2%) |
| 75 Years and older | 2,391 (99.9%) | 3 (0.1%) |
| Total | 53,836 (90.5%) | 5,664 (9.5%) |
Health Insurance Coverage by Citizenship Status in Maricopa
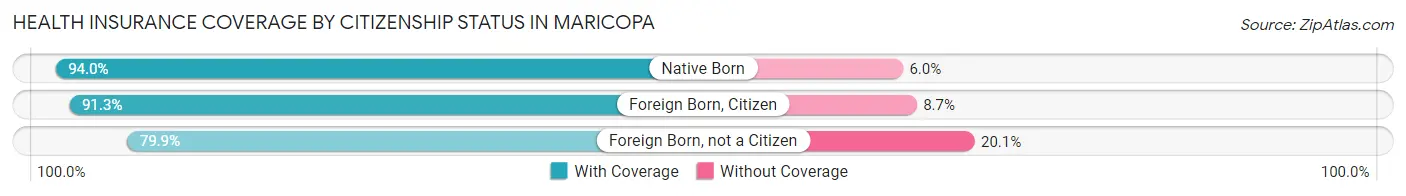
| Citizenship Status | With Coverage | Without Coverage |
| Native Born | 4,464 (94.0%) | 286 (6.0%) |
| Foreign Born, Citizen | 11,801 (91.3%) | 1,129 (8.7%) |
| Foreign Born, not a Citizen | 3,164 (79.9%) | 796 (20.1%) |
Health Insurance Coverage by Household Income in Maricopa
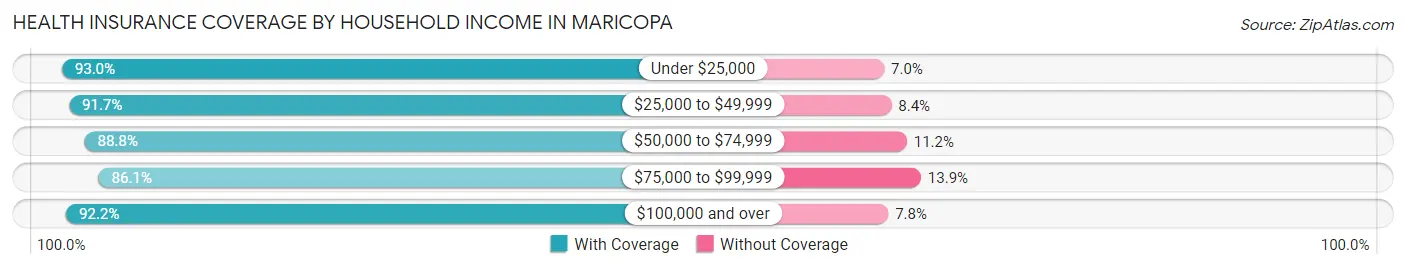
| Household Income | With Coverage | Without Coverage |
| Under $25,000 | 2,194 (93.0%) | 165 (7.0%) |
| $25,000 to $49,999 | 5,324 (91.6%) | 485 (8.4%) |
| $50,000 to $74,999 | 10,720 (88.8%) | 1,357 (11.2%) |
| $75,000 to $99,999 | 8,603 (86.1%) | 1,386 (13.9%) |
| $100,000 and over | 26,994 (92.2%) | 2,271 (7.8%) |
Public vs Private Health Insurance Coverage by Age in Maricopa
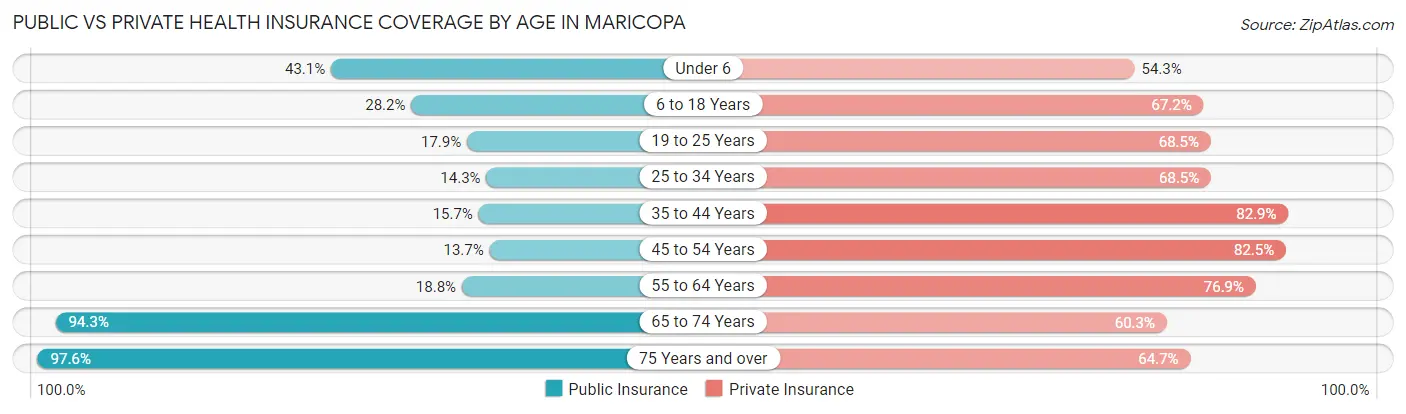
| Age Bracket | Public Insurance | Private Insurance |
| Under 6 | 2,048 (43.1%) | 2,581 (54.3%) |
| 6 to 18 Years | 3,649 (28.2%) | 8,682 (67.1%) |
| 19 to 25 Years | 708 (17.9%) | 2,712 (68.5%) |
| 25 to 34 Years | 1,047 (14.3%) | 5,025 (68.5%) |
| 35 to 44 Years | 1,438 (15.7%) | 7,587 (82.9%) |
| 45 to 54 Years | 1,078 (13.7%) | 6,488 (82.5%) |
| 55 to 64 Years | 963 (18.8%) | 3,931 (76.8%) |
| 65 to 74 Years | 5,652 (94.3%) | 3,617 (60.3%) |
| 75 Years and over | 2,336 (97.6%) | 1,549 (64.7%) |
| Total | 18,919 (31.8%) | 42,172 (70.9%) |
Disability Status by Sex by Age in Maricopa
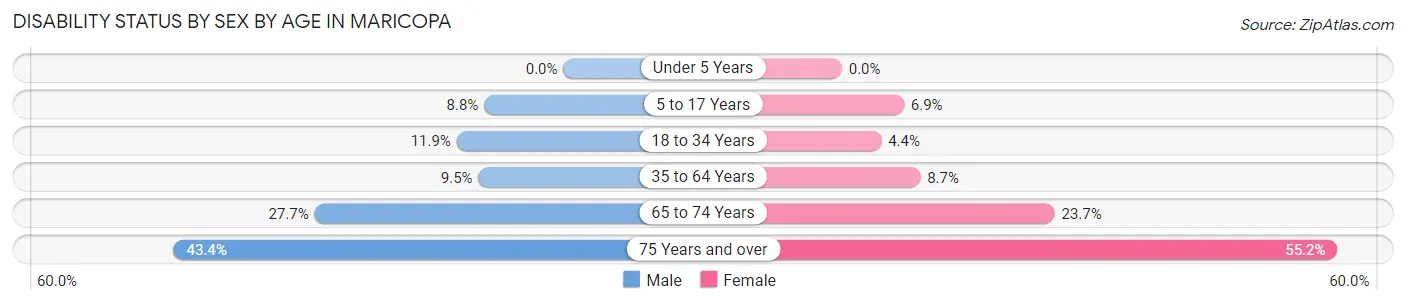
| Age Bracket | Male | Female |
| Under 5 Years | 0 (0.0%) | 0 (0.0%) |
| 5 to 17 Years | 568 (8.8%) | 436 (6.9%) |
| 18 to 34 Years | 709 (11.9%) | 277 (4.4%) |
| 35 to 64 Years | 1,049 (9.5%) | 965 (8.7%) |
| 65 to 74 Years | 742 (27.7%) | 786 (23.7%) |
| 75 Years and over | 557 (43.4%) | 613 (55.2%) |
Disability Class by Sex by Age in Maricopa
Disability Class: Hearing Difficulty
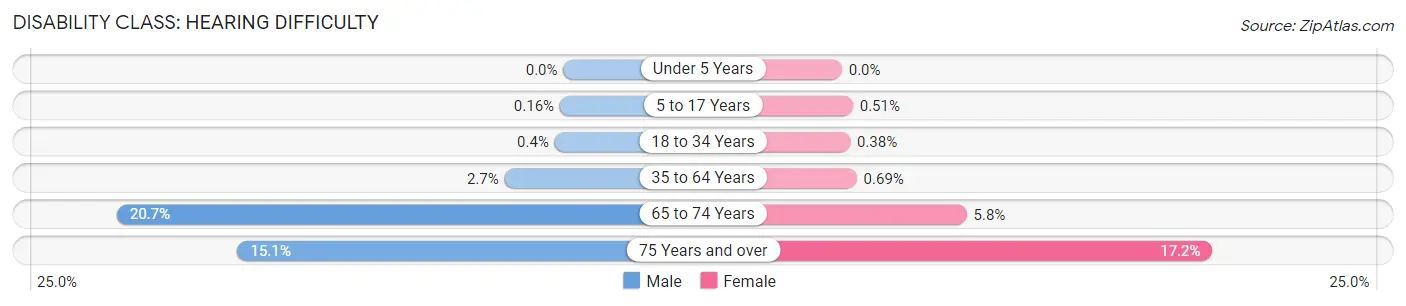
| Age Bracket | Male | Female |
| Under 5 Years | 0 (0.0%) | 0 (0.0%) |
| 5 to 17 Years | 10 (0.2%) | 32 (0.5%) |
| 18 to 34 Years | 24 (0.4%) | 24 (0.4%) |
| 35 to 64 Years | 303 (2.7%) | 76 (0.7%) |
| 65 to 74 Years | 555 (20.7%) | 192 (5.8%) |
| 75 Years and over | 194 (15.1%) | 191 (17.2%) |
Disability Class: Vision Difficulty
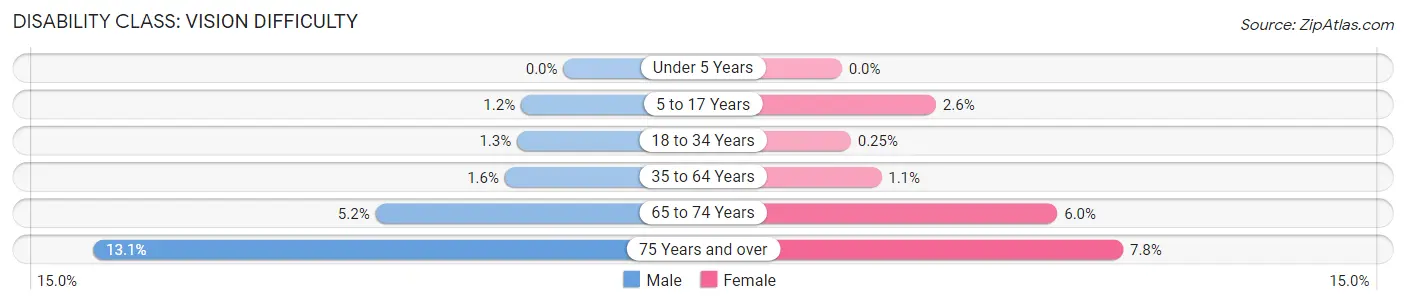
| Age Bracket | Male | Female |
| Under 5 Years | 0 (0.0%) | 0 (0.0%) |
| 5 to 17 Years | 76 (1.2%) | 165 (2.6%) |
| 18 to 34 Years | 77 (1.3%) | 16 (0.3%) |
| 35 to 64 Years | 181 (1.6%) | 122 (1.1%) |
| 65 to 74 Years | 140 (5.2%) | 199 (6.0%) |
| 75 Years and over | 168 (13.1%) | 87 (7.8%) |
Disability Class: Cognitive Difficulty
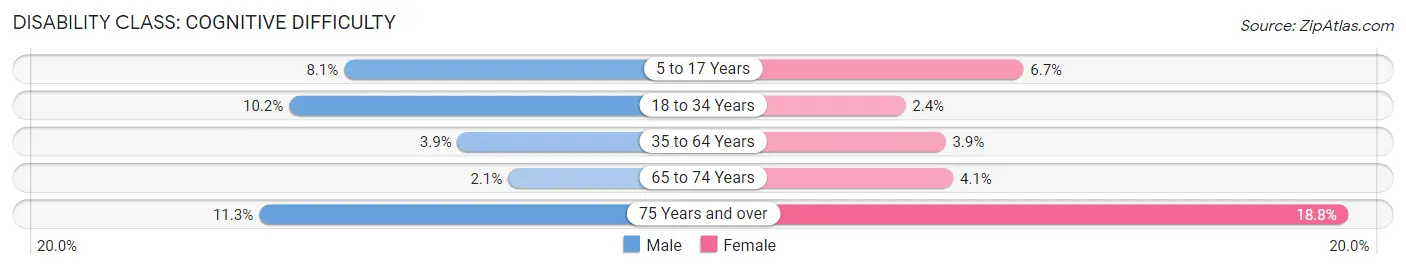
| Age Bracket | Male | Female |
| 5 to 17 Years | 524 (8.1%) | 425 (6.7%) |
| 18 to 34 Years | 608 (10.2%) | 149 (2.4%) |
| 35 to 64 Years | 436 (3.9%) | 425 (3.8%) |
| 65 to 74 Years | 55 (2.1%) | 137 (4.1%) |
| 75 Years and over | 145 (11.3%) | 209 (18.8%) |
Disability Class: Ambulatory Difficulty
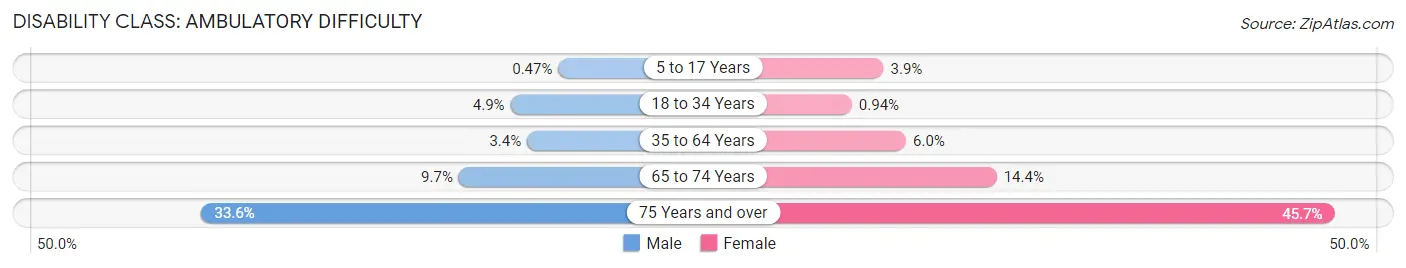
| Age Bracket | Male | Female |
| 5 to 17 Years | 30 (0.5%) | 245 (3.9%) |
| 18 to 34 Years | 293 (4.9%) | 59 (0.9%) |
| 35 to 64 Years | 374 (3.4%) | 660 (6.0%) |
| 65 to 74 Years | 260 (9.7%) | 477 (14.4%) |
| 75 Years and over | 431 (33.6%) | 508 (45.7%) |
Disability Class: Self-Care Difficulty
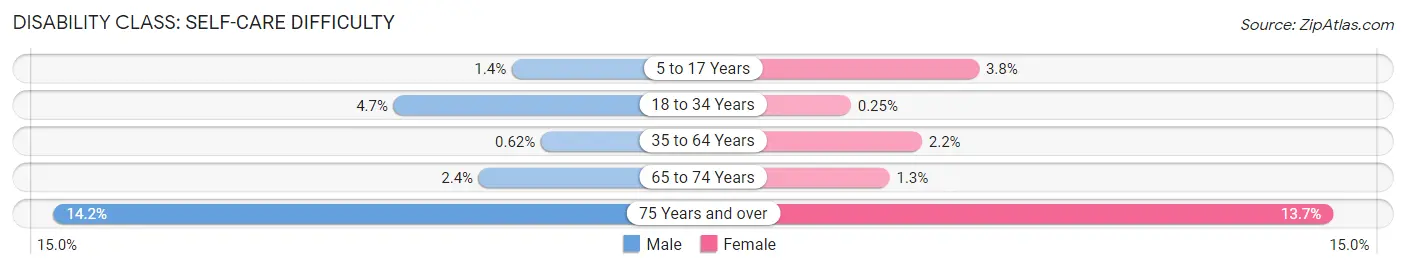
| Age Bracket | Male | Female |
| 5 to 17 Years | 92 (1.4%) | 241 (3.8%) |
| 18 to 34 Years | 282 (4.7%) | 16 (0.3%) |
| 35 to 64 Years | 69 (0.6%) | 246 (2.2%) |
| 65 to 74 Years | 63 (2.4%) | 44 (1.3%) |
| 75 Years and over | 182 (14.2%) | 152 (13.7%) |
Technology Access in Maricopa
Computing Device Access in Maricopa
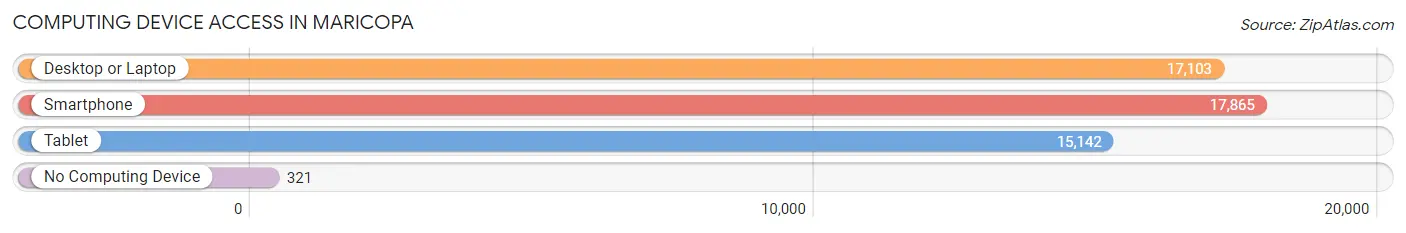
| Device Type | # Households | % Households |
| Desktop or Laptop | 17,103 | 90.6% |
| Smartphone | 17,865 | 94.7% |
| Tablet | 15,142 | 80.2% |
| No Computing Device | 321 | 1.7% |
| Total | 18,869 | 100.0% |
Internet Access in Maricopa
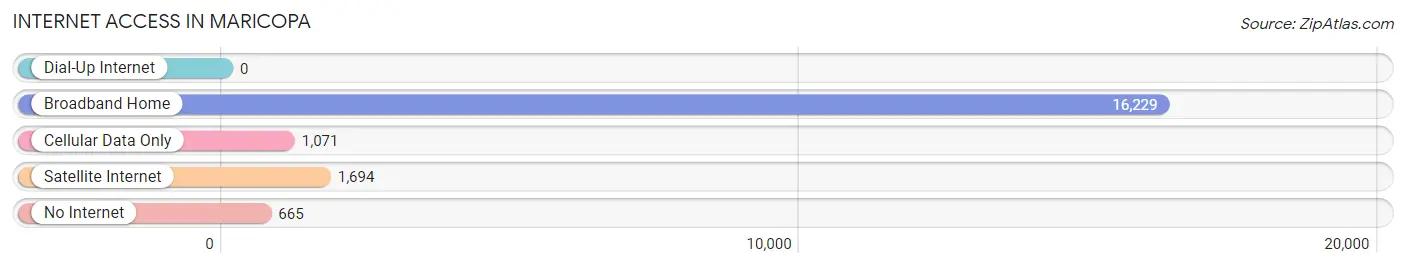
| Internet Type | # Households | % Households |
| Dial-Up Internet | 0 | 0.0% |
| Broadband Home | 16,229 | 86.0% |
| Cellular Data Only | 1,071 | 5.7% |
| Satellite Internet | 1,694 | 9.0% |
| No Internet | 665 | 3.5% |
| Total | 18,869 | 100.0% |
Maricopa Summary
Maricopa, Arizona is a city located in the south-central part of the state, about 35 miles south of Phoenix. It is the second-largest city in Arizona, with a population of over 50,000 people. Maricopa is a rapidly growing city, with a population that has more than doubled since 2000.
History
Maricopa was first settled in 1871 by a group of settlers from the nearby Pima Indian Reservation. The settlers named the area Maricopa after the Maricopa Indians, who had lived in the area for centuries. The town was officially incorporated in 2003.
Geography
Maricopa is located in the Sonoran Desert, at an elevation of 1,085 feet. The city is bordered by the Gila River to the west, and the Salt River to the east. The city is located in the Maricopa County, which is the fourth-largest county in the United States.
The climate in Maricopa is hot and dry, with temperatures reaching over 100 degrees Fahrenheit in the summer months. Winters are mild, with temperatures rarely dropping below freezing.
Economy
Maricopa’s economy is largely based on tourism, agriculture, and manufacturing. The city is home to several large companies, including Intel, Boeing, and Honeywell. The city also has a thriving retail sector, with several large shopping malls and outlets.
Maricopa is also home to several casinos, which attract visitors from all over the state. The city is also home to several golf courses, which attract golfers from all over the world.
Demographics
As of the 2010 census, Maricopa had a population of 43,482 people. The racial makeup of the city was 75.3% White, 4.2% African American, 0.7% Native American, 1.3% Asian, 0.2% Pacific Islander, and 17.5% from other races. Hispanic or Latino of any race were 33.2% of the population.
Maricopa is a diverse city, with a large population of immigrants from Mexico, Central America, and South America. The city also has a large population of Native Americans, with the Pima and Maricopa tribes both having a significant presence in the city.
Maricopa is a rapidly growing city, with a population that has more than doubled since 2000. The city is expected to continue to grow in the coming years, as more people move to the area for its warm climate and strong economy.
Common Questions
What is the Total Population of Maricopa?
Total Population of Maricopa is 59,605.
What is the Total Male Population of Maricopa?
Total Male Population of Maricopa is 29,359.
What is the Total Female Population of Maricopa?
Total Female Population of Maricopa is 30,246.
What is the Ratio of Males per 100 Females in Maricopa?
There are 97.07 Males per 100 Females in Maricopa.
What is the Ratio of Females per 100 Males in Maricopa?
There are 103.02 Females per 100 Males in Maricopa.
What is the Median Population Age in Maricopa?
Median Population Age in Maricopa is 35.7 Years.
What is the Average Family Size in Maricopa
Average Family Size in Maricopa is 3.4 People.
What is the Average Household Size in Maricopa
Average Household Size in Maricopa is 3.2 People.
What is Per Capita Income in Maricopa?
Per Capita income in Maricopa is $33,574.
What is the Median Family Income in Maricopa?
Median Family Income in Maricopa is $90,720.
What is the Median Household income in Maricopa?
Median Household Income in Maricopa is $88,795.
What is Income or Wage Gap in Maricopa?
Income or Wage Gap in Maricopa is 21.2%.
Women in Maricopa earn 78.8 cents for every dollar earned by a man.
What is Family Income Deficit in Maricopa?
Family Income Deficit in Maricopa is $11,740.
Families that are below poverty line in Maricopa earn $11,740 less on average than the poverty threshold level.
What is Inequality or Gini Index in Maricopa?
Inequality or Gini Index in Maricopa is 0.34.
How Large is the Labor Force in Maricopa?
There are 28,895 People in the Labor Forcein in Maricopa.
What is the Percentage of People in the Labor Force in Maricopa?
64.6% of People are in the Labor Force in Maricopa.
What is the Unemployment Rate in Maricopa?
Unemployment Rate in Maricopa is 3.5%.