Cities with the Most Immigrants from South Central Asia in Arizona
RELATED REPORTS & OPTIONS
South Central Asia
Arizona
Compare Cities
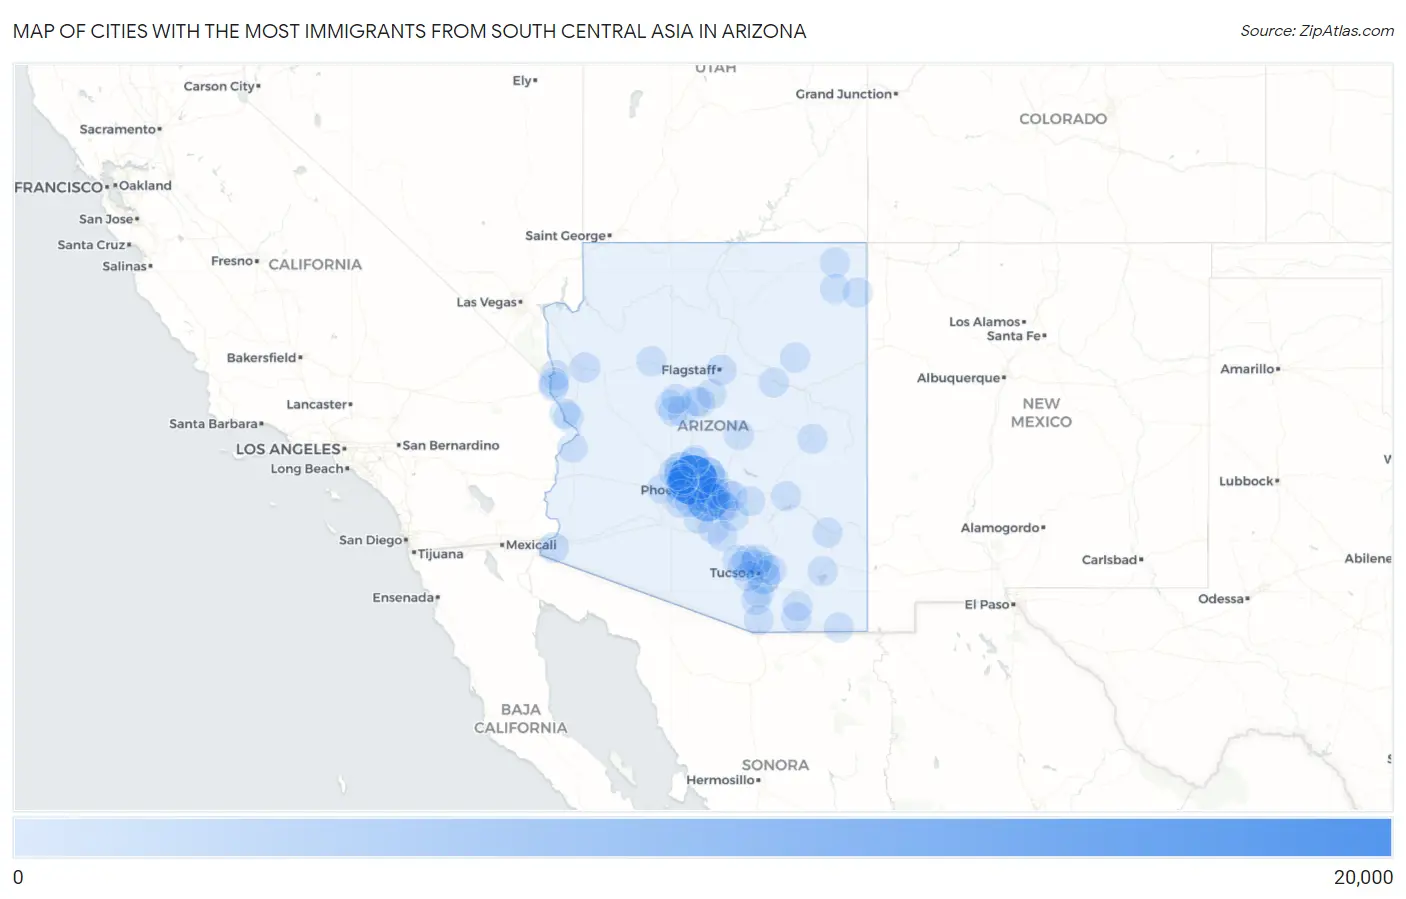
Map of Cities with the Most Immigrants from South Central Asia in Arizona
0
20,000
Cities with the Most Immigrants from South Central Asia in Arizona
| City | South Central Asia | vs State | vs National | |
| 1. | Phoenix | 19,305 | 59,390(32.51%)#1 | 4,330,976(0.45%)#21 |
| 2. | Chandler | 9,796 | 59,390(16.49%)#2 | 4,330,976(0.23%)#41 |
| 3. | Tempe | 5,599 | 59,390(9.43%)#3 | 4,330,976(0.13%)#85 |
| 4. | Scottsdale | 4,794 | 59,390(8.07%)#4 | 4,330,976(0.11%)#111 |
| 5. | Peoria | 3,347 | 59,390(5.64%)#5 | 4,330,976(0.08%)#184 |
| 6. | Tucson | 3,070 | 59,390(5.17%)#6 | 4,330,976(0.07%)#203 |
| 7. | Gilbert | 2,603 | 59,390(4.38%)#7 | 4,330,976(0.06%)#243 |
| 8. | Glendale | 1,675 | 59,390(2.82%)#8 | 4,330,976(0.04%)#393 |
| 9. | Mesa | 1,503 | 59,390(2.53%)#9 | 4,330,976(0.03%)#437 |
| 10. | Catalina Foothills | 885 | 59,390(1.49%)#10 | 4,330,976(0.02%)#750 |
| 11. | Casas Adobes | 531 | 59,390(0.89%)#11 | 4,330,976(0.01%)#1,095 |
| 12. | Oro Valley | 521 | 59,390(0.88%)#12 | 4,330,976(0.01%)#1,111 |
| 13. | Casa Grande | 441 | 59,390(0.74%)#13 | 4,330,976(0.01%)#1,222 |
| 14. | Marana | 418 | 59,390(0.70%)#14 | 4,330,976(0.01%)#1,261 |
| 15. | San Tan Valley | 364 | 59,390(0.61%)#15 | 4,330,976(0.01%)#1,386 |
| 16. | Goodyear | 287 | 59,390(0.48%)#16 | 4,330,976(0.01%)#1,608 |
| 17. | Flagstaff | 278 | 59,390(0.47%)#17 | 4,330,976(0.01%)#1,650 |
| 18. | Sierra Vista | 225 | 59,390(0.38%)#18 | 4,330,976(0.01%)#1,858 |
| 19. | Queen Creek | 192 | 59,390(0.32%)#19 | 4,330,976(0.00%)#2,043 |
| 20. | Yuma | 188 | 59,390(0.32%)#20 | 4,330,976(0.00%)#2,062 |
| 21. | Paradise Valley | 180 | 59,390(0.30%)#21 | 4,330,976(0.00%)#2,108 |
| 22. | Kingman | 173 | 59,390(0.29%)#22 | 4,330,976(0.00%)#2,168 |
| 23. | Maricopa | 167 | 59,390(0.28%)#23 | 4,330,976(0.00%)#2,208 |
| 24. | Bullhead City | 146 | 59,390(0.25%)#24 | 4,330,976(0.00%)#2,362 |
| 25. | El Mirage | 115 | 59,390(0.19%)#25 | 4,330,976(0.00%)#2,637 |
| 26. | Buckeye | 108 | 59,390(0.18%)#26 | 4,330,976(0.00%)#2,709 |
| 27. | Prescott Valley | 102 | 59,390(0.17%)#27 | 4,330,976(0.00%)#2,784 |
| 28. | Surprise | 100 | 59,390(0.17%)#28 | 4,330,976(0.00%)#2,814 |
| 29. | Eloy | 97 | 59,390(0.16%)#29 | 4,330,976(0.00%)#2,867 |
| 30. | Fountain Hills | 87 | 59,390(0.15%)#30 | 4,330,976(0.00%)#3,016 |
| 31. | Litchfield Park | 85 | 59,390(0.14%)#31 | 4,330,976(0.00%)#3,052 |
| 32. | Youngtown | 83 | 59,390(0.14%)#32 | 4,330,976(0.00%)#3,087 |
| 33. | Sahuarita | 74 | 59,390(0.12%)#33 | 4,330,976(0.00%)#3,211 |
| 34. | Apache Junction | 71 | 59,390(0.12%)#34 | 4,330,976(0.00%)#3,269 |
| 35. | Wagon Wheel | 63 | 59,390(0.11%)#35 | 4,330,976(0.00%)#3,451 |
| 36. | Parker | 60 | 59,390(0.10%)#36 | 4,330,976(0.00%)#3,514 |
| 37. | Whetstone | 60 | 59,390(0.10%)#37 | 4,330,976(0.00%)#3,515 |
| 38. | Lake Havasu City | 53 | 59,390(0.09%)#38 | 4,330,976(0.00%)#3,660 |
| 39. | Avondale | 52 | 59,390(0.09%)#39 | 4,330,976(0.00%)#3,679 |
| 40. | New River | 52 | 59,390(0.09%)#40 | 4,330,976(0.00%)#3,689 |
| 41. | Prescott | 47 | 59,390(0.08%)#41 | 4,330,976(0.00%)#3,839 |
| 42. | Gila Crossing | 47 | 59,390(0.08%)#42 | 4,330,976(0.00%)#3,863 |
| 43. | Sun City | 45 | 59,390(0.08%)#43 | 4,330,976(0.00%)#3,892 |
| 44. | Tanque Verde | 45 | 59,390(0.08%)#44 | 4,330,976(0.00%)#3,902 |
| 45. | Green Valley | 41 | 59,390(0.07%)#45 | 4,330,976(0.00%)#4,015 |
| 46. | San Carlos | 41 | 59,390(0.07%)#46 | 4,330,976(0.00%)#4,028 |
| 47. | Desert Hills | 40 | 59,390(0.07%)#47 | 4,330,976(0.00%)#4,063 |
| 48. | Tucson Mountains | 36 | 59,390(0.06%)#48 | 4,330,976(0.00%)#4,180 |
| 49. | Verde Village | 35 | 59,390(0.06%)#49 | 4,330,976(0.00%)#4,213 |
| 50. | Clarkdale | 35 | 59,390(0.06%)#50 | 4,330,976(0.00%)#4,228 |
| 51. | Sedona | 34 | 59,390(0.06%)#51 | 4,330,976(0.00%)#4,258 |
| 52. | Williamson | 29 | 59,390(0.05%)#52 | 4,330,976(0.00%)#4,483 |
| 53. | Sun City West | 28 | 59,390(0.05%)#53 | 4,330,976(0.00%)#4,516 |
| 54. | Seligman | 27 | 59,390(0.05%)#54 | 4,330,976(0.00%)#4,611 |
| 55. | Anthem | 26 | 59,390(0.04%)#55 | 4,330,976(0.00%)#4,619 |
| 56. | Florence | 25 | 59,390(0.04%)#56 | 4,330,976(0.00%)#4,675 |
| 57. | Payson | 22 | 59,390(0.04%)#57 | 4,330,976(0.00%)#4,891 |
| 58. | Willcox | 22 | 59,390(0.04%)#58 | 4,330,976(0.00%)#4,920 |
| 59. | Chino Valley | 19 | 59,390(0.03%)#59 | 4,330,976(0.00%)#5,073 |
| 60. | Rock Point | 17 | 59,390(0.03%)#60 | 4,330,976(0.00%)#5,281 |
| 61. | Tucson Estates | 16 | 59,390(0.03%)#61 | 4,330,976(0.00%)#5,299 |
| 62. | Avra Valley | 15 | 59,390(0.03%)#62 | 4,330,976(0.00%)#5,373 |
| 63. | Many Farms | 15 | 59,390(0.03%)#63 | 4,330,976(0.00%)#5,419 |
| 64. | Douglas | 13 | 59,390(0.02%)#64 | 4,330,976(0.00%)#5,517 |
| 65. | Fort Mohave | 10 | 59,390(0.02%)#65 | 4,330,976(0.00%)#5,835 |
| 66. | Picture Rocks | 10 | 59,390(0.02%)#66 | 4,330,976(0.00%)#5,851 |
| 67. | Thatcher | 9 | 59,390(0.02%)#67 | 4,330,976(0.00%)#5,996 |
| 68. | Rio Rico | 8 | 59,390(0.01%)#68 | 4,330,976(0.00%)#6,089 |
| 69. | Dilkon | 7 | 59,390(0.01%)#69 | 4,330,976(0.00%)#6,304 |
| 70. | Gold Canyon | 5 | 59,390(0.01%)#70 | 4,330,976(0.00%)#6,473 |
| 71. | Winslow | 5 | 59,390(0.01%)#71 | 4,330,976(0.00%)#6,479 |
| 72. | Mesquite Creek | 5 | 59,390(0.01%)#72 | 4,330,976(0.00%)#6,580 |
| 73. | Tsaile | 4 | 59,390(0.01%)#73 | 4,330,976(0.00%)#6,676 |
| 74. | Superior | 3 | 59,390(0.01%)#74 | 4,330,976(0.00%)#6,761 |
Common Questions
What are the Top 10 Cities with the Most Immigrants from South Central Asia in Arizona?
Top 10 Cities with the Most Immigrants from South Central Asia in Arizona are:
#1
19,305
#2
9,796
#3
5,599
#4
4,794
#5
3,347
#6
3,070
#7
2,603
#8
1,675
#9
1,503
#10
885
What city has the Most Immigrants from South Central Asia in Arizona?
Phoenix has the Most Immigrants from South Central Asia in Arizona with 19,305.
What is the Total Immigrants from South Central Asia in the State of Arizona?
Total Immigrants from South Central Asia in Arizona is 59,390.
What is the Total Immigrants from South Central Asia in the United States?
Total Immigrants from South Central Asia in the United States is 4,330,976.