Benson, AZ
Benson Map
Benson Overview
5,318
TOTAL POPULATION
2,657
MALE POPULATION
2,661
FEMALE POPULATION
99.85
MALES / 100 FEMALES
100.15
FEMALES / 100 MALES
50.1
MEDIAN AGE
2.9
AVG FAMILY SIZE
2.3
AVG HOUSEHOLD SIZE
$29,164
PER CAPITA INCOME
$66,325
AVG FAMILY INCOME
$49,955
AVG HOUSEHOLD INCOME
24.6%
WAGE / INCOME GAP [ % ]
75.4¢/ $1
WAGE / INCOME GAP [ $ ]
0.42
INEQUALITY / GINI INDEX
2,282
LABOR FORCE [ PEOPLE ]
51.6%
PERCENT IN LABOR FORCE
7.8%
UNEMPLOYMENT RATE
Benson Zip Codes
Benson Area Codes
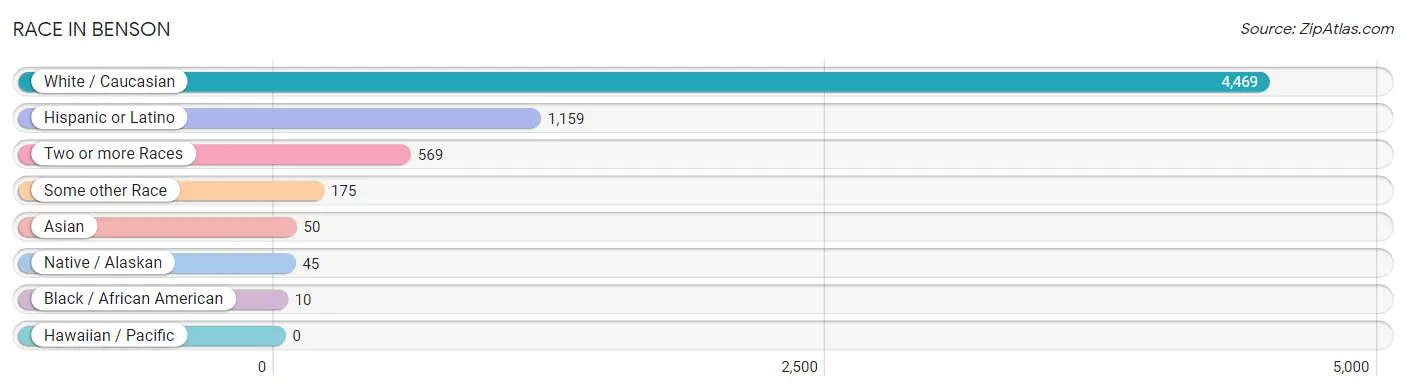
Race in Benson
The most populous races in Benson are White / Caucasian (4,469 | 84.0%), Hispanic or Latino (1,159 | 21.8%), and Two or more Races (569 | 10.7%).
| Race | # Population | % Population |
| Asian | 50 | 0.9% |
| Black / African American | 10 | 0.2% |
| Hawaiian / Pacific | 0 | 0.0% |
| Hispanic or Latino | 1,159 | 21.8% |
| Native / Alaskan | 45 | 0.9% |
| White / Caucasian | 4,469 | 84.0% |
| Two or more Races | 569 | 10.7% |
| Some other Race | 175 | 3.3% |
| Total | 5,318 | 100.0% |
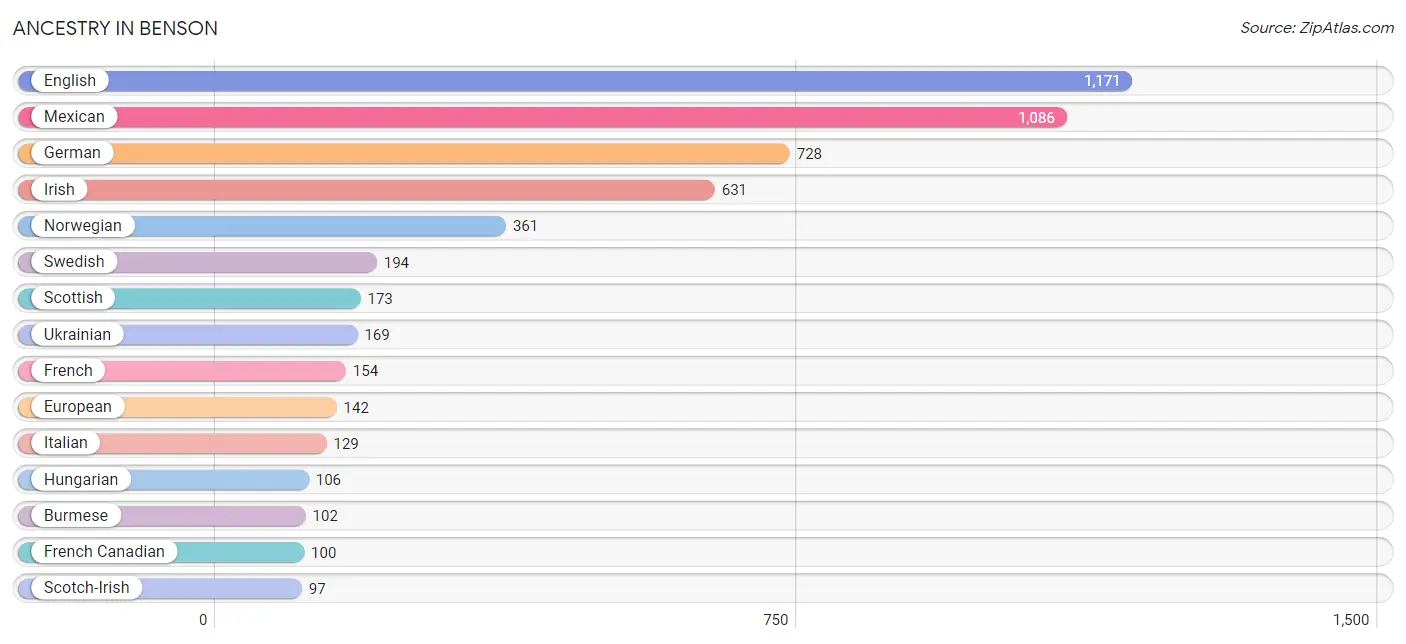
Ancestry in Benson
The most populous ancestries reported in Benson are English (1,171 | 22.0%), Mexican (1,086 | 20.4%), German (728 | 13.7%), Irish (631 | 11.9%), and Norwegian (361 | 6.8%), together accounting for 74.8% of all Benson residents.
| Ancestry | # Population | % Population |
| American | 90 | 1.7% |
| Arab | 19 | 0.4% |
| Armenian | 10 | 0.2% |
| Austrian | 12 | 0.2% |
| British | 84 | 1.6% |
| Burmese | 102 | 1.9% |
| Canadian | 20 | 0.4% |
| Central American | 18 | 0.3% |
| Cherokee | 22 | 0.4% |
| Creek | 4 | 0.1% |
| Czech | 9 | 0.2% |
| Dutch | 29 | 0.5% |
| English | 1,171 | 22.0% |
| European | 142 | 2.7% |
| Finnish | 17 | 0.3% |
| French | 154 | 2.9% |
| French Canadian | 100 | 1.9% |
| German | 728 | 13.7% |
| Guatemalan | 18 | 0.3% |
| Hungarian | 106 | 2.0% |
| Irish | 631 | 11.9% |
| Italian | 129 | 2.4% |
| Korean | 14 | 0.3% |
| Mexican | 1,086 | 20.4% |
| Northern European | 22 | 0.4% |
| Norwegian | 361 | 6.8% |
| Polish | 39 | 0.7% |
| Pueblo | 31 | 0.6% |
| Puerto Rican | 8 | 0.2% |
| Russian | 53 | 1.0% |
| Scandinavian | 13 | 0.2% |
| Scotch-Irish | 97 | 1.8% |
| Scottish | 173 | 3.3% |
| Spanish | 16 | 0.3% |
| Sri Lankan | 19 | 0.4% |
| Swedish | 194 | 3.6% |
| Swiss | 61 | 1.1% |
| Turkish | 14 | 0.3% |
| Ukrainian | 169 | 3.2% |
| Welsh | 78 | 1.5% |
| Yaqui | 11 | 0.2% | View All 41 Rows |
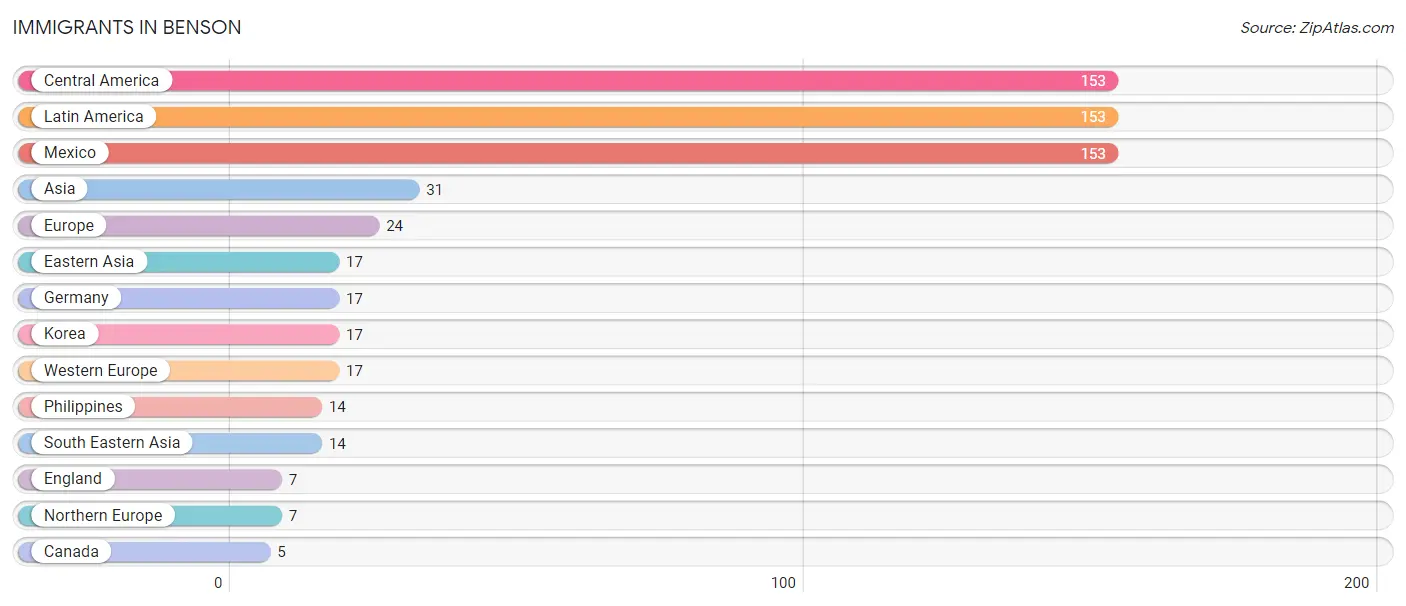
Immigrants in Benson
The most numerous immigrant groups reported in Benson came from Central America (153 | 2.9%), Latin America (153 | 2.9%), Mexico (153 | 2.9%), Asia (31 | 0.6%), and Europe (24 | 0.4%), together accounting for 9.7% of all Benson residents.
| Immigration Origin | # Population | % Population |
| Asia | 31 | 0.6% |
| Canada | 5 | 0.1% |
| Central America | 153 | 2.9% |
| Eastern Asia | 17 | 0.3% |
| England | 7 | 0.1% |
| Europe | 24 | 0.4% |
| Germany | 17 | 0.3% |
| Korea | 17 | 0.3% |
| Latin America | 153 | 2.9% |
| Mexico | 153 | 2.9% |
| Northern Europe | 7 | 0.1% |
| Philippines | 14 | 0.3% |
| South Eastern Asia | 14 | 0.3% |
| Western Europe | 17 | 0.3% | View All 14 Rows |
Sex and Age in Benson
Sex and Age in Benson
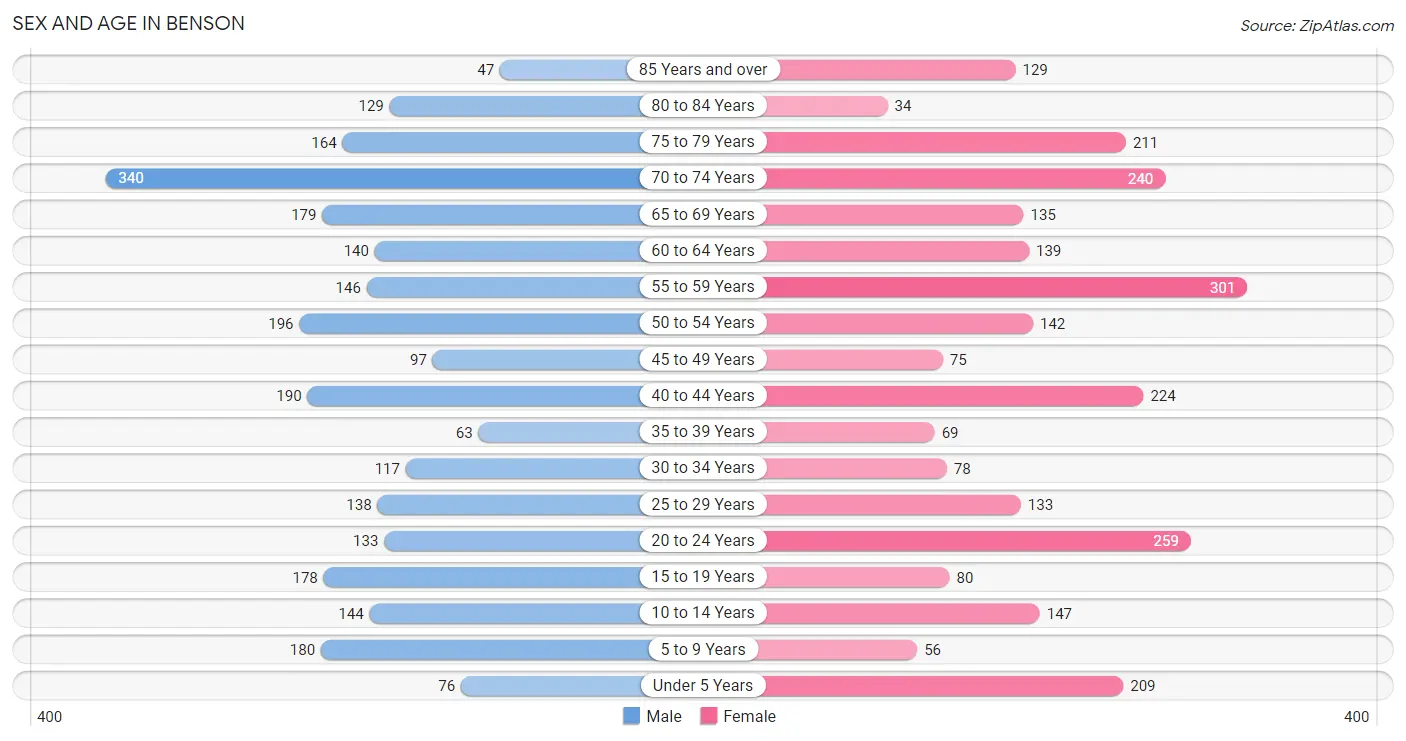
The most populous age groups in Benson are 70 to 74 Years (340 | 12.8%) for men and 55 to 59 Years (301 | 11.3%) for women.
| Age Bracket | Male | Female |
| Under 5 Years | 76 (2.9%) | 209 (7.9%) |
| 5 to 9 Years | 180 (6.8%) | 56 (2.1%) |
| 10 to 14 Years | 144 (5.4%) | 147 (5.5%) |
| 15 to 19 Years | 178 (6.7%) | 80 (3.0%) |
| 20 to 24 Years | 133 (5.0%) | 259 (9.7%) |
| 25 to 29 Years | 138 (5.2%) | 133 (5.0%) |
| 30 to 34 Years | 117 (4.4%) | 78 (2.9%) |
| 35 to 39 Years | 63 (2.4%) | 69 (2.6%) |
| 40 to 44 Years | 190 (7.1%) | 224 (8.4%) |
| 45 to 49 Years | 97 (3.6%) | 75 (2.8%) |
| 50 to 54 Years | 196 (7.4%) | 142 (5.3%) |
| 55 to 59 Years | 146 (5.5%) | 301 (11.3%) |
| 60 to 64 Years | 140 (5.3%) | 139 (5.2%) |
| 65 to 69 Years | 179 (6.7%) | 135 (5.1%) |
| 70 to 74 Years | 340 (12.8%) | 240 (9.0%) |
| 75 to 79 Years | 164 (6.2%) | 211 (7.9%) |
| 80 to 84 Years | 129 (4.9%) | 34 (1.3%) |
| 85 Years and over | 47 (1.8%) | 129 (4.9%) |
| Total | 2,657 (100.0%) | 2,661 (100.0%) |
Families and Households in Benson
Median Family Size in Benson
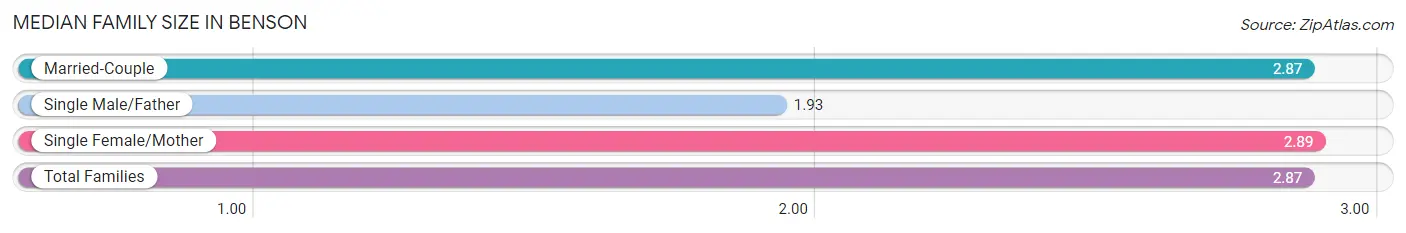
The median family size in Benson is 2.87 persons per family, with single female/mother families (411 | 29.9%) accounting for the largest median family size of 2.89 persons per family. On the other hand, single male/father families (14 | 1.0%) represent the smallest median family size with 1.93 persons per family.
| Family Type | # Families | Family Size |
| Married-Couple | 950 (69.1%) | 2.87 |
| Single Male/Father | 14 (1.0%) | 1.93 |
| Single Female/Mother | 411 (29.9%) | 2.89 |
| Total Families | 1,375 (100.0%) | 2.87 |
Median Household Size in Benson
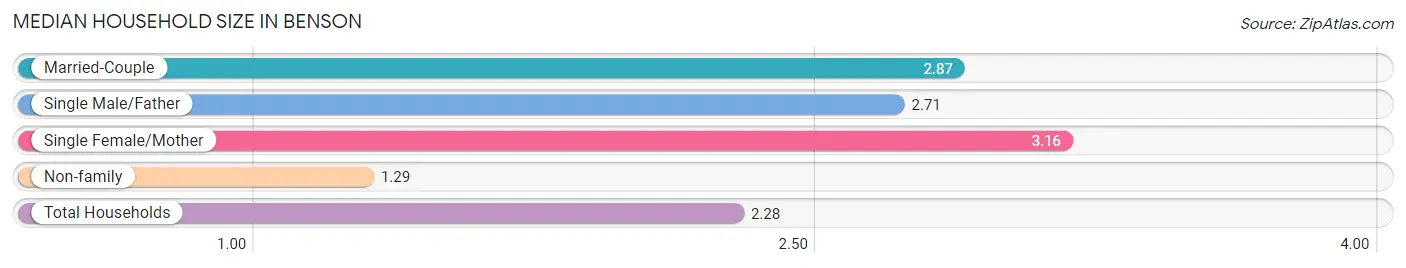
The median household size in Benson is 2.28 persons per household, with single female/mother households (411 | 17.7%) accounting for the largest median household size of 3.16 persons per household. non-family households (948 | 40.8%) represent the smallest median household size with 1.29 persons per household.
| Household Type | # Households | Household Size |
| Married-Couple | 950 (40.9%) | 2.87 |
| Single Male/Father | 14 (0.6%) | 2.71 |
| Single Female/Mother | 411 (17.7%) | 3.16 |
| Non-family | 948 (40.8%) | 1.29 |
| Total Households | 2,323 (100.0%) | 2.28 |
Household Size by Marriage Status in Benson
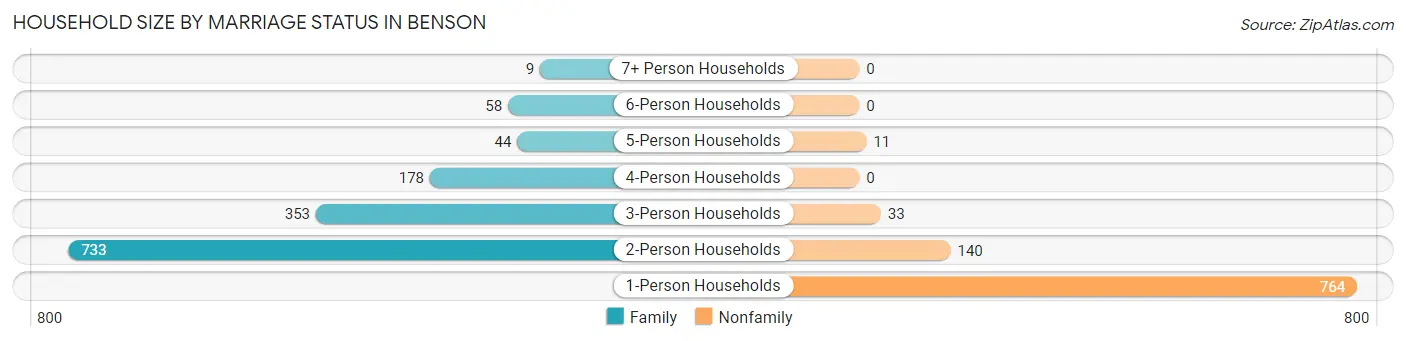
Out of a total of 2,323 households in Benson, 1,375 (59.2%) are family households, while 948 (40.8%) are nonfamily households. The most numerous type of family households are 2-person households, comprising 733, and the most common type of nonfamily households are 1-person households, comprising 764.
| Household Size | Family Households | Nonfamily Households |
| 1-Person Households | - | 764 (32.9%) |
| 2-Person Households | 733 (31.6%) | 140 (6.0%) |
| 3-Person Households | 353 (15.2%) | 33 (1.4%) |
| 4-Person Households | 178 (7.7%) | 0 (0.0%) |
| 5-Person Households | 44 (1.9%) | 11 (0.5%) |
| 6-Person Households | 58 (2.5%) | 0 (0.0%) |
| 7+ Person Households | 9 (0.4%) | 0 (0.0%) |
| Total | 1,375 (59.2%) | 948 (40.8%) |
Female Fertility in Benson
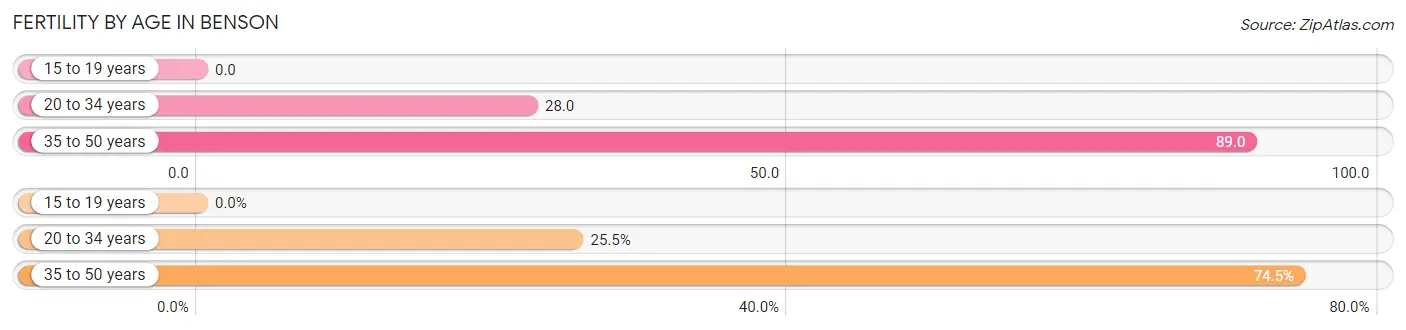
Fertility by Age in Benson
Average fertility rate in Benson is 52.0 births per 1,000 women. Women in the age bracket of 35 to 50 years have the highest fertility rate with 89.0 births per 1,000 women. Women in the age bracket of 35 to 50 years acount for 74.5% of all women with births.
| Age Bracket | Women with Births | Births / 1,000 Women |
| 15 to 19 years | 0 (0.0%) | 0.0 |
| 20 to 34 years | 13 (25.5%) | 28.0 |
| 35 to 50 years | 38 (74.5%) | 89.0 |
| Total | 51 (100.0%) | 52.0 |
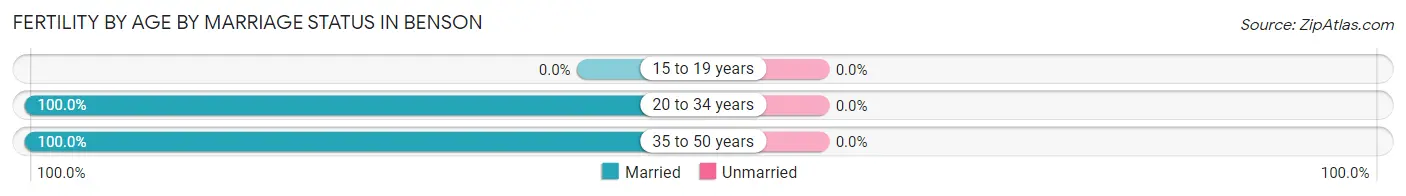
Fertility by Age by Marriage Status in Benson
| Age Bracket | Married | Unmarried |
| 15 to 19 years | 0 (0.0%) | 0 (0.0%) |
| 20 to 34 years | 13 (100.0%) | 0 (0.0%) |
| 35 to 50 years | 38 (100.0%) | 0 (0.0%) |
| Total | 51 (100.0%) | 0 (0.0%) |
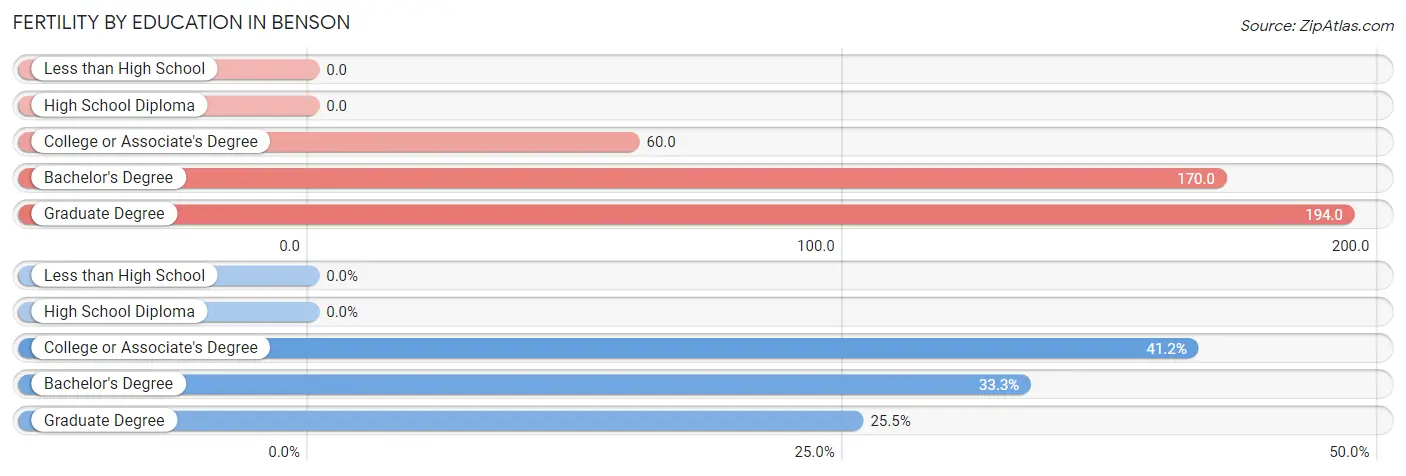
Fertility by Education in Benson
| Educational Attainment | Women with Births | Births / 1,000 Women |
| Less than High School | 0 (0.0%) | 0.0 |
| High School Diploma | 0 (0.0%) | 0.0 |
| College or Associate's Degree | 21 (41.2%) | 60.0 |
| Bachelor's Degree | 17 (33.3%) | 170.0 |
| Graduate Degree | 13 (25.5%) | 194.0 |
| Total | 51 (100.0%) | 52.0 |
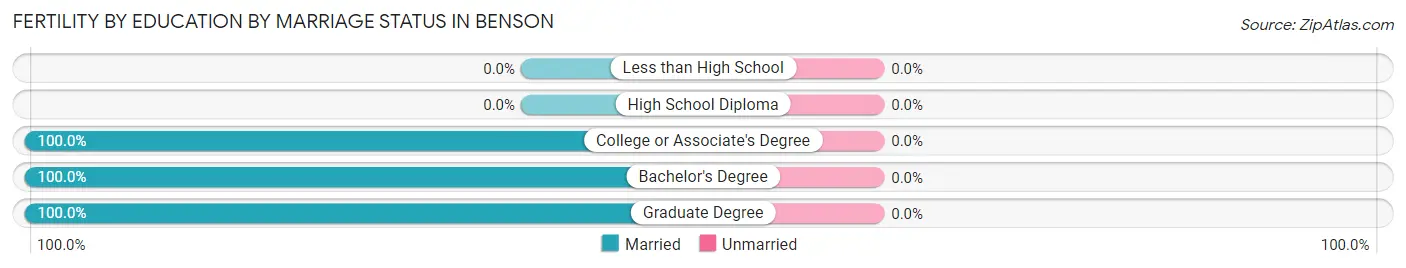
Fertility by Education by Marriage Status in Benson
| Educational Attainment | Married | Unmarried |
| Less than High School | 0 (0.0%) | 0 (0.0%) |
| High School Diploma | 0 (0.0%) | 0 (0.0%) |
| College or Associate's Degree | 21 (100.0%) | 0 (0.0%) |
| Bachelor's Degree | 17 (100.0%) | 0 (0.0%) |
| Graduate Degree | 13 (100.0%) | 0 (0.0%) |
| Total | 51 (100.0%) | 0 (0.0%) |
Income in Benson
Income Overview in Benson
Per Capita Income in Benson is $29,164, while median incomes of families and households are $66,325 and $49,955 respectively.
| Characteristic | Number | Measure |
| Per Capita Income | 5,318 | $29,164 |
| Median Family Income | 1,375 | $66,325 |
| Mean Family Income | 1,375 | $79,503 |
| Median Household Income | 2,323 | $49,955 |
| Mean Household Income | 2,323 | $63,496 |
| Income Deficit | 1,375 | $0 |
| Wage / Income Gap (%) | 5,318 | 24.59% |
| Wage / Income Gap ($) | 5,318 | 75.41¢ per $1 |
| Gini / Inequality Index | 5,318 | 0.42 |
Earnings by Sex in Benson
Average Earnings in Benson are $27,117, $32,925 for men and $24,828 for women, a difference of 24.6%.
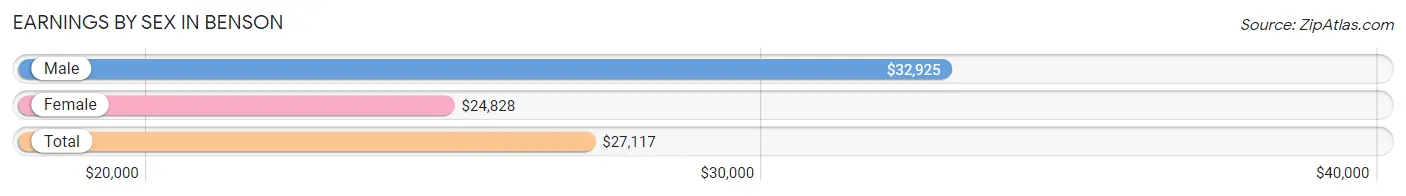
| Sex | Number | Average Earnings |
| Male | 1,114 (48.6%) | $32,925 |
| Female | 1,178 (51.4%) | $24,828 |
| Total | 2,292 (100.0%) | $27,117 |
Earnings by Sex by Income Bracket in Benson
The most common earnings brackets in Benson are $100,000+ for men (194 | 17.4%) and $25,000 to $29,999 for women (154 | 13.1%).
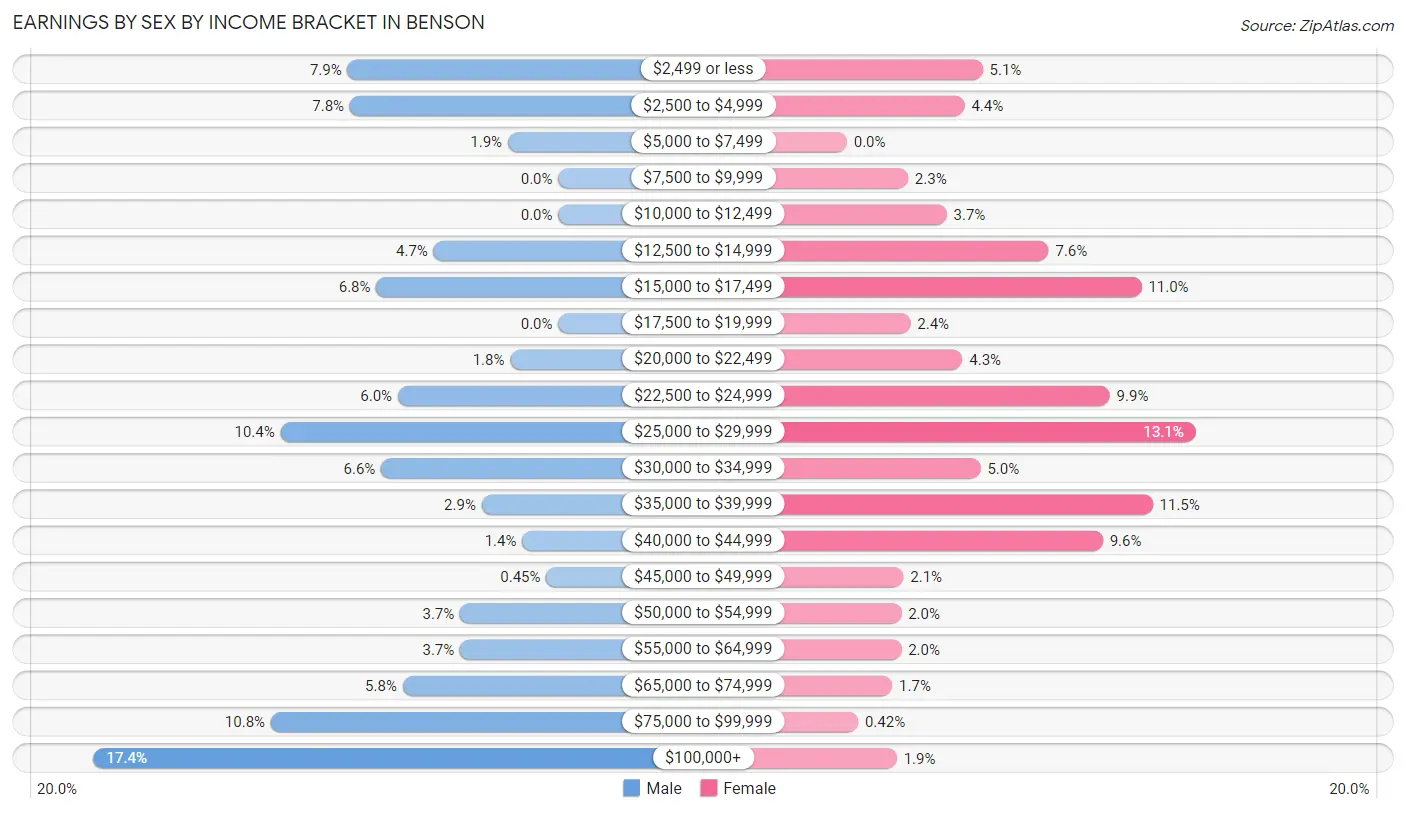
| Income | Male | Female |
| $2,499 or less | 88 (7.9%) | 60 (5.1%) |
| $2,500 to $4,999 | 87 (7.8%) | 52 (4.4%) |
| $5,000 to $7,499 | 21 (1.9%) | 0 (0.0%) |
| $7,500 to $9,999 | 0 (0.0%) | 27 (2.3%) |
| $10,000 to $12,499 | 0 (0.0%) | 44 (3.7%) |
| $12,500 to $14,999 | 52 (4.7%) | 89 (7.6%) |
| $15,000 to $17,499 | 76 (6.8%) | 130 (11.0%) |
| $17,500 to $19,999 | 0 (0.0%) | 28 (2.4%) |
| $20,000 to $22,499 | 20 (1.8%) | 51 (4.3%) |
| $22,500 to $24,999 | 67 (6.0%) | 116 (9.9%) |
| $25,000 to $29,999 | 116 (10.4%) | 154 (13.1%) |
| $30,000 to $34,999 | 74 (6.6%) | 59 (5.0%) |
| $35,000 to $39,999 | 32 (2.9%) | 135 (11.5%) |
| $40,000 to $44,999 | 15 (1.3%) | 113 (9.6%) |
| $45,000 to $49,999 | 5 (0.4%) | 25 (2.1%) |
| $50,000 to $54,999 | 41 (3.7%) | 24 (2.0%) |
| $55,000 to $64,999 | 41 (3.7%) | 24 (2.0%) |
| $65,000 to $74,999 | 65 (5.8%) | 20 (1.7%) |
| $75,000 to $99,999 | 120 (10.8%) | 5 (0.4%) |
| $100,000+ | 194 (17.4%) | 22 (1.9%) |
| Total | 1,114 (100.0%) | 1,178 (100.0%) |
Earnings by Sex by Educational Attainment in Benson
Average earnings in Benson are $44,167 for men and $26,925 for women, a difference of 39.0%. Men with an educational attainment of bachelor's degree enjoy the highest average annual earnings of $100,217, while those with less than high school education earn the least with $27,557. Women with an educational attainment of graduate degree earn the most with the average annual earnings of $56,354, while those with high school diploma education have the smallest earnings of $24,655.
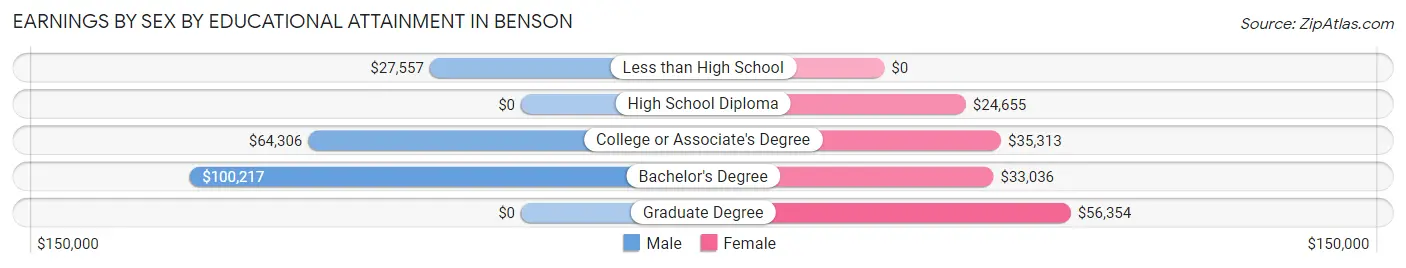
| Educational Attainment | Male Income | Female Income |
| Less than High School | $27,557 | $0 |
| High School Diploma | - | - |
| College or Associate's Degree | $64,306 | $35,313 |
| Bachelor's Degree | $100,217 | $33,036 |
| Graduate Degree | - | - |
| Total | $44,167 | $26,925 |
Family Income in Benson
Family Income Brackets in Benson
According to the Benson family income data, there are 285 families falling into the $50,000 to $74,999 income range, which is the most common income bracket and makes up 20.7% of all families. Conversely, the less than $10,000 income bracket is the least frequent group with only 14 families (1.0%) belonging to this category.
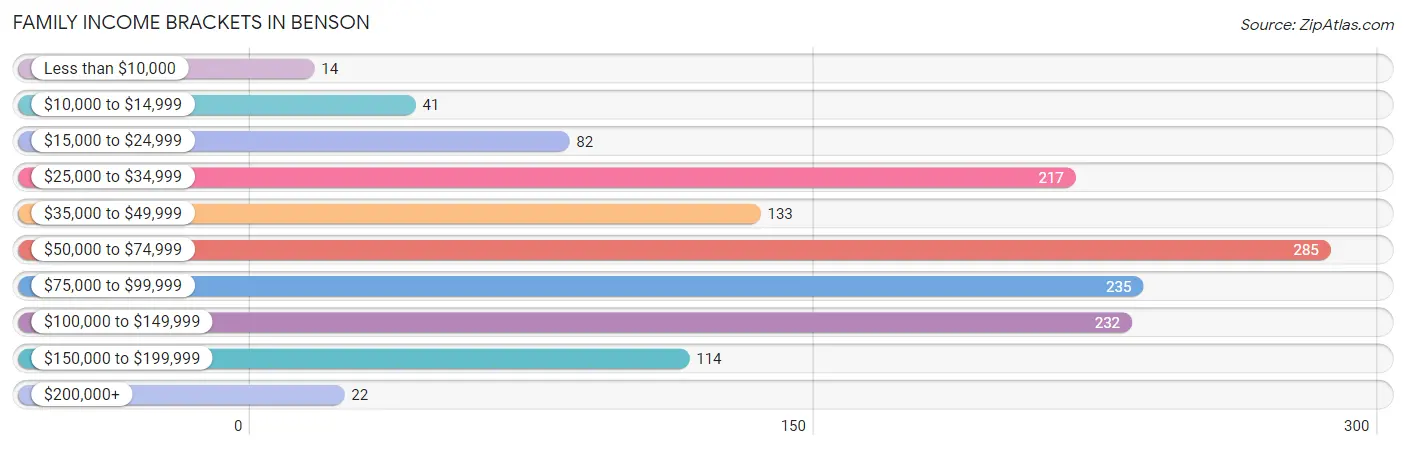
| Income Bracket | # Families | % Families |
| Less than $10,000 | 14 | 1.0% |
| $10,000 to $14,999 | 41 | 3.0% |
| $15,000 to $24,999 | 82 | 6.0% |
| $25,000 to $34,999 | 217 | 15.8% |
| $35,000 to $49,999 | 133 | 9.7% |
| $50,000 to $74,999 | 285 | 20.7% |
| $75,000 to $99,999 | 235 | 17.1% |
| $100,000 to $149,999 | 232 | 16.9% |
| $150,000 to $199,999 | 114 | 8.3% |
| $200,000+ | 22 | 1.6% |
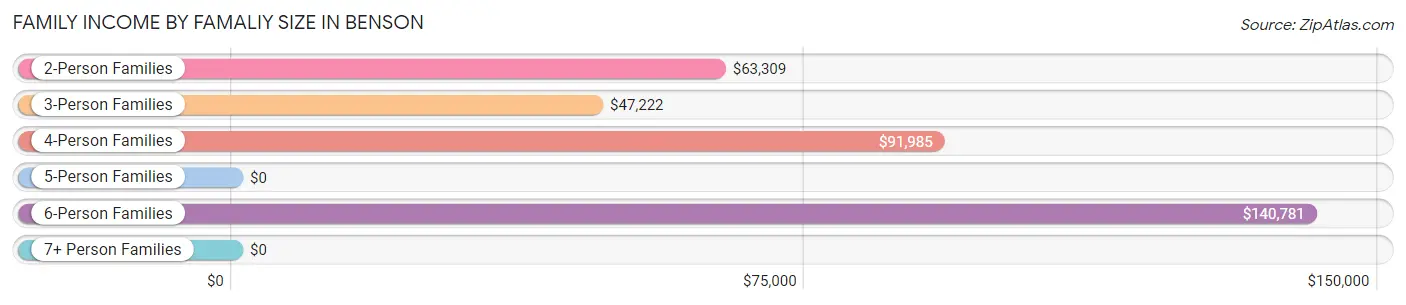
Family Income by Famaliy Size in Benson
6-person families (58 | 4.2%) account for the highest median family income in Benson with $140,781 per family, while 2-person families (815 | 59.3%) have the highest median income of $31,654 per family member.
| Income Bracket | # Families | Median Income |
| 2-Person Families | 815 (59.3%) | $63,309 |
| 3-Person Families | 300 (21.8%) | $47,222 |
| 4-Person Families | 177 (12.9%) | $91,985 |
| 5-Person Families | 16 (1.2%) | $0 |
| 6-Person Families | 58 (4.2%) | $140,781 |
| 7+ Person Families | 9 (0.6%) | $0 |
| Total | 1,375 (100.0%) | $66,325 |
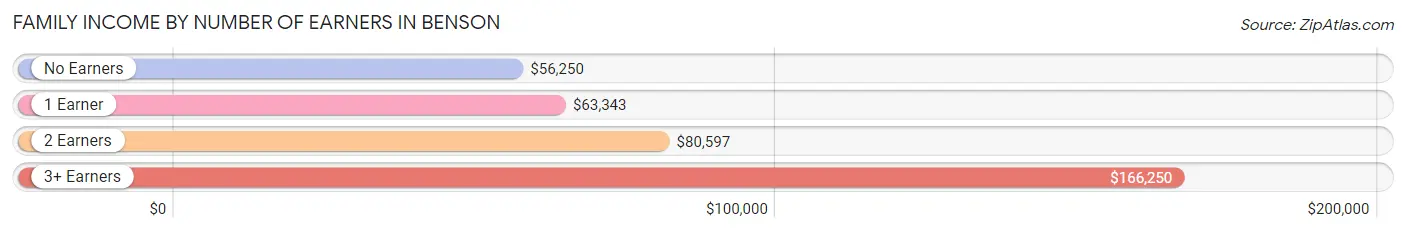
Family Income by Number of Earners in Benson
The median family income in Benson is $66,325, with families comprising 3+ earners (100) having the highest median family income of $166,250, while families with no earners (373) have the lowest median family income of $56,250, accounting for 7.3% and 27.1% of families, respectively.
| Number of Earners | # Families | Median Income |
| No Earners | 373 (27.1%) | $56,250 |
| 1 Earner | 551 (40.1%) | $63,343 |
| 2 Earners | 351 (25.5%) | $80,597 |
| 3+ Earners | 100 (7.3%) | $166,250 |
| Total | 1,375 (100.0%) | $66,325 |
Household Income in Benson
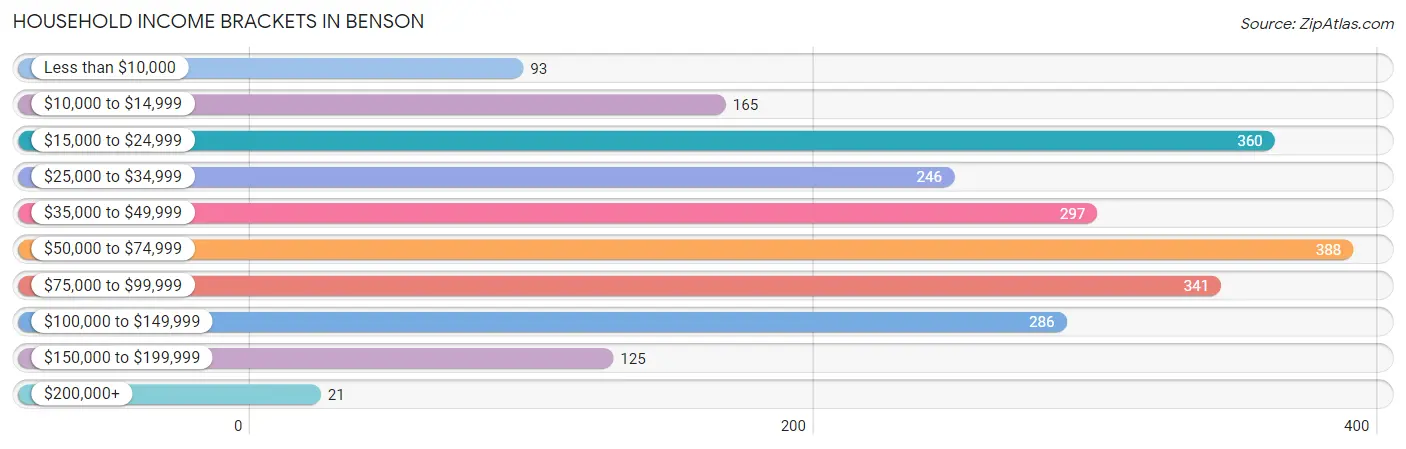
Household Income Brackets in Benson
With 388 households falling in the category, the $50,000 to $74,999 income range is the most frequent in Benson, accounting for 16.7% of all households. In contrast, only 21 households (0.9%) fall into the $200,000+ income bracket, making it the least populous group.
| Income Bracket | # Households | % Households |
| Less than $10,000 | 93 | 4.0% |
| $10,000 to $14,999 | 165 | 7.1% |
| $15,000 to $24,999 | 360 | 15.5% |
| $25,000 to $34,999 | 246 | 10.6% |
| $35,000 to $49,999 | 297 | 12.8% |
| $50,000 to $74,999 | 388 | 16.7% |
| $75,000 to $99,999 | 341 | 14.7% |
| $100,000 to $149,999 | 286 | 12.3% |
| $150,000 to $199,999 | 125 | 5.4% |
| $200,000+ | 21 | 0.9% |
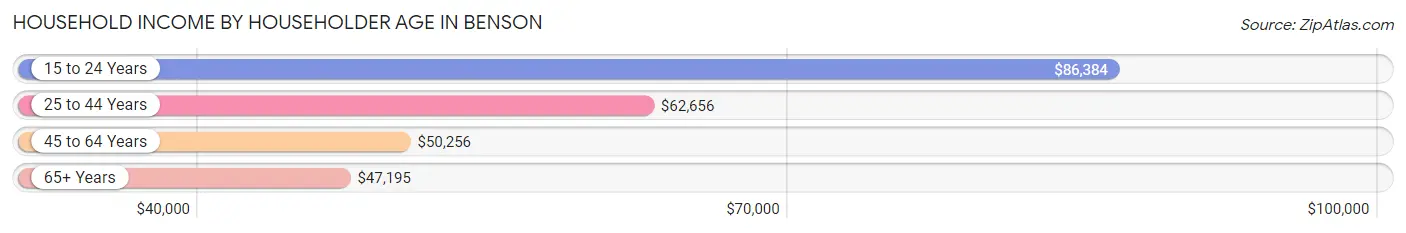
Household Income by Householder Age in Benson
The median household income in Benson is $49,955, with the highest median household income of $86,384 found in the 15 to 24 years age bracket for the primary householder. A total of 91 households (3.9%) fall into this category. Meanwhile, the 65+ years age bracket for the primary householder has the lowest median household income of $47,195, with 1,012 households (43.6%) in this group.
| Income Bracket | # Households | Median Income |
| 15 to 24 Years | 91 (3.9%) | $86,384 |
| 25 to 44 Years | 473 (20.4%) | $62,656 |
| 45 to 64 Years | 747 (32.2%) | $50,256 |
| 65+ Years | 1,012 (43.6%) | $47,195 |
| Total | 2,323 (100.0%) | $49,955 |
Poverty in Benson
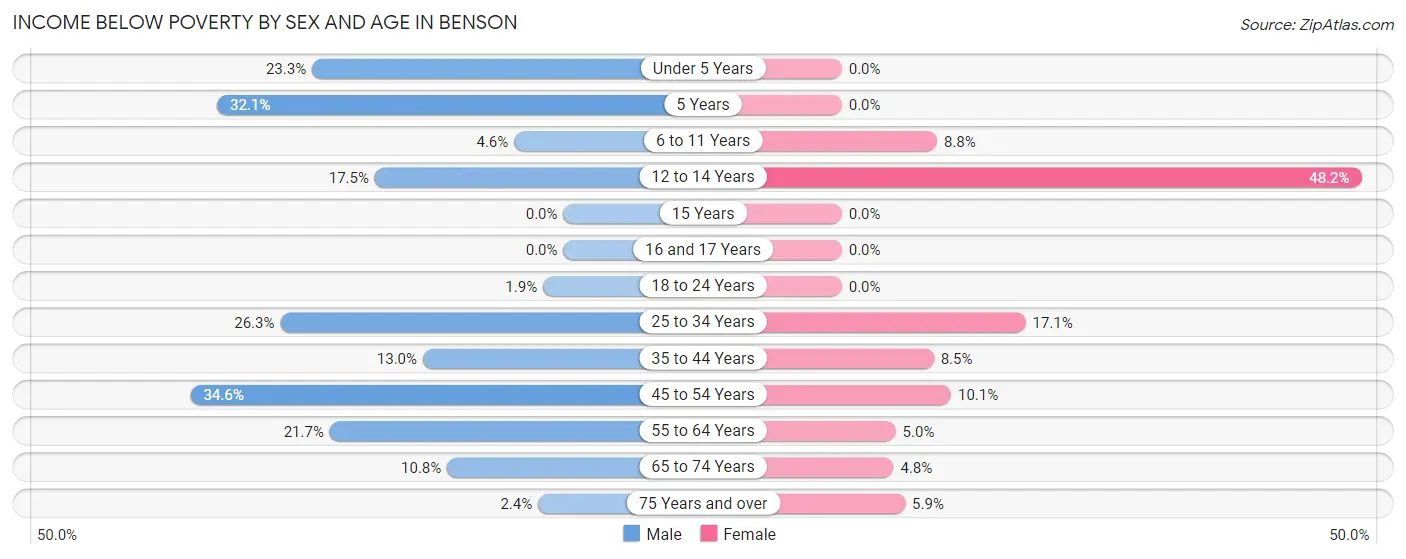
Income Below Poverty by Sex and Age in Benson
With 14.4% poverty level for males and 7.0% for females among the residents of Benson, 45 to 54 year old males and 12 to 14 year old females are the most vulnerable to poverty, with 100 males (34.6%) and 27 females (48.2%) in their respective age groups living below the poverty level.
| Age Bracket | Male | Female |
| Under 5 Years | 14 (23.3%) | 0 (0.0%) |
| 5 Years | 9 (32.1%) | 0 (0.0%) |
| 6 to 11 Years | 9 (4.6%) | 13 (8.8%) |
| 12 to 14 Years | 14 (17.5%) | 27 (48.2%) |
| 15 Years | 0 (0.0%) | 0 (0.0%) |
| 16 and 17 Years | 0 (0.0%) | 0 (0.0%) |
| 18 to 24 Years | 4 (1.9%) | 0 (0.0%) |
| 25 to 34 Years | 67 (26.3%) | 36 (17.1%) |
| 35 to 44 Years | 33 (13.0%) | 25 (8.5%) |
| 45 to 54 Years | 100 (34.6%) | 22 (10.1%) |
| 55 to 64 Years | 62 (21.7%) | 22 (5.0%) |
| 65 to 74 Years | 56 (10.8%) | 18 (4.8%) |
| 75 Years and over | 8 (2.4%) | 22 (5.9%) |
| Total | 376 (14.4%) | 185 (7.0%) |
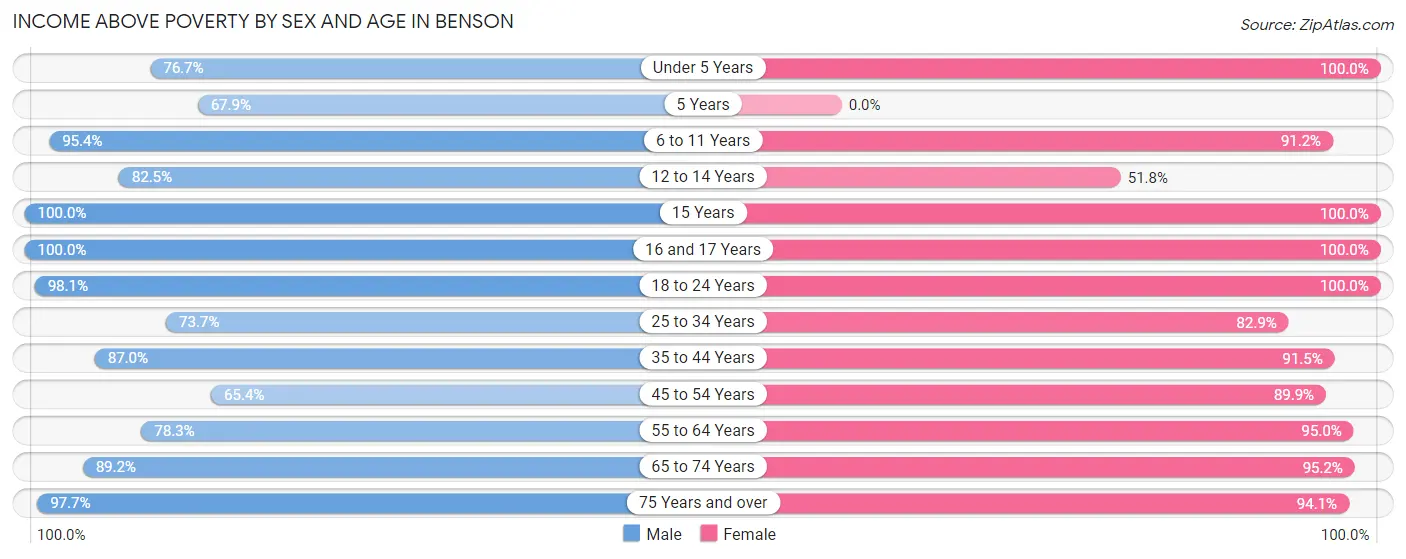
Income Above Poverty by Sex and Age in Benson
According to the poverty statistics in Benson, males aged 15 years and females aged under 5 years are the age groups that are most secure financially, with 100.0% of males and 100.0% of females in these age groups living above the poverty line.
| Age Bracket | Male | Female |
| Under 5 Years | 46 (76.7%) | 209 (100.0%) |
| 5 Years | 19 (67.9%) | 0 (0.0%) |
| 6 to 11 Years | 188 (95.4%) | 134 (91.2%) |
| 12 to 14 Years | 66 (82.5%) | 29 (51.8%) |
| 15 Years | 54 (100.0%) | 29 (100.0%) |
| 16 and 17 Years | 45 (100.0%) | 35 (100.0%) |
| 18 to 24 Years | 208 (98.1%) | 275 (100.0%) |
| 25 to 34 Years | 188 (73.7%) | 175 (82.9%) |
| 35 to 44 Years | 220 (87.0%) | 268 (91.5%) |
| 45 to 54 Years | 189 (65.4%) | 195 (89.9%) |
| 55 to 64 Years | 224 (78.3%) | 418 (95.0%) |
| 65 to 74 Years | 463 (89.2%) | 357 (95.2%) |
| 75 Years and over | 332 (97.7%) | 352 (94.1%) |
| Total | 2,242 (85.6%) | 2,476 (93.0%) |
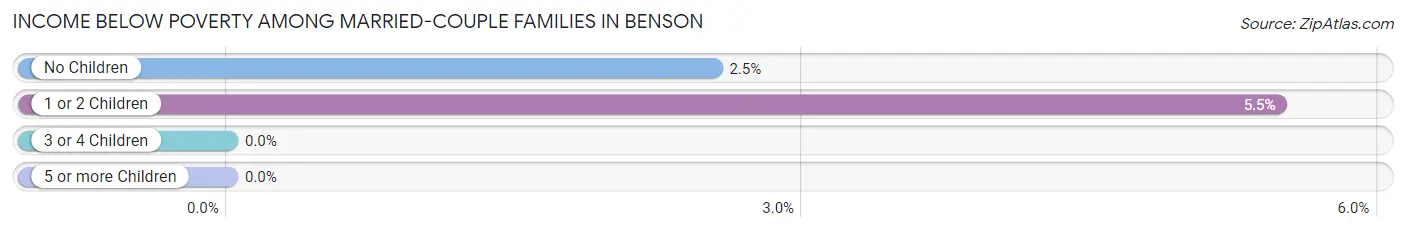
Income Below Poverty Among Married-Couple Families in Benson
The poverty statistics for married-couple families in Benson show that 3.0% or 29 of the total 950 families live below the poverty line. Families with 1 or 2 children have the highest poverty rate of 5.5%, comprising of 12 families. On the other hand, families with 3 or 4 children have the lowest poverty rate of 0.0%, which includes 0 families.
| Children | Above Poverty | Below Poverty |
| No Children | 655 (97.5%) | 17 (2.5%) |
| 1 or 2 Children | 207 (94.5%) | 12 (5.5%) |
| 3 or 4 Children | 50 (100.0%) | 0 (0.0%) |
| 5 or more Children | 9 (100.0%) | 0 (0.0%) |
| Total | 921 (97.0%) | 29 (3.0%) |
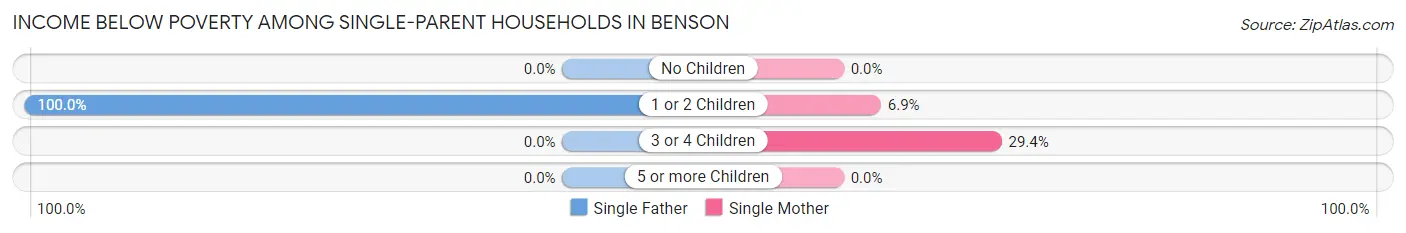
Income Below Poverty Among Single-Parent Households in Benson
According to the poverty data in Benson, 100.0% or 14 single-father households and 5.8% or 24 single-mother households are living below the poverty line. Among single-father households, those with 1 or 2 children have the highest poverty rate, with 14 households (100.0%) experiencing poverty. Likewise, among single-mother households, those with 3 or 4 children have the highest poverty rate, with 10 households (29.4%) falling below the poverty line.
| Children | Single Father | Single Mother |
| No Children | 0 (0.0%) | 0 (0.0%) |
| 1 or 2 Children | 14 (100.0%) | 14 (6.9%) |
| 3 or 4 Children | 0 (0.0%) | 10 (29.4%) |
| 5 or more Children | 0 (0.0%) | 0 (0.0%) |
| Total | 14 (100.0%) | 24 (5.8%) |
Income Below Poverty Among Married-Couple vs Single-Parent Households in Benson
The poverty data for Benson shows that 29 of the married-couple family households (3.0%) and 38 of the single-parent households (8.9%) are living below the poverty level. Within the married-couple family households, those with 1 or 2 children have the highest poverty rate, with 12 households (5.5%) falling below the poverty line. Among the single-parent households, those with 3 or 4 children have the highest poverty rate, with 10 household (29.4%) living below poverty.
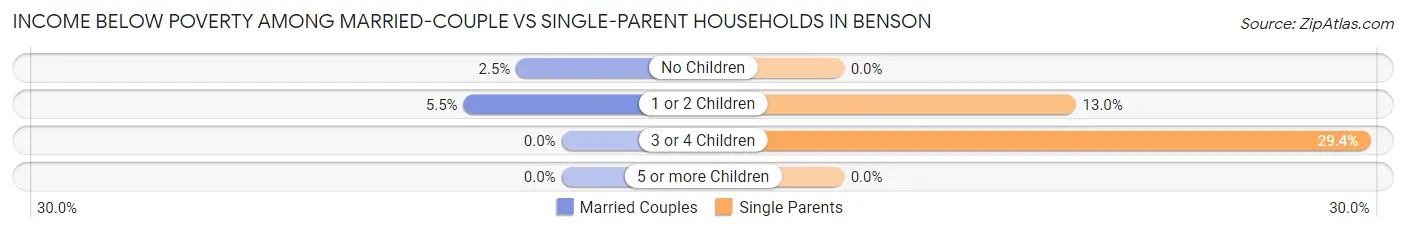
| Children | Married-Couple Families | Single-Parent Households |
| No Children | 17 (2.5%) | 0 (0.0%) |
| 1 or 2 Children | 12 (5.5%) | 28 (13.0%) |
| 3 or 4 Children | 0 (0.0%) | 10 (29.4%) |
| 5 or more Children | 0 (0.0%) | 0 (0.0%) |
| Total | 29 (3.0%) | 38 (8.9%) |
Employment Characteristics in Benson
Employment by Class of Employer in Benson
Among the 2,051 employed individuals in Benson, private company employees (1,205 | 58.8%), federal government employees (225 | 11.0%), and not-for-profit organizations (194 | 9.5%) make up the most common classes of employment.
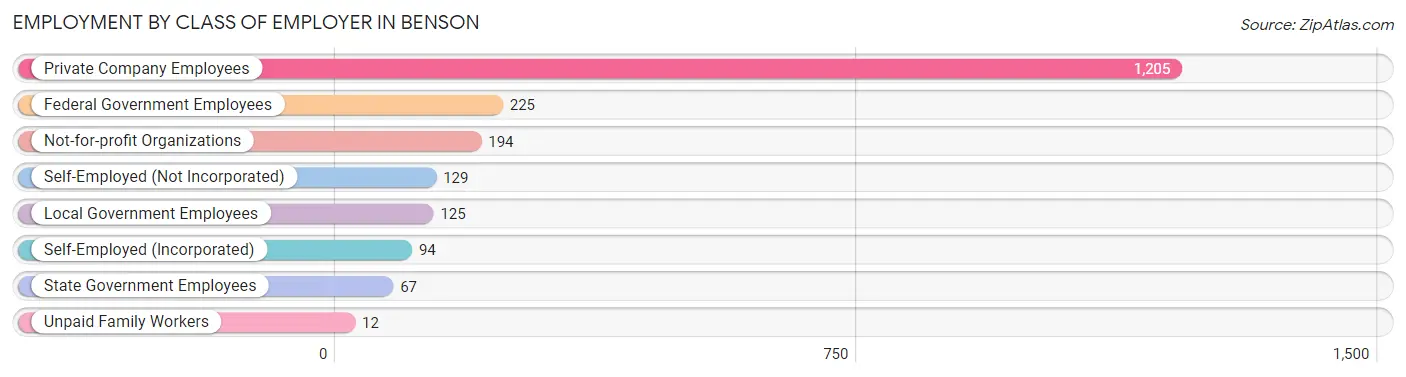
| Employer Class | # Employees | % Employees |
| Private Company Employees | 1,205 | 58.8% |
| Self-Employed (Incorporated) | 94 | 4.6% |
| Self-Employed (Not Incorporated) | 129 | 6.3% |
| Not-for-profit Organizations | 194 | 9.5% |
| Local Government Employees | 125 | 6.1% |
| State Government Employees | 67 | 3.3% |
| Federal Government Employees | 225 | 11.0% |
| Unpaid Family Workers | 12 | 0.6% |
| Total | 2,051 | 100.0% |
Employment Status by Age in Benson
According to the labor force statistics for Benson, out of the total population over 16 years of age (4,423), 51.6% or 2,282 individuals are in the labor force, with 7.8% or 178 of them unemployed. The age group with the highest labor force participation rate is 20 to 24 years, with 100.0% or 392 individuals in the labor force. Within the labor force, the 30 to 34 years age range has the highest percentage of unemployed individuals, with 18.8% or 27 of them being unemployed.
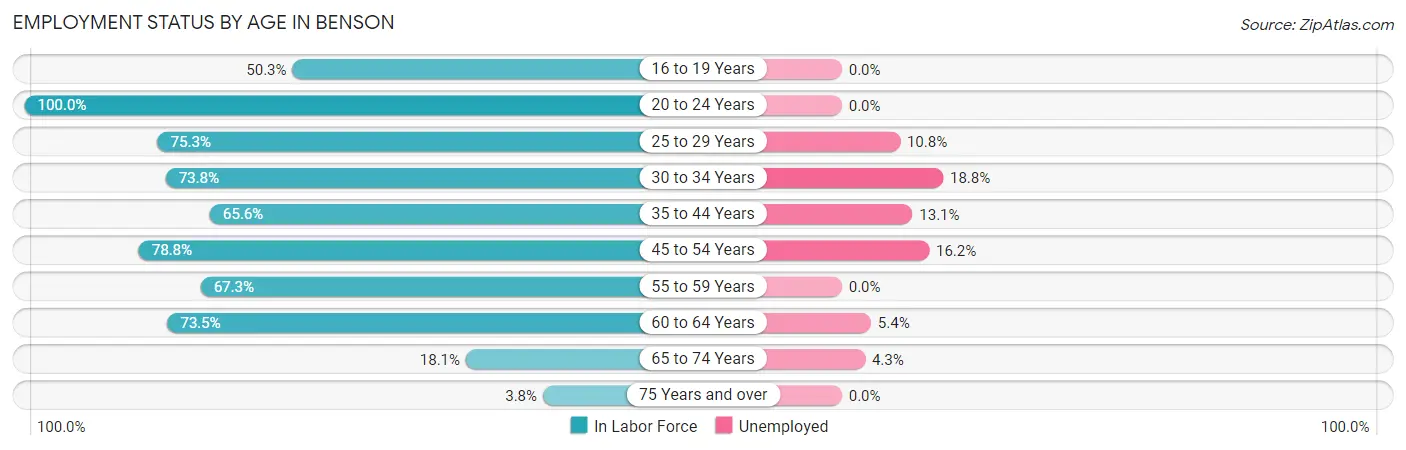
| Age Bracket | In Labor Force | Unemployed |
| 16 to 19 Years | 88 (50.3%) | 0 (0.0%) |
| 20 to 24 Years | 392 (100.0%) | 0 (0.0%) |
| 25 to 29 Years | 204 (75.3%) | 22 (10.8%) |
| 30 to 34 Years | 144 (73.8%) | 27 (18.8%) |
| 35 to 44 Years | 358 (65.6%) | 47 (13.1%) |
| 45 to 54 Years | 402 (78.8%) | 65 (16.2%) |
| 55 to 59 Years | 301 (67.3%) | 0 (0.0%) |
| 60 to 64 Years | 205 (73.5%) | 11 (5.4%) |
| 65 to 74 Years | 162 (18.1%) | 7 (4.3%) |
| 75 Years and over | 27 (3.8%) | 0 (0.0%) |
| Total | 2,282 (51.6%) | 178 (7.8%) |
Employment Status by Educational Attainment in Benson
According to labor force statistics for Benson, 71.8% of individuals (1,614) out of the total population between 25 and 64 years of age (2,248) are in the labor force, with 10.7% or 173 of them being unemployed. The group with the highest labor force participation rate are those with the educational attainment of bachelor's degree or higher, with 75.3% or 409 individuals in the labor force. Within the labor force, individuals with high school diploma education have the highest percentage of unemployment, with 20.0% or 120 of them being unemployed.
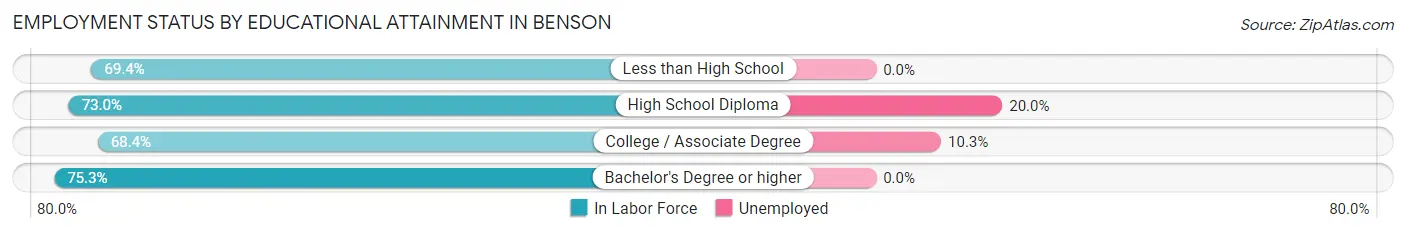
| Educational Attainment | In Labor Force | Unemployed |
| Less than High School | 102 (69.4%) | 0 (0.0%) |
| High School Diploma | 599 (73.0%) | 164 (20.0%) |
| College / Associate Degree | 504 (68.4%) | 76 (10.3%) |
| Bachelor's Degree or higher | 409 (75.3%) | 0 (0.0%) |
| Total | 1,614 (71.8%) | 241 (10.7%) |
Employment Occupations by Sex in Benson
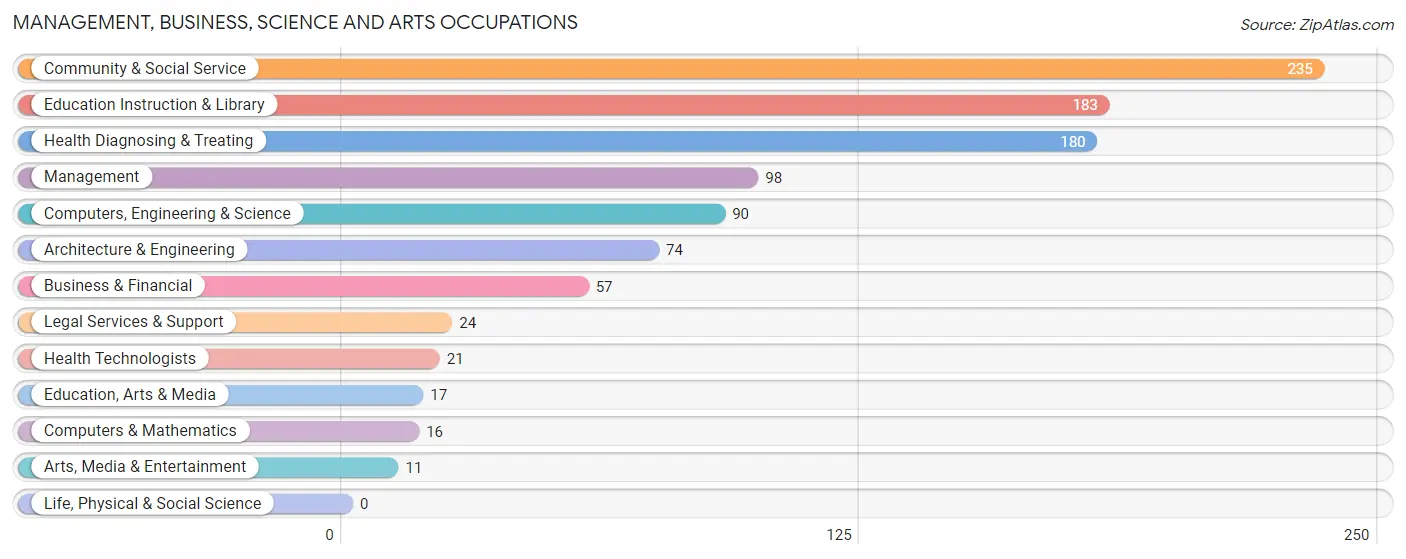
Management, Business, Science and Arts Occupations
The most common Management, Business, Science and Arts occupations in Benson are Community & Social Service (235 | 11.2%), Education Instruction & Library (183 | 8.7%), Health Diagnosing & Treating (180 | 8.6%), Management (98 | 4.7%), and Computers, Engineering & Science (90 | 4.3%).
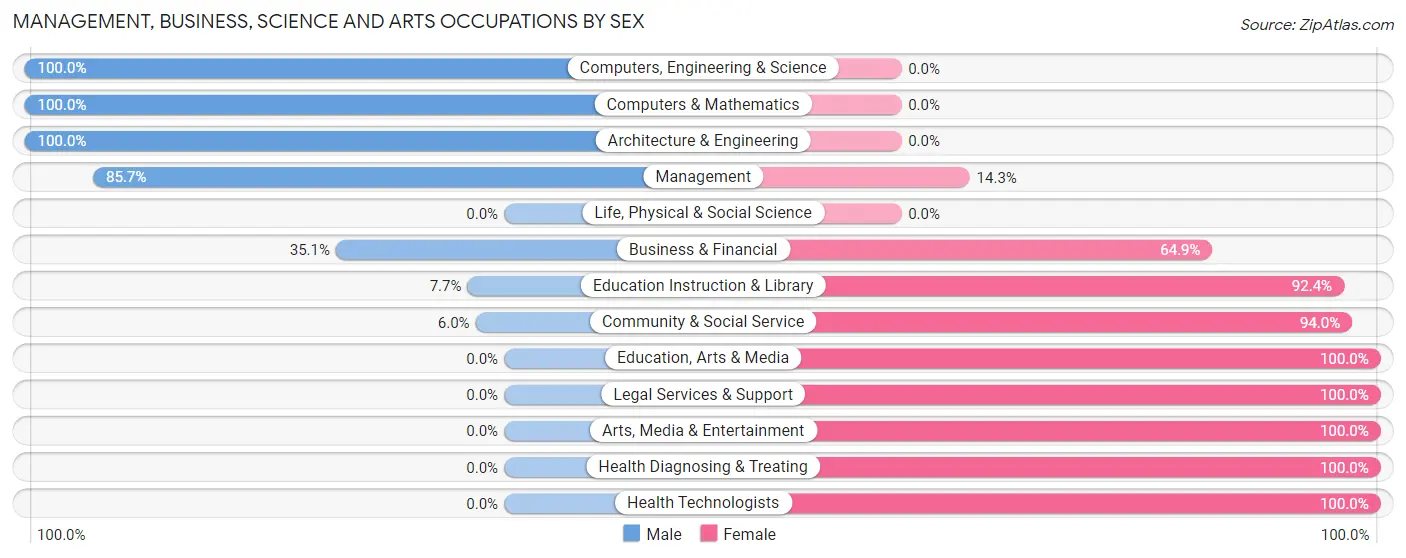
Management, Business, Science and Arts Occupations by Sex
Within the Management, Business, Science and Arts occupations in Benson, the most male-oriented occupations are Computers, Engineering & Science (100.0%), Computers & Mathematics (100.0%), and Architecture & Engineering (100.0%), while the most female-oriented occupations are Education, Arts & Media (100.0%), Legal Services & Support (100.0%), and Arts, Media & Entertainment (100.0%).
| Occupation | Male | Female |
| Management | 84 (85.7%) | 14 (14.3%) |
| Business & Financial | 20 (35.1%) | 37 (64.9%) |
| Computers, Engineering & Science | 90 (100.0%) | 0 (0.0%) |
| Computers & Mathematics | 16 (100.0%) | 0 (0.0%) |
| Architecture & Engineering | 74 (100.0%) | 0 (0.0%) |
| Life, Physical & Social Science | 0 (0.0%) | 0 (0.0%) |
| Community & Social Service | 14 (6.0%) | 221 (94.0%) |
| Education, Arts & Media | 0 (0.0%) | 17 (100.0%) |
| Legal Services & Support | 0 (0.0%) | 24 (100.0%) |
| Education Instruction & Library | 14 (7.6%) | 169 (92.3%) |
| Arts, Media & Entertainment | 0 (0.0%) | 11 (100.0%) |
| Health Diagnosing & Treating | 0 (0.0%) | 180 (100.0%) |
| Health Technologists | 0 (0.0%) | 21 (100.0%) |
| Total (Category) | 208 (31.5%) | 452 (68.5%) |
| Total (Overall) | 994 (47.2%) | 1,110 (52.8%) |
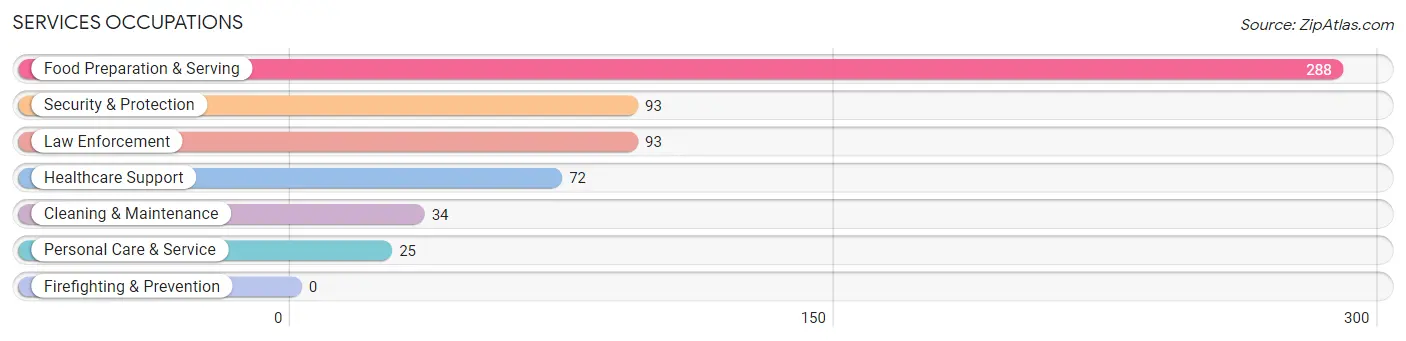
Services Occupations
The most common Services occupations in Benson are Food Preparation & Serving (288 | 13.7%), Security & Protection (93 | 4.4%), Law Enforcement (93 | 4.4%), Healthcare Support (72 | 3.4%), and Cleaning & Maintenance (34 | 1.6%).
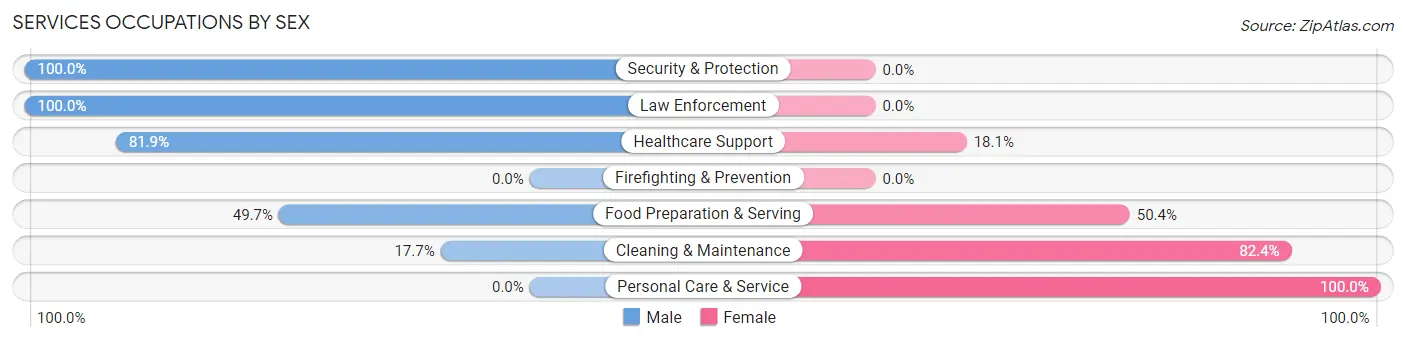
Services Occupations by Sex
Within the Services occupations in Benson, the most male-oriented occupations are Security & Protection (100.0%), Law Enforcement (100.0%), and Healthcare Support (81.9%), while the most female-oriented occupations are Personal Care & Service (100.0%), Cleaning & Maintenance (82.4%), and Food Preparation & Serving (50.3%).
| Occupation | Male | Female |
| Healthcare Support | 59 (81.9%) | 13 (18.1%) |
| Security & Protection | 93 (100.0%) | 0 (0.0%) |
| Firefighting & Prevention | 0 (0.0%) | 0 (0.0%) |
| Law Enforcement | 93 (100.0%) | 0 (0.0%) |
| Food Preparation & Serving | 143 (49.6%) | 145 (50.3%) |
| Cleaning & Maintenance | 6 (17.6%) | 28 (82.4%) |
| Personal Care & Service | 0 (0.0%) | 25 (100.0%) |
| Total (Category) | 301 (58.8%) | 211 (41.2%) |
| Total (Overall) | 994 (47.2%) | 1,110 (52.8%) |
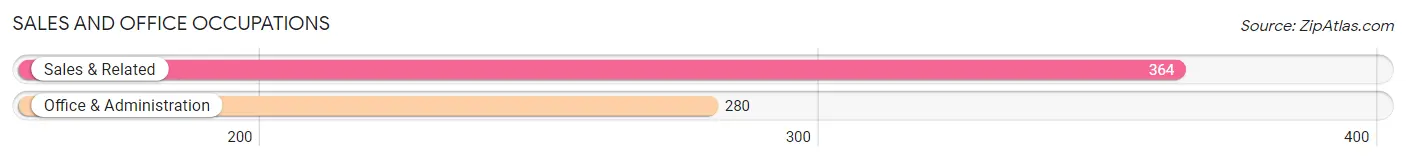
Sales and Office Occupations
The most common Sales and Office occupations in Benson are Sales & Related (364 | 17.3%), and Office & Administration (280 | 13.3%).
Sales and Office Occupations by Sex
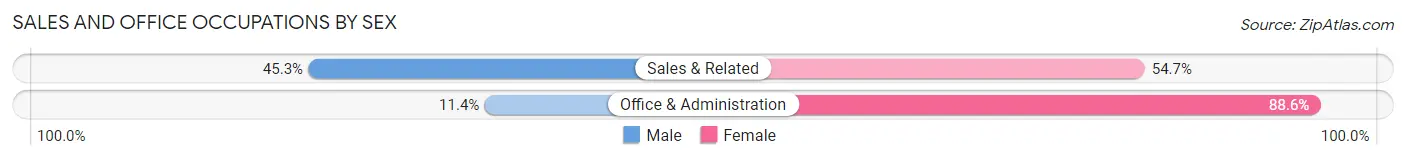
| Occupation | Male | Female |
| Sales & Related | 165 (45.3%) | 199 (54.7%) |
| Office & Administration | 32 (11.4%) | 248 (88.6%) |
| Total (Category) | 197 (30.6%) | 447 (69.4%) |
| Total (Overall) | 994 (47.2%) | 1,110 (52.8%) |
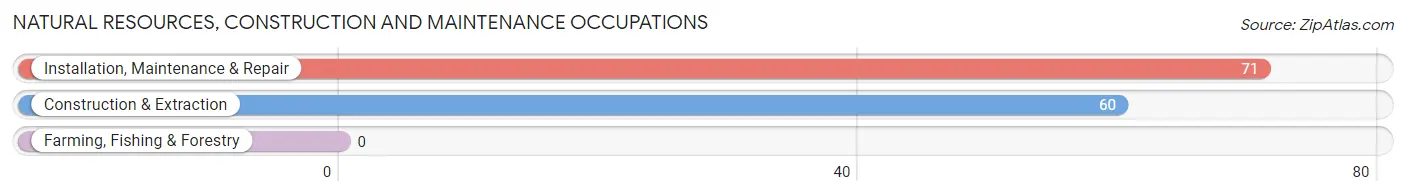
Natural Resources, Construction and Maintenance Occupations
The most common Natural Resources, Construction and Maintenance occupations in Benson are Installation, Maintenance & Repair (71 | 3.4%), and Construction & Extraction (60 | 2.9%).
Natural Resources, Construction and Maintenance Occupations by Sex
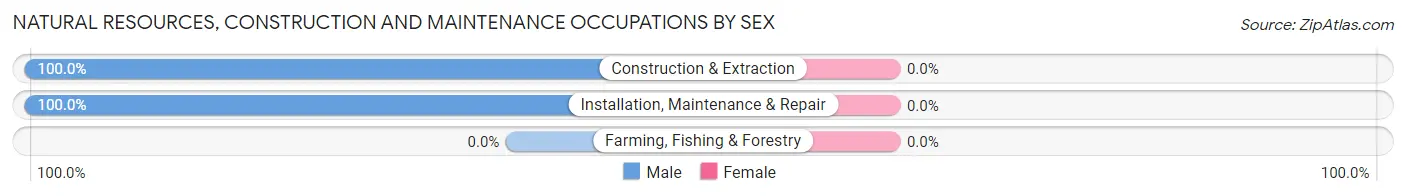
| Occupation | Male | Female |
| Farming, Fishing & Forestry | 0 (0.0%) | 0 (0.0%) |
| Construction & Extraction | 60 (100.0%) | 0 (0.0%) |
| Installation, Maintenance & Repair | 71 (100.0%) | 0 (0.0%) |
| Total (Category) | 131 (100.0%) | 0 (0.0%) |
| Total (Overall) | 994 (47.2%) | 1,110 (52.8%) |
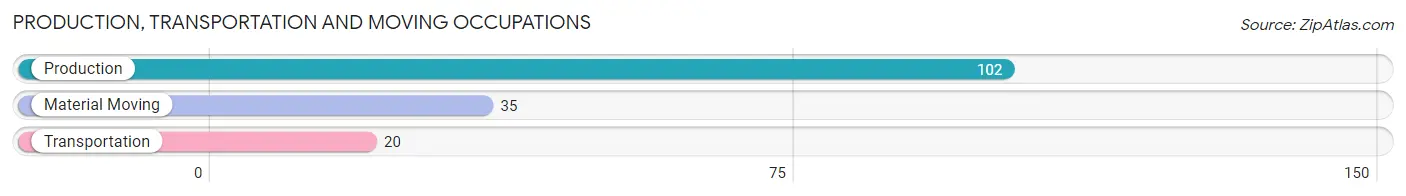
Production, Transportation and Moving Occupations
The most common Production, Transportation and Moving occupations in Benson are Production (102 | 4.9%), Material Moving (35 | 1.7%), and Transportation (20 | 0.9%).
Production, Transportation and Moving Occupations by Sex
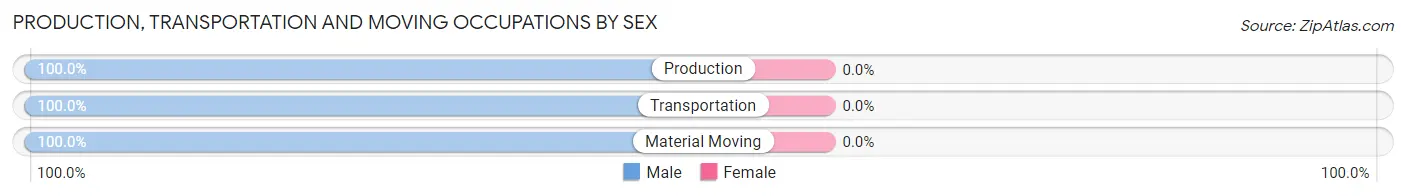
| Occupation | Male | Female |
| Production | 102 (100.0%) | 0 (0.0%) |
| Transportation | 20 (100.0%) | 0 (0.0%) |
| Material Moving | 35 (100.0%) | 0 (0.0%) |
| Total (Category) | 157 (100.0%) | 0 (0.0%) |
| Total (Overall) | 994 (47.2%) | 1,110 (52.8%) |
Employment Industries by Sex in Benson
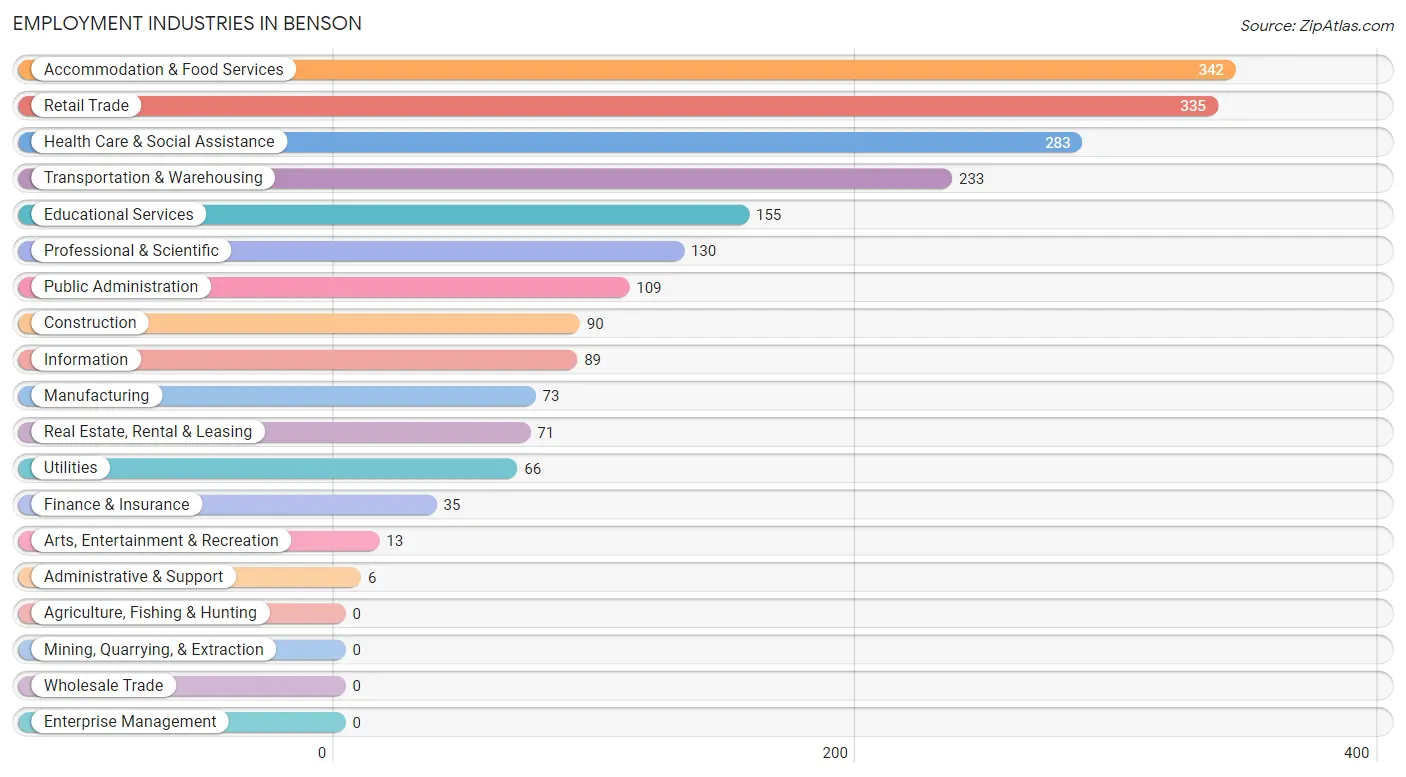
Employment Industries in Benson
The major employment industries in Benson include Accommodation & Food Services (342 | 16.3%), Retail Trade (335 | 15.9%), Health Care & Social Assistance (283 | 13.5%), Transportation & Warehousing (233 | 11.1%), and Educational Services (155 | 7.4%).
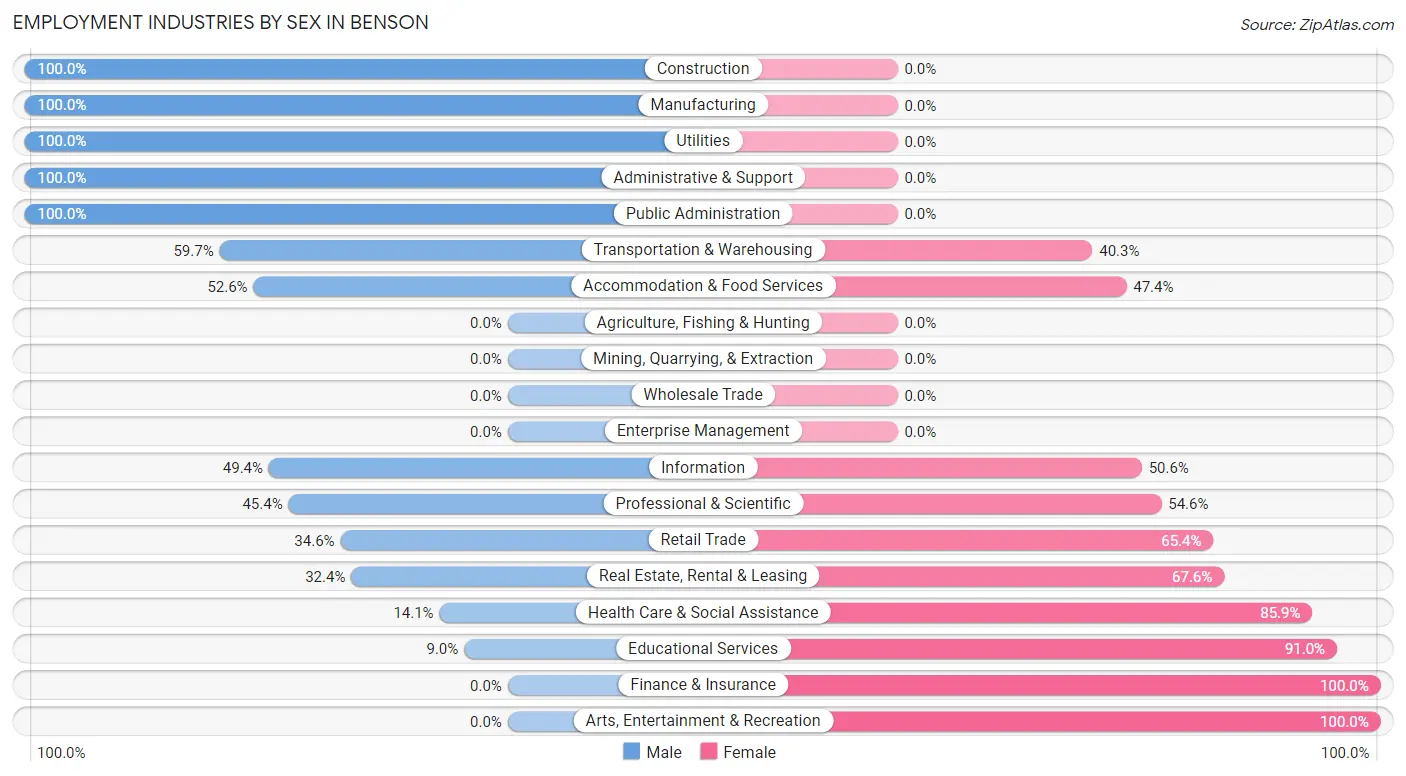
Employment Industries by Sex in Benson
The Benson industries that see more men than women are Construction (100.0%), Manufacturing (100.0%), and Utilities (100.0%), whereas the industries that tend to have a higher number of women are Finance & Insurance (100.0%), Arts, Entertainment & Recreation (100.0%), and Educational Services (91.0%).
| Industry | Male | Female |
| Agriculture, Fishing & Hunting | 0 (0.0%) | 0 (0.0%) |
| Mining, Quarrying, & Extraction | 0 (0.0%) | 0 (0.0%) |
| Construction | 90 (100.0%) | 0 (0.0%) |
| Manufacturing | 73 (100.0%) | 0 (0.0%) |
| Wholesale Trade | 0 (0.0%) | 0 (0.0%) |
| Retail Trade | 116 (34.6%) | 219 (65.4%) |
| Transportation & Warehousing | 139 (59.7%) | 94 (40.3%) |
| Utilities | 66 (100.0%) | 0 (0.0%) |
| Information | 44 (49.4%) | 45 (50.6%) |
| Finance & Insurance | 0 (0.0%) | 35 (100.0%) |
| Real Estate, Rental & Leasing | 23 (32.4%) | 48 (67.6%) |
| Professional & Scientific | 59 (45.4%) | 71 (54.6%) |
| Enterprise Management | 0 (0.0%) | 0 (0.0%) |
| Administrative & Support | 6 (100.0%) | 0 (0.0%) |
| Educational Services | 14 (9.0%) | 141 (91.0%) |
| Health Care & Social Assistance | 40 (14.1%) | 243 (85.9%) |
| Arts, Entertainment & Recreation | 0 (0.0%) | 13 (100.0%) |
| Accommodation & Food Services | 180 (52.6%) | 162 (47.4%) |
| Public Administration | 109 (100.0%) | 0 (0.0%) |
| Total | 994 (47.2%) | 1,110 (52.8%) |
Education in Benson
School Enrollment in Benson
The most common levels of schooling among the 1,027 students in Benson are high school (244 | 23.8%), elementary school (238 | 23.2%), and middle school (234 | 22.8%).
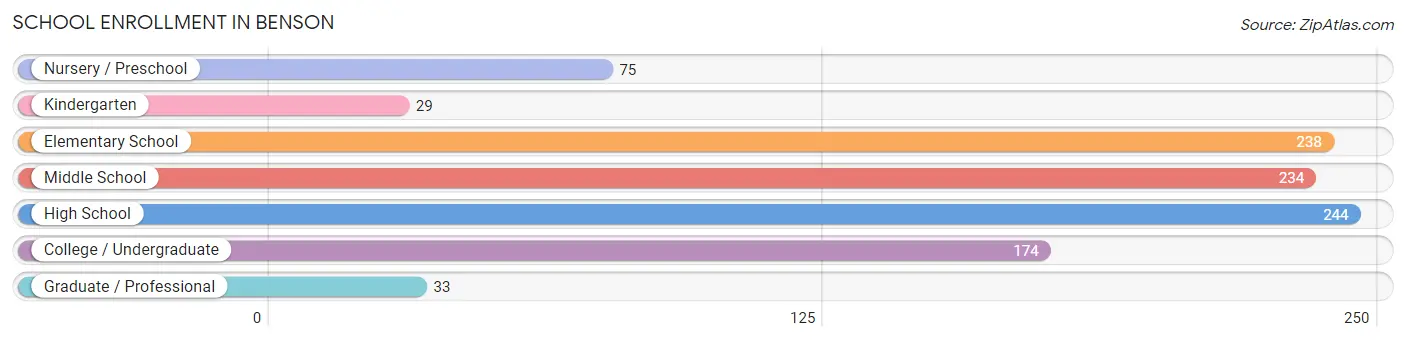
| School Level | # Students | % Students |
| Nursery / Preschool | 75 | 7.3% |
| Kindergarten | 29 | 2.8% |
| Elementary School | 238 | 23.2% |
| Middle School | 234 | 22.8% |
| High School | 244 | 23.8% |
| College / Undergraduate | 174 | 16.9% |
| Graduate / Professional | 33 | 3.2% |
| Total | 1,027 | 100.0% |
School Enrollment by Age by Funding Source in Benson
Out of a total of 1,027 students who are enrolled in schools in Benson, 83 (8.1%) attend a private institution, while the remaining 944 (91.9%) are enrolled in public schools. The age group of 35 years and over has the highest likelihood of being enrolled in private schools, with 49 (41.5% in the age bracket) enrolled. Conversely, the age group of 10 to 14 year olds has the lowest likelihood of being enrolled in a private school, with 291 (100.0% in the age bracket) attending a public institution.
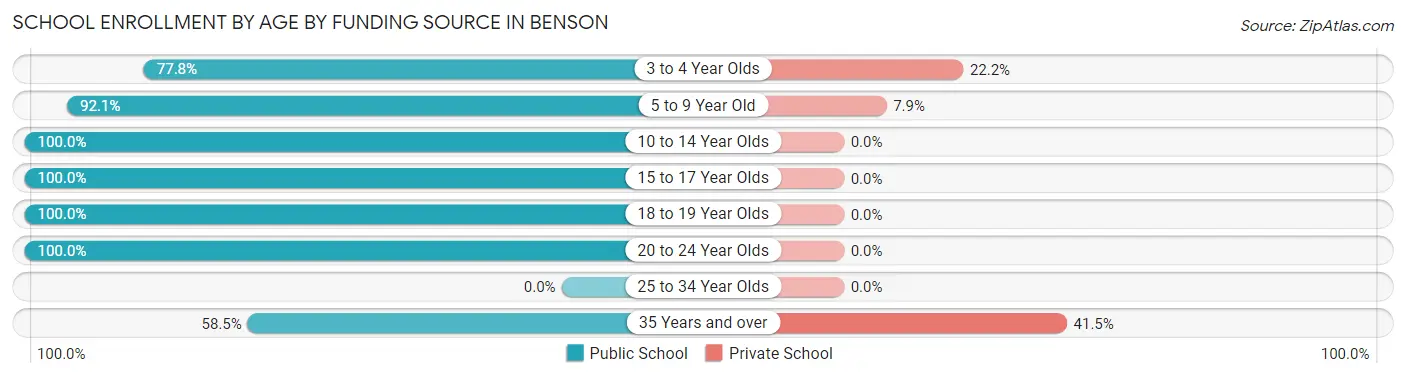
| Age Bracket | Public School | Private School |
| 3 to 4 Year Olds | 56 (77.8%) | 16 (22.2%) |
| 5 to 9 Year Old | 209 (92.1%) | 18 (7.9%) |
| 10 to 14 Year Olds | 291 (100.0%) | 0 (0.0%) |
| 15 to 17 Year Olds | 163 (100.0%) | 0 (0.0%) |
| 18 to 19 Year Olds | 83 (100.0%) | 0 (0.0%) |
| 20 to 24 Year Olds | 73 (100.0%) | 0 (0.0%) |
| 25 to 34 Year Olds | 0 (0.0%) | 0 (0.0%) |
| 35 Years and over | 69 (58.5%) | 49 (41.5%) |
| Total | 944 (91.9%) | 83 (8.1%) |
Educational Attainment by Field of Study in Benson
Business (161 | 16.7%), arts & humanities (151 | 15.7%), education (149 | 15.5%), science & technology (103 | 10.7%), and computers & mathematics (94 | 9.8%) are the most common fields of study among 964 individuals in Benson who have obtained a bachelor's degree or higher.
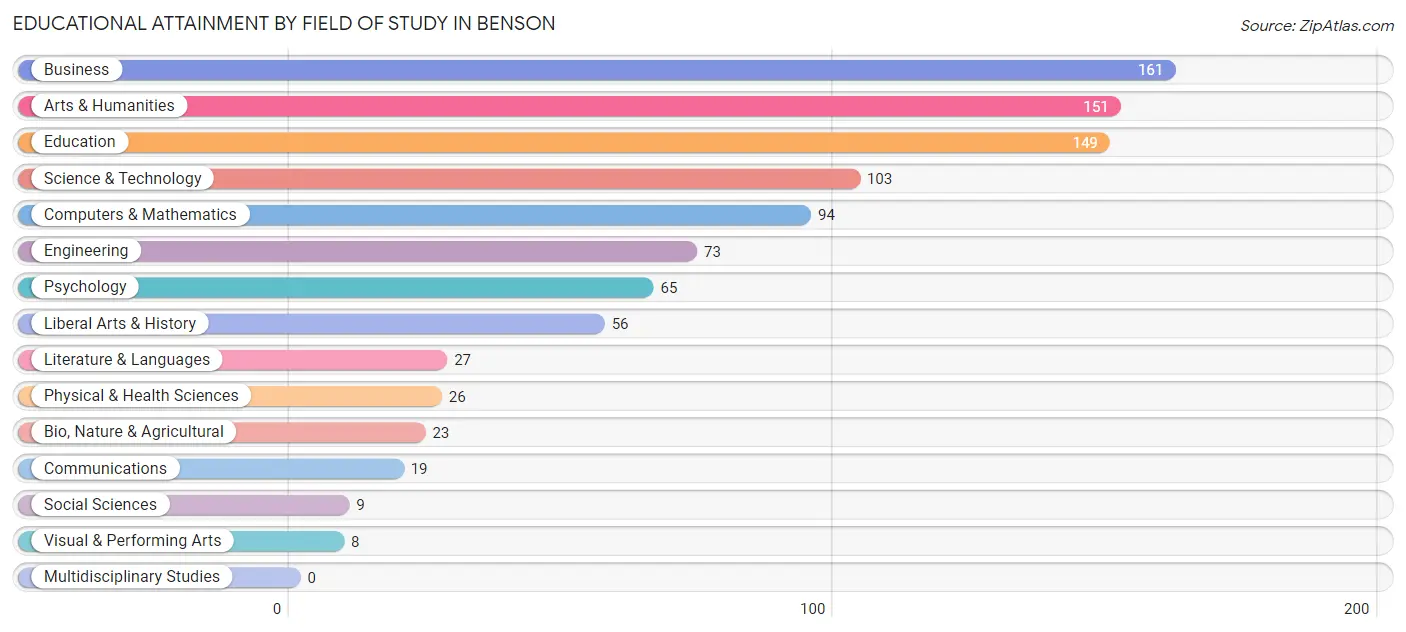
| Field of Study | # Graduates | % Graduates |
| Computers & Mathematics | 94 | 9.8% |
| Bio, Nature & Agricultural | 23 | 2.4% |
| Physical & Health Sciences | 26 | 2.7% |
| Psychology | 65 | 6.7% |
| Social Sciences | 9 | 0.9% |
| Engineering | 73 | 7.6% |
| Multidisciplinary Studies | 0 | 0.0% |
| Science & Technology | 103 | 10.7% |
| Business | 161 | 16.7% |
| Education | 149 | 15.5% |
| Literature & Languages | 27 | 2.8% |
| Liberal Arts & History | 56 | 5.8% |
| Visual & Performing Arts | 8 | 0.8% |
| Communications | 19 | 2.0% |
| Arts & Humanities | 151 | 15.7% |
| Total | 964 | 100.0% |
Transportation & Commute in Benson
Vehicle Availability by Sex in Benson
The most prevalent vehicle ownership categories in Benson are males with 2 vehicles (277, accounting for 28.3%) and females with 2 vehicles (365, making up 26.2%).
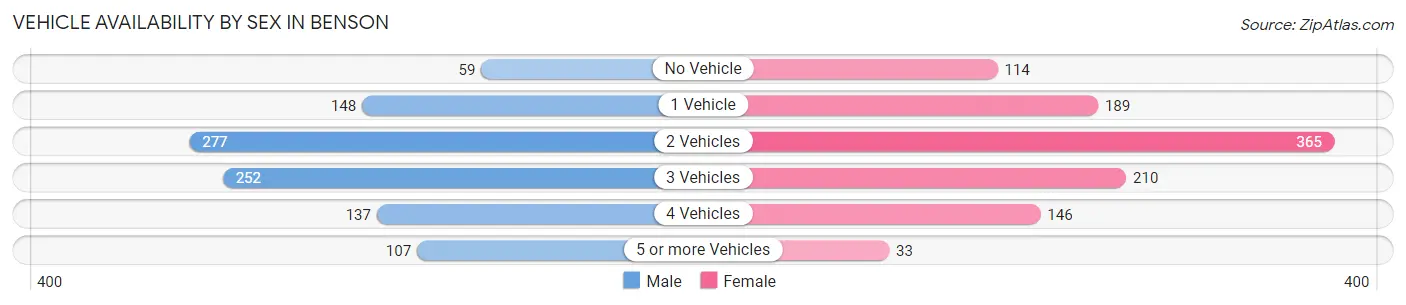
| Vehicles Available | Male | Female |
| No Vehicle | 59 (6.0%) | 114 (10.8%) |
| 1 Vehicle | 148 (15.1%) | 189 (17.9%) |
| 2 Vehicles | 277 (28.3%) | 365 (34.5%) |
| 3 Vehicles | 252 (25.7%) | 210 (19.9%) |
| 4 Vehicles | 137 (14.0%) | 146 (13.8%) |
| 5 or more Vehicles | 107 (10.9%) | 33 (3.1%) |
| Total | 980 (100.0%) | 1,057 (100.0%) |
Commute Time in Benson
The most frequently occuring commute durations in Benson are less than 5 minutes (332 commuters, 18.7%), 45 to 59 minutes (331 commuters, 18.7%), and 5 to 9 minutes (296 commuters, 16.7%).
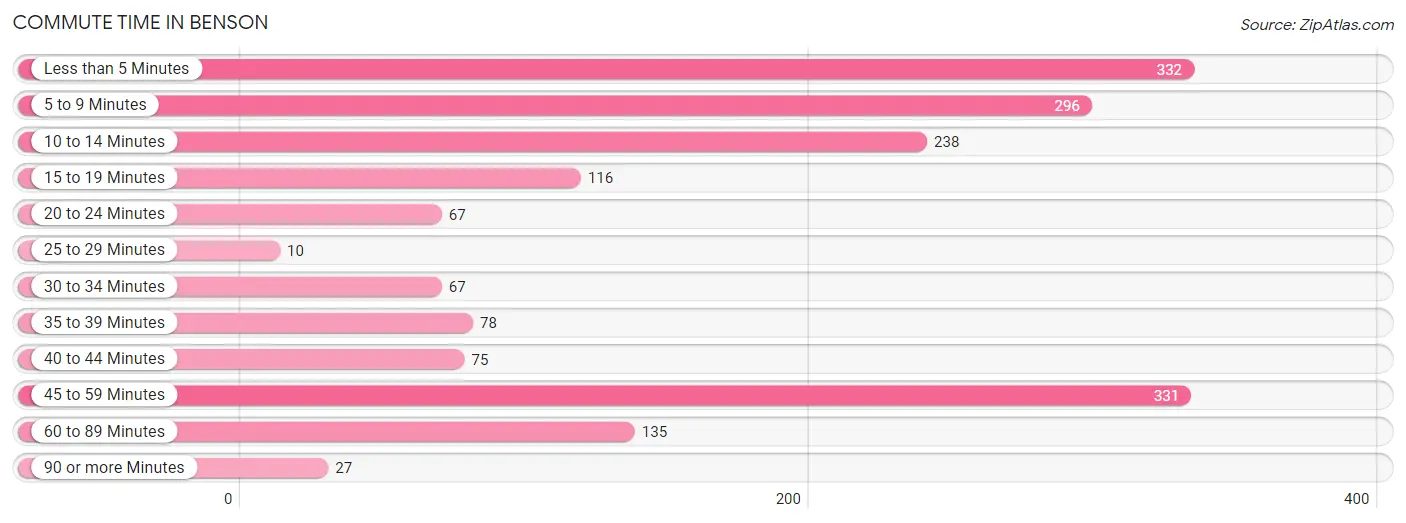
| Commute Time | # Commuters | % Commuters |
| Less than 5 Minutes | 332 | 18.7% |
| 5 to 9 Minutes | 296 | 16.7% |
| 10 to 14 Minutes | 238 | 13.4% |
| 15 to 19 Minutes | 116 | 6.6% |
| 20 to 24 Minutes | 67 | 3.8% |
| 25 to 29 Minutes | 10 | 0.6% |
| 30 to 34 Minutes | 67 | 3.8% |
| 35 to 39 Minutes | 78 | 4.4% |
| 40 to 44 Minutes | 75 | 4.2% |
| 45 to 59 Minutes | 331 | 18.7% |
| 60 to 89 Minutes | 135 | 7.6% |
| 90 or more Minutes | 27 | 1.5% |
Commute Time by Sex in Benson
The most common commute times in Benson are 45 to 59 minutes (294 commuters, 35.3%) for males and less than 5 minutes (229 commuters, 24.4%) for females.
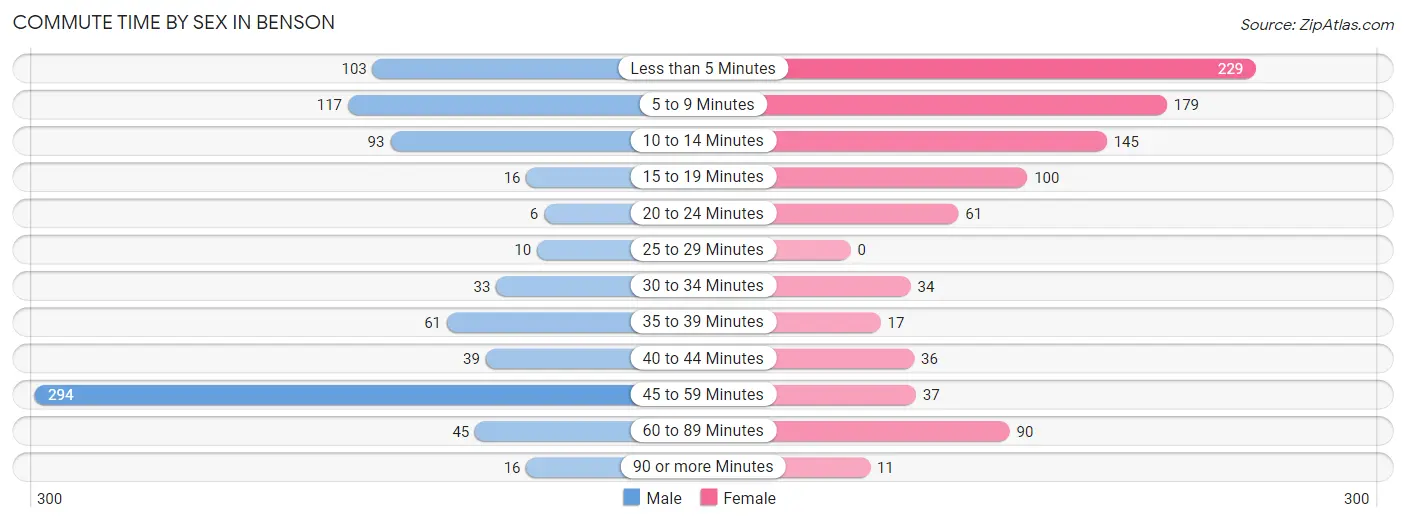
| Commute Time | Male | Female |
| Less than 5 Minutes | 103 (12.4%) | 229 (24.4%) |
| 5 to 9 Minutes | 117 (14.1%) | 179 (19.1%) |
| 10 to 14 Minutes | 93 (11.2%) | 145 (15.4%) |
| 15 to 19 Minutes | 16 (1.9%) | 100 (10.6%) |
| 20 to 24 Minutes | 6 (0.7%) | 61 (6.5%) |
| 25 to 29 Minutes | 10 (1.2%) | 0 (0.0%) |
| 30 to 34 Minutes | 33 (4.0%) | 34 (3.6%) |
| 35 to 39 Minutes | 61 (7.3%) | 17 (1.8%) |
| 40 to 44 Minutes | 39 (4.7%) | 36 (3.8%) |
| 45 to 59 Minutes | 294 (35.3%) | 37 (3.9%) |
| 60 to 89 Minutes | 45 (5.4%) | 90 (9.6%) |
| 90 or more Minutes | 16 (1.9%) | 11 (1.2%) |
Time of Departure to Work by Sex in Benson
The most frequent times of departure to work in Benson are 6:00 AM to 6:29 AM (191, 22.9%) for males and 12:00 PM to 3:59 PM (309, 32.9%) for females.
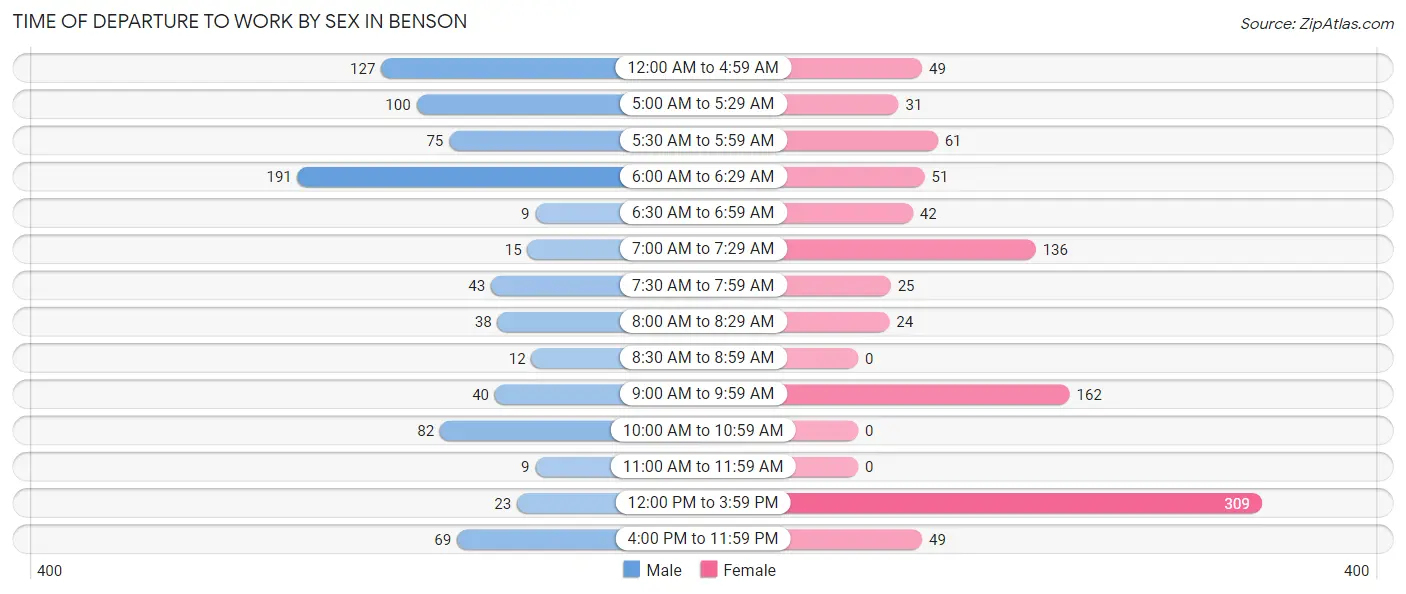
| Time of Departure | Male | Female |
| 12:00 AM to 4:59 AM | 127 (15.2%) | 49 (5.2%) |
| 5:00 AM to 5:29 AM | 100 (12.0%) | 31 (3.3%) |
| 5:30 AM to 5:59 AM | 75 (9.0%) | 61 (6.5%) |
| 6:00 AM to 6:29 AM | 191 (22.9%) | 51 (5.4%) |
| 6:30 AM to 6:59 AM | 9 (1.1%) | 42 (4.5%) |
| 7:00 AM to 7:29 AM | 15 (1.8%) | 136 (14.5%) |
| 7:30 AM to 7:59 AM | 43 (5.2%) | 25 (2.7%) |
| 8:00 AM to 8:29 AM | 38 (4.6%) | 24 (2.6%) |
| 8:30 AM to 8:59 AM | 12 (1.4%) | 0 (0.0%) |
| 9:00 AM to 9:59 AM | 40 (4.8%) | 162 (17.2%) |
| 10:00 AM to 10:59 AM | 82 (9.8%) | 0 (0.0%) |
| 11:00 AM to 11:59 AM | 9 (1.1%) | 0 (0.0%) |
| 12:00 PM to 3:59 PM | 23 (2.8%) | 309 (32.9%) |
| 4:00 PM to 11:59 PM | 69 (8.3%) | 49 (5.2%) |
| Total | 833 (100.0%) | 939 (100.0%) |
Housing Occupancy in Benson
Occupancy by Ownership in Benson
Of the total 2,323 dwellings in Benson, owner-occupied units account for 1,518 (65.3%), while renter-occupied units make up 805 (34.6%).
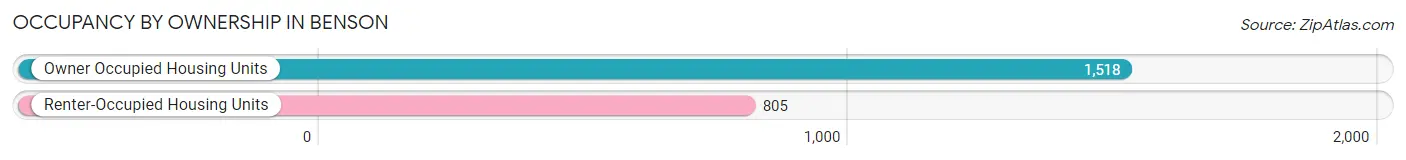
| Occupancy | # Housing Units | % Housing Units |
| Owner Occupied Housing Units | 1,518 | 65.3% |
| Renter-Occupied Housing Units | 805 | 34.6% |
| Total Occupied Housing Units | 2,323 | 100.0% |
Occupancy by Household Size in Benson
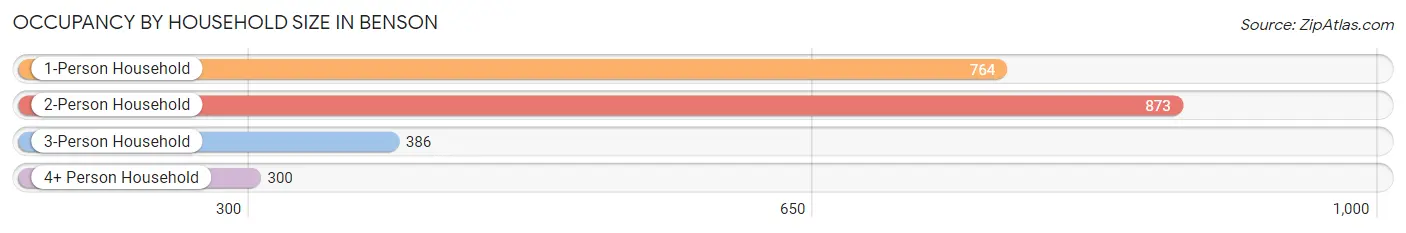
| Household Size | # Housing Units | % Housing Units |
| 1-Person Household | 764 | 32.9% |
| 2-Person Household | 873 | 37.6% |
| 3-Person Household | 386 | 16.6% |
| 4+ Person Household | 300 | 12.9% |
| Total Housing Units | 2,323 | 100.0% |
Occupancy by Ownership by Household Size in Benson
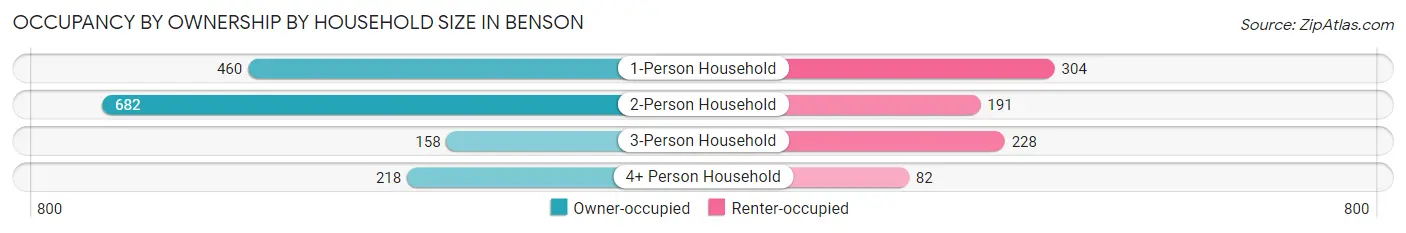
| Household Size | Owner-occupied | Renter-occupied |
| 1-Person Household | 460 (60.2%) | 304 (39.8%) |
| 2-Person Household | 682 (78.1%) | 191 (21.9%) |
| 3-Person Household | 158 (40.9%) | 228 (59.1%) |
| 4+ Person Household | 218 (72.7%) | 82 (27.3%) |
| Total Housing Units | 1,518 (65.3%) | 805 (34.6%) |
Occupancy by Educational Attainment in Benson
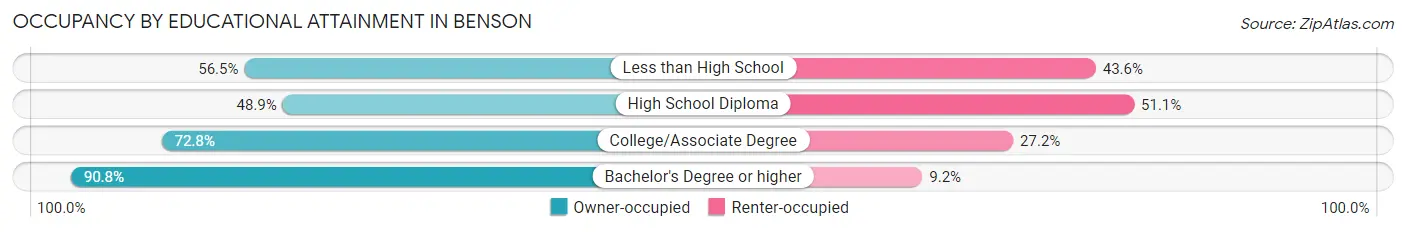
| Household Size | Owner-occupied | Renter-occupied |
| Less than High School | 140 (56.5%) | 108 (43.5%) |
| High School Diploma | 452 (48.9%) | 473 (51.1%) |
| College/Associate Degree | 480 (72.8%) | 179 (27.2%) |
| Bachelor's Degree or higher | 446 (90.8%) | 45 (9.2%) |
Occupancy by Age of Householder in Benson
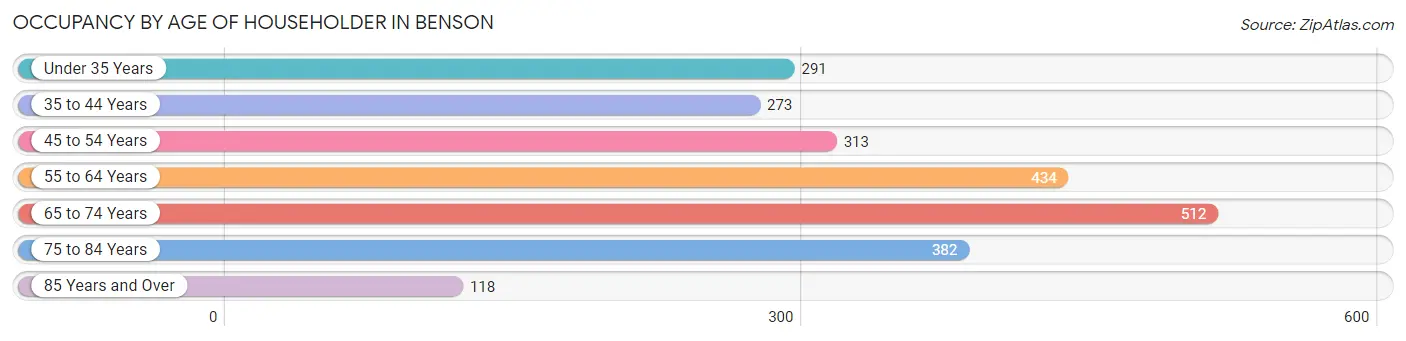
| Age Bracket | # Households | % Households |
| Under 35 Years | 291 | 12.5% |
| 35 to 44 Years | 273 | 11.7% |
| 45 to 54 Years | 313 | 13.5% |
| 55 to 64 Years | 434 | 18.7% |
| 65 to 74 Years | 512 | 22.0% |
| 75 to 84 Years | 382 | 16.4% |
| 85 Years and Over | 118 | 5.1% |
| Total | 2,323 | 100.0% |
Housing Finances in Benson
Median Income by Occupancy in Benson
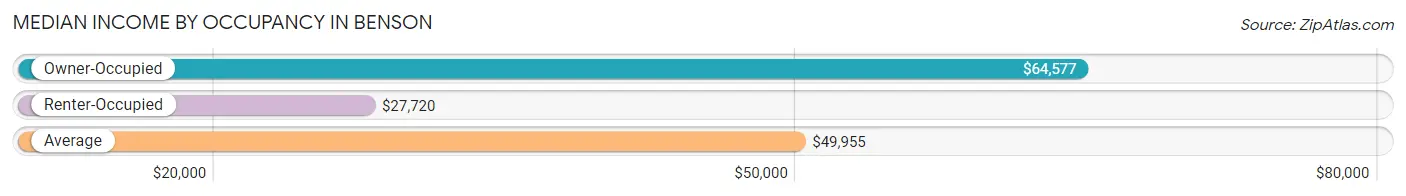
| Occupancy Type | # Households | Median Income |
| Owner-Occupied | 1,518 (65.3%) | $64,577 |
| Renter-Occupied | 805 (34.6%) | $27,720 |
| Average | 2,323 (100.0%) | $49,955 |
Occupancy by Householder Income Bracket in Benson
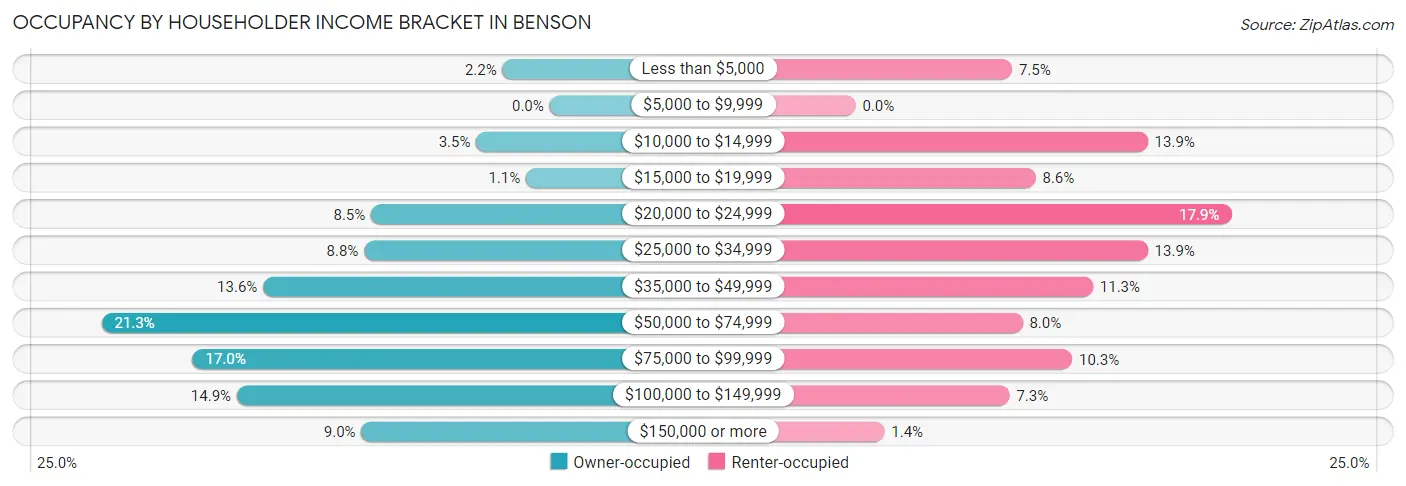
| Income Bracket | Owner-occupied | Renter-occupied |
| Less than $5,000 | 34 (2.2%) | 60 (7.4%) |
| $5,000 to $9,999 | 0 (0.0%) | 0 (0.0%) |
| $10,000 to $14,999 | 53 (3.5%) | 112 (13.9%) |
| $15,000 to $19,999 | 17 (1.1%) | 69 (8.6%) |
| $20,000 to $24,999 | 129 (8.5%) | 144 (17.9%) |
| $25,000 to $34,999 | 134 (8.8%) | 112 (13.9%) |
| $35,000 to $49,999 | 207 (13.6%) | 91 (11.3%) |
| $50,000 to $74,999 | 324 (21.3%) | 64 (8.0%) |
| $75,000 to $99,999 | 258 (17.0%) | 83 (10.3%) |
| $100,000 to $149,999 | 226 (14.9%) | 59 (7.3%) |
| $150,000 or more | 136 (9.0%) | 11 (1.4%) |
| Total | 1,518 (100.0%) | 805 (100.0%) |
Monthly Housing Cost Tiers in Benson
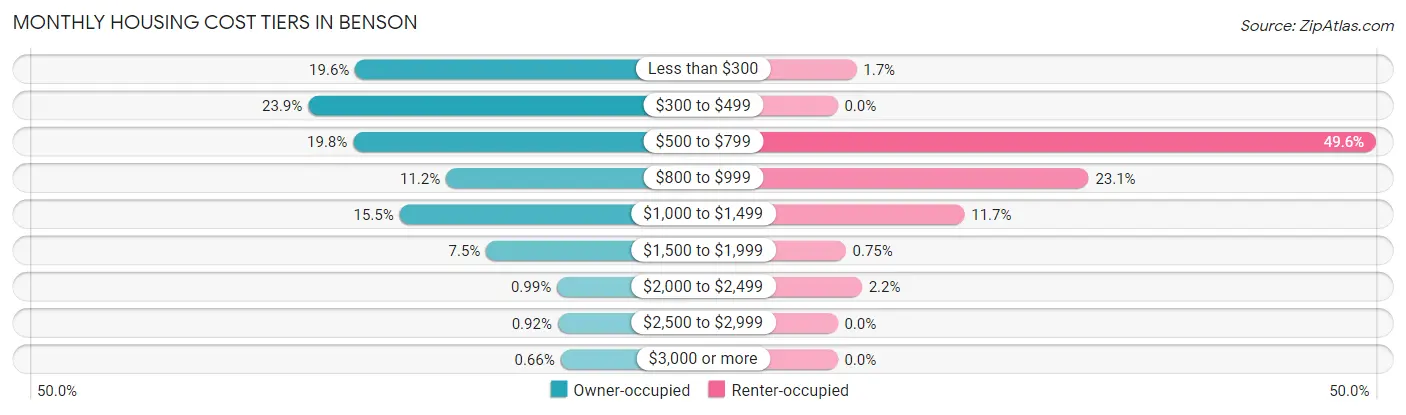
| Monthly Cost | Owner-occupied | Renter-occupied |
| Less than $300 | 297 (19.6%) | 14 (1.7%) |
| $300 to $499 | 363 (23.9%) | 0 (0.0%) |
| $500 to $799 | 300 (19.8%) | 399 (49.6%) |
| $800 to $999 | 170 (11.2%) | 186 (23.1%) |
| $1,000 to $1,499 | 235 (15.5%) | 94 (11.7%) |
| $1,500 to $1,999 | 114 (7.5%) | 6 (0.7%) |
| $2,000 to $2,499 | 15 (1.0%) | 18 (2.2%) |
| $2,500 to $2,999 | 14 (0.9%) | 0 (0.0%) |
| $3,000 or more | 10 (0.7%) | 0 (0.0%) |
| Total | 1,518 (100.0%) | 805 (100.0%) |
Physical Housing Characteristics in Benson
Housing Structures in Benson
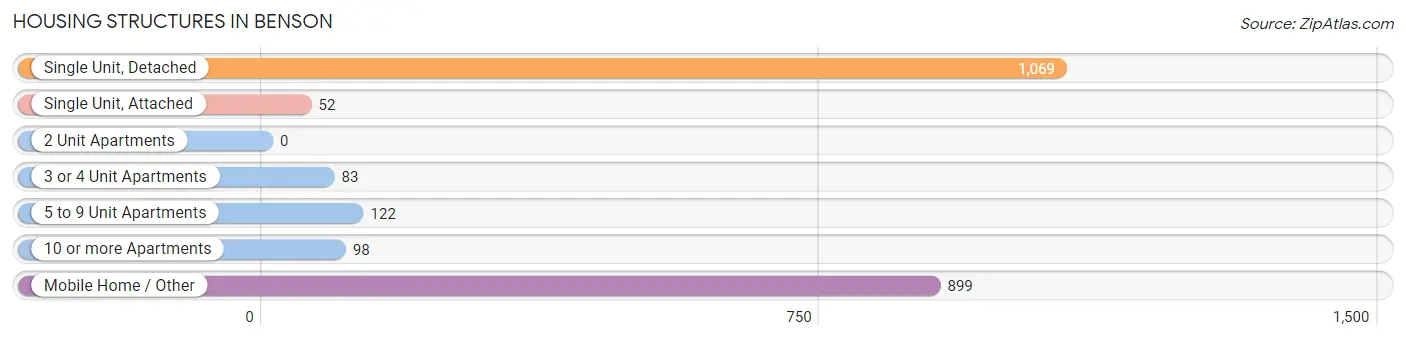
| Structure Type | # Housing Units | % Housing Units |
| Single Unit, Detached | 1,069 | 46.0% |
| Single Unit, Attached | 52 | 2.2% |
| 2 Unit Apartments | 0 | 0.0% |
| 3 or 4 Unit Apartments | 83 | 3.6% |
| 5 to 9 Unit Apartments | 122 | 5.2% |
| 10 or more Apartments | 98 | 4.2% |
| Mobile Home / Other | 899 | 38.7% |
| Total | 2,323 | 100.0% |
Housing Structures by Occupancy in Benson
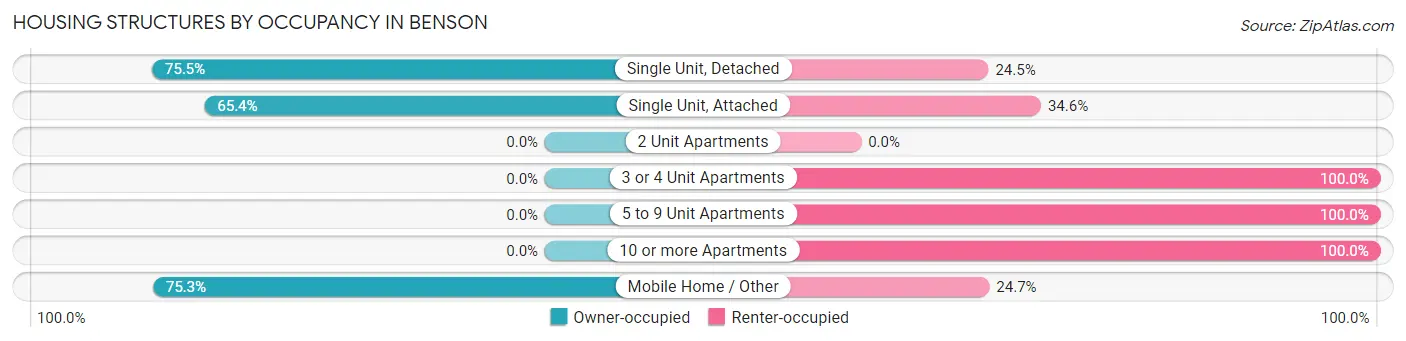
| Structure Type | Owner-occupied | Renter-occupied |
| Single Unit, Detached | 807 (75.5%) | 262 (24.5%) |
| Single Unit, Attached | 34 (65.4%) | 18 (34.6%) |
| 2 Unit Apartments | 0 (0.0%) | 0 (0.0%) |
| 3 or 4 Unit Apartments | 0 (0.0%) | 83 (100.0%) |
| 5 to 9 Unit Apartments | 0 (0.0%) | 122 (100.0%) |
| 10 or more Apartments | 0 (0.0%) | 98 (100.0%) |
| Mobile Home / Other | 677 (75.3%) | 222 (24.7%) |
| Total | 1,518 (65.3%) | 805 (34.6%) |
Housing Structures by Number of Rooms in Benson
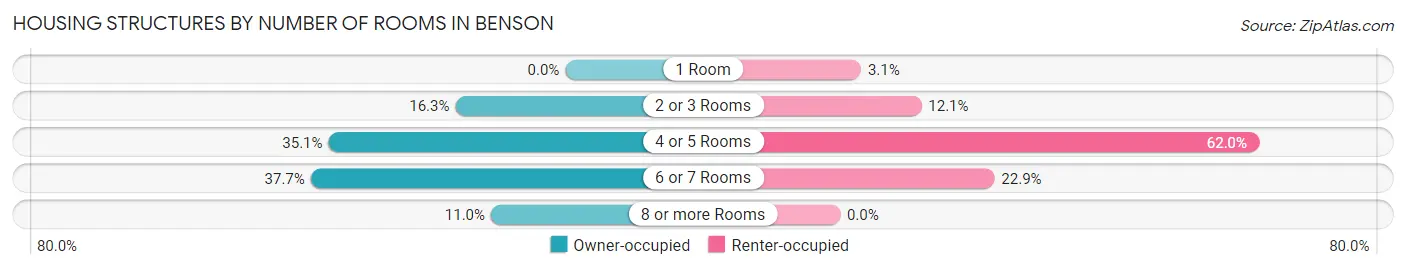
| Number of Rooms | Owner-occupied | Renter-occupied |
| 1 Room | 0 (0.0%) | 25 (3.1%) |
| 2 or 3 Rooms | 247 (16.3%) | 97 (12.0%) |
| 4 or 5 Rooms | 532 (35.0%) | 499 (62.0%) |
| 6 or 7 Rooms | 572 (37.7%) | 184 (22.9%) |
| 8 or more Rooms | 167 (11.0%) | 0 (0.0%) |
| Total | 1,518 (100.0%) | 805 (100.0%) |
Housing Structure by Heating Type in Benson
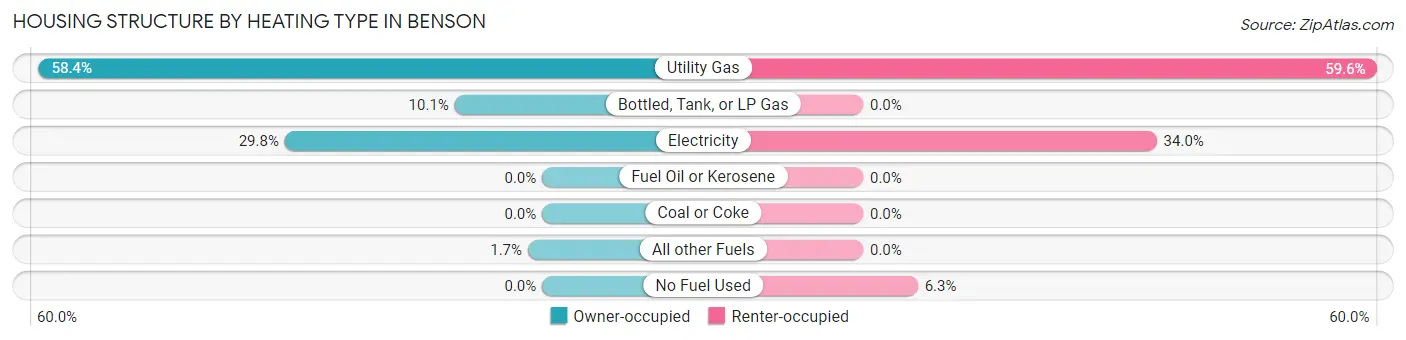
| Heating Type | Owner-occupied | Renter-occupied |
| Utility Gas | 886 (58.4%) | 480 (59.6%) |
| Bottled, Tank, or LP Gas | 154 (10.1%) | 0 (0.0%) |
| Electricity | 453 (29.8%) | 274 (34.0%) |
| Fuel Oil or Kerosene | 0 (0.0%) | 0 (0.0%) |
| Coal or Coke | 0 (0.0%) | 0 (0.0%) |
| All other Fuels | 25 (1.7%) | 0 (0.0%) |
| No Fuel Used | 0 (0.0%) | 51 (6.3%) |
| Total | 1,518 (100.0%) | 805 (100.0%) |
Household Vehicle Usage in Benson
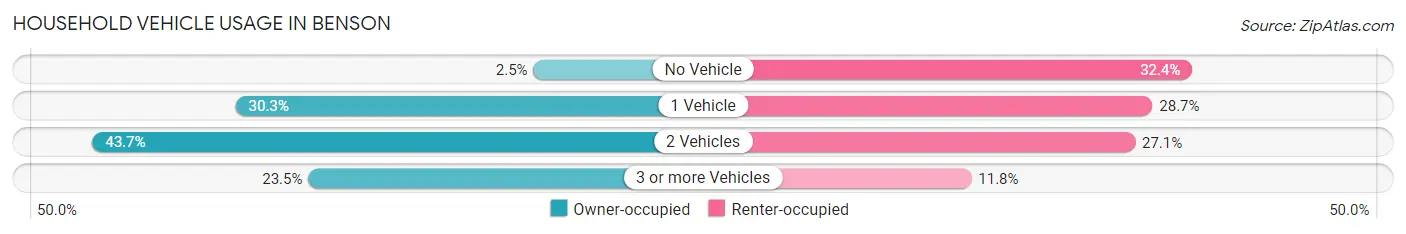
| Vehicles per Household | Owner-occupied | Renter-occupied |
| No Vehicle | 38 (2.5%) | 261 (32.4%) |
| 1 Vehicle | 460 (30.3%) | 231 (28.7%) |
| 2 Vehicles | 663 (43.7%) | 218 (27.1%) |
| 3 or more Vehicles | 357 (23.5%) | 95 (11.8%) |
| Total | 1,518 (100.0%) | 805 (100.0%) |
Real Estate & Mortgages in Benson
Real Estate and Mortgage Overview in Benson
| Characteristic | Without Mortgage | With Mortgage |
| Housing Units | 924 | 594 |
| Median Property Value | $94,400 | $190,300 |
| Median Household Income | $60,341 | $75 |
| Monthly Housing Costs | $397 | $10 |
| Real Estate Taxes | $808 | $11 |
Property Value by Mortgage Status in Benson
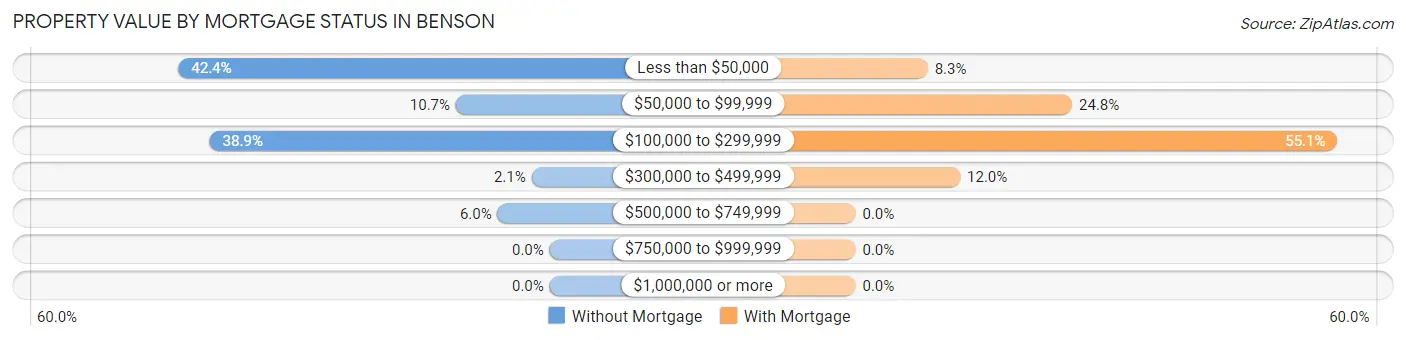
| Property Value | Without Mortgage | With Mortgage |
| Less than $50,000 | 392 (42.4%) | 49 (8.3%) |
| $50,000 to $99,999 | 99 (10.7%) | 147 (24.7%) |
| $100,000 to $299,999 | 359 (38.9%) | 327 (55.0%) |
| $300,000 to $499,999 | 19 (2.1%) | 71 (11.9%) |
| $500,000 to $749,999 | 55 (5.9%) | 0 (0.0%) |
| $750,000 to $999,999 | 0 (0.0%) | 0 (0.0%) |
| $1,000,000 or more | 0 (0.0%) | 0 (0.0%) |
| Total | 924 (100.0%) | 594 (100.0%) |
Household Income by Mortgage Status in Benson
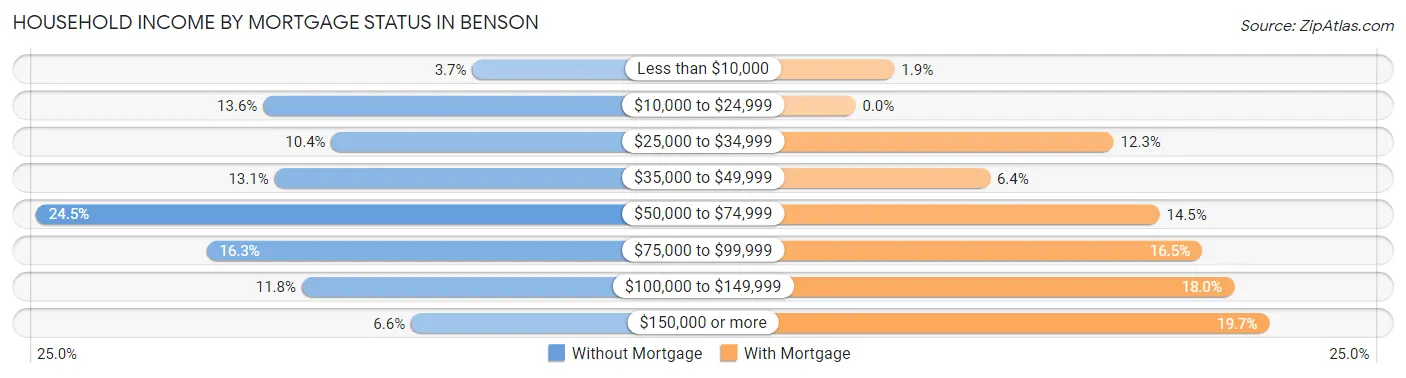
| Household Income | Without Mortgage | With Mortgage |
| Less than $10,000 | 34 (3.7%) | 11 (1.8%) |
| $10,000 to $24,999 | 126 (13.6%) | 0 (0.0%) |
| $25,000 to $34,999 | 96 (10.4%) | 73 (12.3%) |
| $35,000 to $49,999 | 121 (13.1%) | 38 (6.4%) |
| $50,000 to $74,999 | 226 (24.5%) | 86 (14.5%) |
| $75,000 to $99,999 | 151 (16.3%) | 98 (16.5%) |
| $100,000 to $149,999 | 109 (11.8%) | 107 (18.0%) |
| $150,000 or more | 61 (6.6%) | 117 (19.7%) |
| Total | 924 (100.0%) | 594 (100.0%) |
Property Value to Household Income Ratio in Benson
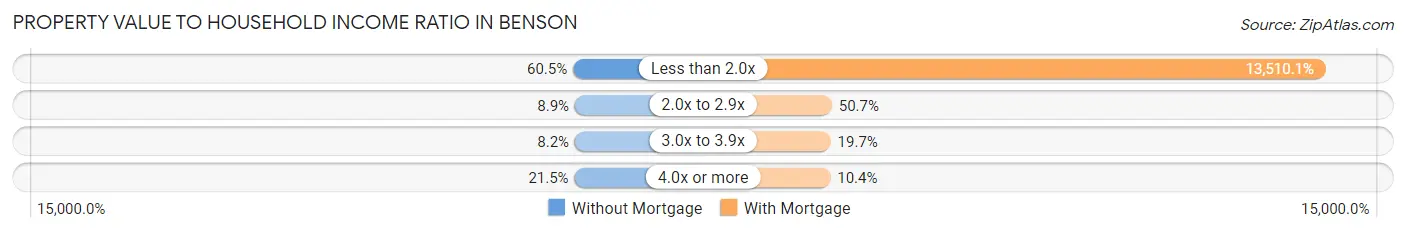
| Value-to-Income Ratio | Without Mortgage | With Mortgage |
| Less than 2.0x | 559 (60.5%) | 80,250 (13,510.1%) |
| 2.0x to 2.9x | 82 (8.9%) | 301 (50.7%) |
| 3.0x to 3.9x | 76 (8.2%) | 117 (19.7%) |
| 4.0x or more | 199 (21.5%) | 62 (10.4%) |
| Total | 924 (100.0%) | 594 (100.0%) |
Real Estate Taxes by Mortgage Status in Benson
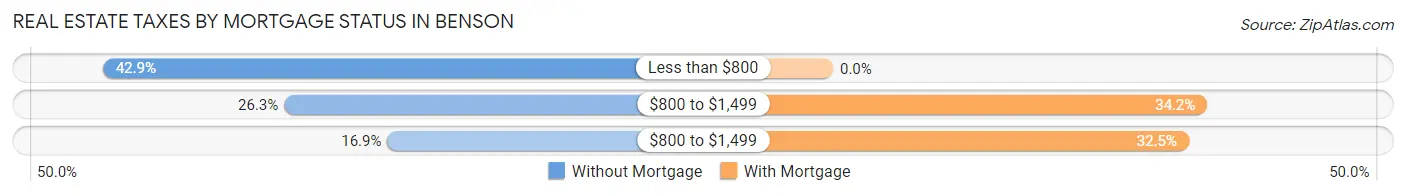
| Property Taxes | Without Mortgage | With Mortgage |
| Less than $800 | 396 (42.9%) | 0 (0.0%) |
| $800 to $1,499 | 243 (26.3%) | 203 (34.2%) |
| $800 to $1,499 | 156 (16.9%) | 193 (32.5%) |
| Total | 924 (100.0%) | 594 (100.0%) |
Health & Disability in Benson
Health Insurance Coverage by Age in Benson
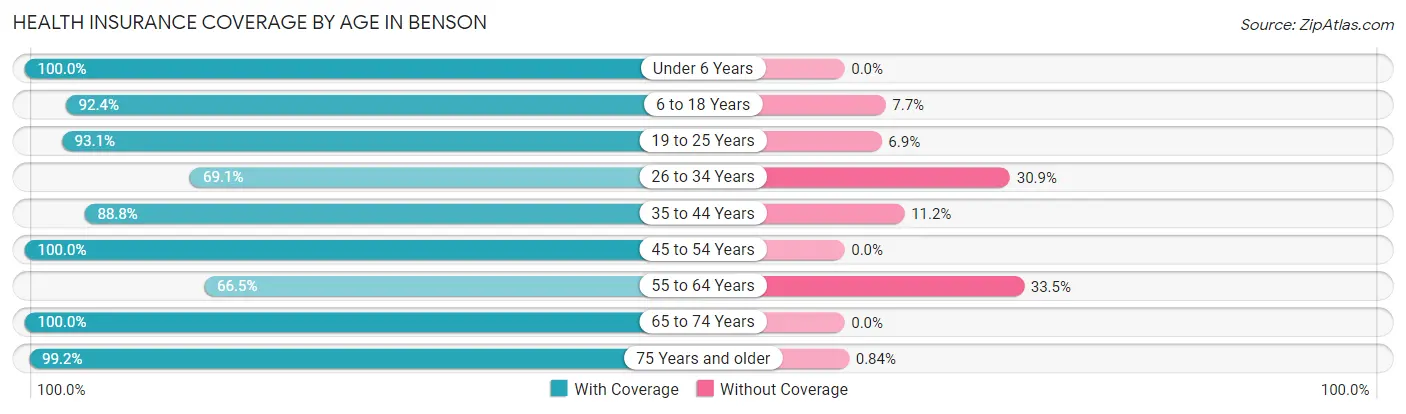
| Age Bracket | With Coverage | Without Coverage |
| Under 6 Years | 313 (100.0%) | 0 (0.0%) |
| 6 to 18 Years | 688 (92.3%) | 57 (7.6%) |
| 19 to 25 Years | 457 (93.1%) | 34 (6.9%) |
| 26 to 34 Years | 262 (69.1%) | 117 (30.9%) |
| 35 to 44 Years | 485 (88.8%) | 61 (11.2%) |
| 45 to 54 Years | 506 (100.0%) | 0 (0.0%) |
| 55 to 64 Years | 483 (66.5%) | 243 (33.5%) |
| 65 to 74 Years | 894 (100.0%) | 0 (0.0%) |
| 75 Years and older | 708 (99.2%) | 6 (0.8%) |
| Total | 4,796 (90.2%) | 518 (9.8%) |
Health Insurance Coverage by Citizenship Status in Benson
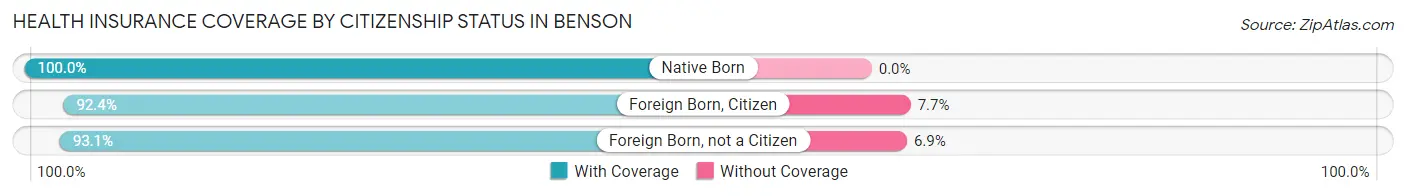
| Citizenship Status | With Coverage | Without Coverage |
| Native Born | 313 (100.0%) | 0 (0.0%) |
| Foreign Born, Citizen | 688 (92.3%) | 57 (7.6%) |
| Foreign Born, not a Citizen | 457 (93.1%) | 34 (6.9%) |
Health Insurance Coverage by Household Income in Benson
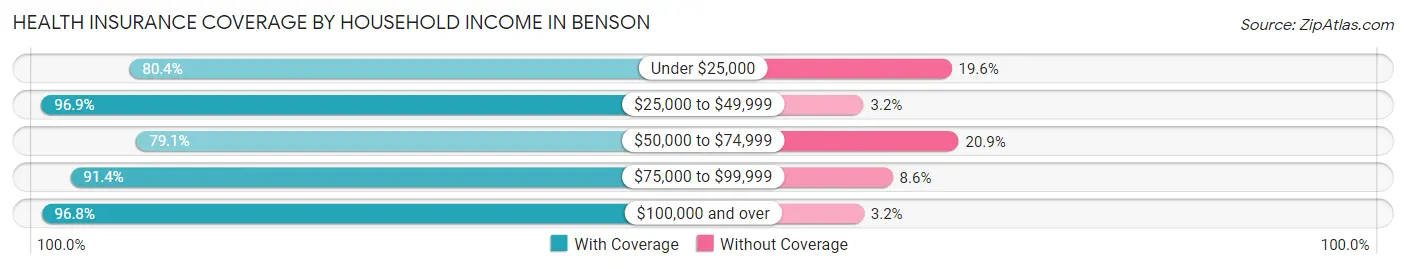
| Household Income | With Coverage | Without Coverage |
| Under $25,000 | 733 (80.4%) | 179 (19.6%) |
| $25,000 to $49,999 | 1,015 (96.9%) | 33 (3.2%) |
| $50,000 to $74,999 | 623 (79.1%) | 165 (20.9%) |
| $75,000 to $99,999 | 915 (91.4%) | 86 (8.6%) |
| $100,000 and over | 1,489 (96.8%) | 49 (3.2%) |
Public vs Private Health Insurance Coverage by Age in Benson
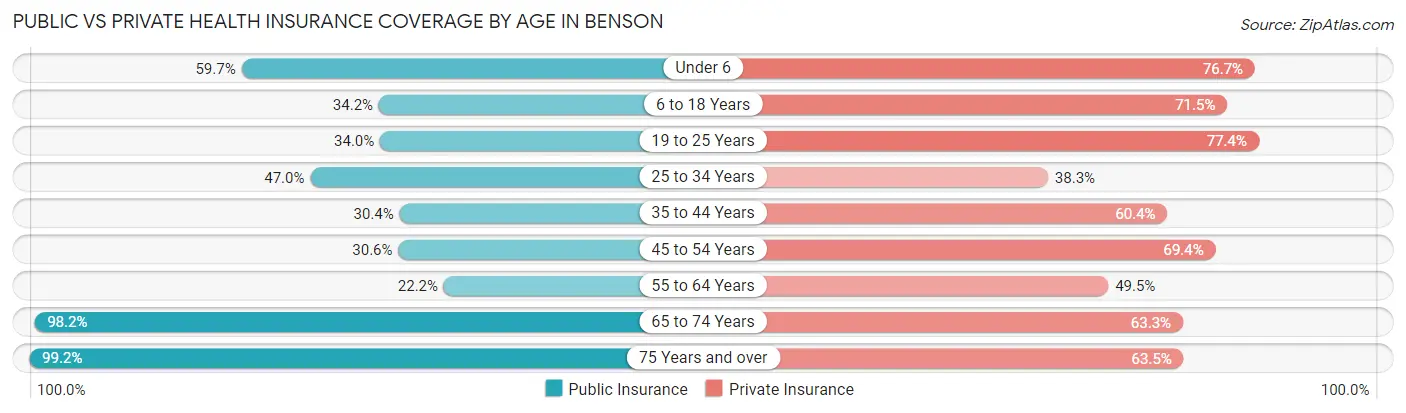
| Age Bracket | Public Insurance | Private Insurance |
| Under 6 | 187 (59.7%) | 240 (76.7%) |
| 6 to 18 Years | 255 (34.2%) | 533 (71.5%) |
| 19 to 25 Years | 167 (34.0%) | 380 (77.4%) |
| 25 to 34 Years | 178 (47.0%) | 145 (38.3%) |
| 35 to 44 Years | 166 (30.4%) | 330 (60.4%) |
| 45 to 54 Years | 155 (30.6%) | 351 (69.4%) |
| 55 to 64 Years | 161 (22.2%) | 359 (49.4%) |
| 65 to 74 Years | 878 (98.2%) | 566 (63.3%) |
| 75 Years and over | 708 (99.2%) | 453 (63.4%) |
| Total | 2,855 (53.7%) | 3,357 (63.2%) |
Disability Status by Sex by Age in Benson
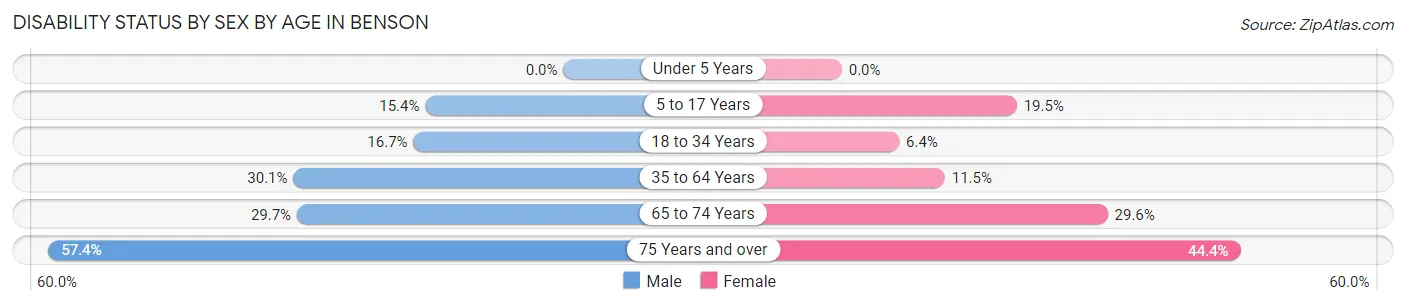
| Age Bracket | Male | Female |
| Under 5 Years | 0 (0.0%) | 0 (0.0%) |
| 5 to 17 Years | 65 (15.4%) | 52 (19.5%) |
| 18 to 34 Years | 78 (16.7%) | 31 (6.4%) |
| 35 to 64 Years | 249 (30.1%) | 109 (11.5%) |
| 65 to 74 Years | 154 (29.7%) | 111 (29.6%) |
| 75 Years and over | 195 (57.4%) | 166 (44.4%) |
Disability Class by Sex by Age in Benson
Disability Class: Hearing Difficulty
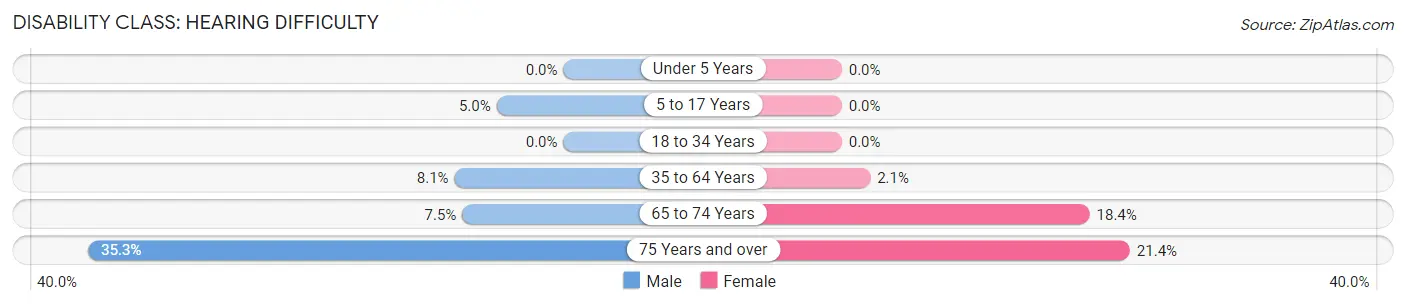
| Age Bracket | Male | Female |
| Under 5 Years | 0 (0.0%) | 0 (0.0%) |
| 5 to 17 Years | 21 (5.0%) | 0 (0.0%) |
| 18 to 34 Years | 0 (0.0%) | 0 (0.0%) |
| 35 to 64 Years | 67 (8.1%) | 20 (2.1%) |
| 65 to 74 Years | 39 (7.5%) | 69 (18.4%) |
| 75 Years and over | 120 (35.3%) | 80 (21.4%) |
Disability Class: Vision Difficulty
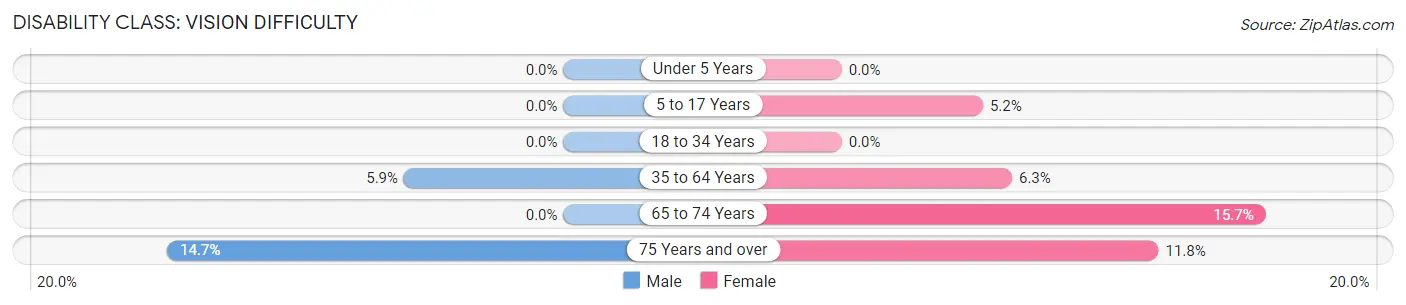
| Age Bracket | Male | Female |
| Under 5 Years | 0 (0.0%) | 0 (0.0%) |
| 5 to 17 Years | 0 (0.0%) | 14 (5.2%) |
| 18 to 34 Years | 0 (0.0%) | 0 (0.0%) |
| 35 to 64 Years | 49 (5.9%) | 60 (6.3%) |
| 65 to 74 Years | 0 (0.0%) | 59 (15.7%) |
| 75 Years and over | 50 (14.7%) | 44 (11.8%) |
Disability Class: Cognitive Difficulty
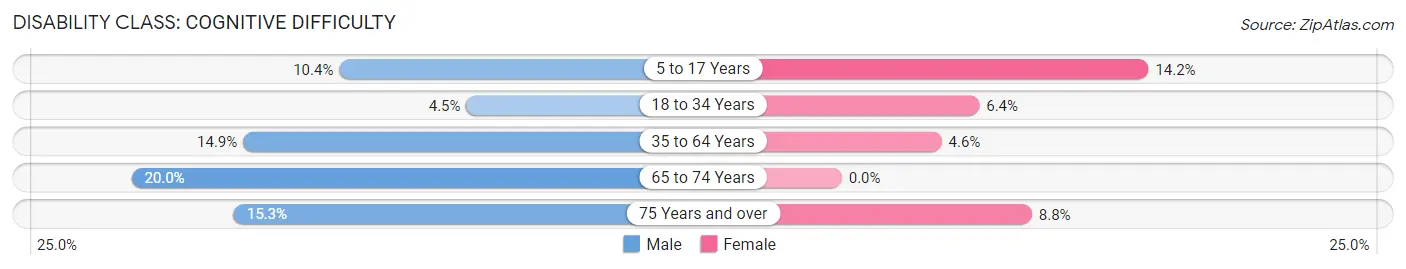
| Age Bracket | Male | Female |
| 5 to 17 Years | 44 (10.4%) | 38 (14.2%) |
| 18 to 34 Years | 21 (4.5%) | 31 (6.4%) |
| 35 to 64 Years | 123 (14.9%) | 44 (4.6%) |
| 65 to 74 Years | 104 (20.0%) | 0 (0.0%) |
| 75 Years and over | 52 (15.3%) | 33 (8.8%) |
Disability Class: Ambulatory Difficulty
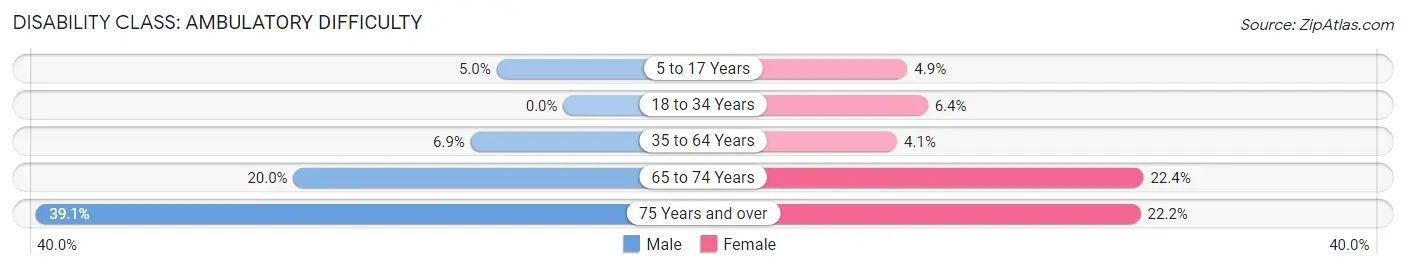
| Age Bracket | Male | Female |
| 5 to 17 Years | 21 (5.0%) | 13 (4.9%) |
| 18 to 34 Years | 0 (0.0%) | 31 (6.4%) |
| 35 to 64 Years | 57 (6.9%) | 39 (4.1%) |
| 65 to 74 Years | 104 (20.0%) | 84 (22.4%) |
| 75 Years and over | 133 (39.1%) | 83 (22.2%) |
Disability Class: Self-Care Difficulty
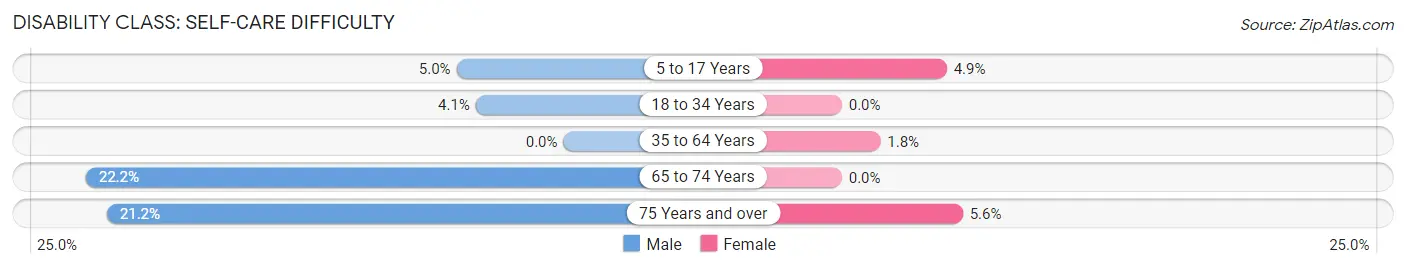
| Age Bracket | Male | Female |
| 5 to 17 Years | 21 (5.0%) | 13 (4.9%) |
| 18 to 34 Years | 19 (4.1%) | 0 (0.0%) |
| 35 to 64 Years | 0 (0.0%) | 17 (1.8%) |
| 65 to 74 Years | 115 (22.2%) | 0 (0.0%) |
| 75 Years and over | 72 (21.2%) | 21 (5.6%) |
Technology Access in Benson
Computing Device Access in Benson
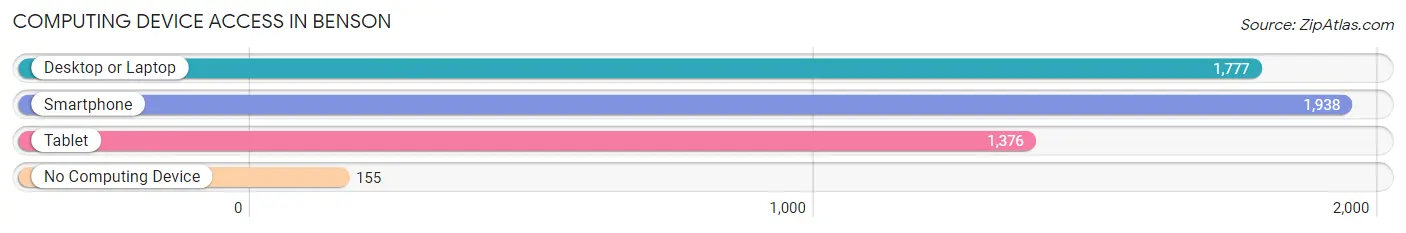
| Device Type | # Households | % Households |
| Desktop or Laptop | 1,777 | 76.5% |
| Smartphone | 1,938 | 83.4% |
| Tablet | 1,376 | 59.2% |
| No Computing Device | 155 | 6.7% |
| Total | 2,323 | 100.0% |
Internet Access in Benson
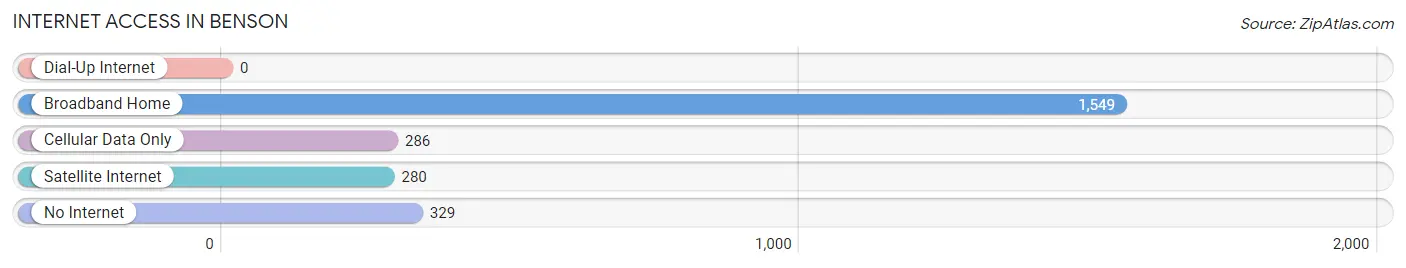
| Internet Type | # Households | % Households |
| Dial-Up Internet | 0 | 0.0% |
| Broadband Home | 1,549 | 66.7% |
| Cellular Data Only | 286 | 12.3% |
| Satellite Internet | 280 | 12.0% |
| No Internet | 329 | 14.2% |
| Total | 2,323 | 100.0% |
Benson Summary
Benson, Arizona is a small town located in Cochise County in the southeastern part of the state. It is situated at the junction of Interstate 10 and State Route 80, about 80 miles southeast of Tucson. The town was founded in 1880 by the railroad magnate, William B. Hooper, and was named after his friend, Judge William B. Benson. The town has a population of 5,105 as of the 2010 census.
Geography
Benson is located in the San Pedro Valley, at an elevation of 3,935 feet. The town is surrounded by the San Pedro Riparian National Conservation Area, which is home to a variety of wildlife, including javelina, coyotes, bobcats, and mule deer. The San Pedro River runs through the town, providing a source of water for the area. The climate in Benson is semi-arid, with hot summers and mild winters.
Economy
Benson is a major transportation hub for the region, with Interstate 10 and State Route 80 running through the town. The town is also home to the Benson Airport, which serves the area with general aviation services. The town is also home to a variety of businesses, including a number of restaurants, hotels, and retail stores. The town is also home to a number of manufacturing and industrial businesses, including a copper smelter and a cement plant.
Demographics
As of the 2010 census, Benson had a population of 5,105. The racial makeup of the town was 79.2% White, 0.7% African American, 1.2% Native American, 0.4% Asian, 0.1% Pacific Islander, 16.2% from other races, and 2.3% from two or more races. Hispanic or Latino of any race were 44.2% of the population.
The median income for a household in Benson was $30,938, and the median income for a family was $35,938. About 17.2% of families and 20.3% of the population were below the poverty line, including 28.3% of those under age 18 and 11.2% of those age 65 or over.
Education
Benson is served by the Benson Unified School District, which includes Benson High School, Benson Middle School, and Benson Elementary School. The town is also home to Cochise College, a two-year community college.
Conclusion
Benson, Arizona is a small town located in Cochise County in the southeastern part of the state. It is a major transportation hub for the region, with Interstate 10 and State Route 80 running through the town. The town has a population of 5,105 as of the 2010 census, and is home to a variety of businesses, including a number of restaurants, hotels, and retail stores. The town is served by the Benson Unified School District, and is also home to Cochise College, a two-year community college.
Common Questions
What is the Total Population of Benson?
Total Population of Benson is 5,318.
What is the Total Male Population of Benson?
Total Male Population of Benson is 2,657.
What is the Total Female Population of Benson?
Total Female Population of Benson is 2,661.
What is the Ratio of Males per 100 Females in Benson?
There are 99.85 Males per 100 Females in Benson.
What is the Ratio of Females per 100 Males in Benson?
There are 100.15 Females per 100 Males in Benson.
What is the Median Population Age in Benson?
Median Population Age in Benson is 50.1 Years.
What is the Average Family Size in Benson
Average Family Size in Benson is 2.9 People.
What is the Average Household Size in Benson
Average Household Size in Benson is 2.3 People.
What is Per Capita Income in Benson?
Per Capita income in Benson is $29,164.
What is the Median Family Income in Benson?
Median Family Income in Benson is $66,325.
What is the Median Household income in Benson?
Median Household Income in Benson is $49,955.
What is Income or Wage Gap in Benson?
Income or Wage Gap in Benson is 24.6%.
Women in Benson earn 75.4 cents for every dollar earned by a man.
What is Inequality or Gini Index in Benson?
Inequality or Gini Index in Benson is 0.42.
How Large is the Labor Force in Benson?
There are 2,282 People in the Labor Forcein in Benson.
What is the Percentage of People in the Labor Force in Benson?
51.6% of People are in the Labor Force in Benson.
What is the Unemployment Rate in Benson?
Unemployment Rate in Benson is 7.8%.