Desert Hills, AZ
Desert Hills Map
Desert Hills Overview
2,651
TOTAL POPULATION
1,290
MALE POPULATION
1,361
FEMALE POPULATION
94.78
MALES / 100 FEMALES
105.50
FEMALES / 100 MALES
63.9
MEDIAN AGE
2.4
AVG FAMILY SIZE
1.8
AVG HOUSEHOLD SIZE
$47,995
PER CAPITA INCOME
$75,759
AVG FAMILY INCOME
$59,911
AVG HOUSEHOLD INCOME
44.9%
WAGE / INCOME GAP [ % ]
55.1¢/ $1
WAGE / INCOME GAP [ $ ]
0.47
INEQUALITY / GINI INDEX
894
LABOR FORCE [ PEOPLE ]
37.9%
PERCENT IN LABOR FORCE
7.6%
UNEMPLOYMENT RATE
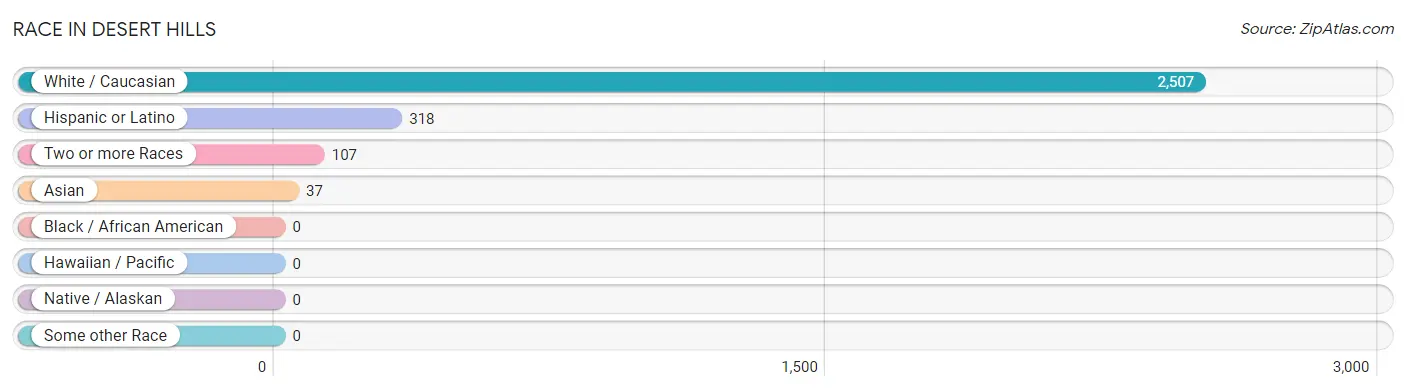
Race in Desert Hills
The most populous races in Desert Hills are White / Caucasian (2,507 | 94.6%), Hispanic or Latino (318 | 12.0%), and Two or more Races (107 | 4.0%).
| Race | # Population | % Population |
| Asian | 37 | 1.4% |
| Black / African American | 0 | 0.0% |
| Hawaiian / Pacific | 0 | 0.0% |
| Hispanic or Latino | 318 | 12.0% |
| Native / Alaskan | 0 | 0.0% |
| White / Caucasian | 2,507 | 94.6% |
| Two or more Races | 107 | 4.0% |
| Some other Race | 0 | 0.0% |
| Total | 2,651 | 100.0% |
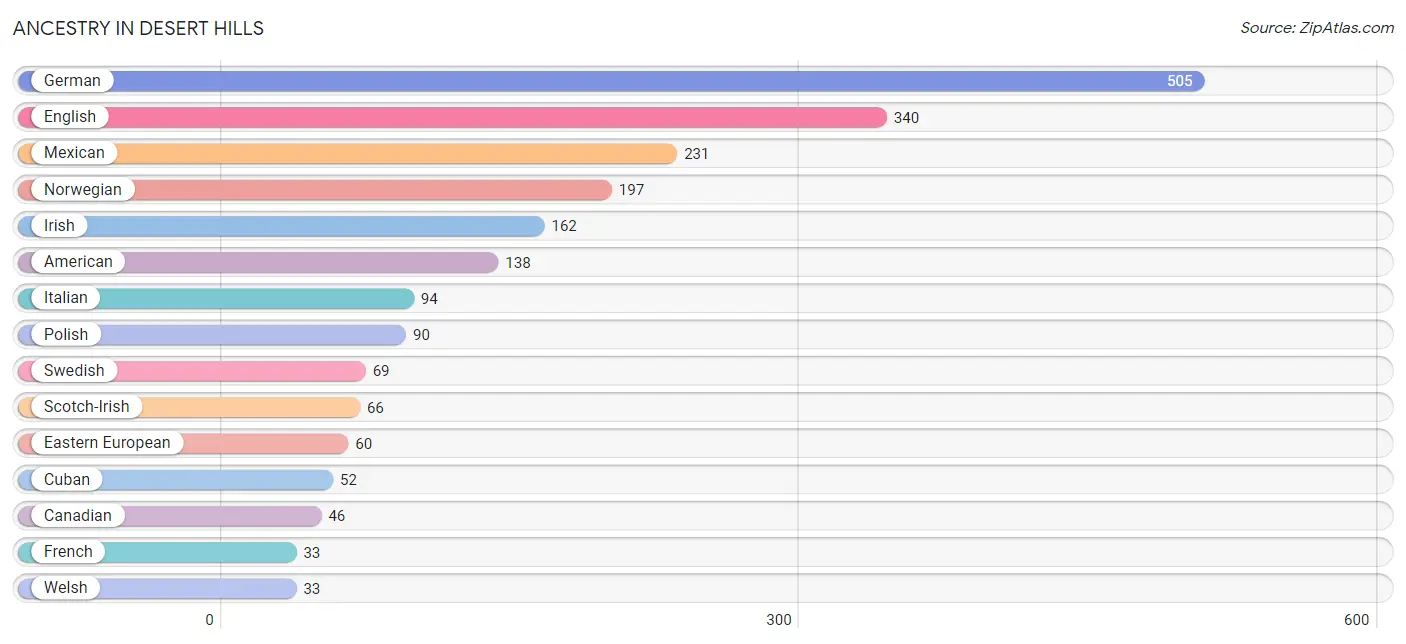
Ancestry in Desert Hills
The most populous ancestries reported in Desert Hills are German (505 | 19.1%), English (340 | 12.8%), Mexican (231 | 8.7%), Norwegian (197 | 7.4%), and Irish (162 | 6.1%), together accounting for 54.1% of all Desert Hills residents.
| Ancestry | # Population | % Population |
| American | 138 | 5.2% |
| Australian | 11 | 0.4% |
| Blackfeet | 3 | 0.1% |
| British | 11 | 0.4% |
| Canadian | 46 | 1.7% |
| Cherokee | 25 | 0.9% |
| Cuban | 52 | 2.0% |
| Czech | 12 | 0.4% |
| Danish | 26 | 1.0% |
| Dutch | 30 | 1.1% |
| Eastern European | 60 | 2.3% |
| English | 340 | 12.8% |
| European | 12 | 0.4% |
| French | 33 | 1.2% |
| French Canadian | 15 | 0.6% |
| German | 505 | 19.1% |
| Hungarian | 9 | 0.3% |
| Indian (Asian) | 13 | 0.5% |
| Irish | 162 | 6.1% |
| Italian | 94 | 3.5% |
| Korean | 24 | 0.9% |
| Mexican | 231 | 8.7% |
| Norwegian | 197 | 7.4% |
| Pennsylvania German | 27 | 1.0% |
| Polish | 90 | 3.4% |
| Russian | 17 | 0.6% |
| Scotch-Irish | 66 | 2.5% |
| Scottish | 13 | 0.5% |
| South American | 19 | 0.7% |
| Swedish | 69 | 2.6% |
| Ukrainian | 13 | 0.5% |
| Uruguayan | 19 | 0.7% |
| Welsh | 33 | 1.2% | View All 33 Rows |
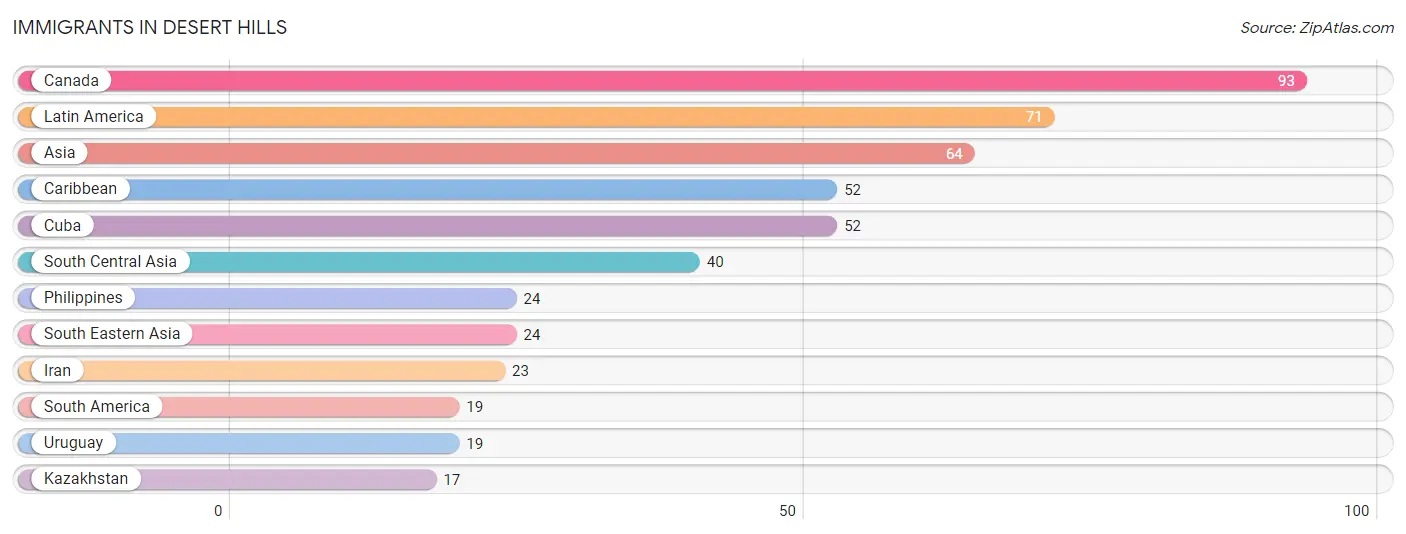
Immigrants in Desert Hills
The most numerous immigrant groups reported in Desert Hills came from Canada (93 | 3.5%), Latin America (71 | 2.7%), Asia (64 | 2.4%), Caribbean (52 | 2.0%), and Cuba (52 | 2.0%), together accounting for 12.5% of all Desert Hills residents.
| Immigration Origin | # Population | % Population |
| Asia | 64 | 2.4% |
| Canada | 93 | 3.5% |
| Caribbean | 52 | 2.0% |
| Cuba | 52 | 2.0% |
| Iran | 23 | 0.9% |
| Kazakhstan | 17 | 0.6% |
| Latin America | 71 | 2.7% |
| Philippines | 24 | 0.9% |
| South America | 19 | 0.7% |
| South Central Asia | 40 | 1.5% |
| South Eastern Asia | 24 | 0.9% |
| Uruguay | 19 | 0.7% | View All 12 Rows |
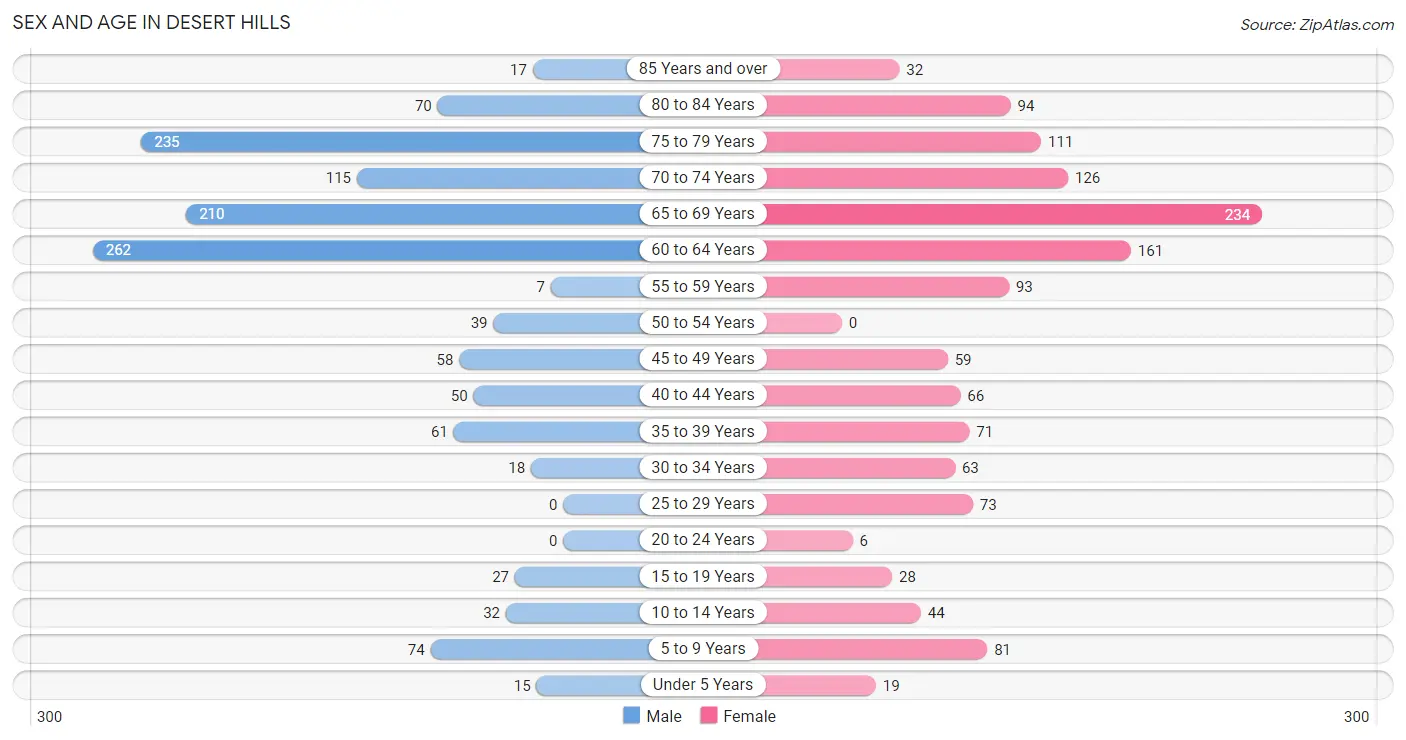
Sex and Age in Desert Hills
Sex and Age in Desert Hills
The most populous age groups in Desert Hills are 60 to 64 Years (262 | 20.3%) for men and 65 to 69 Years (234 | 17.2%) for women.
| Age Bracket | Male | Female |
| Under 5 Years | 15 (1.2%) | 19 (1.4%) |
| 5 to 9 Years | 74 (5.7%) | 81 (5.9%) |
| 10 to 14 Years | 32 (2.5%) | 44 (3.2%) |
| 15 to 19 Years | 27 (2.1%) | 28 (2.1%) |
| 20 to 24 Years | 0 (0.0%) | 6 (0.4%) |
| 25 to 29 Years | 0 (0.0%) | 73 (5.4%) |
| 30 to 34 Years | 18 (1.4%) | 63 (4.6%) |
| 35 to 39 Years | 61 (4.7%) | 71 (5.2%) |
| 40 to 44 Years | 50 (3.9%) | 66 (4.9%) |
| 45 to 49 Years | 58 (4.5%) | 59 (4.3%) |
| 50 to 54 Years | 39 (3.0%) | 0 (0.0%) |
| 55 to 59 Years | 7 (0.5%) | 93 (6.8%) |
| 60 to 64 Years | 262 (20.3%) | 161 (11.8%) |
| 65 to 69 Years | 210 (16.3%) | 234 (17.2%) |
| 70 to 74 Years | 115 (8.9%) | 126 (9.3%) |
| 75 to 79 Years | 235 (18.2%) | 111 (8.2%) |
| 80 to 84 Years | 70 (5.4%) | 94 (6.9%) |
| 85 Years and over | 17 (1.3%) | 32 (2.4%) |
| Total | 1,290 (100.0%) | 1,361 (100.0%) |
Families and Households in Desert Hills
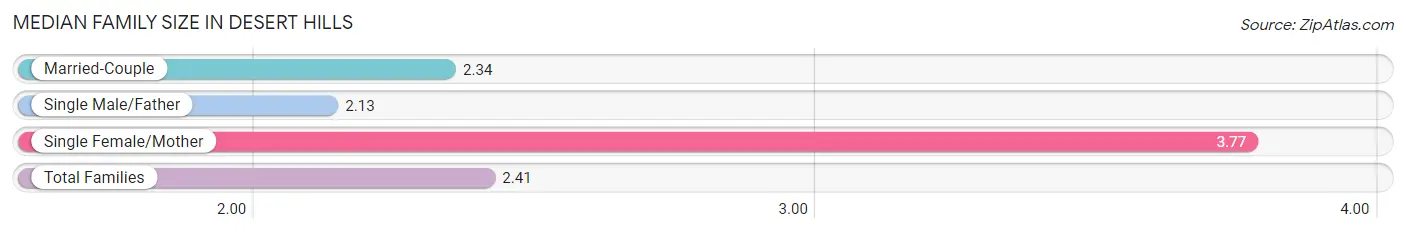
Median Family Size in Desert Hills
The median family size in Desert Hills is 2.41 persons per family, with single female/mother families (48 | 5.9%) accounting for the largest median family size of 3.77 persons per family. On the other hand, single male/father families (46 | 5.7%) represent the smallest median family size with 2.13 persons per family.
| Family Type | # Families | Family Size |
| Married-Couple | 719 (88.4%) | 2.34 |
| Single Male/Father | 46 (5.7%) | 2.13 |
| Single Female/Mother | 48 (5.9%) | 3.77 |
| Total Families | 813 (100.0%) | 2.41 |
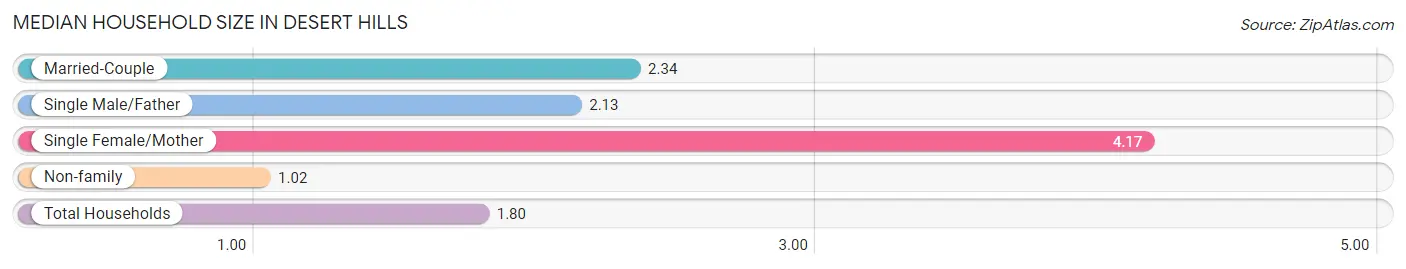
Median Household Size in Desert Hills
The median household size in Desert Hills is 1.80 persons per household, with single female/mother households (48 | 3.3%) accounting for the largest median household size of 4.17 persons per household. non-family households (659 | 44.8%) represent the smallest median household size with 1.02 persons per household.
| Household Type | # Households | Household Size |
| Married-Couple | 719 (48.8%) | 2.34 |
| Single Male/Father | 46 (3.1%) | 2.13 |
| Single Female/Mother | 48 (3.3%) | 4.17 |
| Non-family | 659 (44.8%) | 1.02 |
| Total Households | 1,472 (100.0%) | 1.80 |
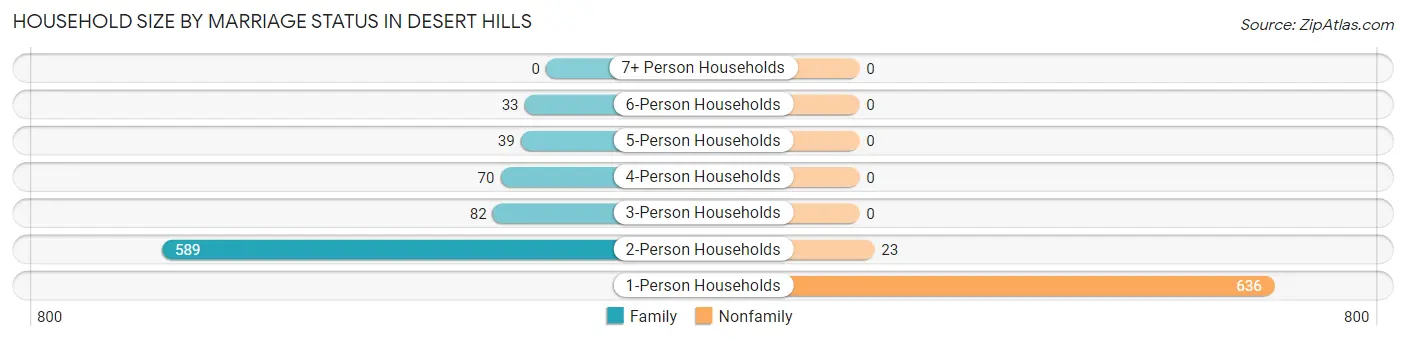
Household Size by Marriage Status in Desert Hills
Out of a total of 1,472 households in Desert Hills, 813 (55.2%) are family households, while 659 (44.8%) are nonfamily households. The most numerous type of family households are 2-person households, comprising 589, and the most common type of nonfamily households are 1-person households, comprising 636.
| Household Size | Family Households | Nonfamily Households |
| 1-Person Households | - | 636 (43.2%) |
| 2-Person Households | 589 (40.0%) | 23 (1.6%) |
| 3-Person Households | 82 (5.6%) | 0 (0.0%) |
| 4-Person Households | 70 (4.8%) | 0 (0.0%) |
| 5-Person Households | 39 (2.6%) | 0 (0.0%) |
| 6-Person Households | 33 (2.2%) | 0 (0.0%) |
| 7+ Person Households | 0 (0.0%) | 0 (0.0%) |
| Total | 813 (55.2%) | 659 (44.8%) |
Female Fertility in Desert Hills
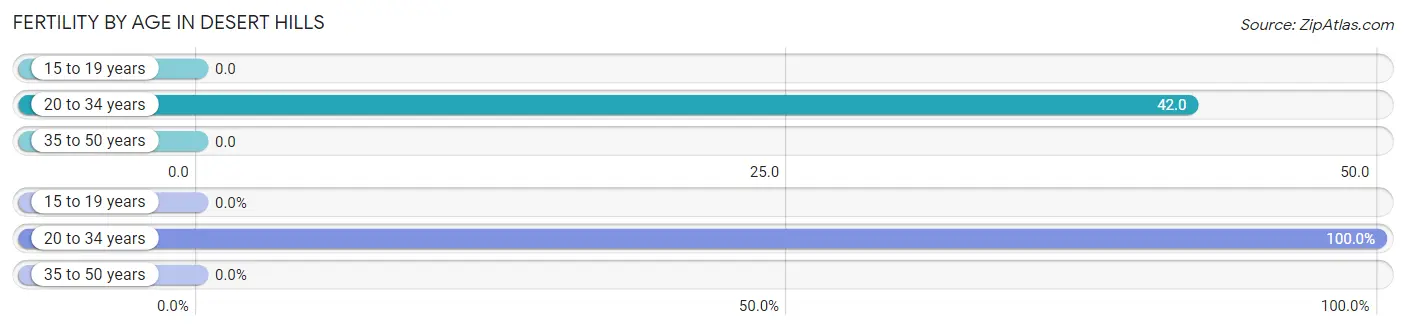
Fertility by Age in Desert Hills
Average fertility rate in Desert Hills is 16.0 births per 1,000 women. Women in the age bracket of 20 to 34 years have the highest fertility rate with 42.0 births per 1,000 women. Women in the age bracket of 20 to 34 years acount for 100.0% of all women with births.
| Age Bracket | Women with Births | Births / 1,000 Women |
| 15 to 19 years | 0 (0.0%) | 0.0 |
| 20 to 34 years | 6 (100.0%) | 42.0 |
| 35 to 50 years | 0 (0.0%) | 0.0 |
| Total | 6 (100.0%) | 16.0 |
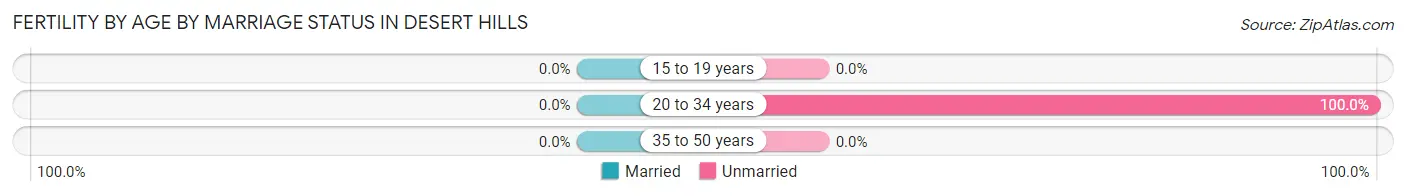
Fertility by Age by Marriage Status in Desert Hills
| Age Bracket | Married | Unmarried |
| 15 to 19 years | 0 (0.0%) | 0 (0.0%) |
| 20 to 34 years | 0 (0.0%) | 6 (100.0%) |
| 35 to 50 years | 0 (0.0%) | 0 (0.0%) |
| Total | 0 (0.0%) | 6 (100.0%) |
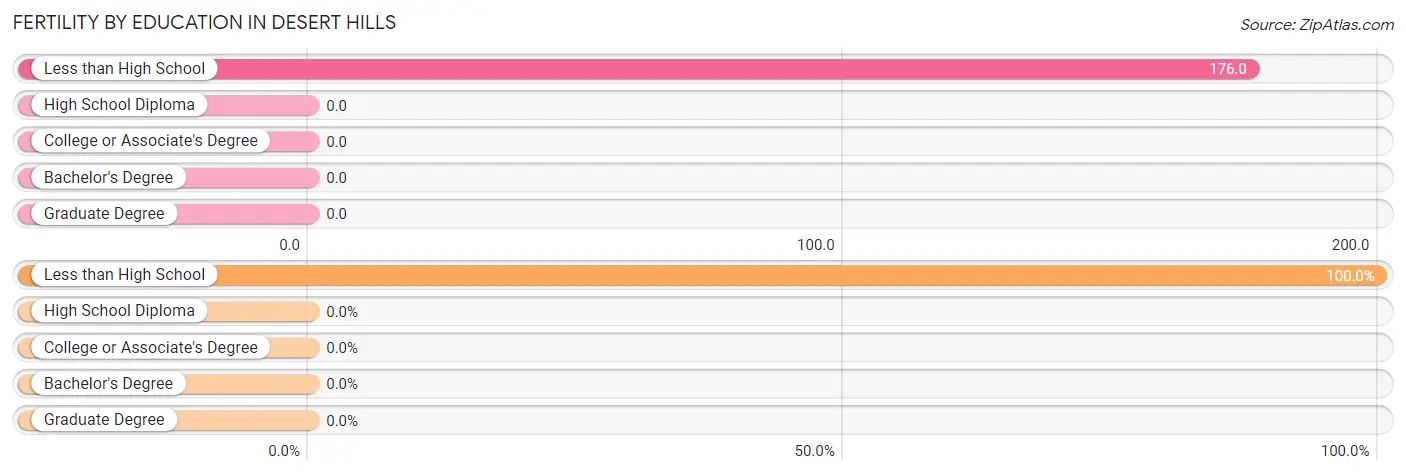
Fertility by Education in Desert Hills
| Educational Attainment | Women with Births | Births / 1,000 Women |
| Less than High School | 6 (100.0%) | 176.0 |
| High School Diploma | 0 (0.0%) | 0.0 |
| College or Associate's Degree | 0 (0.0%) | 0.0 |
| Bachelor's Degree | 0 (0.0%) | 0.0 |
| Graduate Degree | 0 (0.0%) | 0.0 |
| Total | 6 (100.0%) | 16.0 |
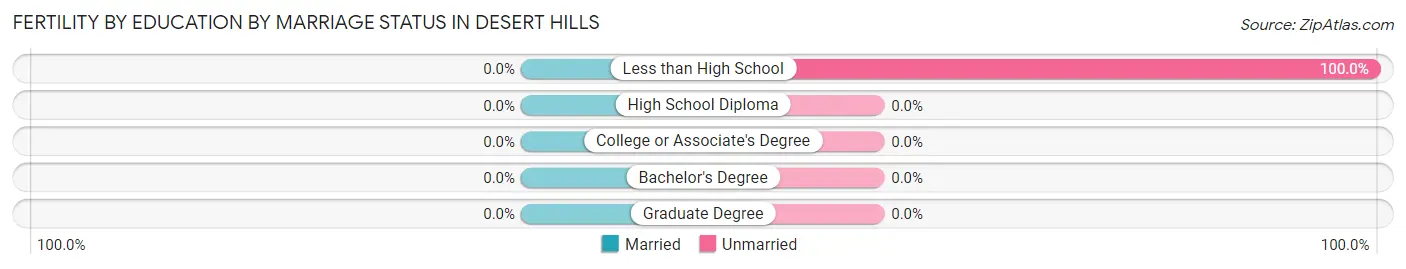
Fertility by Education by Marriage Status in Desert Hills
| Educational Attainment | Married | Unmarried |
| Less than High School | 0 (0.0%) | 6 (100.0%) |
| High School Diploma | 0 (0.0%) | 0 (0.0%) |
| College or Associate's Degree | 0 (0.0%) | 0 (0.0%) |
| Bachelor's Degree | 0 (0.0%) | 0 (0.0%) |
| Graduate Degree | 0 (0.0%) | 0 (0.0%) |
| Total | 0 (0.0%) | 6 (100.0%) |
Income in Desert Hills
Income Overview in Desert Hills
Per Capita Income in Desert Hills is $47,995, while median incomes of families and households are $75,759 and $59,911 respectively.
| Characteristic | Number | Measure |
| Per Capita Income | 2,651 | $47,995 |
| Median Family Income | 813 | $75,759 |
| Mean Family Income | 813 | $100,565 |
| Median Household Income | 1,472 | $59,911 |
| Mean Household Income | 1,472 | $87,086 |
| Income Deficit | 813 | $0 |
| Wage / Income Gap (%) | 2,651 | 44.87% |
| Wage / Income Gap ($) | 2,651 | 55.13¢ per $1 |
| Gini / Inequality Index | 2,651 | 0.47 |
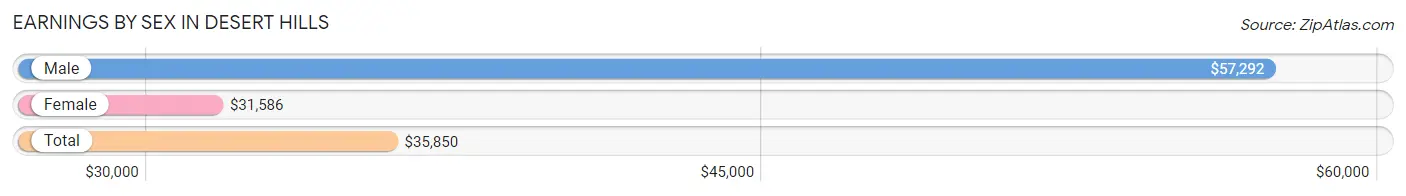
Earnings by Sex in Desert Hills
Average Earnings in Desert Hills are $35,850, $57,292 for men and $31,586 for women, a difference of 44.9%.
| Sex | Number | Average Earnings |
| Male | 399 (41.6%) | $57,292 |
| Female | 559 (58.4%) | $31,586 |
| Total | 958 (100.0%) | $35,850 |
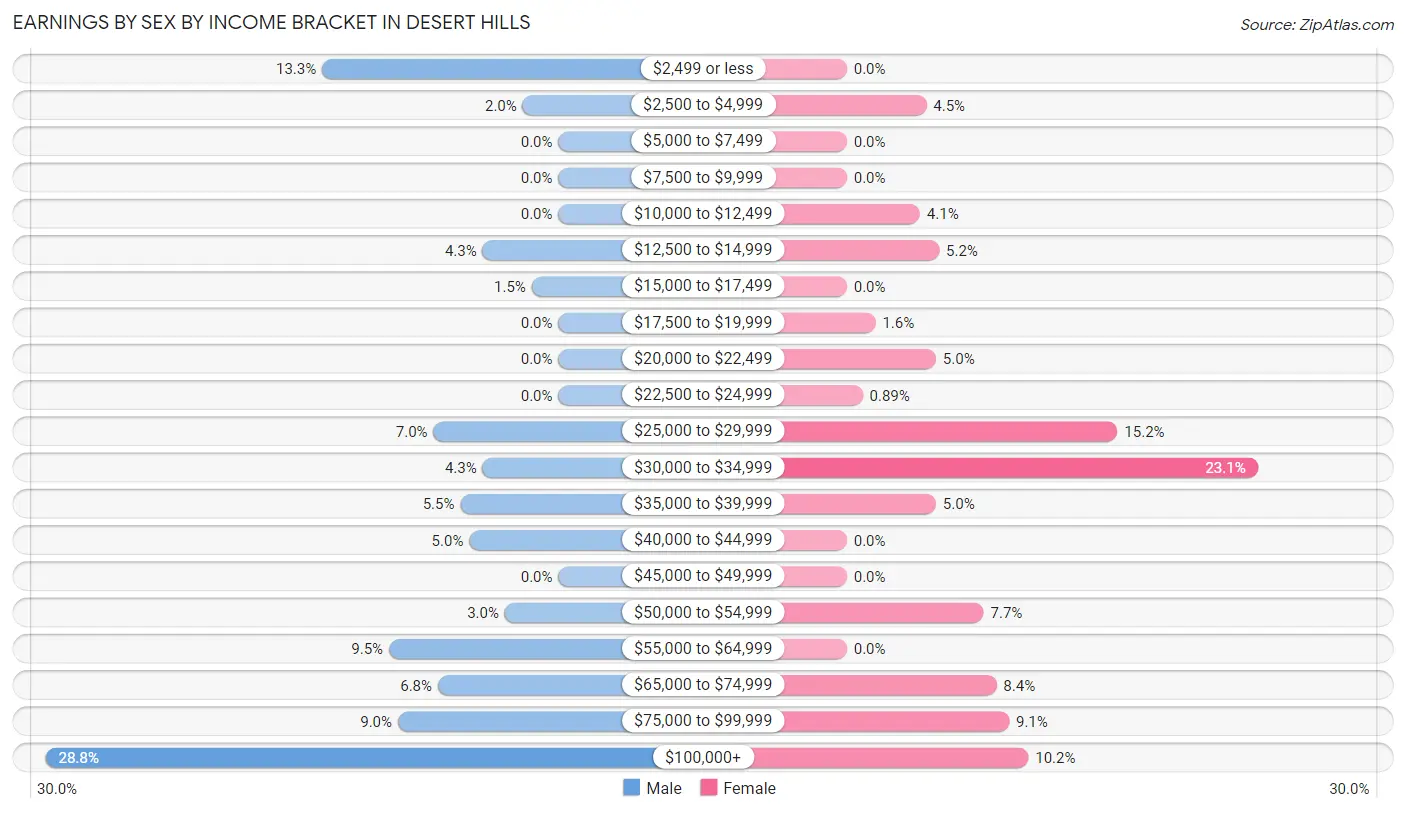
Earnings by Sex by Income Bracket in Desert Hills
The most common earnings brackets in Desert Hills are $100,000+ for men (115 | 28.8%) and $30,000 to $34,999 for women (129 | 23.1%).
| Income | Male | Female |
| $2,499 or less | 53 (13.3%) | 0 (0.0%) |
| $2,500 to $4,999 | 8 (2.0%) | 25 (4.5%) |
| $5,000 to $7,499 | 0 (0.0%) | 0 (0.0%) |
| $7,500 to $9,999 | 0 (0.0%) | 0 (0.0%) |
| $10,000 to $12,499 | 0 (0.0%) | 23 (4.1%) |
| $12,500 to $14,999 | 17 (4.3%) | 29 (5.2%) |
| $15,000 to $17,499 | 6 (1.5%) | 0 (0.0%) |
| $17,500 to $19,999 | 0 (0.0%) | 9 (1.6%) |
| $20,000 to $22,499 | 0 (0.0%) | 28 (5.0%) |
| $22,500 to $24,999 | 0 (0.0%) | 5 (0.9%) |
| $25,000 to $29,999 | 28 (7.0%) | 85 (15.2%) |
| $30,000 to $34,999 | 17 (4.3%) | 129 (23.1%) |
| $35,000 to $39,999 | 22 (5.5%) | 28 (5.0%) |
| $40,000 to $44,999 | 20 (5.0%) | 0 (0.0%) |
| $45,000 to $49,999 | 0 (0.0%) | 0 (0.0%) |
| $50,000 to $54,999 | 12 (3.0%) | 43 (7.7%) |
| $55,000 to $64,999 | 38 (9.5%) | 0 (0.0%) |
| $65,000 to $74,999 | 27 (6.8%) | 47 (8.4%) |
| $75,000 to $99,999 | 36 (9.0%) | 51 (9.1%) |
| $100,000+ | 115 (28.8%) | 57 (10.2%) |
| Total | 399 (100.0%) | 559 (100.0%) |
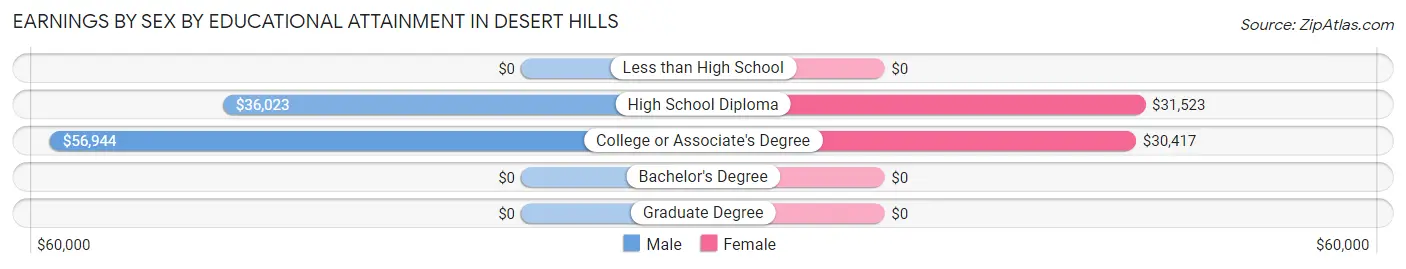
Earnings by Sex by Educational Attainment in Desert Hills
Average earnings in Desert Hills are $59,000 for men and $31,649 for women, a difference of 46.4%. Men with an educational attainment of college or associate's degree enjoy the highest average annual earnings of $56,944, while those with high school diploma education earn the least with $36,023. Women with an educational attainment of high school diploma earn the most with the average annual earnings of $31,523, while those with college or associate's degree education have the smallest earnings of $30,417.
| Educational Attainment | Male Income | Female Income |
| Less than High School | - | - |
| High School Diploma | $36,023 | $31,523 |
| College or Associate's Degree | $56,944 | $30,417 |
| Bachelor's Degree | - | - |
| Graduate Degree | - | - |
| Total | $59,000 | $31,649 |
Family Income in Desert Hills
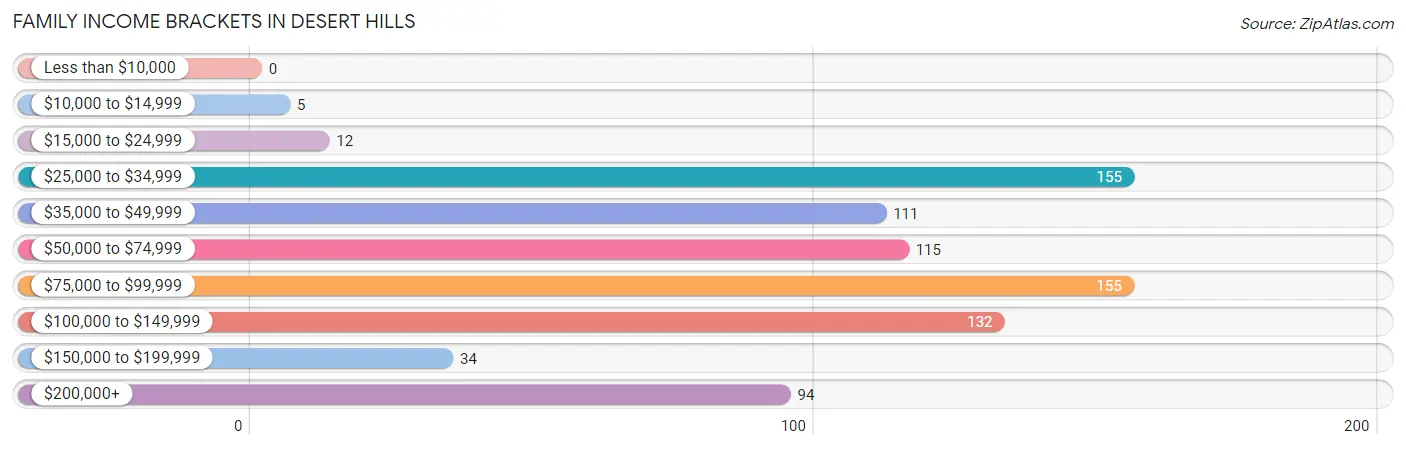
Family Income Brackets in Desert Hills
According to the Desert Hills family income data, there are 155 families falling into the $25,000 to $34,999 income range, which is the most common income bracket and makes up 19.1% of all families.
| Income Bracket | # Families | % Families |
| Less than $10,000 | 0 | 0.0% |
| $10,000 to $14,999 | 5 | 0.6% |
| $15,000 to $24,999 | 12 | 1.5% |
| $25,000 to $34,999 | 155 | 19.1% |
| $35,000 to $49,999 | 111 | 13.7% |
| $50,000 to $74,999 | 115 | 14.1% |
| $75,000 to $99,999 | 155 | 19.1% |
| $100,000 to $149,999 | 132 | 16.2% |
| $150,000 to $199,999 | 34 | 4.2% |
| $200,000+ | 94 | 11.6% |
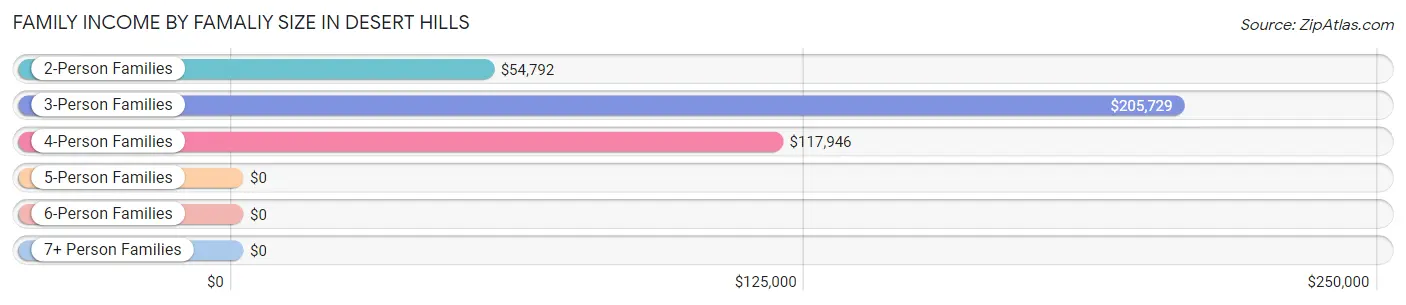
Family Income by Famaliy Size in Desert Hills
3-person families (87 | 10.7%) account for the highest median family income in Desert Hills with $205,729 per family, while 3-person families (87 | 10.7%) have the highest median income of $68,576 per family member.
| Income Bracket | # Families | Median Income |
| 2-Person Families | 589 (72.5%) | $54,792 |
| 3-Person Families | 87 (10.7%) | $205,729 |
| 4-Person Families | 70 (8.6%) | $117,946 |
| 5-Person Families | 39 (4.8%) | $0 |
| 6-Person Families | 28 (3.4%) | $0 |
| 7+ Person Families | 0 (0.0%) | $0 |
| Total | 813 (100.0%) | $75,759 |
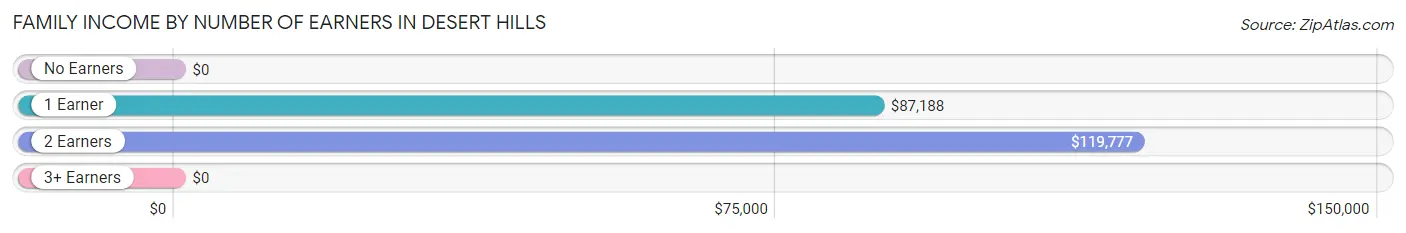
Family Income by Number of Earners in Desert Hills
| Number of Earners | # Families | Median Income |
| No Earners | 339 (41.7%) | $0 |
| 1 Earner | 280 (34.4%) | $87,188 |
| 2 Earners | 139 (17.1%) | $119,777 |
| 3+ Earners | 55 (6.8%) | $0 |
| Total | 813 (100.0%) | $75,759 |
Household Income in Desert Hills
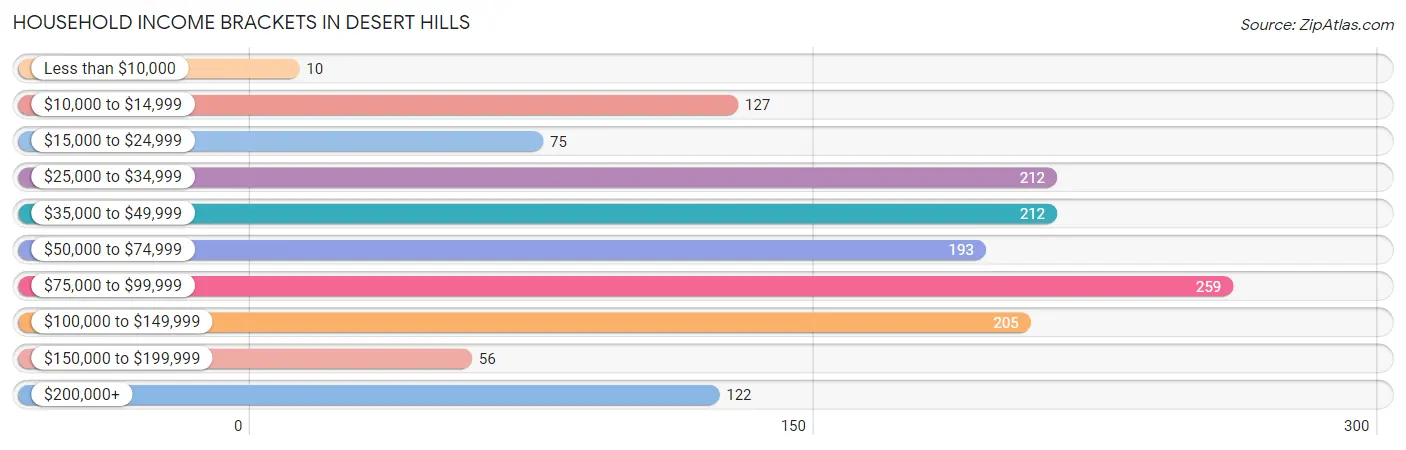
Household Income Brackets in Desert Hills
With 259 households falling in the category, the $75,000 to $99,999 income range is the most frequent in Desert Hills, accounting for 17.6% of all households. In contrast, only 10 households (0.7%) fall into the less than $10,000 income bracket, making it the least populous group.
| Income Bracket | # Households | % Households |
| Less than $10,000 | 10 | 0.7% |
| $10,000 to $14,999 | 127 | 8.6% |
| $15,000 to $24,999 | 75 | 5.1% |
| $25,000 to $34,999 | 212 | 14.4% |
| $35,000 to $49,999 | 212 | 14.4% |
| $50,000 to $74,999 | 193 | 13.1% |
| $75,000 to $99,999 | 259 | 17.6% |
| $100,000 to $149,999 | 205 | 13.9% |
| $150,000 to $199,999 | 56 | 3.8% |
| $200,000+ | 122 | 8.3% |
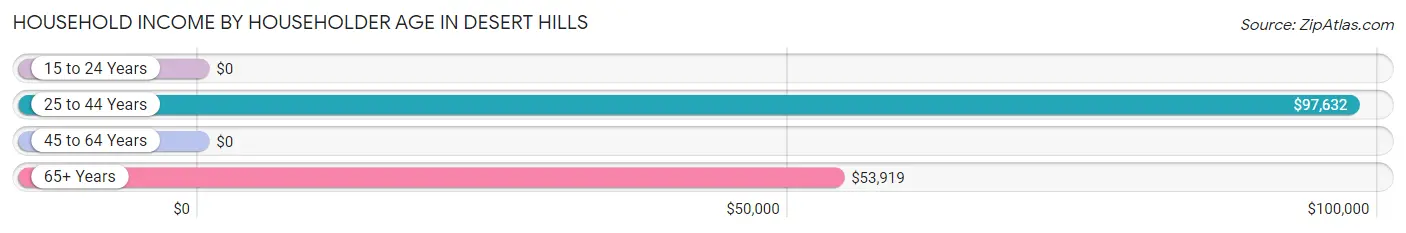
Household Income by Householder Age in Desert Hills
The median household income in Desert Hills is $59,911, with the highest median household income of $97,632 found in the 25 to 44 years age bracket for the primary householder. A total of 218 households (14.8%) fall into this category.
| Income Bracket | # Households | Median Income |
| 15 to 24 Years | 0 (0.0%) | $0 |
| 25 to 44 Years | 218 (14.8%) | $97,632 |
| 45 to 64 Years | 400 (27.2%) | $0 |
| 65+ Years | 854 (58.0%) | $53,919 |
| Total | 1,472 (100.0%) | $59,911 |
Poverty in Desert Hills
Income Below Poverty by Sex and Age in Desert Hills
With 6.0% poverty level for males and 3.9% for females among the residents of Desert Hills, 65 to 74 year old males and 18 to 24 year old females are the most vulnerable to poverty, with 78 males (24.0%) and 6 females (100.0%) in their respective age groups living below the poverty level.
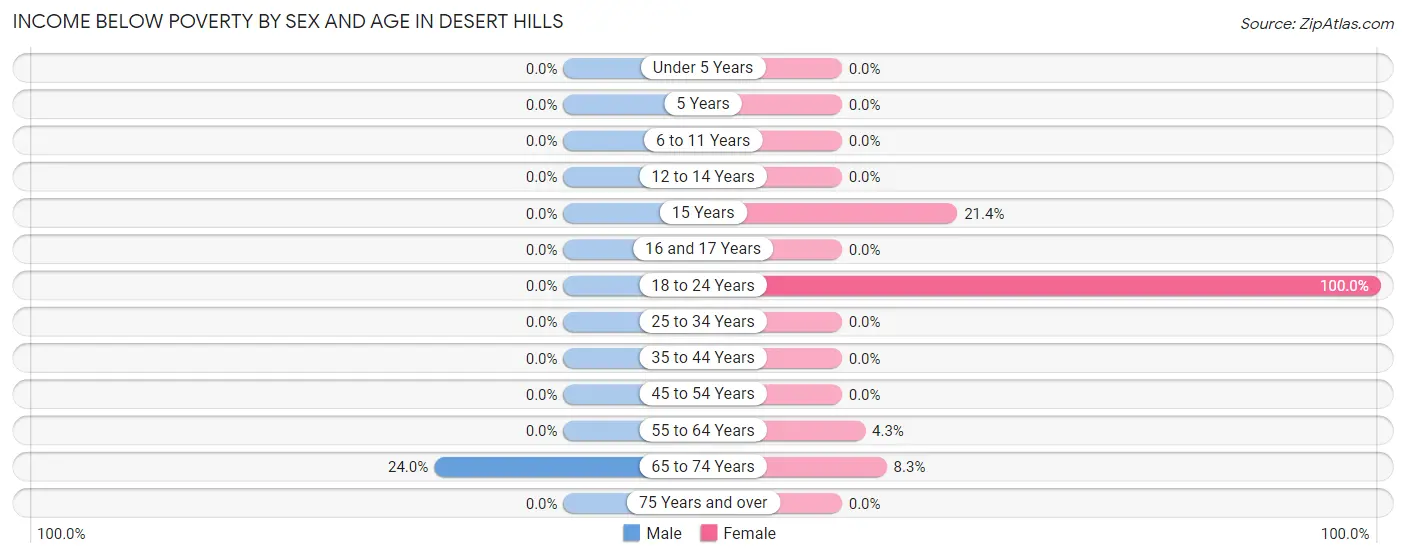
| Age Bracket | Male | Female |
| Under 5 Years | 0 (0.0%) | 0 (0.0%) |
| 5 Years | 0 (0.0%) | 0 (0.0%) |
| 6 to 11 Years | 0 (0.0%) | 0 (0.0%) |
| 12 to 14 Years | 0 (0.0%) | 0 (0.0%) |
| 15 Years | 0 (0.0%) | 6 (21.4%) |
| 16 and 17 Years | 0 (0.0%) | 0 (0.0%) |
| 18 to 24 Years | 0 (0.0%) | 6 (100.0%) |
| 25 to 34 Years | 0 (0.0%) | 0 (0.0%) |
| 35 to 44 Years | 0 (0.0%) | 0 (0.0%) |
| 45 to 54 Years | 0 (0.0%) | 0 (0.0%) |
| 55 to 64 Years | 0 (0.0%) | 11 (4.3%) |
| 65 to 74 Years | 78 (24.0%) | 30 (8.3%) |
| 75 Years and over | 0 (0.0%) | 0 (0.0%) |
| Total | 78 (6.0%) | 53 (3.9%) |
Income Above Poverty by Sex and Age in Desert Hills
According to the poverty statistics in Desert Hills, males aged under 5 years and females aged under 5 years are the age groups that are most secure financially, with 100.0% of males and 100.0% of females in these age groups living above the poverty line.
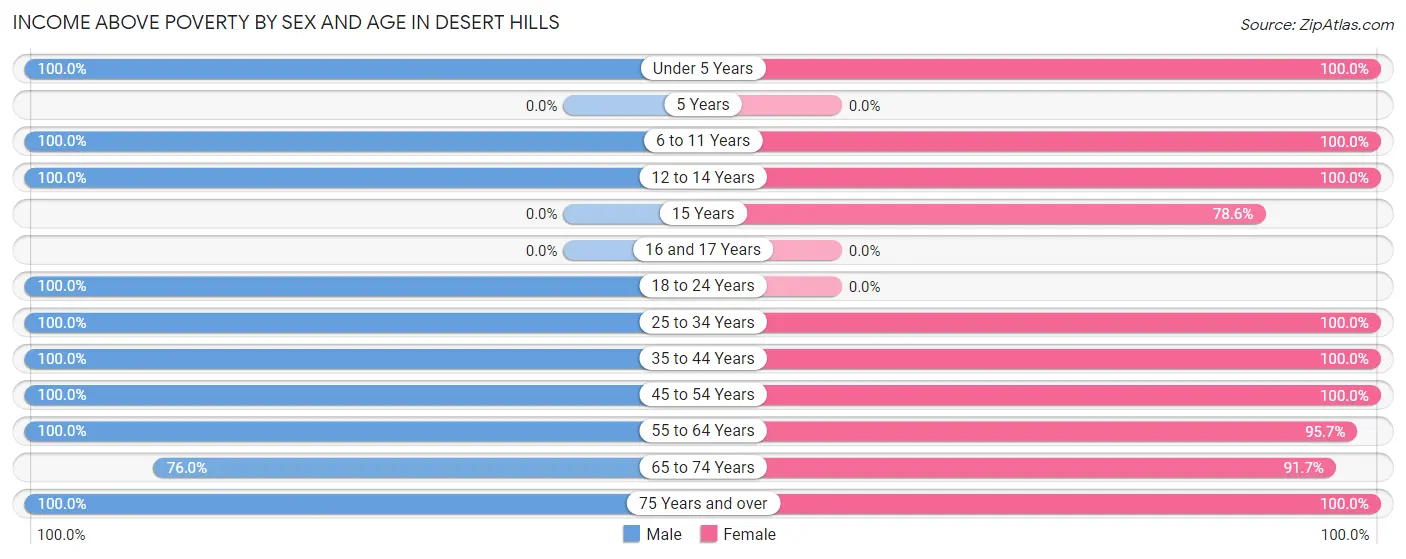
| Age Bracket | Male | Female |
| Under 5 Years | 15 (100.0%) | 12 (100.0%) |
| 5 Years | 0 (0.0%) | 0 (0.0%) |
| 6 to 11 Years | 95 (100.0%) | 81 (100.0%) |
| 12 to 14 Years | 11 (100.0%) | 44 (100.0%) |
| 15 Years | 0 (0.0%) | 22 (78.6%) |
| 16 and 17 Years | 0 (0.0%) | 0 (0.0%) |
| 18 to 24 Years | 27 (100.0%) | 0 (0.0%) |
| 25 to 34 Years | 18 (100.0%) | 136 (100.0%) |
| 35 to 44 Years | 111 (100.0%) | 137 (100.0%) |
| 45 to 54 Years | 97 (100.0%) | 59 (100.0%) |
| 55 to 64 Years | 269 (100.0%) | 243 (95.7%) |
| 65 to 74 Years | 247 (76.0%) | 330 (91.7%) |
| 75 Years and over | 322 (100.0%) | 237 (100.0%) |
| Total | 1,212 (94.0%) | 1,301 (96.1%) |
Income Below Poverty Among Married-Couple Families in Desert Hills
The poverty statistics for married-couple families in Desert Hills show that 0.7% or 5 of the total 719 families live below the poverty line. Families with 1 or 2 children have the highest poverty rate of 5.4%, comprising of 5 families. On the other hand, families with no children have the lowest poverty rate of 0.0%, which includes 0 families.
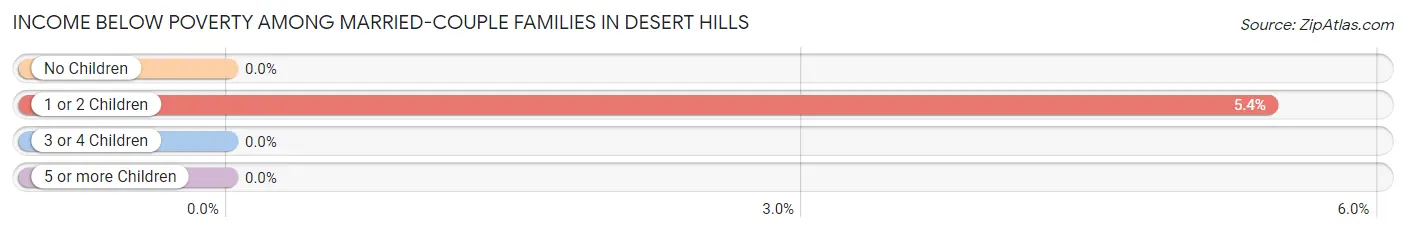
| Children | Above Poverty | Below Poverty |
| No Children | 587 (100.0%) | 0 (0.0%) |
| 1 or 2 Children | 87 (94.6%) | 5 (5.4%) |
| 3 or 4 Children | 40 (100.0%) | 0 (0.0%) |
| 5 or more Children | 0 (0.0%) | 0 (0.0%) |
| Total | 714 (99.3%) | 5 (0.7%) |
Income Below Poverty Among Single-Parent Households in Desert Hills
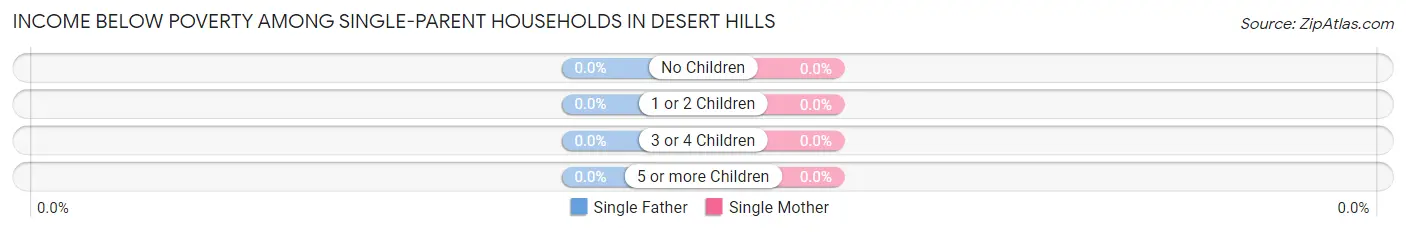
| Children | Single Father | Single Mother |
| No Children | 0 (0.0%) | 0 (0.0%) |
| 1 or 2 Children | 0 (0.0%) | 0 (0.0%) |
| 3 or 4 Children | 0 (0.0%) | 0 (0.0%) |
| 5 or more Children | 0 (0.0%) | 0 (0.0%) |
| Total | 0 (0.0%) | 0 (0.0%) |
Income Below Poverty Among Married-Couple vs Single-Parent Households in Desert Hills
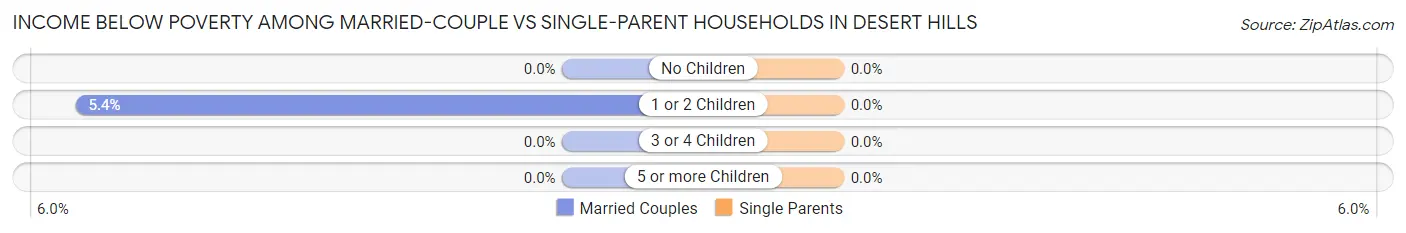
| Children | Married-Couple Families | Single-Parent Households |
| No Children | 0 (0.0%) | 0 (0.0%) |
| 1 or 2 Children | 5 (5.4%) | 0 (0.0%) |
| 3 or 4 Children | 0 (0.0%) | 0 (0.0%) |
| 5 or more Children | 0 (0.0%) | 0 (0.0%) |
| Total | 5 (0.7%) | 0 (0.0%) |
Employment Characteristics in Desert Hills
Employment by Class of Employer in Desert Hills
Among the 825 employed individuals in Desert Hills, private company employees (467 | 56.6%), not-for-profit organizations (90 | 10.9%), and self-employed (not incorporated) (79 | 9.6%) make up the most common classes of employment.
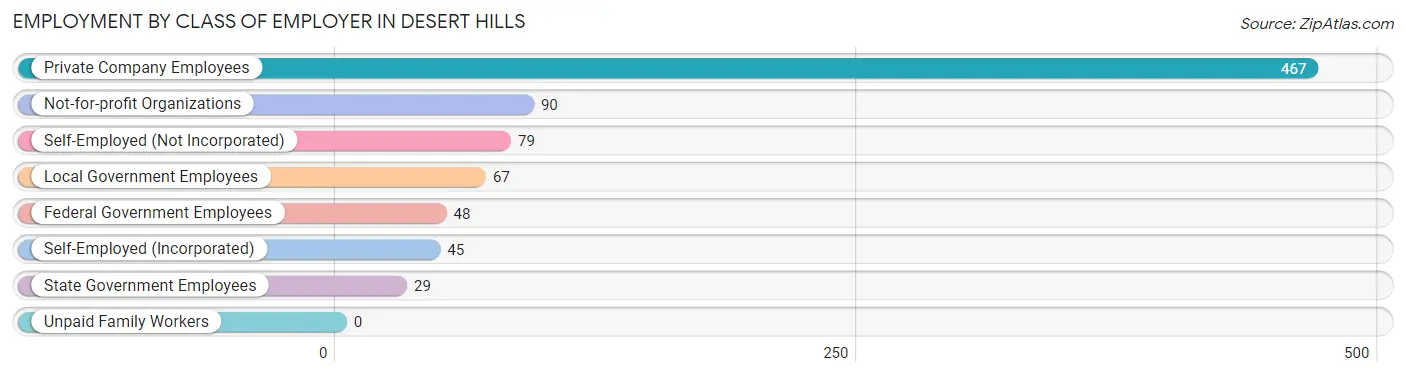
| Employer Class | # Employees | % Employees |
| Private Company Employees | 467 | 56.6% |
| Self-Employed (Incorporated) | 45 | 5.4% |
| Self-Employed (Not Incorporated) | 79 | 9.6% |
| Not-for-profit Organizations | 90 | 10.9% |
| Local Government Employees | 67 | 8.1% |
| State Government Employees | 29 | 3.5% |
| Federal Government Employees | 48 | 5.8% |
| Unpaid Family Workers | 0 | 0.0% |
| Total | 825 | 100.0% |
Employment Status by Age in Desert Hills
According to the labor force statistics for Desert Hills, out of the total population over 16 years of age (2,358), 37.9% or 894 individuals are in the labor force, with 7.6% or 68 of them unemployed. The age group with the highest labor force participation rate is 16 to 19 years, with 100.0% or 27 individuals in the labor force. Within the labor force, the 16 to 19 years age range has the highest percentage of unemployed individuals, with 70.4% or 19 of them being unemployed.
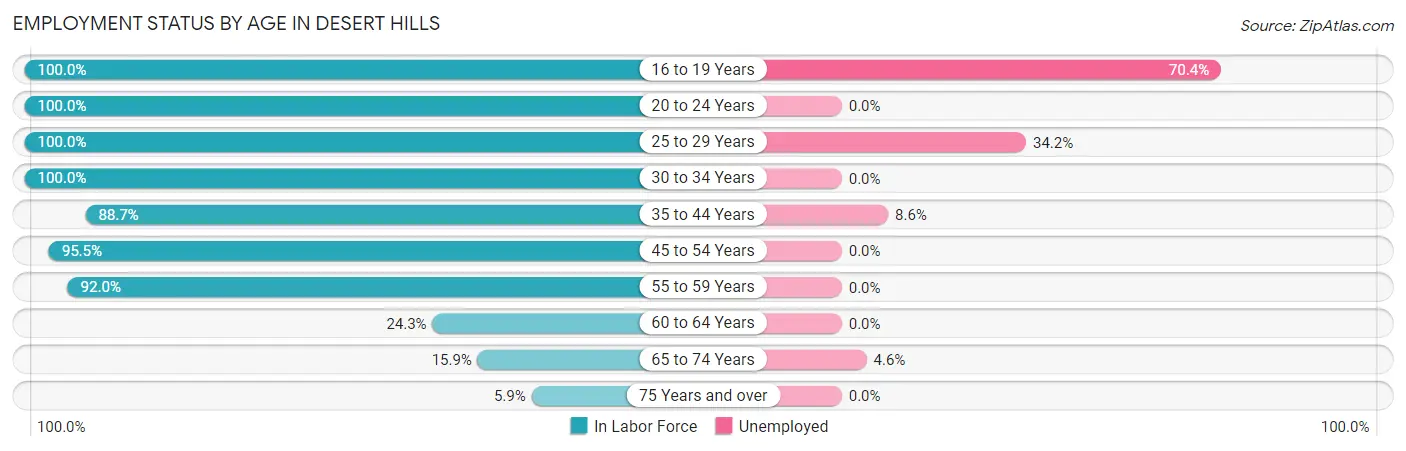
| Age Bracket | In Labor Force | Unemployed |
| 16 to 19 Years | 27 (100.0%) | 19 (70.4%) |
| 20 to 24 Years | 6 (100.0%) | 0 (0.0%) |
| 25 to 29 Years | 73 (100.0%) | 25 (34.2%) |
| 30 to 34 Years | 81 (100.0%) | 0 (0.0%) |
| 35 to 44 Years | 220 (88.7%) | 19 (8.6%) |
| 45 to 54 Years | 149 (95.5%) | 0 (0.0%) |
| 55 to 59 Years | 92 (92.0%) | 0 (0.0%) |
| 60 to 64 Years | 103 (24.3%) | 0 (0.0%) |
| 65 to 74 Years | 109 (15.9%) | 5 (4.6%) |
| 75 Years and over | 33 (5.9%) | 0 (0.0%) |
| Total | 894 (37.9%) | 68 (7.6%) |
Employment Status by Educational Attainment in Desert Hills
According to labor force statistics for Desert Hills, 66.4% of individuals (718) out of the total population between 25 and 64 years of age (1,081) are in the labor force, with 6.1% or 44 of them being unemployed. The group with the highest labor force participation rate are those with the educational attainment of high school diploma, with 76.1% or 197 individuals in the labor force. Within the labor force, individuals with bachelor's degree or higher education have the highest percentage of unemployment, with 8.6% or 19 of them being unemployed.
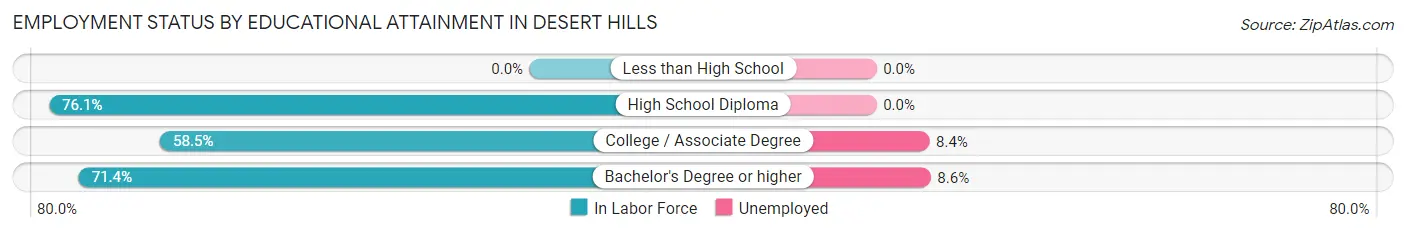
| Educational Attainment | In Labor Force | Unemployed |
| Less than High School | 0 (0.0%) | 0 (0.0%) |
| High School Diploma | 197 (76.1%) | 0 (0.0%) |
| College / Associate Degree | 299 (58.5%) | 43 (8.4%) |
| Bachelor's Degree or higher | 222 (71.4%) | 27 (8.6%) |
| Total | 718 (66.4%) | 66 (6.1%) |
Employment Occupations by Sex in Desert Hills
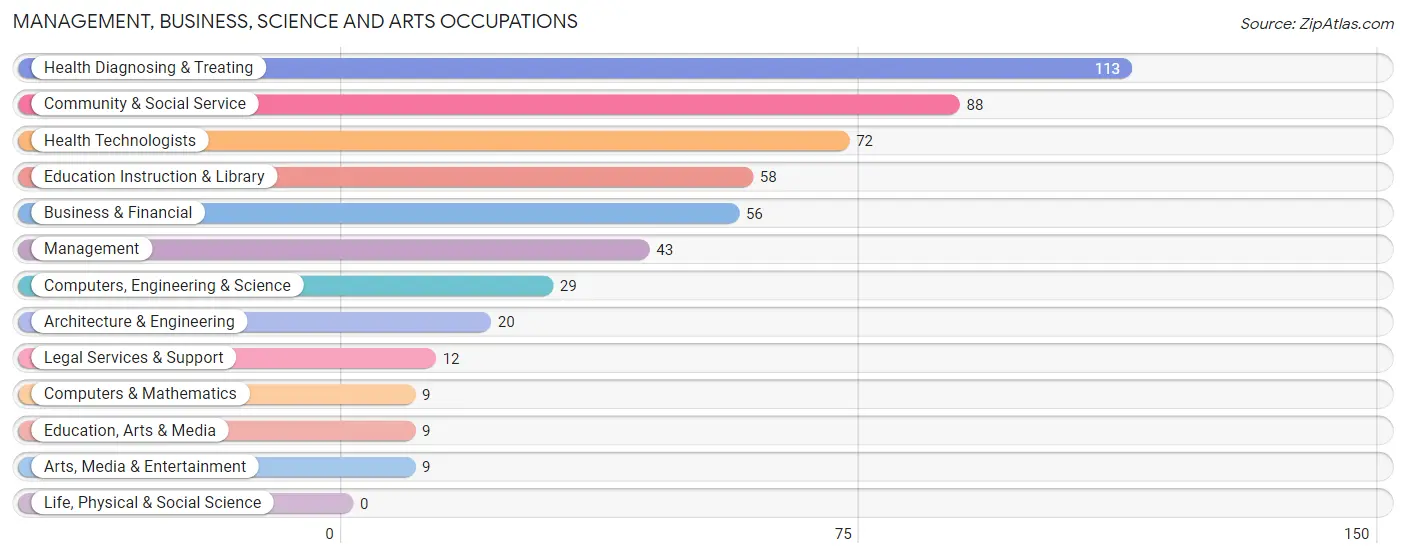
Management, Business, Science and Arts Occupations
The most common Management, Business, Science and Arts occupations in Desert Hills are Health Diagnosing & Treating (113 | 13.7%), Community & Social Service (88 | 10.7%), Health Technologists (72 | 8.7%), Education Instruction & Library (58 | 7.0%), and Business & Financial (56 | 6.8%).
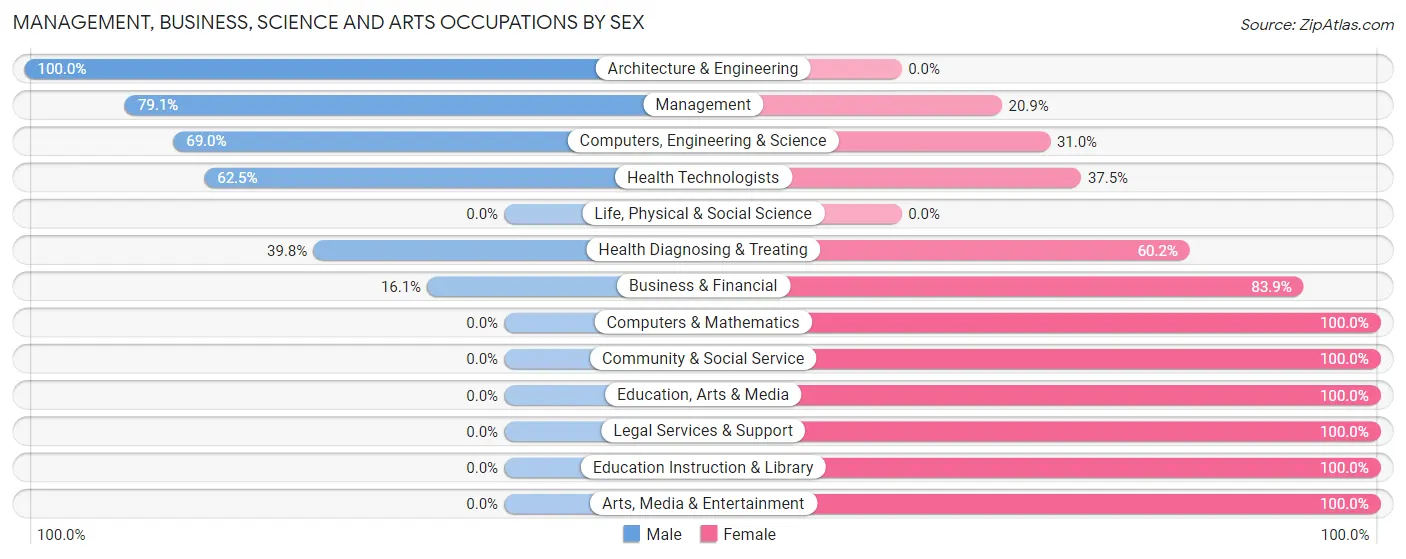
Management, Business, Science and Arts Occupations by Sex
Within the Management, Business, Science and Arts occupations in Desert Hills, the most male-oriented occupations are Architecture & Engineering (100.0%), Management (79.1%), and Computers, Engineering & Science (69.0%), while the most female-oriented occupations are Computers & Mathematics (100.0%), Community & Social Service (100.0%), and Education, Arts & Media (100.0%).
| Occupation | Male | Female |
| Management | 34 (79.1%) | 9 (20.9%) |
| Business & Financial | 9 (16.1%) | 47 (83.9%) |
| Computers, Engineering & Science | 20 (69.0%) | 9 (31.0%) |
| Computers & Mathematics | 0 (0.0%) | 9 (100.0%) |
| Architecture & Engineering | 20 (100.0%) | 0 (0.0%) |
| Life, Physical & Social Science | 0 (0.0%) | 0 (0.0%) |
| Community & Social Service | 0 (0.0%) | 88 (100.0%) |
| Education, Arts & Media | 0 (0.0%) | 9 (100.0%) |
| Legal Services & Support | 0 (0.0%) | 12 (100.0%) |
| Education Instruction & Library | 0 (0.0%) | 58 (100.0%) |
| Arts, Media & Entertainment | 0 (0.0%) | 9 (100.0%) |
| Health Diagnosing & Treating | 45 (39.8%) | 68 (60.2%) |
| Health Technologists | 45 (62.5%) | 27 (37.5%) |
| Total (Category) | 108 (32.8%) | 221 (67.2%) |
| Total (Overall) | 306 (37.1%) | 519 (62.9%) |
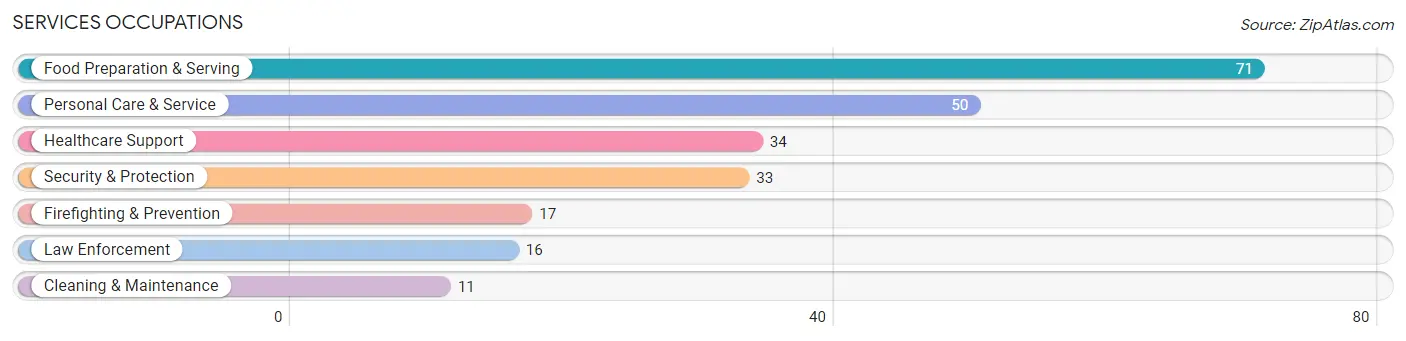
Services Occupations
The most common Services occupations in Desert Hills are Food Preparation & Serving (71 | 8.6%), Personal Care & Service (50 | 6.1%), Healthcare Support (34 | 4.1%), Security & Protection (33 | 4.0%), and Firefighting & Prevention (17 | 2.1%).
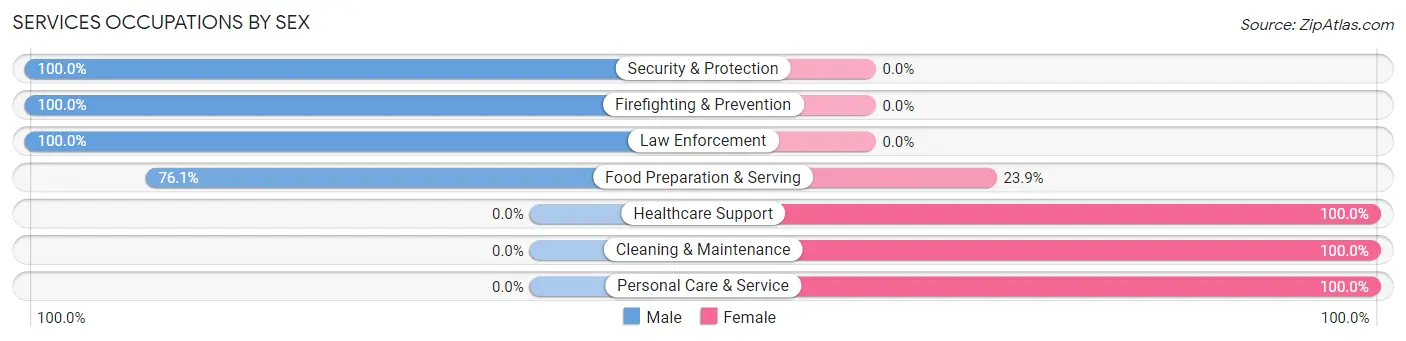
Services Occupations by Sex
Within the Services occupations in Desert Hills, the most male-oriented occupations are Security & Protection (100.0%), Firefighting & Prevention (100.0%), and Law Enforcement (100.0%), while the most female-oriented occupations are Healthcare Support (100.0%), Cleaning & Maintenance (100.0%), and Personal Care & Service (100.0%).
| Occupation | Male | Female |
| Healthcare Support | 0 (0.0%) | 34 (100.0%) |
| Security & Protection | 33 (100.0%) | 0 (0.0%) |
| Firefighting & Prevention | 17 (100.0%) | 0 (0.0%) |
| Law Enforcement | 16 (100.0%) | 0 (0.0%) |
| Food Preparation & Serving | 54 (76.1%) | 17 (23.9%) |
| Cleaning & Maintenance | 0 (0.0%) | 11 (100.0%) |
| Personal Care & Service | 0 (0.0%) | 50 (100.0%) |
| Total (Category) | 87 (43.7%) | 112 (56.3%) |
| Total (Overall) | 306 (37.1%) | 519 (62.9%) |
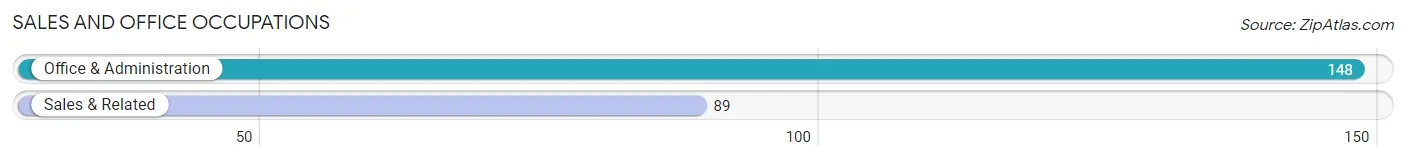
Sales and Office Occupations
The most common Sales and Office occupations in Desert Hills are Office & Administration (148 | 17.9%), and Sales & Related (89 | 10.8%).
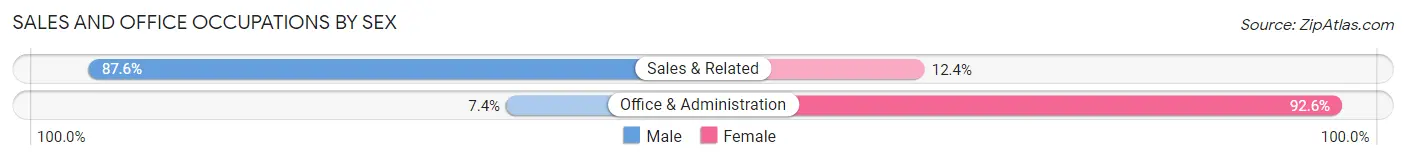
Sales and Office Occupations by Sex
| Occupation | Male | Female |
| Sales & Related | 78 (87.6%) | 11 (12.4%) |
| Office & Administration | 11 (7.4%) | 137 (92.6%) |
| Total (Category) | 89 (37.6%) | 148 (62.5%) |
| Total (Overall) | 306 (37.1%) | 519 (62.9%) |
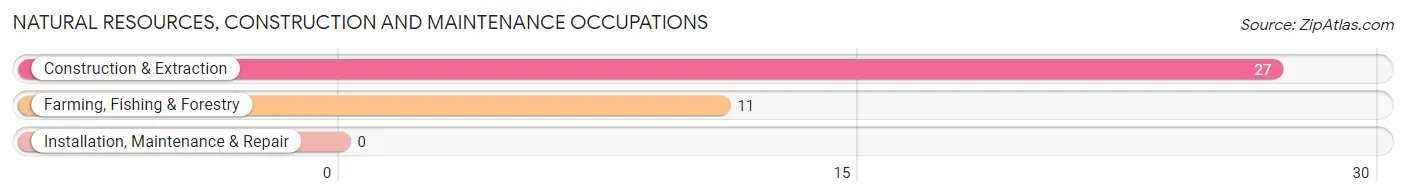
Natural Resources, Construction and Maintenance Occupations
The most common Natural Resources, Construction and Maintenance occupations in Desert Hills are Construction & Extraction (27 | 3.3%), and Farming, Fishing & Forestry (11 | 1.3%).
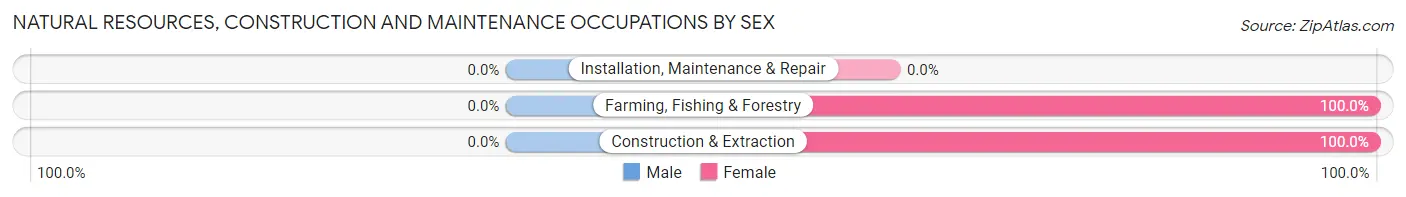
Natural Resources, Construction and Maintenance Occupations by Sex
| Occupation | Male | Female |
| Farming, Fishing & Forestry | 0 (0.0%) | 11 (100.0%) |
| Construction & Extraction | 0 (0.0%) | 27 (100.0%) |
| Installation, Maintenance & Repair | 0 (0.0%) | 0 (0.0%) |
| Total (Category) | 0 (0.0%) | 38 (100.0%) |
| Total (Overall) | 306 (37.1%) | 519 (62.9%) |
Production, Transportation and Moving Occupations
The most common Production, Transportation and Moving occupations in Desert Hills are , and Production (22 | 2.7%).
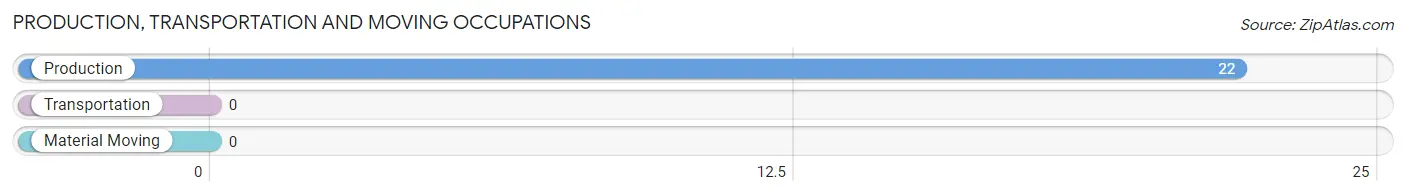
Production, Transportation and Moving Occupations by Sex
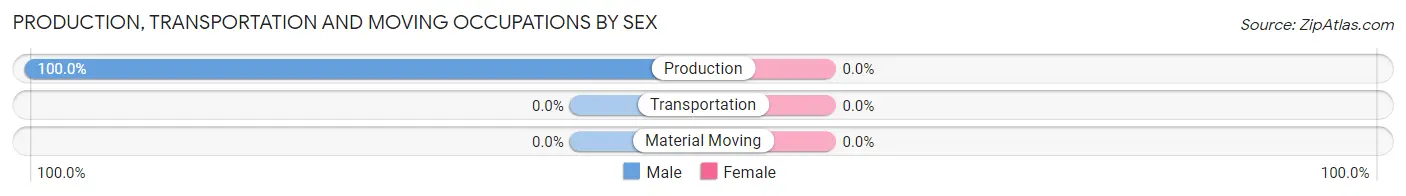
| Occupation | Male | Female |
| Production | 22 (100.0%) | 0 (0.0%) |
| Transportation | 0 (0.0%) | 0 (0.0%) |
| Material Moving | 0 (0.0%) | 0 (0.0%) |
| Total (Category) | 22 (100.0%) | 0 (0.0%) |
| Total (Overall) | 306 (37.1%) | 519 (62.9%) |
Employment Industries by Sex in Desert Hills
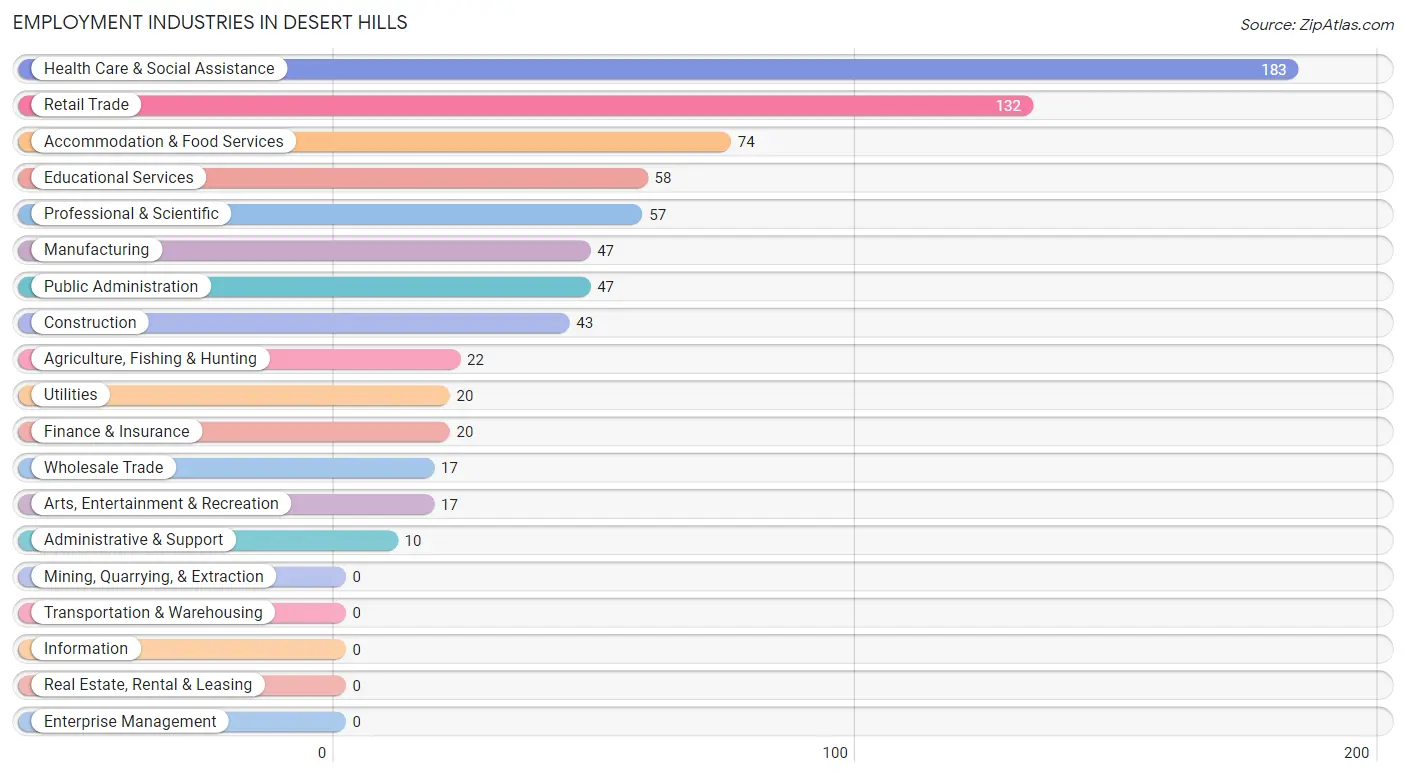
Employment Industries in Desert Hills
The major employment industries in Desert Hills include Health Care & Social Assistance (183 | 22.2%), Retail Trade (132 | 16.0%), Accommodation & Food Services (74 | 9.0%), Educational Services (58 | 7.0%), and Professional & Scientific (57 | 6.9%).
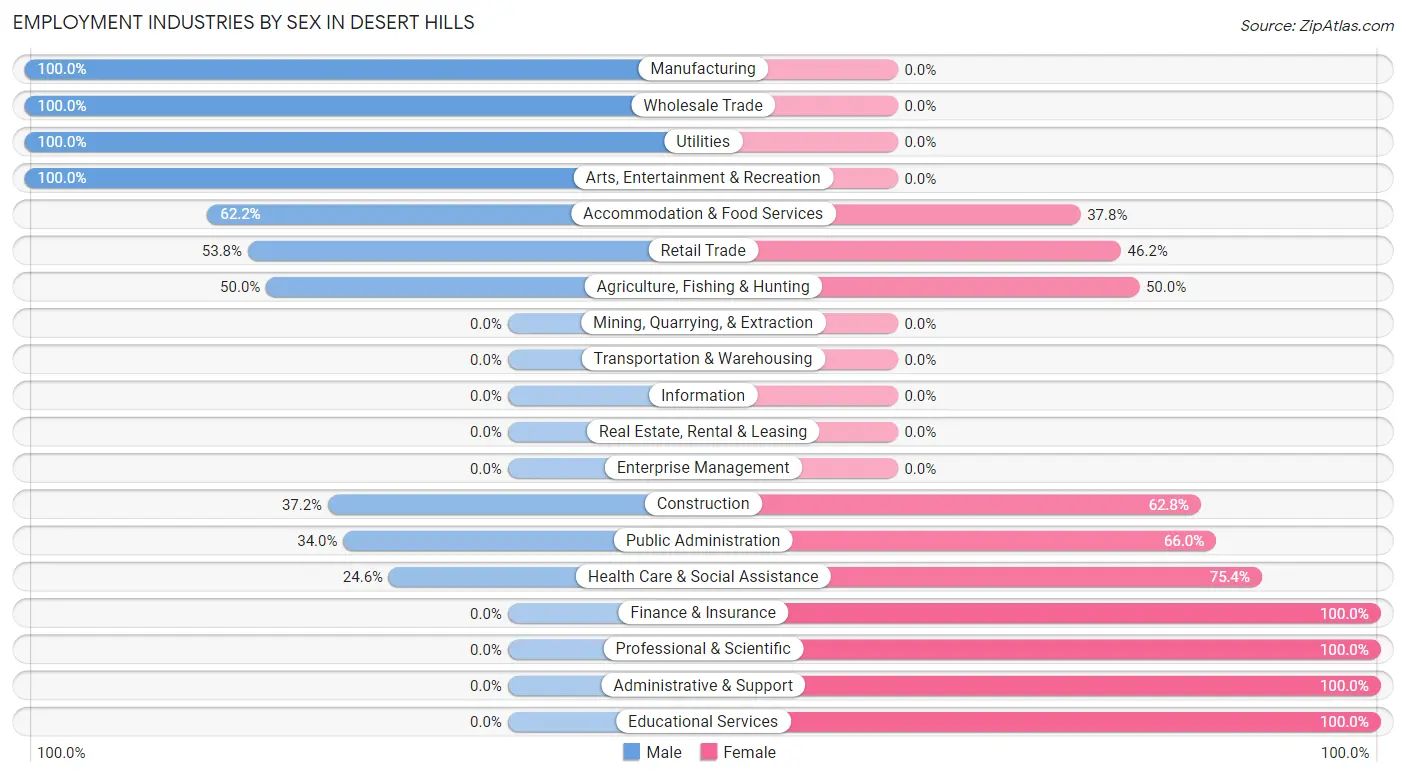
Employment Industries by Sex in Desert Hills
The Desert Hills industries that see more men than women are Manufacturing (100.0%), Wholesale Trade (100.0%), and Utilities (100.0%), whereas the industries that tend to have a higher number of women are Finance & Insurance (100.0%), Professional & Scientific (100.0%), and Administrative & Support (100.0%).
| Industry | Male | Female |
| Agriculture, Fishing & Hunting | 11 (50.0%) | 11 (50.0%) |
| Mining, Quarrying, & Extraction | 0 (0.0%) | 0 (0.0%) |
| Construction | 16 (37.2%) | 27 (62.8%) |
| Manufacturing | 47 (100.0%) | 0 (0.0%) |
| Wholesale Trade | 17 (100.0%) | 0 (0.0%) |
| Retail Trade | 71 (53.8%) | 61 (46.2%) |
| Transportation & Warehousing | 0 (0.0%) | 0 (0.0%) |
| Utilities | 20 (100.0%) | 0 (0.0%) |
| Information | 0 (0.0%) | 0 (0.0%) |
| Finance & Insurance | 0 (0.0%) | 20 (100.0%) |
| Real Estate, Rental & Leasing | 0 (0.0%) | 0 (0.0%) |
| Professional & Scientific | 0 (0.0%) | 57 (100.0%) |
| Enterprise Management | 0 (0.0%) | 0 (0.0%) |
| Administrative & Support | 0 (0.0%) | 10 (100.0%) |
| Educational Services | 0 (0.0%) | 58 (100.0%) |
| Health Care & Social Assistance | 45 (24.6%) | 138 (75.4%) |
| Arts, Entertainment & Recreation | 17 (100.0%) | 0 (0.0%) |
| Accommodation & Food Services | 46 (62.2%) | 28 (37.8%) |
| Public Administration | 16 (34.0%) | 31 (66.0%) |
| Total | 306 (37.1%) | 519 (62.9%) |
Education in Desert Hills
School Enrollment in Desert Hills
The most common levels of schooling among the 336 students in Desert Hills are elementary school (153 | 45.5%), high school (47 | 14.0%), and middle school (44 | 13.1%).
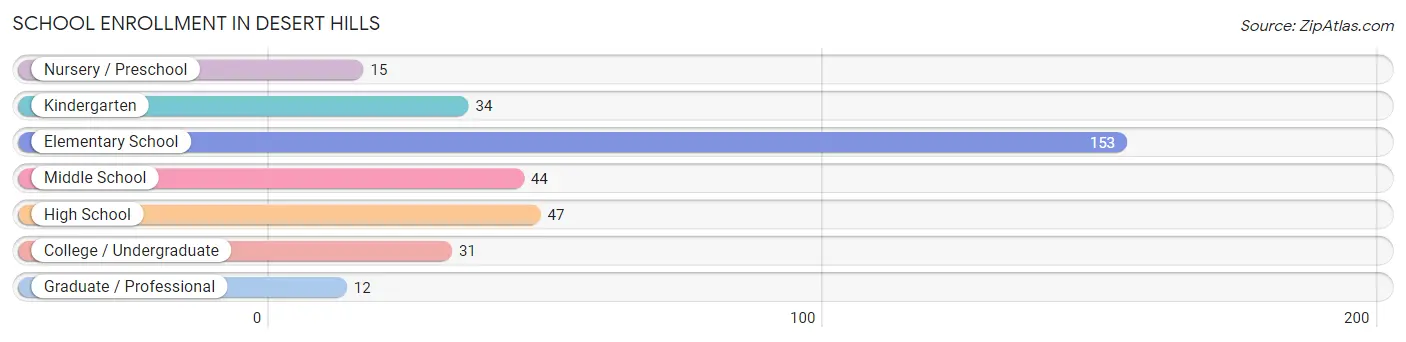
| School Level | # Students | % Students |
| Nursery / Preschool | 15 | 4.5% |
| Kindergarten | 34 | 10.1% |
| Elementary School | 153 | 45.5% |
| Middle School | 44 | 13.1% |
| High School | 47 | 14.0% |
| College / Undergraduate | 31 | 9.2% |
| Graduate / Professional | 12 | 3.6% |
| Total | 336 | 100.0% |
School Enrollment by Age by Funding Source in Desert Hills
Out of a total of 336 students who are enrolled in schools in Desert Hills, 63 (18.8%) attend a private institution, while the remaining 273 (81.2%) are enrolled in public schools. The age group of 3 to 4 year olds has the highest likelihood of being enrolled in private schools, with 15 (100.0% in the age bracket) enrolled. Conversely, the age group of 10 to 14 year olds has the lowest likelihood of being enrolled in a private school, with 76 (100.0% in the age bracket) attending a public institution.
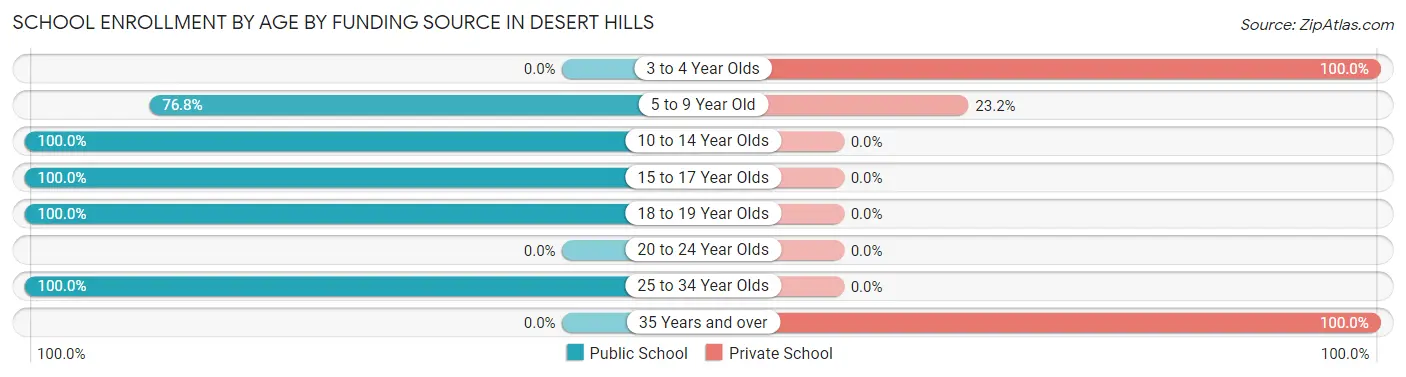
| Age Bracket | Public School | Private School |
| 3 to 4 Year Olds | 0 (0.0%) | 15 (100.0%) |
| 5 to 9 Year Old | 119 (76.8%) | 36 (23.2%) |
| 10 to 14 Year Olds | 76 (100.0%) | 0 (0.0%) |
| 15 to 17 Year Olds | 28 (100.0%) | 0 (0.0%) |
| 18 to 19 Year Olds | 19 (100.0%) | 0 (0.0%) |
| 20 to 24 Year Olds | 0 (0.0%) | 0 (0.0%) |
| 25 to 34 Year Olds | 31 (100.0%) | 0 (0.0%) |
| 35 Years and over | 0 (0.0%) | 12 (100.0%) |
| Total | 273 (81.3%) | 63 (18.8%) |
Educational Attainment by Field of Study in Desert Hills
Business (164 | 26.5%), education (129 | 20.9%), psychology (59 | 9.6%), science & technology (52 | 8.4%), and bio, nature & agricultural (49 | 7.9%) are the most common fields of study among 618 individuals in Desert Hills who have obtained a bachelor's degree or higher.
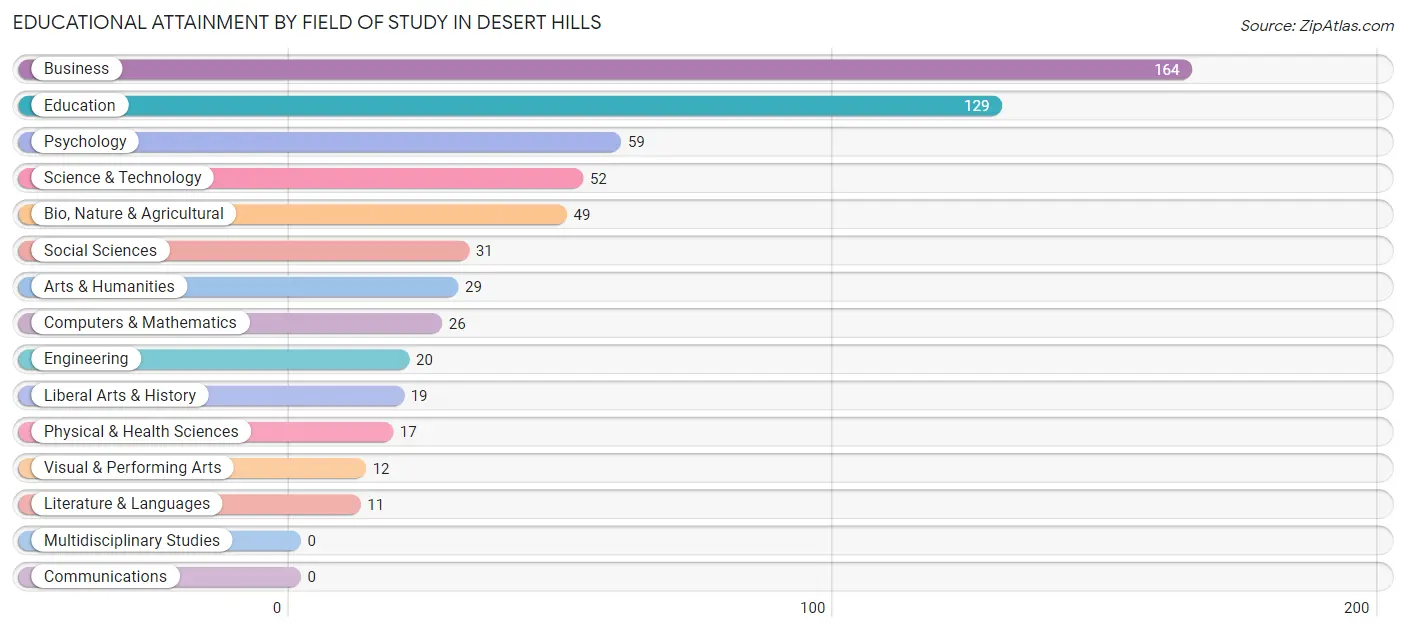
| Field of Study | # Graduates | % Graduates |
| Computers & Mathematics | 26 | 4.2% |
| Bio, Nature & Agricultural | 49 | 7.9% |
| Physical & Health Sciences | 17 | 2.8% |
| Psychology | 59 | 9.6% |
| Social Sciences | 31 | 5.0% |
| Engineering | 20 | 3.2% |
| Multidisciplinary Studies | 0 | 0.0% |
| Science & Technology | 52 | 8.4% |
| Business | 164 | 26.5% |
| Education | 129 | 20.9% |
| Literature & Languages | 11 | 1.8% |
| Liberal Arts & History | 19 | 3.1% |
| Visual & Performing Arts | 12 | 1.9% |
| Communications | 0 | 0.0% |
| Arts & Humanities | 29 | 4.7% |
| Total | 618 | 100.0% |
Transportation & Commute in Desert Hills
Vehicle Availability by Sex in Desert Hills
The most prevalent vehicle ownership categories in Desert Hills are males with 2 vehicles (179, accounting for 58.5%) and females with 2 vehicles (276, making up 34.5%).
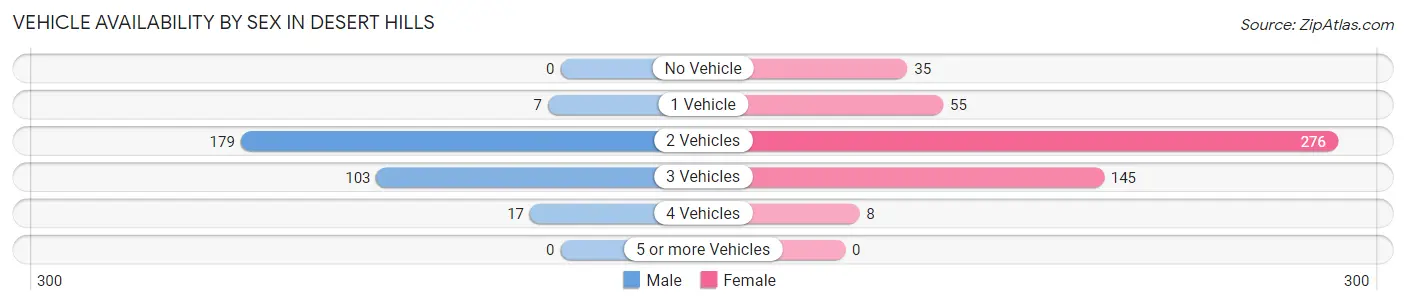
| Vehicles Available | Male | Female |
| No Vehicle | 0 (0.0%) | 35 (6.7%) |
| 1 Vehicle | 7 (2.3%) | 55 (10.6%) |
| 2 Vehicles | 179 (58.5%) | 276 (53.2%) |
| 3 Vehicles | 103 (33.7%) | 145 (27.9%) |
| 4 Vehicles | 17 (5.6%) | 8 (1.5%) |
| 5 or more Vehicles | 0 (0.0%) | 0 (0.0%) |
| Total | 306 (100.0%) | 519 (100.0%) |
Commute Time in Desert Hills
The most frequently occuring commute durations in Desert Hills are 10 to 14 minutes (225 commuters, 34.1%), 5 to 9 minutes (132 commuters, 20.0%), and less than 5 minutes (113 commuters, 17.1%).
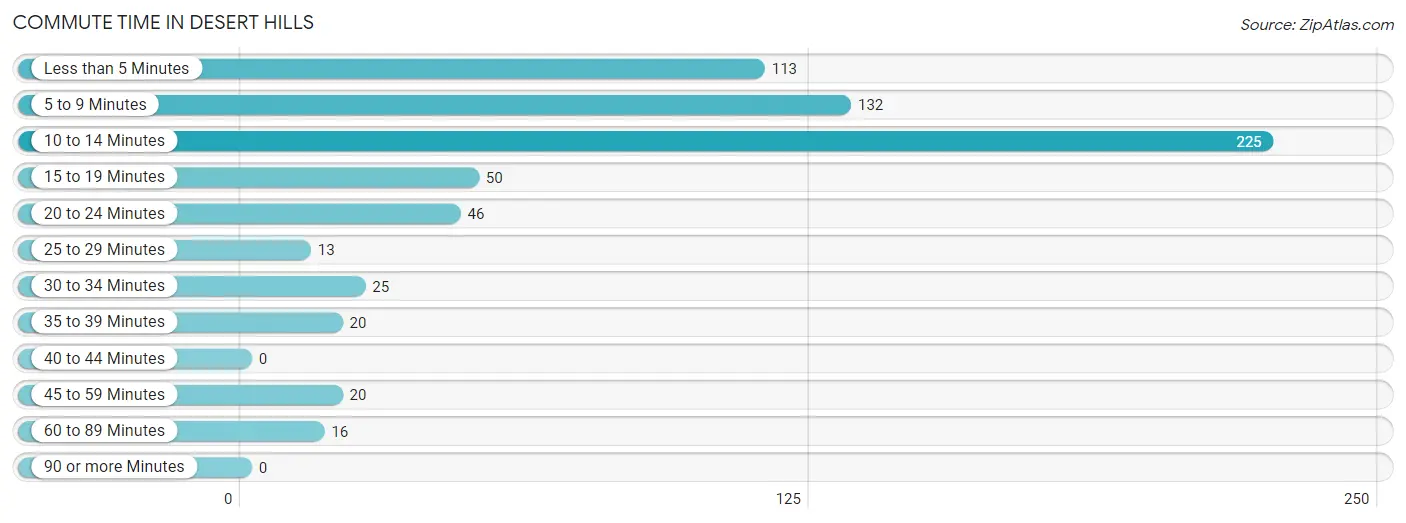
| Commute Time | # Commuters | % Commuters |
| Less than 5 Minutes | 113 | 17.1% |
| 5 to 9 Minutes | 132 | 20.0% |
| 10 to 14 Minutes | 225 | 34.1% |
| 15 to 19 Minutes | 50 | 7.6% |
| 20 to 24 Minutes | 46 | 7.0% |
| 25 to 29 Minutes | 13 | 2.0% |
| 30 to 34 Minutes | 25 | 3.8% |
| 35 to 39 Minutes | 20 | 3.0% |
| 40 to 44 Minutes | 0 | 0.0% |
| 45 to 59 Minutes | 20 | 3.0% |
| 60 to 89 Minutes | 16 | 2.4% |
| 90 or more Minutes | 0 | 0.0% |
Commute Time by Sex in Desert Hills
The most common commute times in Desert Hills are 10 to 14 minutes (65 commuters, 30.8%) for males and 10 to 14 minutes (160 commuters, 35.6%) for females.
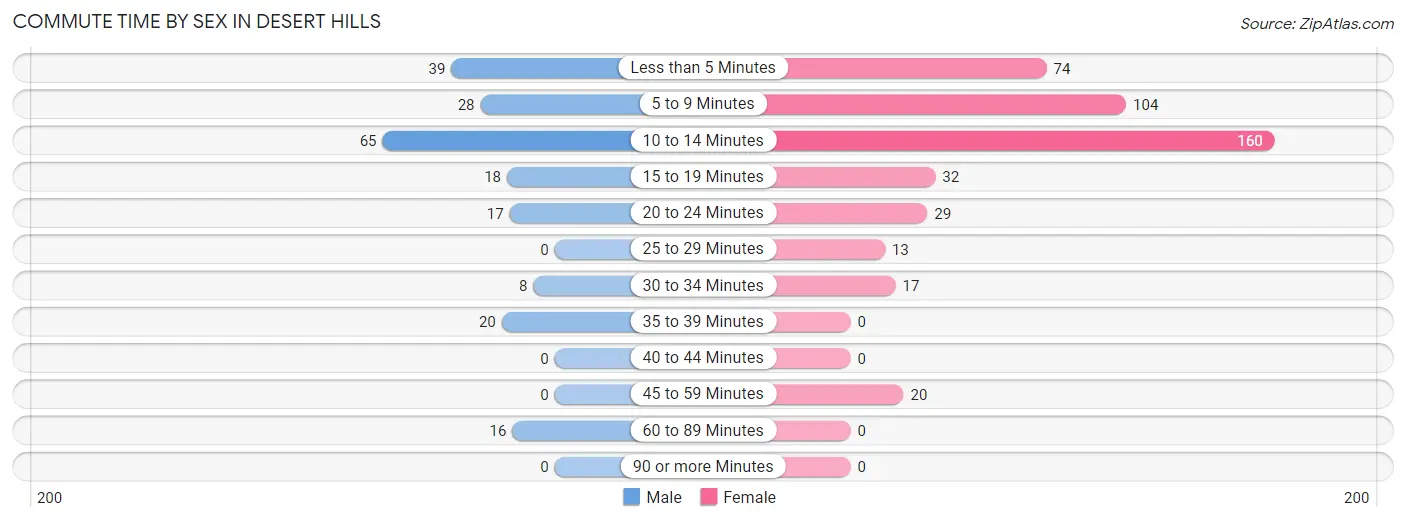
| Commute Time | Male | Female |
| Less than 5 Minutes | 39 (18.5%) | 74 (16.5%) |
| 5 to 9 Minutes | 28 (13.3%) | 104 (23.2%) |
| 10 to 14 Minutes | 65 (30.8%) | 160 (35.6%) |
| 15 to 19 Minutes | 18 (8.5%) | 32 (7.1%) |
| 20 to 24 Minutes | 17 (8.1%) | 29 (6.5%) |
| 25 to 29 Minutes | 0 (0.0%) | 13 (2.9%) |
| 30 to 34 Minutes | 8 (3.8%) | 17 (3.8%) |
| 35 to 39 Minutes | 20 (9.5%) | 0 (0.0%) |
| 40 to 44 Minutes | 0 (0.0%) | 0 (0.0%) |
| 45 to 59 Minutes | 0 (0.0%) | 20 (4.4%) |
| 60 to 89 Minutes | 16 (7.6%) | 0 (0.0%) |
| 90 or more Minutes | 0 (0.0%) | 0 (0.0%) |
Time of Departure to Work by Sex in Desert Hills
The most frequent times of departure to work in Desert Hills are 7:30 AM to 7:59 AM (81, 38.4%) for males and 7:30 AM to 7:59 AM (146, 32.5%) for females.
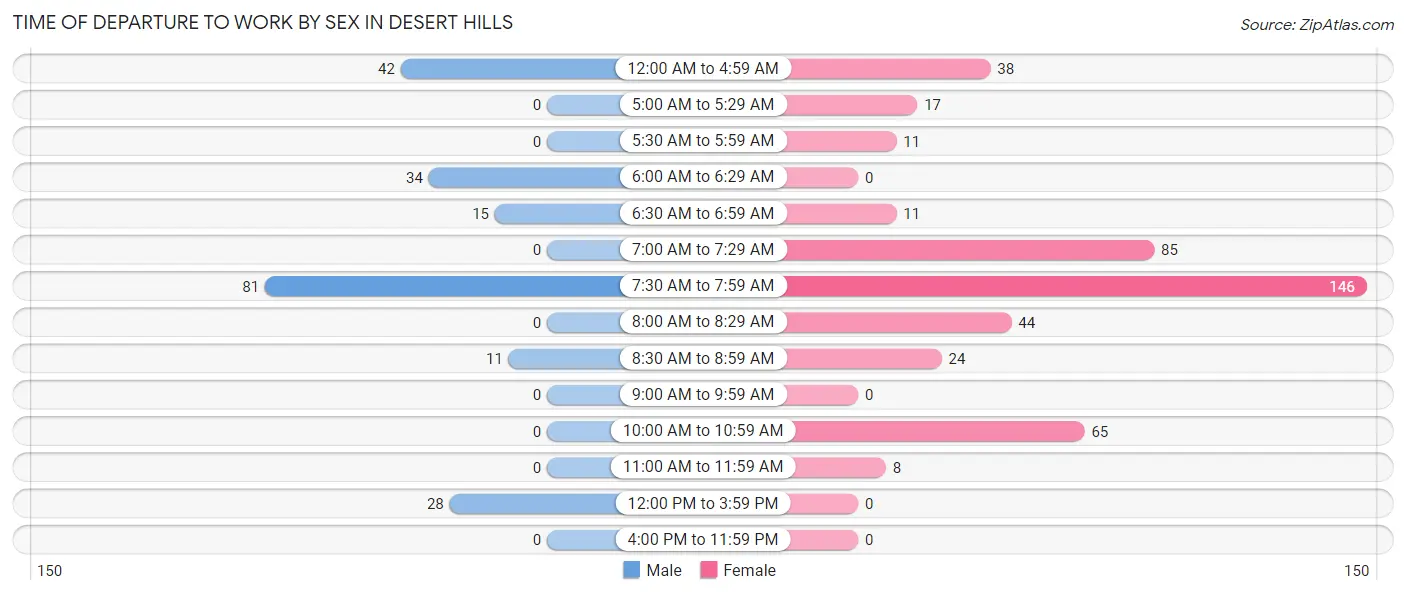
| Time of Departure | Male | Female |
| 12:00 AM to 4:59 AM | 42 (19.9%) | 38 (8.5%) |
| 5:00 AM to 5:29 AM | 0 (0.0%) | 17 (3.8%) |
| 5:30 AM to 5:59 AM | 0 (0.0%) | 11 (2.5%) |
| 6:00 AM to 6:29 AM | 34 (16.1%) | 0 (0.0%) |
| 6:30 AM to 6:59 AM | 15 (7.1%) | 11 (2.5%) |
| 7:00 AM to 7:29 AM | 0 (0.0%) | 85 (18.9%) |
| 7:30 AM to 7:59 AM | 81 (38.4%) | 146 (32.5%) |
| 8:00 AM to 8:29 AM | 0 (0.0%) | 44 (9.8%) |
| 8:30 AM to 8:59 AM | 11 (5.2%) | 24 (5.3%) |
| 9:00 AM to 9:59 AM | 0 (0.0%) | 0 (0.0%) |
| 10:00 AM to 10:59 AM | 0 (0.0%) | 65 (14.5%) |
| 11:00 AM to 11:59 AM | 0 (0.0%) | 8 (1.8%) |
| 12:00 PM to 3:59 PM | 28 (13.3%) | 0 (0.0%) |
| 4:00 PM to 11:59 PM | 0 (0.0%) | 0 (0.0%) |
| Total | 211 (100.0%) | 449 (100.0%) |
Housing Occupancy in Desert Hills
Occupancy by Ownership in Desert Hills
Of the total 1,472 dwellings in Desert Hills, owner-occupied units account for 1,211 (82.3%), while renter-occupied units make up 261 (17.7%).
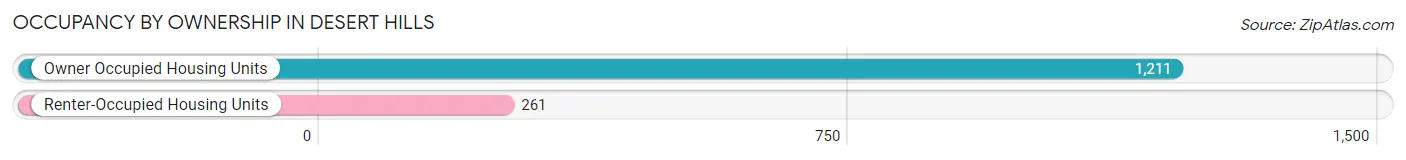
| Occupancy | # Housing Units | % Housing Units |
| Owner Occupied Housing Units | 1,211 | 82.3% |
| Renter-Occupied Housing Units | 261 | 17.7% |
| Total Occupied Housing Units | 1,472 | 100.0% |
Occupancy by Household Size in Desert Hills
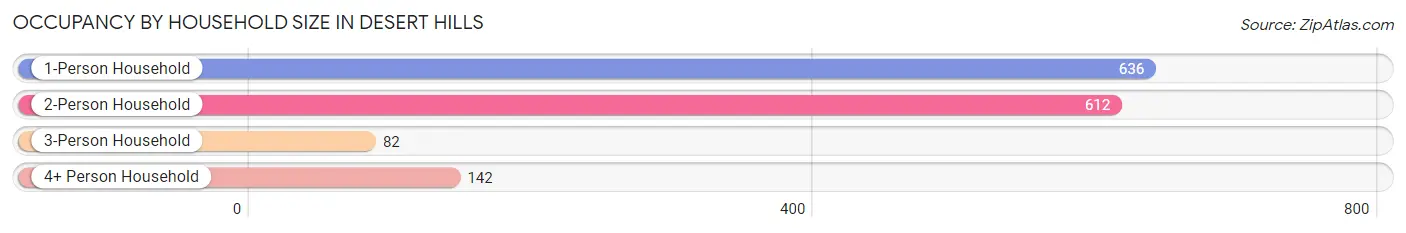
| Household Size | # Housing Units | % Housing Units |
| 1-Person Household | 636 | 43.2% |
| 2-Person Household | 612 | 41.6% |
| 3-Person Household | 82 | 5.6% |
| 4+ Person Household | 142 | 9.7% |
| Total Housing Units | 1,472 | 100.0% |
Occupancy by Ownership by Household Size in Desert Hills
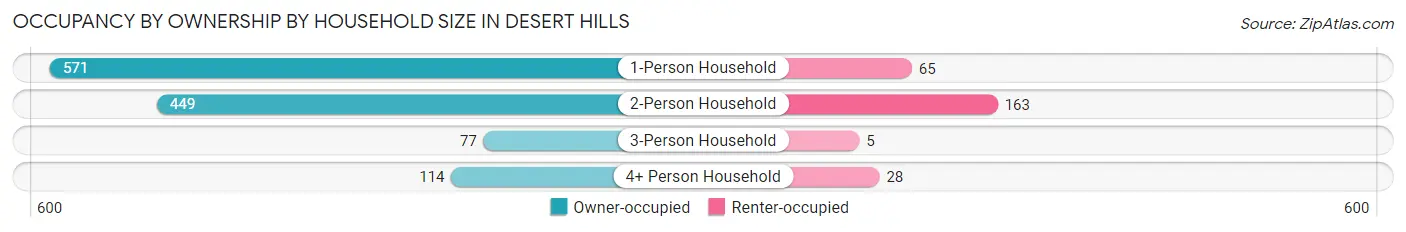
| Household Size | Owner-occupied | Renter-occupied |
| 1-Person Household | 571 (89.8%) | 65 (10.2%) |
| 2-Person Household | 449 (73.4%) | 163 (26.6%) |
| 3-Person Household | 77 (93.9%) | 5 (6.1%) |
| 4+ Person Household | 114 (80.3%) | 28 (19.7%) |
| Total Housing Units | 1,211 (82.3%) | 261 (17.7%) |
Occupancy by Educational Attainment in Desert Hills
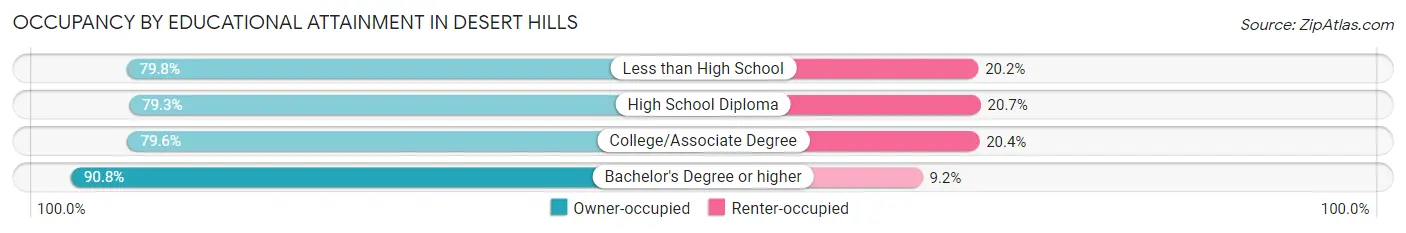
| Household Size | Owner-occupied | Renter-occupied |
| Less than High School | 138 (79.8%) | 35 (20.2%) |
| High School Diploma | 268 (79.3%) | 70 (20.7%) |
| College/Associate Degree | 479 (79.6%) | 123 (20.4%) |
| Bachelor's Degree or higher | 326 (90.8%) | 33 (9.2%) |
Occupancy by Age of Householder in Desert Hills
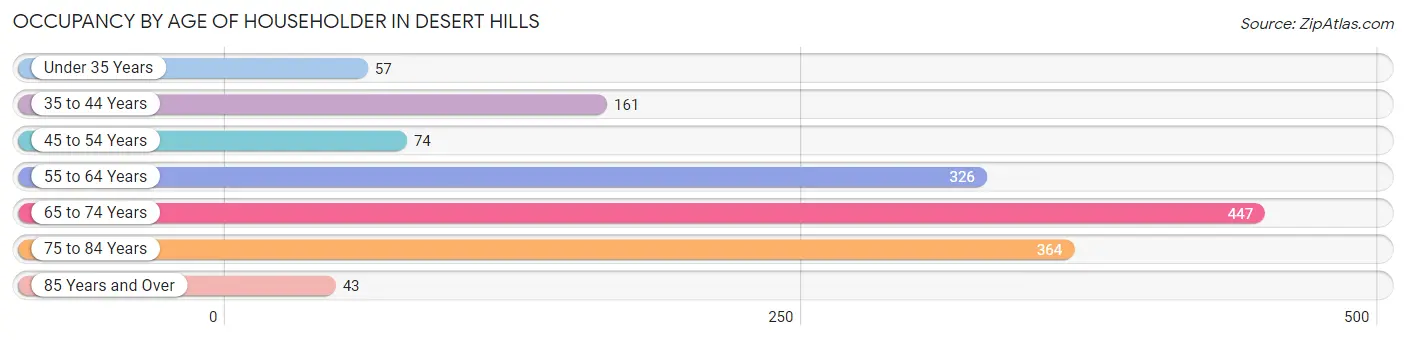
| Age Bracket | # Households | % Households |
| Under 35 Years | 57 | 3.9% |
| 35 to 44 Years | 161 | 10.9% |
| 45 to 54 Years | 74 | 5.0% |
| 55 to 64 Years | 326 | 22.2% |
| 65 to 74 Years | 447 | 30.4% |
| 75 to 84 Years | 364 | 24.7% |
| 85 Years and Over | 43 | 2.9% |
| Total | 1,472 | 100.0% |
Housing Finances in Desert Hills
Median Income by Occupancy in Desert Hills
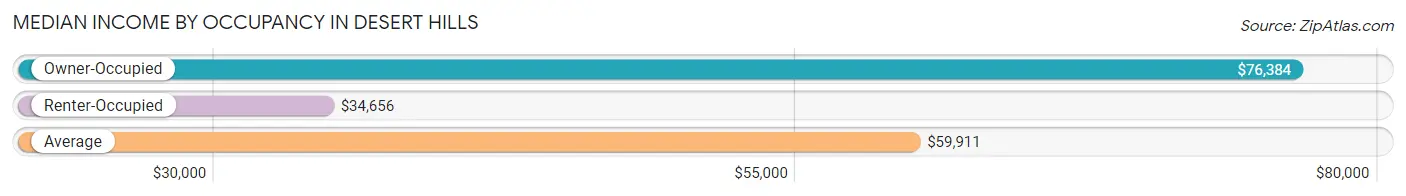
| Occupancy Type | # Households | Median Income |
| Owner-Occupied | 1,211 (82.3%) | $76,384 |
| Renter-Occupied | 261 (17.7%) | $34,656 |
| Average | 1,472 (100.0%) | $59,911 |
Occupancy by Householder Income Bracket in Desert Hills
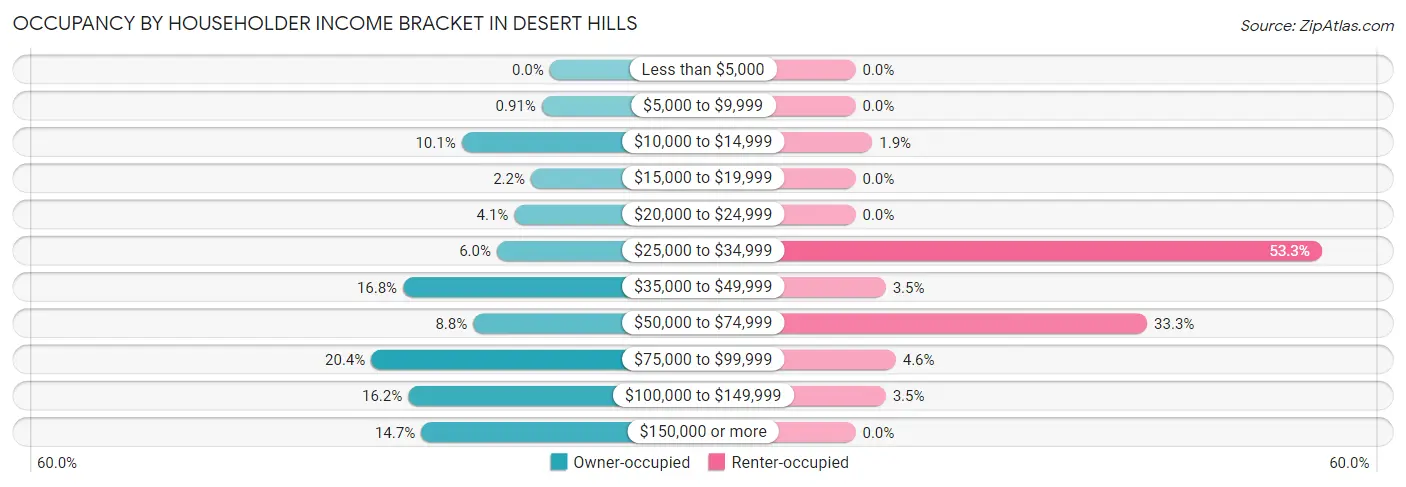
| Income Bracket | Owner-occupied | Renter-occupied |
| Less than $5,000 | 0 (0.0%) | 0 (0.0%) |
| $5,000 to $9,999 | 11 (0.9%) | 0 (0.0%) |
| $10,000 to $14,999 | 122 (10.1%) | 5 (1.9%) |
| $15,000 to $19,999 | 26 (2.1%) | 0 (0.0%) |
| $20,000 to $24,999 | 49 (4.1%) | 0 (0.0%) |
| $25,000 to $34,999 | 73 (6.0%) | 139 (53.3%) |
| $35,000 to $49,999 | 203 (16.8%) | 9 (3.5%) |
| $50,000 to $74,999 | 106 (8.7%) | 87 (33.3%) |
| $75,000 to $99,999 | 247 (20.4%) | 12 (4.6%) |
| $100,000 to $149,999 | 196 (16.2%) | 9 (3.5%) |
| $150,000 or more | 178 (14.7%) | 0 (0.0%) |
| Total | 1,211 (100.0%) | 261 (100.0%) |
Monthly Housing Cost Tiers in Desert Hills
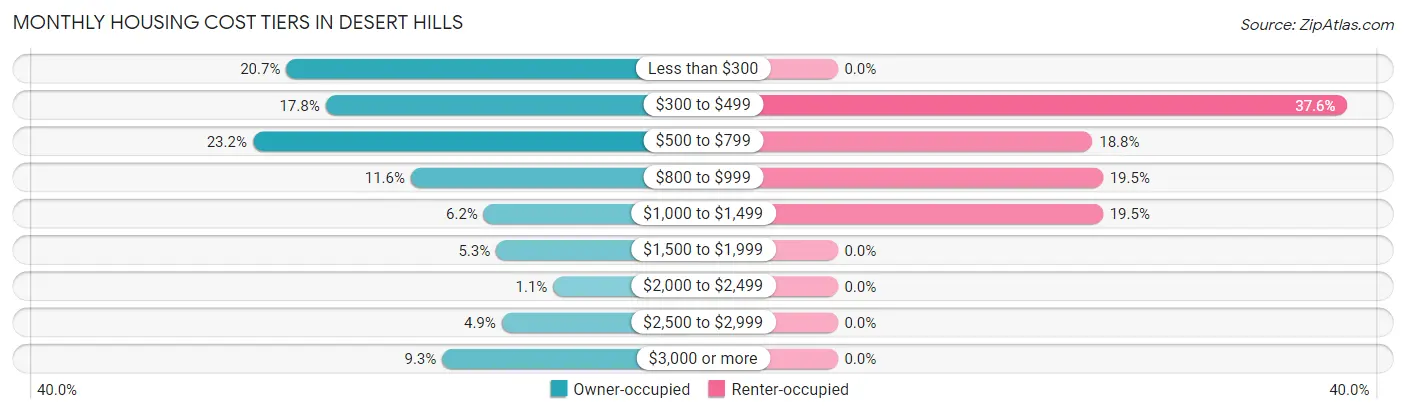
| Monthly Cost | Owner-occupied | Renter-occupied |
| Less than $300 | 251 (20.7%) | 0 (0.0%) |
| $300 to $499 | 216 (17.8%) | 98 (37.6%) |
| $500 to $799 | 281 (23.2%) | 49 (18.8%) |
| $800 to $999 | 140 (11.6%) | 51 (19.5%) |
| $1,000 to $1,499 | 75 (6.2%) | 51 (19.5%) |
| $1,500 to $1,999 | 64 (5.3%) | 0 (0.0%) |
| $2,000 to $2,499 | 13 (1.1%) | 0 (0.0%) |
| $2,500 to $2,999 | 59 (4.9%) | 0 (0.0%) |
| $3,000 or more | 112 (9.2%) | 0 (0.0%) |
| Total | 1,211 (100.0%) | 261 (100.0%) |
Physical Housing Characteristics in Desert Hills
Housing Structures in Desert Hills
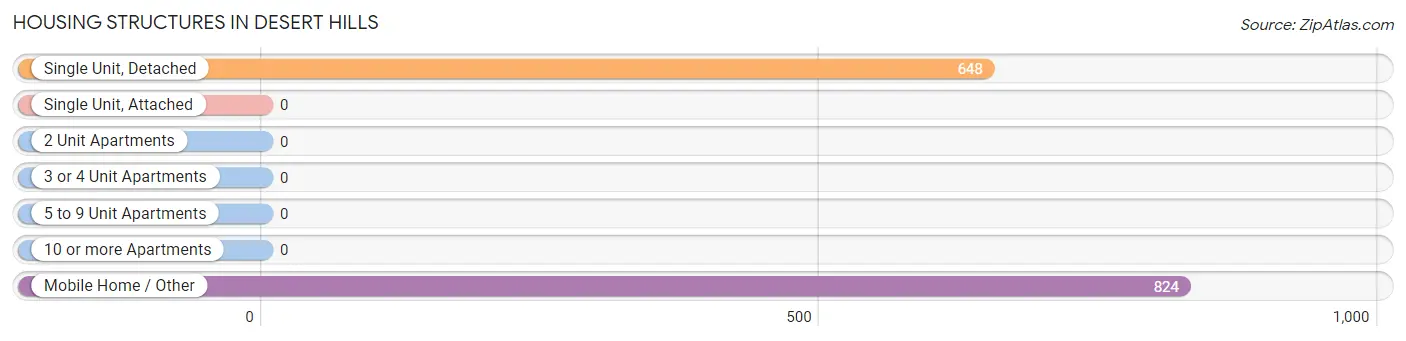
| Structure Type | # Housing Units | % Housing Units |
| Single Unit, Detached | 648 | 44.0% |
| Single Unit, Attached | 0 | 0.0% |
| 2 Unit Apartments | 0 | 0.0% |
| 3 or 4 Unit Apartments | 0 | 0.0% |
| 5 to 9 Unit Apartments | 0 | 0.0% |
| 10 or more Apartments | 0 | 0.0% |
| Mobile Home / Other | 824 | 56.0% |
| Total | 1,472 | 100.0% |
Housing Structures by Occupancy in Desert Hills
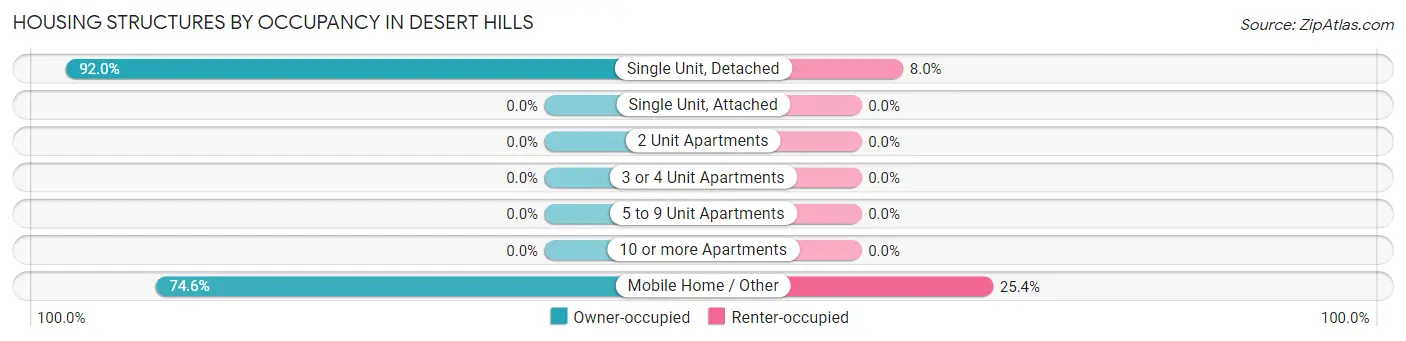
| Structure Type | Owner-occupied | Renter-occupied |
| Single Unit, Detached | 596 (92.0%) | 52 (8.0%) |
| Single Unit, Attached | 0 (0.0%) | 0 (0.0%) |
| 2 Unit Apartments | 0 (0.0%) | 0 (0.0%) |
| 3 or 4 Unit Apartments | 0 (0.0%) | 0 (0.0%) |
| 5 to 9 Unit Apartments | 0 (0.0%) | 0 (0.0%) |
| 10 or more Apartments | 0 (0.0%) | 0 (0.0%) |
| Mobile Home / Other | 615 (74.6%) | 209 (25.4%) |
| Total | 1,211 (82.3%) | 261 (17.7%) |
Housing Structures by Number of Rooms in Desert Hills
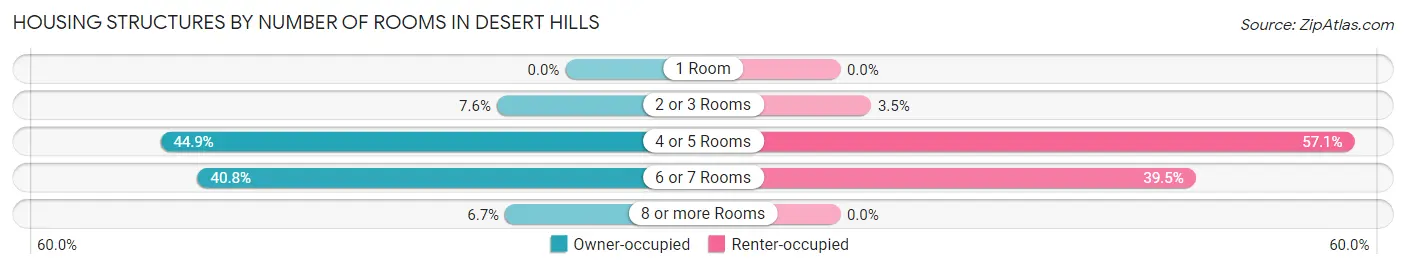
| Number of Rooms | Owner-occupied | Renter-occupied |
| 1 Room | 0 (0.0%) | 0 (0.0%) |
| 2 or 3 Rooms | 92 (7.6%) | 9 (3.5%) |
| 4 or 5 Rooms | 544 (44.9%) | 149 (57.1%) |
| 6 or 7 Rooms | 494 (40.8%) | 103 (39.5%) |
| 8 or more Rooms | 81 (6.7%) | 0 (0.0%) |
| Total | 1,211 (100.0%) | 261 (100.0%) |
Housing Structure by Heating Type in Desert Hills
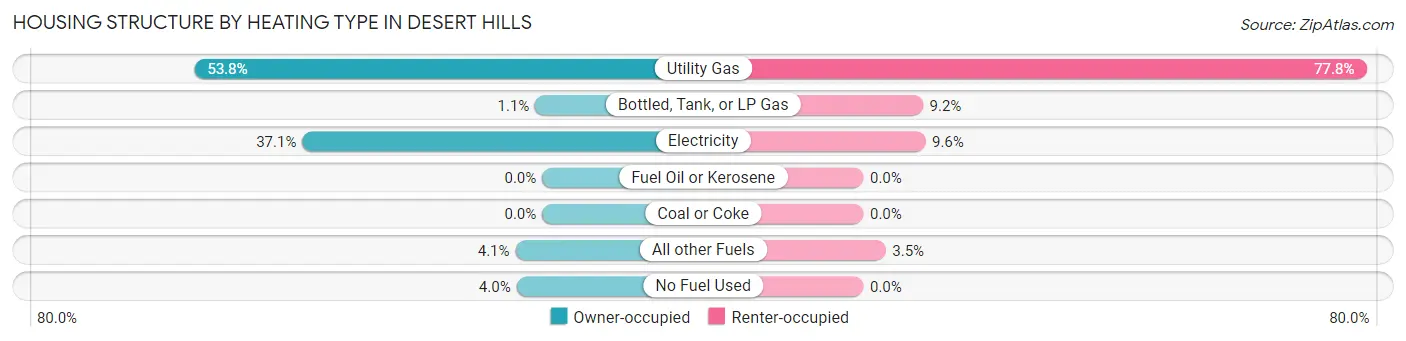
| Heating Type | Owner-occupied | Renter-occupied |
| Utility Gas | 651 (53.8%) | 203 (77.8%) |
| Bottled, Tank, or LP Gas | 13 (1.1%) | 24 (9.2%) |
| Electricity | 449 (37.1%) | 25 (9.6%) |
| Fuel Oil or Kerosene | 0 (0.0%) | 0 (0.0%) |
| Coal or Coke | 0 (0.0%) | 0 (0.0%) |
| All other Fuels | 50 (4.1%) | 9 (3.5%) |
| No Fuel Used | 48 (4.0%) | 0 (0.0%) |
| Total | 1,211 (100.0%) | 261 (100.0%) |
Household Vehicle Usage in Desert Hills
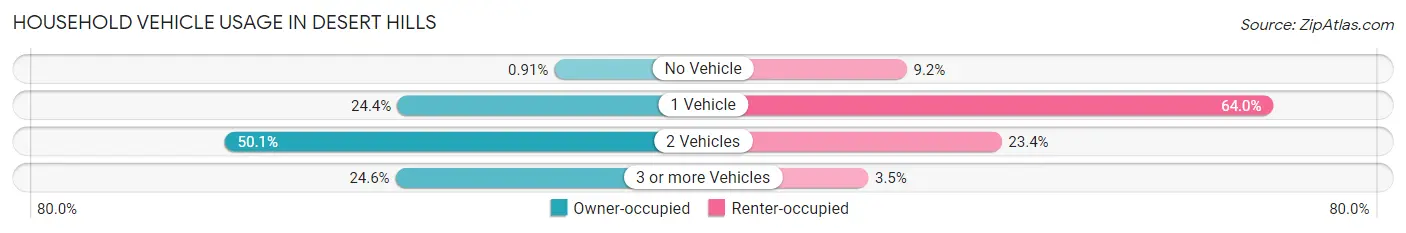
| Vehicles per Household | Owner-occupied | Renter-occupied |
| No Vehicle | 11 (0.9%) | 24 (9.2%) |
| 1 Vehicle | 295 (24.4%) | 167 (64.0%) |
| 2 Vehicles | 607 (50.1%) | 61 (23.4%) |
| 3 or more Vehicles | 298 (24.6%) | 9 (3.5%) |
| Total | 1,211 (100.0%) | 261 (100.0%) |
Real Estate & Mortgages in Desert Hills
Real Estate and Mortgage Overview in Desert Hills
| Characteristic | Without Mortgage | With Mortgage |
| Housing Units | 654 | 557 |
| Median Property Value | $149,400 | $367,000 |
| Median Household Income | $39,537 | $143 |
| Monthly Housing Costs | $329 | $112 |
| Real Estate Taxes | $563 | $27 |
Property Value by Mortgage Status in Desert Hills
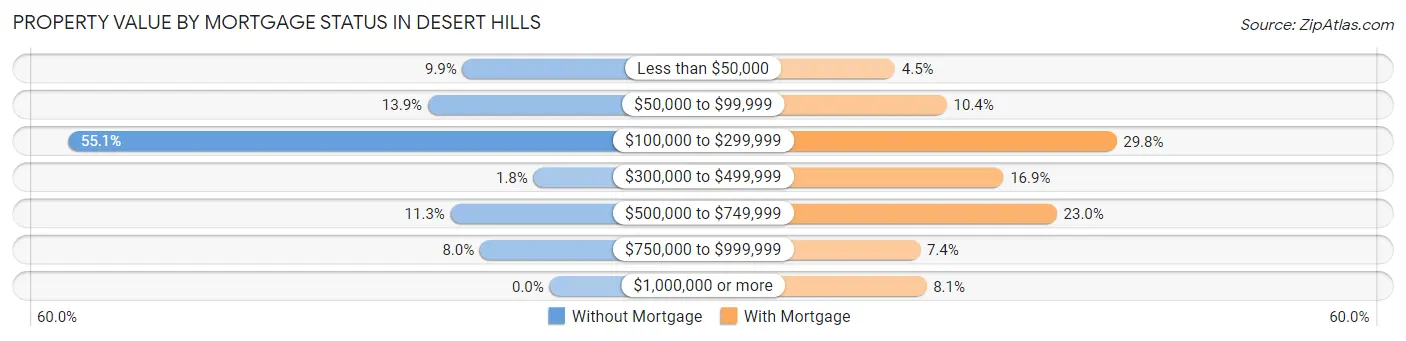
| Property Value | Without Mortgage | With Mortgage |
| Less than $50,000 | 65 (9.9%) | 25 (4.5%) |
| $50,000 to $99,999 | 91 (13.9%) | 58 (10.4%) |
| $100,000 to $299,999 | 360 (55.0%) | 166 (29.8%) |
| $300,000 to $499,999 | 12 (1.8%) | 94 (16.9%) |
| $500,000 to $749,999 | 74 (11.3%) | 128 (23.0%) |
| $750,000 to $999,999 | 52 (8.0%) | 41 (7.4%) |
| $1,000,000 or more | 0 (0.0%) | 45 (8.1%) |
| Total | 654 (100.0%) | 557 (100.0%) |
Household Income by Mortgage Status in Desert Hills
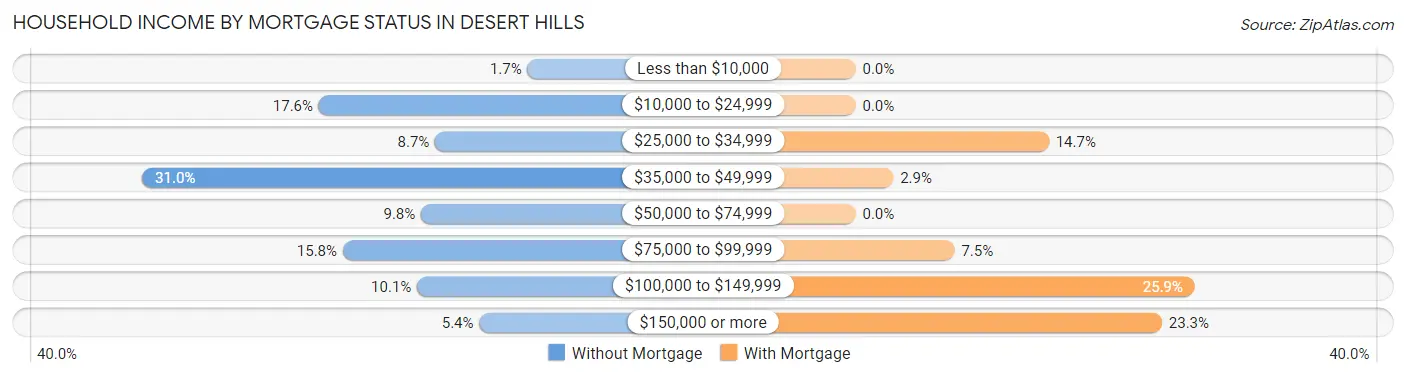
| Household Income | Without Mortgage | With Mortgage |
| Less than $10,000 | 11 (1.7%) | 0 (0.0%) |
| $10,000 to $24,999 | 115 (17.6%) | 0 (0.0%) |
| $25,000 to $34,999 | 57 (8.7%) | 82 (14.7%) |
| $35,000 to $49,999 | 203 (31.0%) | 16 (2.9%) |
| $50,000 to $74,999 | 64 (9.8%) | 0 (0.0%) |
| $75,000 to $99,999 | 103 (15.8%) | 42 (7.5%) |
| $100,000 to $149,999 | 66 (10.1%) | 144 (25.9%) |
| $150,000 or more | 35 (5.3%) | 130 (23.3%) |
| Total | 654 (100.0%) | 557 (100.0%) |
Property Value to Household Income Ratio in Desert Hills
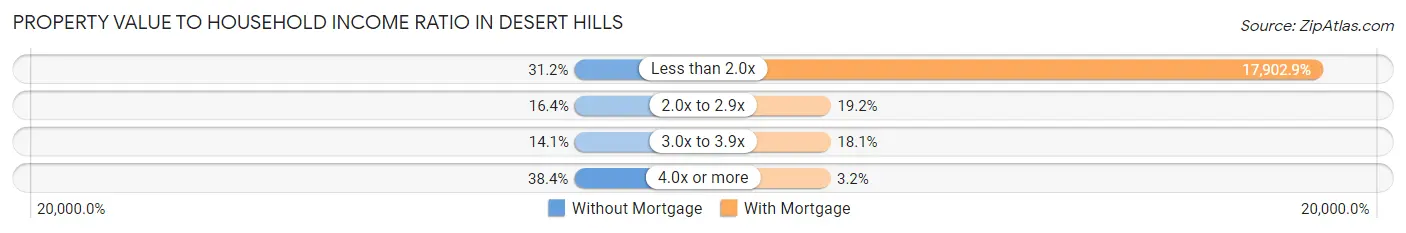
| Value-to-Income Ratio | Without Mortgage | With Mortgage |
| Less than 2.0x | 204 (31.2%) | 99,719 (17,902.9%) |
| 2.0x to 2.9x | 107 (16.4%) | 107 (19.2%) |
| 3.0x to 3.9x | 92 (14.1%) | 101 (18.1%) |
| 4.0x or more | 251 (38.4%) | 18 (3.2%) |
| Total | 654 (100.0%) | 557 (100.0%) |
Real Estate Taxes by Mortgage Status in Desert Hills
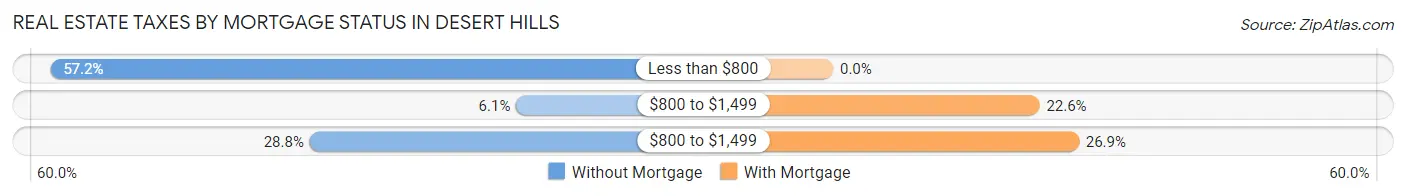
| Property Taxes | Without Mortgage | With Mortgage |
| Less than $800 | 374 (57.2%) | 0 (0.0%) |
| $800 to $1,499 | 40 (6.1%) | 126 (22.6%) |
| $800 to $1,499 | 188 (28.7%) | 150 (26.9%) |
| Total | 654 (100.0%) | 557 (100.0%) |
Health & Disability in Desert Hills
Health Insurance Coverage by Age in Desert Hills
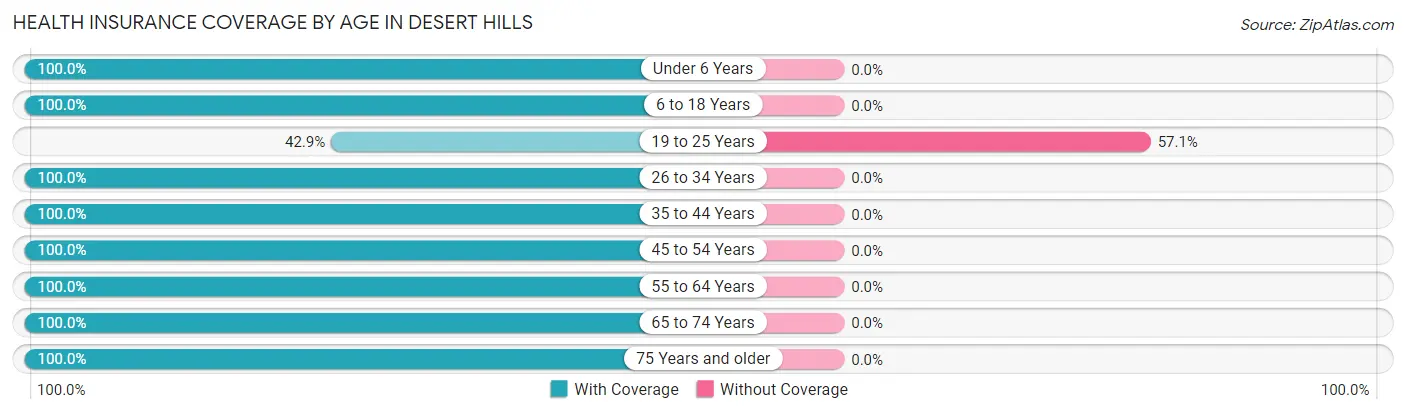
| Age Bracket | With Coverage | Without Coverage |
| Under 6 Years | 34 (100.0%) | 0 (0.0%) |
| 6 to 18 Years | 278 (100.0%) | 0 (0.0%) |
| 19 to 25 Years | 6 (42.9%) | 8 (57.1%) |
| 26 to 34 Years | 154 (100.0%) | 0 (0.0%) |
| 35 to 44 Years | 248 (100.0%) | 0 (0.0%) |
| 45 to 54 Years | 156 (100.0%) | 0 (0.0%) |
| 55 to 64 Years | 523 (100.0%) | 0 (0.0%) |
| 65 to 74 Years | 685 (100.0%) | 0 (0.0%) |
| 75 Years and older | 559 (100.0%) | 0 (0.0%) |
| Total | 2,643 (99.7%) | 8 (0.3%) |
Health Insurance Coverage by Citizenship Status in Desert Hills
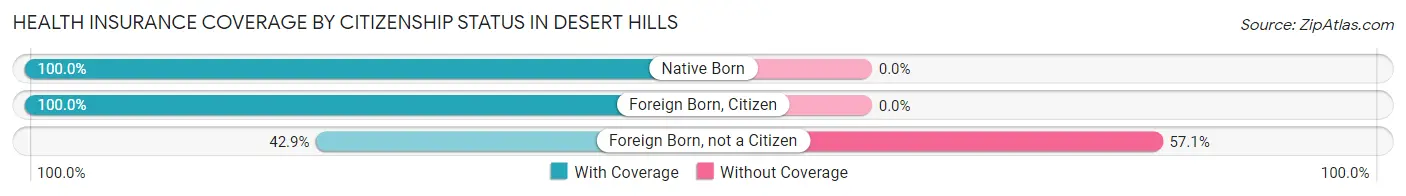
| Citizenship Status | With Coverage | Without Coverage |
| Native Born | 34 (100.0%) | 0 (0.0%) |
| Foreign Born, Citizen | 278 (100.0%) | 0 (0.0%) |
| Foreign Born, not a Citizen | 6 (42.9%) | 8 (57.1%) |
Health Insurance Coverage by Household Income in Desert Hills
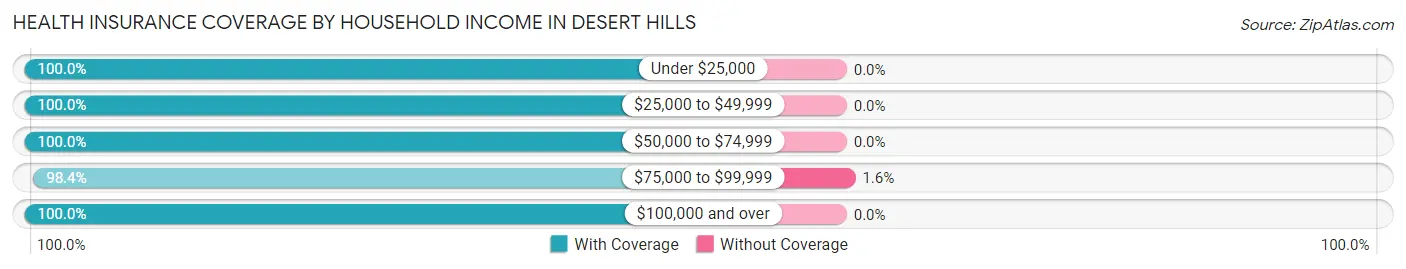
| Household Income | With Coverage | Without Coverage |
| Under $25,000 | 236 (100.0%) | 0 (0.0%) |
| $25,000 to $49,999 | 654 (100.0%) | 0 (0.0%) |
| $50,000 to $74,999 | 410 (100.0%) | 0 (0.0%) |
| $75,000 to $99,999 | 482 (98.4%) | 8 (1.6%) |
| $100,000 and over | 861 (100.0%) | 0 (0.0%) |
Public vs Private Health Insurance Coverage by Age in Desert Hills
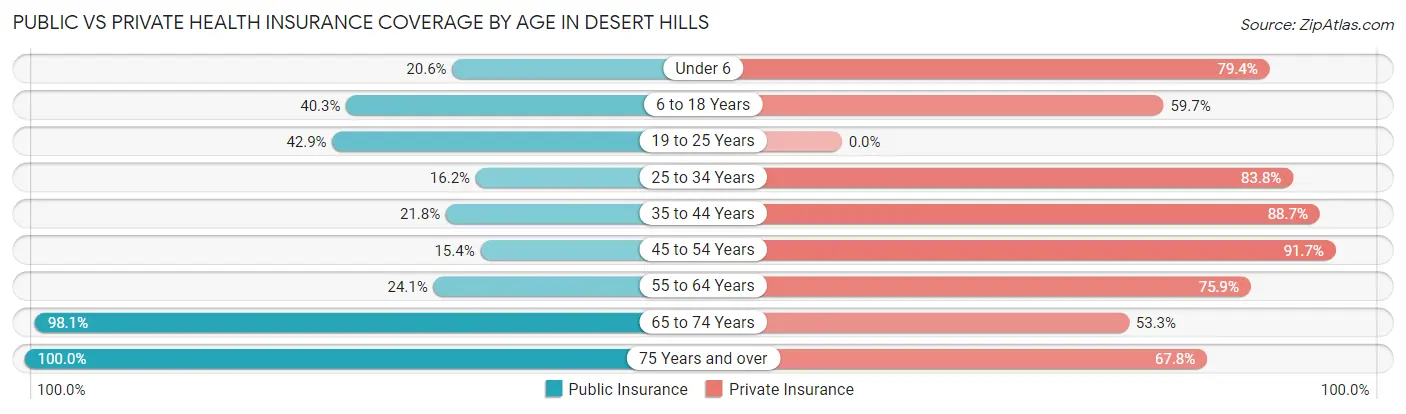
| Age Bracket | Public Insurance | Private Insurance |
| Under 6 | 7 (20.6%) | 27 (79.4%) |
| 6 to 18 Years | 112 (40.3%) | 166 (59.7%) |
| 19 to 25 Years | 6 (42.9%) | 0 (0.0%) |
| 25 to 34 Years | 25 (16.2%) | 129 (83.8%) |
| 35 to 44 Years | 54 (21.8%) | 220 (88.7%) |
| 45 to 54 Years | 24 (15.4%) | 143 (91.7%) |
| 55 to 64 Years | 126 (24.1%) | 397 (75.9%) |
| 65 to 74 Years | 672 (98.1%) | 365 (53.3%) |
| 75 Years and over | 559 (100.0%) | 379 (67.8%) |
| Total | 1,585 (59.8%) | 1,826 (68.9%) |
Disability Status by Sex by Age in Desert Hills
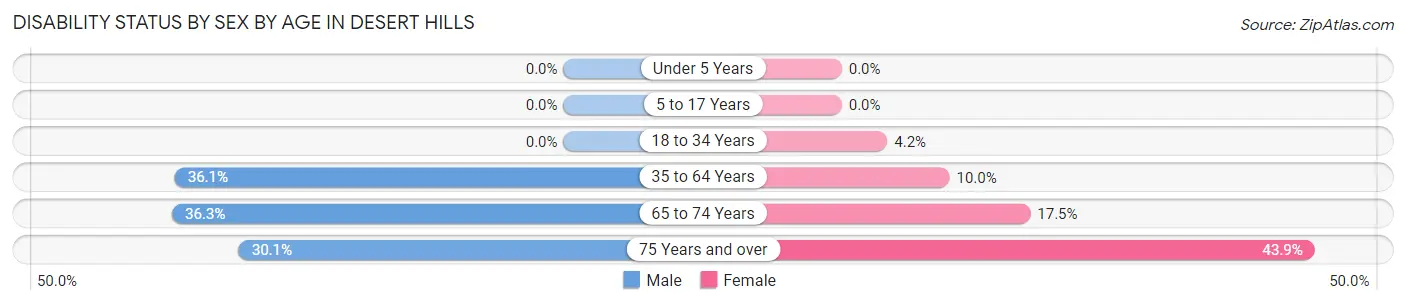
| Age Bracket | Male | Female |
| Under 5 Years | 0 (0.0%) | 0 (0.0%) |
| 5 to 17 Years | 0 (0.0%) | 0 (0.0%) |
| 18 to 34 Years | 0 (0.0%) | 6 (4.2%) |
| 35 to 64 Years | 172 (36.1%) | 45 (10.0%) |
| 65 to 74 Years | 118 (36.3%) | 63 (17.5%) |
| 75 Years and over | 97 (30.1%) | 104 (43.9%) |
Disability Class by Sex by Age in Desert Hills
Disability Class: Hearing Difficulty
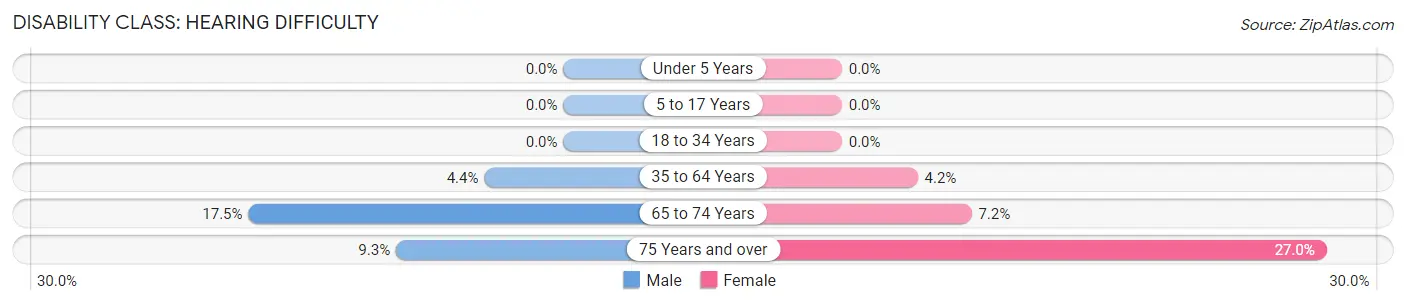
| Age Bracket | Male | Female |
| Under 5 Years | 0 (0.0%) | 0 (0.0%) |
| 5 to 17 Years | 0 (0.0%) | 0 (0.0%) |
| 18 to 34 Years | 0 (0.0%) | 0 (0.0%) |
| 35 to 64 Years | 21 (4.4%) | 19 (4.2%) |
| 65 to 74 Years | 57 (17.5%) | 26 (7.2%) |
| 75 Years and over | 30 (9.3%) | 64 (27.0%) |
Disability Class: Vision Difficulty
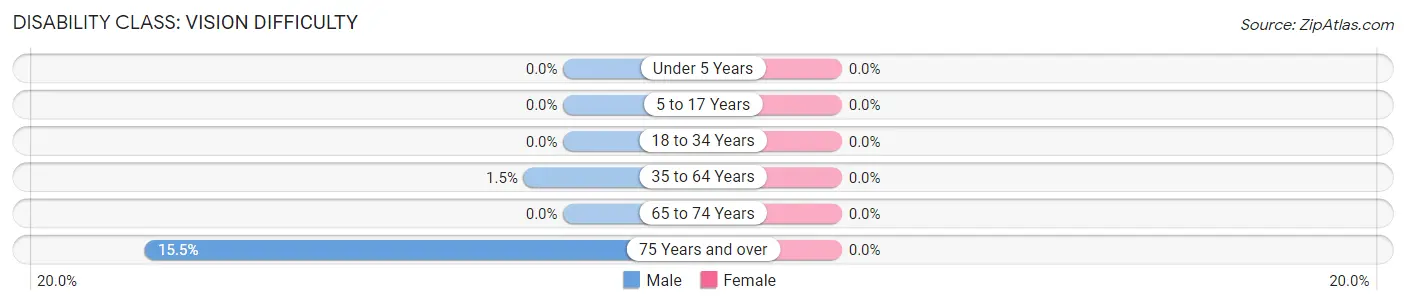
| Age Bracket | Male | Female |
| Under 5 Years | 0 (0.0%) | 0 (0.0%) |
| 5 to 17 Years | 0 (0.0%) | 0 (0.0%) |
| 18 to 34 Years | 0 (0.0%) | 0 (0.0%) |
| 35 to 64 Years | 7 (1.5%) | 0 (0.0%) |
| 65 to 74 Years | 0 (0.0%) | 0 (0.0%) |
| 75 Years and over | 50 (15.5%) | 0 (0.0%) |
Disability Class: Cognitive Difficulty
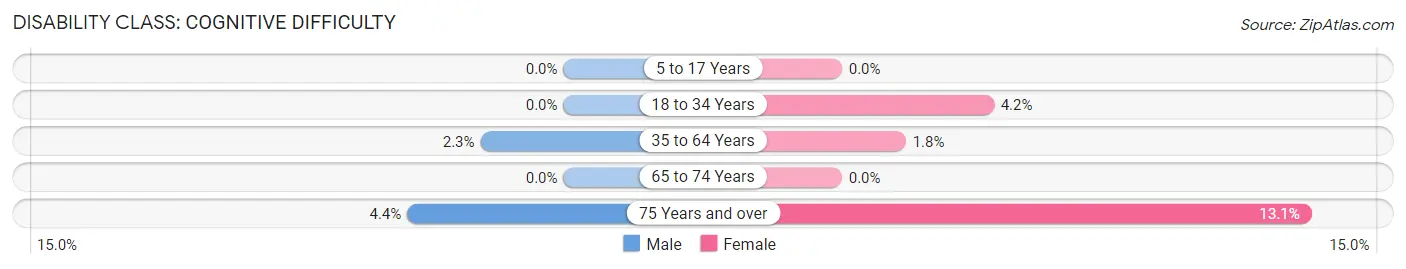
| Age Bracket | Male | Female |
| 5 to 17 Years | 0 (0.0%) | 0 (0.0%) |
| 18 to 34 Years | 0 (0.0%) | 6 (4.2%) |
| 35 to 64 Years | 11 (2.3%) | 8 (1.8%) |
| 65 to 74 Years | 0 (0.0%) | 0 (0.0%) |
| 75 Years and over | 14 (4.3%) | 31 (13.1%) |
Disability Class: Ambulatory Difficulty
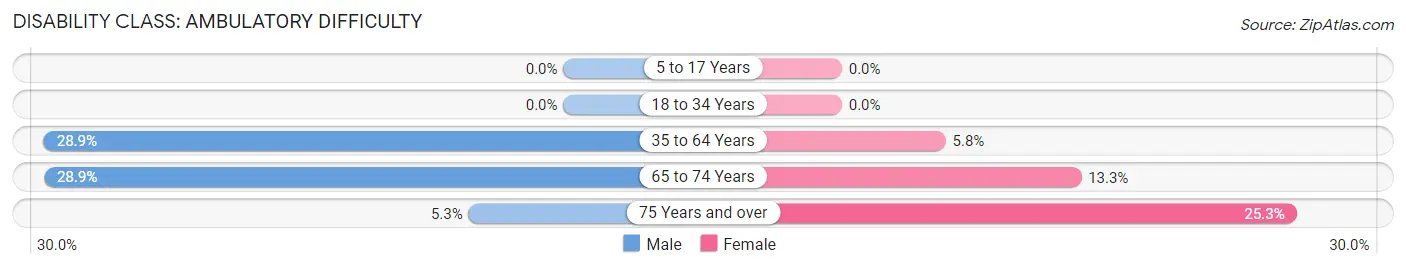
| Age Bracket | Male | Female |
| 5 to 17 Years | 0 (0.0%) | 0 (0.0%) |
| 18 to 34 Years | 0 (0.0%) | 0 (0.0%) |
| 35 to 64 Years | 138 (28.9%) | 26 (5.8%) |
| 65 to 74 Years | 94 (28.9%) | 48 (13.3%) |
| 75 Years and over | 17 (5.3%) | 60 (25.3%) |
Disability Class: Self-Care Difficulty
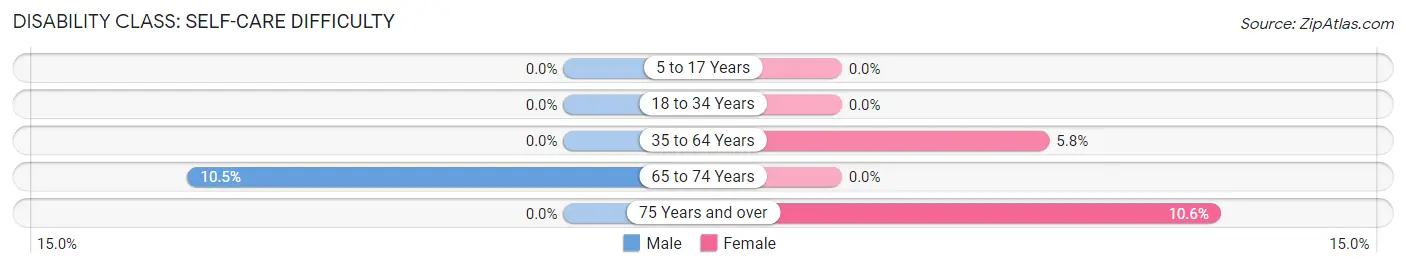
| Age Bracket | Male | Female |
| 5 to 17 Years | 0 (0.0%) | 0 (0.0%) |
| 18 to 34 Years | 0 (0.0%) | 0 (0.0%) |
| 35 to 64 Years | 0 (0.0%) | 26 (5.8%) |
| 65 to 74 Years | 34 (10.5%) | 0 (0.0%) |
| 75 Years and over | 0 (0.0%) | 25 (10.5%) |
Technology Access in Desert Hills
Computing Device Access in Desert Hills
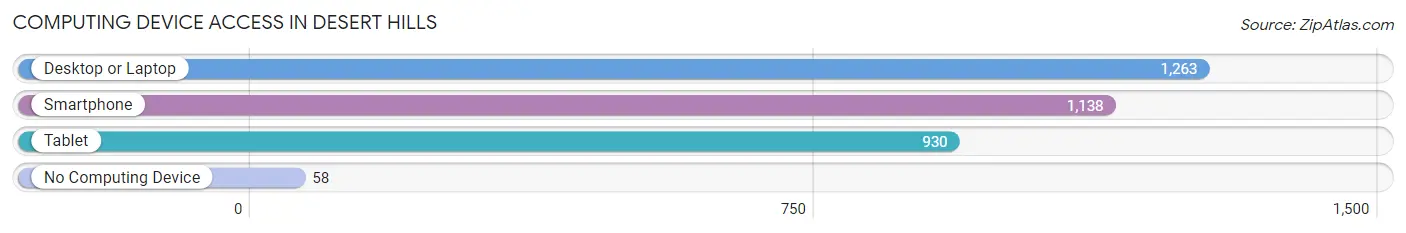
| Device Type | # Households | % Households |
| Desktop or Laptop | 1,263 | 85.8% |
| Smartphone | 1,138 | 77.3% |
| Tablet | 930 | 63.2% |
| No Computing Device | 58 | 3.9% |
| Total | 1,472 | 100.0% |
Internet Access in Desert Hills
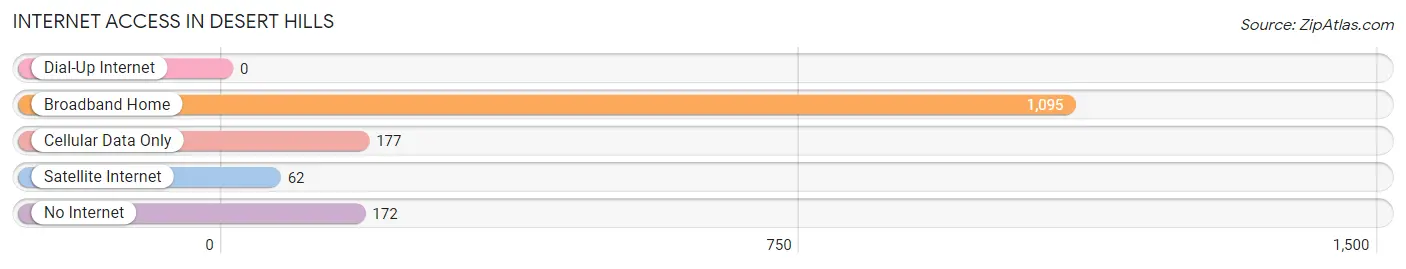
| Internet Type | # Households | % Households |
| Dial-Up Internet | 0 | 0.0% |
| Broadband Home | 1,095 | 74.4% |
| Cellular Data Only | 177 | 12.0% |
| Satellite Internet | 62 | 4.2% |
| No Internet | 172 | 11.7% |
| Total | 1,472 | 100.0% |
Desert Hills Summary
Desert Hills is a census-designated place (CDP) located in Maricopa County, Arizona. It is situated in the Sonoran Desert, approximately 25 miles north of Phoenix. The population of Desert Hills was 8,945 at the 2010 census.
Geography
Desert Hills is located at 33°41'25" North, 112°2'17" West (33.690278, -112.038333). It is situated in the Sonoran Desert, approximately 25 miles north of Phoenix. The terrain is mostly flat, with some rolling hills. The elevation is 1,845 feet above sea level.
Climate
Desert Hills has a hot desert climate, with hot summers and mild winters. The average high temperature in July is 104°F, and the average low temperature in January is 44°F. The average annual precipitation is 8.5 inches.
Demographics
As of the 2010 census, there were 8,945 people, 3,093 households, and 2,521 families residing in Desert Hills. The population density was 1,092.3 people per square mile. The racial makeup of the CDP was 87.2% White, 1.2% African American, 0.7% Native American, 1.7% Asian, 0.1% Pacific Islander, 6.7% from other races, and 2.4% from two or more races. Hispanic or Latino of any race were 16.2% of the population.
Economy
The economy of Desert Hills is largely based on tourism and retail. The area is home to several resorts, golf courses, and shopping centers. The area also has a number of restaurants, bars, and other entertainment venues. The median household income in Desert Hills was $63,945 in 2017.
History
Desert Hills was first settled in the late 19th century by ranchers and farmers. The area was originally known as "Rattlesnake Ranch" due to the large number of rattlesnakes in the area. In the early 20th century, the area began to be developed as a resort destination. The first resort, the Desert Hills Hotel, opened in 1925. The area was officially incorporated as a CDP in 2000.
Common Questions
What is the Total Population of Desert Hills?
Total Population of Desert Hills is 2,651.
What is the Total Male Population of Desert Hills?
Total Male Population of Desert Hills is 1,290.
What is the Total Female Population of Desert Hills?
Total Female Population of Desert Hills is 1,361.
What is the Ratio of Males per 100 Females in Desert Hills?
There are 94.78 Males per 100 Females in Desert Hills.
What is the Ratio of Females per 100 Males in Desert Hills?
There are 105.50 Females per 100 Males in Desert Hills.
What is the Median Population Age in Desert Hills?
Median Population Age in Desert Hills is 63.9 Years.
What is the Average Family Size in Desert Hills
Average Family Size in Desert Hills is 2.4 People.
What is the Average Household Size in Desert Hills
Average Household Size in Desert Hills is 1.8 People.
What is Per Capita Income in Desert Hills?
Per Capita income in Desert Hills is $47,995.
What is the Median Family Income in Desert Hills?
Median Family Income in Desert Hills is $75,759.
What is the Median Household income in Desert Hills?
Median Household Income in Desert Hills is $59,911.
What is Income or Wage Gap in Desert Hills?
Income or Wage Gap in Desert Hills is 44.9%.
Women in Desert Hills earn 55.1 cents for every dollar earned by a man.
What is Inequality or Gini Index in Desert Hills?
Inequality or Gini Index in Desert Hills is 0.47.
How Large is the Labor Force in Desert Hills?
There are 894 People in the Labor Forcein in Desert Hills.
What is the Percentage of People in the Labor Force in Desert Hills?
37.9% of People are in the Labor Force in Desert Hills.
What is the Unemployment Rate in Desert Hills?
Unemployment Rate in Desert Hills is 7.6%.