Fountain Hills, AZ
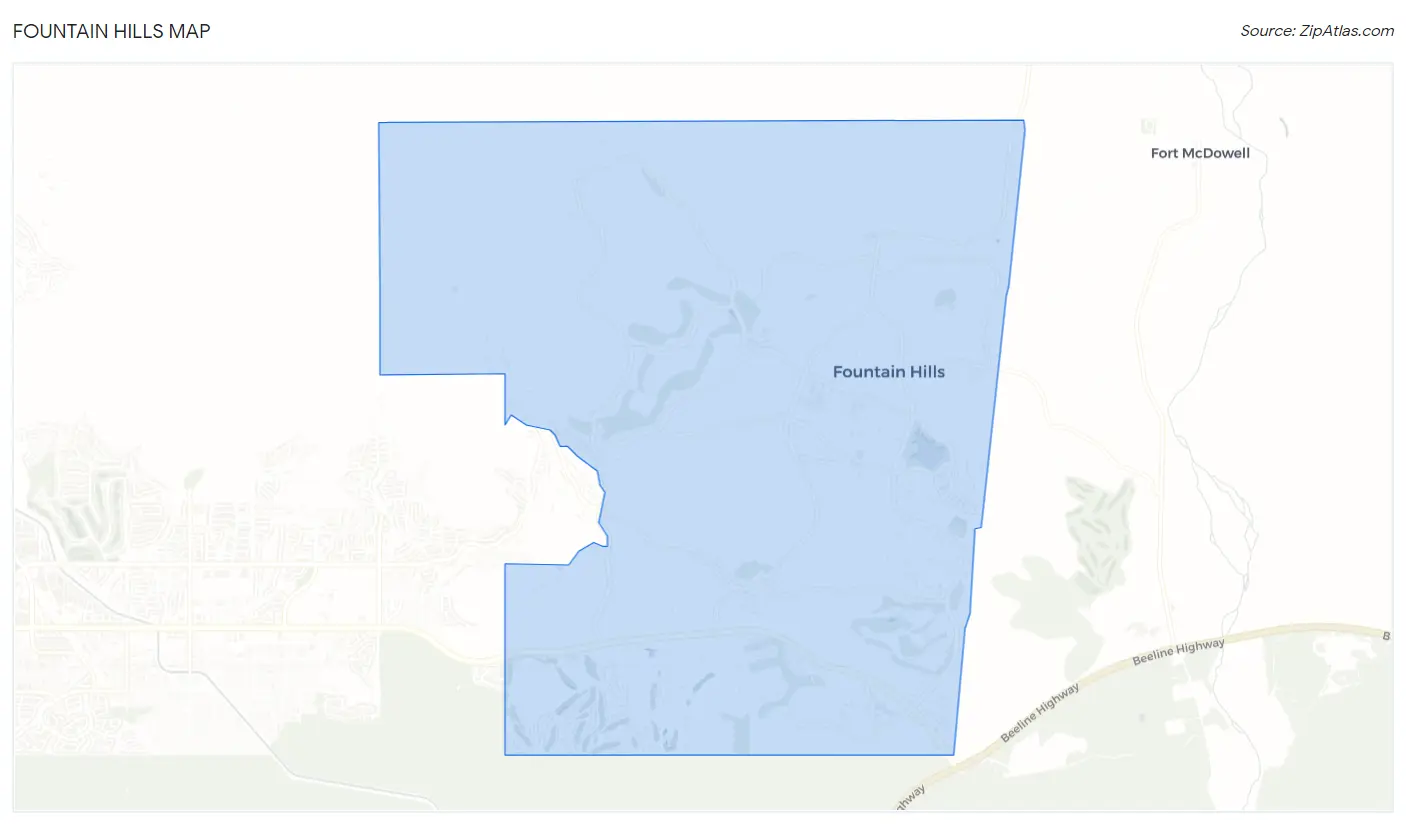
Fountain Hills Map
Fountain Hills Overview
23,739
TOTAL POPULATION
11,780
MALE POPULATION
11,959
FEMALE POPULATION
98.50
MALES / 100 FEMALES
101.52
FEMALES / 100 MALES
60.2
MEDIAN AGE
2.6
AVG FAMILY SIZE
2.1
AVG HOUSEHOLD SIZE
$66,756
PER CAPITA INCOME
$117,752
AVG FAMILY INCOME
$100,317
AVG HOUSEHOLD INCOME
43.6%
WAGE / INCOME GAP [ % ]
56.4¢/ $1
WAGE / INCOME GAP [ $ ]
0.48
INEQUALITY / GINI INDEX
11,129
LABOR FORCE [ PEOPLE ]
52.5%
PERCENT IN LABOR FORCE
5.1%
UNEMPLOYMENT RATE
Fountain Hills Zip Codes
Fountain Hills Area Codes
Race in Fountain Hills
The most populous races in Fountain Hills are White / Caucasian (21,638 | 91.1%), Two or more Races (866 | 3.6%), and Hispanic or Latino (746 | 3.1%).
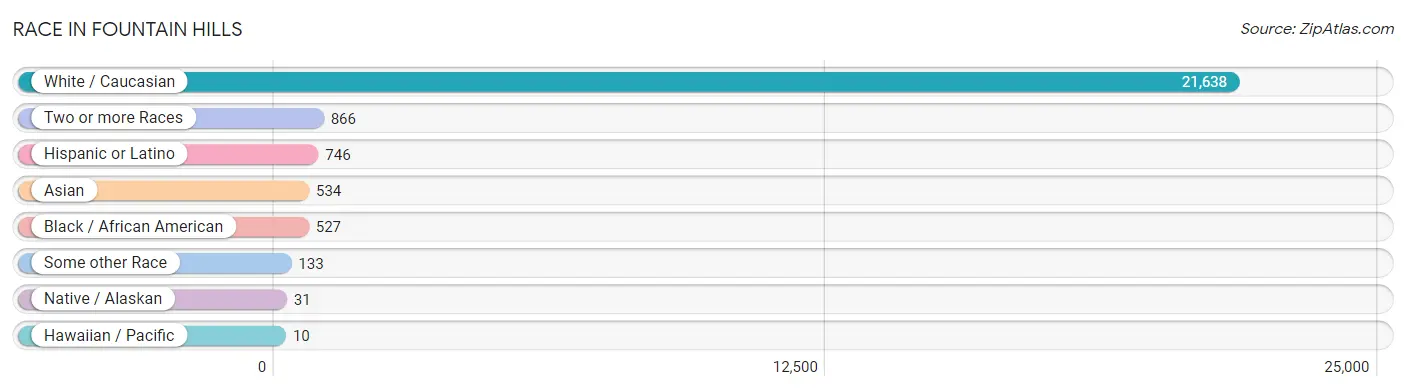
| Race | # Population | % Population |
| Asian | 534 | 2.2% |
| Black / African American | 527 | 2.2% |
| Hawaiian / Pacific | 10 | 0.0% |
| Hispanic or Latino | 746 | 3.1% |
| Native / Alaskan | 31 | 0.1% |
| White / Caucasian | 21,638 | 91.1% |
| Two or more Races | 866 | 3.6% |
| Some other Race | 133 | 0.6% |
| Total | 23,739 | 100.0% |
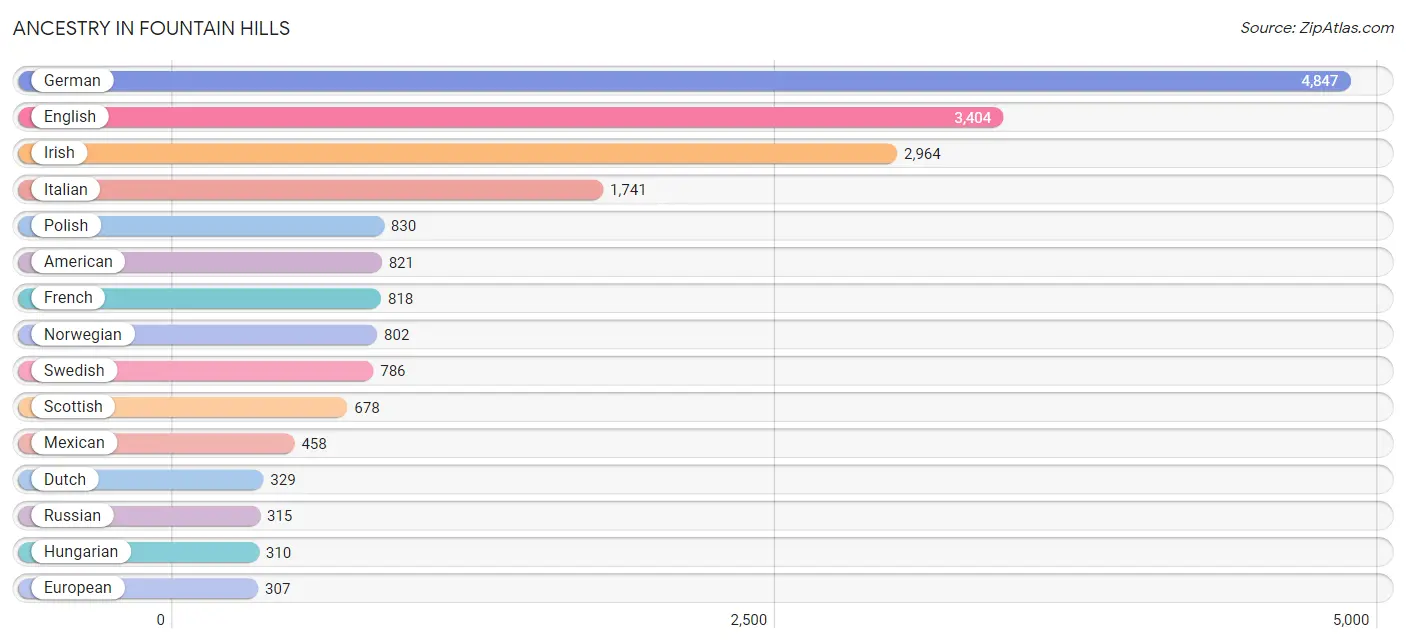
Ancestry in Fountain Hills
The most populous ancestries reported in Fountain Hills are German (4,847 | 20.4%), English (3,404 | 14.3%), Irish (2,964 | 12.5%), Italian (1,741 | 7.3%), and Polish (830 | 3.5%), together accounting for 58.1% of all Fountain Hills residents.
| Ancestry | # Population | % Population |
| African | 156 | 0.7% |
| Albanian | 11 | 0.1% |
| American | 821 | 3.5% |
| Arab | 85 | 0.4% |
| Argentinean | 28 | 0.1% |
| Armenian | 28 | 0.1% |
| Austrian | 78 | 0.3% |
| Bangladeshi | 29 | 0.1% |
| Belgian | 32 | 0.1% |
| Bhutanese | 27 | 0.1% |
| Blackfeet | 24 | 0.1% |
| Brazilian | 18 | 0.1% |
| British | 208 | 0.9% |
| Bulgarian | 14 | 0.1% |
| Burmese | 95 | 0.4% |
| Canadian | 100 | 0.4% |
| Central American | 23 | 0.1% |
| Cherokee | 43 | 0.2% |
| Chilean | 17 | 0.1% |
| Chippewa | 6 | 0.0% |
| Choctaw | 170 | 0.7% |
| Croatian | 51 | 0.2% |
| Czech | 179 | 0.7% |
| Czechoslovakian | 11 | 0.1% |
| Danish | 302 | 1.3% |
| Dutch | 329 | 1.4% |
| Eastern European | 32 | 0.1% |
| English | 3,404 | 14.3% |
| Estonian | 21 | 0.1% |
| European | 307 | 1.3% |
| Finnish | 48 | 0.2% |
| French | 818 | 3.5% |
| French Canadian | 151 | 0.6% |
| German | 4,847 | 20.4% |
| Greek | 250 | 1.1% |
| Guatemalan | 23 | 0.1% |
| Hungarian | 310 | 1.3% |
| Icelander | 8 | 0.0% |
| Indian (Asian) | 118 | 0.5% |
| Iranian | 121 | 0.5% |
| Irish | 2,964 | 12.5% |
| Iroquois | 11 | 0.1% |
| Italian | 1,741 | 7.3% |
| Korean | 225 | 0.9% |
| Laotian | 11 | 0.1% |
| Latvian | 8 | 0.0% |
| Lebanese | 47 | 0.2% |
| Lithuanian | 204 | 0.9% |
| Mexican | 458 | 1.9% |
| Moroccan | 14 | 0.1% |
| Native Hawaiian | 10 | 0.0% |
| Navajo | 35 | 0.2% |
| Northern European | 44 | 0.2% |
| Norwegian | 802 | 3.4% |
| Pakistani | 8 | 0.0% |
| Pennsylvania German | 33 | 0.1% |
| Peruvian | 9 | 0.0% |
| Polish | 830 | 3.5% |
| Portuguese | 115 | 0.5% |
| Puerto Rican | 30 | 0.1% |
| Russian | 315 | 1.3% |
| Scandinavian | 111 | 0.5% |
| Scotch-Irish | 134 | 0.6% |
| Scottish | 678 | 2.9% |
| Serbian | 12 | 0.1% |
| Sioux | 13 | 0.1% |
| Slavic | 31 | 0.1% |
| Slovak | 32 | 0.1% |
| Slovene | 27 | 0.1% |
| South American | 54 | 0.2% |
| Spaniard | 101 | 0.4% |
| Spanish | 47 | 0.2% |
| Sri Lankan | 43 | 0.2% |
| Subsaharan African | 156 | 0.7% |
| Swedish | 786 | 3.3% |
| Swiss | 136 | 0.6% |
| Syrian | 14 | 0.1% |
| Thai | 180 | 0.8% |
| Turkish | 44 | 0.2% |
| Ukrainian | 41 | 0.2% |
| Vietnamese | 49 | 0.2% |
| Welsh | 233 | 1.0% |
| West Indian | 19 | 0.1% |
| Yugoslavian | 19 | 0.1% | View All 84 Rows |
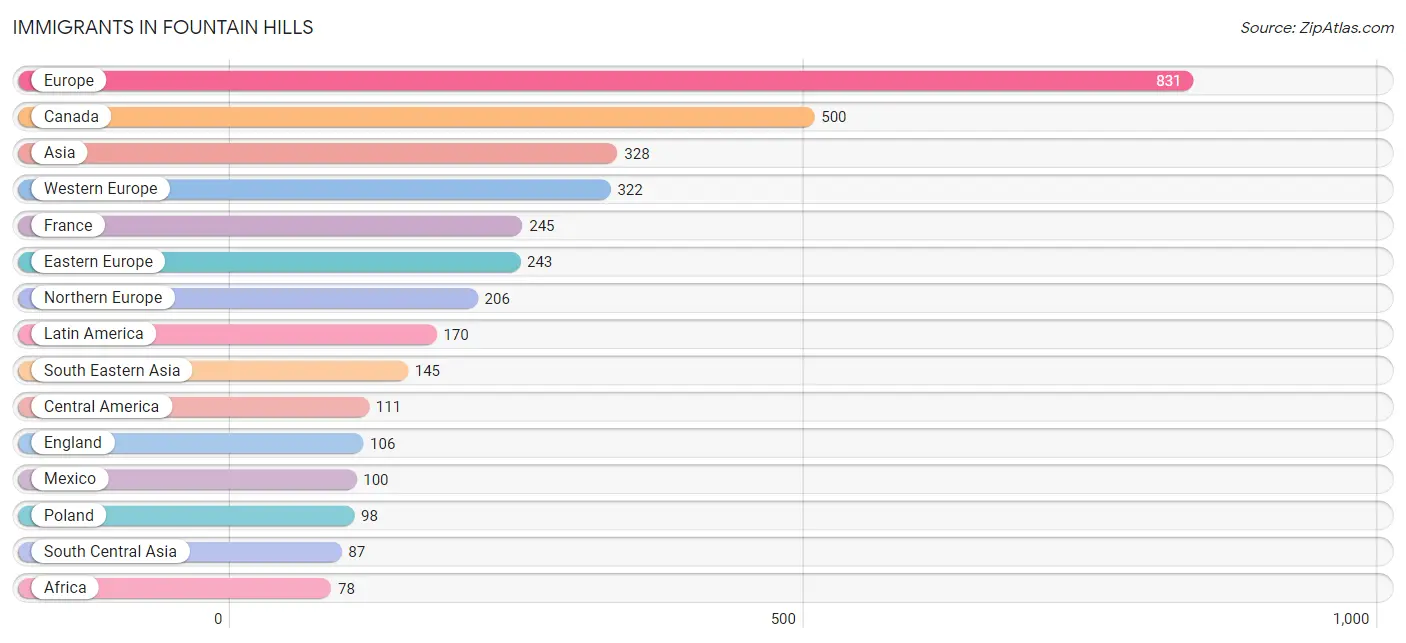
Immigrants in Fountain Hills
The most numerous immigrant groups reported in Fountain Hills came from Europe (831 | 3.5%), Canada (500 | 2.1%), Asia (328 | 1.4%), Western Europe (322 | 1.4%), and France (245 | 1.0%), together accounting for 9.4% of all Fountain Hills residents.
| Immigration Origin | # Population | % Population |
| Africa | 78 | 0.3% |
| Argentina | 15 | 0.1% |
| Asia | 328 | 1.4% |
| Bangladesh | 29 | 0.1% |
| Brazil | 18 | 0.1% |
| Bulgaria | 14 | 0.1% |
| Canada | 500 | 2.1% |
| Central America | 111 | 0.5% |
| Chile | 17 | 0.1% |
| China | 20 | 0.1% |
| Eastern Africa | 56 | 0.2% |
| Eastern Asia | 75 | 0.3% |
| Eastern Europe | 243 | 1.0% |
| England | 106 | 0.4% |
| Ethiopia | 42 | 0.2% |
| Europe | 831 | 3.5% |
| France | 245 | 1.0% |
| Germany | 77 | 0.3% |
| Greece | 53 | 0.2% |
| Guatemala | 11 | 0.1% |
| Hungary | 14 | 0.1% |
| India | 30 | 0.1% |
| Indonesia | 11 | 0.1% |
| Iran | 13 | 0.1% |
| Ireland | 22 | 0.1% |
| Italy | 7 | 0.0% |
| Kazakhstan | 15 | 0.1% |
| Korea | 55 | 0.2% |
| Laos | 6 | 0.0% |
| Latin America | 170 | 0.7% |
| Mexico | 100 | 0.4% |
| Nigeria | 8 | 0.0% |
| Northern Africa | 14 | 0.1% |
| Northern Europe | 206 | 0.9% |
| Peru | 9 | 0.0% |
| Philippines | 77 | 0.3% |
| Poland | 98 | 0.4% |
| Russia | 41 | 0.2% |
| Scotland | 61 | 0.3% |
| Serbia | 12 | 0.1% |
| South America | 59 | 0.3% |
| South Central Asia | 87 | 0.4% |
| South Eastern Asia | 145 | 0.6% |
| Southern Europe | 60 | 0.3% |
| Taiwan | 3 | 0.0% |
| Thailand | 8 | 0.0% |
| Turkey | 21 | 0.1% |
| Ukraine | 12 | 0.1% |
| Vietnam | 43 | 0.2% |
| Western Africa | 8 | 0.0% |
| Western Asia | 21 | 0.1% |
| Western Europe | 322 | 1.4% |
| Zimbabwe | 14 | 0.1% | View All 53 Rows |
Sex and Age in Fountain Hills
Sex and Age in Fountain Hills
The most populous age groups in Fountain Hills are 60 to 64 Years (1,437 | 12.2%) for men and 60 to 64 Years (1,521 | 12.7%) for women.
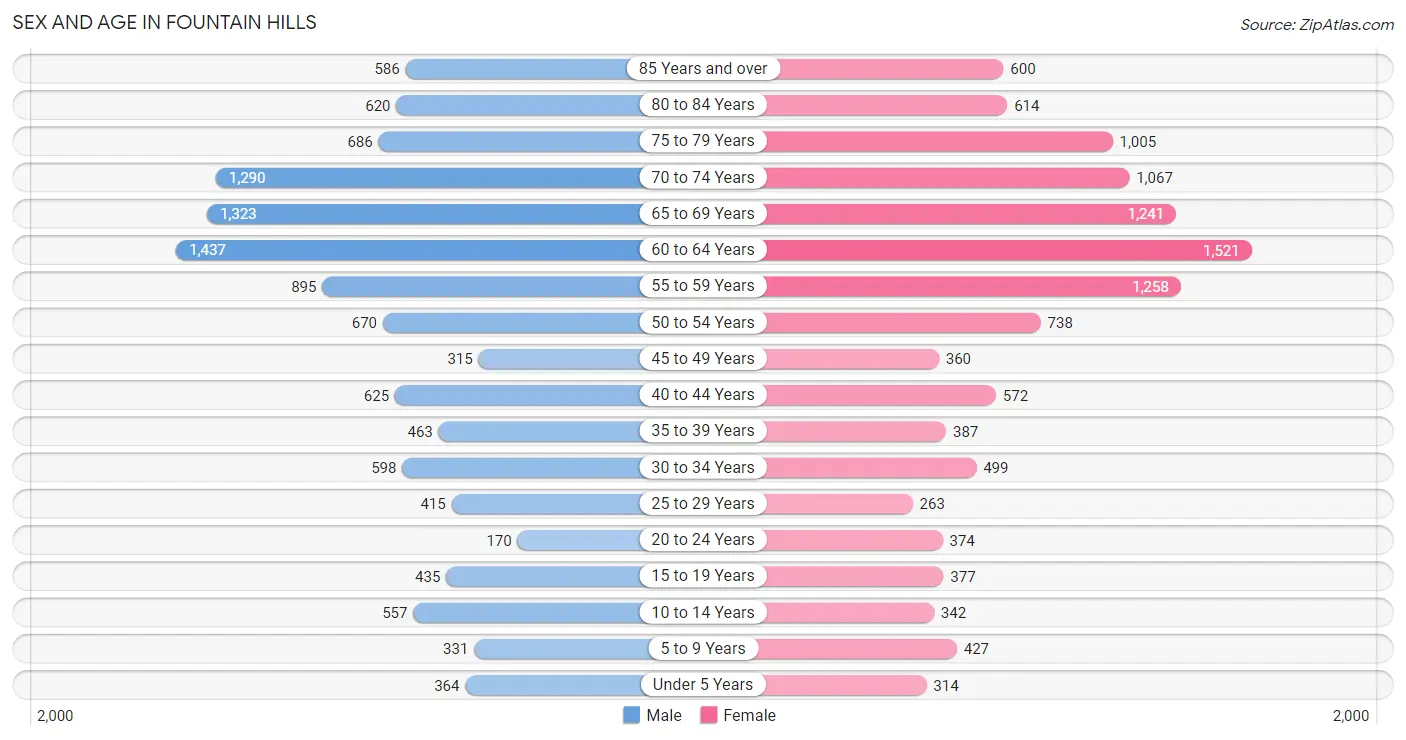
| Age Bracket | Male | Female |
| Under 5 Years | 364 (3.1%) | 314 (2.6%) |
| 5 to 9 Years | 331 (2.8%) | 427 (3.6%) |
| 10 to 14 Years | 557 (4.7%) | 342 (2.9%) |
| 15 to 19 Years | 435 (3.7%) | 377 (3.2%) |
| 20 to 24 Years | 170 (1.4%) | 374 (3.1%) |
| 25 to 29 Years | 415 (3.5%) | 263 (2.2%) |
| 30 to 34 Years | 598 (5.1%) | 499 (4.2%) |
| 35 to 39 Years | 463 (3.9%) | 387 (3.2%) |
| 40 to 44 Years | 625 (5.3%) | 572 (4.8%) |
| 45 to 49 Years | 315 (2.7%) | 360 (3.0%) |
| 50 to 54 Years | 670 (5.7%) | 738 (6.2%) |
| 55 to 59 Years | 895 (7.6%) | 1,258 (10.5%) |
| 60 to 64 Years | 1,437 (12.2%) | 1,521 (12.7%) |
| 65 to 69 Years | 1,323 (11.2%) | 1,241 (10.4%) |
| 70 to 74 Years | 1,290 (11.0%) | 1,067 (8.9%) |
| 75 to 79 Years | 686 (5.8%) | 1,005 (8.4%) |
| 80 to 84 Years | 620 (5.3%) | 614 (5.1%) |
| 85 Years and over | 586 (5.0%) | 600 (5.0%) |
| Total | 11,780 (100.0%) | 11,959 (100.0%) |
Families and Households in Fountain Hills
Median Family Size in Fountain Hills
The median family size in Fountain Hills is 2.58 persons per family, with single female/mother families (521 | 7.0%) accounting for the largest median family size of 2.67 persons per family. On the other hand, single male/father families (284 | 3.8%) represent the smallest median family size with 2.40 persons per family.
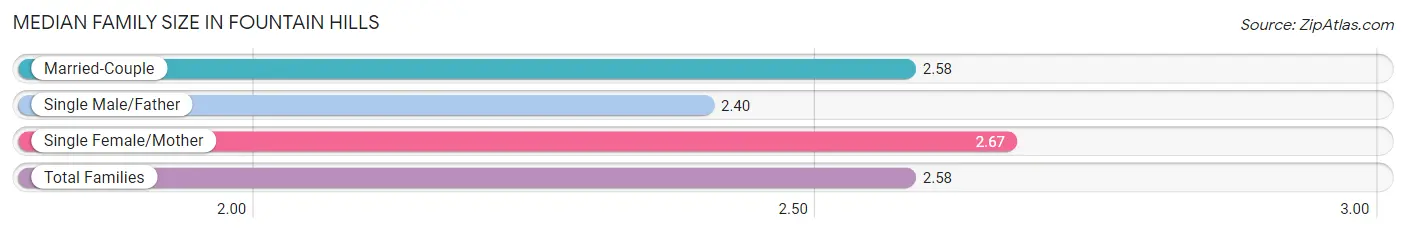
| Family Type | # Families | Family Size |
| Married-Couple | 6,631 (89.2%) | 2.58 |
| Single Male/Father | 284 (3.8%) | 2.40 |
| Single Female/Mother | 521 (7.0%) | 2.67 |
| Total Families | 7,436 (100.0%) | 2.58 |
Median Household Size in Fountain Hills
The median household size in Fountain Hills is 2.12 persons per household, with single female/mother households (521 | 4.7%) accounting for the largest median household size of 2.69 persons per household. non-family households (3,656 | 33.0%) represent the smallest median household size with 1.14 persons per household.
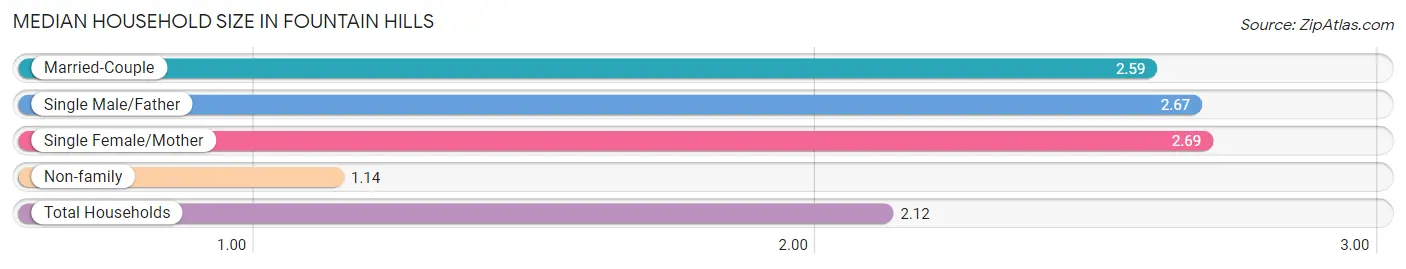
| Household Type | # Households | Household Size |
| Married-Couple | 6,631 (59.8%) | 2.59 |
| Single Male/Father | 284 (2.6%) | 2.67 |
| Single Female/Mother | 521 (4.7%) | 2.69 |
| Non-family | 3,656 (33.0%) | 1.14 |
| Total Households | 11,092 (100.0%) | 2.12 |
Household Size by Marriage Status in Fountain Hills
Out of a total of 11,092 households in Fountain Hills, 7,436 (67.0%) are family households, while 3,656 (33.0%) are nonfamily households. The most numerous type of family households are 2-person households, comprising 5,312, and the most common type of nonfamily households are 1-person households, comprising 3,229.
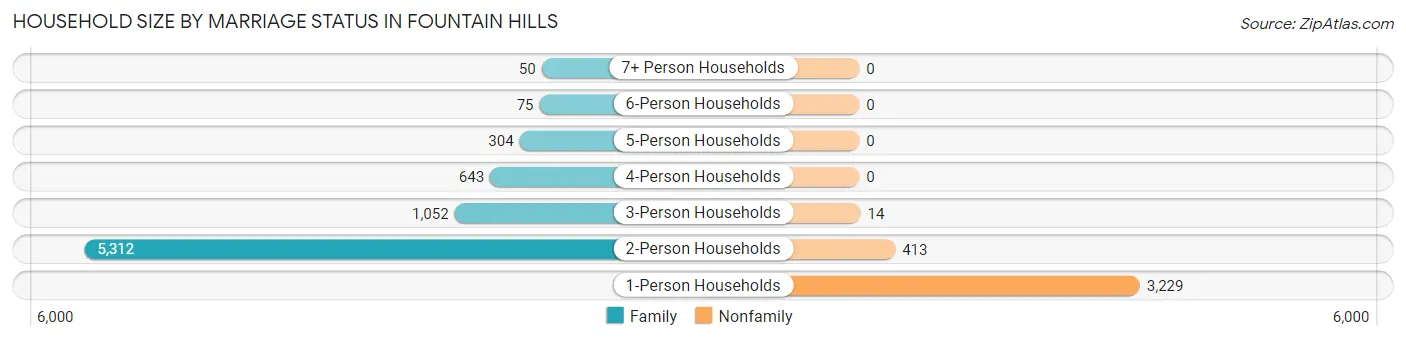
| Household Size | Family Households | Nonfamily Households |
| 1-Person Households | - | 3,229 (29.1%) |
| 2-Person Households | 5,312 (47.9%) | 413 (3.7%) |
| 3-Person Households | 1,052 (9.5%) | 14 (0.1%) |
| 4-Person Households | 643 (5.8%) | 0 (0.0%) |
| 5-Person Households | 304 (2.7%) | 0 (0.0%) |
| 6-Person Households | 75 (0.7%) | 0 (0.0%) |
| 7+ Person Households | 50 (0.4%) | 0 (0.0%) |
| Total | 7,436 (67.0%) | 3,656 (33.0%) |
Female Fertility in Fountain Hills
Fertility by Age in Fountain Hills
Average fertility rate in Fountain Hills is 27.0 births per 1,000 women. Women in the age bracket of 20 to 34 years have the highest fertility rate with 46.0 births per 1,000 women. Women in the age bracket of 20 to 34 years acount for 66.7% of all women with births.
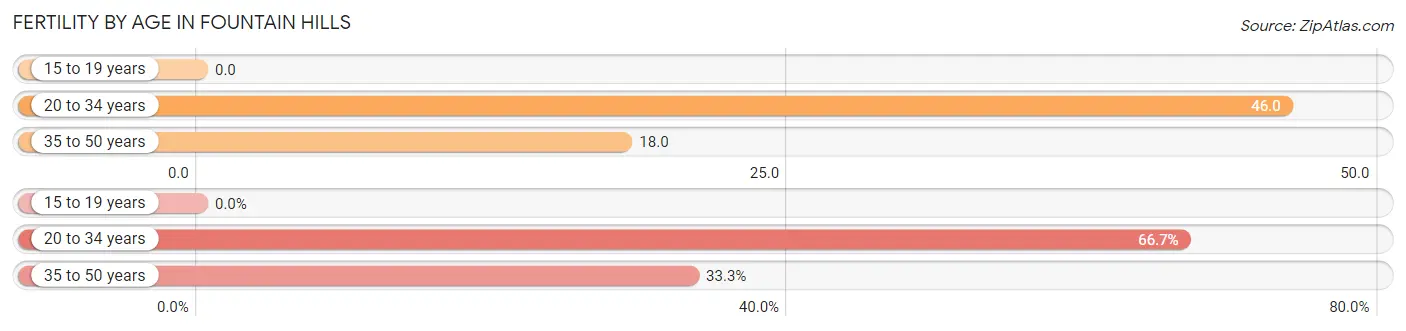
| Age Bracket | Women with Births | Births / 1,000 Women |
| 15 to 19 years | 0 (0.0%) | 0.0 |
| 20 to 34 years | 52 (66.7%) | 46.0 |
| 35 to 50 years | 26 (33.3%) | 18.0 |
| Total | 78 (100.0%) | 27.0 |
Fertility by Age by Marriage Status in Fountain Hills
48.7% of women with births (78) in Fountain Hills are married. The highest percentage of unmarried women with births falls into 35 to 50 years age bracket with 53.8% of them unmarried at the time of birth, while the lowest percentage of unmarried women with births belong to 20 to 34 years age bracket with 50.0% of them unmarried.
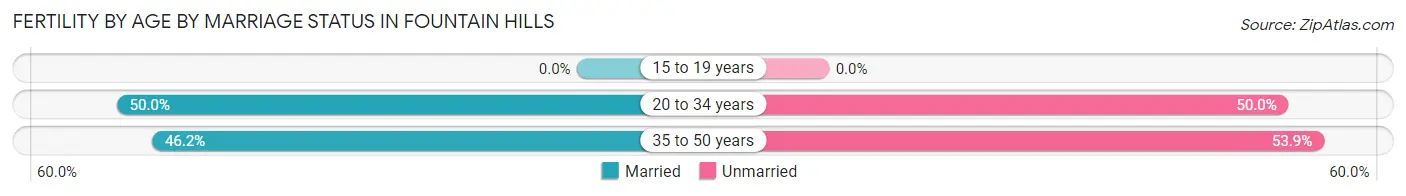
| Age Bracket | Married | Unmarried |
| 15 to 19 years | 0 (0.0%) | 0 (0.0%) |
| 20 to 34 years | 26 (50.0%) | 26 (50.0%) |
| 35 to 50 years | 12 (46.2%) | 14 (53.8%) |
| Total | 38 (48.7%) | 40 (51.3%) |
Fertility by Education in Fountain Hills
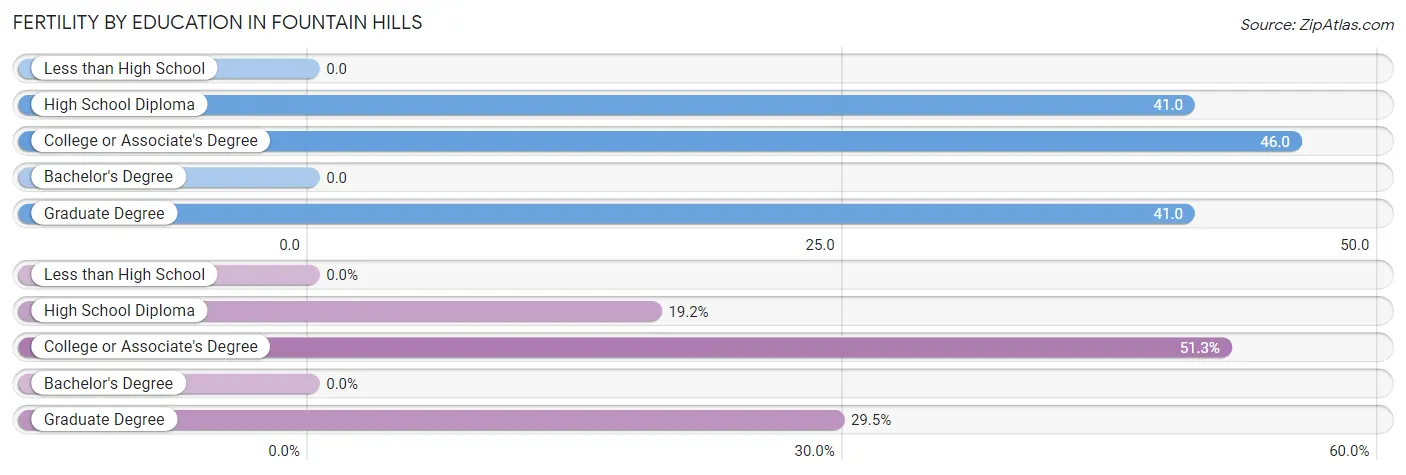
| Educational Attainment | Women with Births | Births / 1,000 Women |
| Less than High School | 0 (0.0%) | 0.0 |
| High School Diploma | 15 (19.2%) | 41.0 |
| College or Associate's Degree | 40 (51.3%) | 46.0 |
| Bachelor's Degree | 0 (0.0%) | 0.0 |
| Graduate Degree | 23 (29.5%) | 41.0 |
| Total | 78 (100.0%) | 27.0 |
Fertility by Education by Marriage Status in Fountain Hills
51.3% of women with births in Fountain Hills are unmarried. Women with the educational attainment of high school diploma are most likely to be married with 100.0% of them married at childbirth, while women with the educational attainment of college or associate's degree are least likely to be married with 100.0% of them unmarried at childbirth.
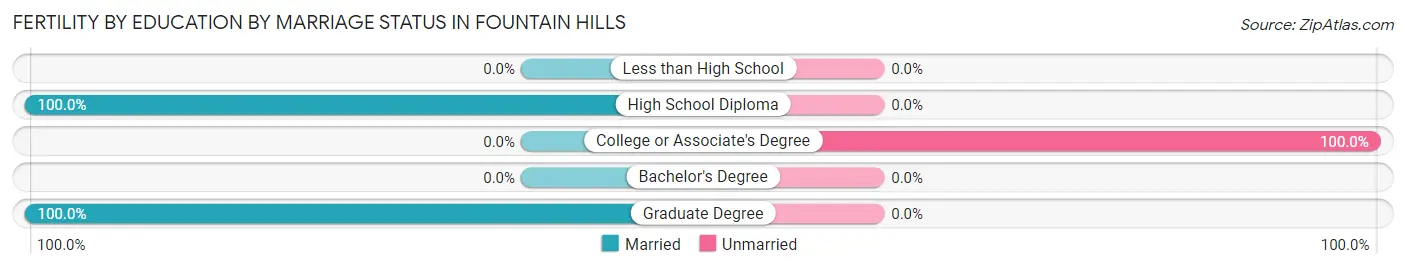
| Educational Attainment | Married | Unmarried |
| Less than High School | 0 (0.0%) | 0 (0.0%) |
| High School Diploma | 15 (100.0%) | 0 (0.0%) |
| College or Associate's Degree | 0 (0.0%) | 40 (100.0%) |
| Bachelor's Degree | 0 (0.0%) | 0 (0.0%) |
| Graduate Degree | 23 (100.0%) | 0 (0.0%) |
| Total | 38 (48.7%) | 40 (51.3%) |
Income in Fountain Hills
Income Overview in Fountain Hills
Per Capita Income in Fountain Hills is $66,756, while median incomes of families and households are $117,752 and $100,317 respectively.
| Characteristic | Number | Measure |
| Per Capita Income | 23,739 | $66,756 |
| Median Family Income | 7,436 | $117,752 |
| Mean Family Income | 7,436 | $165,122 |
| Median Household Income | 11,092 | $100,317 |
| Mean Household Income | 11,092 | $140,336 |
| Income Deficit | 7,436 | $0 |
| Wage / Income Gap (%) | 23,739 | 43.65% |
| Wage / Income Gap ($) | 23,739 | 56.35¢ per $1 |
| Gini / Inequality Index | 23,739 | 0.48 |
Earnings by Sex in Fountain Hills
Average Earnings in Fountain Hills are $58,932, $80,745 for men and $45,503 for women, a difference of 43.6%.
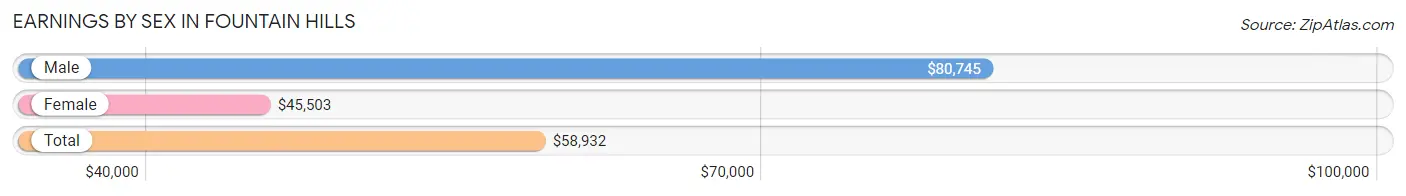
| Sex | Number | Average Earnings |
| Male | 6,370 (54.5%) | $80,745 |
| Female | 5,312 (45.5%) | $45,503 |
| Total | 11,682 (100.0%) | $58,932 |
Earnings by Sex by Income Bracket in Fountain Hills
The most common earnings brackets in Fountain Hills are $100,000+ for men (2,126 | 33.4%) and $100,000+ for women (1,095 | 20.6%).
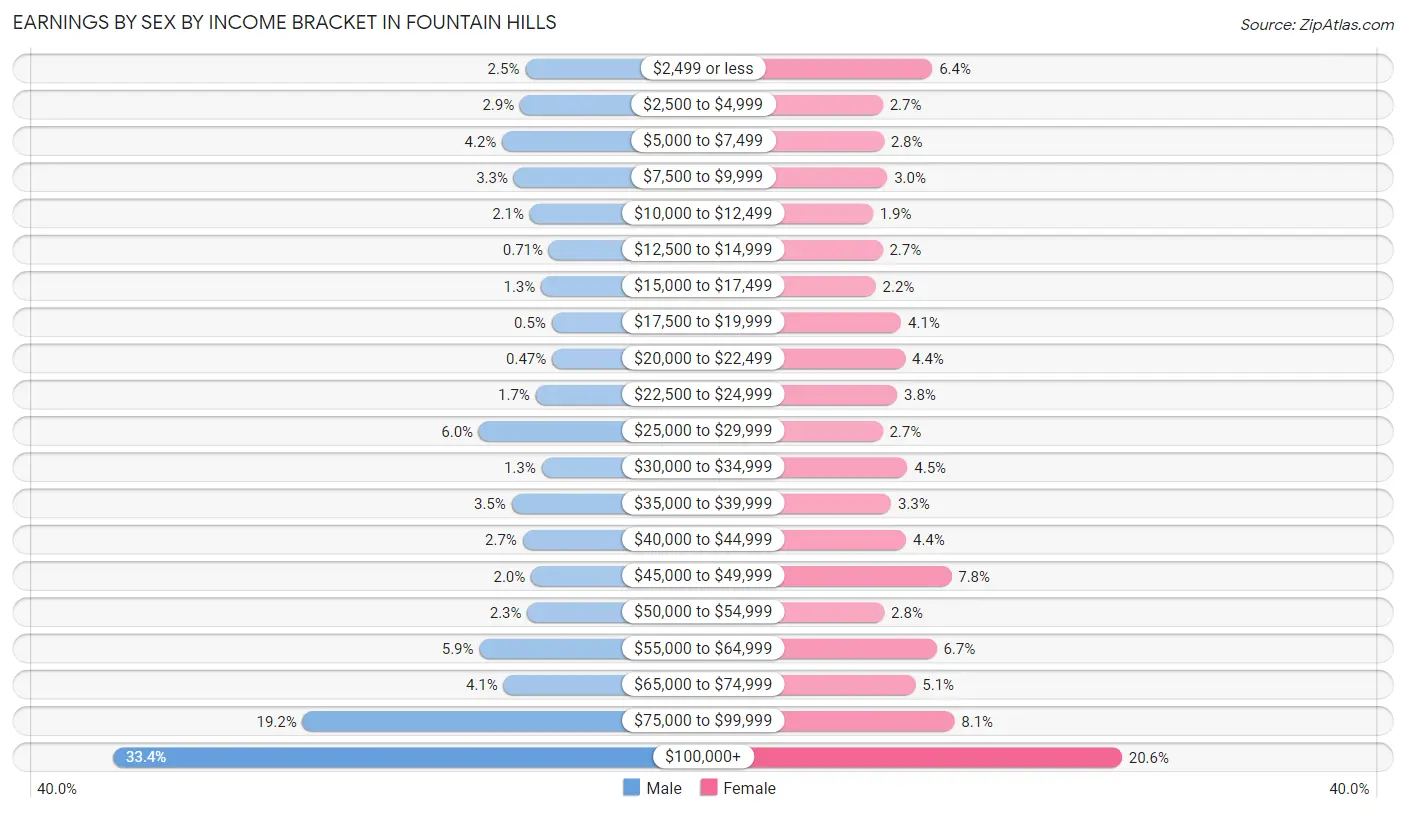
| Income | Male | Female |
| $2,499 or less | 158 (2.5%) | 340 (6.4%) |
| $2,500 to $4,999 | 183 (2.9%) | 143 (2.7%) |
| $5,000 to $7,499 | 268 (4.2%) | 147 (2.8%) |
| $7,500 to $9,999 | 213 (3.3%) | 161 (3.0%) |
| $10,000 to $12,499 | 136 (2.1%) | 103 (1.9%) |
| $12,500 to $14,999 | 45 (0.7%) | 142 (2.7%) |
| $15,000 to $17,499 | 82 (1.3%) | 115 (2.2%) |
| $17,500 to $19,999 | 32 (0.5%) | 216 (4.1%) |
| $20,000 to $22,499 | 30 (0.5%) | 232 (4.4%) |
| $22,500 to $24,999 | 108 (1.7%) | 200 (3.8%) |
| $25,000 to $29,999 | 379 (5.9%) | 142 (2.7%) |
| $30,000 to $34,999 | 80 (1.3%) | 241 (4.5%) |
| $35,000 to $39,999 | 223 (3.5%) | 176 (3.3%) |
| $40,000 to $44,999 | 170 (2.7%) | 236 (4.4%) |
| $45,000 to $49,999 | 130 (2.0%) | 416 (7.8%) |
| $50,000 to $54,999 | 148 (2.3%) | 149 (2.8%) |
| $55,000 to $64,999 | 377 (5.9%) | 357 (6.7%) |
| $65,000 to $74,999 | 261 (4.1%) | 273 (5.1%) |
| $75,000 to $99,999 | 1,221 (19.2%) | 428 (8.1%) |
| $100,000+ | 2,126 (33.4%) | 1,095 (20.6%) |
| Total | 6,370 (100.0%) | 5,312 (100.0%) |
Earnings by Sex by Educational Attainment in Fountain Hills
Average earnings in Fountain Hills are $82,937 for men and $47,160 for women, a difference of 43.1%. Men with an educational attainment of bachelor's degree enjoy the highest average annual earnings of $101,528, while those with less than high school education earn the least with $28,750. Women with an educational attainment of graduate degree earn the most with the average annual earnings of $71,667, while those with high school diploma education have the smallest earnings of $28,250.
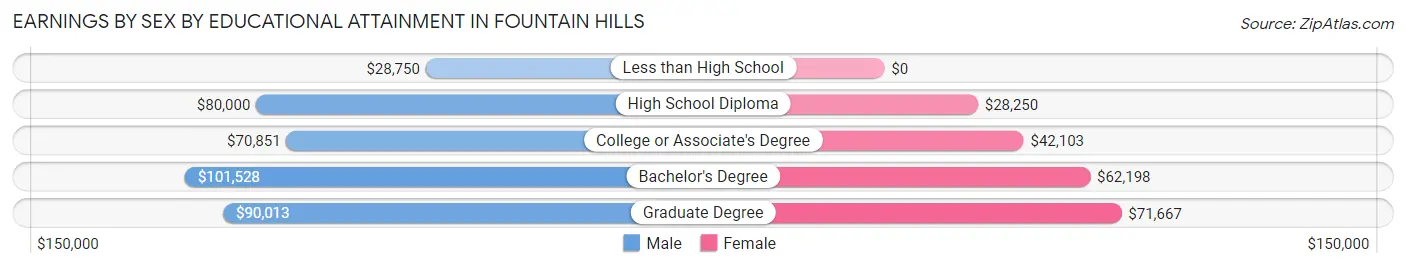
| Educational Attainment | Male Income | Female Income |
| Less than High School | $28,750 | $0 |
| High School Diploma | $80,000 | $28,250 |
| College or Associate's Degree | $70,851 | $42,103 |
| Bachelor's Degree | $101,528 | $62,198 |
| Graduate Degree | $90,013 | $71,667 |
| Total | $82,937 | $47,160 |
Family Income in Fountain Hills
Family Income Brackets in Fountain Hills
According to the Fountain Hills family income data, there are 1,822 families falling into the $200,000+ income range, which is the most common income bracket and makes up 24.5% of all families. Conversely, the $10,000 to $14,999 income bracket is the least frequent group with only 37 families (0.5%) belonging to this category.
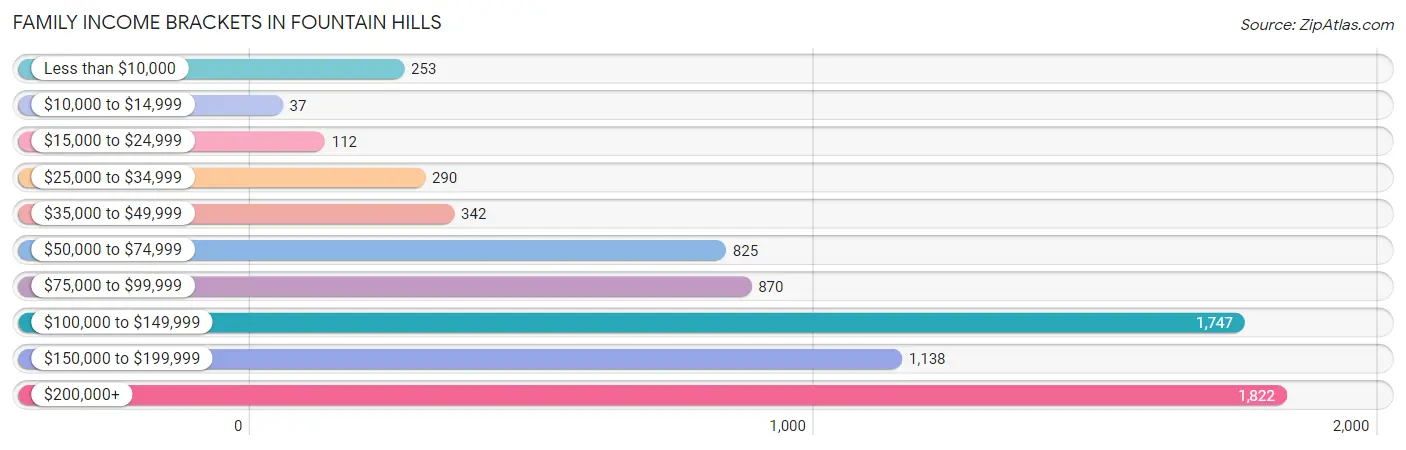
| Income Bracket | # Families | % Families |
| Less than $10,000 | 253 | 3.4% |
| $10,000 to $14,999 | 37 | 0.5% |
| $15,000 to $24,999 | 112 | 1.5% |
| $25,000 to $34,999 | 290 | 3.9% |
| $35,000 to $49,999 | 342 | 4.6% |
| $50,000 to $74,999 | 825 | 11.1% |
| $75,000 to $99,999 | 870 | 11.7% |
| $100,000 to $149,999 | 1,747 | 23.5% |
| $150,000 to $199,999 | 1,138 | 15.3% |
| $200,000+ | 1,822 | 24.5% |
Family Income by Famaliy Size in Fountain Hills
6-person families (75 | 1.0%) account for the highest median family income in Fountain Hills with $250,001 per family, while 2-person families (5,407 | 72.7%) have the highest median income of $57,513 per family member.
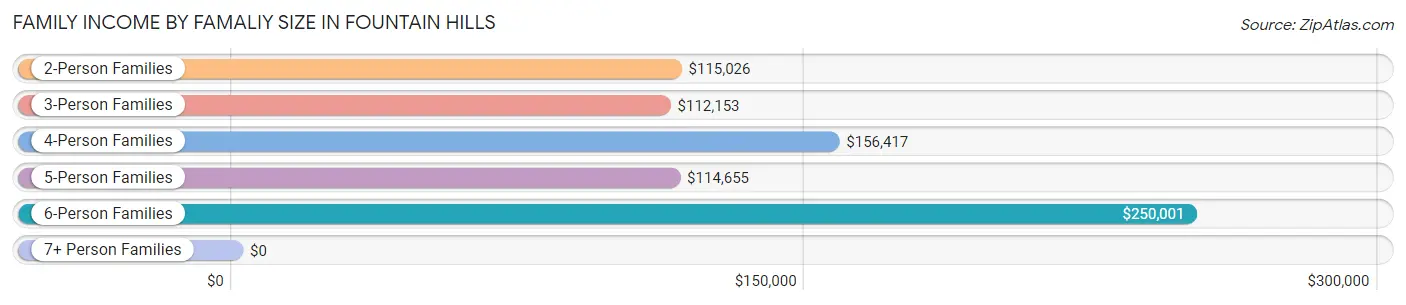
| Income Bracket | # Families | Median Income |
| 2-Person Families | 5,407 (72.7%) | $115,026 |
| 3-Person Families | 968 (13.0%) | $112,153 |
| 4-Person Families | 665 (8.9%) | $156,417 |
| 5-Person Families | 271 (3.6%) | $114,655 |
| 6-Person Families | 75 (1.0%) | $250,001 |
| 7+ Person Families | 50 (0.7%) | $0 |
| Total | 7,436 (100.0%) | $117,752 |
Family Income by Number of Earners in Fountain Hills
The median family income in Fountain Hills is $117,752, with families comprising 3+ earners (533) having the highest median family income of $174,539, while families with no earners (2,146) have the lowest median family income of $83,778, accounting for 7.2% and 28.9% of families, respectively.
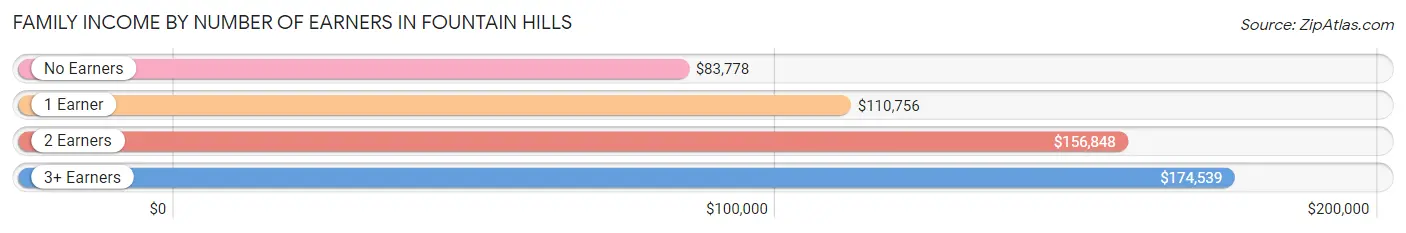
| Number of Earners | # Families | Median Income |
| No Earners | 2,146 (28.9%) | $83,778 |
| 1 Earner | 1,947 (26.2%) | $110,756 |
| 2 Earners | 2,810 (37.8%) | $156,848 |
| 3+ Earners | 533 (7.2%) | $174,539 |
| Total | 7,436 (100.0%) | $117,752 |
Household Income in Fountain Hills
Household Income Brackets in Fountain Hills
With 2,252 households falling in the category, the $100,000 to $149,999 income range is the most frequent in Fountain Hills, accounting for 20.3% of all households. In contrast, only 233 households (2.1%) fall into the $10,000 to $14,999 income bracket, making it the least populous group.
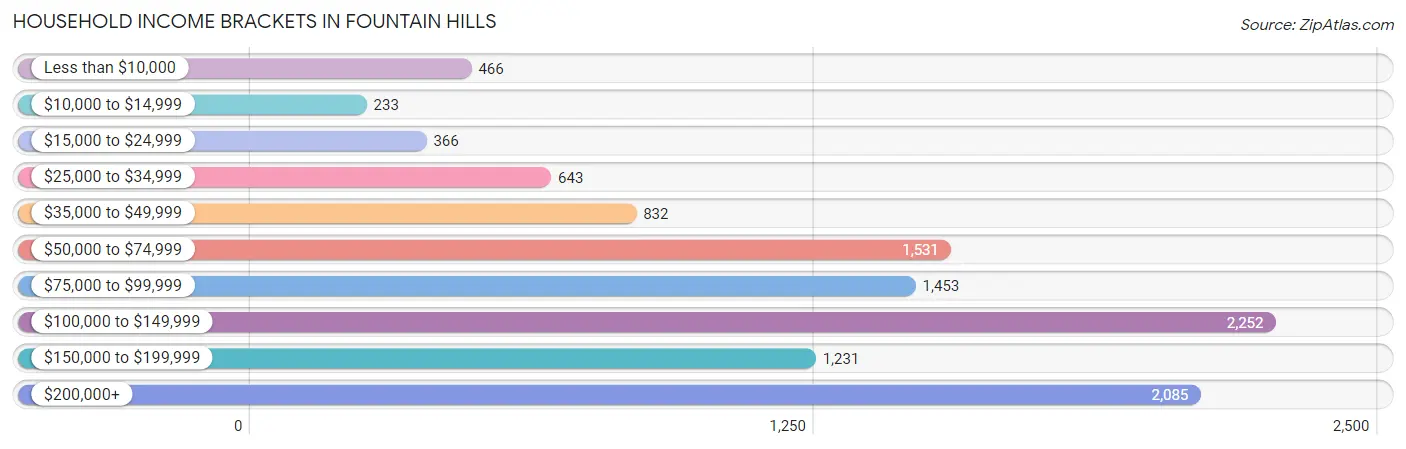
| Income Bracket | # Households | % Households |
| Less than $10,000 | 466 | 4.2% |
| $10,000 to $14,999 | 233 | 2.1% |
| $15,000 to $24,999 | 366 | 3.3% |
| $25,000 to $34,999 | 643 | 5.8% |
| $35,000 to $49,999 | 832 | 7.5% |
| $50,000 to $74,999 | 1,531 | 13.8% |
| $75,000 to $99,999 | 1,453 | 13.1% |
| $100,000 to $149,999 | 2,252 | 20.3% |
| $150,000 to $199,999 | 1,231 | 11.1% |
| $200,000+ | 2,085 | 18.8% |
Household Income by Householder Age in Fountain Hills
The median household income in Fountain Hills is $100,317, with the highest median household income of $116,983 found in the 45 to 64 years age bracket for the primary householder. A total of 3,686 households (33.2%) fall into this category. Meanwhile, the 15 to 24 years age bracket for the primary householder has the lowest median household income of $49,464, with 59 households (0.5%) in this group.
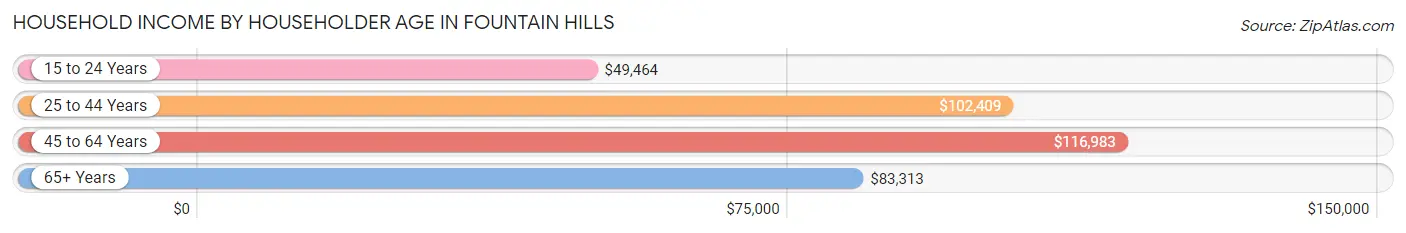
| Income Bracket | # Households | Median Income |
| 15 to 24 Years | 59 (0.5%) | $49,464 |
| 25 to 44 Years | 1,602 (14.4%) | $102,409 |
| 45 to 64 Years | 3,686 (33.2%) | $116,983 |
| 65+ Years | 5,745 (51.8%) | $83,313 |
| Total | 11,092 (100.0%) | $100,317 |
Poverty in Fountain Hills
Income Below Poverty by Sex and Age in Fountain Hills
With 6.1% poverty level for males and 5.0% for females among the residents of Fountain Hills, 12 to 14 year old males and 75 year old and over females are the most vulnerable to poverty, with 49 males (17.8%) and 227 females (10.7%) in their respective age groups living below the poverty level.
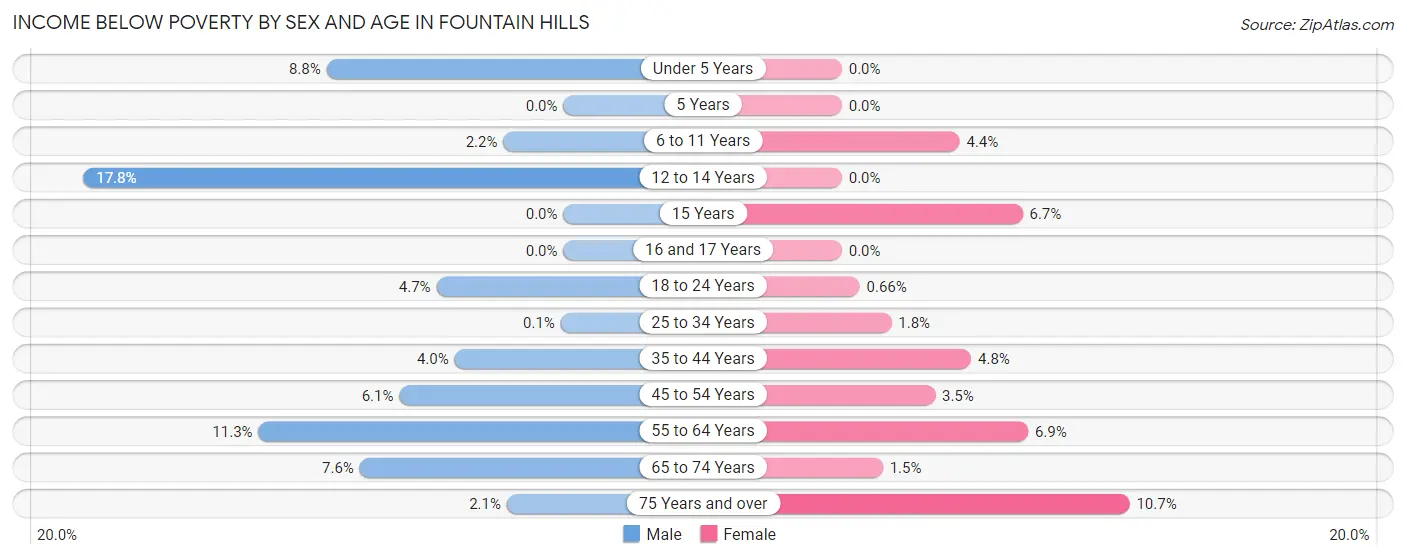
| Age Bracket | Male | Female |
| Under 5 Years | 32 (8.8%) | 0 (0.0%) |
| 5 Years | 0 (0.0%) | 0 (0.0%) |
| 6 to 11 Years | 12 (2.2%) | 21 (4.4%) |
| 12 to 14 Years | 49 (17.8%) | 0 (0.0%) |
| 15 Years | 0 (0.0%) | 11 (6.7%) |
| 16 and 17 Years | 0 (0.0%) | 0 (0.0%) |
| 18 to 24 Years | 18 (4.7%) | 3 (0.7%) |
| 25 to 34 Years | 1 (0.1%) | 14 (1.8%) |
| 35 to 44 Years | 44 (4.0%) | 46 (4.8%) |
| 45 to 54 Years | 60 (6.1%) | 38 (3.5%) |
| 55 to 64 Years | 264 (11.3%) | 192 (6.9%) |
| 65 to 74 Years | 196 (7.6%) | 35 (1.5%) |
| 75 Years and over | 39 (2.1%) | 227 (10.7%) |
| Total | 715 (6.1%) | 587 (5.0%) |
Income Above Poverty by Sex and Age in Fountain Hills
According to the poverty statistics in Fountain Hills, males aged 5 years and females aged under 5 years are the age groups that are most secure financially, with 100.0% of males and 100.0% of females in these age groups living above the poverty line.
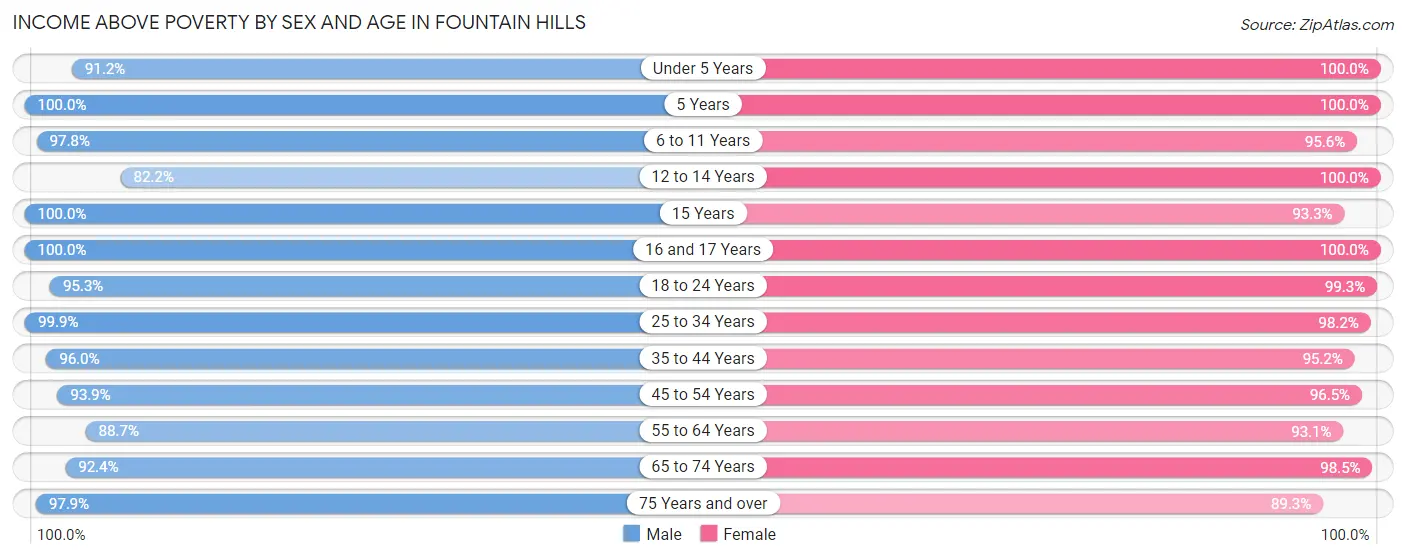
| Age Bracket | Male | Female |
| Under 5 Years | 332 (91.2%) | 314 (100.0%) |
| 5 Years | 74 (100.0%) | 45 (100.0%) |
| 6 to 11 Years | 527 (97.8%) | 460 (95.6%) |
| 12 to 14 Years | 226 (82.2%) | 243 (100.0%) |
| 15 Years | 41 (100.0%) | 153 (93.3%) |
| 16 and 17 Years | 182 (100.0%) | 129 (100.0%) |
| 18 to 24 Years | 364 (95.3%) | 455 (99.3%) |
| 25 to 34 Years | 1,012 (99.9%) | 748 (98.2%) |
| 35 to 44 Years | 1,044 (96.0%) | 913 (95.2%) |
| 45 to 54 Years | 925 (93.9%) | 1,060 (96.5%) |
| 55 to 64 Years | 2,068 (88.7%) | 2,585 (93.1%) |
| 65 to 74 Years | 2,398 (92.4%) | 2,273 (98.5%) |
| 75 Years and over | 1,822 (97.9%) | 1,898 (89.3%) |
| Total | 11,015 (93.9%) | 11,276 (95.1%) |
Income Below Poverty Among Married-Couple Families in Fountain Hills
The poverty statistics for married-couple families in Fountain Hills show that 4.4% or 293 of the total 6,631 families live below the poverty line. Families with 3 or 4 children have the highest poverty rate of 5.9%, comprising of 14 families. On the other hand, families with 1 or 2 children have the lowest poverty rate of 0.0%, which includes 0 families.
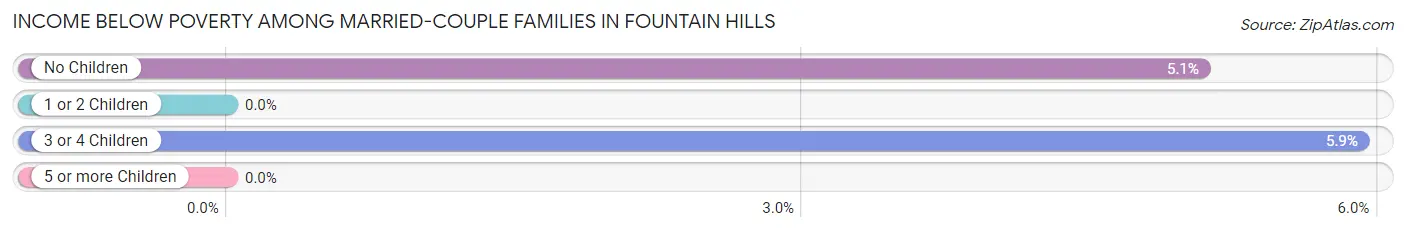
| Children | Above Poverty | Below Poverty |
| No Children | 5,218 (94.9%) | 279 (5.1%) |
| 1 or 2 Children | 897 (100.0%) | 0 (0.0%) |
| 3 or 4 Children | 223 (94.1%) | 14 (5.9%) |
| 5 or more Children | 0 (0.0%) | 0 (0.0%) |
| Total | 6,338 (95.6%) | 293 (4.4%) |
Income Below Poverty Among Single-Parent Households in Fountain Hills
According to the poverty data in Fountain Hills, 18.7% or 53 single-father households and 5.2% or 27 single-mother households are living below the poverty line. Among single-father households, those with 1 or 2 children have the highest poverty rate, with 53 households (31.2%) experiencing poverty. Likewise, among single-mother households, those with 1 or 2 children have the highest poverty rate, with 21 households (11.5%) falling below the poverty line.
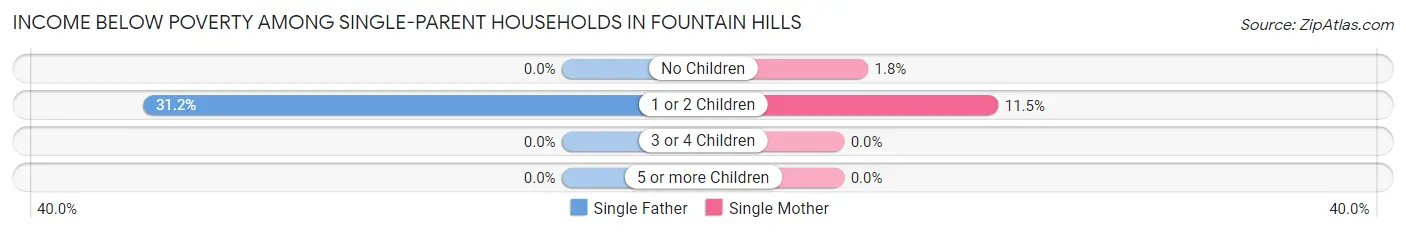
| Children | Single Father | Single Mother |
| No Children | 0 (0.0%) | 6 (1.8%) |
| 1 or 2 Children | 53 (31.2%) | 21 (11.5%) |
| 3 or 4 Children | 0 (0.0%) | 0 (0.0%) |
| 5 or more Children | 0 (0.0%) | 0 (0.0%) |
| Total | 53 (18.7%) | 27 (5.2%) |
Income Below Poverty Among Married-Couple vs Single-Parent Households in Fountain Hills
The poverty data for Fountain Hills shows that 293 of the married-couple family households (4.4%) and 80 of the single-parent households (9.9%) are living below the poverty level. Within the married-couple family households, those with 3 or 4 children have the highest poverty rate, with 14 households (5.9%) falling below the poverty line. Among the single-parent households, those with 1 or 2 children have the highest poverty rate, with 74 household (21.0%) living below poverty.
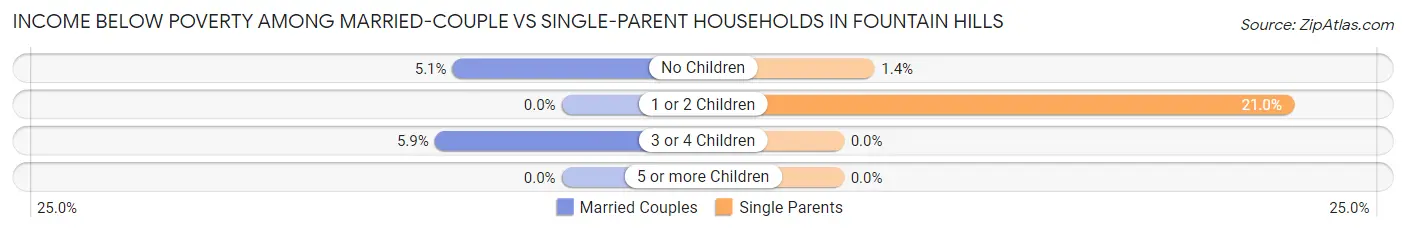
| Children | Married-Couple Families | Single-Parent Households |
| No Children | 279 (5.1%) | 6 (1.4%) |
| 1 or 2 Children | 0 (0.0%) | 74 (21.0%) |
| 3 or 4 Children | 14 (5.9%) | 0 (0.0%) |
| 5 or more Children | 0 (0.0%) | 0 (0.0%) |
| Total | 293 (4.4%) | 80 (9.9%) |
Employment Characteristics in Fountain Hills
Employment by Class of Employer in Fountain Hills
Among the 10,435 employed individuals in Fountain Hills, private company employees (6,274 | 60.1%), self-employed (incorporated) (1,320 | 12.7%), and self-employed (not incorporated) (944 | 9.0%) make up the most common classes of employment.
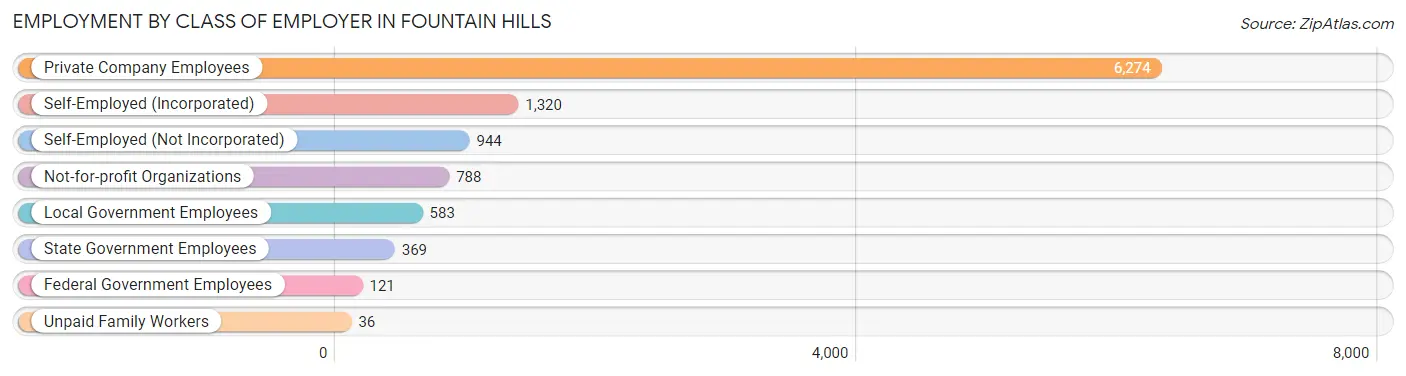
| Employer Class | # Employees | % Employees |
| Private Company Employees | 6,274 | 60.1% |
| Self-Employed (Incorporated) | 1,320 | 12.7% |
| Self-Employed (Not Incorporated) | 944 | 9.0% |
| Not-for-profit Organizations | 788 | 7.5% |
| Local Government Employees | 583 | 5.6% |
| State Government Employees | 369 | 3.5% |
| Federal Government Employees | 121 | 1.2% |
| Unpaid Family Workers | 36 | 0.3% |
| Total | 10,435 | 100.0% |
Employment Status by Age in Fountain Hills
According to the labor force statistics for Fountain Hills, out of the total population over 16 years of age (21,199), 52.5% or 11,129 individuals are in the labor force, with 5.1% or 568 of them unemployed. The age group with the highest labor force participation rate is 20 to 24 years, with 96.3% or 524 individuals in the labor force. Within the labor force, the 20 to 24 years age range has the highest percentage of unemployed individuals, with 21.9% or 115 of them being unemployed.
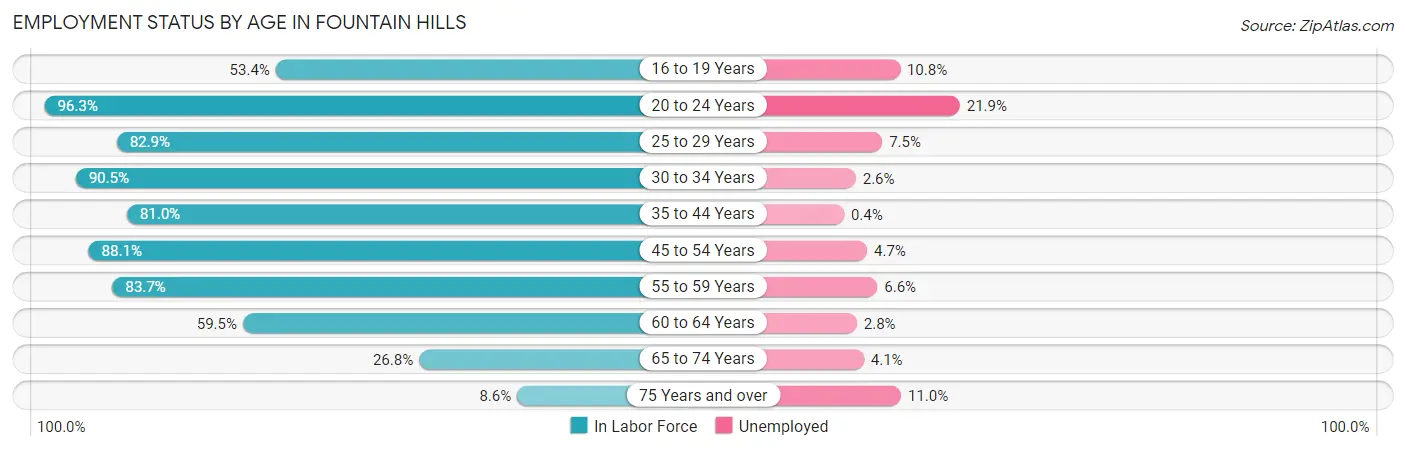
| Age Bracket | In Labor Force | Unemployed |
| 16 to 19 Years | 324 (53.4%) | 35 (10.8%) |
| 20 to 24 Years | 524 (96.3%) | 115 (21.9%) |
| 25 to 29 Years | 562 (82.9%) | 42 (7.5%) |
| 30 to 34 Years | 993 (90.5%) | 26 (2.6%) |
| 35 to 44 Years | 1,658 (81.0%) | 7 (0.4%) |
| 45 to 54 Years | 1,835 (88.1%) | 86 (4.7%) |
| 55 to 59 Years | 1,802 (83.7%) | 119 (6.6%) |
| 60 to 64 Years | 1,760 (59.5%) | 49 (2.8%) |
| 65 to 74 Years | 1,319 (26.8%) | 54 (4.1%) |
| 75 Years and over | 354 (8.6%) | 39 (11.0%) |
| Total | 11,129 (52.5%) | 568 (5.1%) |
Employment Status by Educational Attainment in Fountain Hills
According to labor force statistics for Fountain Hills, 78.2% of individuals (8,615) out of the total population between 25 and 64 years of age (11,016) are in the labor force, with 3.8% or 327 of them being unemployed. The group with the highest labor force participation rate are those with the educational attainment of bachelor's degree or higher, with 80.0% or 4,637 individuals in the labor force. Within the labor force, individuals with college / associate degree education have the highest percentage of unemployment, with 5.7% or 170 of them being unemployed.
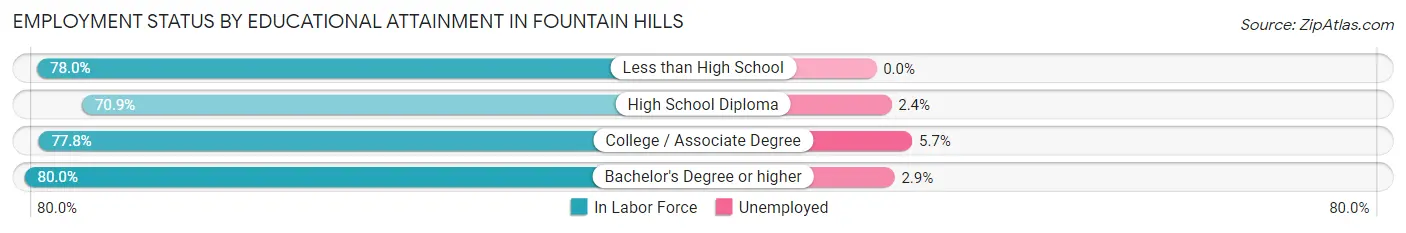
| Educational Attainment | In Labor Force | Unemployed |
| Less than High School | 128 (78.0%) | 0 (0.0%) |
| High School Diploma | 872 (70.9%) | 30 (2.4%) |
| College / Associate Degree | 2,977 (77.8%) | 218 (5.7%) |
| Bachelor's Degree or higher | 4,637 (80.0%) | 168 (2.9%) |
| Total | 8,615 (78.2%) | 419 (3.8%) |
Employment Occupations by Sex in Fountain Hills
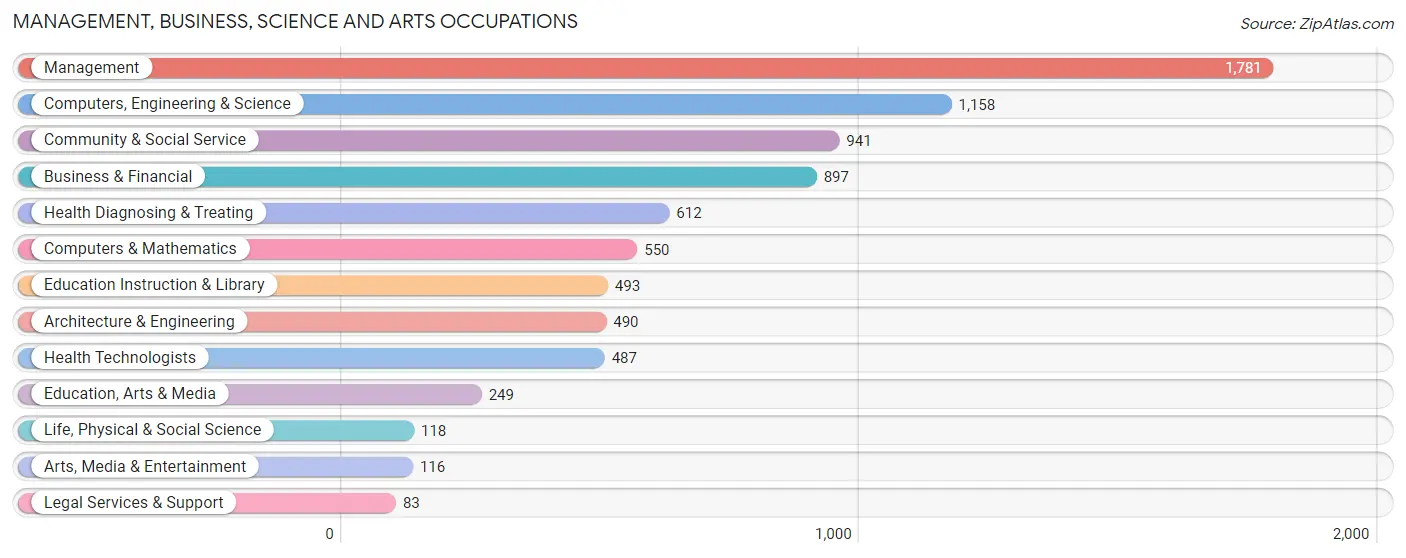
Management, Business, Science and Arts Occupations
The most common Management, Business, Science and Arts occupations in Fountain Hills are Management (1,781 | 16.9%), Computers, Engineering & Science (1,158 | 11.0%), Community & Social Service (941 | 8.9%), Business & Financial (897 | 8.5%), and Health Diagnosing & Treating (612 | 5.8%).
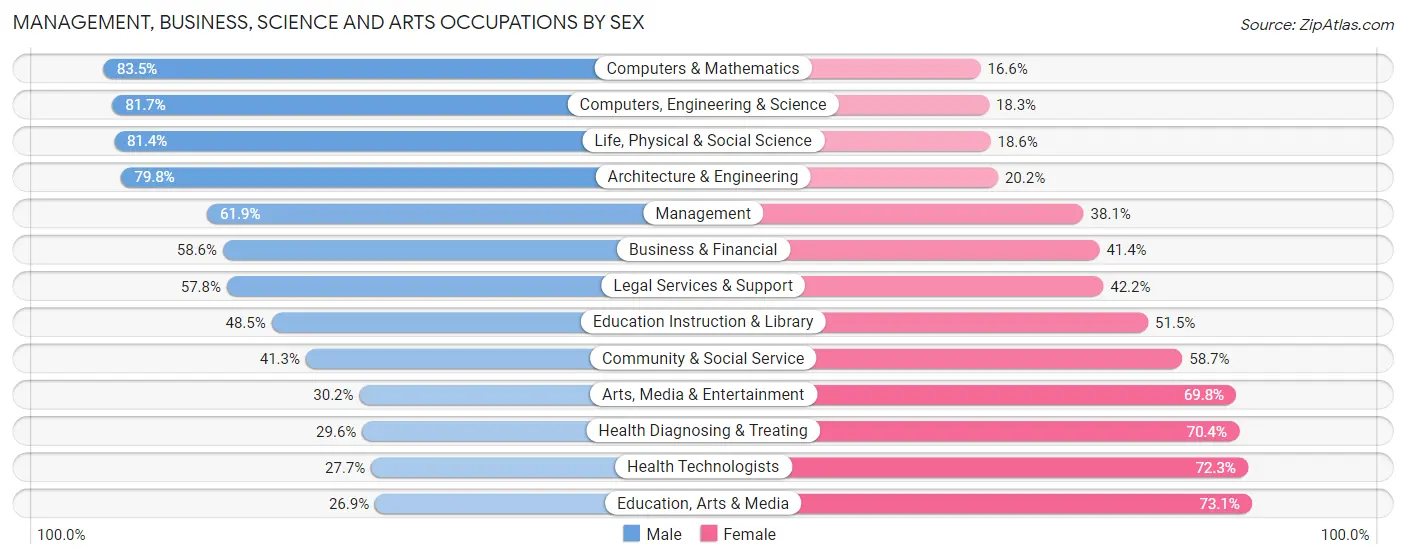
Management, Business, Science and Arts Occupations by Sex
Within the Management, Business, Science and Arts occupations in Fountain Hills, the most male-oriented occupations are Computers & Mathematics (83.5%), Computers, Engineering & Science (81.7%), and Life, Physical & Social Science (81.4%), while the most female-oriented occupations are Education, Arts & Media (73.1%), Health Technologists (72.3%), and Health Diagnosing & Treating (70.4%).
| Occupation | Male | Female |
| Management | 1,103 (61.9%) | 678 (38.1%) |
| Business & Financial | 526 (58.6%) | 371 (41.4%) |
| Computers, Engineering & Science | 946 (81.7%) | 212 (18.3%) |
| Computers & Mathematics | 459 (83.5%) | 91 (16.6%) |
| Architecture & Engineering | 391 (79.8%) | 99 (20.2%) |
| Life, Physical & Social Science | 96 (81.4%) | 22 (18.6%) |
| Community & Social Service | 389 (41.3%) | 552 (58.7%) |
| Education, Arts & Media | 67 (26.9%) | 182 (73.1%) |
| Legal Services & Support | 48 (57.8%) | 35 (42.2%) |
| Education Instruction & Library | 239 (48.5%) | 254 (51.5%) |
| Arts, Media & Entertainment | 35 (30.2%) | 81 (69.8%) |
| Health Diagnosing & Treating | 181 (29.6%) | 431 (70.4%) |
| Health Technologists | 135 (27.7%) | 352 (72.3%) |
| Total (Category) | 3,145 (58.4%) | 2,244 (41.6%) |
| Total (Overall) | 5,759 (54.5%) | 4,805 (45.5%) |
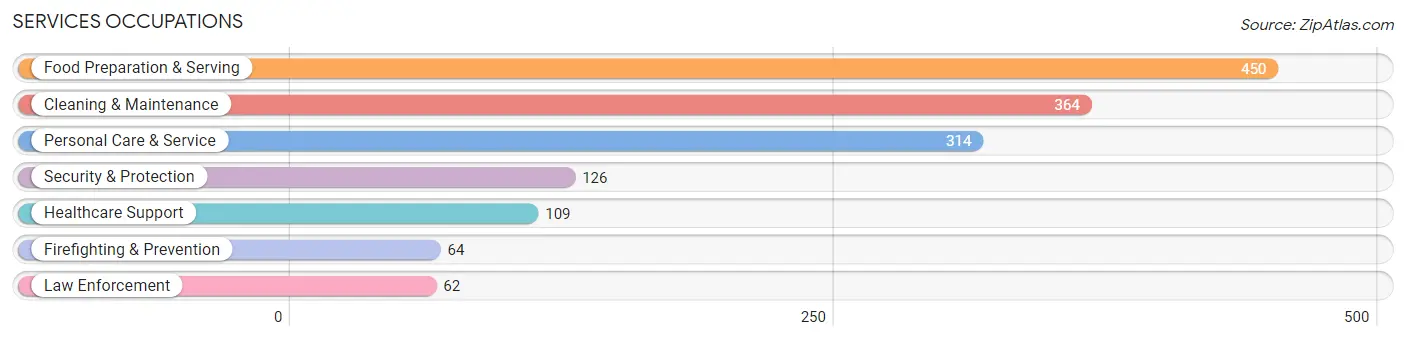
Services Occupations
The most common Services occupations in Fountain Hills are Food Preparation & Serving (450 | 4.3%), Cleaning & Maintenance (364 | 3.5%), Personal Care & Service (314 | 3.0%), Security & Protection (126 | 1.2%), and Healthcare Support (109 | 1.0%).
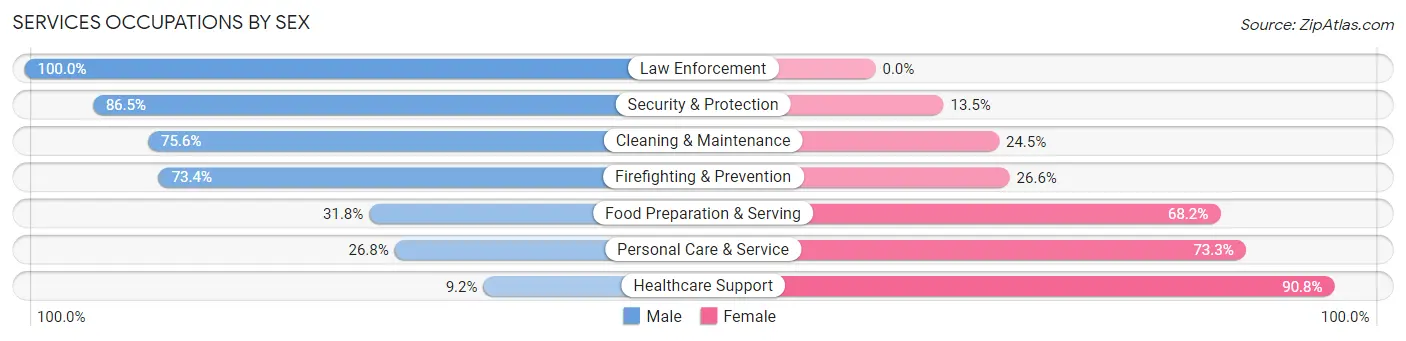
Services Occupations by Sex
Within the Services occupations in Fountain Hills, the most male-oriented occupations are Law Enforcement (100.0%), Security & Protection (86.5%), and Cleaning & Maintenance (75.5%), while the most female-oriented occupations are Healthcare Support (90.8%), Personal Care & Service (73.3%), and Food Preparation & Serving (68.2%).
| Occupation | Male | Female |
| Healthcare Support | 10 (9.2%) | 99 (90.8%) |
| Security & Protection | 109 (86.5%) | 17 (13.5%) |
| Firefighting & Prevention | 47 (73.4%) | 17 (26.6%) |
| Law Enforcement | 62 (100.0%) | 0 (0.0%) |
| Food Preparation & Serving | 143 (31.8%) | 307 (68.2%) |
| Cleaning & Maintenance | 275 (75.5%) | 89 (24.4%) |
| Personal Care & Service | 84 (26.8%) | 230 (73.3%) |
| Total (Category) | 621 (45.6%) | 742 (54.4%) |
| Total (Overall) | 5,759 (54.5%) | 4,805 (45.5%) |
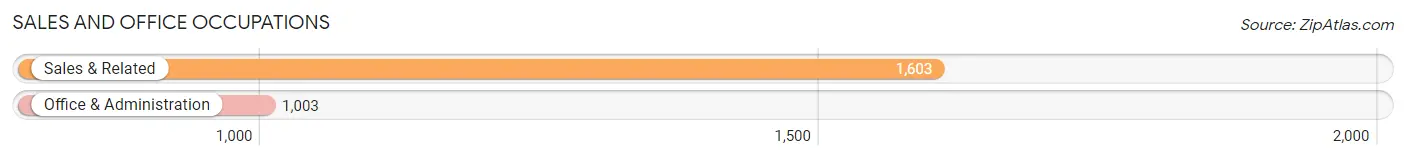
Sales and Office Occupations
The most common Sales and Office occupations in Fountain Hills are Sales & Related (1,603 | 15.2%), and Office & Administration (1,003 | 9.5%).
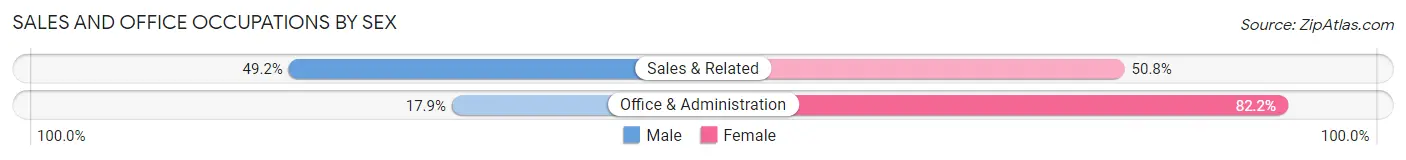
Sales and Office Occupations by Sex
| Occupation | Male | Female |
| Sales & Related | 789 (49.2%) | 814 (50.8%) |
| Office & Administration | 179 (17.8%) | 824 (82.2%) |
| Total (Category) | 968 (37.1%) | 1,638 (62.8%) |
| Total (Overall) | 5,759 (54.5%) | 4,805 (45.5%) |
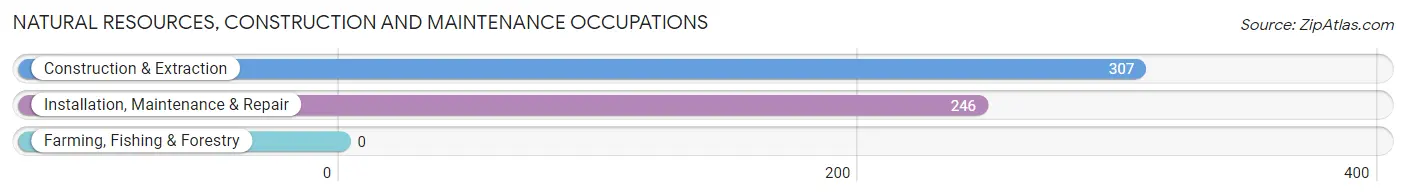
Natural Resources, Construction and Maintenance Occupations
The most common Natural Resources, Construction and Maintenance occupations in Fountain Hills are Construction & Extraction (307 | 2.9%), and Installation, Maintenance & Repair (246 | 2.3%).
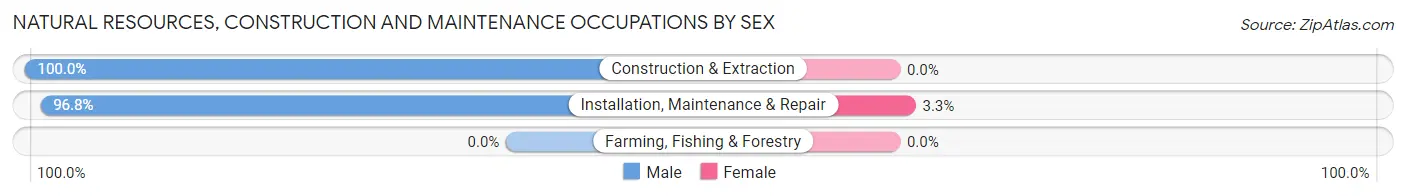
Natural Resources, Construction and Maintenance Occupations by Sex
| Occupation | Male | Female |
| Farming, Fishing & Forestry | 0 (0.0%) | 0 (0.0%) |
| Construction & Extraction | 307 (100.0%) | 0 (0.0%) |
| Installation, Maintenance & Repair | 238 (96.8%) | 8 (3.3%) |
| Total (Category) | 545 (98.6%) | 8 (1.5%) |
| Total (Overall) | 5,759 (54.5%) | 4,805 (45.5%) |
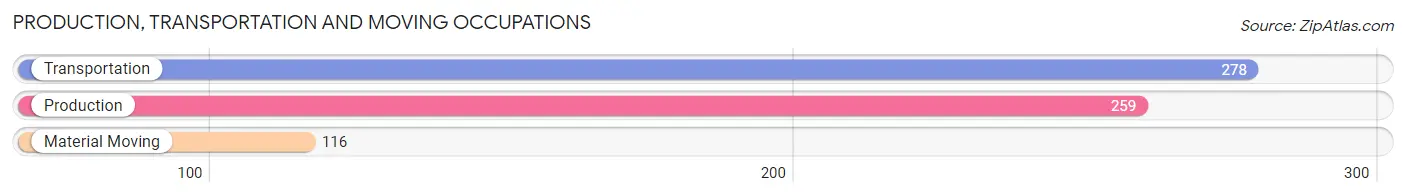
Production, Transportation and Moving Occupations
The most common Production, Transportation and Moving occupations in Fountain Hills are Transportation (278 | 2.6%), Production (259 | 2.5%), and Material Moving (116 | 1.1%).
Production, Transportation and Moving Occupations by Sex
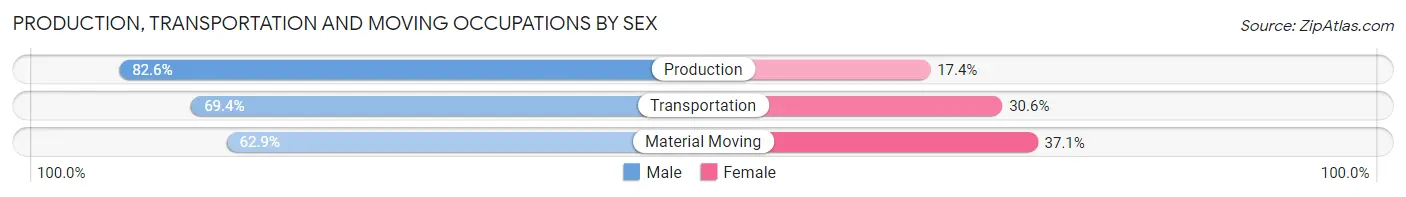
| Occupation | Male | Female |
| Production | 214 (82.6%) | 45 (17.4%) |
| Transportation | 193 (69.4%) | 85 (30.6%) |
| Material Moving | 73 (62.9%) | 43 (37.1%) |
| Total (Category) | 480 (73.5%) | 173 (26.5%) |
| Total (Overall) | 5,759 (54.5%) | 4,805 (45.5%) |
Employment Industries by Sex in Fountain Hills
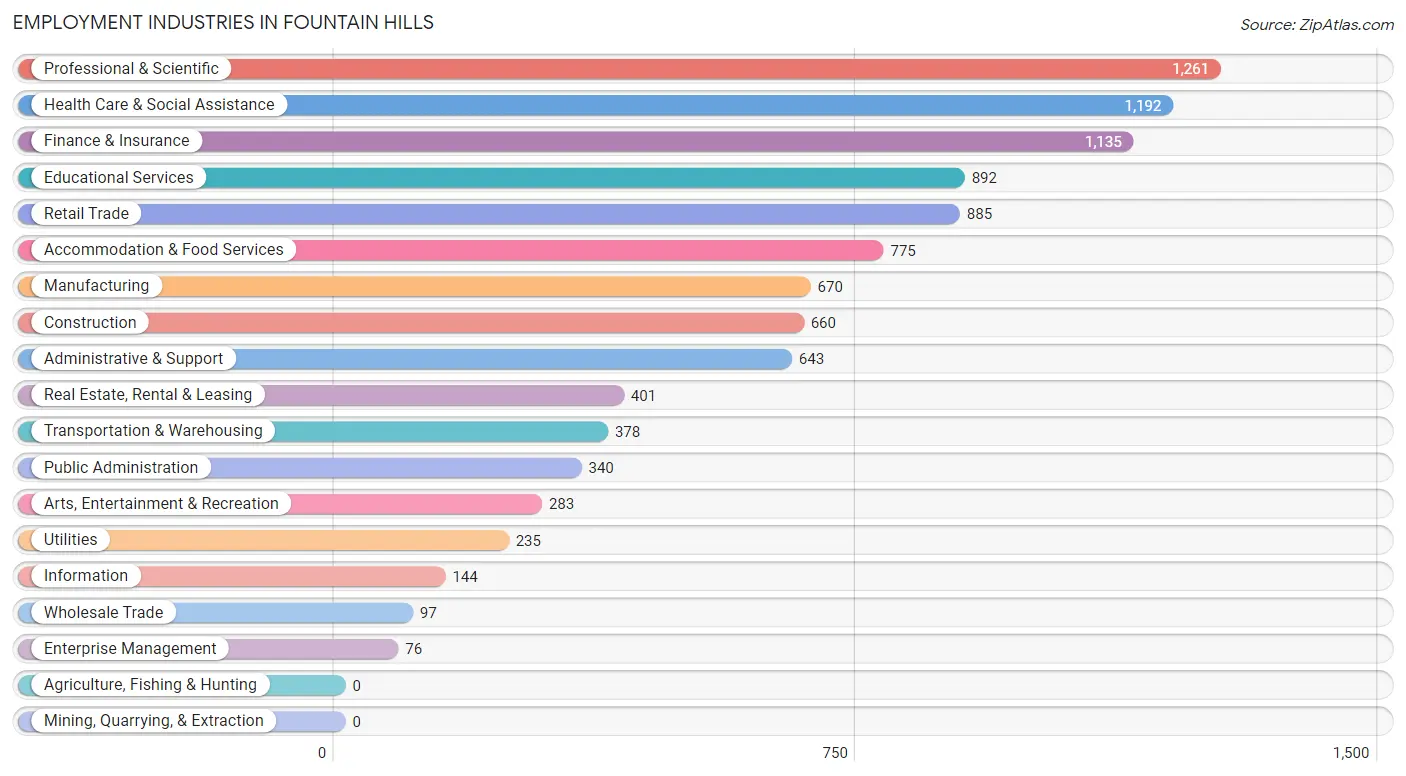
Employment Industries in Fountain Hills
The major employment industries in Fountain Hills include Professional & Scientific (1,261 | 11.9%), Health Care & Social Assistance (1,192 | 11.3%), Finance & Insurance (1,135 | 10.7%), Educational Services (892 | 8.4%), and Retail Trade (885 | 8.4%).
Employment Industries by Sex in Fountain Hills
The Fountain Hills industries that see more men than women are Enterprise Management (100.0%), Utilities (88.1%), and Construction (79.8%), whereas the industries that tend to have a higher number of women are Educational Services (68.0%), Health Care & Social Assistance (64.7%), and Arts, Entertainment & Recreation (63.6%).
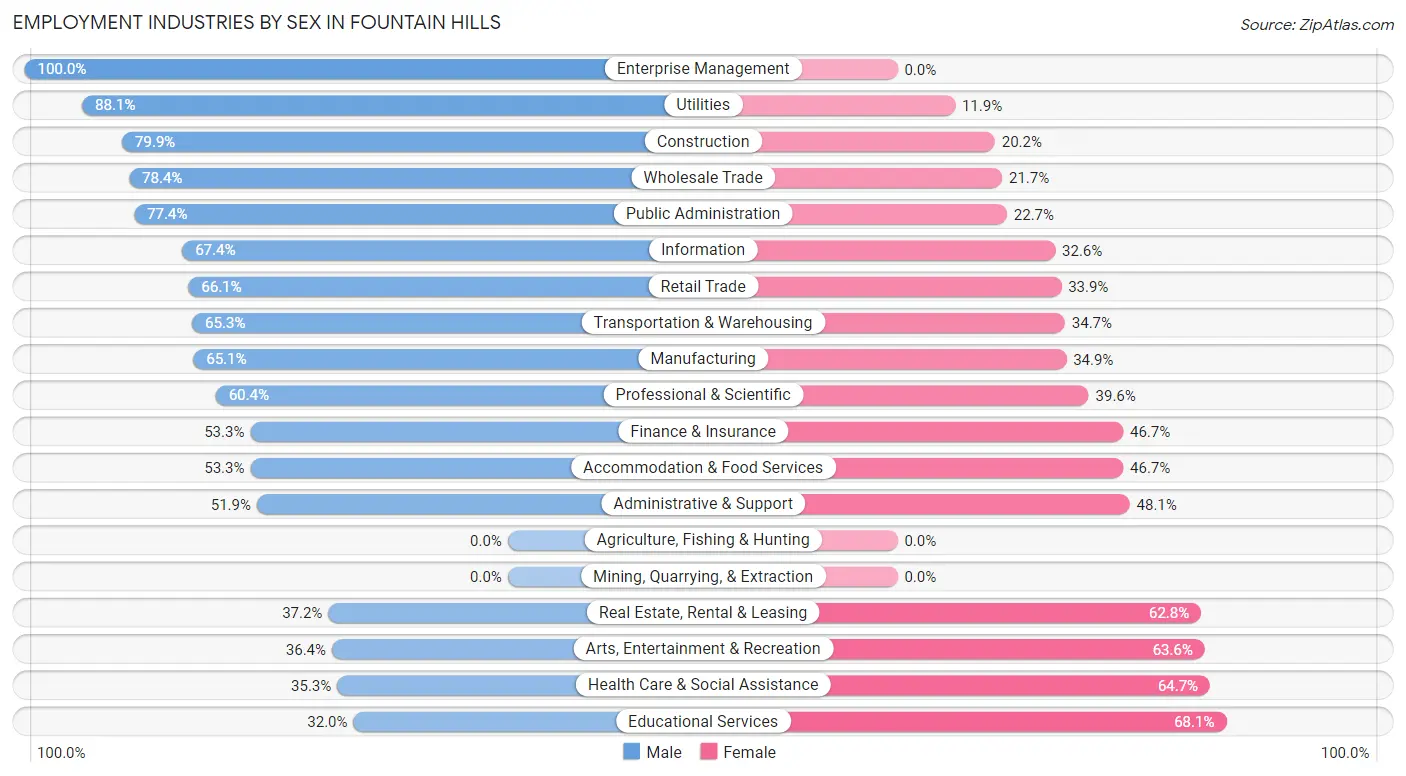
| Industry | Male | Female |
| Agriculture, Fishing & Hunting | 0 (0.0%) | 0 (0.0%) |
| Mining, Quarrying, & Extraction | 0 (0.0%) | 0 (0.0%) |
| Construction | 527 (79.8%) | 133 (20.2%) |
| Manufacturing | 436 (65.1%) | 234 (34.9%) |
| Wholesale Trade | 76 (78.3%) | 21 (21.6%) |
| Retail Trade | 585 (66.1%) | 300 (33.9%) |
| Transportation & Warehousing | 247 (65.3%) | 131 (34.7%) |
| Utilities | 207 (88.1%) | 28 (11.9%) |
| Information | 97 (67.4%) | 47 (32.6%) |
| Finance & Insurance | 605 (53.3%) | 530 (46.7%) |
| Real Estate, Rental & Leasing | 149 (37.2%) | 252 (62.8%) |
| Professional & Scientific | 762 (60.4%) | 499 (39.6%) |
| Enterprise Management | 76 (100.0%) | 0 (0.0%) |
| Administrative & Support | 334 (51.9%) | 309 (48.1%) |
| Educational Services | 285 (32.0%) | 607 (68.0%) |
| Health Care & Social Assistance | 421 (35.3%) | 771 (64.7%) |
| Arts, Entertainment & Recreation | 103 (36.4%) | 180 (63.6%) |
| Accommodation & Food Services | 413 (53.3%) | 362 (46.7%) |
| Public Administration | 263 (77.3%) | 77 (22.7%) |
| Total | 5,759 (54.5%) | 4,805 (45.5%) |
Education in Fountain Hills
School Enrollment in Fountain Hills
The most common levels of schooling among the 3,259 students in Fountain Hills are middle school (709 | 21.8%), elementary school (700 | 21.5%), and high school (687 | 21.1%).
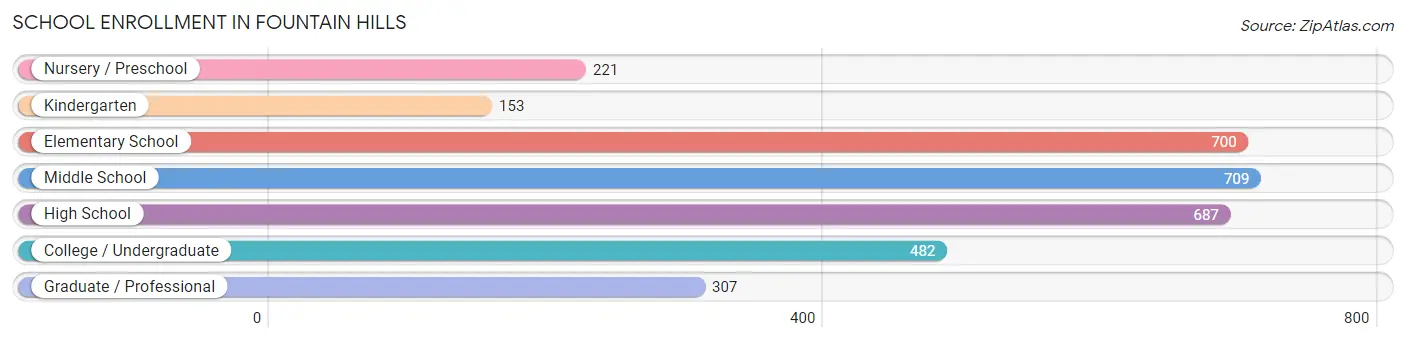
| School Level | # Students | % Students |
| Nursery / Preschool | 221 | 6.8% |
| Kindergarten | 153 | 4.7% |
| Elementary School | 700 | 21.5% |
| Middle School | 709 | 21.8% |
| High School | 687 | 21.1% |
| College / Undergraduate | 482 | 14.8% |
| Graduate / Professional | 307 | 9.4% |
| Total | 3,259 | 100.0% |
School Enrollment by Age by Funding Source in Fountain Hills
Out of a total of 3,259 students who are enrolled in schools in Fountain Hills, 825 (25.3%) attend a private institution, while the remaining 2,434 (74.7%) are enrolled in public schools. The age group of 3 to 4 year olds has the highest likelihood of being enrolled in private schools, with 118 (58.1% in the age bracket) enrolled. Conversely, the age group of 18 to 19 year olds has the lowest likelihood of being enrolled in a private school, with 207 (92.8% in the age bracket) attending a public institution.
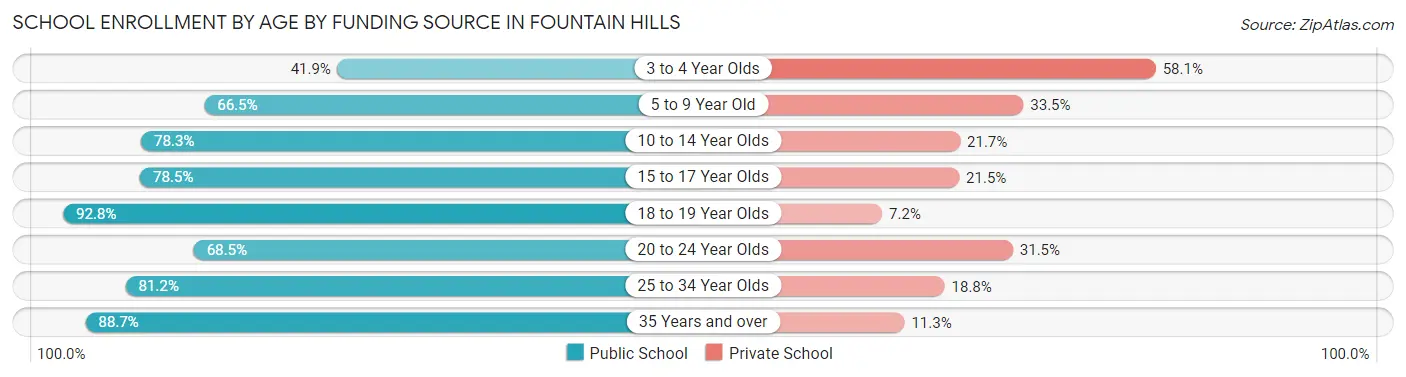
| Age Bracket | Public School | Private School |
| 3 to 4 Year Olds | 85 (41.9%) | 118 (58.1%) |
| 5 to 9 Year Old | 497 (66.5%) | 250 (33.5%) |
| 10 to 14 Year Olds | 704 (78.3%) | 195 (21.7%) |
| 15 to 17 Year Olds | 405 (78.5%) | 111 (21.5%) |
| 18 to 19 Year Olds | 207 (92.8%) | 16 (7.2%) |
| 20 to 24 Year Olds | 163 (68.5%) | 75 (31.5%) |
| 25 to 34 Year Olds | 108 (81.2%) | 25 (18.8%) |
| 35 Years and over | 266 (88.7%) | 34 (11.3%) |
| Total | 2,434 (74.7%) | 825 (25.3%) |
Educational Attainment by Field of Study in Fountain Hills
Business (2,506 | 23.7%), science & technology (1,258 | 11.9%), engineering (1,218 | 11.5%), education (1,128 | 10.7%), and social sciences (589 | 5.6%) are the most common fields of study among 10,555 individuals in Fountain Hills who have obtained a bachelor's degree or higher.
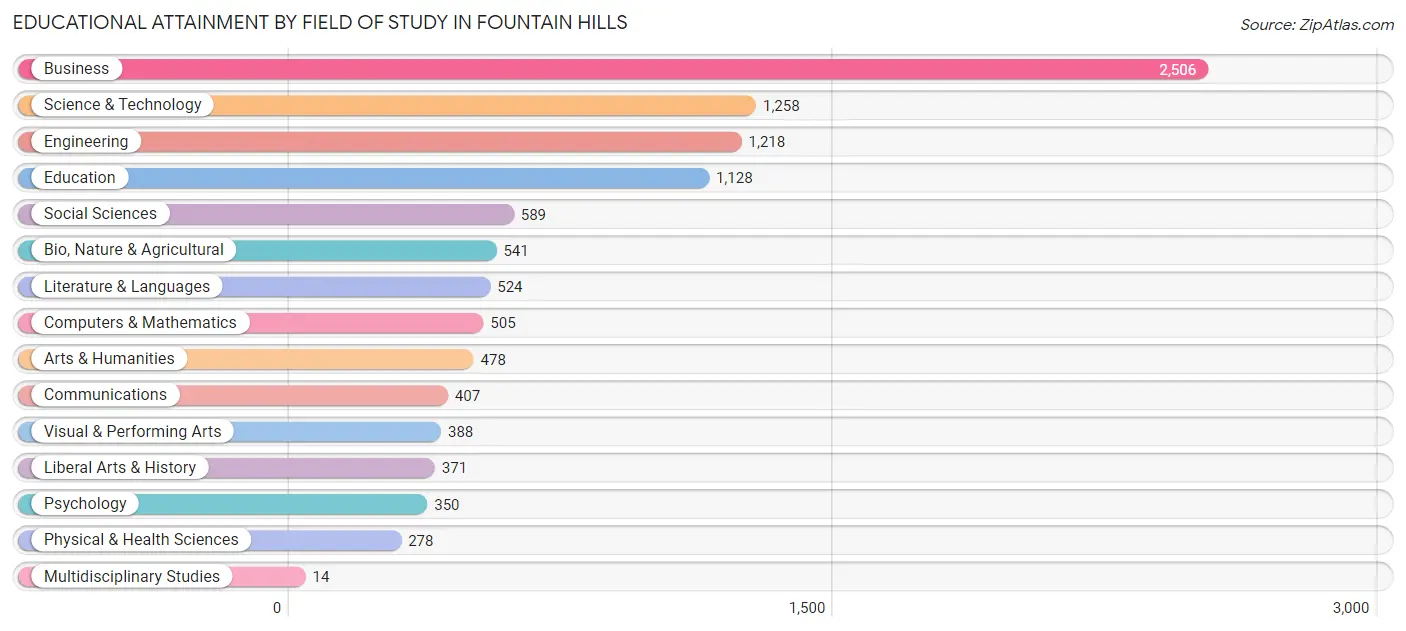
| Field of Study | # Graduates | % Graduates |
| Computers & Mathematics | 505 | 4.8% |
| Bio, Nature & Agricultural | 541 | 5.1% |
| Physical & Health Sciences | 278 | 2.6% |
| Psychology | 350 | 3.3% |
| Social Sciences | 589 | 5.6% |
| Engineering | 1,218 | 11.5% |
| Multidisciplinary Studies | 14 | 0.1% |
| Science & Technology | 1,258 | 11.9% |
| Business | 2,506 | 23.7% |
| Education | 1,128 | 10.7% |
| Literature & Languages | 524 | 5.0% |
| Liberal Arts & History | 371 | 3.5% |
| Visual & Performing Arts | 388 | 3.7% |
| Communications | 407 | 3.9% |
| Arts & Humanities | 478 | 4.5% |
| Total | 10,555 | 100.0% |
Transportation & Commute in Fountain Hills
Vehicle Availability by Sex in Fountain Hills
The most prevalent vehicle ownership categories in Fountain Hills are males with 2 vehicles (2,746, accounting for 48.4%) and females with 2 vehicles (2,123, making up 57.8%).
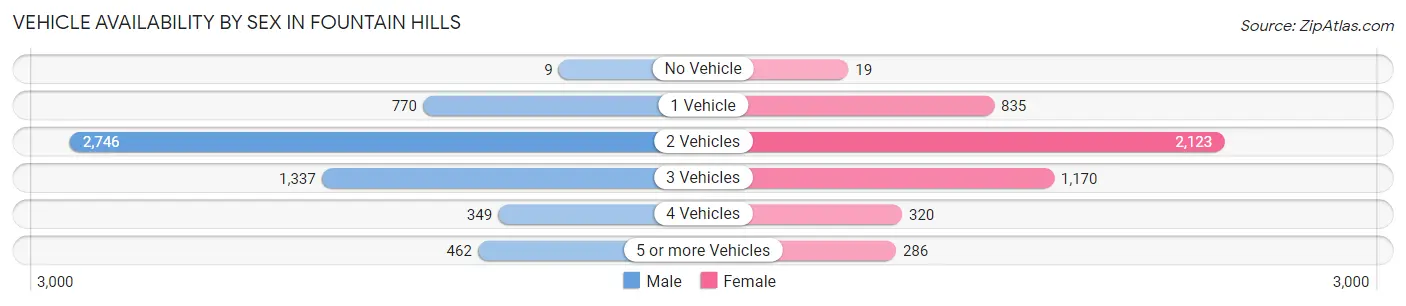
| Vehicles Available | Male | Female |
| No Vehicle | 9 (0.2%) | 19 (0.4%) |
| 1 Vehicle | 770 (13.6%) | 835 (17.6%) |
| 2 Vehicles | 2,746 (48.4%) | 2,123 (44.7%) |
| 3 Vehicles | 1,337 (23.6%) | 1,170 (24.6%) |
| 4 Vehicles | 349 (6.1%) | 320 (6.7%) |
| 5 or more Vehicles | 462 (8.1%) | 286 (6.0%) |
| Total | 5,673 (100.0%) | 4,753 (100.0%) |
Commute Time in Fountain Hills
The most frequently occuring commute durations in Fountain Hills are 30 to 34 minutes (1,146 commuters, 15.0%), 10 to 14 minutes (1,016 commuters, 13.3%), and 5 to 9 minutes (868 commuters, 11.4%).
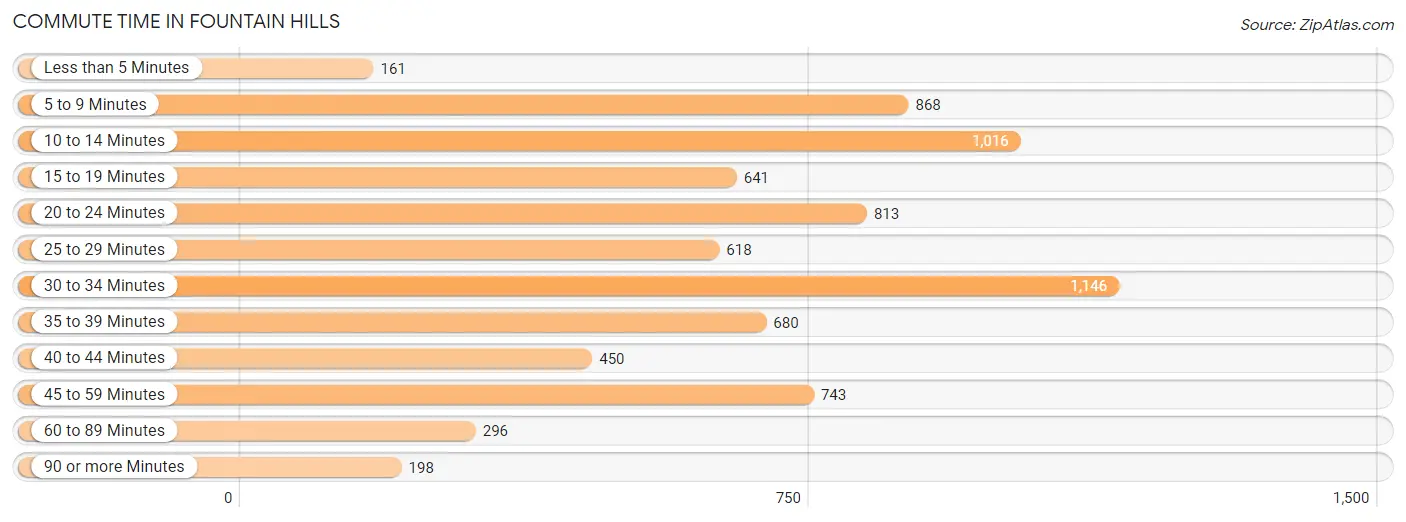
| Commute Time | # Commuters | % Commuters |
| Less than 5 Minutes | 161 | 2.1% |
| 5 to 9 Minutes | 868 | 11.4% |
| 10 to 14 Minutes | 1,016 | 13.3% |
| 15 to 19 Minutes | 641 | 8.4% |
| 20 to 24 Minutes | 813 | 10.7% |
| 25 to 29 Minutes | 618 | 8.1% |
| 30 to 34 Minutes | 1,146 | 15.0% |
| 35 to 39 Minutes | 680 | 8.9% |
| 40 to 44 Minutes | 450 | 5.9% |
| 45 to 59 Minutes | 743 | 9.7% |
| 60 to 89 Minutes | 296 | 3.9% |
| 90 or more Minutes | 198 | 2.6% |
Commute Time by Sex in Fountain Hills
The most common commute times in Fountain Hills are 30 to 34 minutes (798 commuters, 18.9%) for males and 5 to 9 minutes (589 commuters, 17.3%) for females.
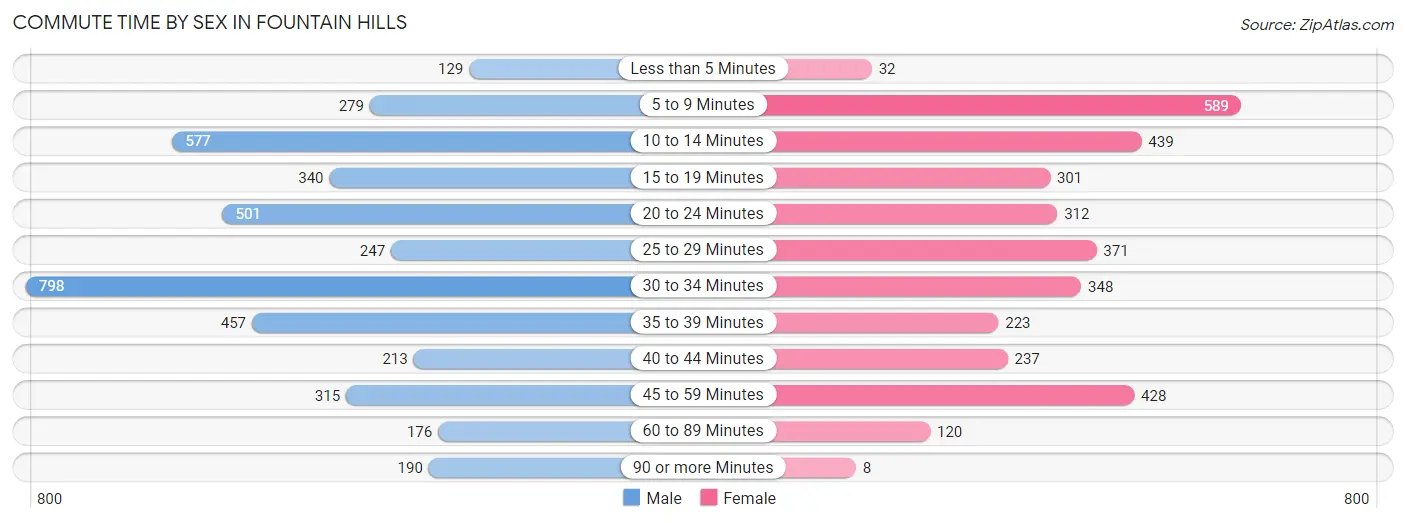
| Commute Time | Male | Female |
| Less than 5 Minutes | 129 (3.1%) | 32 (0.9%) |
| 5 to 9 Minutes | 279 (6.6%) | 589 (17.3%) |
| 10 to 14 Minutes | 577 (13.7%) | 439 (12.9%) |
| 15 to 19 Minutes | 340 (8.1%) | 301 (8.8%) |
| 20 to 24 Minutes | 501 (11.9%) | 312 (9.1%) |
| 25 to 29 Minutes | 247 (5.9%) | 371 (10.9%) |
| 30 to 34 Minutes | 798 (18.9%) | 348 (10.2%) |
| 35 to 39 Minutes | 457 (10.8%) | 223 (6.5%) |
| 40 to 44 Minutes | 213 (5.1%) | 237 (7.0%) |
| 45 to 59 Minutes | 315 (7.5%) | 428 (12.6%) |
| 60 to 89 Minutes | 176 (4.2%) | 120 (3.5%) |
| 90 or more Minutes | 190 (4.5%) | 8 (0.2%) |
Time of Departure to Work by Sex in Fountain Hills
The most frequent times of departure to work in Fountain Hills are 7:30 AM to 7:59 AM (579, 13.7%) for males and 7:30 AM to 7:59 AM (693, 20.3%) for females.
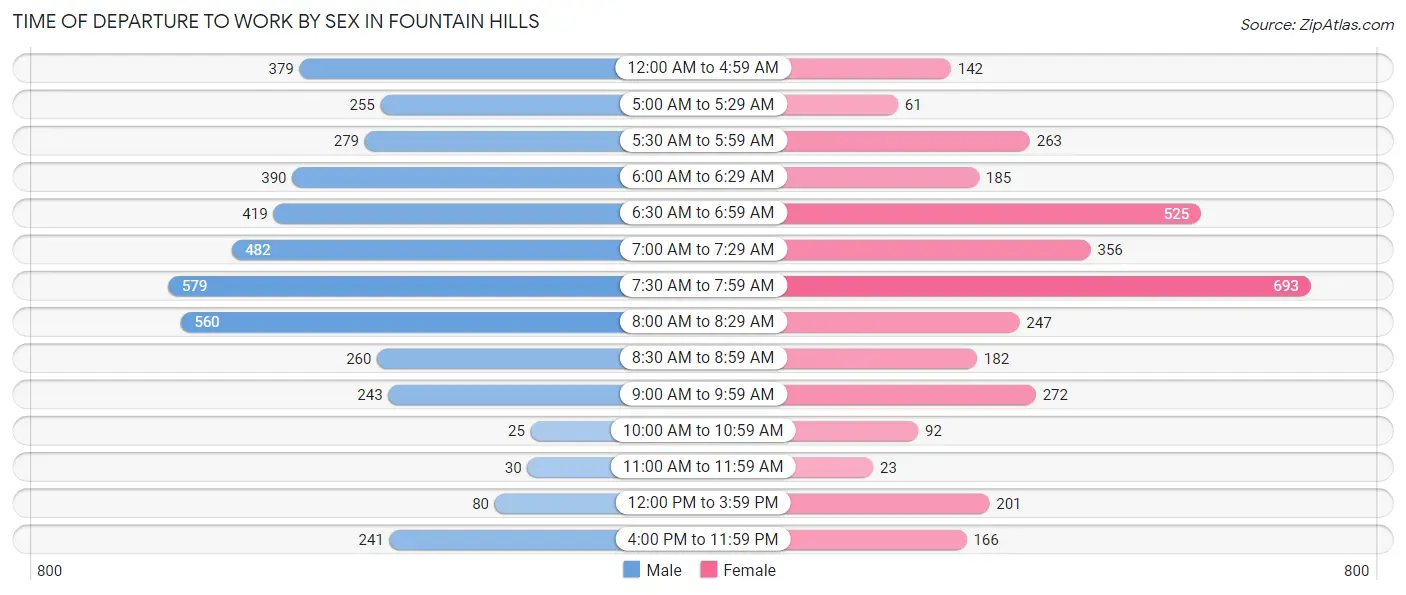
| Time of Departure | Male | Female |
| 12:00 AM to 4:59 AM | 379 (9.0%) | 142 (4.2%) |
| 5:00 AM to 5:29 AM | 255 (6.0%) | 61 (1.8%) |
| 5:30 AM to 5:59 AM | 279 (6.6%) | 263 (7.7%) |
| 6:00 AM to 6:29 AM | 390 (9.2%) | 185 (5.4%) |
| 6:30 AM to 6:59 AM | 419 (9.9%) | 525 (15.4%) |
| 7:00 AM to 7:29 AM | 482 (11.4%) | 356 (10.4%) |
| 7:30 AM to 7:59 AM | 579 (13.7%) | 693 (20.3%) |
| 8:00 AM to 8:29 AM | 560 (13.3%) | 247 (7.2%) |
| 8:30 AM to 8:59 AM | 260 (6.2%) | 182 (5.3%) |
| 9:00 AM to 9:59 AM | 243 (5.8%) | 272 (8.0%) |
| 10:00 AM to 10:59 AM | 25 (0.6%) | 92 (2.7%) |
| 11:00 AM to 11:59 AM | 30 (0.7%) | 23 (0.7%) |
| 12:00 PM to 3:59 PM | 80 (1.9%) | 201 (5.9%) |
| 4:00 PM to 11:59 PM | 241 (5.7%) | 166 (4.9%) |
| Total | 4,222 (100.0%) | 3,408 (100.0%) |
Housing Occupancy in Fountain Hills
Occupancy by Ownership in Fountain Hills
Of the total 11,092 dwellings in Fountain Hills, owner-occupied units account for 9,416 (84.9%), while renter-occupied units make up 1,676 (15.1%).
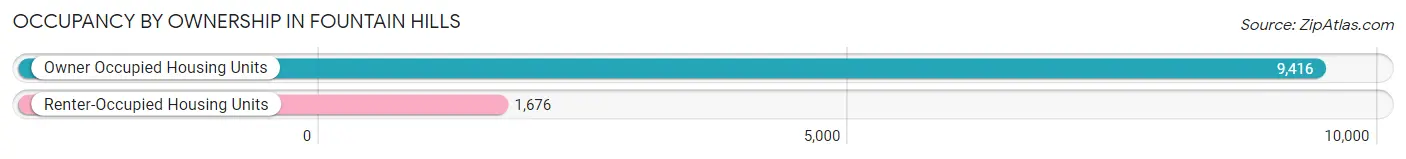
| Occupancy | # Housing Units | % Housing Units |
| Owner Occupied Housing Units | 9,416 | 84.9% |
| Renter-Occupied Housing Units | 1,676 | 15.1% |
| Total Occupied Housing Units | 11,092 | 100.0% |
Occupancy by Household Size in Fountain Hills
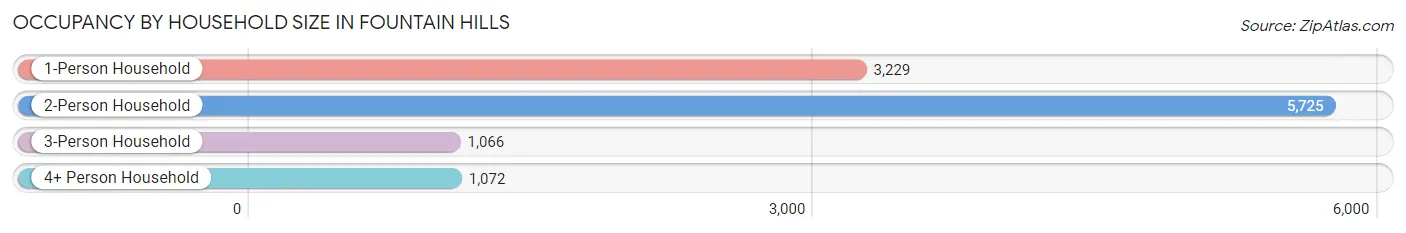
| Household Size | # Housing Units | % Housing Units |
| 1-Person Household | 3,229 | 29.1% |
| 2-Person Household | 5,725 | 51.6% |
| 3-Person Household | 1,066 | 9.6% |
| 4+ Person Household | 1,072 | 9.7% |
| Total Housing Units | 11,092 | 100.0% |
Occupancy by Ownership by Household Size in Fountain Hills
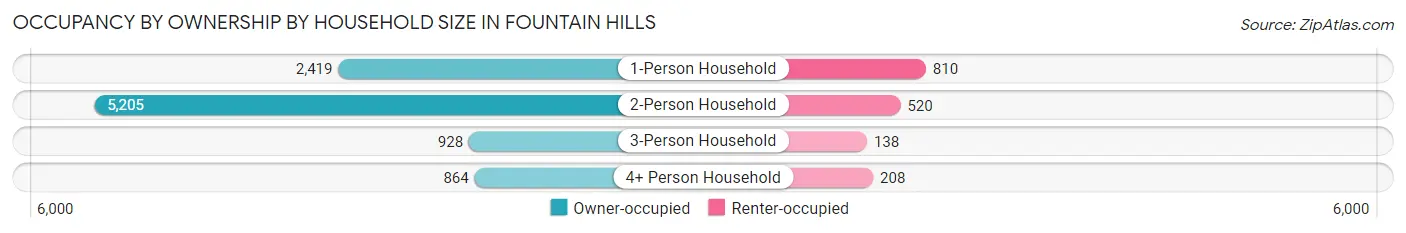
| Household Size | Owner-occupied | Renter-occupied |
| 1-Person Household | 2,419 (74.9%) | 810 (25.1%) |
| 2-Person Household | 5,205 (90.9%) | 520 (9.1%) |
| 3-Person Household | 928 (87.1%) | 138 (13.0%) |
| 4+ Person Household | 864 (80.6%) | 208 (19.4%) |
| Total Housing Units | 9,416 (84.9%) | 1,676 (15.1%) |
Occupancy by Educational Attainment in Fountain Hills
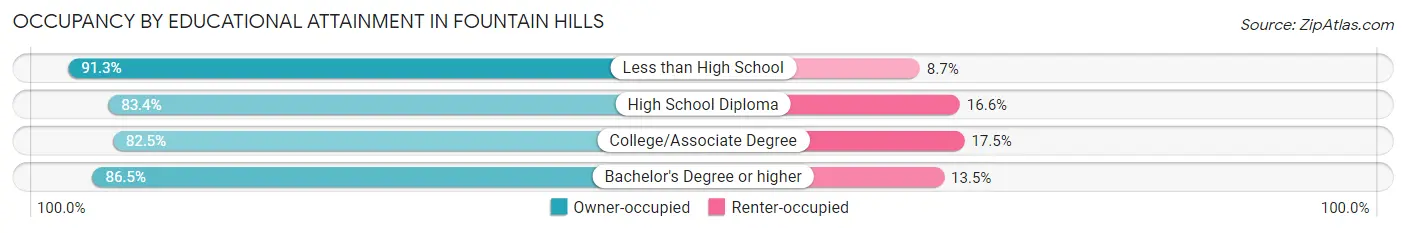
| Household Size | Owner-occupied | Renter-occupied |
| Less than High School | 137 (91.3%) | 13 (8.7%) |
| High School Diploma | 1,276 (83.4%) | 254 (16.6%) |
| College/Associate Degree | 2,873 (82.5%) | 610 (17.5%) |
| Bachelor's Degree or higher | 5,130 (86.5%) | 799 (13.5%) |
Occupancy by Age of Householder in Fountain Hills
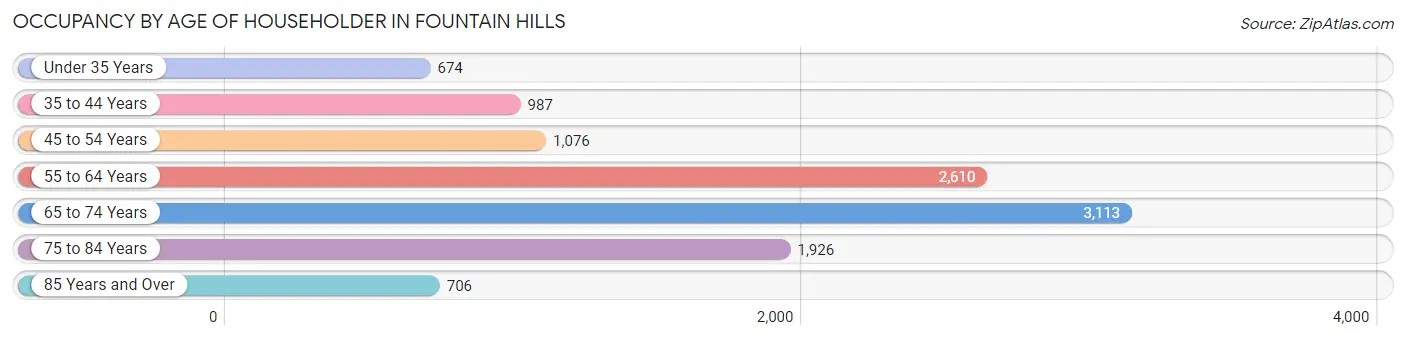
| Age Bracket | # Households | % Households |
| Under 35 Years | 674 | 6.1% |
| 35 to 44 Years | 987 | 8.9% |
| 45 to 54 Years | 1,076 | 9.7% |
| 55 to 64 Years | 2,610 | 23.5% |
| 65 to 74 Years | 3,113 | 28.1% |
| 75 to 84 Years | 1,926 | 17.4% |
| 85 Years and Over | 706 | 6.4% |
| Total | 11,092 | 100.0% |
Housing Finances in Fountain Hills
Median Income by Occupancy in Fountain Hills
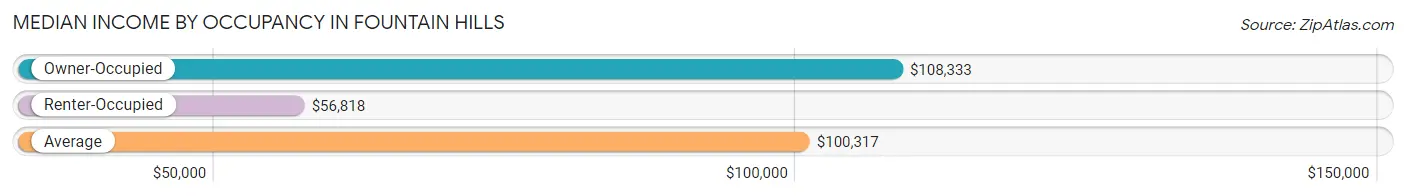
| Occupancy Type | # Households | Median Income |
| Owner-Occupied | 9,416 (84.9%) | $108,333 |
| Renter-Occupied | 1,676 (15.1%) | $56,818 |
| Average | 11,092 (100.0%) | $100,317 |
Occupancy by Householder Income Bracket in Fountain Hills
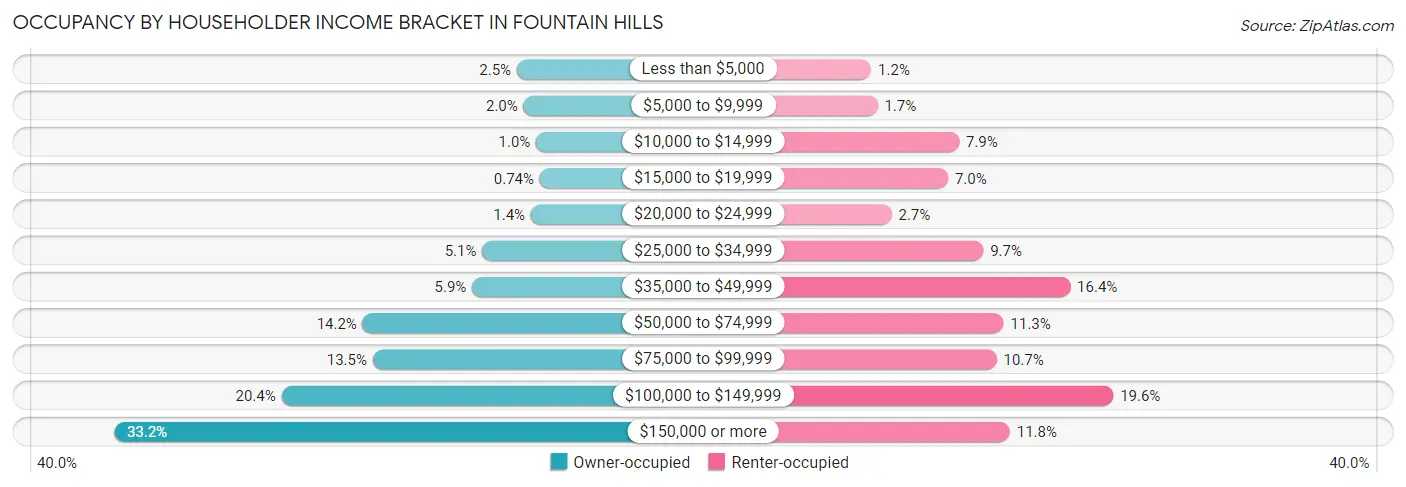
| Income Bracket | Owner-occupied | Renter-occupied |
| Less than $5,000 | 234 (2.5%) | 20 (1.2%) |
| $5,000 to $9,999 | 186 (2.0%) | 28 (1.7%) |
| $10,000 to $14,999 | 96 (1.0%) | 132 (7.9%) |
| $15,000 to $19,999 | 70 (0.7%) | 118 (7.0%) |
| $20,000 to $24,999 | 134 (1.4%) | 46 (2.7%) |
| $25,000 to $34,999 | 483 (5.1%) | 163 (9.7%) |
| $35,000 to $49,999 | 556 (5.9%) | 274 (16.4%) |
| $50,000 to $74,999 | 1,341 (14.2%) | 189 (11.3%) |
| $75,000 to $99,999 | 1,268 (13.5%) | 180 (10.7%) |
| $100,000 to $149,999 | 1,923 (20.4%) | 329 (19.6%) |
| $150,000 or more | 3,125 (33.2%) | 197 (11.7%) |
| Total | 9,416 (100.0%) | 1,676 (100.0%) |
Monthly Housing Cost Tiers in Fountain Hills
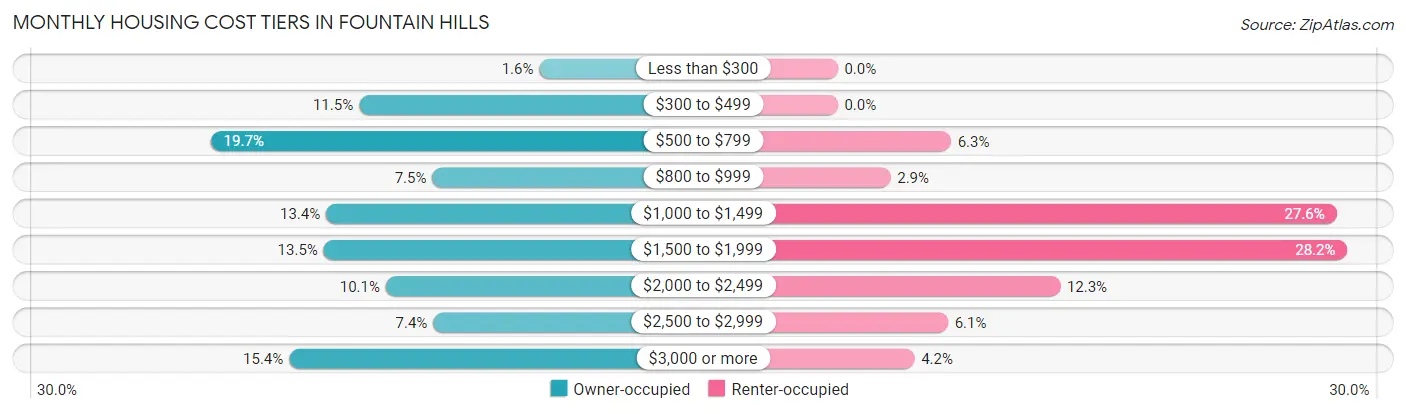
| Monthly Cost | Owner-occupied | Renter-occupied |
| Less than $300 | 148 (1.6%) | 0 (0.0%) |
| $300 to $499 | 1,086 (11.5%) | 0 (0.0%) |
| $500 to $799 | 1,857 (19.7%) | 105 (6.3%) |
| $800 to $999 | 704 (7.5%) | 49 (2.9%) |
| $1,000 to $1,499 | 1,257 (13.4%) | 462 (27.6%) |
| $1,500 to $1,999 | 1,269 (13.5%) | 472 (28.2%) |
| $2,000 to $2,499 | 946 (10.1%) | 206 (12.3%) |
| $2,500 to $2,999 | 700 (7.4%) | 102 (6.1%) |
| $3,000 or more | 1,449 (15.4%) | 71 (4.2%) |
| Total | 9,416 (100.0%) | 1,676 (100.0%) |
Physical Housing Characteristics in Fountain Hills
Housing Structures in Fountain Hills
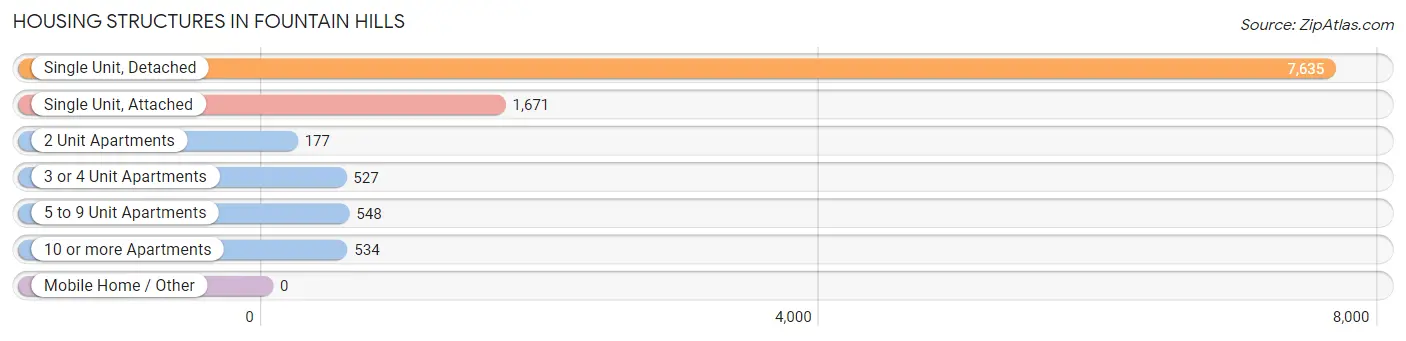
| Structure Type | # Housing Units | % Housing Units |
| Single Unit, Detached | 7,635 | 68.8% |
| Single Unit, Attached | 1,671 | 15.1% |
| 2 Unit Apartments | 177 | 1.6% |
| 3 or 4 Unit Apartments | 527 | 4.8% |
| 5 to 9 Unit Apartments | 548 | 4.9% |
| 10 or more Apartments | 534 | 4.8% |
| Mobile Home / Other | 0 | 0.0% |
| Total | 11,092 | 100.0% |
Housing Structures by Occupancy in Fountain Hills
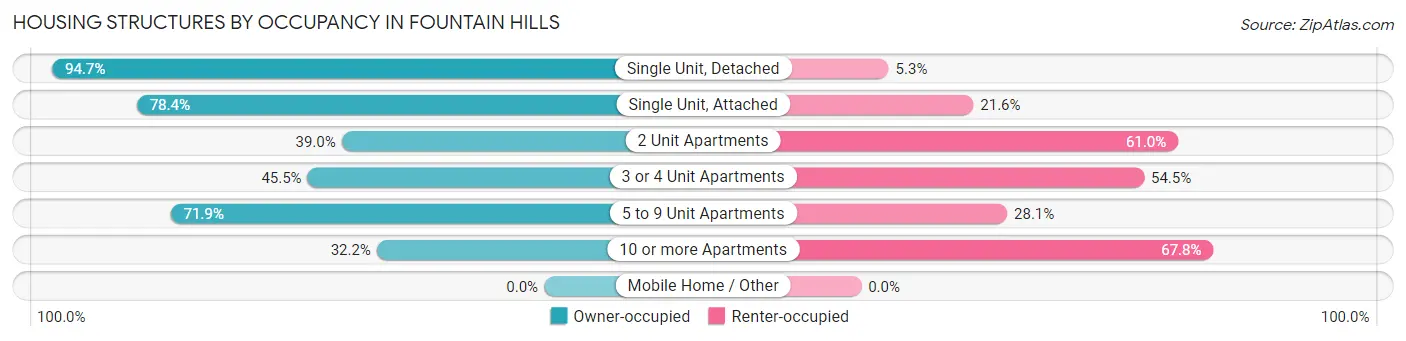
| Structure Type | Owner-occupied | Renter-occupied |
| Single Unit, Detached | 7,231 (94.7%) | 404 (5.3%) |
| Single Unit, Attached | 1,310 (78.4%) | 361 (21.6%) |
| 2 Unit Apartments | 69 (39.0%) | 108 (61.0%) |
| 3 or 4 Unit Apartments | 240 (45.5%) | 287 (54.5%) |
| 5 to 9 Unit Apartments | 394 (71.9%) | 154 (28.1%) |
| 10 or more Apartments | 172 (32.2%) | 362 (67.8%) |
| Mobile Home / Other | 0 (0.0%) | 0 (0.0%) |
| Total | 9,416 (84.9%) | 1,676 (15.1%) |
Housing Structures by Number of Rooms in Fountain Hills
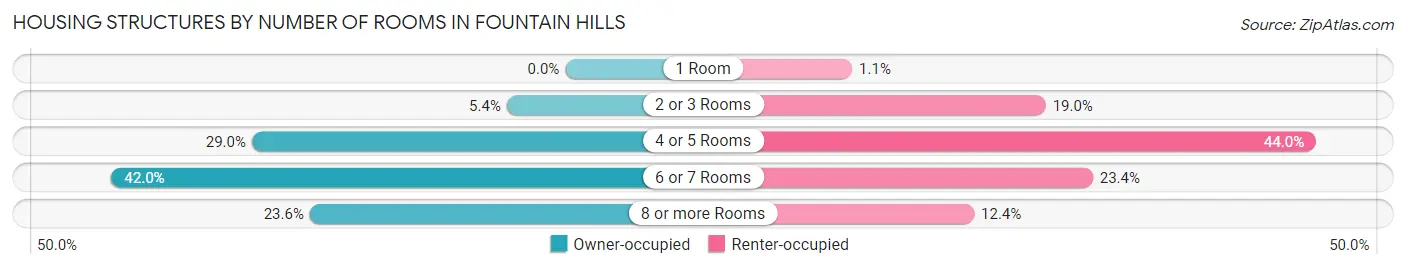
| Number of Rooms | Owner-occupied | Renter-occupied |
| 1 Room | 0 (0.0%) | 19 (1.1%) |
| 2 or 3 Rooms | 509 (5.4%) | 319 (19.0%) |
| 4 or 5 Rooms | 2,730 (29.0%) | 738 (44.0%) |
| 6 or 7 Rooms | 3,952 (42.0%) | 392 (23.4%) |
| 8 or more Rooms | 2,225 (23.6%) | 208 (12.4%) |
| Total | 9,416 (100.0%) | 1,676 (100.0%) |
Housing Structure by Heating Type in Fountain Hills
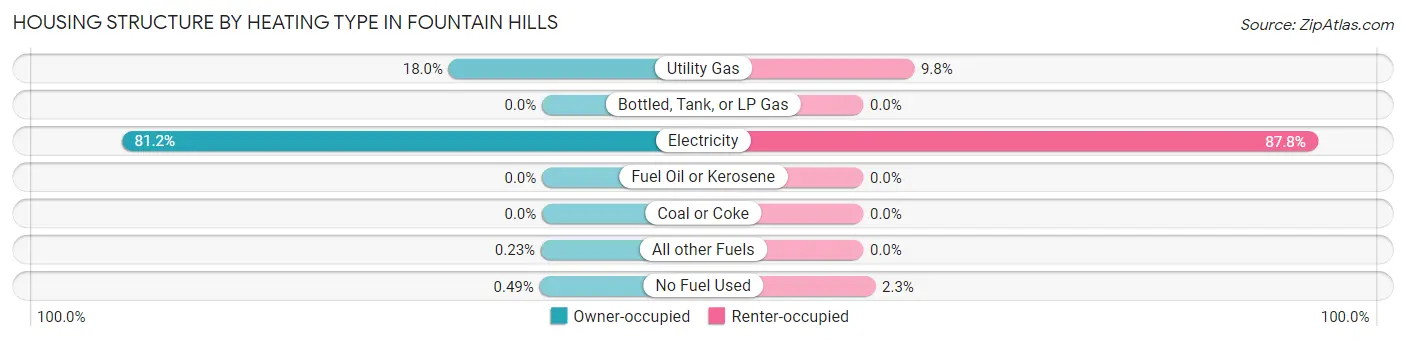
| Heating Type | Owner-occupied | Renter-occupied |
| Utility Gas | 1,698 (18.0%) | 165 (9.8%) |
| Bottled, Tank, or LP Gas | 0 (0.0%) | 0 (0.0%) |
| Electricity | 7,650 (81.2%) | 1,472 (87.8%) |
| Fuel Oil or Kerosene | 0 (0.0%) | 0 (0.0%) |
| Coal or Coke | 0 (0.0%) | 0 (0.0%) |
| All other Fuels | 22 (0.2%) | 0 (0.0%) |
| No Fuel Used | 46 (0.5%) | 39 (2.3%) |
| Total | 9,416 (100.0%) | 1,676 (100.0%) |
Household Vehicle Usage in Fountain Hills
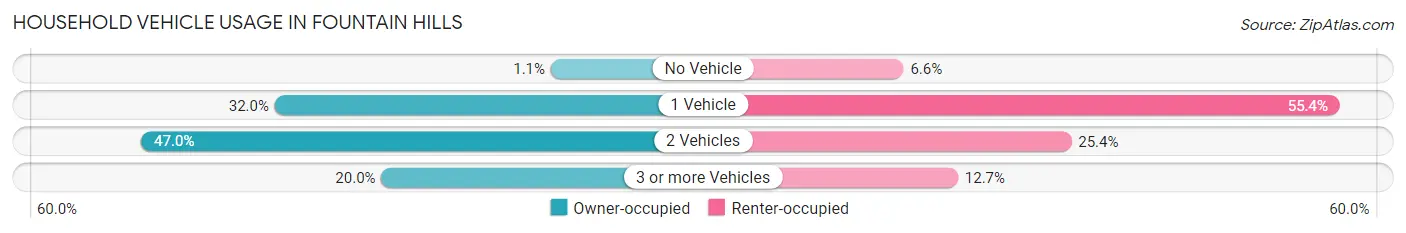
| Vehicles per Household | Owner-occupied | Renter-occupied |
| No Vehicle | 99 (1.1%) | 110 (6.6%) |
| 1 Vehicle | 3,010 (32.0%) | 929 (55.4%) |
| 2 Vehicles | 4,421 (46.9%) | 425 (25.4%) |
| 3 or more Vehicles | 1,886 (20.0%) | 212 (12.7%) |
| Total | 9,416 (100.0%) | 1,676 (100.0%) |
Real Estate & Mortgages in Fountain Hills
Real Estate and Mortgage Overview in Fountain Hills
| Characteristic | Without Mortgage | With Mortgage |
| Housing Units | 3,929 | 5,487 |
| Median Property Value | $484,600 | $544,000 |
| Median Household Income | $88,207 | $2,067 |
| Monthly Housing Costs | $591 | $1,449 |
| Real Estate Taxes | $2,475 | $0 |
Property Value by Mortgage Status in Fountain Hills
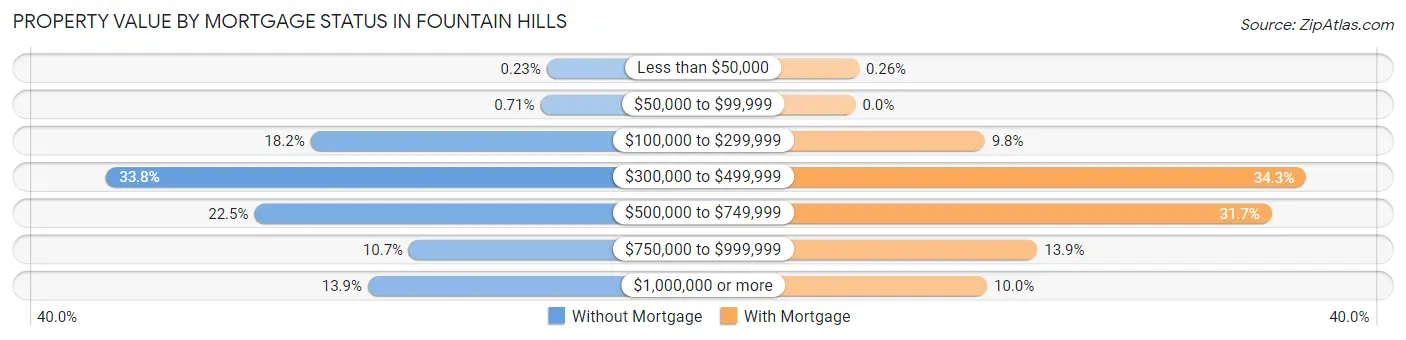
| Property Value | Without Mortgage | With Mortgage |
| Less than $50,000 | 9 (0.2%) | 14 (0.3%) |
| $50,000 to $99,999 | 28 (0.7%) | 0 (0.0%) |
| $100,000 to $299,999 | 716 (18.2%) | 540 (9.8%) |
| $300,000 to $499,999 | 1,327 (33.8%) | 1,883 (34.3%) |
| $500,000 to $749,999 | 884 (22.5%) | 1,740 (31.7%) |
| $750,000 to $999,999 | 421 (10.7%) | 760 (13.9%) |
| $1,000,000 or more | 544 (13.9%) | 550 (10.0%) |
| Total | 3,929 (100.0%) | 5,487 (100.0%) |
Household Income by Mortgage Status in Fountain Hills
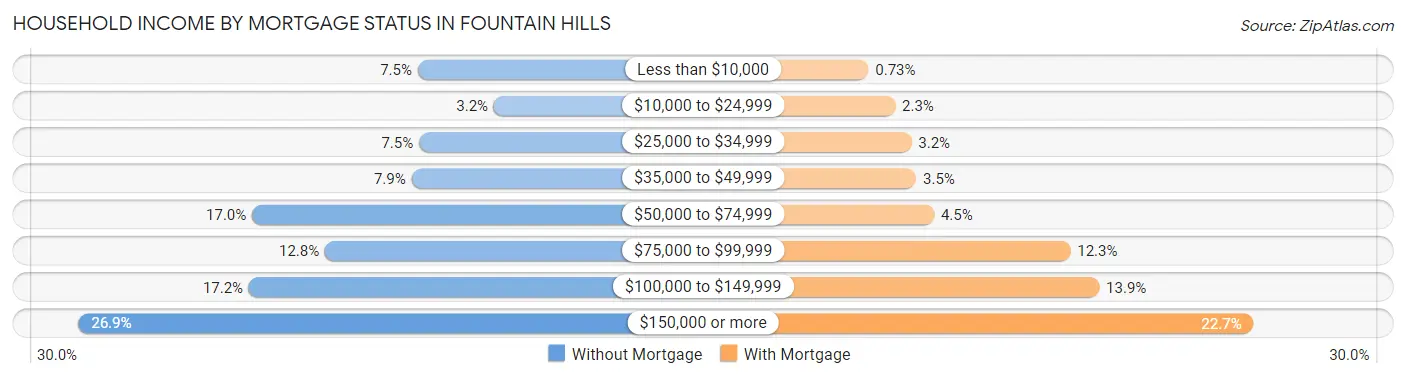
| Household Income | Without Mortgage | With Mortgage |
| Less than $10,000 | 296 (7.5%) | 40 (0.7%) |
| $10,000 to $24,999 | 125 (3.2%) | 124 (2.3%) |
| $25,000 to $34,999 | 293 (7.5%) | 175 (3.2%) |
| $35,000 to $49,999 | 310 (7.9%) | 190 (3.5%) |
| $50,000 to $74,999 | 668 (17.0%) | 246 (4.5%) |
| $75,000 to $99,999 | 504 (12.8%) | 673 (12.3%) |
| $100,000 to $149,999 | 675 (17.2%) | 764 (13.9%) |
| $150,000 or more | 1,058 (26.9%) | 1,248 (22.7%) |
| Total | 3,929 (100.0%) | 5,487 (100.0%) |
Property Value to Household Income Ratio in Fountain Hills
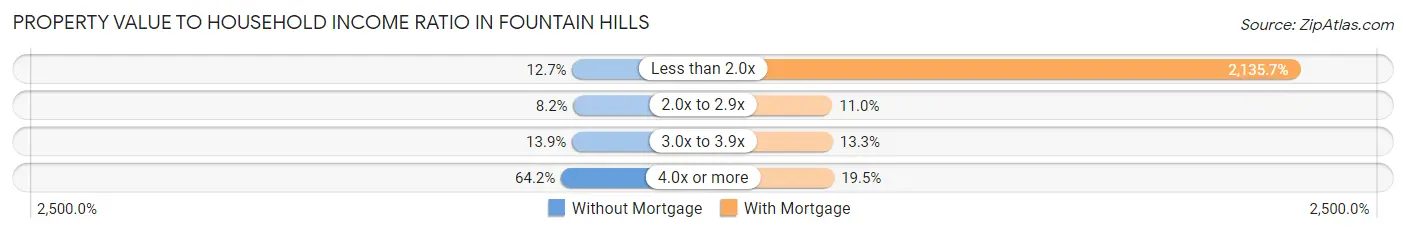
| Value-to-Income Ratio | Without Mortgage | With Mortgage |
| Less than 2.0x | 498 (12.7%) | 117,183 (2,135.7%) |
| 2.0x to 2.9x | 322 (8.2%) | 601 (11.0%) |
| 3.0x to 3.9x | 547 (13.9%) | 731 (13.3%) |
| 4.0x or more | 2,522 (64.2%) | 1,067 (19.5%) |
| Total | 3,929 (100.0%) | 5,487 (100.0%) |
Real Estate Taxes by Mortgage Status in Fountain Hills
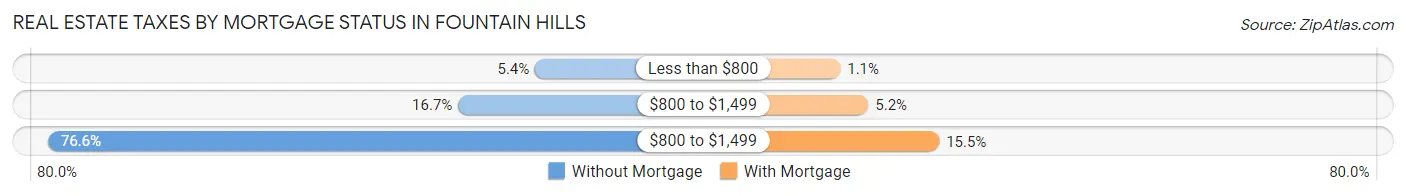
| Property Taxes | Without Mortgage | With Mortgage |
| Less than $800 | 212 (5.4%) | 58 (1.1%) |
| $800 to $1,499 | 654 (16.7%) | 283 (5.2%) |
| $800 to $1,499 | 3,010 (76.6%) | 851 (15.5%) |
| Total | 3,929 (100.0%) | 5,487 (100.0%) |
Health & Disability in Fountain Hills
Health Insurance Coverage by Age in Fountain Hills
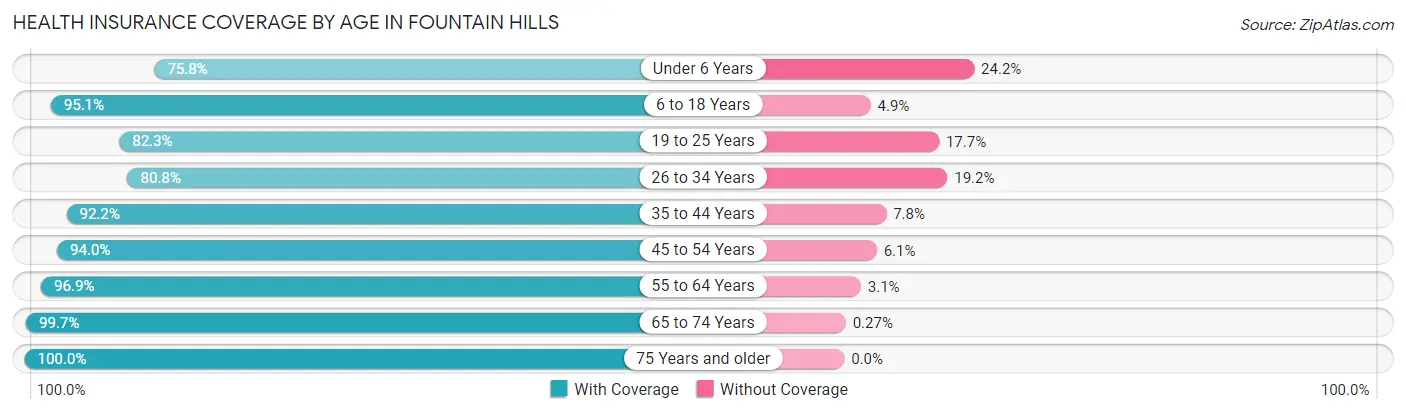
| Age Bracket | With Coverage | Without Coverage |
| Under 6 Years | 604 (75.8%) | 193 (24.2%) |
| 6 to 18 Years | 2,133 (95.1%) | 110 (4.9%) |
| 19 to 25 Years | 592 (82.3%) | 127 (17.7%) |
| 26 to 34 Years | 1,379 (80.8%) | 328 (19.2%) |
| 35 to 44 Years | 1,887 (92.2%) | 160 (7.8%) |
| 45 to 54 Years | 1,957 (94.0%) | 126 (6.0%) |
| 55 to 64 Years | 4,951 (96.9%) | 158 (3.1%) |
| 65 to 74 Years | 4,889 (99.7%) | 13 (0.3%) |
| 75 Years and older | 3,986 (100.0%) | 0 (0.0%) |
| Total | 22,378 (94.9%) | 1,215 (5.1%) |
Health Insurance Coverage by Citizenship Status in Fountain Hills
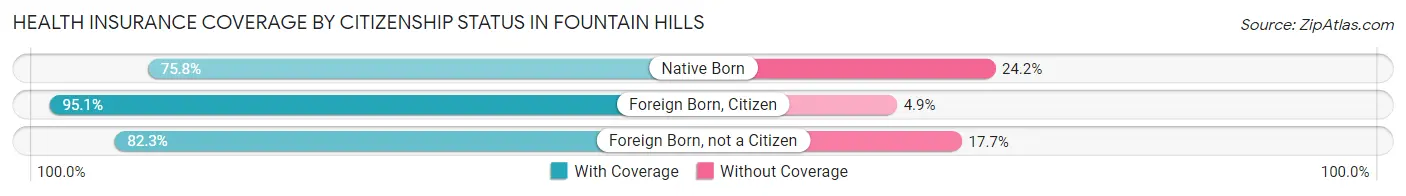
| Citizenship Status | With Coverage | Without Coverage |
| Native Born | 604 (75.8%) | 193 (24.2%) |
| Foreign Born, Citizen | 2,133 (95.1%) | 110 (4.9%) |
| Foreign Born, not a Citizen | 592 (82.3%) | 127 (17.7%) |
Health Insurance Coverage by Household Income in Fountain Hills
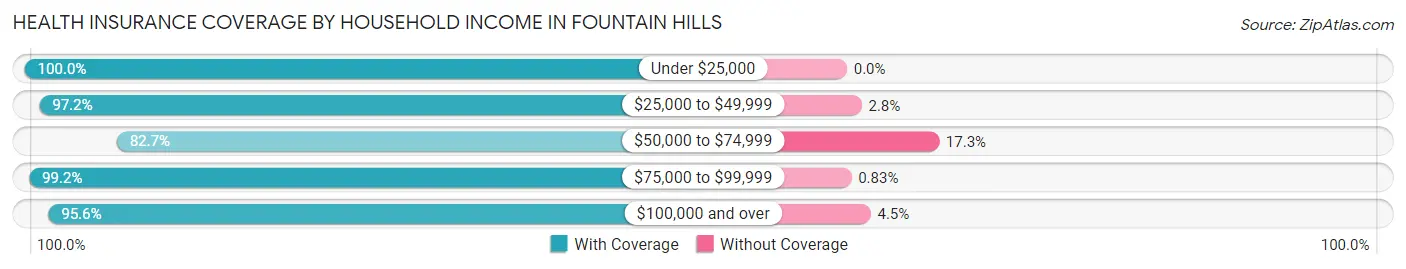
| Household Income | With Coverage | Without Coverage |
| Under $25,000 | 1,391 (100.0%) | 0 (0.0%) |
| $25,000 to $49,999 | 2,362 (97.2%) | 67 (2.8%) |
| $50,000 to $74,999 | 2,402 (82.7%) | 501 (17.3%) |
| $75,000 to $99,999 | 2,751 (99.2%) | 23 (0.8%) |
| $100,000 and over | 13,401 (95.6%) | 624 (4.4%) |
Public vs Private Health Insurance Coverage by Age in Fountain Hills
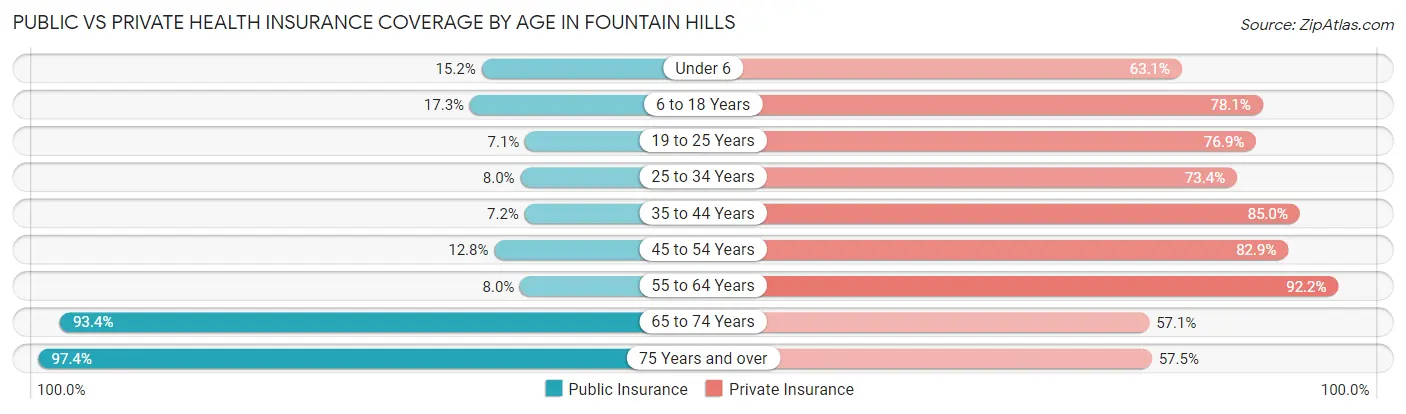
| Age Bracket | Public Insurance | Private Insurance |
| Under 6 | 121 (15.2%) | 503 (63.1%) |
| 6 to 18 Years | 389 (17.3%) | 1,752 (78.1%) |
| 19 to 25 Years | 51 (7.1%) | 553 (76.9%) |
| 25 to 34 Years | 136 (8.0%) | 1,252 (73.4%) |
| 35 to 44 Years | 147 (7.2%) | 1,740 (85.0%) |
| 45 to 54 Years | 267 (12.8%) | 1,726 (82.9%) |
| 55 to 64 Years | 409 (8.0%) | 4,708 (92.1%) |
| 65 to 74 Years | 4,580 (93.4%) | 2,797 (57.1%) |
| 75 Years and over | 3,882 (97.4%) | 2,293 (57.5%) |
| Total | 9,982 (42.3%) | 17,324 (73.4%) |
Disability Status by Sex by Age in Fountain Hills
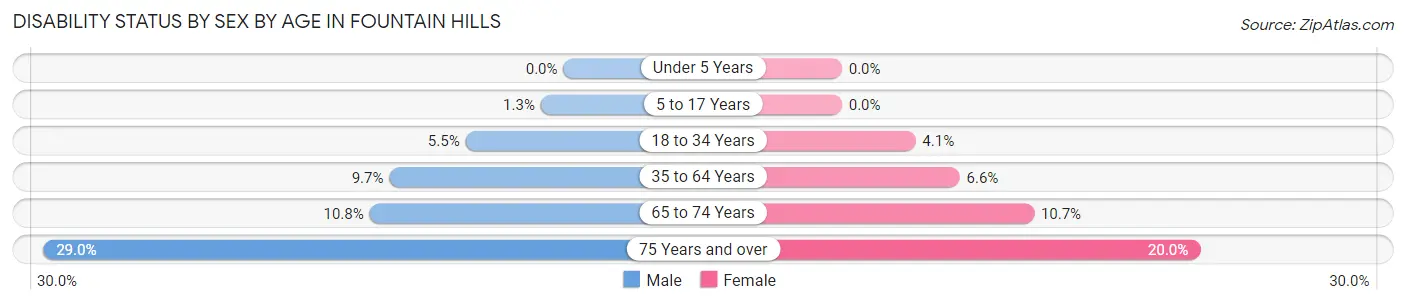
| Age Bracket | Male | Female |
| Under 5 Years | 0 (0.0%) | 0 (0.0%) |
| 5 to 17 Years | 14 (1.3%) | 0 (0.0%) |
| 18 to 34 Years | 76 (5.4%) | 50 (4.1%) |
| 35 to 64 Years | 427 (9.7%) | 317 (6.6%) |
| 65 to 74 Years | 280 (10.8%) | 247 (10.7%) |
| 75 Years and over | 539 (29.0%) | 424 (20.0%) |
Disability Class by Sex by Age in Fountain Hills
Disability Class: Hearing Difficulty
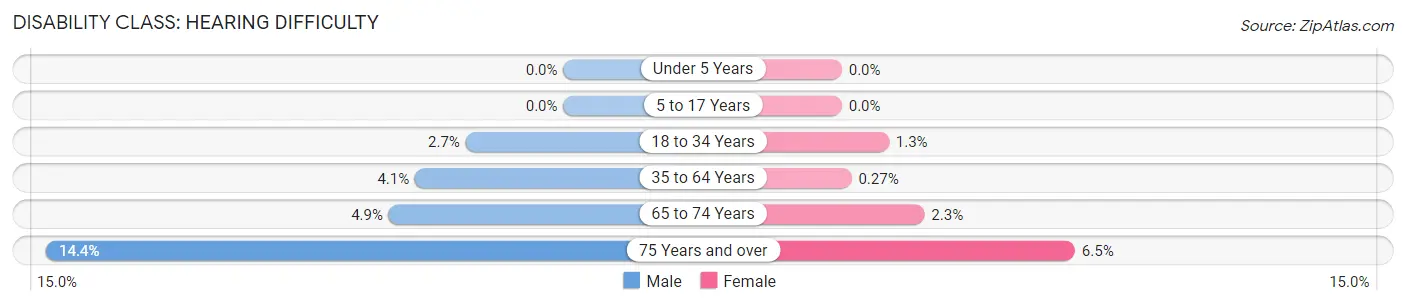
| Age Bracket | Male | Female |
| Under 5 Years | 0 (0.0%) | 0 (0.0%) |
| 5 to 17 Years | 0 (0.0%) | 0 (0.0%) |
| 18 to 34 Years | 38 (2.7%) | 16 (1.3%) |
| 35 to 64 Years | 182 (4.1%) | 13 (0.3%) |
| 65 to 74 Years | 126 (4.9%) | 53 (2.3%) |
| 75 Years and over | 268 (14.4%) | 138 (6.5%) |
Disability Class: Vision Difficulty
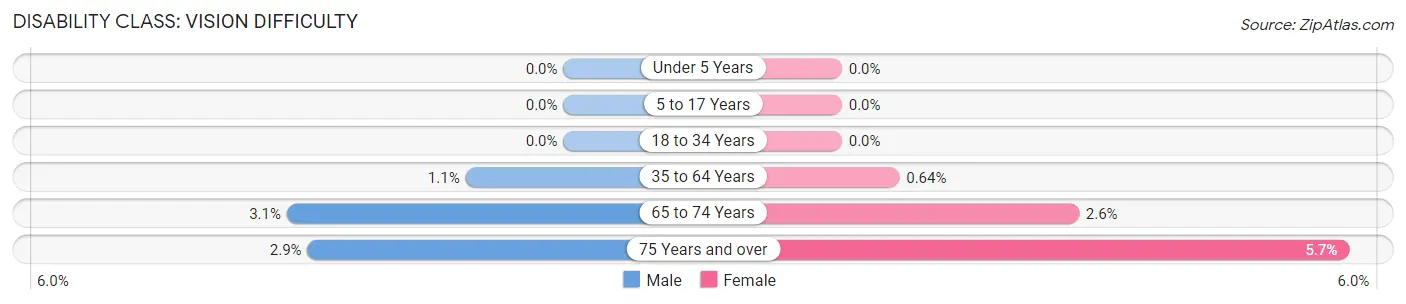
| Age Bracket | Male | Female |
| Under 5 Years | 0 (0.0%) | 0 (0.0%) |
| 5 to 17 Years | 0 (0.0%) | 0 (0.0%) |
| 18 to 34 Years | 0 (0.0%) | 0 (0.0%) |
| 35 to 64 Years | 48 (1.1%) | 31 (0.6%) |
| 65 to 74 Years | 80 (3.1%) | 61 (2.6%) |
| 75 Years and over | 53 (2.9%) | 120 (5.7%) |
Disability Class: Cognitive Difficulty
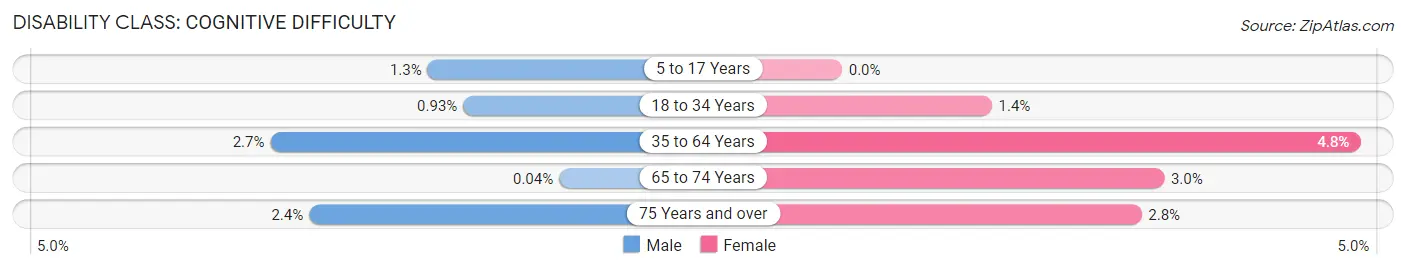
| Age Bracket | Male | Female |
| 5 to 17 Years | 14 (1.3%) | 0 (0.0%) |
| 18 to 34 Years | 13 (0.9%) | 17 (1.4%) |
| 35 to 64 Years | 120 (2.7%) | 233 (4.8%) |
| 65 to 74 Years | 1 (0.0%) | 69 (3.0%) |
| 75 Years and over | 44 (2.4%) | 59 (2.8%) |
Disability Class: Ambulatory Difficulty
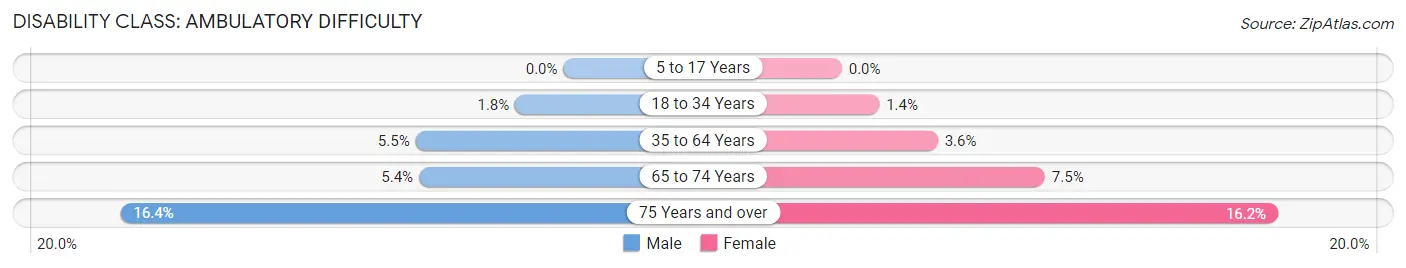
| Age Bracket | Male | Female |
| 5 to 17 Years | 0 (0.0%) | 0 (0.0%) |
| 18 to 34 Years | 25 (1.8%) | 17 (1.4%) |
| 35 to 64 Years | 242 (5.5%) | 172 (3.6%) |
| 65 to 74 Years | 139 (5.4%) | 174 (7.5%) |
| 75 Years and over | 306 (16.4%) | 344 (16.2%) |
Disability Class: Self-Care Difficulty
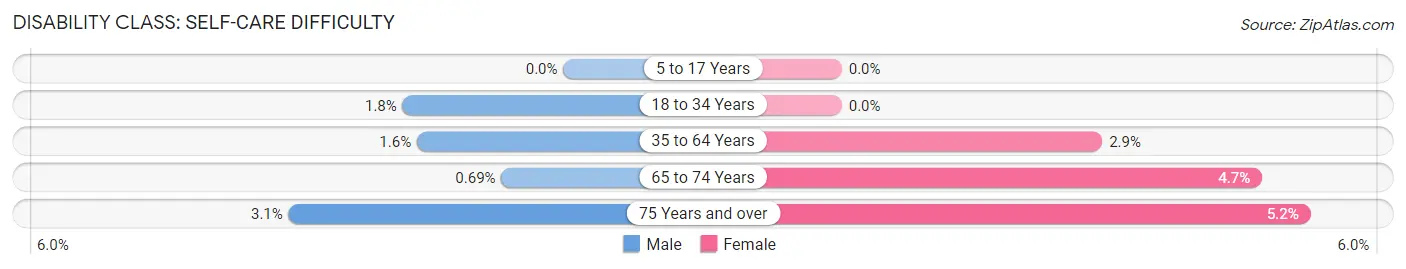
| Age Bracket | Male | Female |
| 5 to 17 Years | 0 (0.0%) | 0 (0.0%) |
| 18 to 34 Years | 25 (1.8%) | 0 (0.0%) |
| 35 to 64 Years | 72 (1.6%) | 140 (2.9%) |
| 65 to 74 Years | 18 (0.7%) | 108 (4.7%) |
| 75 Years and over | 57 (3.1%) | 111 (5.2%) |
Technology Access in Fountain Hills
Computing Device Access in Fountain Hills
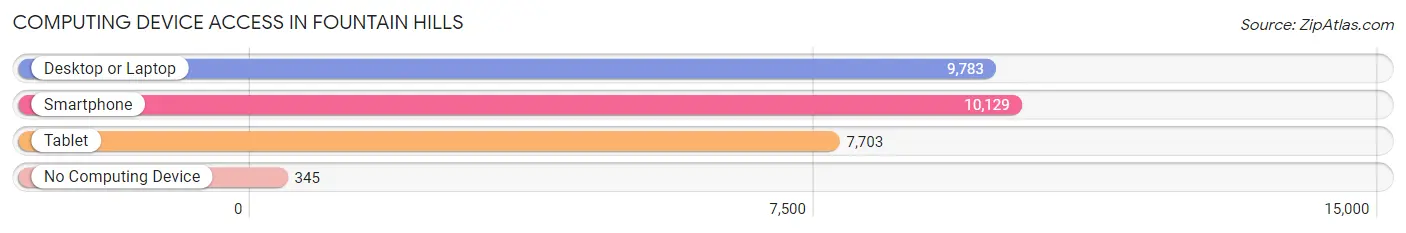
| Device Type | # Households | % Households |
| Desktop or Laptop | 9,783 | 88.2% |
| Smartphone | 10,129 | 91.3% |
| Tablet | 7,703 | 69.5% |
| No Computing Device | 345 | 3.1% |
| Total | 11,092 | 100.0% |
Internet Access in Fountain Hills
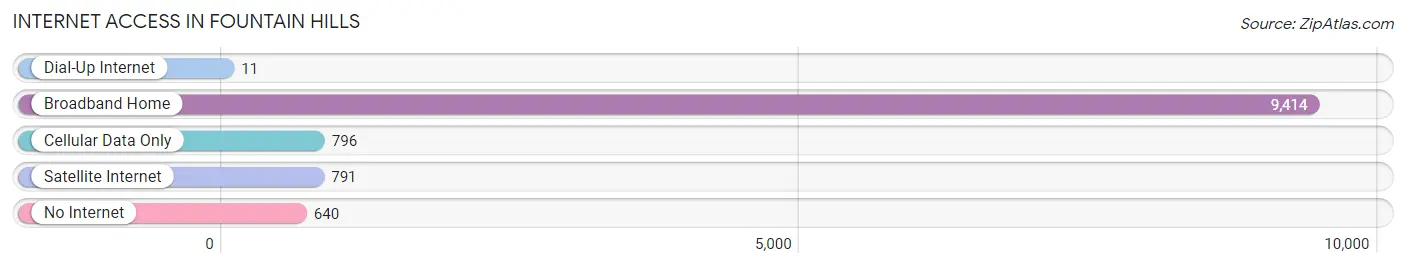
| Internet Type | # Households | % Households |
| Dial-Up Internet | 11 | 0.1% |
| Broadband Home | 9,414 | 84.9% |
| Cellular Data Only | 796 | 7.2% |
| Satellite Internet | 791 | 7.1% |
| No Internet | 640 | 5.8% |
| Total | 11,092 | 100.0% |
Fountain Hills Summary
Fountain Hills, Arizona is a town located in Maricopa County, Arizona, United States. It is situated in the Sonoran Desert, approximately 25 miles northeast of Phoenix. The town was incorporated in 1989 and has a population of 24,535 as of the 2020 census.
Geography
Fountain Hills is located in the Sonoran Desert, at an elevation of 1,845 feet. The town is situated in the foothills of the McDowell Mountains, which are part of the larger Mazatzal Mountains. The town is bordered by the Tonto National Forest to the north and east, and the Fort McDowell Yavapai Nation to the south. The town is located approximately 25 miles northeast of Phoenix, and is accessible via State Route 87 and State Route 88.
Climate
Fountain Hills has a hot desert climate, with hot summers and mild winters. The average high temperature in July is 103°F, and the average low temperature in January is 39°F. The town receives an average of 8.5 inches of precipitation per year, with most of it occurring in the summer months.
History
Fountain Hills was founded in the late 1960s by Robert P. McCulloch, a businessman from Michigan. McCulloch purchased the land in the area and developed it into a residential community. The town was incorporated in 1989, and the first mayor was elected in 1990.
Economy
Fountain Hills has a diverse economy, with a mix of retail, tourism, and professional services. The town is home to several large employers, including the Fountain Hills Unified School District, the Fountain Hills Medical Center, and the Fountain Hills Golf Club. The town also has a thriving tourism industry, with many visitors coming to the area to enjoy the town's natural beauty and recreational activities.
Demographics
As of the 2020 census, the population of Fountain Hills was 24,535. The racial makeup of the town was 87.3% White, 4.2% Hispanic or Latino, 2.7% Asian, 1.7% Black or African American, 0.3% Native American, and 0.2% Pacific Islander. The median household income was $77,845, and the median home value was $400,000.
Conclusion
Fountain Hills, Arizona is a town located in Maricopa County, Arizona, United States. It is situated in the Sonoran Desert, approximately 25 miles northeast of Phoenix. The town was incorporated in 1989 and has a population of 24,535 as of the 2020 census. Fountain Hills has a hot desert climate, with hot summers and mild winters. The town has a diverse economy, with a mix of retail, tourism, and professional services. As of the 2020 census, the population of Fountain Hills was 24,535, with a median household income of $77,845 and a median home value of $400,000.
Common Questions
What is the Total Population of Fountain Hills?
Total Population of Fountain Hills is 23,739.
What is the Total Male Population of Fountain Hills?
Total Male Population of Fountain Hills is 11,780.
What is the Total Female Population of Fountain Hills?
Total Female Population of Fountain Hills is 11,959.
What is the Ratio of Males per 100 Females in Fountain Hills?
There are 98.50 Males per 100 Females in Fountain Hills.
What is the Ratio of Females per 100 Males in Fountain Hills?
There are 101.52 Females per 100 Males in Fountain Hills.
What is the Median Population Age in Fountain Hills?
Median Population Age in Fountain Hills is 60.2 Years.
What is the Average Family Size in Fountain Hills
Average Family Size in Fountain Hills is 2.6 People.
What is the Average Household Size in Fountain Hills
Average Household Size in Fountain Hills is 2.1 People.
What is Per Capita Income in Fountain Hills?
Per Capita income in Fountain Hills is $66,756.
What is the Median Family Income in Fountain Hills?
Median Family Income in Fountain Hills is $117,752.
What is the Median Household income in Fountain Hills?
Median Household Income in Fountain Hills is $100,317.
What is Income or Wage Gap in Fountain Hills?
Income or Wage Gap in Fountain Hills is 43.6%.
Women in Fountain Hills earn 56.4 cents for every dollar earned by a man.
What is Inequality or Gini Index in Fountain Hills?
Inequality or Gini Index in Fountain Hills is 0.48.
How Large is the Labor Force in Fountain Hills?
There are 11,129 People in the Labor Forcein in Fountain Hills.
What is the Percentage of People in the Labor Force in Fountain Hills?
52.5% of People are in the Labor Force in Fountain Hills.
What is the Unemployment Rate in Fountain Hills?
Unemployment Rate in Fountain Hills is 5.1%.