Catalina, AZ
Catalina Map
Catalina Overview
6,371
TOTAL POPULATION
3,222
MALE POPULATION
3,149
FEMALE POPULATION
102.32
MALES / 100 FEMALES
97.73
FEMALES / 100 MALES
55.1
MEDIAN AGE
2.8
AVG FAMILY SIZE
2.3
AVG HOUSEHOLD SIZE
$41,018
PER CAPITA INCOME
$85,903
AVG FAMILY INCOME
$69,243
AVG HOUSEHOLD INCOME
30.1%
WAGE / INCOME GAP [ % ]
69.9¢/ $1
WAGE / INCOME GAP [ $ ]
0.47
INEQUALITY / GINI INDEX
2,972
LABOR FORCE [ PEOPLE ]
54.4%
PERCENT IN LABOR FORCE
3.3%
UNEMPLOYMENT RATE
Catalina Area Codes
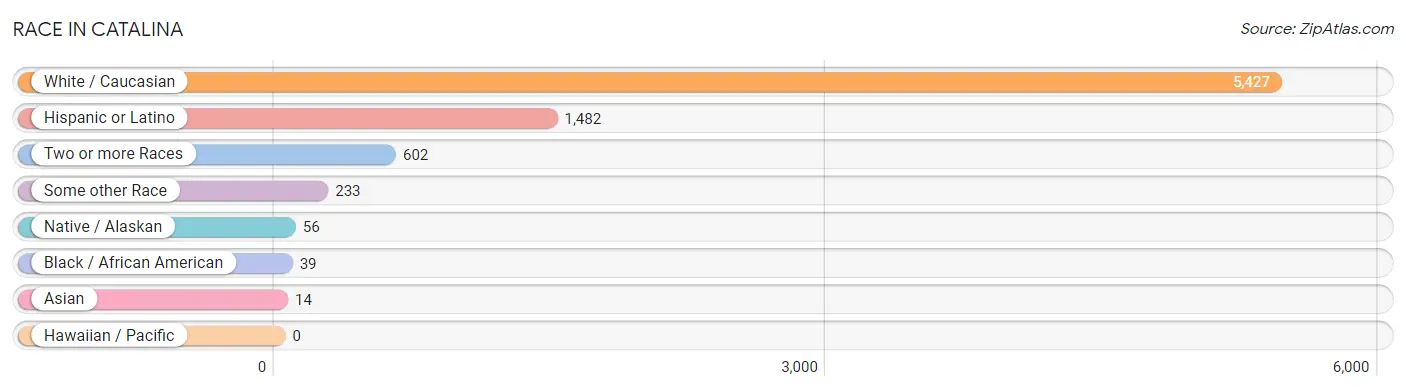
Race in Catalina
The most populous races in Catalina are White / Caucasian (5,427 | 85.2%), Hispanic or Latino (1,482 | 23.3%), and Two or more Races (602 | 9.5%).
| Race | # Population | % Population |
| Asian | 14 | 0.2% |
| Black / African American | 39 | 0.6% |
| Hawaiian / Pacific | 0 | 0.0% |
| Hispanic or Latino | 1,482 | 23.3% |
| Native / Alaskan | 56 | 0.9% |
| White / Caucasian | 5,427 | 85.2% |
| Two or more Races | 602 | 9.5% |
| Some other Race | 233 | 3.7% |
| Total | 6,371 | 100.0% |
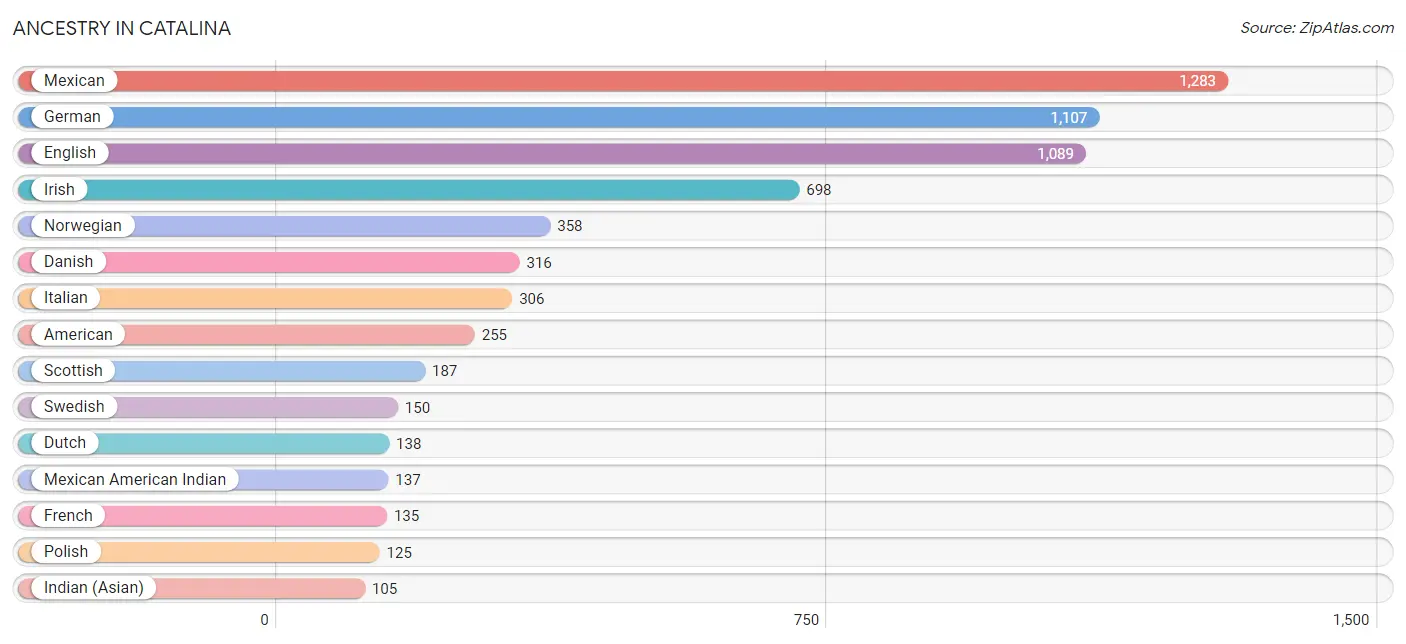
Ancestry in Catalina
The most populous ancestries reported in Catalina are Mexican (1,283 | 20.1%), German (1,107 | 17.4%), English (1,089 | 17.1%), Irish (698 | 11.0%), and Norwegian (358 | 5.6%), together accounting for 71.2% of all Catalina residents.
| Ancestry | # Population | % Population |
| American | 255 | 4.0% |
| Austrian | 9 | 0.1% |
| Belgian | 73 | 1.1% |
| Bhutanese | 14 | 0.2% |
| Bolivian | 64 | 1.0% |
| British | 98 | 1.5% |
| Czech | 40 | 0.6% |
| Danish | 316 | 5.0% |
| Dutch | 138 | 2.2% |
| Eastern European | 7 | 0.1% |
| English | 1,089 | 17.1% |
| European | 63 | 1.0% |
| Finnish | 48 | 0.7% |
| French | 135 | 2.1% |
| French Canadian | 25 | 0.4% |
| German | 1,107 | 17.4% |
| Hungarian | 30 | 0.5% |
| Indian (Asian) | 105 | 1.7% |
| Irish | 698 | 11.0% |
| Italian | 306 | 4.8% |
| Korean | 7 | 0.1% |
| Latvian | 23 | 0.4% |
| Mexican | 1,283 | 20.1% |
| Mexican American Indian | 137 | 2.1% |
| Nigerian | 11 | 0.2% |
| Northern European | 57 | 0.9% |
| Norwegian | 358 | 5.6% |
| Osage | 4 | 0.1% |
| Pennsylvania German | 11 | 0.2% |
| Polish | 125 | 2.0% |
| Portuguese | 19 | 0.3% |
| Puerto Rican | 31 | 0.5% |
| Russian | 76 | 1.2% |
| Scandinavian | 26 | 0.4% |
| Scotch-Irish | 48 | 0.7% |
| Scottish | 187 | 2.9% |
| Slavic | 11 | 0.2% |
| South African | 12 | 0.2% |
| South American | 77 | 1.2% |
| Spaniard | 8 | 0.1% |
| Spanish | 23 | 0.4% |
| Spanish American | 50 | 0.8% |
| Sri Lankan | 12 | 0.2% |
| Subsaharan African | 23 | 0.4% |
| Swedish | 150 | 2.4% |
| Venezuelan | 13 | 0.2% |
| Welsh | 40 | 0.6% |
| Yaqui | 13 | 0.2% | View All 48 Rows |
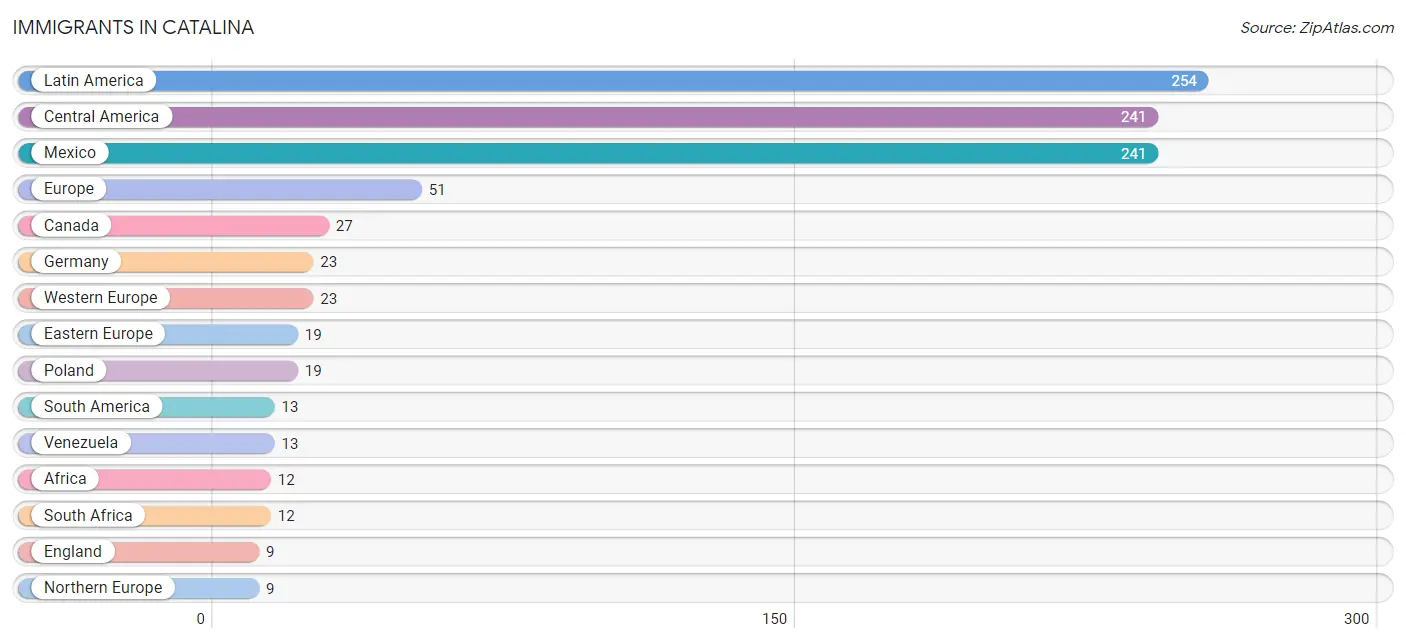
Immigrants in Catalina
The most numerous immigrant groups reported in Catalina came from Latin America (254 | 4.0%), Central America (241 | 3.8%), Mexico (241 | 3.8%), Europe (51 | 0.8%), and Canada (27 | 0.4%), together accounting for 12.8% of all Catalina residents.
| Immigration Origin | # Population | % Population |
| Africa | 12 | 0.2% |
| Canada | 27 | 0.4% |
| Central America | 241 | 3.8% |
| Eastern Europe | 19 | 0.3% |
| England | 9 | 0.1% |
| Europe | 51 | 0.8% |
| Germany | 23 | 0.4% |
| Latin America | 254 | 4.0% |
| Mexico | 241 | 3.8% |
| Northern Europe | 9 | 0.1% |
| Poland | 19 | 0.3% |
| South Africa | 12 | 0.2% |
| South America | 13 | 0.2% |
| Venezuela | 13 | 0.2% |
| Western Europe | 23 | 0.4% | View All 15 Rows |
Sex and Age in Catalina
Sex and Age in Catalina
The most populous age groups in Catalina are 55 to 59 Years (510 | 15.8%) for men and 55 to 59 Years (380 | 12.1%) for women.
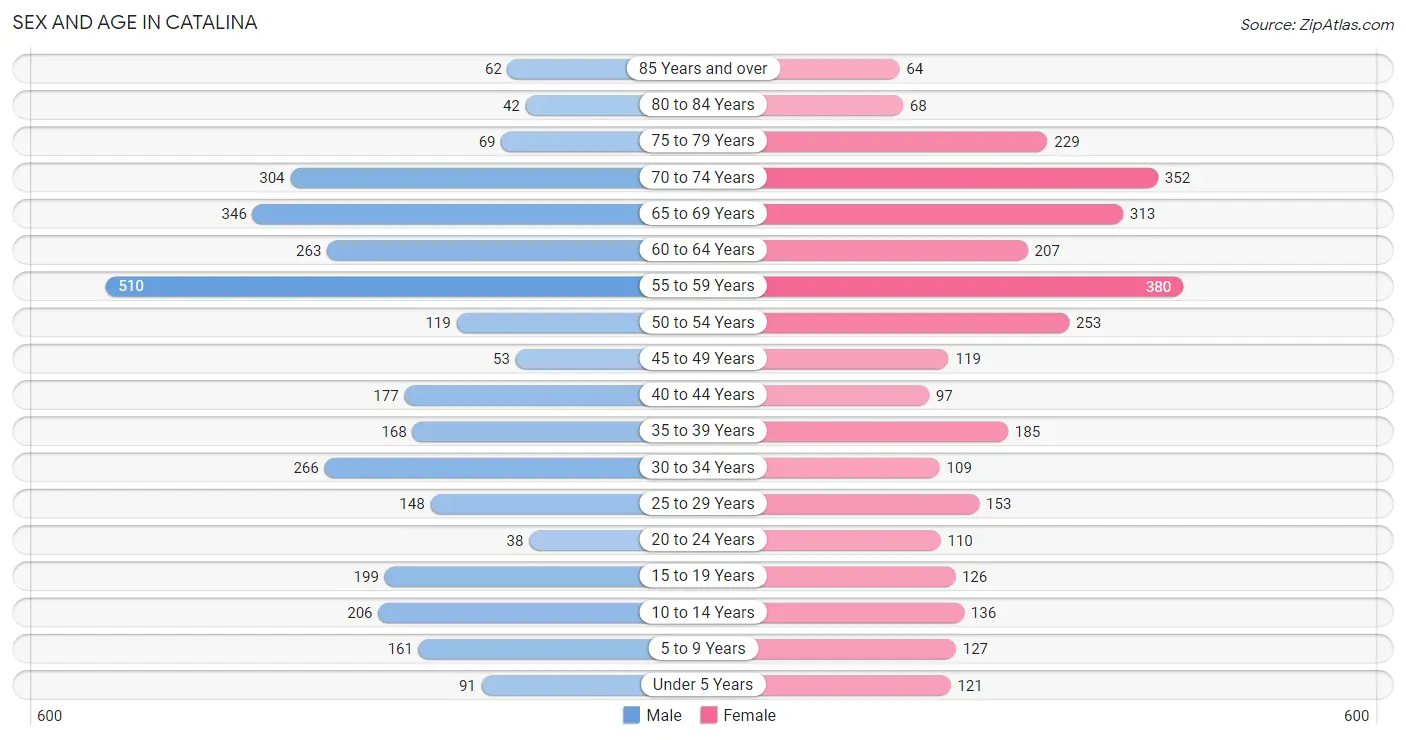
| Age Bracket | Male | Female |
| Under 5 Years | 91 (2.8%) | 121 (3.8%) |
| 5 to 9 Years | 161 (5.0%) | 127 (4.0%) |
| 10 to 14 Years | 206 (6.4%) | 136 (4.3%) |
| 15 to 19 Years | 199 (6.2%) | 126 (4.0%) |
| 20 to 24 Years | 38 (1.2%) | 110 (3.5%) |
| 25 to 29 Years | 148 (4.6%) | 153 (4.9%) |
| 30 to 34 Years | 266 (8.3%) | 109 (3.5%) |
| 35 to 39 Years | 168 (5.2%) | 185 (5.9%) |
| 40 to 44 Years | 177 (5.5%) | 97 (3.1%) |
| 45 to 49 Years | 53 (1.6%) | 119 (3.8%) |
| 50 to 54 Years | 119 (3.7%) | 253 (8.0%) |
| 55 to 59 Years | 510 (15.8%) | 380 (12.1%) |
| 60 to 64 Years | 263 (8.2%) | 207 (6.6%) |
| 65 to 69 Years | 346 (10.7%) | 313 (9.9%) |
| 70 to 74 Years | 304 (9.4%) | 352 (11.2%) |
| 75 to 79 Years | 69 (2.1%) | 229 (7.3%) |
| 80 to 84 Years | 42 (1.3%) | 68 (2.2%) |
| 85 Years and over | 62 (1.9%) | 64 (2.0%) |
| Total | 3,222 (100.0%) | 3,149 (100.0%) |
Families and Households in Catalina
Median Family Size in Catalina
The median family size in Catalina is 2.76 persons per family, with single male/father families (214 | 11.4%) accounting for the largest median family size of 2.84 persons per family. On the other hand, single female/mother families (187 | 9.9%) represent the smallest median family size with 2.52 persons per family.
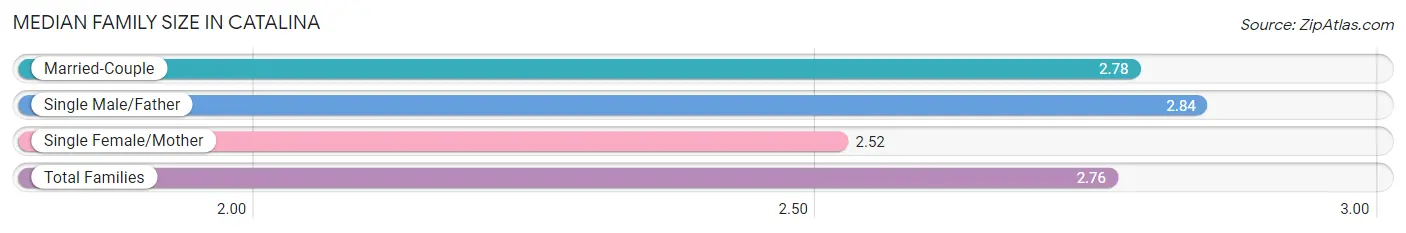
| Family Type | # Families | Family Size |
| Married-Couple | 1,481 (78.7%) | 2.78 |
| Single Male/Father | 214 (11.4%) | 2.84 |
| Single Female/Mother | 187 (9.9%) | 2.52 |
| Total Families | 1,882 (100.0%) | 2.76 |
Median Household Size in Catalina
The median household size in Catalina is 2.29 persons per household, with single male/father households (214 | 7.7%) accounting for the largest median household size of 3.04 persons per household. non-family households (903 | 32.4%) represent the smallest median household size with 1.18 persons per household.
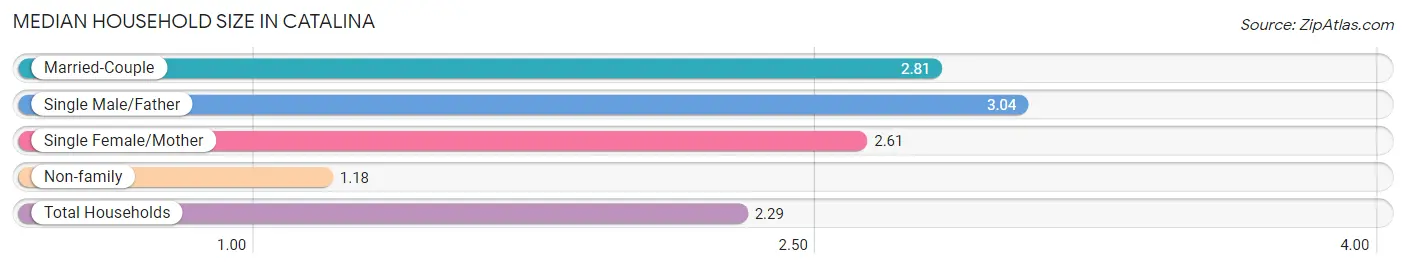
| Household Type | # Households | Household Size |
| Married-Couple | 1,481 (53.2%) | 2.81 |
| Single Male/Father | 214 (7.7%) | 3.04 |
| Single Female/Mother | 187 (6.7%) | 2.61 |
| Non-family | 903 (32.4%) | 1.18 |
| Total Households | 2,785 (100.0%) | 2.29 |
Household Size by Marriage Status in Catalina
Out of a total of 2,785 households in Catalina, 1,882 (67.6%) are family households, while 903 (32.4%) are nonfamily households. The most numerous type of family households are 2-person households, comprising 1,182, and the most common type of nonfamily households are 1-person households, comprising 758.
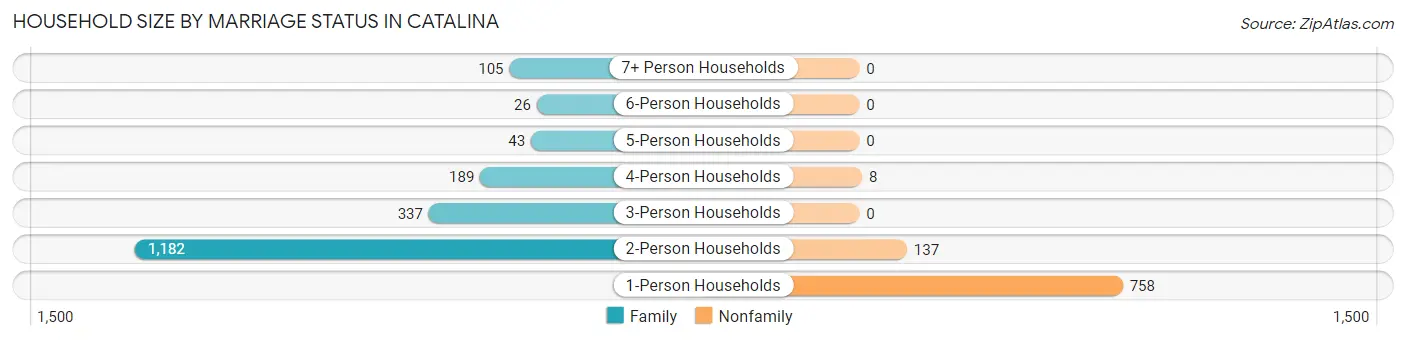
| Household Size | Family Households | Nonfamily Households |
| 1-Person Households | - | 758 (27.2%) |
| 2-Person Households | 1,182 (42.4%) | 137 (4.9%) |
| 3-Person Households | 337 (12.1%) | 0 (0.0%) |
| 4-Person Households | 189 (6.8%) | 8 (0.3%) |
| 5-Person Households | 43 (1.5%) | 0 (0.0%) |
| 6-Person Households | 26 (0.9%) | 0 (0.0%) |
| 7+ Person Households | 105 (3.8%) | 0 (0.0%) |
| Total | 1,882 (67.6%) | 903 (32.4%) |
Female Fertility in Catalina
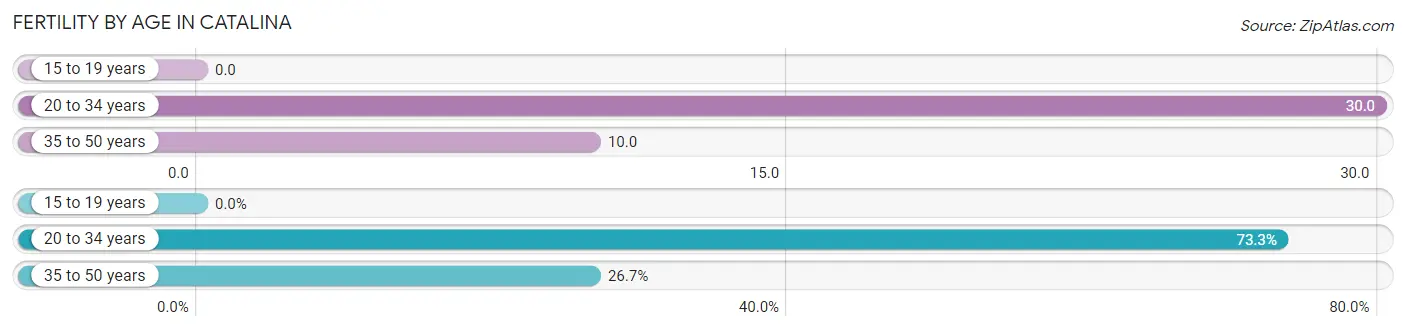
Fertility by Age in Catalina
Average fertility rate in Catalina is 17.0 births per 1,000 women. Women in the age bracket of 20 to 34 years have the highest fertility rate with 30.0 births per 1,000 women. Women in the age bracket of 20 to 34 years acount for 73.3% of all women with births.
| Age Bracket | Women with Births | Births / 1,000 Women |
| 15 to 19 years | 0 (0.0%) | 0.0 |
| 20 to 34 years | 11 (73.3%) | 30.0 |
| 35 to 50 years | 4 (26.7%) | 10.0 |
| Total | 15 (100.0%) | 17.0 |
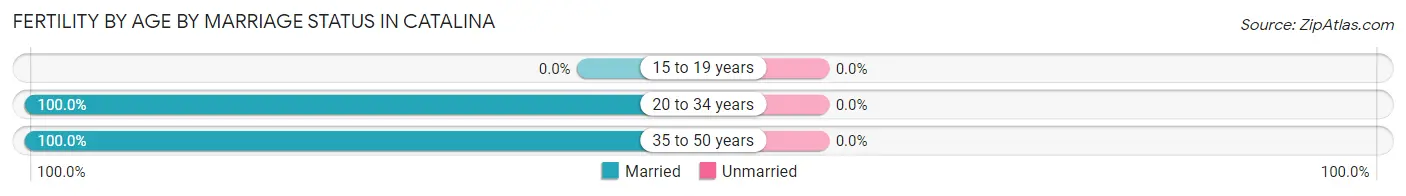
Fertility by Age by Marriage Status in Catalina
| Age Bracket | Married | Unmarried |
| 15 to 19 years | 0 (0.0%) | 0 (0.0%) |
| 20 to 34 years | 11 (100.0%) | 0 (0.0%) |
| 35 to 50 years | 4 (100.0%) | 0 (0.0%) |
| Total | 15 (100.0%) | 0 (0.0%) |
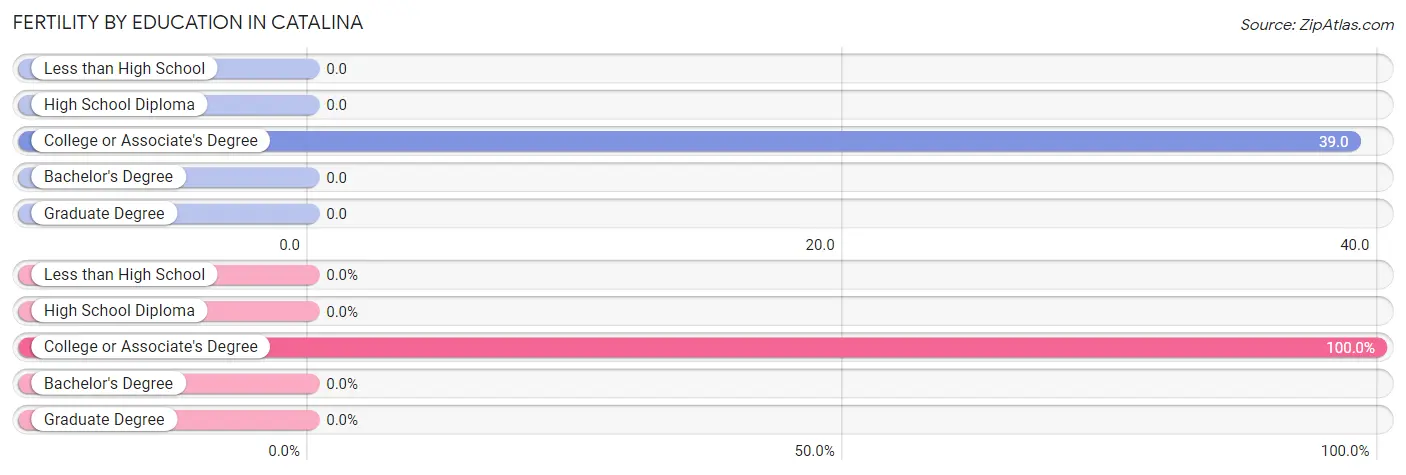
Fertility by Education in Catalina
| Educational Attainment | Women with Births | Births / 1,000 Women |
| Less than High School | 0 (0.0%) | 0.0 |
| High School Diploma | 0 (0.0%) | 0.0 |
| College or Associate's Degree | 15 (100.0%) | 39.0 |
| Bachelor's Degree | 0 (0.0%) | 0.0 |
| Graduate Degree | 0 (0.0%) | 0.0 |
| Total | 15 (100.0%) | 17.0 |
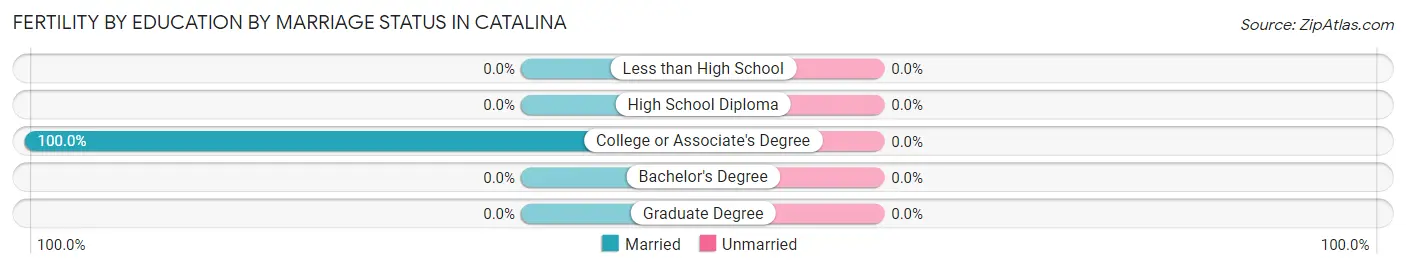
Fertility by Education by Marriage Status in Catalina
| Educational Attainment | Married | Unmarried |
| Less than High School | 0 (0.0%) | 0 (0.0%) |
| High School Diploma | 0 (0.0%) | 0 (0.0%) |
| College or Associate's Degree | 15 (100.0%) | 0 (0.0%) |
| Bachelor's Degree | 0 (0.0%) | 0 (0.0%) |
| Graduate Degree | 0 (0.0%) | 0 (0.0%) |
| Total | 15 (100.0%) | 0 (0.0%) |
Income in Catalina
Income Overview in Catalina
Per Capita Income in Catalina is $41,018, while median incomes of families and households are $85,903 and $69,243 respectively.
| Characteristic | Number | Measure |
| Per Capita Income | 6,371 | $41,018 |
| Median Family Income | 1,882 | $85,903 |
| Mean Family Income | 1,882 | $119,384 |
| Median Household Income | 2,785 | $69,243 |
| Mean Household Income | 2,785 | $93,778 |
| Income Deficit | 1,882 | $0 |
| Wage / Income Gap (%) | 6,371 | 30.11% |
| Wage / Income Gap ($) | 6,371 | 69.89¢ per $1 |
| Gini / Inequality Index | 6,371 | 0.47 |
Earnings by Sex in Catalina
Average Earnings in Catalina are $38,912, $44,382 for men and $31,017 for women, a difference of 30.1%.
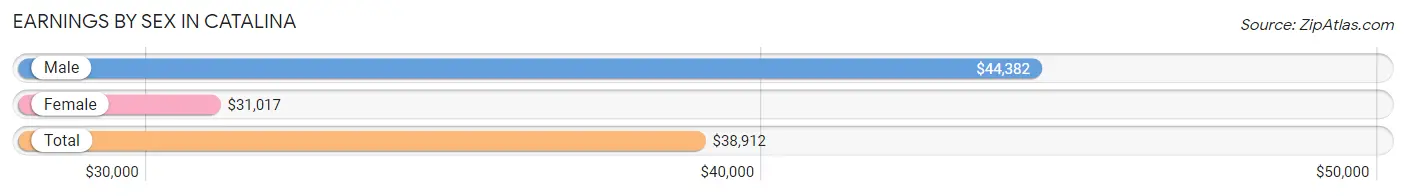
| Sex | Number | Average Earnings |
| Male | 1,638 (52.8%) | $44,382 |
| Female | 1,463 (47.2%) | $31,017 |
| Total | 3,101 (100.0%) | $38,912 |
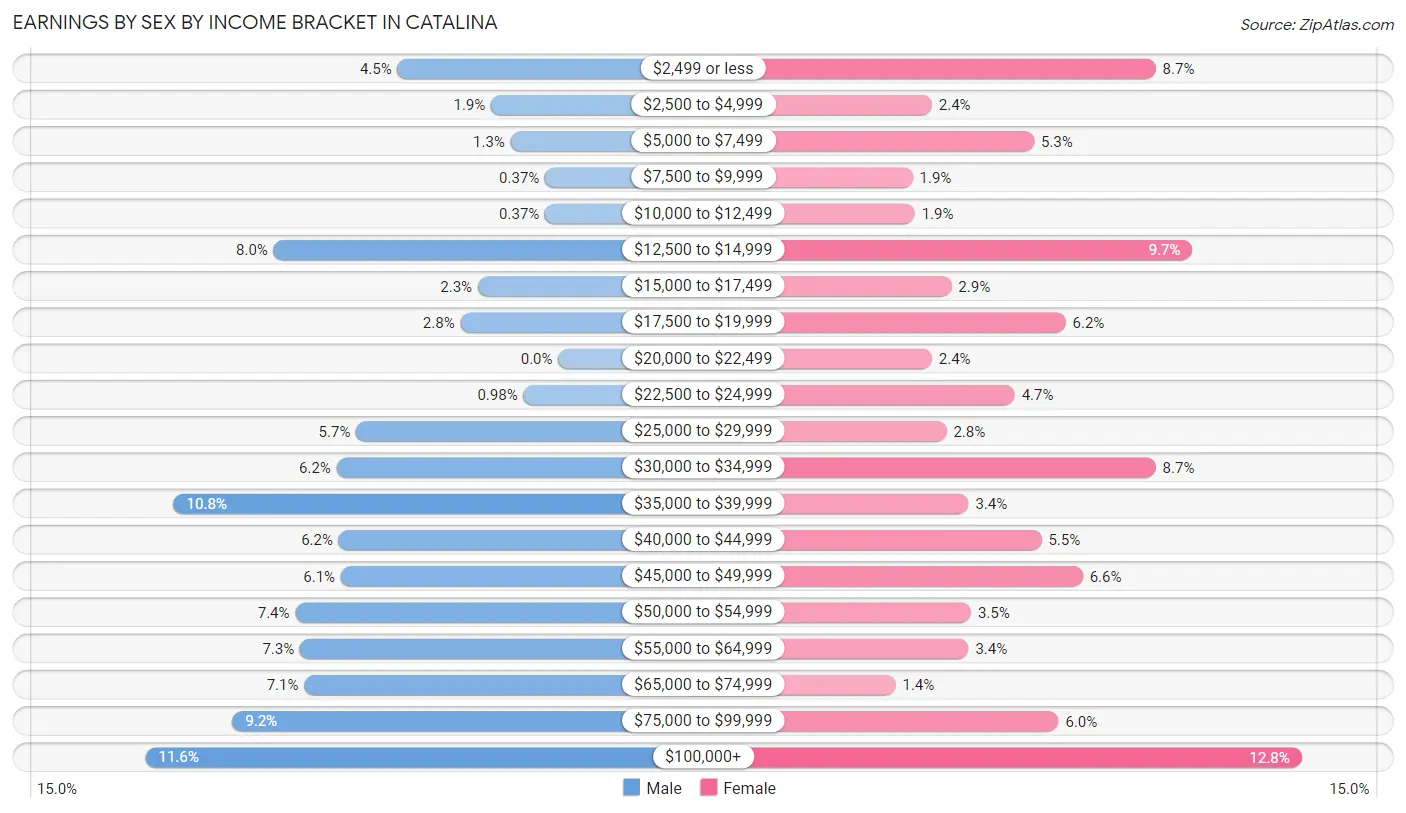
Earnings by Sex by Income Bracket in Catalina
The most common earnings brackets in Catalina are $100,000+ for men (190 | 11.6%) and $100,000+ for women (187 | 12.8%).
| Income | Male | Female |
| $2,499 or less | 74 (4.5%) | 127 (8.7%) |
| $2,500 to $4,999 | 31 (1.9%) | 35 (2.4%) |
| $5,000 to $7,499 | 22 (1.3%) | 77 (5.3%) |
| $7,500 to $9,999 | 6 (0.4%) | 27 (1.8%) |
| $10,000 to $12,499 | 6 (0.4%) | 28 (1.9%) |
| $12,500 to $14,999 | 131 (8.0%) | 142 (9.7%) |
| $15,000 to $17,499 | 37 (2.3%) | 43 (2.9%) |
| $17,500 to $19,999 | 45 (2.8%) | 90 (6.1%) |
| $20,000 to $22,499 | 0 (0.0%) | 35 (2.4%) |
| $22,500 to $24,999 | 16 (1.0%) | 69 (4.7%) |
| $25,000 to $29,999 | 93 (5.7%) | 41 (2.8%) |
| $30,000 to $34,999 | 102 (6.2%) | 127 (8.7%) |
| $35,000 to $39,999 | 177 (10.8%) | 50 (3.4%) |
| $40,000 to $44,999 | 101 (6.2%) | 80 (5.5%) |
| $45,000 to $49,999 | 100 (6.1%) | 97 (6.6%) |
| $50,000 to $54,999 | 121 (7.4%) | 51 (3.5%) |
| $55,000 to $64,999 | 119 (7.3%) | 50 (3.4%) |
| $65,000 to $74,999 | 117 (7.1%) | 20 (1.4%) |
| $75,000 to $99,999 | 150 (9.2%) | 87 (5.9%) |
| $100,000+ | 190 (11.6%) | 187 (12.8%) |
| Total | 1,638 (100.0%) | 1,463 (100.0%) |
Earnings by Sex by Educational Attainment in Catalina
Average earnings in Catalina are $46,131 for men and $33,735 for women, a difference of 26.9%. Men with an educational attainment of bachelor's degree enjoy the highest average annual earnings of $82,583, while those with less than high school education earn the least with $43,021. Women with an educational attainment of graduate degree earn the most with the average annual earnings of $69,000, while those with college or associate's degree education have the smallest earnings of $19,831.
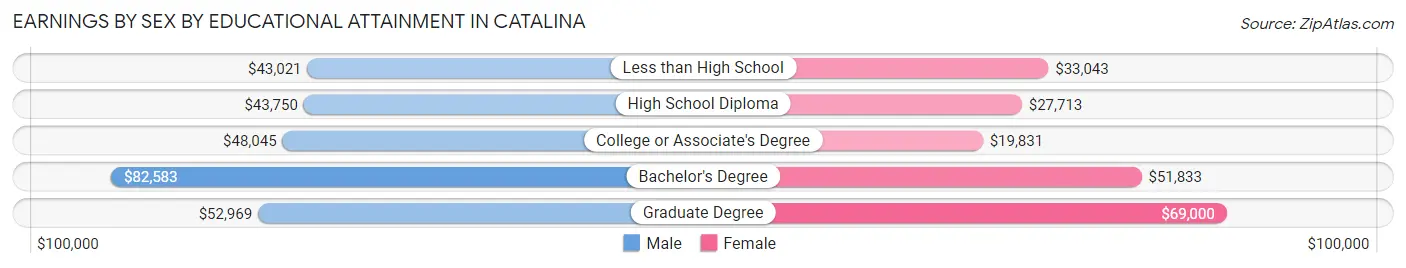
| Educational Attainment | Male Income | Female Income |
| Less than High School | $43,021 | $33,043 |
| High School Diploma | $43,750 | $27,713 |
| College or Associate's Degree | $48,045 | $19,831 |
| Bachelor's Degree | $82,583 | $51,833 |
| Graduate Degree | $52,969 | $69,000 |
| Total | $46,131 | $33,735 |
Family Income in Catalina
Family Income Brackets in Catalina
According to the Catalina family income data, there are 469 families falling into the $100,000 to $149,999 income range, which is the most common income bracket and makes up 24.9% of all families.
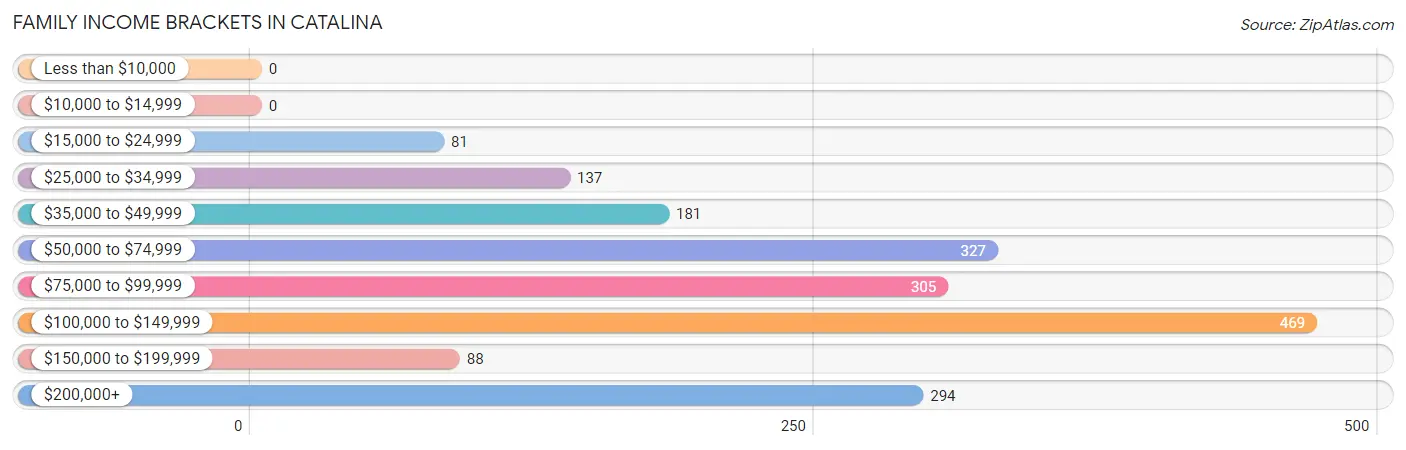
| Income Bracket | # Families | % Families |
| Less than $10,000 | 0 | 0.0% |
| $10,000 to $14,999 | 0 | 0.0% |
| $15,000 to $24,999 | 81 | 4.3% |
| $25,000 to $34,999 | 137 | 7.3% |
| $35,000 to $49,999 | 181 | 9.6% |
| $50,000 to $74,999 | 327 | 17.4% |
| $75,000 to $99,999 | 305 | 16.2% |
| $100,000 to $149,999 | 469 | 24.9% |
| $150,000 to $199,999 | 88 | 4.7% |
| $200,000+ | 294 | 15.6% |
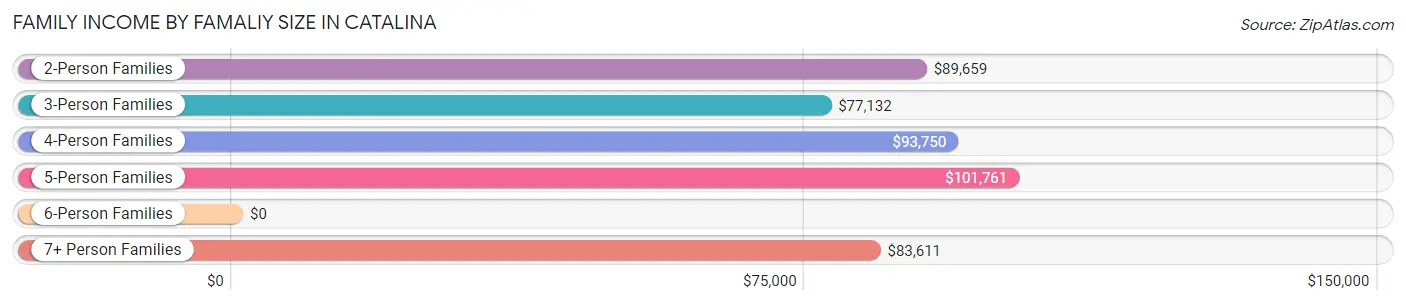
Family Income by Famaliy Size in Catalina
5-person families (43 | 2.3%) account for the highest median family income in Catalina with $101,761 per family, while 2-person families (1,191 | 63.3%) have the highest median income of $44,830 per family member.
| Income Bracket | # Families | Median Income |
| 2-Person Families | 1,191 (63.3%) | $89,659 |
| 3-Person Families | 387 (20.6%) | $77,132 |
| 4-Person Families | 130 (6.9%) | $93,750 |
| 5-Person Families | 43 (2.3%) | $101,761 |
| 6-Person Families | 65 (3.5%) | $0 |
| 7+ Person Families | 66 (3.5%) | $83,611 |
| Total | 1,882 (100.0%) | $85,903 |
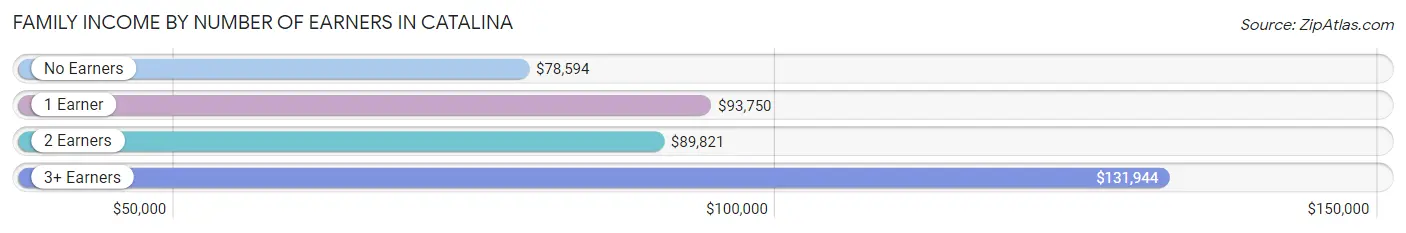
Family Income by Number of Earners in Catalina
The median family income in Catalina is $85,903, with families comprising 3+ earners (116) having the highest median family income of $131,944, while families with no earners (493) have the lowest median family income of $78,594, accounting for 6.2% and 26.2% of families, respectively.
| Number of Earners | # Families | Median Income |
| No Earners | 493 (26.2%) | $78,594 |
| 1 Earner | 438 (23.3%) | $93,750 |
| 2 Earners | 835 (44.4%) | $89,821 |
| 3+ Earners | 116 (6.2%) | $131,944 |
| Total | 1,882 (100.0%) | $85,903 |
Household Income in Catalina
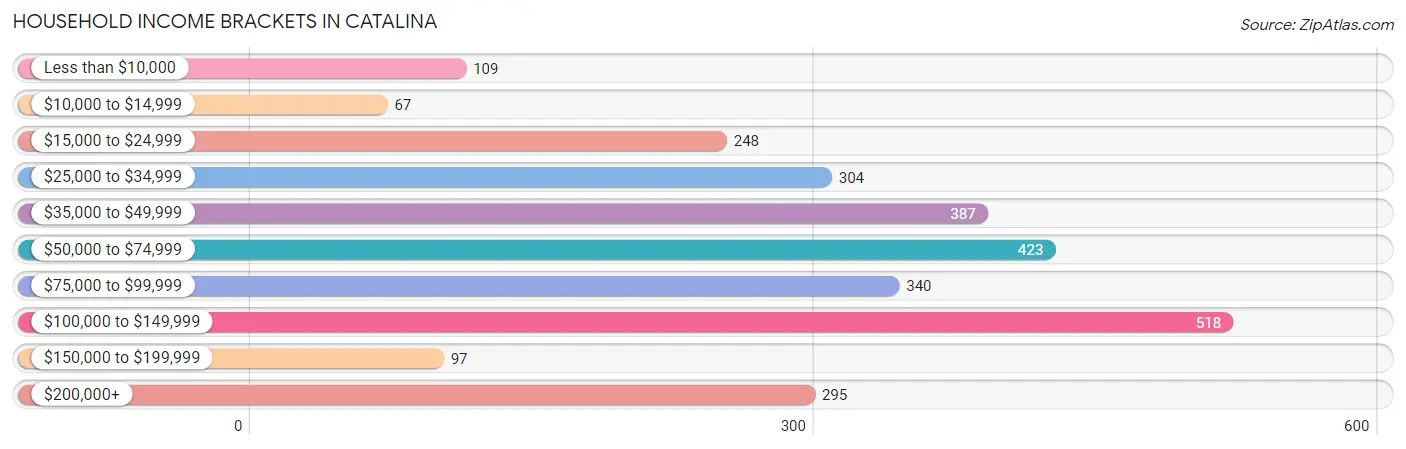
Household Income Brackets in Catalina
With 518 households falling in the category, the $100,000 to $149,999 income range is the most frequent in Catalina, accounting for 18.6% of all households. In contrast, only 67 households (2.4%) fall into the $10,000 to $14,999 income bracket, making it the least populous group.
| Income Bracket | # Households | % Households |
| Less than $10,000 | 109 | 3.9% |
| $10,000 to $14,999 | 67 | 2.4% |
| $15,000 to $24,999 | 248 | 8.9% |
| $25,000 to $34,999 | 304 | 10.9% |
| $35,000 to $49,999 | 387 | 13.9% |
| $50,000 to $74,999 | 423 | 15.2% |
| $75,000 to $99,999 | 340 | 12.2% |
| $100,000 to $149,999 | 518 | 18.6% |
| $150,000 to $199,999 | 97 | 3.5% |
| $200,000+ | 295 | 10.6% |
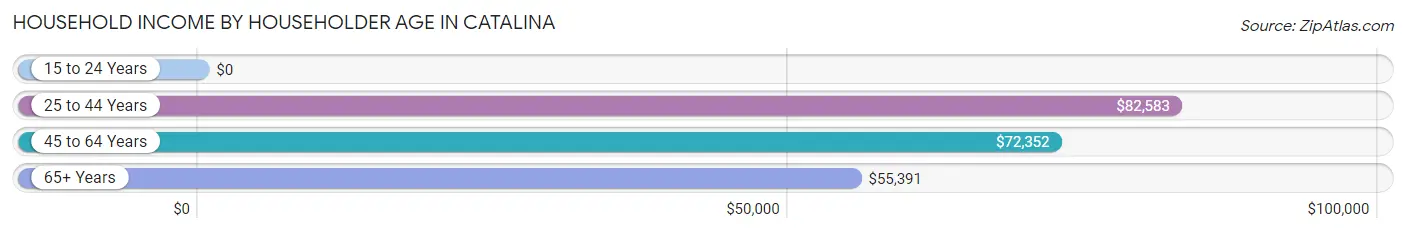
Household Income by Householder Age in Catalina
The median household income in Catalina is $69,243, with the highest median household income of $82,583 found in the 25 to 44 years age bracket for the primary householder. A total of 561 households (20.1%) fall into this category. Meanwhile, the 15 to 24 years age bracket for the primary householder has the lowest median household income of $0, with 27 households (1.0%) in this group.
| Income Bracket | # Households | Median Income |
| 15 to 24 Years | 27 (1.0%) | $0 |
| 25 to 44 Years | 561 (20.1%) | $82,583 |
| 45 to 64 Years | 1,059 (38.0%) | $72,352 |
| 65+ Years | 1,138 (40.9%) | $55,391 |
| Total | 2,785 (100.0%) | $69,243 |
Poverty in Catalina
Income Below Poverty by Sex and Age in Catalina
With 6.7% poverty level for males and 7.6% for females among the residents of Catalina, 16 and 17 year old males and 35 to 44 year old females are the most vulnerable to poverty, with 27 males (24.8%) and 48 females (17.0%) in their respective age groups living below the poverty level.
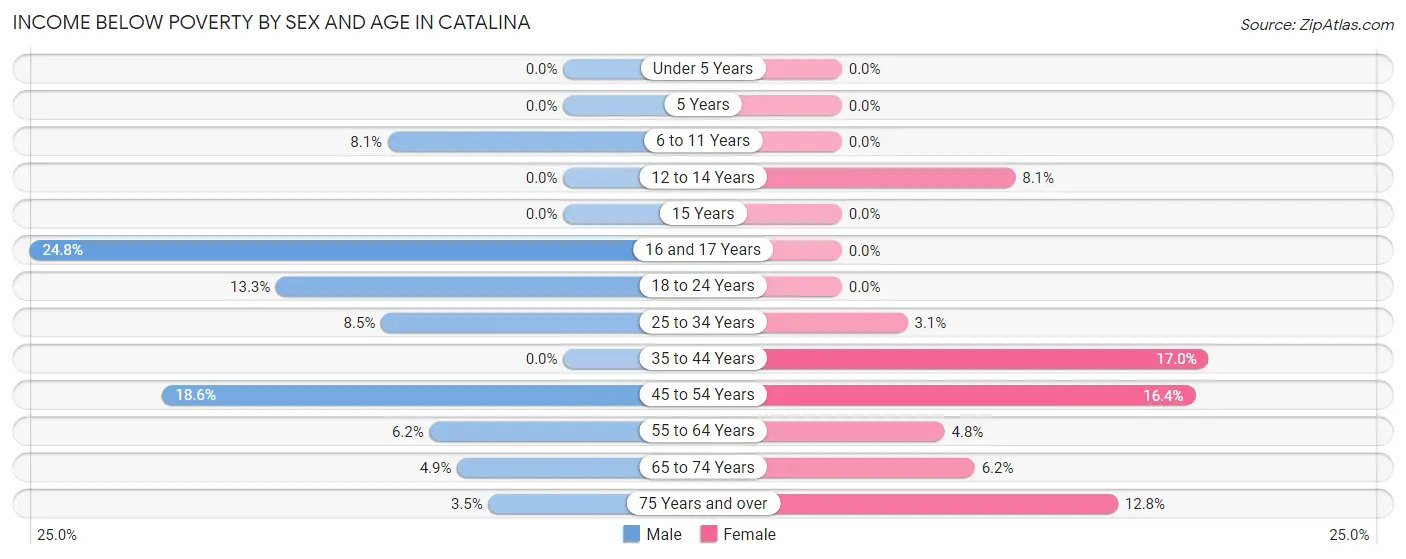
| Age Bracket | Male | Female |
| Under 5 Years | 0 (0.0%) | 0 (0.0%) |
| 5 Years | 0 (0.0%) | 0 (0.0%) |
| 6 to 11 Years | 25 (8.1%) | 0 (0.0%) |
| 12 to 14 Years | 0 (0.0%) | 7 (8.1%) |
| 15 Years | 0 (0.0%) | 0 (0.0%) |
| 16 and 17 Years | 27 (24.8%) | 0 (0.0%) |
| 18 to 24 Years | 10 (13.3%) | 0 (0.0%) |
| 25 to 34 Years | 35 (8.5%) | 8 (3.0%) |
| 35 to 44 Years | 0 (0.0%) | 48 (17.0%) |
| 45 to 54 Years | 32 (18.6%) | 61 (16.4%) |
| 55 to 64 Years | 48 (6.2%) | 28 (4.8%) |
| 65 to 74 Years | 32 (4.9%) | 41 (6.2%) |
| 75 Years and over | 6 (3.5%) | 46 (12.8%) |
| Total | 215 (6.7%) | 239 (7.6%) |
Income Above Poverty by Sex and Age in Catalina
According to the poverty statistics in Catalina, males aged under 5 years and females aged under 5 years are the age groups that are most secure financially, with 100.0% of males and 100.0% of females in these age groups living above the poverty line.
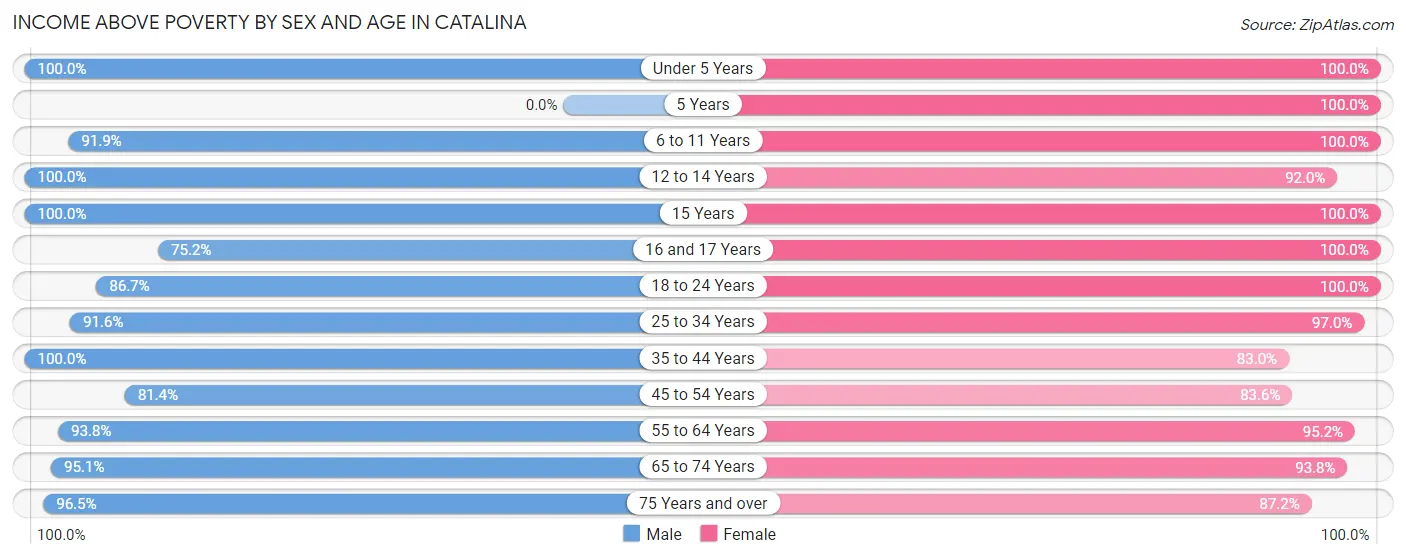
| Age Bracket | Male | Female |
| Under 5 Years | 91 (100.0%) | 121 (100.0%) |
| 5 Years | 0 (0.0%) | 31 (100.0%) |
| 6 to 11 Years | 282 (91.9%) | 145 (100.0%) |
| 12 to 14 Years | 60 (100.0%) | 80 (91.9%) |
| 15 Years | 53 (100.0%) | 13 (100.0%) |
| 16 and 17 Years | 82 (75.2%) | 32 (100.0%) |
| 18 to 24 Years | 65 (86.7%) | 191 (100.0%) |
| 25 to 34 Years | 379 (91.5%) | 254 (97.0%) |
| 35 to 44 Years | 345 (100.0%) | 234 (83.0%) |
| 45 to 54 Years | 140 (81.4%) | 311 (83.6%) |
| 55 to 64 Years | 725 (93.8%) | 559 (95.2%) |
| 65 to 74 Years | 618 (95.1%) | 624 (93.8%) |
| 75 Years and over | 167 (96.5%) | 313 (87.2%) |
| Total | 3,007 (93.3%) | 2,908 (92.4%) |
Income Below Poverty Among Married-Couple Families in Catalina
The poverty statistics for married-couple families in Catalina show that 1.1% or 17 of the total 1,481 families live below the poverty line. Families with no children have the highest poverty rate of 1.5%, comprising of 17 families. On the other hand, families with 1 or 2 children have the lowest poverty rate of 0.0%, which includes 0 families.
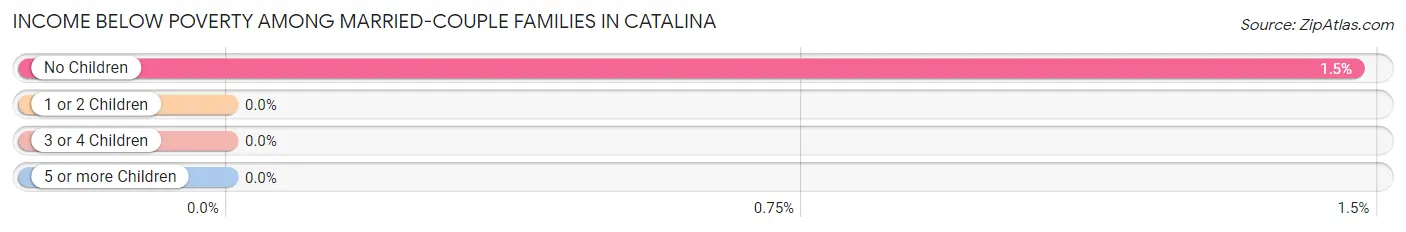
| Children | Above Poverty | Below Poverty |
| No Children | 1,143 (98.5%) | 17 (1.5%) |
| 1 or 2 Children | 195 (100.0%) | 0 (0.0%) |
| 3 or 4 Children | 113 (100.0%) | 0 (0.0%) |
| 5 or more Children | 13 (100.0%) | 0 (0.0%) |
| Total | 1,464 (98.9%) | 17 (1.1%) |
Income Below Poverty Among Single-Parent Households in Catalina
According to the poverty data in Catalina, 3.3% or 7 single-father households and 12.8% or 24 single-mother households are living below the poverty line. Among single-father households, those with 1 or 2 children have the highest poverty rate, with 7 households (4.6%) experiencing poverty. Likewise, among single-mother households, those with 1 or 2 children have the highest poverty rate, with 24 households (68.6%) falling below the poverty line.
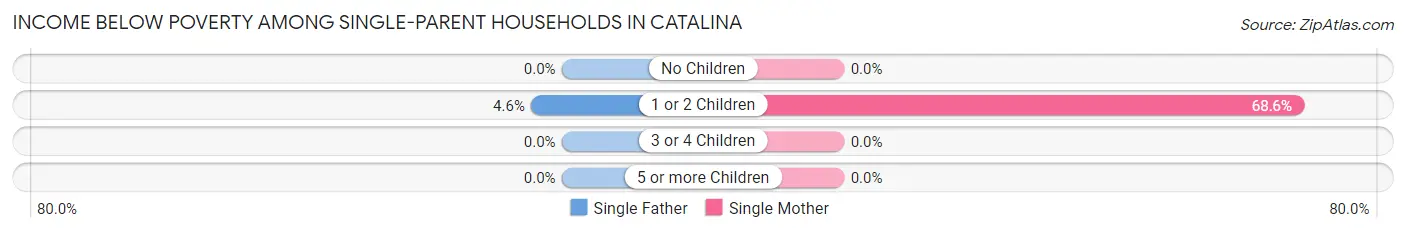
| Children | Single Father | Single Mother |
| No Children | 0 (0.0%) | 0 (0.0%) |
| 1 or 2 Children | 7 (4.6%) | 24 (68.6%) |
| 3 or 4 Children | 0 (0.0%) | 0 (0.0%) |
| 5 or more Children | 0 (0.0%) | 0 (0.0%) |
| Total | 7 (3.3%) | 24 (12.8%) |
Income Below Poverty Among Married-Couple vs Single-Parent Households in Catalina
The poverty data for Catalina shows that 17 of the married-couple family households (1.1%) and 31 of the single-parent households (7.7%) are living below the poverty level. Within the married-couple family households, those with no children have the highest poverty rate, with 17 households (1.5%) falling below the poverty line. Among the single-parent households, those with 1 or 2 children have the highest poverty rate, with 31 household (16.5%) living below poverty.
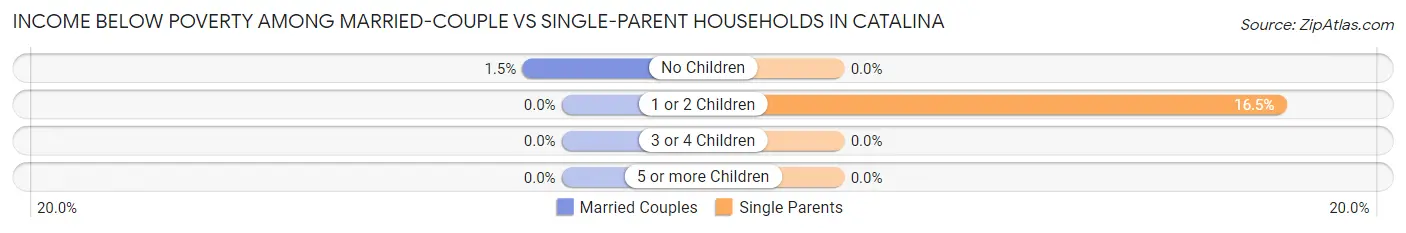
| Children | Married-Couple Families | Single-Parent Households |
| No Children | 17 (1.5%) | 0 (0.0%) |
| 1 or 2 Children | 0 (0.0%) | 31 (16.5%) |
| 3 or 4 Children | 0 (0.0%) | 0 (0.0%) |
| 5 or more Children | 0 (0.0%) | 0 (0.0%) |
| Total | 17 (1.1%) | 31 (7.7%) |
Employment Characteristics in Catalina
Employment by Class of Employer in Catalina
Among the 2,790 employed individuals in Catalina, private company employees (1,658 | 59.4%), self-employed (not incorporated) (322 | 11.5%), and not-for-profit organizations (199 | 7.1%) make up the most common classes of employment.
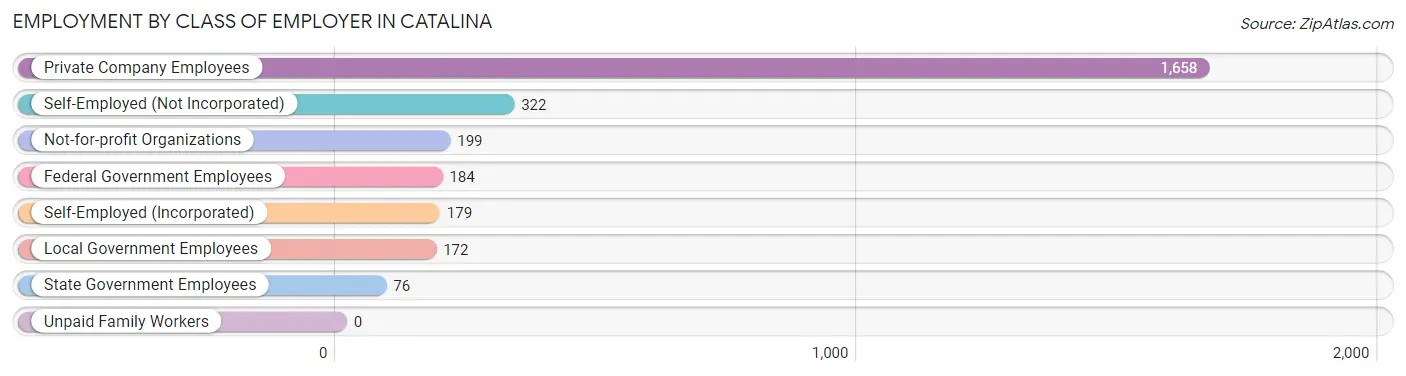
| Employer Class | # Employees | % Employees |
| Private Company Employees | 1,658 | 59.4% |
| Self-Employed (Incorporated) | 179 | 6.4% |
| Self-Employed (Not Incorporated) | 322 | 11.5% |
| Not-for-profit Organizations | 199 | 7.1% |
| Local Government Employees | 172 | 6.2% |
| State Government Employees | 76 | 2.7% |
| Federal Government Employees | 184 | 6.6% |
| Unpaid Family Workers | 0 | 0.0% |
| Total | 2,790 | 100.0% |
Employment Status by Age in Catalina
According to the labor force statistics for Catalina, out of the total population over 16 years of age (5,463), 54.4% or 2,972 individuals are in the labor force, with 3.3% or 98 of them unemployed. The age group with the highest labor force participation rate is 25 to 29 years, with 100.0% or 301 individuals in the labor force. Within the labor force, the 20 to 24 years age range has the highest percentage of unemployed individuals, with 10.3% or 12 of them being unemployed.
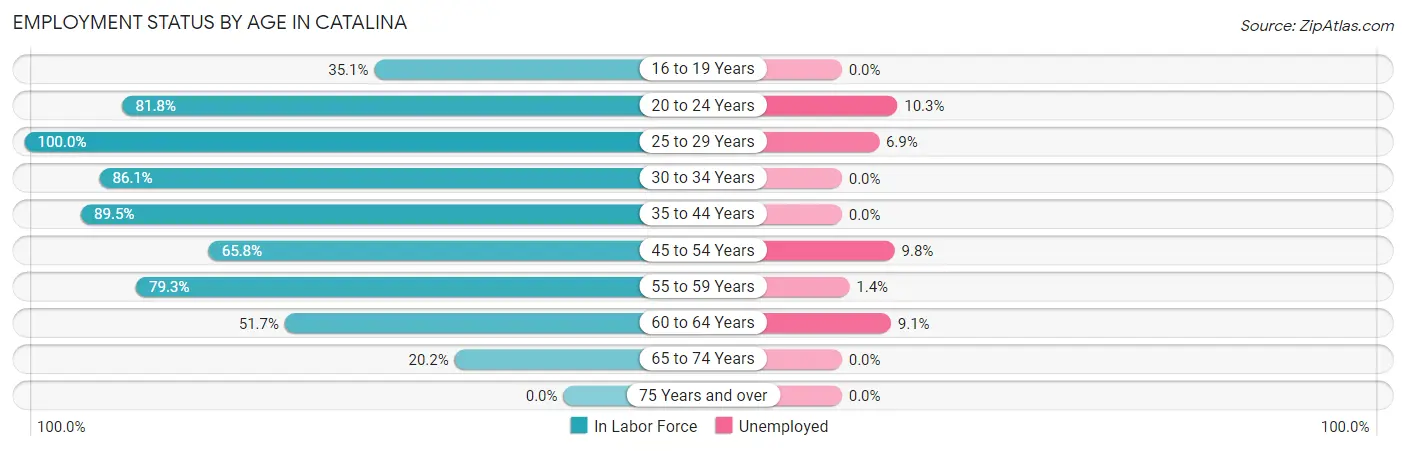
| Age Bracket | In Labor Force | Unemployed |
| 16 to 19 Years | 91 (35.1%) | 0 (0.0%) |
| 20 to 24 Years | 121 (81.8%) | 12 (10.3%) |
| 25 to 29 Years | 301 (100.0%) | 21 (6.9%) |
| 30 to 34 Years | 323 (86.1%) | 0 (0.0%) |
| 35 to 44 Years | 561 (89.5%) | 0 (0.0%) |
| 45 to 54 Years | 358 (65.8%) | 35 (9.8%) |
| 55 to 59 Years | 706 (79.3%) | 10 (1.4%) |
| 60 to 64 Years | 243 (51.7%) | 22 (9.1%) |
| 65 to 74 Years | 266 (20.2%) | 0 (0.0%) |
| 75 Years and over | 0 (0.0%) | 0 (0.0%) |
| Total | 2,972 (54.4%) | 98 (3.3%) |
Employment Status by Educational Attainment in Catalina
According to labor force statistics for Catalina, 77.7% of individuals (2,492) out of the total population between 25 and 64 years of age (3,207) are in the labor force, with 3.5% or 87 of them being unemployed. The group with the highest labor force participation rate are those with the educational attainment of bachelor's degree or higher, with 89.0% or 810 individuals in the labor force. Within the labor force, individuals with bachelor's degree or higher education have the highest percentage of unemployment, with 6.0% or 49 of them being unemployed.
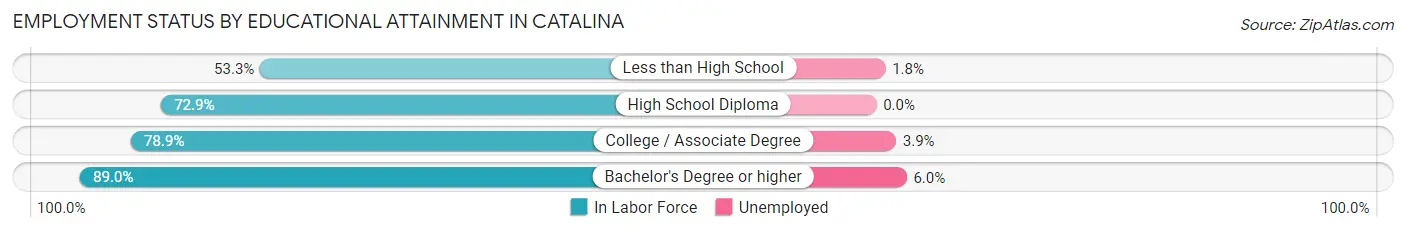
| Educational Attainment | In Labor Force | Unemployed |
| Less than High School | 170 (53.3%) | 6 (1.8%) |
| High School Diploma | 587 (72.9%) | 0 (0.0%) |
| College / Associate Degree | 925 (78.9%) | 46 (3.9%) |
| Bachelor's Degree or higher | 810 (89.0%) | 55 (6.0%) |
| Total | 2,492 (77.7%) | 112 (3.5%) |
Employment Occupations by Sex in Catalina
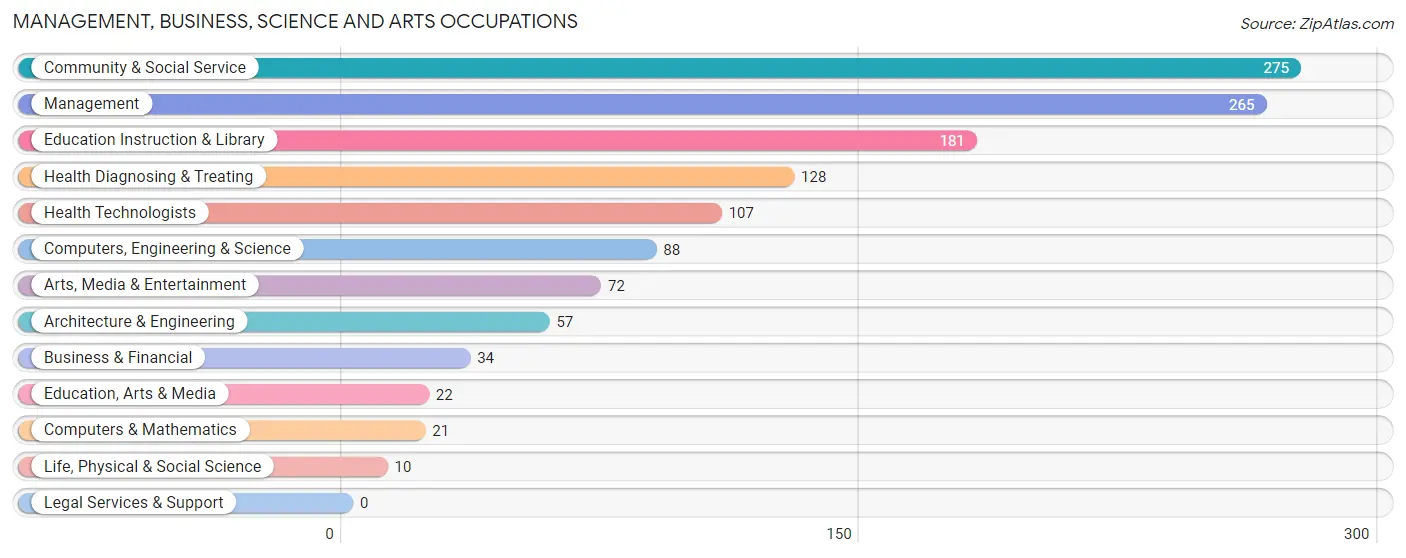
Management, Business, Science and Arts Occupations
The most common Management, Business, Science and Arts occupations in Catalina are Community & Social Service (275 | 9.7%), Management (265 | 9.4%), Education Instruction & Library (181 | 6.4%), Health Diagnosing & Treating (128 | 4.5%), and Health Technologists (107 | 3.8%).
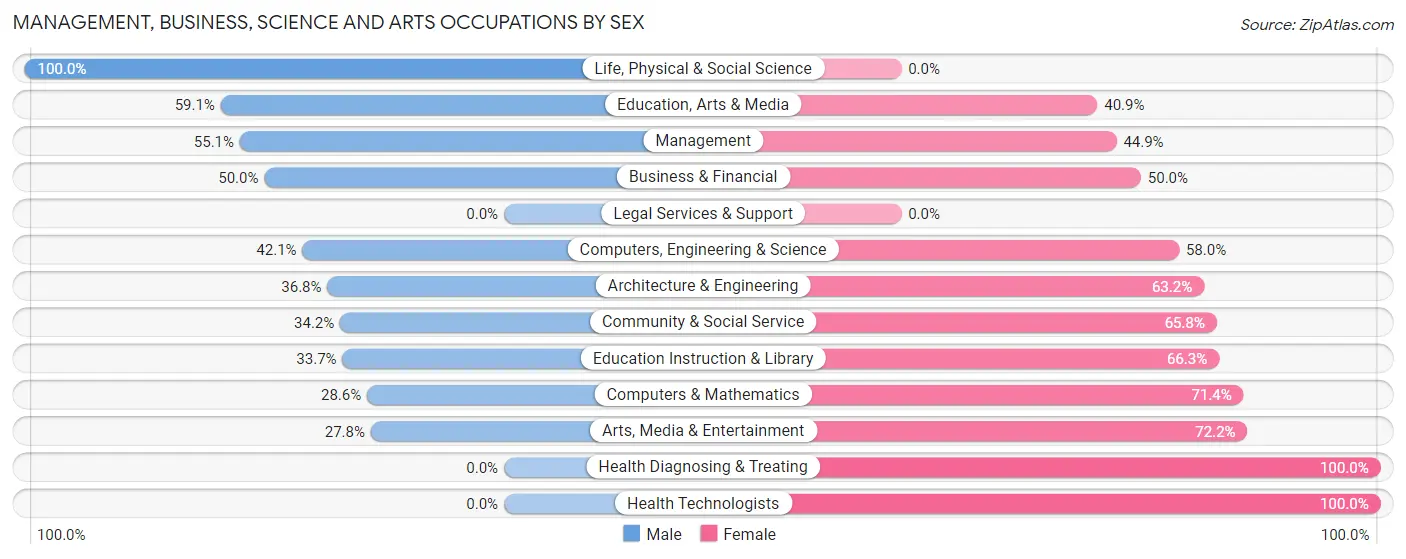
Management, Business, Science and Arts Occupations by Sex
Within the Management, Business, Science and Arts occupations in Catalina, the most male-oriented occupations are Life, Physical & Social Science (100.0%), Education, Arts & Media (59.1%), and Management (55.1%), while the most female-oriented occupations are Health Diagnosing & Treating (100.0%), Health Technologists (100.0%), and Arts, Media & Entertainment (72.2%).
| Occupation | Male | Female |
| Management | 146 (55.1%) | 119 (44.9%) |
| Business & Financial | 17 (50.0%) | 17 (50.0%) |
| Computers, Engineering & Science | 37 (42.0%) | 51 (58.0%) |
| Computers & Mathematics | 6 (28.6%) | 15 (71.4%) |
| Architecture & Engineering | 21 (36.8%) | 36 (63.2%) |
| Life, Physical & Social Science | 10 (100.0%) | 0 (0.0%) |
| Community & Social Service | 94 (34.2%) | 181 (65.8%) |
| Education, Arts & Media | 13 (59.1%) | 9 (40.9%) |
| Legal Services & Support | 0 (0.0%) | 0 (0.0%) |
| Education Instruction & Library | 61 (33.7%) | 120 (66.3%) |
| Arts, Media & Entertainment | 20 (27.8%) | 52 (72.2%) |
| Health Diagnosing & Treating | 0 (0.0%) | 128 (100.0%) |
| Health Technologists | 0 (0.0%) | 107 (100.0%) |
| Total (Category) | 294 (37.2%) | 496 (62.8%) |
| Total (Overall) | 1,514 (53.5%) | 1,315 (46.5%) |
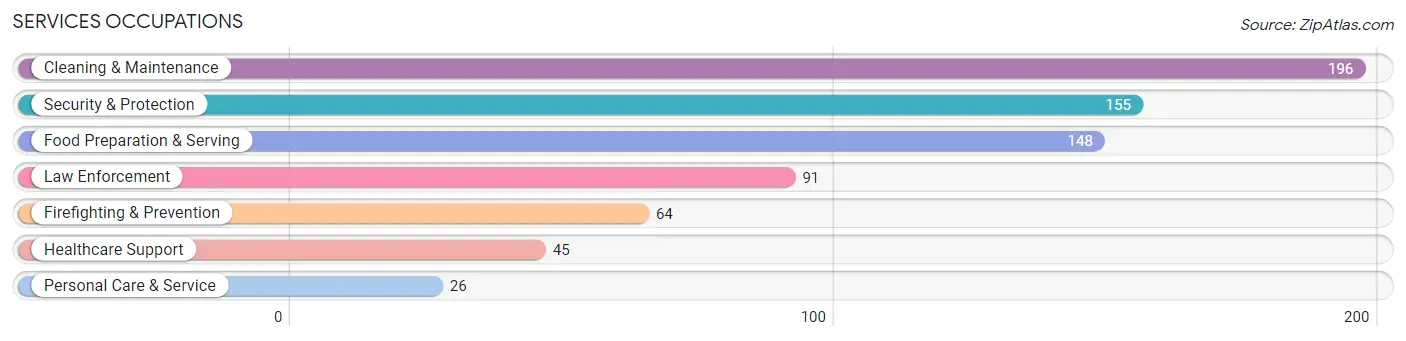
Services Occupations
The most common Services occupations in Catalina are Cleaning & Maintenance (196 | 6.9%), Security & Protection (155 | 5.5%), Food Preparation & Serving (148 | 5.2%), Law Enforcement (91 | 3.2%), and Firefighting & Prevention (64 | 2.3%).
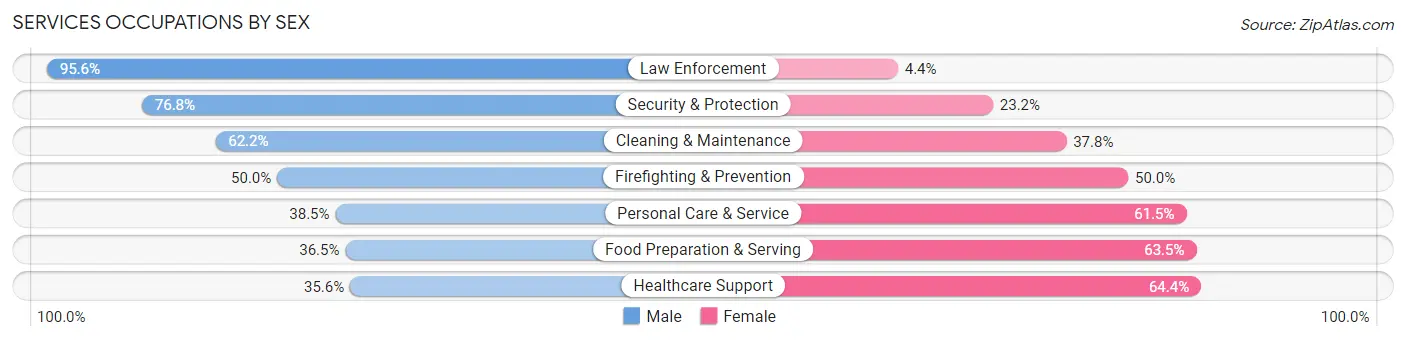
Services Occupations by Sex
Within the Services occupations in Catalina, the most male-oriented occupations are Law Enforcement (95.6%), Security & Protection (76.8%), and Cleaning & Maintenance (62.2%), while the most female-oriented occupations are Healthcare Support (64.4%), Food Preparation & Serving (63.5%), and Personal Care & Service (61.5%).
| Occupation | Male | Female |
| Healthcare Support | 16 (35.6%) | 29 (64.4%) |
| Security & Protection | 119 (76.8%) | 36 (23.2%) |
| Firefighting & Prevention | 32 (50.0%) | 32 (50.0%) |
| Law Enforcement | 87 (95.6%) | 4 (4.4%) |
| Food Preparation & Serving | 54 (36.5%) | 94 (63.5%) |
| Cleaning & Maintenance | 122 (62.2%) | 74 (37.8%) |
| Personal Care & Service | 10 (38.5%) | 16 (61.5%) |
| Total (Category) | 321 (56.3%) | 249 (43.7%) |
| Total (Overall) | 1,514 (53.5%) | 1,315 (46.5%) |
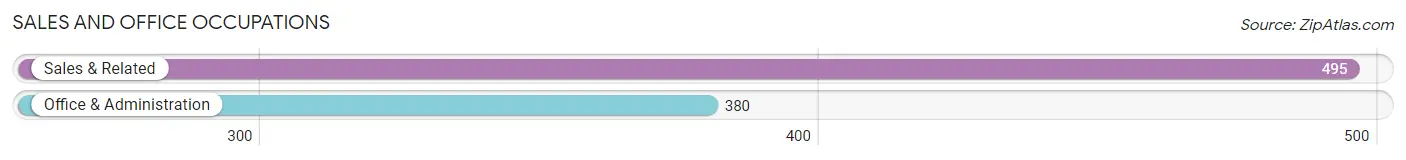
Sales and Office Occupations
The most common Sales and Office occupations in Catalina are Sales & Related (495 | 17.5%), and Office & Administration (380 | 13.4%).
Sales and Office Occupations by Sex
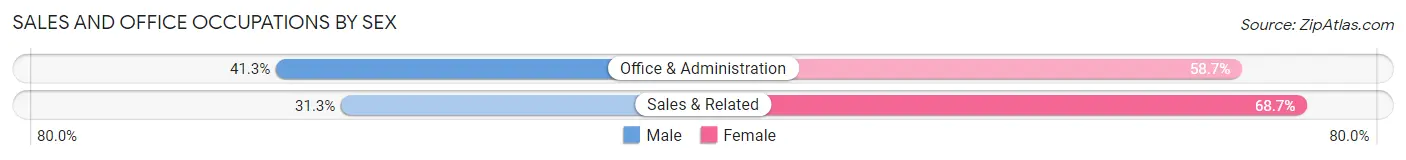
| Occupation | Male | Female |
| Sales & Related | 155 (31.3%) | 340 (68.7%) |
| Office & Administration | 157 (41.3%) | 223 (58.7%) |
| Total (Category) | 312 (35.7%) | 563 (64.3%) |
| Total (Overall) | 1,514 (53.5%) | 1,315 (46.5%) |
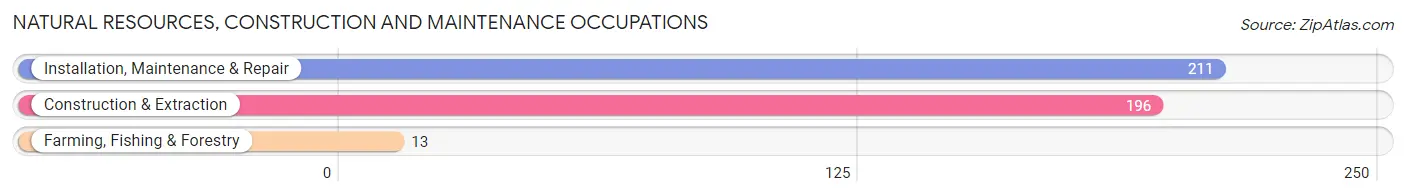
Natural Resources, Construction and Maintenance Occupations
The most common Natural Resources, Construction and Maintenance occupations in Catalina are Installation, Maintenance & Repair (211 | 7.5%), Construction & Extraction (196 | 6.9%), and Farming, Fishing & Forestry (13 | 0.5%).
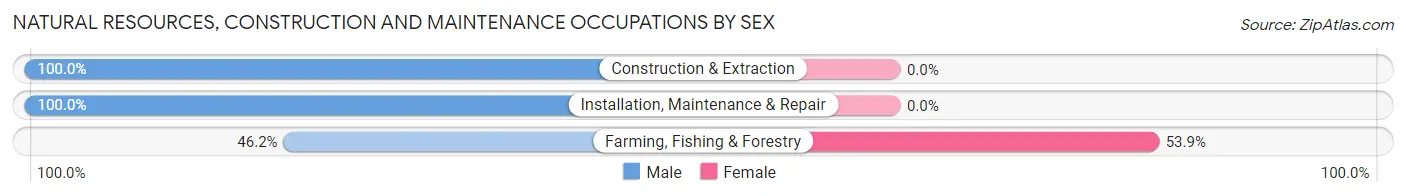
Natural Resources, Construction and Maintenance Occupations by Sex
| Occupation | Male | Female |
| Farming, Fishing & Forestry | 6 (46.2%) | 7 (53.8%) |
| Construction & Extraction | 196 (100.0%) | 0 (0.0%) |
| Installation, Maintenance & Repair | 211 (100.0%) | 0 (0.0%) |
| Total (Category) | 413 (98.3%) | 7 (1.7%) |
| Total (Overall) | 1,514 (53.5%) | 1,315 (46.5%) |
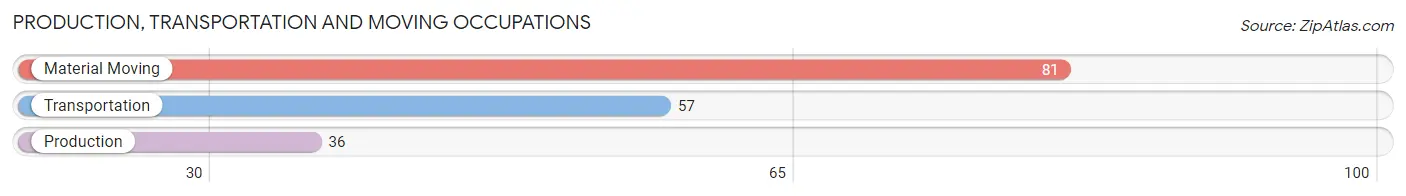
Production, Transportation and Moving Occupations
The most common Production, Transportation and Moving occupations in Catalina are Material Moving (81 | 2.9%), Transportation (57 | 2.0%), and Production (36 | 1.3%).
Production, Transportation and Moving Occupations by Sex
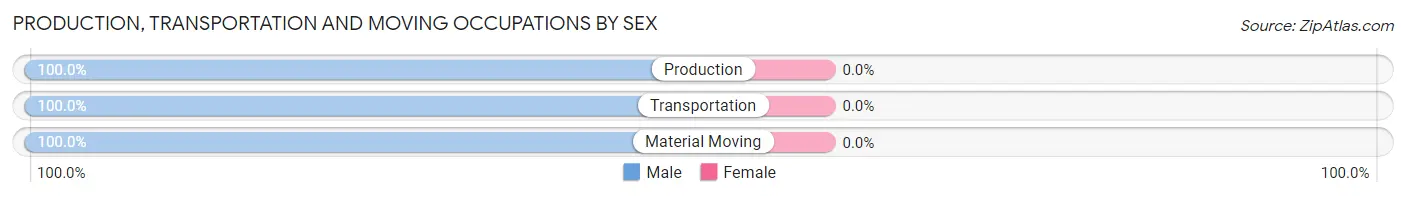
| Occupation | Male | Female |
| Production | 36 (100.0%) | 0 (0.0%) |
| Transportation | 57 (100.0%) | 0 (0.0%) |
| Material Moving | 81 (100.0%) | 0 (0.0%) |
| Total (Category) | 174 (100.0%) | 0 (0.0%) |
| Total (Overall) | 1,514 (53.5%) | 1,315 (46.5%) |
Employment Industries by Sex in Catalina
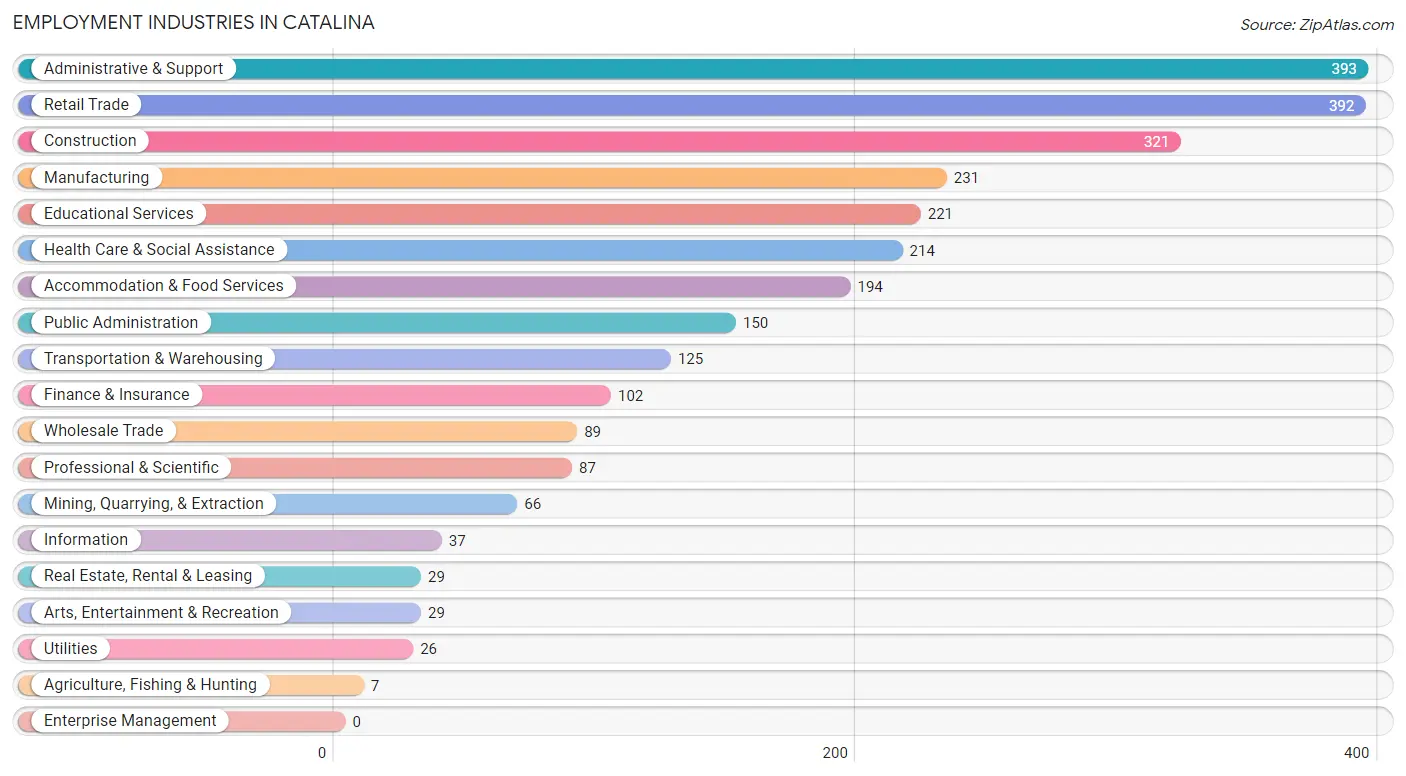
Employment Industries in Catalina
The major employment industries in Catalina include Administrative & Support (393 | 13.9%), Retail Trade (392 | 13.9%), Construction (321 | 11.4%), Manufacturing (231 | 8.2%), and Educational Services (221 | 7.8%).
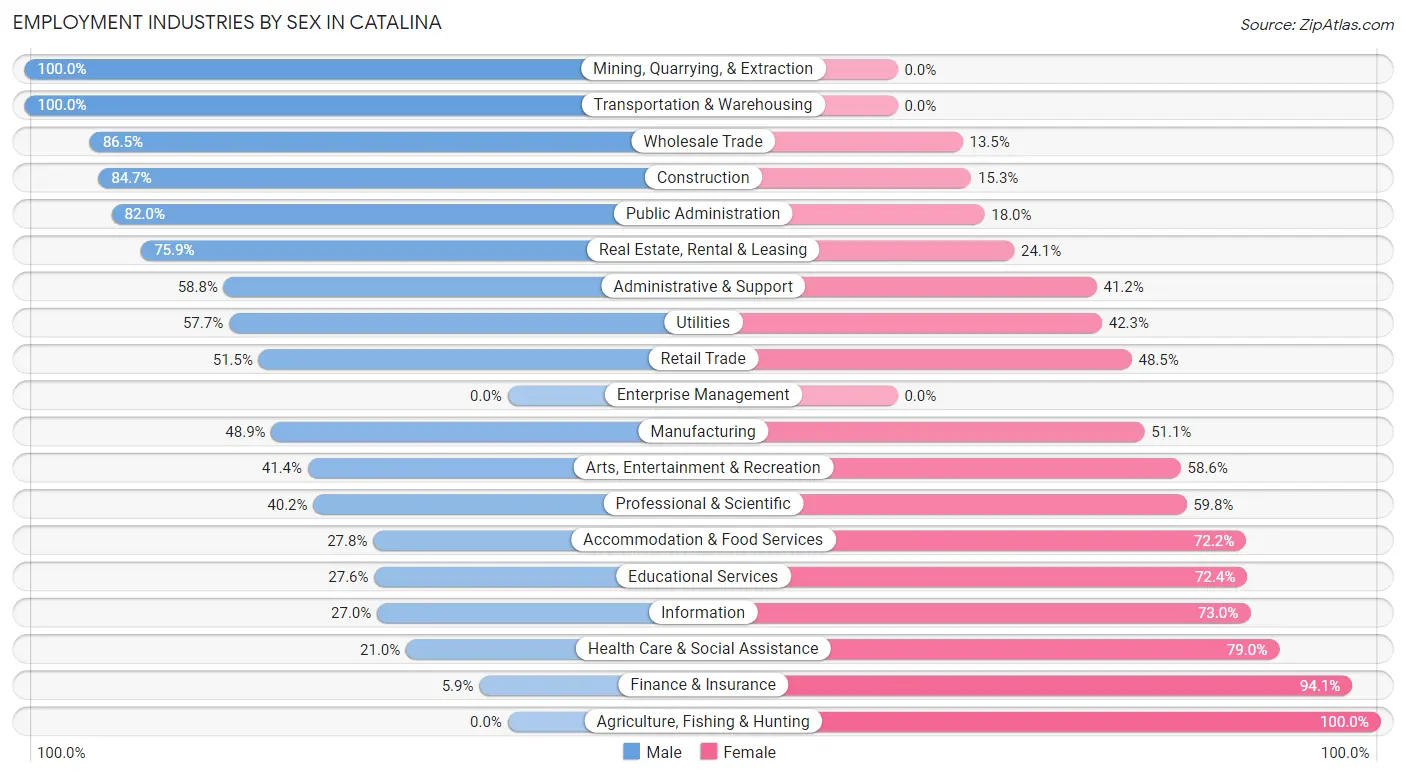
Employment Industries by Sex in Catalina
The Catalina industries that see more men than women are Mining, Quarrying, & Extraction (100.0%), Transportation & Warehousing (100.0%), and Wholesale Trade (86.5%), whereas the industries that tend to have a higher number of women are Agriculture, Fishing & Hunting (100.0%), Finance & Insurance (94.1%), and Health Care & Social Assistance (79.0%).
| Industry | Male | Female |
| Agriculture, Fishing & Hunting | 0 (0.0%) | 7 (100.0%) |
| Mining, Quarrying, & Extraction | 66 (100.0%) | 0 (0.0%) |
| Construction | 272 (84.7%) | 49 (15.3%) |
| Manufacturing | 113 (48.9%) | 118 (51.1%) |
| Wholesale Trade | 77 (86.5%) | 12 (13.5%) |
| Retail Trade | 202 (51.5%) | 190 (48.5%) |
| Transportation & Warehousing | 125 (100.0%) | 0 (0.0%) |
| Utilities | 15 (57.7%) | 11 (42.3%) |
| Information | 10 (27.0%) | 27 (73.0%) |
| Finance & Insurance | 6 (5.9%) | 96 (94.1%) |
| Real Estate, Rental & Leasing | 22 (75.9%) | 7 (24.1%) |
| Professional & Scientific | 35 (40.2%) | 52 (59.8%) |
| Enterprise Management | 0 (0.0%) | 0 (0.0%) |
| Administrative & Support | 231 (58.8%) | 162 (41.2%) |
| Educational Services | 61 (27.6%) | 160 (72.4%) |
| Health Care & Social Assistance | 45 (21.0%) | 169 (79.0%) |
| Arts, Entertainment & Recreation | 12 (41.4%) | 17 (58.6%) |
| Accommodation & Food Services | 54 (27.8%) | 140 (72.2%) |
| Public Administration | 123 (82.0%) | 27 (18.0%) |
| Total | 1,514 (53.5%) | 1,315 (46.5%) |
Education in Catalina
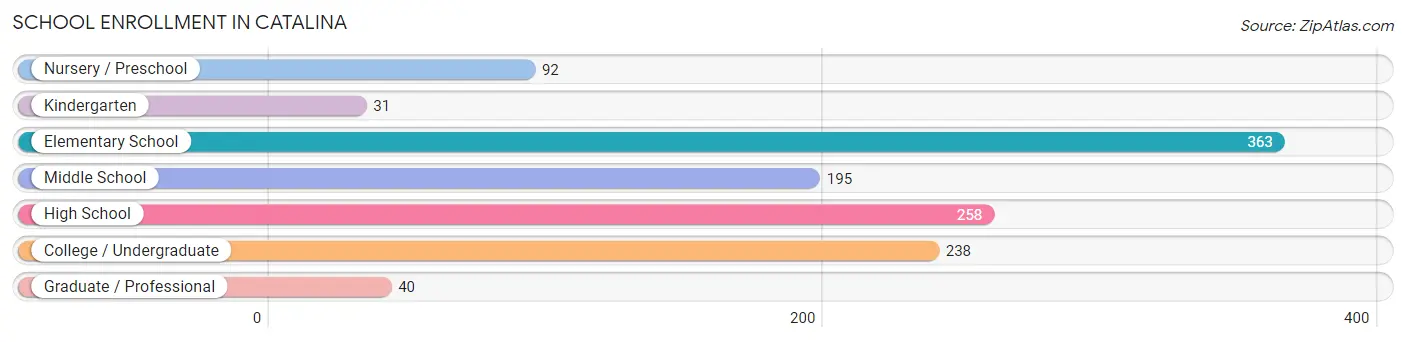
School Enrollment in Catalina
The most common levels of schooling among the 1,217 students in Catalina are elementary school (363 | 29.8%), high school (258 | 21.2%), and college / undergraduate (238 | 19.6%).
| School Level | # Students | % Students |
| Nursery / Preschool | 92 | 7.6% |
| Kindergarten | 31 | 2.5% |
| Elementary School | 363 | 29.8% |
| Middle School | 195 | 16.0% |
| High School | 258 | 21.2% |
| College / Undergraduate | 238 | 19.6% |
| Graduate / Professional | 40 | 3.3% |
| Total | 1,217 | 100.0% |
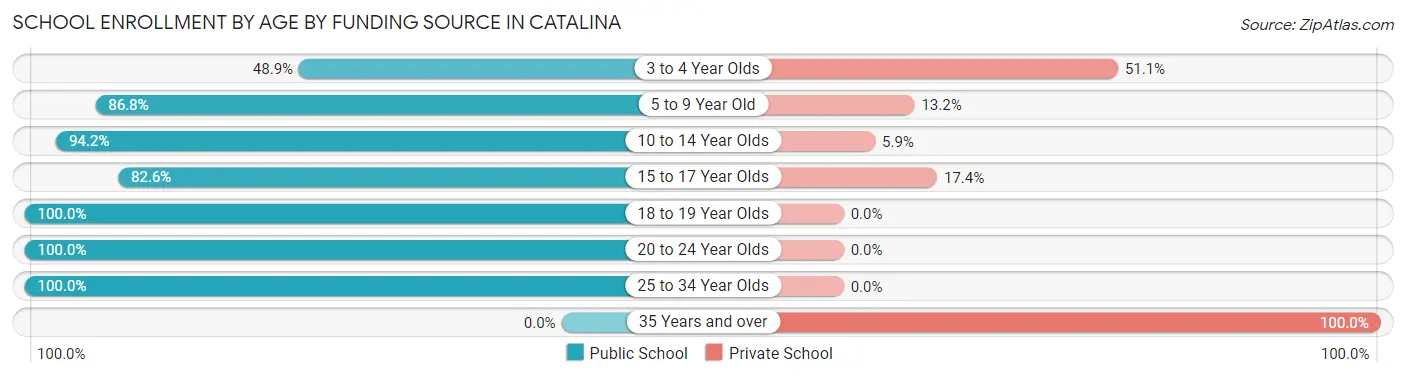
School Enrollment by Age by Funding Source in Catalina
Out of a total of 1,217 students who are enrolled in schools in Catalina, 191 (15.7%) attend a private institution, while the remaining 1,026 (84.3%) are enrolled in public schools. The age group of 35 years and over has the highest likelihood of being enrolled in private schools, with 50 (100.0% in the age bracket) enrolled. Conversely, the age group of 18 to 19 year olds has the lowest likelihood of being enrolled in a private school, with 101 (100.0% in the age bracket) attending a public institution.
| Age Bracket | Public School | Private School |
| 3 to 4 Year Olds | 45 (48.9%) | 47 (51.1%) |
| 5 to 9 Year Old | 250 (86.8%) | 38 (13.2%) |
| 10 to 14 Year Olds | 322 (94.2%) | 20 (5.9%) |
| 15 to 17 Year Olds | 171 (82.6%) | 36 (17.4%) |
| 18 to 19 Year Olds | 101 (100.0%) | 0 (0.0%) |
| 20 to 24 Year Olds | 35 (100.0%) | 0 (0.0%) |
| 25 to 34 Year Olds | 102 (100.0%) | 0 (0.0%) |
| 35 Years and over | 0 (0.0%) | 50 (100.0%) |
| Total | 1,026 (84.3%) | 191 (15.7%) |
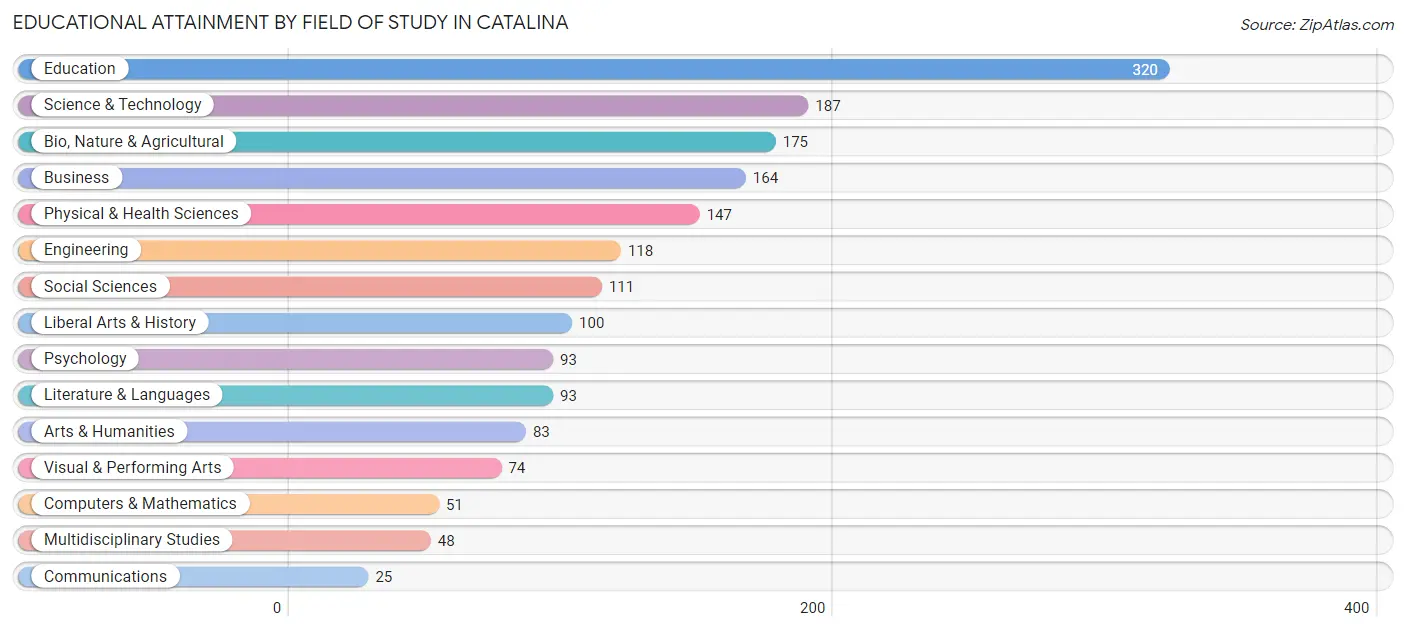
Educational Attainment by Field of Study in Catalina
Education (320 | 17.9%), science & technology (187 | 10.4%), bio, nature & agricultural (175 | 9.8%), business (164 | 9.2%), and physical & health sciences (147 | 8.2%) are the most common fields of study among 1,789 individuals in Catalina who have obtained a bachelor's degree or higher.
| Field of Study | # Graduates | % Graduates |
| Computers & Mathematics | 51 | 2.9% |
| Bio, Nature & Agricultural | 175 | 9.8% |
| Physical & Health Sciences | 147 | 8.2% |
| Psychology | 93 | 5.2% |
| Social Sciences | 111 | 6.2% |
| Engineering | 118 | 6.6% |
| Multidisciplinary Studies | 48 | 2.7% |
| Science & Technology | 187 | 10.4% |
| Business | 164 | 9.2% |
| Education | 320 | 17.9% |
| Literature & Languages | 93 | 5.2% |
| Liberal Arts & History | 100 | 5.6% |
| Visual & Performing Arts | 74 | 4.1% |
| Communications | 25 | 1.4% |
| Arts & Humanities | 83 | 4.6% |
| Total | 1,789 | 100.0% |
Transportation & Commute in Catalina
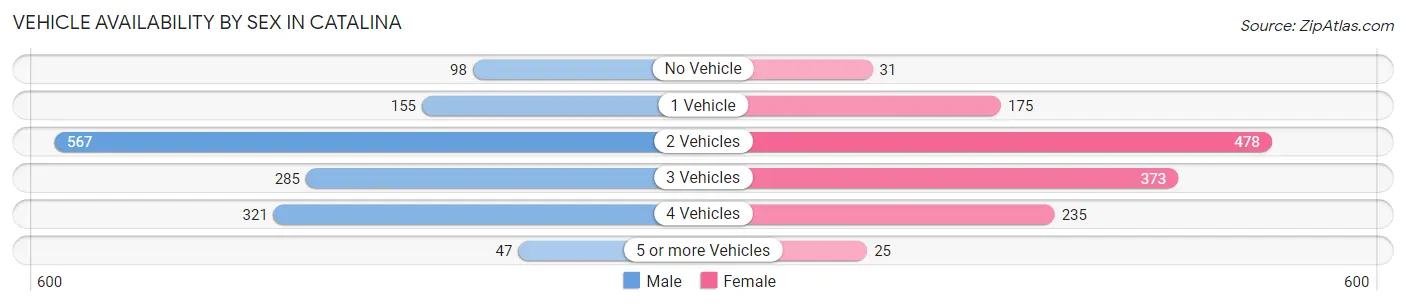
Vehicle Availability by Sex in Catalina
The most prevalent vehicle ownership categories in Catalina are males with 2 vehicles (567, accounting for 38.5%) and females with 2 vehicles (478, making up 43.0%).
| Vehicles Available | Male | Female |
| No Vehicle | 98 (6.7%) | 31 (2.4%) |
| 1 Vehicle | 155 (10.5%) | 175 (13.3%) |
| 2 Vehicles | 567 (38.5%) | 478 (36.3%) |
| 3 Vehicles | 285 (19.4%) | 373 (28.3%) |
| 4 Vehicles | 321 (21.8%) | 235 (17.8%) |
| 5 or more Vehicles | 47 (3.2%) | 25 (1.9%) |
| Total | 1,473 (100.0%) | 1,317 (100.0%) |
Commute Time in Catalina
The most frequently occuring commute durations in Catalina are 10 to 14 minutes (375 commuters, 15.2%), 30 to 34 minutes (359 commuters, 14.6%), and 60 to 89 minutes (340 commuters, 13.8%).
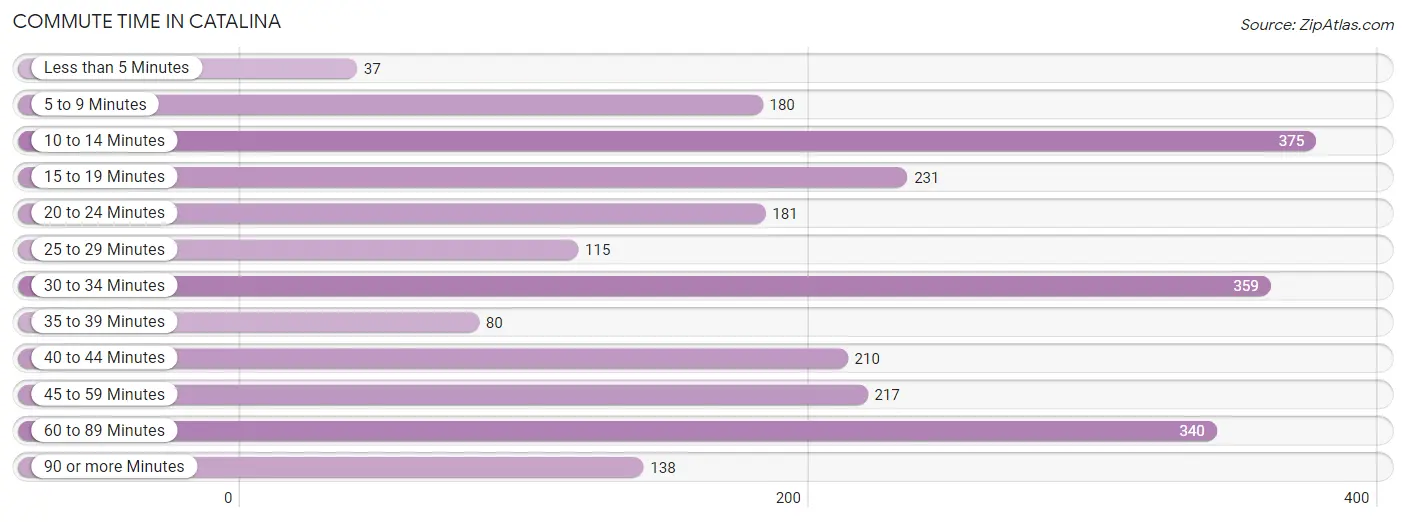
| Commute Time | # Commuters | % Commuters |
| Less than 5 Minutes | 37 | 1.5% |
| 5 to 9 Minutes | 180 | 7.3% |
| 10 to 14 Minutes | 375 | 15.2% |
| 15 to 19 Minutes | 231 | 9.4% |
| 20 to 24 Minutes | 181 | 7.3% |
| 25 to 29 Minutes | 115 | 4.7% |
| 30 to 34 Minutes | 359 | 14.6% |
| 35 to 39 Minutes | 80 | 3.3% |
| 40 to 44 Minutes | 210 | 8.5% |
| 45 to 59 Minutes | 217 | 8.8% |
| 60 to 89 Minutes | 340 | 13.8% |
| 90 or more Minutes | 138 | 5.6% |
Commute Time by Sex in Catalina
The most common commute times in Catalina are 60 to 89 minutes (248 commuters, 18.6%) for males and 10 to 14 minutes (276 commuters, 24.4%) for females.
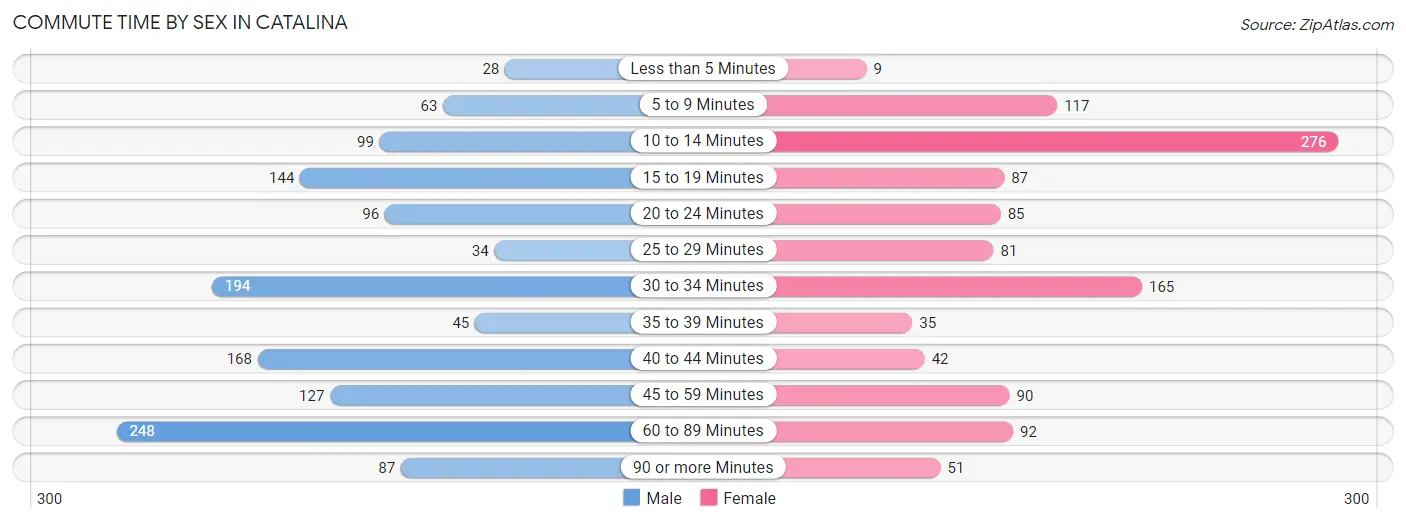
| Commute Time | Male | Female |
| Less than 5 Minutes | 28 (2.1%) | 9 (0.8%) |
| 5 to 9 Minutes | 63 (4.7%) | 117 (10.3%) |
| 10 to 14 Minutes | 99 (7.4%) | 276 (24.4%) |
| 15 to 19 Minutes | 144 (10.8%) | 87 (7.7%) |
| 20 to 24 Minutes | 96 (7.2%) | 85 (7.5%) |
| 25 to 29 Minutes | 34 (2.5%) | 81 (7.2%) |
| 30 to 34 Minutes | 194 (14.5%) | 165 (14.6%) |
| 35 to 39 Minutes | 45 (3.4%) | 35 (3.1%) |
| 40 to 44 Minutes | 168 (12.6%) | 42 (3.7%) |
| 45 to 59 Minutes | 127 (9.5%) | 90 (8.0%) |
| 60 to 89 Minutes | 248 (18.6%) | 92 (8.1%) |
| 90 or more Minutes | 87 (6.5%) | 51 (4.5%) |
Time of Departure to Work by Sex in Catalina
The most frequent times of departure to work in Catalina are 6:30 AM to 6:59 AM (222, 16.7%) for males and 12:00 PM to 3:59 PM (155, 13.7%) for females.
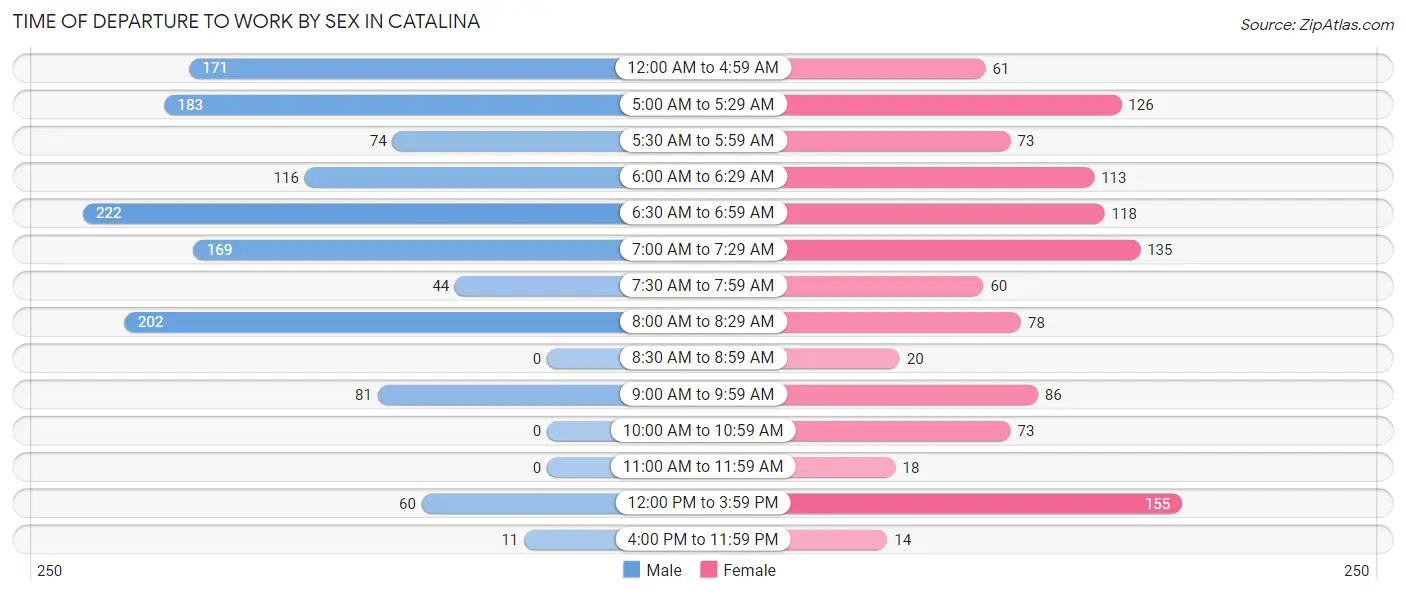
| Time of Departure | Male | Female |
| 12:00 AM to 4:59 AM | 171 (12.8%) | 61 (5.4%) |
| 5:00 AM to 5:29 AM | 183 (13.7%) | 126 (11.2%) |
| 5:30 AM to 5:59 AM | 74 (5.6%) | 73 (6.5%) |
| 6:00 AM to 6:29 AM | 116 (8.7%) | 113 (10.0%) |
| 6:30 AM to 6:59 AM | 222 (16.7%) | 118 (10.4%) |
| 7:00 AM to 7:29 AM | 169 (12.7%) | 135 (11.9%) |
| 7:30 AM to 7:59 AM | 44 (3.3%) | 60 (5.3%) |
| 8:00 AM to 8:29 AM | 202 (15.1%) | 78 (6.9%) |
| 8:30 AM to 8:59 AM | 0 (0.0%) | 20 (1.8%) |
| 9:00 AM to 9:59 AM | 81 (6.1%) | 86 (7.6%) |
| 10:00 AM to 10:59 AM | 0 (0.0%) | 73 (6.5%) |
| 11:00 AM to 11:59 AM | 0 (0.0%) | 18 (1.6%) |
| 12:00 PM to 3:59 PM | 60 (4.5%) | 155 (13.7%) |
| 4:00 PM to 11:59 PM | 11 (0.8%) | 14 (1.2%) |
| Total | 1,333 (100.0%) | 1,130 (100.0%) |
Housing Occupancy in Catalina
Occupancy by Ownership in Catalina
Of the total 2,785 dwellings in Catalina, owner-occupied units account for 2,342 (84.1%), while renter-occupied units make up 443 (15.9%).
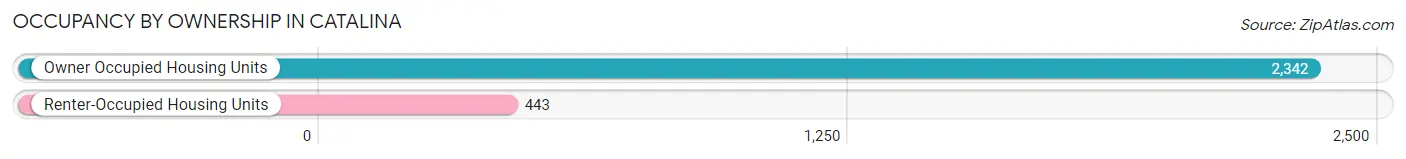
| Occupancy | # Housing Units | % Housing Units |
| Owner Occupied Housing Units | 2,342 | 84.1% |
| Renter-Occupied Housing Units | 443 | 15.9% |
| Total Occupied Housing Units | 2,785 | 100.0% |
Occupancy by Household Size in Catalina
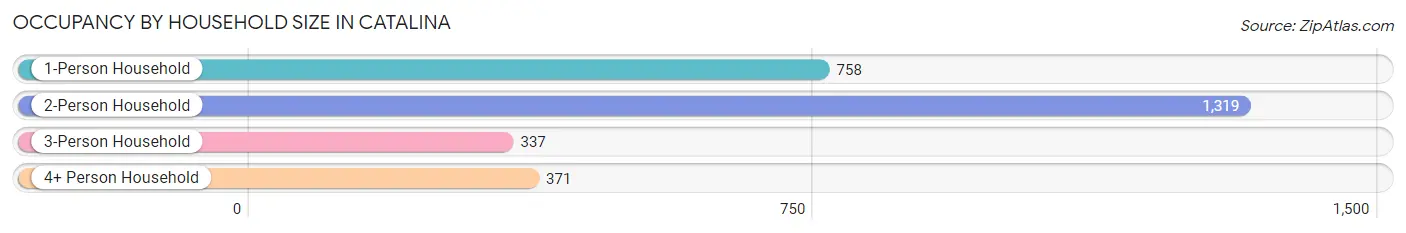
| Household Size | # Housing Units | % Housing Units |
| 1-Person Household | 758 | 27.2% |
| 2-Person Household | 1,319 | 47.4% |
| 3-Person Household | 337 | 12.1% |
| 4+ Person Household | 371 | 13.3% |
| Total Housing Units | 2,785 | 100.0% |
Occupancy by Ownership by Household Size in Catalina
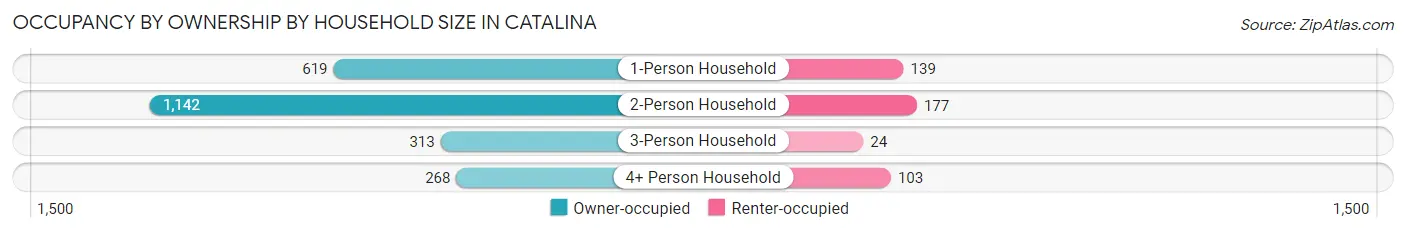
| Household Size | Owner-occupied | Renter-occupied |
| 1-Person Household | 619 (81.7%) | 139 (18.3%) |
| 2-Person Household | 1,142 (86.6%) | 177 (13.4%) |
| 3-Person Household | 313 (92.9%) | 24 (7.1%) |
| 4+ Person Household | 268 (72.2%) | 103 (27.8%) |
| Total Housing Units | 2,342 (84.1%) | 443 (15.9%) |
Occupancy by Educational Attainment in Catalina
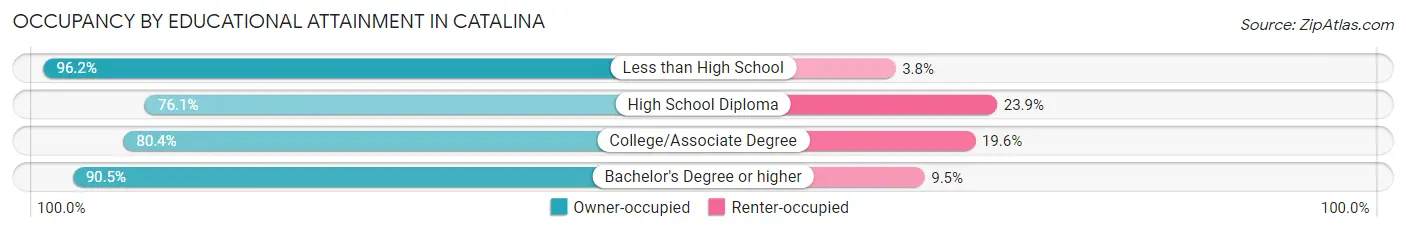
| Household Size | Owner-occupied | Renter-occupied |
| Less than High School | 204 (96.2%) | 8 (3.8%) |
| High School Diploma | 436 (76.1%) | 137 (23.9%) |
| College/Associate Degree | 858 (80.4%) | 209 (19.6%) |
| Bachelor's Degree or higher | 844 (90.5%) | 89 (9.5%) |
Occupancy by Age of Householder in Catalina
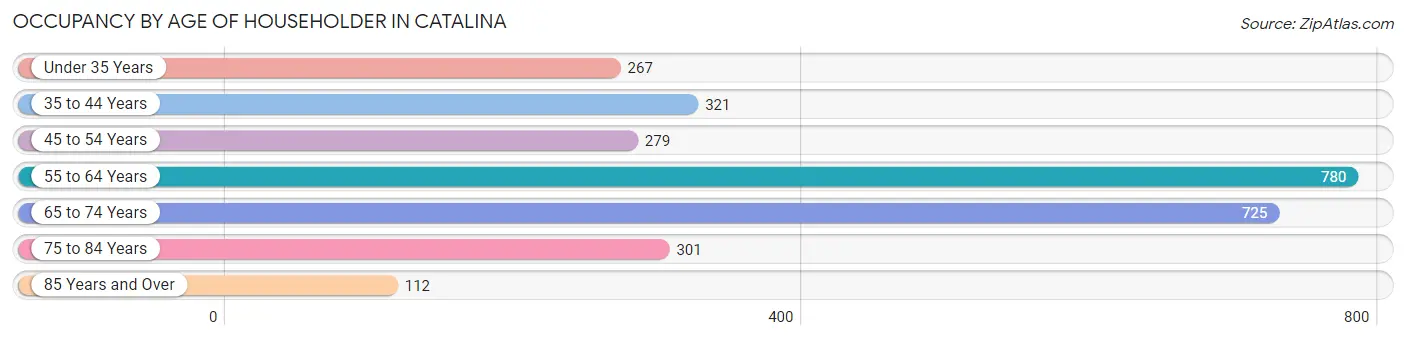
| Age Bracket | # Households | % Households |
| Under 35 Years | 267 | 9.6% |
| 35 to 44 Years | 321 | 11.5% |
| 45 to 54 Years | 279 | 10.0% |
| 55 to 64 Years | 780 | 28.0% |
| 65 to 74 Years | 725 | 26.0% |
| 75 to 84 Years | 301 | 10.8% |
| 85 Years and Over | 112 | 4.0% |
| Total | 2,785 | 100.0% |
Housing Finances in Catalina
Median Income by Occupancy in Catalina
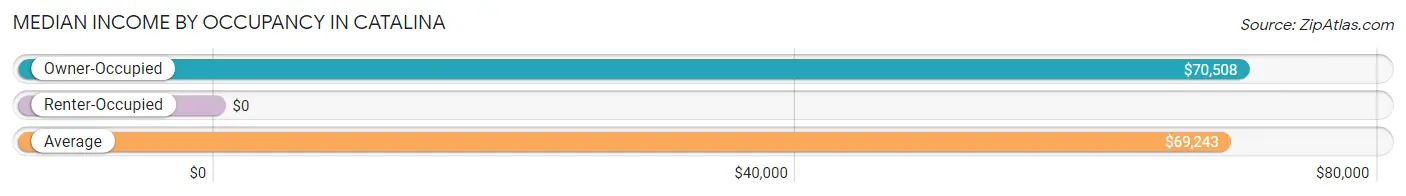
| Occupancy Type | # Households | Median Income |
| Owner-Occupied | 2,342 (84.1%) | $70,508 |
| Renter-Occupied | 443 (15.9%) | $0 |
| Average | 2,785 (100.0%) | $69,243 |
Occupancy by Householder Income Bracket in Catalina
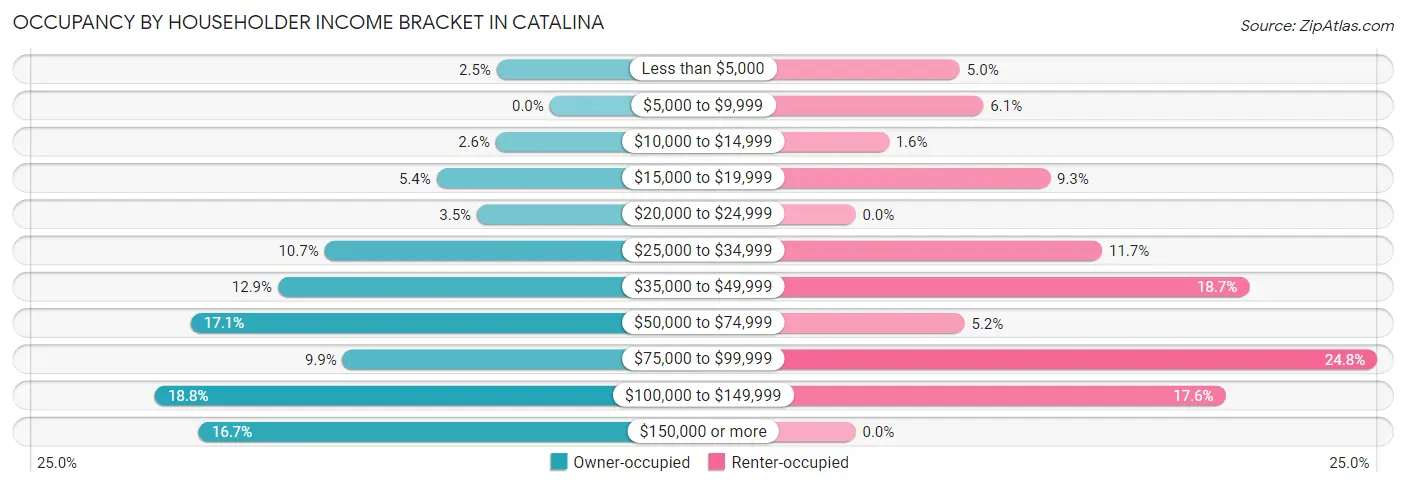
| Income Bracket | Owner-occupied | Renter-occupied |
| Less than $5,000 | 59 (2.5%) | 22 (5.0%) |
| $5,000 to $9,999 | 0 (0.0%) | 27 (6.1%) |
| $10,000 to $14,999 | 60 (2.6%) | 7 (1.6%) |
| $15,000 to $19,999 | 126 (5.4%) | 41 (9.3%) |
| $20,000 to $24,999 | 81 (3.5%) | 0 (0.0%) |
| $25,000 to $34,999 | 251 (10.7%) | 52 (11.7%) |
| $35,000 to $49,999 | 303 (12.9%) | 83 (18.7%) |
| $50,000 to $74,999 | 400 (17.1%) | 23 (5.2%) |
| $75,000 to $99,999 | 231 (9.9%) | 110 (24.8%) |
| $100,000 to $149,999 | 440 (18.8%) | 78 (17.6%) |
| $150,000 or more | 391 (16.7%) | 0 (0.0%) |
| Total | 2,342 (100.0%) | 443 (100.0%) |
Monthly Housing Cost Tiers in Catalina
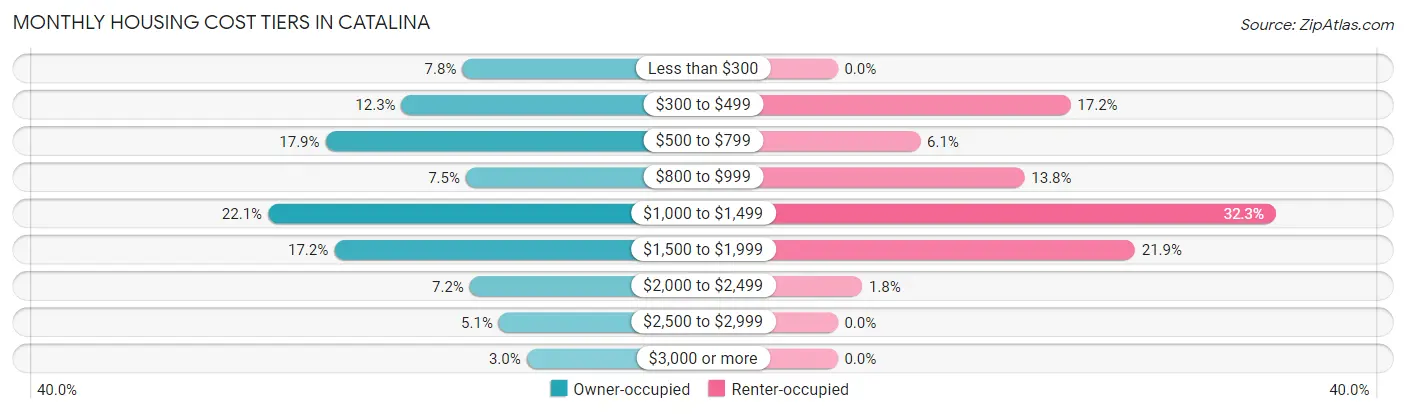
| Monthly Cost | Owner-occupied | Renter-occupied |
| Less than $300 | 182 (7.8%) | 0 (0.0%) |
| $300 to $499 | 287 (12.2%) | 76 (17.2%) |
| $500 to $799 | 418 (17.8%) | 27 (6.1%) |
| $800 to $999 | 176 (7.5%) | 61 (13.8%) |
| $1,000 to $1,499 | 517 (22.1%) | 143 (32.3%) |
| $1,500 to $1,999 | 403 (17.2%) | 97 (21.9%) |
| $2,000 to $2,499 | 169 (7.2%) | 8 (1.8%) |
| $2,500 to $2,999 | 119 (5.1%) | 0 (0.0%) |
| $3,000 or more | 71 (3.0%) | 0 (0.0%) |
| Total | 2,342 (100.0%) | 443 (100.0%) |
Physical Housing Characteristics in Catalina
Housing Structures in Catalina
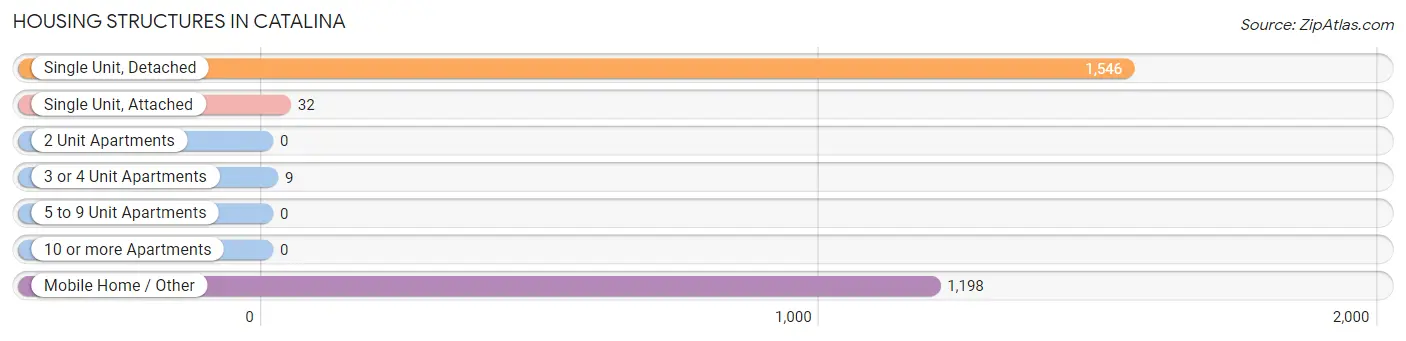
| Structure Type | # Housing Units | % Housing Units |
| Single Unit, Detached | 1,546 | 55.5% |
| Single Unit, Attached | 32 | 1.1% |
| 2 Unit Apartments | 0 | 0.0% |
| 3 or 4 Unit Apartments | 9 | 0.3% |
| 5 to 9 Unit Apartments | 0 | 0.0% |
| 10 or more Apartments | 0 | 0.0% |
| Mobile Home / Other | 1,198 | 43.0% |
| Total | 2,785 | 100.0% |
Housing Structures by Occupancy in Catalina
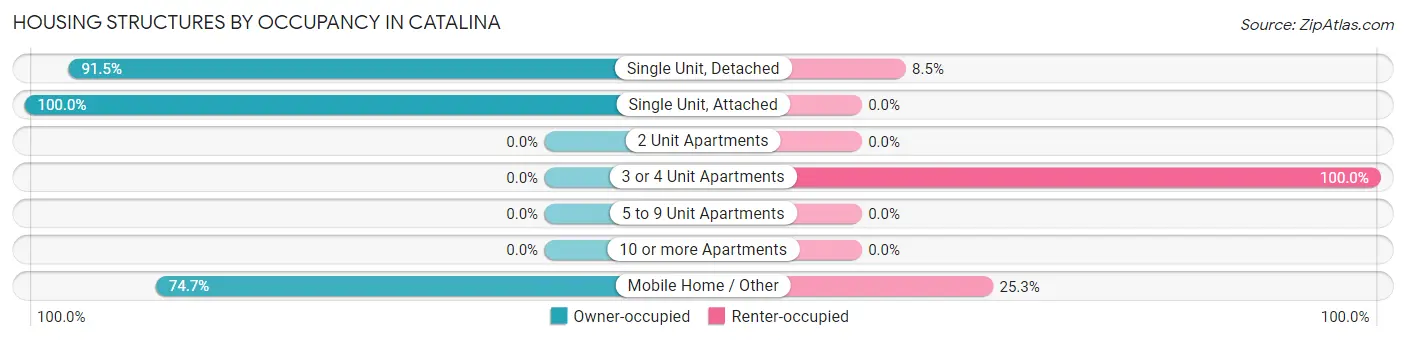
| Structure Type | Owner-occupied | Renter-occupied |
| Single Unit, Detached | 1,415 (91.5%) | 131 (8.5%) |
| Single Unit, Attached | 32 (100.0%) | 0 (0.0%) |
| 2 Unit Apartments | 0 (0.0%) | 0 (0.0%) |
| 3 or 4 Unit Apartments | 0 (0.0%) | 9 (100.0%) |
| 5 to 9 Unit Apartments | 0 (0.0%) | 0 (0.0%) |
| 10 or more Apartments | 0 (0.0%) | 0 (0.0%) |
| Mobile Home / Other | 895 (74.7%) | 303 (25.3%) |
| Total | 2,342 (84.1%) | 443 (15.9%) |
Housing Structures by Number of Rooms in Catalina
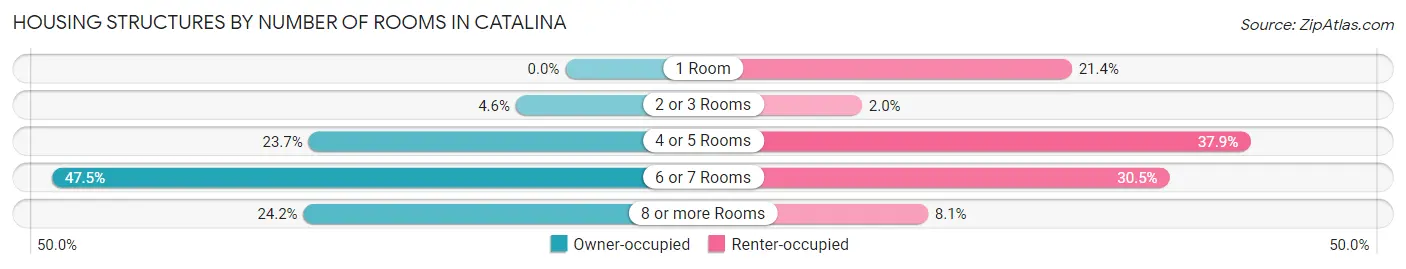
| Number of Rooms | Owner-occupied | Renter-occupied |
| 1 Room | 0 (0.0%) | 95 (21.4%) |
| 2 or 3 Rooms | 107 (4.6%) | 9 (2.0%) |
| 4 or 5 Rooms | 556 (23.7%) | 168 (37.9%) |
| 6 or 7 Rooms | 1,112 (47.5%) | 135 (30.5%) |
| 8 or more Rooms | 567 (24.2%) | 36 (8.1%) |
| Total | 2,342 (100.0%) | 443 (100.0%) |
Housing Structure by Heating Type in Catalina
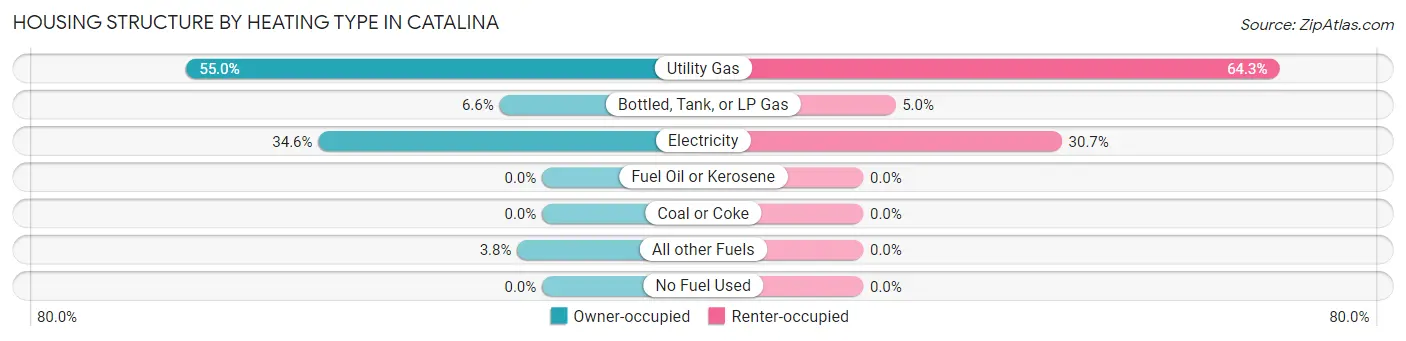
| Heating Type | Owner-occupied | Renter-occupied |
| Utility Gas | 1,288 (55.0%) | 285 (64.3%) |
| Bottled, Tank, or LP Gas | 154 (6.6%) | 22 (5.0%) |
| Electricity | 810 (34.6%) | 136 (30.7%) |
| Fuel Oil or Kerosene | 0 (0.0%) | 0 (0.0%) |
| Coal or Coke | 0 (0.0%) | 0 (0.0%) |
| All other Fuels | 90 (3.8%) | 0 (0.0%) |
| No Fuel Used | 0 (0.0%) | 0 (0.0%) |
| Total | 2,342 (100.0%) | 443 (100.0%) |
Household Vehicle Usage in Catalina
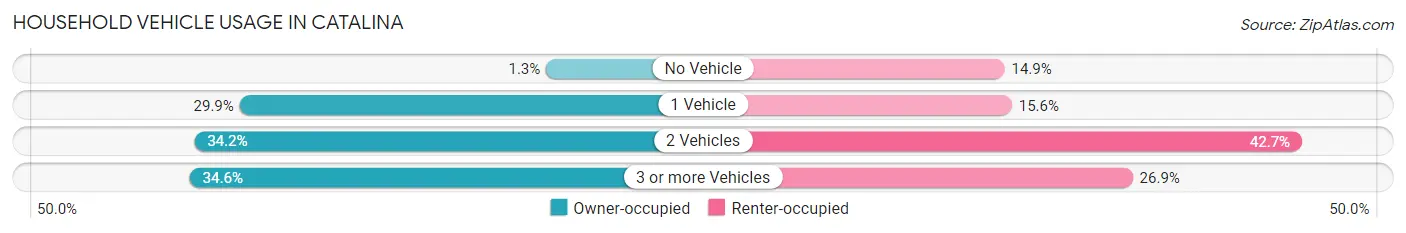
| Vehicles per Household | Owner-occupied | Renter-occupied |
| No Vehicle | 31 (1.3%) | 66 (14.9%) |
| 1 Vehicle | 701 (29.9%) | 69 (15.6%) |
| 2 Vehicles | 800 (34.2%) | 189 (42.7%) |
| 3 or more Vehicles | 810 (34.6%) | 119 (26.9%) |
| Total | 2,342 (100.0%) | 443 (100.0%) |
Real Estate & Mortgages in Catalina
Real Estate and Mortgage Overview in Catalina
| Characteristic | Without Mortgage | With Mortgage |
| Housing Units | 995 | 1,347 |
| Median Property Value | $185,600 | $257,300 |
| Median Household Income | $45,337 | $315 |
| Monthly Housing Costs | $512 | $71 |
| Real Estate Taxes | $1,419 | $44 |
Property Value by Mortgage Status in Catalina
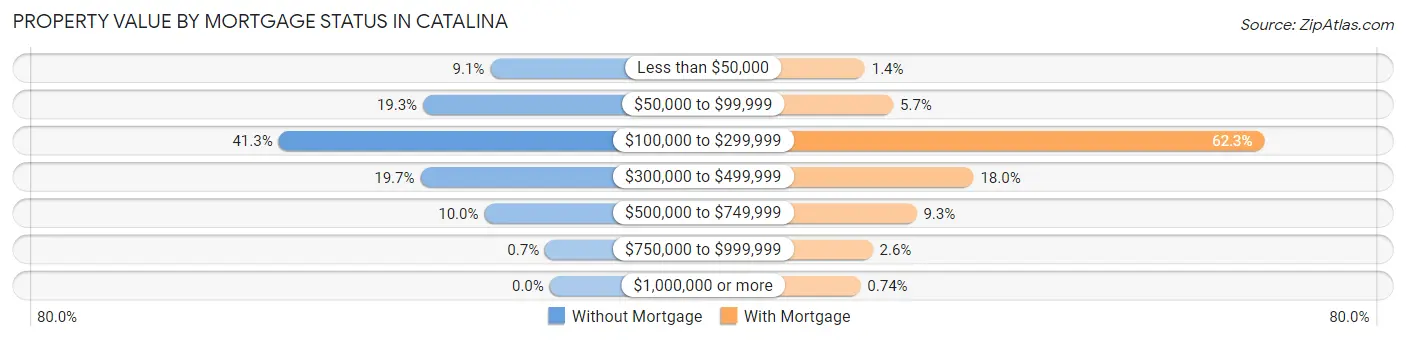
| Property Value | Without Mortgage | With Mortgage |
| Less than $50,000 | 90 (9.0%) | 19 (1.4%) |
| $50,000 to $99,999 | 192 (19.3%) | 77 (5.7%) |
| $100,000 to $299,999 | 411 (41.3%) | 839 (62.3%) |
| $300,000 to $499,999 | 196 (19.7%) | 242 (18.0%) |
| $500,000 to $749,999 | 99 (10.0%) | 125 (9.3%) |
| $750,000 to $999,999 | 7 (0.7%) | 35 (2.6%) |
| $1,000,000 or more | 0 (0.0%) | 10 (0.7%) |
| Total | 995 (100.0%) | 1,347 (100.0%) |
Household Income by Mortgage Status in Catalina
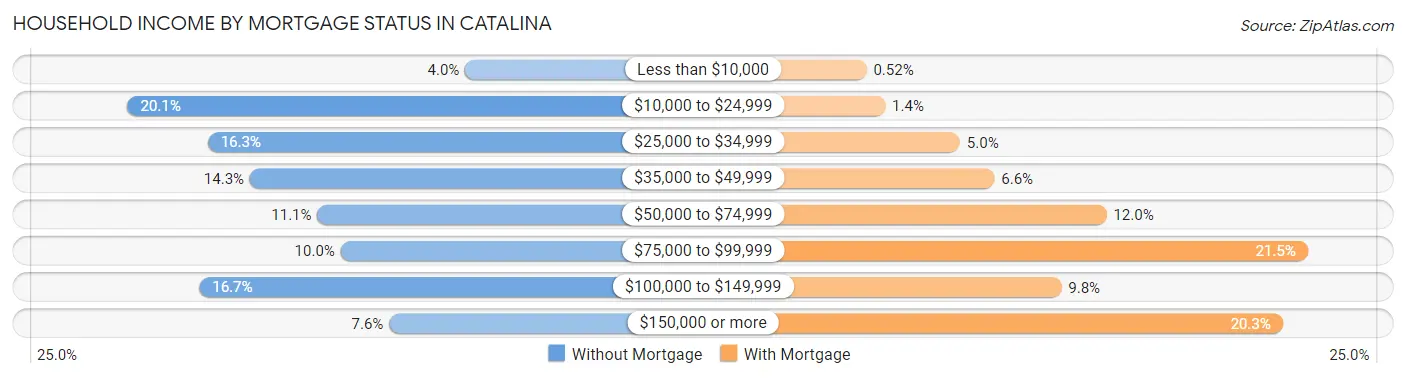
| Household Income | Without Mortgage | With Mortgage |
| Less than $10,000 | 40 (4.0%) | 7 (0.5%) |
| $10,000 to $24,999 | 200 (20.1%) | 19 (1.4%) |
| $25,000 to $34,999 | 162 (16.3%) | 67 (5.0%) |
| $35,000 to $49,999 | 142 (14.3%) | 89 (6.6%) |
| $50,000 to $74,999 | 110 (11.1%) | 161 (11.9%) |
| $75,000 to $99,999 | 99 (10.0%) | 290 (21.5%) |
| $100,000 to $149,999 | 166 (16.7%) | 132 (9.8%) |
| $150,000 or more | 76 (7.6%) | 274 (20.3%) |
| Total | 995 (100.0%) | 1,347 (100.0%) |
Property Value to Household Income Ratio in Catalina
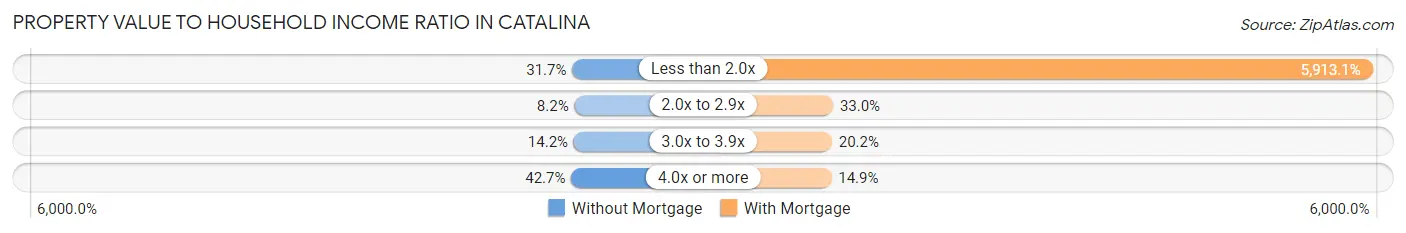
| Value-to-Income Ratio | Without Mortgage | With Mortgage |
| Less than 2.0x | 315 (31.7%) | 79,650 (5,913.1%) |
| 2.0x to 2.9x | 82 (8.2%) | 444 (33.0%) |
| 3.0x to 3.9x | 141 (14.2%) | 272 (20.2%) |
| 4.0x or more | 425 (42.7%) | 201 (14.9%) |
| Total | 995 (100.0%) | 1,347 (100.0%) |
Real Estate Taxes by Mortgage Status in Catalina
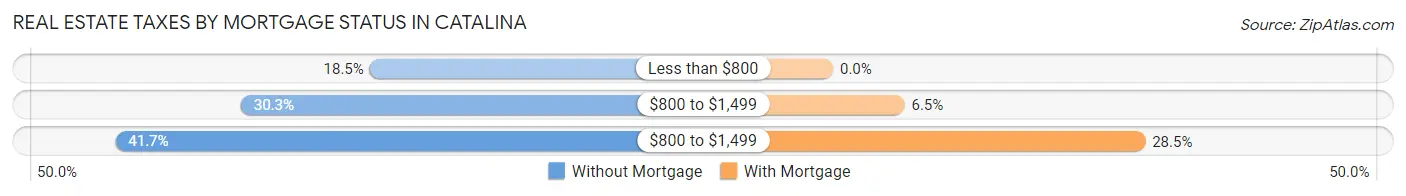
| Property Taxes | Without Mortgage | With Mortgage |
| Less than $800 | 184 (18.5%) | 0 (0.0%) |
| $800 to $1,499 | 301 (30.2%) | 88 (6.5%) |
| $800 to $1,499 | 415 (41.7%) | 384 (28.5%) |
| Total | 995 (100.0%) | 1,347 (100.0%) |
Health & Disability in Catalina
Health Insurance Coverage by Age in Catalina
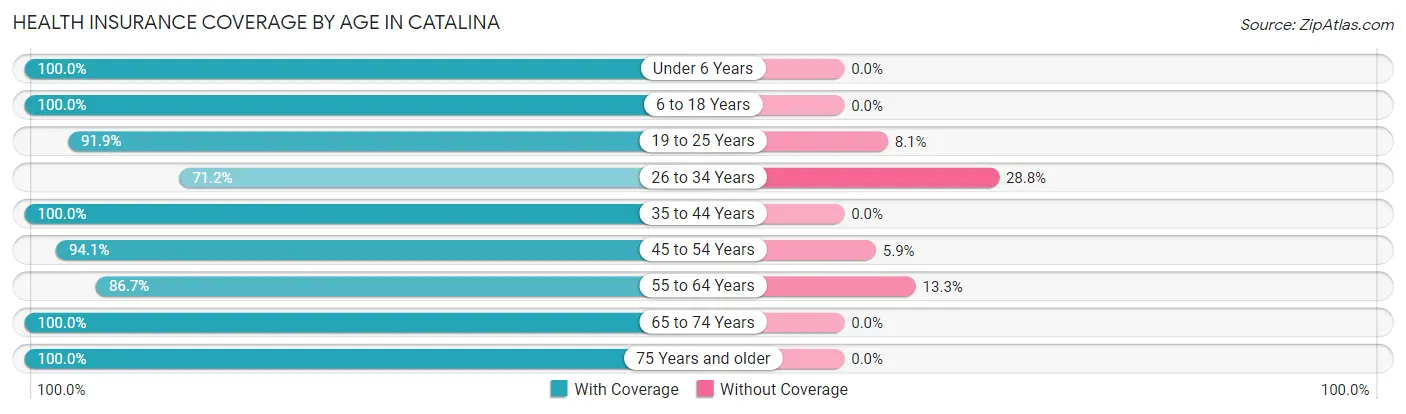
| Age Bracket | With Coverage | Without Coverage |
| Under 6 Years | 243 (100.0%) | 0 (0.0%) |
| 6 to 18 Years | 860 (100.0%) | 0 (0.0%) |
| 19 to 25 Years | 238 (91.9%) | 21 (8.1%) |
| 26 to 34 Years | 422 (71.2%) | 171 (28.8%) |
| 35 to 44 Years | 619 (100.0%) | 0 (0.0%) |
| 45 to 54 Years | 512 (94.1%) | 32 (5.9%) |
| 55 to 64 Years | 1,179 (86.7%) | 181 (13.3%) |
| 65 to 74 Years | 1,315 (100.0%) | 0 (0.0%) |
| 75 Years and older | 532 (100.0%) | 0 (0.0%) |
| Total | 5,920 (93.6%) | 405 (6.4%) |
Health Insurance Coverage by Citizenship Status in Catalina
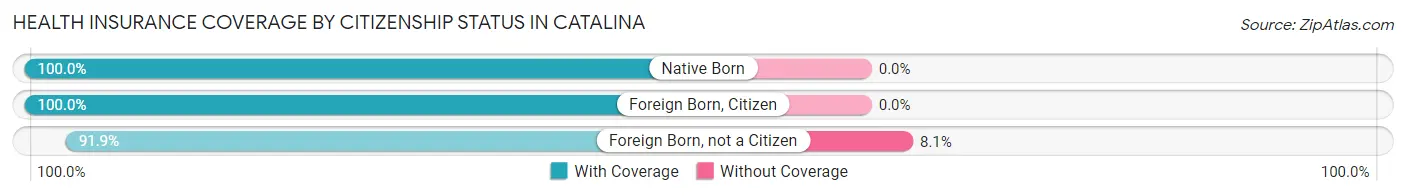
| Citizenship Status | With Coverage | Without Coverage |
| Native Born | 243 (100.0%) | 0 (0.0%) |
| Foreign Born, Citizen | 860 (100.0%) | 0 (0.0%) |
| Foreign Born, not a Citizen | 238 (91.9%) | 21 (8.1%) |
Health Insurance Coverage by Household Income in Catalina
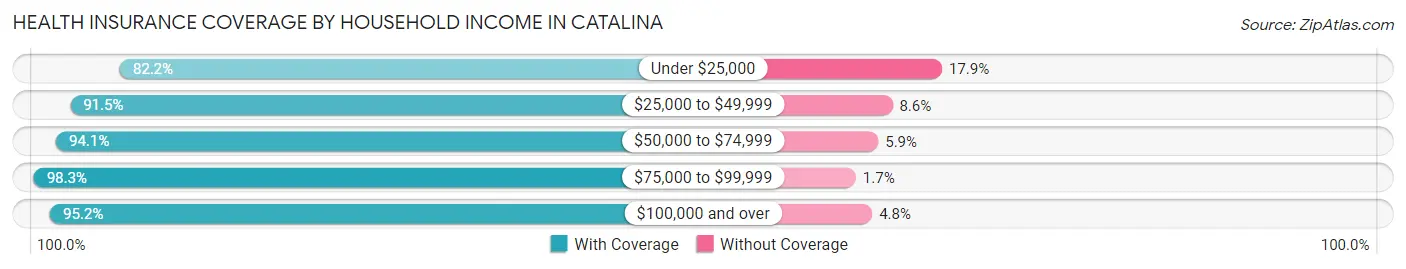
| Household Income | With Coverage | Without Coverage |
| Under $25,000 | 474 (82.2%) | 103 (17.8%) |
| $25,000 to $49,999 | 1,080 (91.4%) | 101 (8.6%) |
| $50,000 to $74,999 | 1,133 (94.1%) | 71 (5.9%) |
| $75,000 to $99,999 | 978 (98.3%) | 17 (1.7%) |
| $100,000 and over | 2,255 (95.2%) | 113 (4.8%) |
Public vs Private Health Insurance Coverage by Age in Catalina
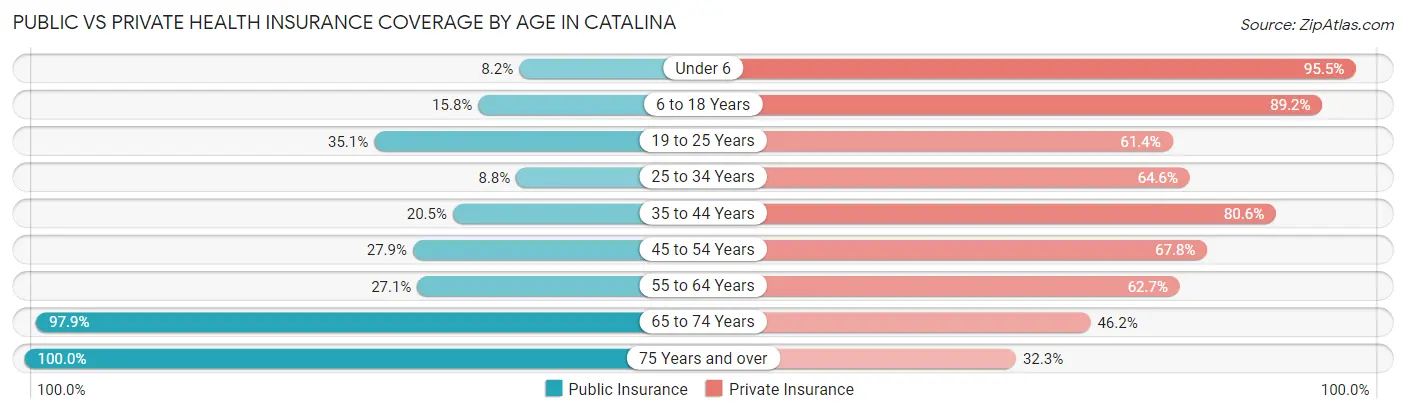
| Age Bracket | Public Insurance | Private Insurance |
| Under 6 | 20 (8.2%) | 232 (95.5%) |
| 6 to 18 Years | 136 (15.8%) | 767 (89.2%) |
| 19 to 25 Years | 91 (35.1%) | 159 (61.4%) |
| 25 to 34 Years | 52 (8.8%) | 383 (64.6%) |
| 35 to 44 Years | 127 (20.5%) | 499 (80.6%) |
| 45 to 54 Years | 152 (27.9%) | 369 (67.8%) |
| 55 to 64 Years | 369 (27.1%) | 853 (62.7%) |
| 65 to 74 Years | 1,287 (97.9%) | 607 (46.2%) |
| 75 Years and over | 532 (100.0%) | 172 (32.3%) |
| Total | 2,766 (43.7%) | 4,041 (63.9%) |
Disability Status by Sex by Age in Catalina
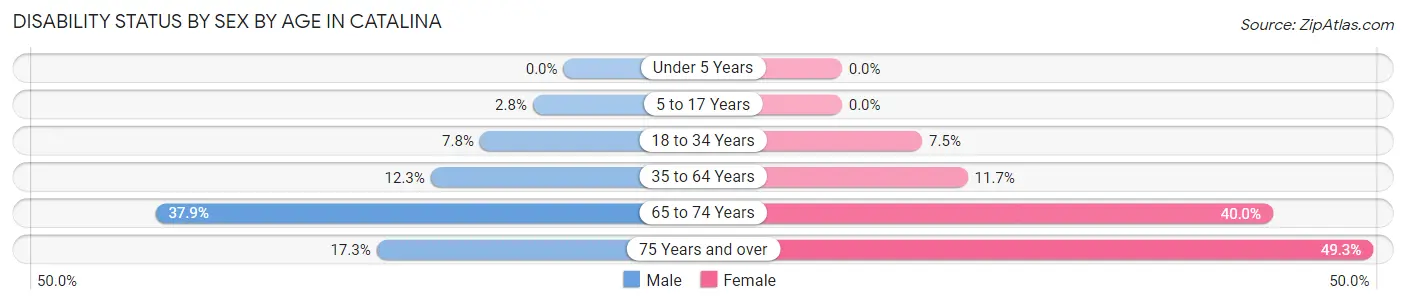
| Age Bracket | Male | Female |
| Under 5 Years | 0 (0.0%) | 0 (0.0%) |
| 5 to 17 Years | 15 (2.8%) | 0 (0.0%) |
| 18 to 34 Years | 37 (7.8%) | 32 (7.5%) |
| 35 to 64 Years | 158 (12.3%) | 145 (11.7%) |
| 65 to 74 Years | 246 (37.9%) | 266 (40.0%) |
| 75 Years and over | 30 (17.3%) | 177 (49.3%) |
Disability Class by Sex by Age in Catalina
Disability Class: Hearing Difficulty
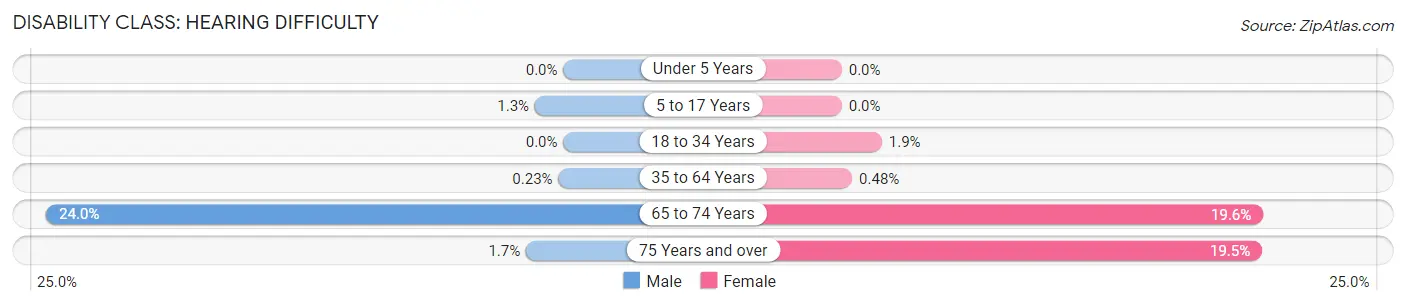
| Age Bracket | Male | Female |
| Under 5 Years | 0 (0.0%) | 0 (0.0%) |
| 5 to 17 Years | 7 (1.3%) | 0 (0.0%) |
| 18 to 34 Years | 0 (0.0%) | 8 (1.9%) |
| 35 to 64 Years | 3 (0.2%) | 6 (0.5%) |
| 65 to 74 Years | 156 (24.0%) | 130 (19.6%) |
| 75 Years and over | 3 (1.7%) | 70 (19.5%) |
Disability Class: Vision Difficulty
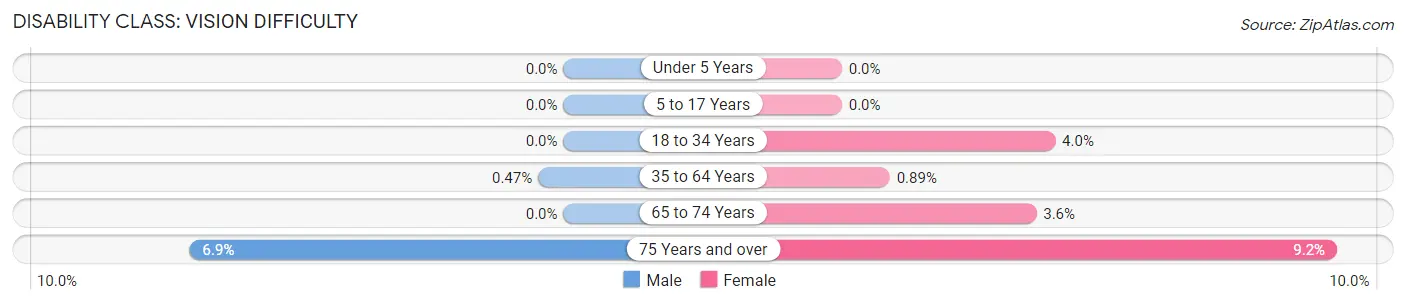
| Age Bracket | Male | Female |
| Under 5 Years | 0 (0.0%) | 0 (0.0%) |
| 5 to 17 Years | 0 (0.0%) | 0 (0.0%) |
| 18 to 34 Years | 0 (0.0%) | 17 (4.0%) |
| 35 to 64 Years | 6 (0.5%) | 11 (0.9%) |
| 65 to 74 Years | 0 (0.0%) | 24 (3.6%) |
| 75 Years and over | 12 (6.9%) | 33 (9.2%) |
Disability Class: Cognitive Difficulty
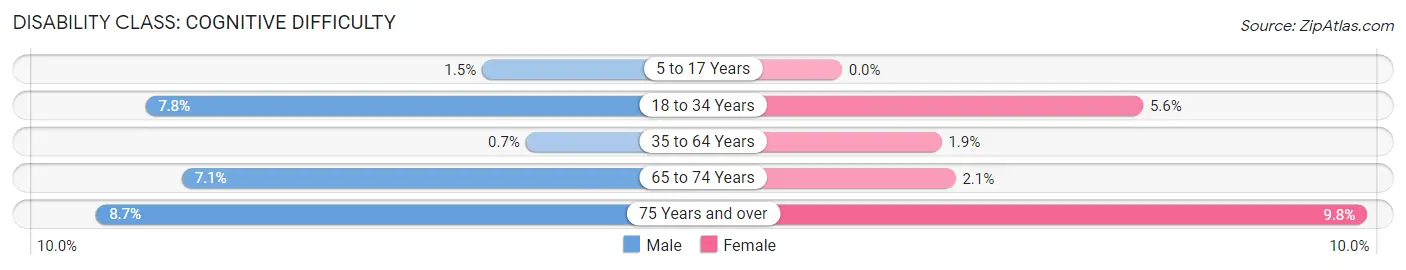
| Age Bracket | Male | Female |
| 5 to 17 Years | 8 (1.5%) | 0 (0.0%) |
| 18 to 34 Years | 37 (7.8%) | 24 (5.6%) |
| 35 to 64 Years | 9 (0.7%) | 23 (1.8%) |
| 65 to 74 Years | 46 (7.1%) | 14 (2.1%) |
| 75 Years and over | 15 (8.7%) | 35 (9.8%) |
Disability Class: Ambulatory Difficulty
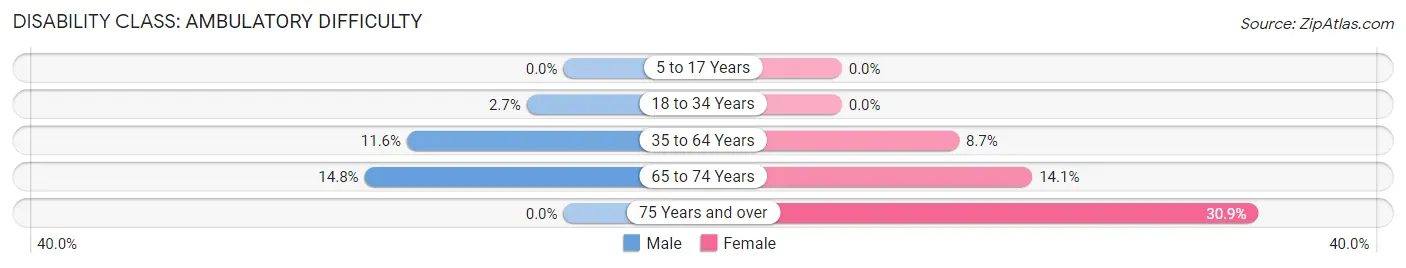
| Age Bracket | Male | Female |
| 5 to 17 Years | 0 (0.0%) | 0 (0.0%) |
| 18 to 34 Years | 13 (2.7%) | 0 (0.0%) |
| 35 to 64 Years | 149 (11.6%) | 108 (8.7%) |
| 65 to 74 Years | 96 (14.8%) | 94 (14.1%) |
| 75 Years and over | 0 (0.0%) | 111 (30.9%) |
Disability Class: Self-Care Difficulty
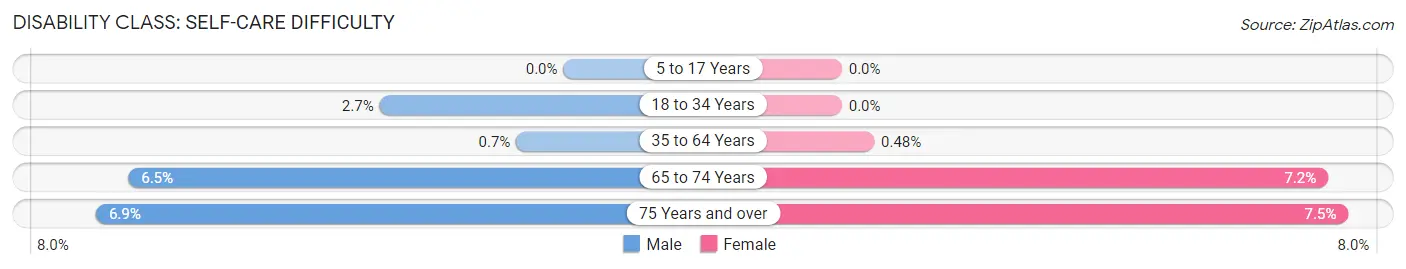
| Age Bracket | Male | Female |
| 5 to 17 Years | 0 (0.0%) | 0 (0.0%) |
| 18 to 34 Years | 13 (2.7%) | 0 (0.0%) |
| 35 to 64 Years | 9 (0.7%) | 6 (0.5%) |
| 65 to 74 Years | 42 (6.5%) | 48 (7.2%) |
| 75 Years and over | 12 (6.9%) | 27 (7.5%) |
Technology Access in Catalina
Computing Device Access in Catalina
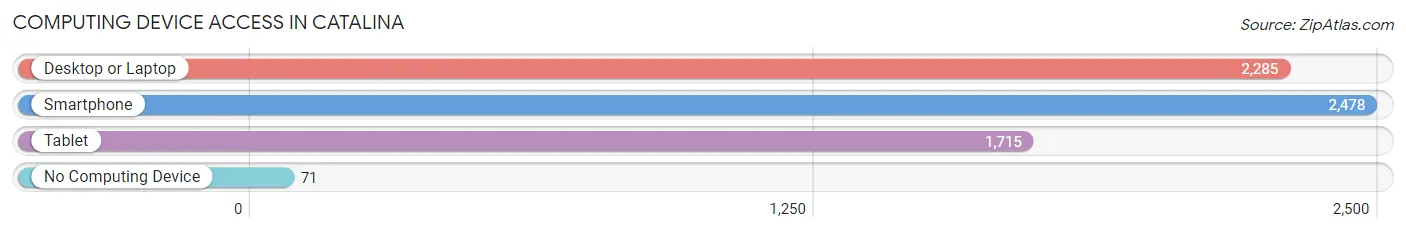
| Device Type | # Households | % Households |
| Desktop or Laptop | 2,285 | 82.1% |
| Smartphone | 2,478 | 89.0% |
| Tablet | 1,715 | 61.6% |
| No Computing Device | 71 | 2.5% |
| Total | 2,785 | 100.0% |
Internet Access in Catalina
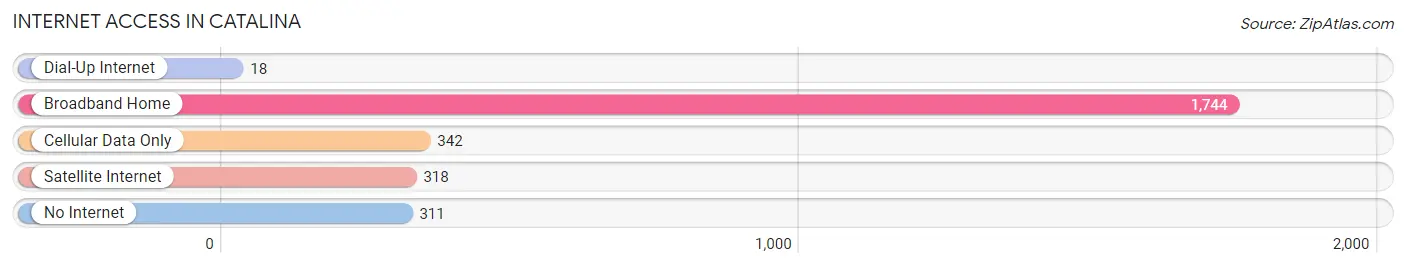
| Internet Type | # Households | % Households |
| Dial-Up Internet | 18 | 0.6% |
| Broadband Home | 1,744 | 62.6% |
| Cellular Data Only | 342 | 12.3% |
| Satellite Internet | 318 | 11.4% |
| No Internet | 311 | 11.2% |
| Total | 2,785 | 100.0% |
Catalina Summary
Catalina, Arizona is a small town located in the foothills of the Santa Catalina Mountains in Pima County, Arizona. The town is situated about 25 miles north of Tucson and is part of the Tucson Metropolitan Statistical Area. The town has a population of about 5,000 people and is known for its scenic beauty and outdoor recreation opportunities.
Geography
Catalina is located in the foothills of the Santa Catalina Mountains in Pima County, Arizona. The town is situated about 25 miles north of Tucson and is part of the Tucson Metropolitan Statistical Area. The town is located at an elevation of 2,890 feet and has a total area of 8.3 square miles. The town is surrounded by the Coronado National Forest and is home to several mountain peaks, including Mount Lemmon, which is the highest peak in the Santa Catalina Mountains.
Economy
The economy of Catalina is largely based on tourism and outdoor recreation. The town is home to several resorts and recreational facilities, including the Catalina State Park, which offers camping, hiking, and horseback riding. The town is also home to several golf courses, including the Catalina Country Club. The town is also home to several restaurants and retail stores.
Demographics
As of the 2010 census, the population of Catalina was 5,025. The racial makeup of the town was 91.2% White, 0.7% African American, 0.7% Native American, 0.7% Asian, 0.1% Pacific Islander, 4.3% from other races, and 2.1% from two or more races. Hispanic or Latino of any race were 11.3% of the population.
The median income for a household in the town was $45,938, and the median income for a family was $50,938. The per capita income for the town was $21,938. About 8.3% of families and 10.3% of the population were below the poverty line, including 14.3% of those under age 18 and 6.3% of those age 65 or over.
Conclusion
Catalina, Arizona is a small town located in the foothills of the Santa Catalina Mountains in Pima County, Arizona. The town has a population of about 5,000 people and is known for its scenic beauty and outdoor recreation opportunities. The economy of Catalina is largely based on tourism and outdoor recreation, and the town is home to several resorts and recreational facilities. The racial makeup of the town is predominantly White, with a small percentage of African American, Native American, Asian, and Pacific Islander residents. The median income for a household in the town is $45,938, and the per capita income for the town is $21,938.
Common Questions
What is the Total Population of Catalina?
Total Population of Catalina is 6,371.
What is the Total Male Population of Catalina?
Total Male Population of Catalina is 3,222.
What is the Total Female Population of Catalina?
Total Female Population of Catalina is 3,149.
What is the Ratio of Males per 100 Females in Catalina?
There are 102.32 Males per 100 Females in Catalina.
What is the Ratio of Females per 100 Males in Catalina?
There are 97.73 Females per 100 Males in Catalina.
What is the Median Population Age in Catalina?
Median Population Age in Catalina is 55.1 Years.
What is the Average Family Size in Catalina
Average Family Size in Catalina is 2.8 People.
What is the Average Household Size in Catalina
Average Household Size in Catalina is 2.3 People.
What is Per Capita Income in Catalina?
Per Capita income in Catalina is $41,018.
What is the Median Family Income in Catalina?
Median Family Income in Catalina is $85,903.
What is the Median Household income in Catalina?
Median Household Income in Catalina is $69,243.
What is Income or Wage Gap in Catalina?
Income or Wage Gap in Catalina is 30.1%.
Women in Catalina earn 69.9 cents for every dollar earned by a man.
What is Inequality or Gini Index in Catalina?
Inequality or Gini Index in Catalina is 0.47.
How Large is the Labor Force in Catalina?
There are 2,972 People in the Labor Forcein in Catalina.
What is the Percentage of People in the Labor Force in Catalina?
54.4% of People are in the Labor Force in Catalina.
What is the Unemployment Rate in Catalina?
Unemployment Rate in Catalina is 3.3%.