Dewey Humboldt, AZ
Dewey Humboldt Map
Dewey Humboldt Overview
4,363
TOTAL POPULATION
2,252
MALE POPULATION
2,111
FEMALE POPULATION
106.68
MALES / 100 FEMALES
93.74
FEMALES / 100 MALES
60.0
MEDIAN AGE
2.8
AVG FAMILY SIZE
2.4
AVG HOUSEHOLD SIZE
$31,676
PER CAPITA INCOME
$63,105
AVG FAMILY INCOME
$56,604
AVG HOUSEHOLD INCOME
21.8%
WAGE / INCOME GAP [ % ]
78.2¢/ $1
WAGE / INCOME GAP [ $ ]
0.41
INEQUALITY / GINI INDEX
1,390
LABOR FORCE [ PEOPLE ]
37.6%
PERCENT IN LABOR FORCE
8.1%
UNEMPLOYMENT RATE
Dewey Humboldt Area Codes
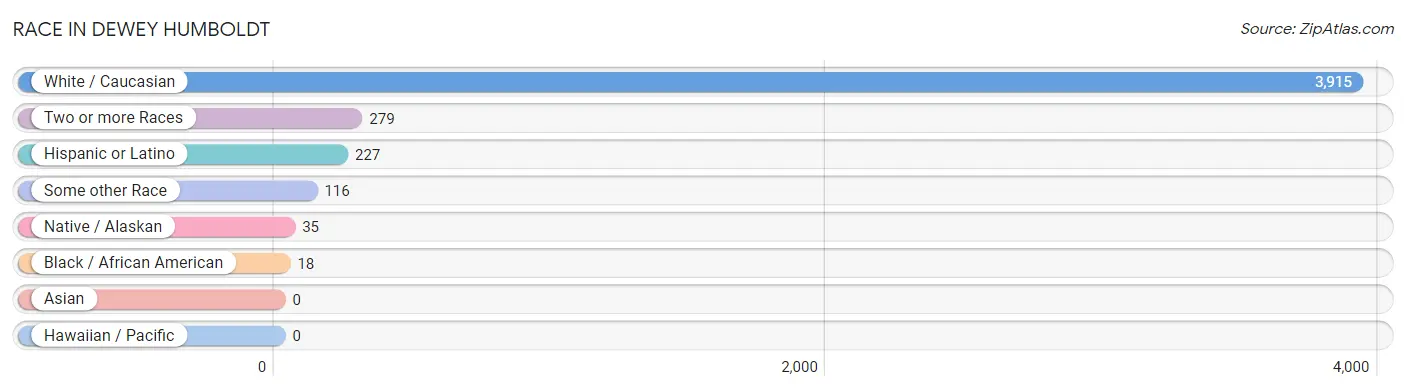
Race in Dewey Humboldt
The most populous races in Dewey Humboldt are White / Caucasian (3,915 | 89.7%), Two or more Races (279 | 6.4%), and Hispanic or Latino (227 | 5.2%).
| Race | # Population | % Population |
| Asian | 0 | 0.0% |
| Black / African American | 18 | 0.4% |
| Hawaiian / Pacific | 0 | 0.0% |
| Hispanic or Latino | 227 | 5.2% |
| Native / Alaskan | 35 | 0.8% |
| White / Caucasian | 3,915 | 89.7% |
| Two or more Races | 279 | 6.4% |
| Some other Race | 116 | 2.7% |
| Total | 4,363 | 100.0% |
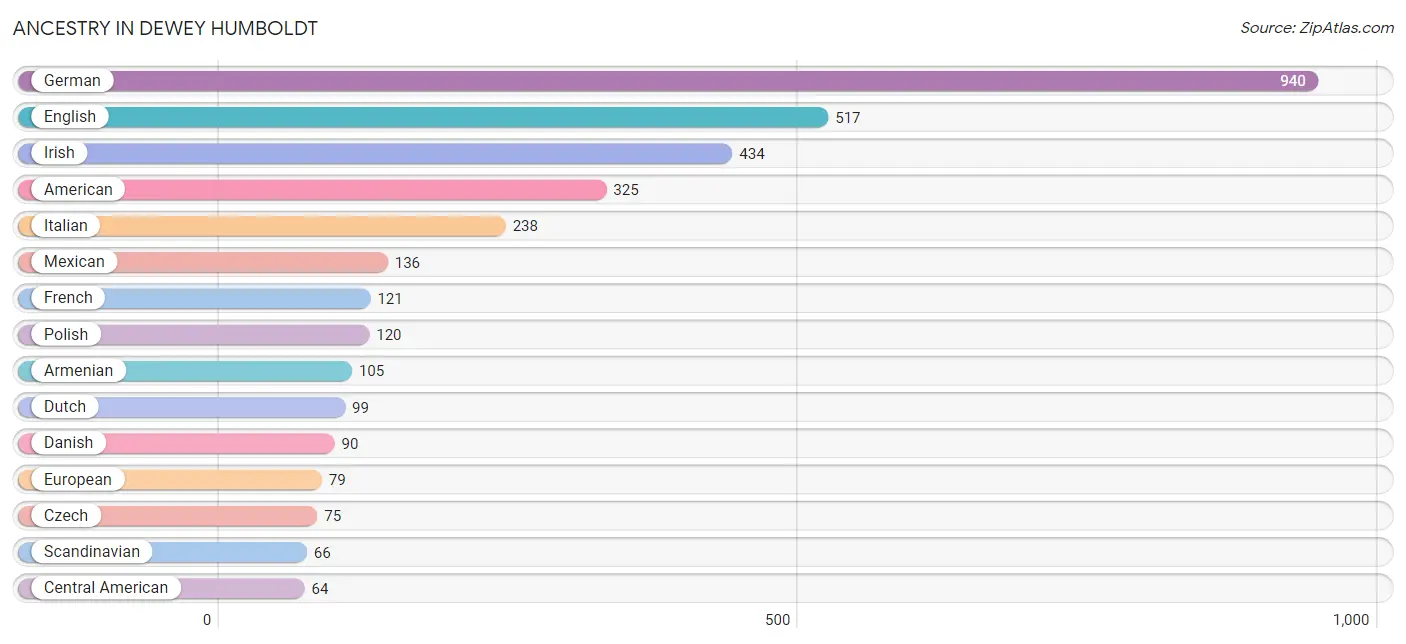
Ancestry in Dewey Humboldt
The most populous ancestries reported in Dewey Humboldt are German (940 | 21.5%), English (517 | 11.8%), Irish (434 | 10.0%), American (325 | 7.4%), and Italian (238 | 5.4%), together accounting for 56.2% of all Dewey Humboldt residents.
| Ancestry | # Population | % Population |
| African | 16 | 0.4% |
| American | 325 | 7.4% |
| Arab | 51 | 1.2% |
| Armenian | 105 | 2.4% |
| British | 16 | 0.4% |
| Central American | 64 | 1.5% |
| Cherokee | 20 | 0.5% |
| Chickasaw | 15 | 0.3% |
| Choctaw | 10 | 0.2% |
| Czech | 75 | 1.7% |
| Czechoslovakian | 17 | 0.4% |
| Danish | 90 | 2.1% |
| Dutch | 99 | 2.3% |
| Eastern European | 6 | 0.1% |
| English | 517 | 11.8% |
| European | 79 | 1.8% |
| French | 121 | 2.8% |
| French Canadian | 26 | 0.6% |
| German | 940 | 21.5% |
| Greek | 25 | 0.6% |
| Guamanian / Chamorro | 4 | 0.1% |
| Guatemalan | 64 | 1.5% |
| Hungarian | 11 | 0.3% |
| Irish | 434 | 10.0% |
| Italian | 238 | 5.4% |
| Lebanese | 51 | 1.2% |
| Mexican | 136 | 3.1% |
| Norwegian | 47 | 1.1% |
| Pima | 2 | 0.1% |
| Polish | 120 | 2.8% |
| Scandinavian | 66 | 1.5% |
| Scotch-Irish | 39 | 0.9% |
| Scottish | 55 | 1.3% |
| Spanish | 11 | 0.3% |
| Subsaharan African | 16 | 0.4% |
| Swedish | 23 | 0.5% |
| Welsh | 11 | 0.3% | View All 37 Rows |
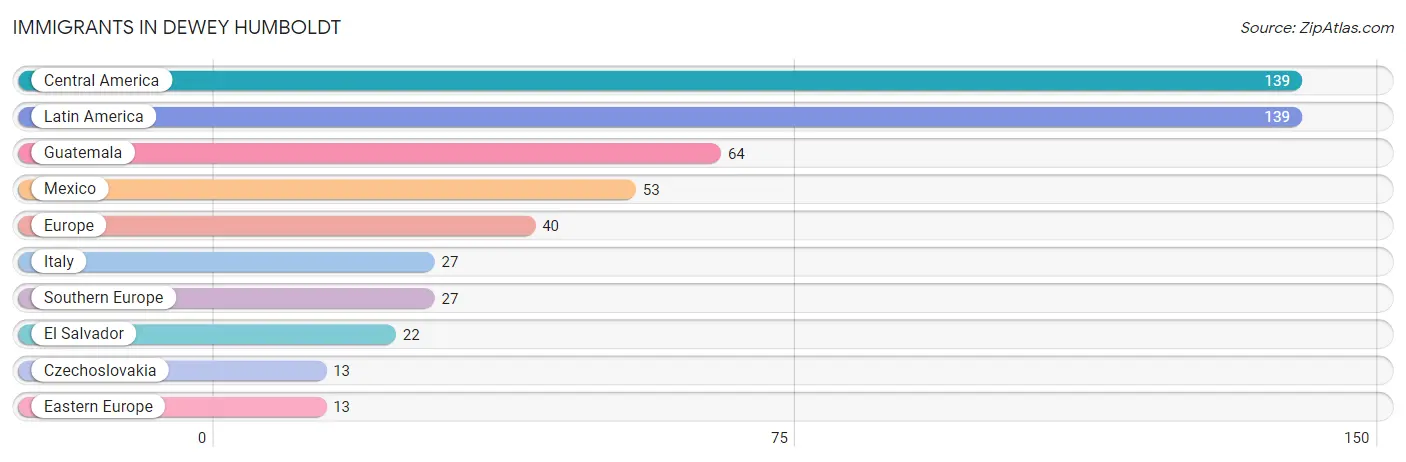
Immigrants in Dewey Humboldt
The most numerous immigrant groups reported in Dewey Humboldt came from Central America (139 | 3.2%), Latin America (139 | 3.2%), Guatemala (64 | 1.5%), Mexico (53 | 1.2%), and Europe (40 | 0.9%), together accounting for 10.0% of all Dewey Humboldt residents.
| Immigration Origin | # Population | % Population |
| Central America | 139 | 3.2% |
| Czechoslovakia | 13 | 0.3% |
| Eastern Europe | 13 | 0.3% |
| El Salvador | 22 | 0.5% |
| Europe | 40 | 0.9% |
| Guatemala | 64 | 1.5% |
| Italy | 27 | 0.6% |
| Latin America | 139 | 3.2% |
| Mexico | 53 | 1.2% |
| Southern Europe | 27 | 0.6% | View All 10 Rows |
Sex and Age in Dewey Humboldt
Sex and Age in Dewey Humboldt
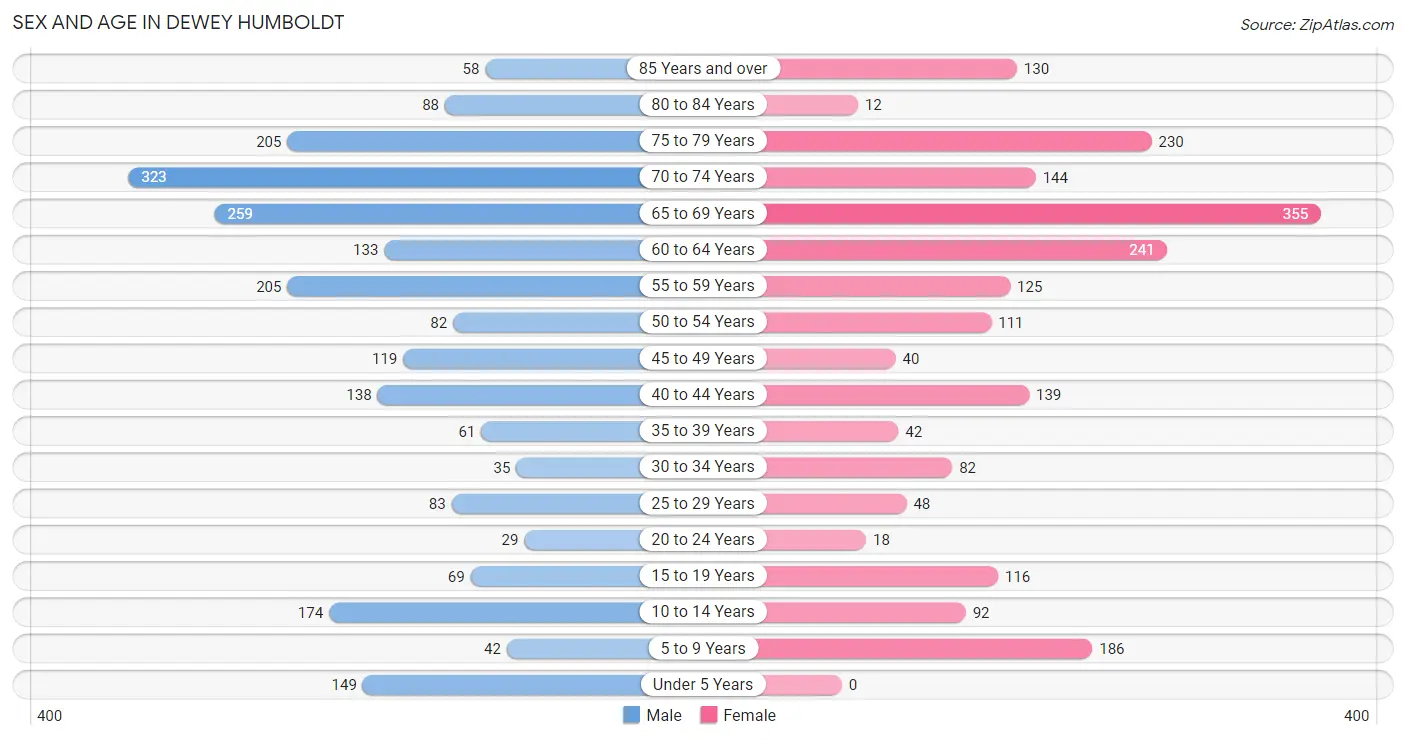
The most populous age groups in Dewey Humboldt are 70 to 74 Years (323 | 14.3%) for men and 65 to 69 Years (355 | 16.8%) for women.
| Age Bracket | Male | Female |
| Under 5 Years | 149 (6.6%) | 0 (0.0%) |
| 5 to 9 Years | 42 (1.9%) | 186 (8.8%) |
| 10 to 14 Years | 174 (7.7%) | 92 (4.4%) |
| 15 to 19 Years | 69 (3.1%) | 116 (5.5%) |
| 20 to 24 Years | 29 (1.3%) | 18 (0.9%) |
| 25 to 29 Years | 83 (3.7%) | 48 (2.3%) |
| 30 to 34 Years | 35 (1.5%) | 82 (3.9%) |
| 35 to 39 Years | 61 (2.7%) | 42 (2.0%) |
| 40 to 44 Years | 138 (6.1%) | 139 (6.6%) |
| 45 to 49 Years | 119 (5.3%) | 40 (1.9%) |
| 50 to 54 Years | 82 (3.6%) | 111 (5.3%) |
| 55 to 59 Years | 205 (9.1%) | 125 (5.9%) |
| 60 to 64 Years | 133 (5.9%) | 241 (11.4%) |
| 65 to 69 Years | 259 (11.5%) | 355 (16.8%) |
| 70 to 74 Years | 323 (14.3%) | 144 (6.8%) |
| 75 to 79 Years | 205 (9.1%) | 230 (10.9%) |
| 80 to 84 Years | 88 (3.9%) | 12 (0.6%) |
| 85 Years and over | 58 (2.6%) | 130 (6.2%) |
| Total | 2,252 (100.0%) | 2,111 (100.0%) |
Families and Households in Dewey Humboldt
Median Family Size in Dewey Humboldt
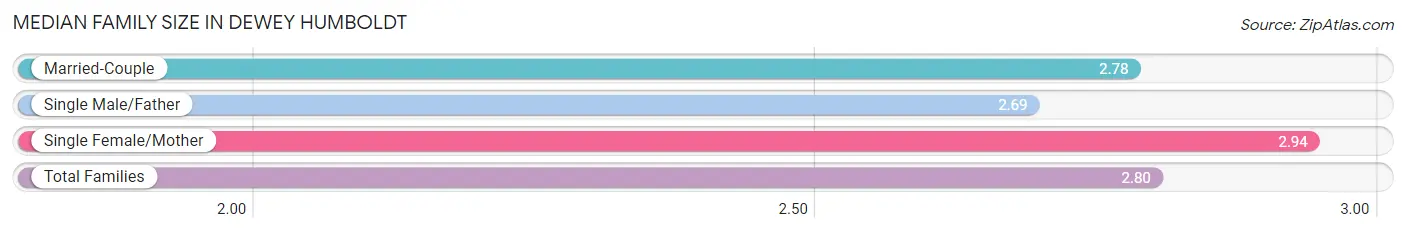
The median family size in Dewey Humboldt is 2.80 persons per family, with single female/mother families (171 | 14.9%) accounting for the largest median family size of 2.94 persons per family. On the other hand, single male/father families (48 | 4.2%) represent the smallest median family size with 2.69 persons per family.
| Family Type | # Families | Family Size |
| Married-Couple | 932 (81.0%) | 2.78 |
| Single Male/Father | 48 (4.2%) | 2.69 |
| Single Female/Mother | 171 (14.9%) | 2.94 |
| Total Families | 1,151 (100.0%) | 2.80 |
Median Household Size in Dewey Humboldt
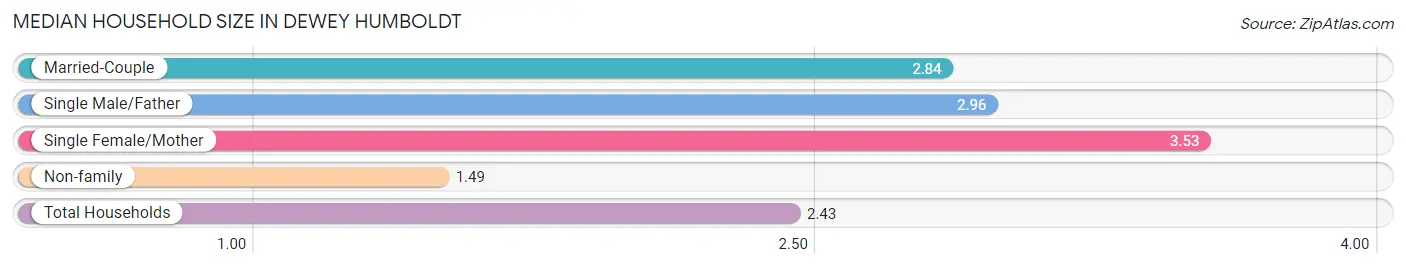
The median household size in Dewey Humboldt is 2.43 persons per household, with single female/mother households (171 | 9.6%) accounting for the largest median household size of 3.53 persons per household. non-family households (635 | 35.5%) represent the smallest median household size with 1.49 persons per household.
| Household Type | # Households | Household Size |
| Married-Couple | 932 (52.2%) | 2.84 |
| Single Male/Father | 48 (2.7%) | 2.96 |
| Single Female/Mother | 171 (9.6%) | 3.53 |
| Non-family | 635 (35.5%) | 1.49 |
| Total Households | 1,786 (100.0%) | 2.43 |
Household Size by Marriage Status in Dewey Humboldt
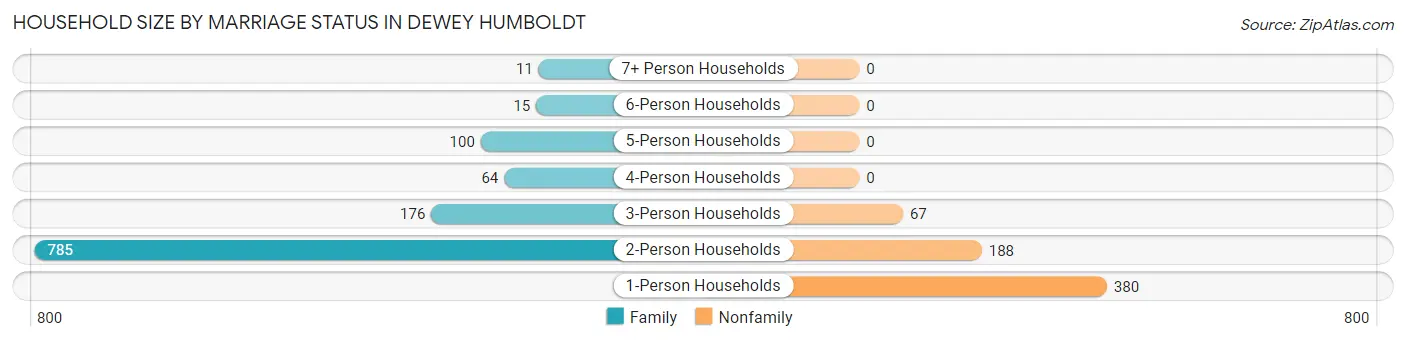
Out of a total of 1,786 households in Dewey Humboldt, 1,151 (64.4%) are family households, while 635 (35.5%) are nonfamily households. The most numerous type of family households are 2-person households, comprising 785, and the most common type of nonfamily households are 1-person households, comprising 380.
| Household Size | Family Households | Nonfamily Households |
| 1-Person Households | - | 380 (21.3%) |
| 2-Person Households | 785 (44.0%) | 188 (10.5%) |
| 3-Person Households | 176 (9.9%) | 67 (3.7%) |
| 4-Person Households | 64 (3.6%) | 0 (0.0%) |
| 5-Person Households | 100 (5.6%) | 0 (0.0%) |
| 6-Person Households | 15 (0.8%) | 0 (0.0%) |
| 7+ Person Households | 11 (0.6%) | 0 (0.0%) |
| Total | 1,151 (64.4%) | 635 (35.5%) |
Female Fertility in Dewey Humboldt
Fertility by Age in Dewey Humboldt
| Age Bracket | Women with Births | Births / 1,000 Women |
| 15 to 19 years | 0 (0.0%) | 0.0 |
| 20 to 34 years | 0 (0.0%) | 0.0 |
| 35 to 50 years | 0 (0.0%) | 0.0 |
| Total | 0 (0.0%) | 0.0 |
Fertility by Age by Marriage Status in Dewey Humboldt
| Age Bracket | Married | Unmarried |
| 15 to 19 years | 0 (0.0%) | 0 (0.0%) |
| 20 to 34 years | 0 (0.0%) | 0 (0.0%) |
| 35 to 50 years | 0 (0.0%) | 0 (0.0%) |
| Total | 0 (0.0%) | 0 (0.0%) |
Fertility by Education in Dewey Humboldt
| Educational Attainment | Women with Births | Births / 1,000 Women |
| Less than High School | 0 (0.0%) | 0.0 |
| High School Diploma | 0 (0.0%) | 0.0 |
| College or Associate's Degree | 0 (0.0%) | 0.0 |
| Bachelor's Degree | 0 (0.0%) | 0.0 |
| Graduate Degree | 0 (0.0%) | 0.0 |
| Total | 0 (0.0%) | 0.0 |
Fertility by Education by Marriage Status in Dewey Humboldt
| Educational Attainment | Married | Unmarried |
| Less than High School | 0 (0.0%) | 0 (0.0%) |
| High School Diploma | 0 (0.0%) | 0 (0.0%) |
| College or Associate's Degree | 0 (0.0%) | 0 (0.0%) |
| Bachelor's Degree | 0 (0.0%) | 0 (0.0%) |
| Graduate Degree | 0 (0.0%) | 0 (0.0%) |
| Total | 0 (0.0%) | 0 (0.0%) |
Income in Dewey Humboldt
Income Overview in Dewey Humboldt
Per Capita Income in Dewey Humboldt is $31,676, while median incomes of families and households are $63,105 and $56,604 respectively.
| Characteristic | Number | Measure |
| Per Capita Income | 4,363 | $31,676 |
| Median Family Income | 1,151 | $63,105 |
| Mean Family Income | 1,151 | $83,827 |
| Median Household Income | 1,786 | $56,604 |
| Mean Household Income | 1,786 | $77,762 |
| Income Deficit | 1,151 | $0 |
| Wage / Income Gap (%) | 4,363 | 21.76% |
| Wage / Income Gap ($) | 4,363 | 78.24¢ per $1 |
| Gini / Inequality Index | 4,363 | 0.41 |
Earnings by Sex in Dewey Humboldt
Average Earnings in Dewey Humboldt are $33,559, $34,447 for men and $26,950 for women, a difference of 21.8%.
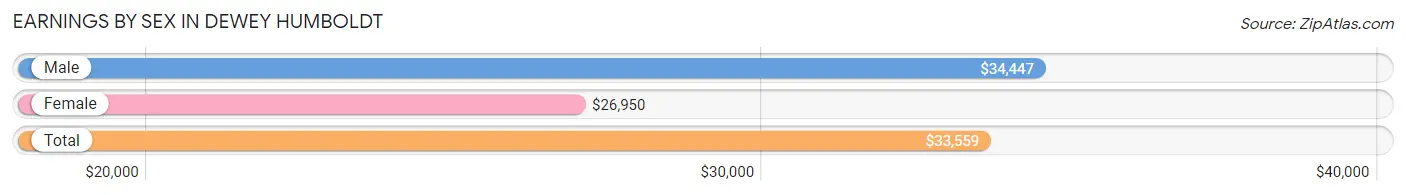
| Sex | Number | Average Earnings |
| Male | 896 (58.4%) | $34,447 |
| Female | 639 (41.6%) | $26,950 |
| Total | 1,535 (100.0%) | $33,559 |
Earnings by Sex by Income Bracket in Dewey Humboldt
The most common earnings brackets in Dewey Humboldt are $30,000 to $34,999 for men (224 | 25.0%) and $2,500 to $4,999 for women (92 | 14.4%).
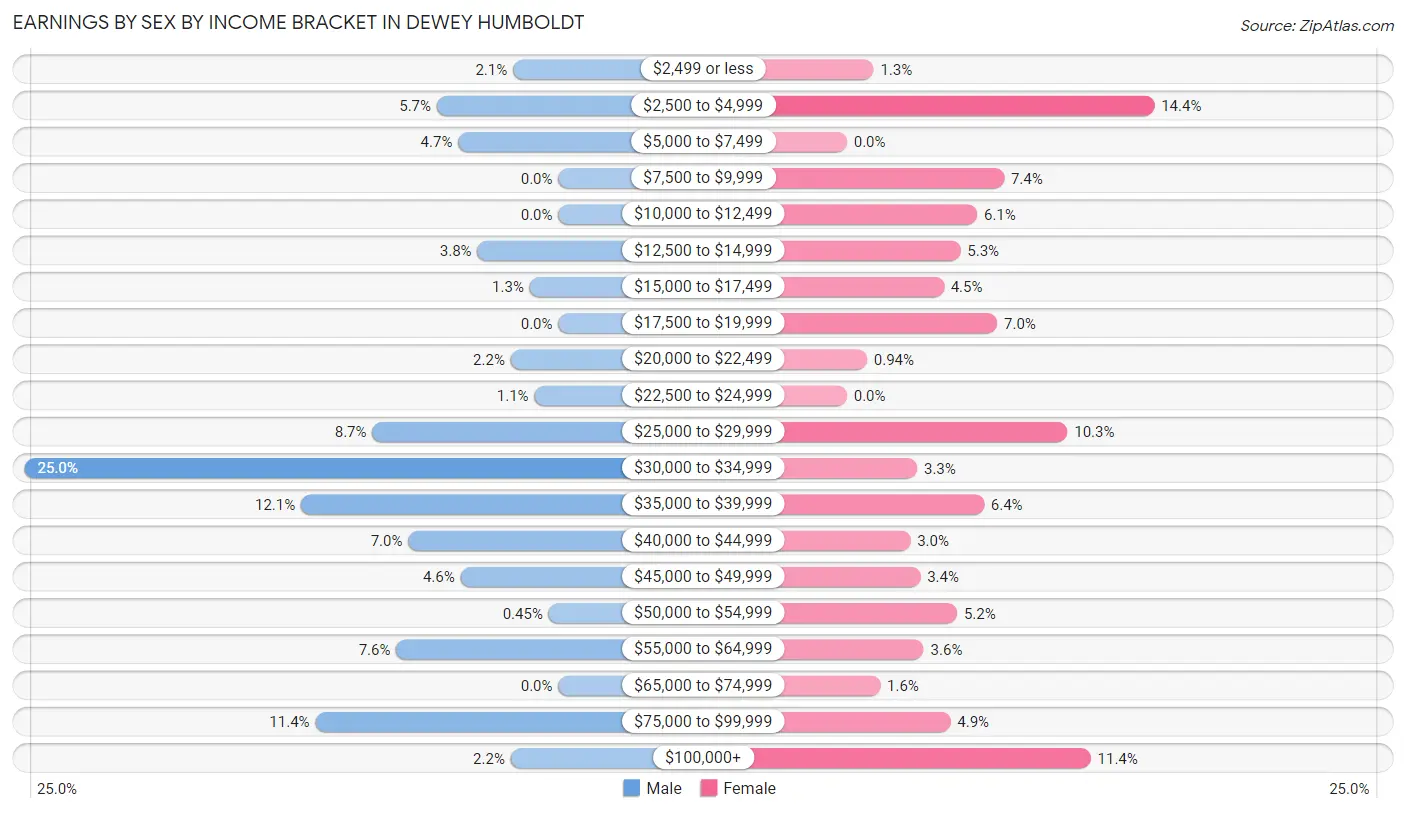
| Income | Male | Female |
| $2,499 or less | 19 (2.1%) | 8 (1.3%) |
| $2,500 to $4,999 | 51 (5.7%) | 92 (14.4%) |
| $5,000 to $7,499 | 42 (4.7%) | 0 (0.0%) |
| $7,500 to $9,999 | 0 (0.0%) | 47 (7.4%) |
| $10,000 to $12,499 | 0 (0.0%) | 39 (6.1%) |
| $12,500 to $14,999 | 34 (3.8%) | 34 (5.3%) |
| $15,000 to $17,499 | 12 (1.3%) | 29 (4.5%) |
| $17,500 to $19,999 | 0 (0.0%) | 45 (7.0%) |
| $20,000 to $22,499 | 20 (2.2%) | 6 (0.9%) |
| $22,500 to $24,999 | 10 (1.1%) | 0 (0.0%) |
| $25,000 to $29,999 | 78 (8.7%) | 66 (10.3%) |
| $30,000 to $34,999 | 224 (25.0%) | 21 (3.3%) |
| $35,000 to $39,999 | 108 (12.0%) | 41 (6.4%) |
| $40,000 to $44,999 | 63 (7.0%) | 19 (3.0%) |
| $45,000 to $49,999 | 41 (4.6%) | 22 (3.4%) |
| $50,000 to $54,999 | 4 (0.4%) | 33 (5.2%) |
| $55,000 to $64,999 | 68 (7.6%) | 23 (3.6%) |
| $65,000 to $74,999 | 0 (0.0%) | 10 (1.6%) |
| $75,000 to $99,999 | 102 (11.4%) | 31 (4.9%) |
| $100,000+ | 20 (2.2%) | 73 (11.4%) |
| Total | 896 (100.0%) | 639 (100.0%) |
Earnings by Sex by Educational Attainment in Dewey Humboldt
Average earnings in Dewey Humboldt are $34,530 for men and $31,726 for women, a difference of 8.1%. Men with an educational attainment of college or associate's degree enjoy the highest average annual earnings of $40,536, while those with high school diploma education earn the least with $32,966. Women with an educational attainment of bachelor's degree earn the most with the average annual earnings of $173,860, while those with college or associate's degree education have the smallest earnings of $27,917.
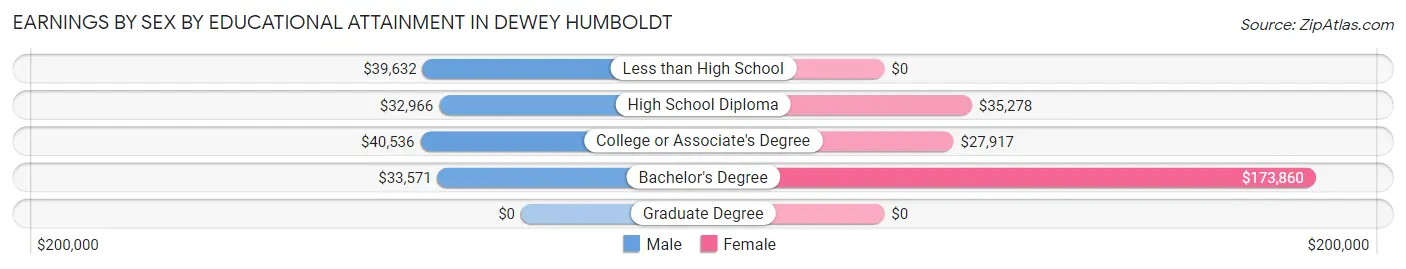
| Educational Attainment | Male Income | Female Income |
| Less than High School | $39,632 | $0 |
| High School Diploma | $32,966 | $35,278 |
| College or Associate's Degree | $40,536 | $27,917 |
| Bachelor's Degree | $33,571 | $173,860 |
| Graduate Degree | - | - |
| Total | $34,530 | $31,726 |
Family Income in Dewey Humboldt
Family Income Brackets in Dewey Humboldt
According to the Dewey Humboldt family income data, there are 259 families falling into the $35,000 to $49,999 income range, which is the most common income bracket and makes up 22.5% of all families.
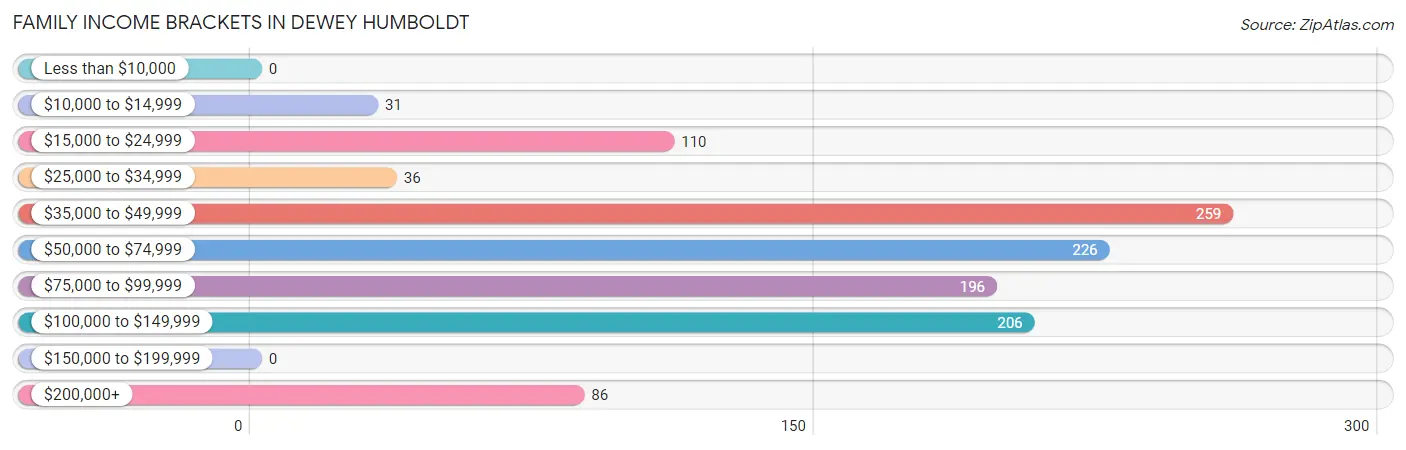
| Income Bracket | # Families | % Families |
| Less than $10,000 | 0 | 0.0% |
| $10,000 to $14,999 | 31 | 2.7% |
| $15,000 to $24,999 | 110 | 9.6% |
| $25,000 to $34,999 | 36 | 3.1% |
| $35,000 to $49,999 | 259 | 22.5% |
| $50,000 to $74,999 | 226 | 19.6% |
| $75,000 to $99,999 | 196 | 17.0% |
| $100,000 to $149,999 | 206 | 17.9% |
| $150,000 to $199,999 | 0 | 0.0% |
| $200,000+ | 86 | 7.5% |
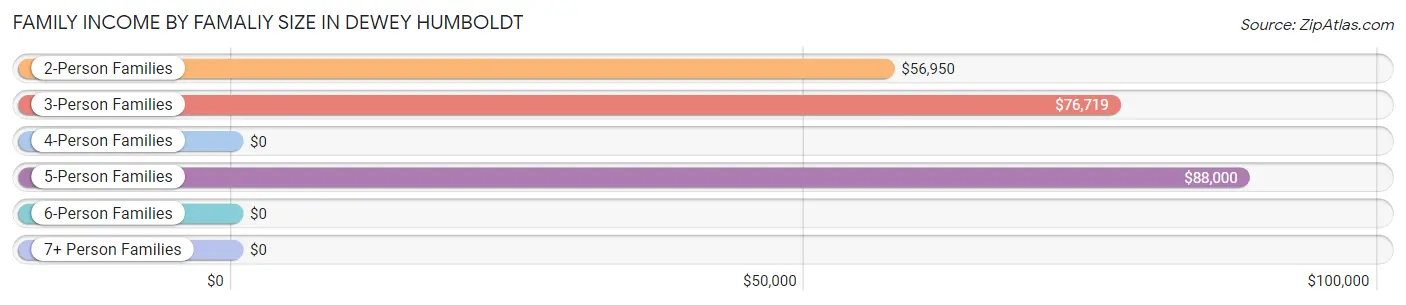
Family Income by Famaliy Size in Dewey Humboldt
5-person families (68 | 5.9%) account for the highest median family income in Dewey Humboldt with $88,000 per family, while 2-person families (870 | 75.6%) have the highest median income of $28,475 per family member.
| Income Bracket | # Families | Median Income |
| 2-Person Families | 870 (75.6%) | $56,950 |
| 3-Person Families | 100 (8.7%) | $76,719 |
| 4-Person Families | 87 (7.6%) | $0 |
| 5-Person Families | 68 (5.9%) | $88,000 |
| 6-Person Families | 15 (1.3%) | $0 |
| 7+ Person Families | 11 (1.0%) | $0 |
| Total | 1,151 (100.0%) | $63,105 |
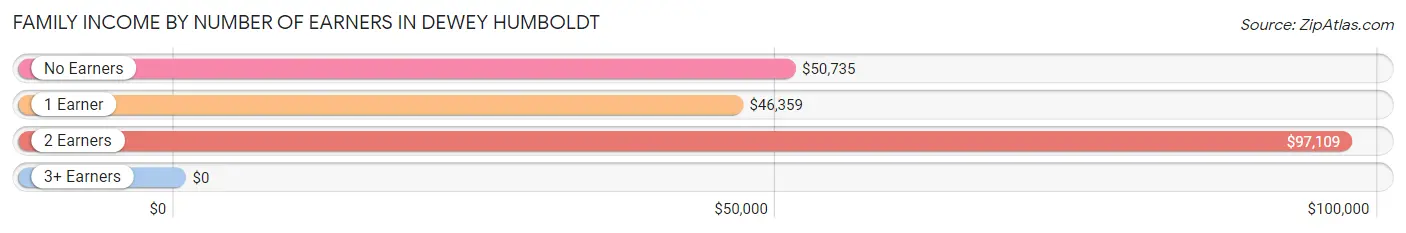
Family Income by Number of Earners in Dewey Humboldt
| Number of Earners | # Families | Median Income |
| No Earners | 468 (40.7%) | $50,735 |
| 1 Earner | 348 (30.2%) | $46,359 |
| 2 Earners | 313 (27.2%) | $97,109 |
| 3+ Earners | 22 (1.9%) | $0 |
| Total | 1,151 (100.0%) | $63,105 |
Household Income in Dewey Humboldt
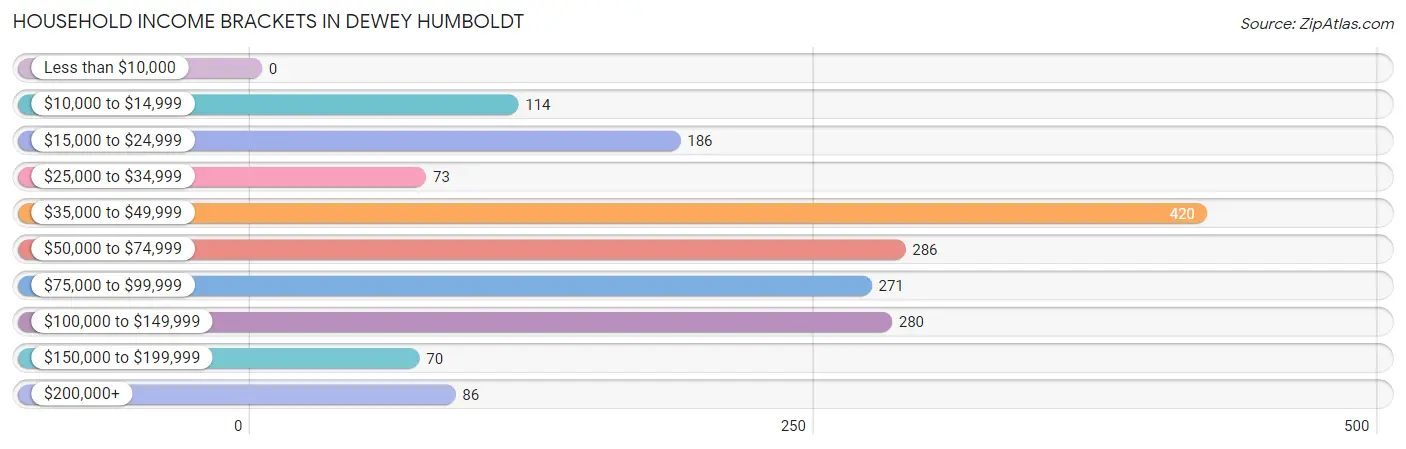
Household Income Brackets in Dewey Humboldt
With 420 households falling in the category, the $35,000 to $49,999 income range is the most frequent in Dewey Humboldt, accounting for 23.5% of all households.
| Income Bracket | # Households | % Households |
| Less than $10,000 | 0 | 0.0% |
| $10,000 to $14,999 | 114 | 6.4% |
| $15,000 to $24,999 | 186 | 10.4% |
| $25,000 to $34,999 | 73 | 4.1% |
| $35,000 to $49,999 | 420 | 23.5% |
| $50,000 to $74,999 | 286 | 16.0% |
| $75,000 to $99,999 | 271 | 15.2% |
| $100,000 to $149,999 | 280 | 15.7% |
| $150,000 to $199,999 | 70 | 3.9% |
| $200,000+ | 86 | 4.8% |
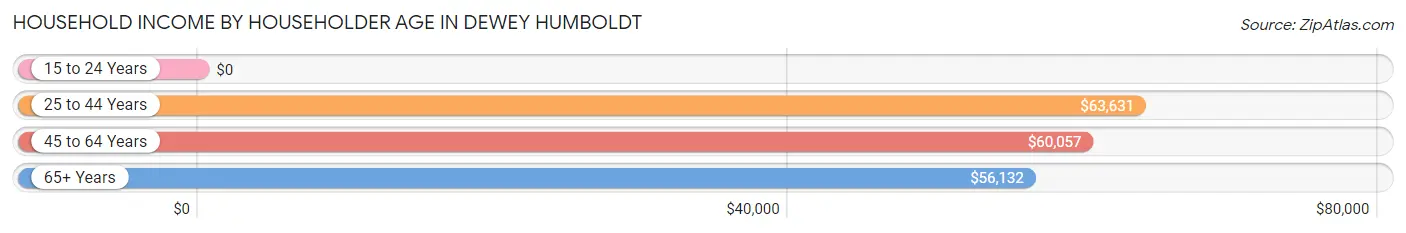
Household Income by Householder Age in Dewey Humboldt
The median household income in Dewey Humboldt is $56,604, with the highest median household income of $63,631 found in the 25 to 44 years age bracket for the primary householder. A total of 185 households (10.4%) fall into this category.
| Income Bracket | # Households | Median Income |
| 15 to 24 Years | 0 (0.0%) | $0 |
| 25 to 44 Years | 185 (10.4%) | $63,631 |
| 45 to 64 Years | 611 (34.2%) | $60,057 |
| 65+ Years | 990 (55.4%) | $56,132 |
| Total | 1,786 (100.0%) | $56,604 |
Poverty in Dewey Humboldt
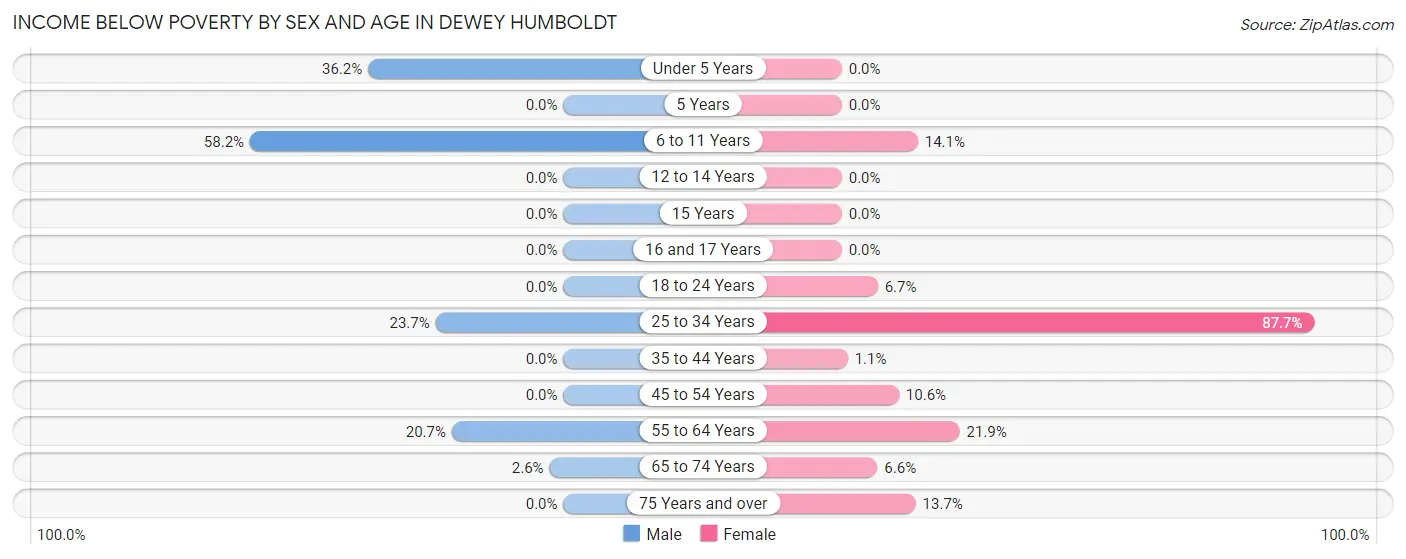
Income Below Poverty by Sex and Age in Dewey Humboldt
With 8.9% poverty level for males and 15.9% for females among the residents of Dewey Humboldt, 6 to 11 year old males and 25 to 34 year old females are the most vulnerable to poverty, with 32 males (58.2%) and 114 females (87.7%) in their respective age groups living below the poverty level.
| Age Bracket | Male | Female |
| Under 5 Years | 54 (36.2%) | 0 (0.0%) |
| 5 Years | 0 (0.0%) | 0 (0.0%) |
| 6 to 11 Years | 32 (58.2%) | 32 (14.1%) |
| 12 to 14 Years | 0 (0.0%) | 0 (0.0%) |
| 15 Years | 0 (0.0%) | 0 (0.0%) |
| 16 and 17 Years | 0 (0.0%) | 0 (0.0%) |
| 18 to 24 Years | 0 (0.0%) | 2 (6.7%) |
| 25 to 34 Years | 28 (23.7%) | 114 (87.7%) |
| 35 to 44 Years | 0 (0.0%) | 2 (1.1%) |
| 45 to 54 Years | 0 (0.0%) | 16 (10.6%) |
| 55 to 64 Years | 70 (20.7%) | 80 (21.9%) |
| 65 to 74 Years | 15 (2.6%) | 33 (6.6%) |
| 75 Years and over | 0 (0.0%) | 51 (13.7%) |
| Total | 199 (8.9%) | 330 (15.9%) |
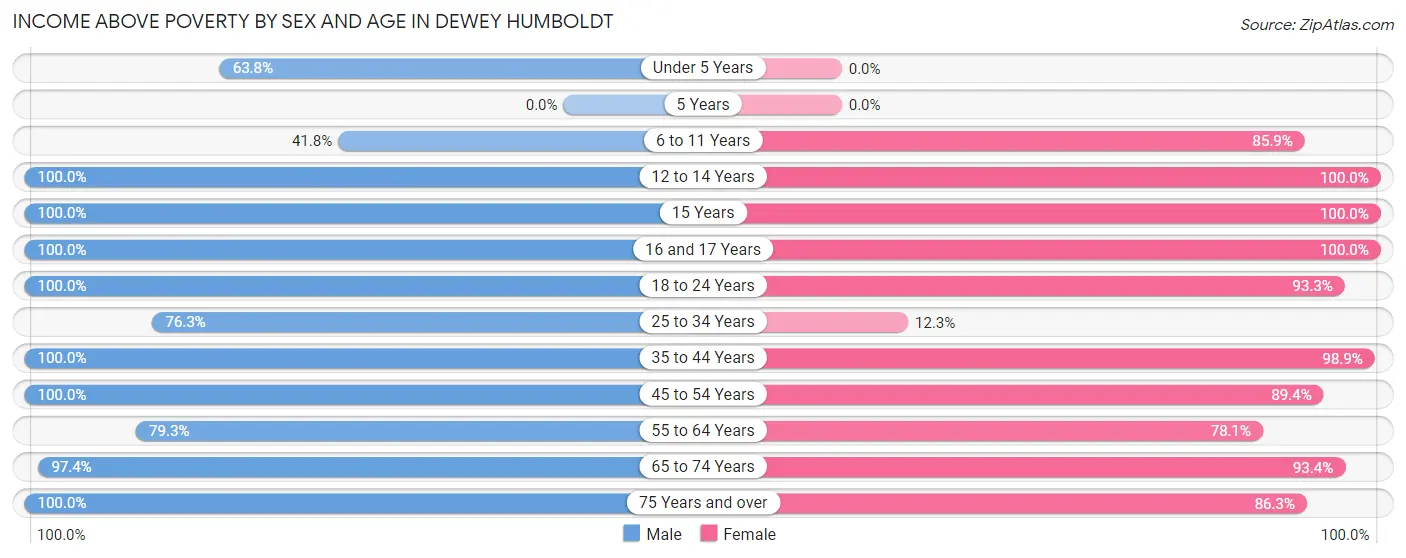
Income Above Poverty by Sex and Age in Dewey Humboldt
According to the poverty statistics in Dewey Humboldt, males aged 12 to 14 years and females aged 12 to 14 years are the age groups that are most secure financially, with 100.0% of males and 100.0% of females in these age groups living above the poverty line.
| Age Bracket | Male | Female |
| Under 5 Years | 95 (63.8%) | 0 (0.0%) |
| 5 Years | 0 (0.0%) | 0 (0.0%) |
| 6 to 11 Years | 23 (41.8%) | 195 (85.9%) |
| 12 to 14 Years | 152 (100.0%) | 12 (100.0%) |
| 15 Years | 16 (100.0%) | 6 (100.0%) |
| 16 and 17 Years | 12 (100.0%) | 98 (100.0%) |
| 18 to 24 Years | 70 (100.0%) | 28 (93.3%) |
| 25 to 34 Years | 90 (76.3%) | 16 (12.3%) |
| 35 to 44 Years | 199 (100.0%) | 179 (98.9%) |
| 45 to 54 Years | 201 (100.0%) | 135 (89.4%) |
| 55 to 64 Years | 268 (79.3%) | 286 (78.1%) |
| 65 to 74 Years | 567 (97.4%) | 466 (93.4%) |
| 75 Years and over | 351 (100.0%) | 321 (86.3%) |
| Total | 2,044 (91.1%) | 1,742 (84.1%) |
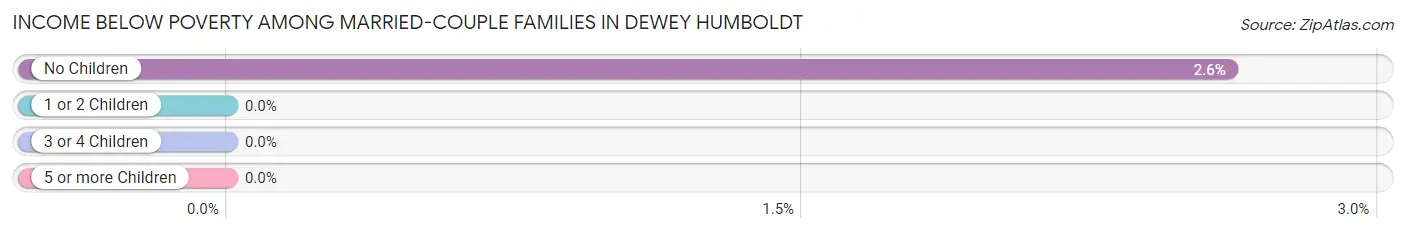
Income Below Poverty Among Married-Couple Families in Dewey Humboldt
The poverty statistics for married-couple families in Dewey Humboldt show that 2.2% or 21 of the total 932 families live below the poverty line. Families with no children have the highest poverty rate of 2.6%, comprising of 21 families. On the other hand, families with 1 or 2 children have the lowest poverty rate of 0.0%, which includes 0 families.
| Children | Above Poverty | Below Poverty |
| No Children | 784 (97.4%) | 21 (2.6%) |
| 1 or 2 Children | 72 (100.0%) | 0 (0.0%) |
| 3 or 4 Children | 44 (100.0%) | 0 (0.0%) |
| 5 or more Children | 11 (100.0%) | 0 (0.0%) |
| Total | 911 (97.8%) | 21 (2.2%) |
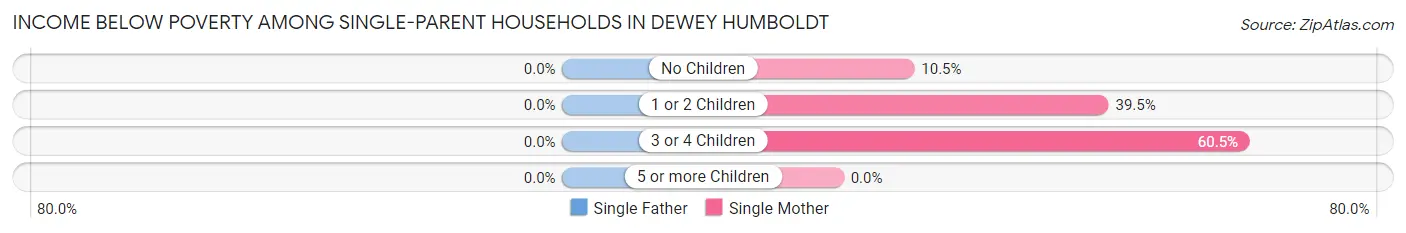
Income Below Poverty Among Single-Parent Households in Dewey Humboldt
| Children | Single Father | Single Mother |
| No Children | 0 (0.0%) | 10 (10.5%) |
| 1 or 2 Children | 0 (0.0%) | 15 (39.5%) |
| 3 or 4 Children | 0 (0.0%) | 23 (60.5%) |
| 5 or more Children | 0 (0.0%) | 0 (0.0%) |
| Total | 0 (0.0%) | 48 (28.1%) |
Income Below Poverty Among Married-Couple vs Single-Parent Households in Dewey Humboldt
The poverty data for Dewey Humboldt shows that 21 of the married-couple family households (2.2%) and 48 of the single-parent households (21.9%) are living below the poverty level. Within the married-couple family households, those with no children have the highest poverty rate, with 21 households (2.6%) falling below the poverty line. Among the single-parent households, those with 3 or 4 children have the highest poverty rate, with 23 household (60.5%) living below poverty.
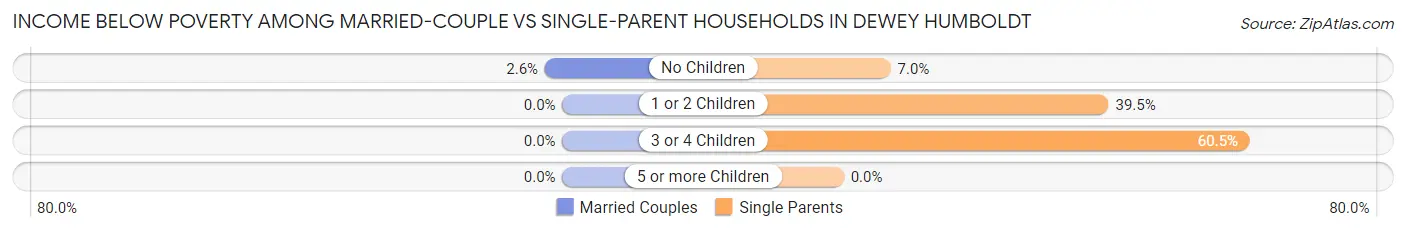
| Children | Married-Couple Families | Single-Parent Households |
| No Children | 21 (2.6%) | 10 (7.0%) |
| 1 or 2 Children | 0 (0.0%) | 15 (39.5%) |
| 3 or 4 Children | 0 (0.0%) | 23 (60.5%) |
| 5 or more Children | 0 (0.0%) | 0 (0.0%) |
| Total | 21 (2.2%) | 48 (21.9%) |
Employment Characteristics in Dewey Humboldt
Employment by Class of Employer in Dewey Humboldt
Among the 1,279 employed individuals in Dewey Humboldt, private company employees (811 | 63.4%), self-employed (not incorporated) (154 | 12.0%), and local government employees (74 | 5.8%) make up the most common classes of employment.
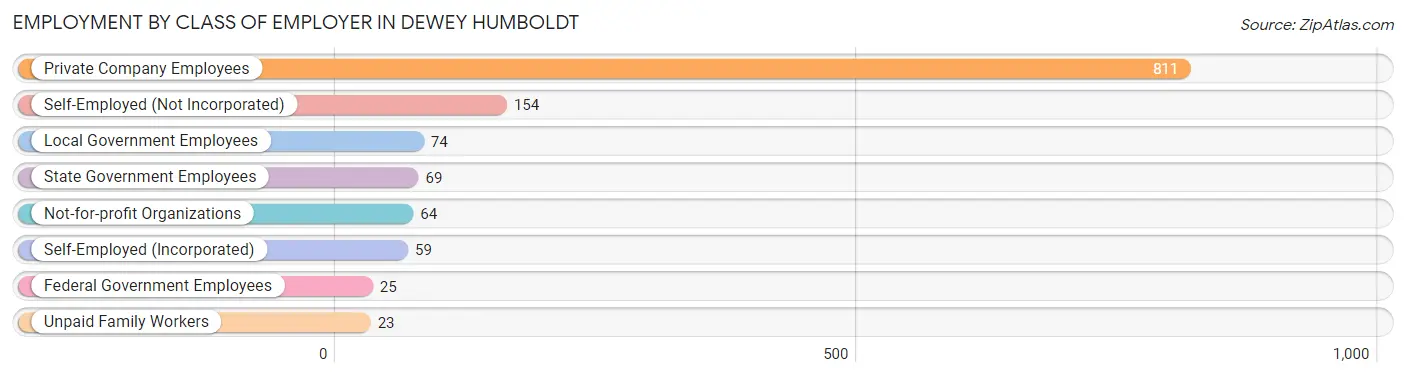
| Employer Class | # Employees | % Employees |
| Private Company Employees | 811 | 63.4% |
| Self-Employed (Incorporated) | 59 | 4.6% |
| Self-Employed (Not Incorporated) | 154 | 12.0% |
| Not-for-profit Organizations | 64 | 5.0% |
| Local Government Employees | 74 | 5.8% |
| State Government Employees | 69 | 5.4% |
| Federal Government Employees | 25 | 1.9% |
| Unpaid Family Workers | 23 | 1.8% |
| Total | 1,279 | 100.0% |
Employment Status by Age in Dewey Humboldt
According to the labor force statistics for Dewey Humboldt, out of the total population over 16 years of age (3,698), 37.6% or 1,390 individuals are in the labor force, with 8.1% or 113 of them unemployed. The age group with the highest labor force participation rate is 20 to 24 years, with 100.0% or 47 individuals in the labor force. Within the labor force, the 35 to 44 years age range has the highest percentage of unemployed individuals, with 25.4% or 68 of them being unemployed.
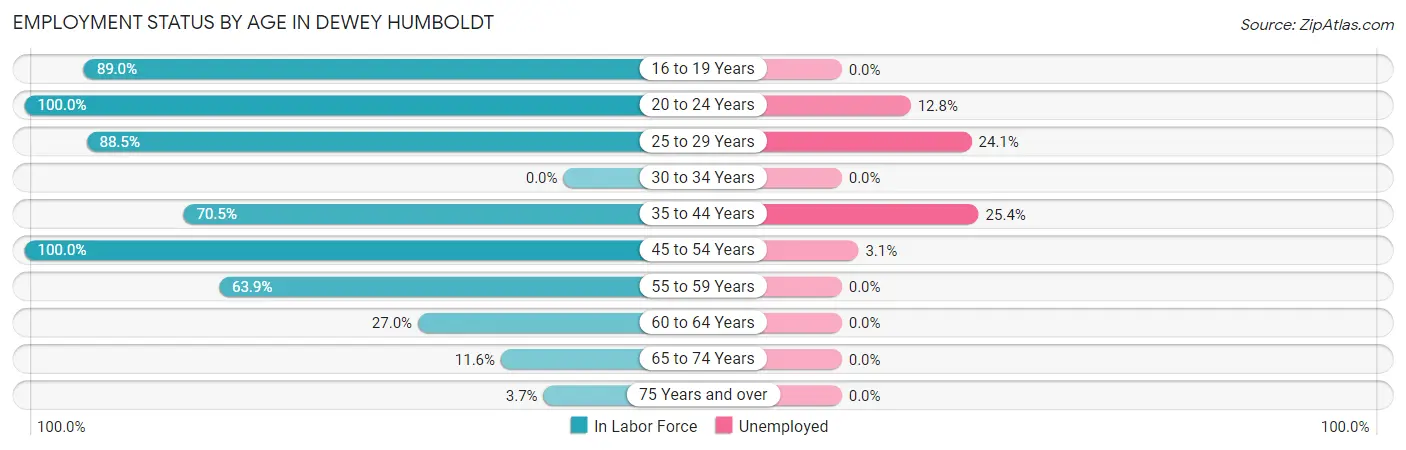
| Age Bracket | In Labor Force | Unemployed |
| 16 to 19 Years | 145 (89.0%) | 0 (0.0%) |
| 20 to 24 Years | 47 (100.0%) | 6 (12.8%) |
| 25 to 29 Years | 116 (88.5%) | 28 (24.1%) |
| 30 to 34 Years | 0 (0.0%) | 0 (0.0%) |
| 35 to 44 Years | 268 (70.5%) | 68 (25.4%) |
| 45 to 54 Years | 352 (100.0%) | 11 (3.1%) |
| 55 to 59 Years | 211 (63.9%) | 0 (0.0%) |
| 60 to 64 Years | 101 (27.0%) | 0 (0.0%) |
| 65 to 74 Years | 125 (11.6%) | 0 (0.0%) |
| 75 Years and over | 27 (3.7%) | 0 (0.0%) |
| Total | 1,390 (37.6%) | 113 (8.1%) |
Employment Status by Educational Attainment in Dewey Humboldt
According to labor force statistics for Dewey Humboldt, 62.2% of individuals (1,047) out of the total population between 25 and 64 years of age (1,684) are in the labor force, with 10.2% or 107 of them being unemployed. The group with the highest labor force participation rate are those with the educational attainment of less than high school, with 100.0% or 181 individuals in the labor force. Within the labor force, individuals with less than high school education have the highest percentage of unemployment, with 26.0% or 47 of them being unemployed.
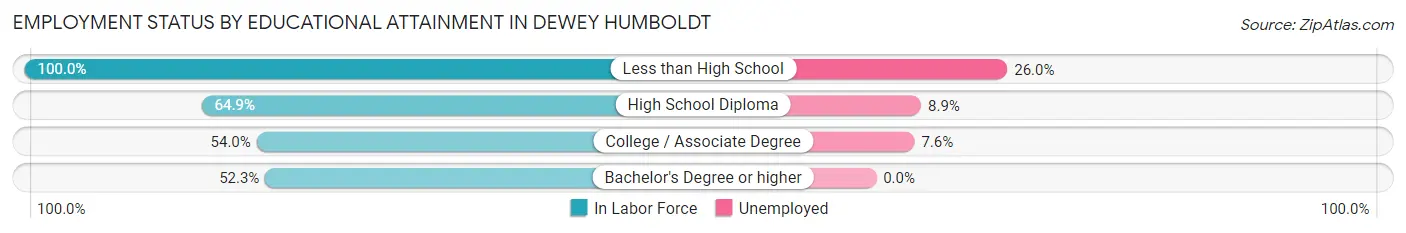
| Educational Attainment | In Labor Force | Unemployed |
| Less than High School | 181 (100.0%) | 47 (26.0%) |
| High School Diploma | 358 (64.9%) | 49 (8.9%) |
| College / Associate Degree | 370 (54.0%) | 52 (7.6%) |
| Bachelor's Degree or higher | 139 (52.3%) | 0 (0.0%) |
| Total | 1,047 (62.2%) | 172 (10.2%) |
Employment Occupations by Sex in Dewey Humboldt
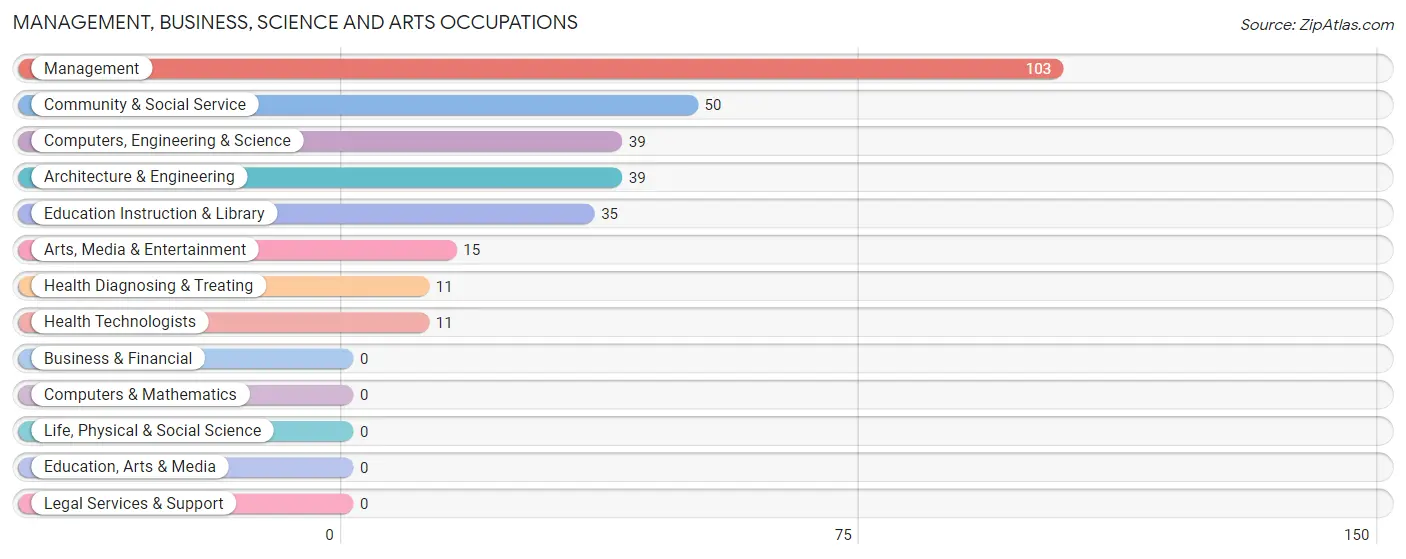
Management, Business, Science and Arts Occupations
The most common Management, Business, Science and Arts occupations in Dewey Humboldt are Management (103 | 8.1%), Community & Social Service (50 | 3.9%), Computers, Engineering & Science (39 | 3.0%), Architecture & Engineering (39 | 3.0%), and Education Instruction & Library (35 | 2.7%).
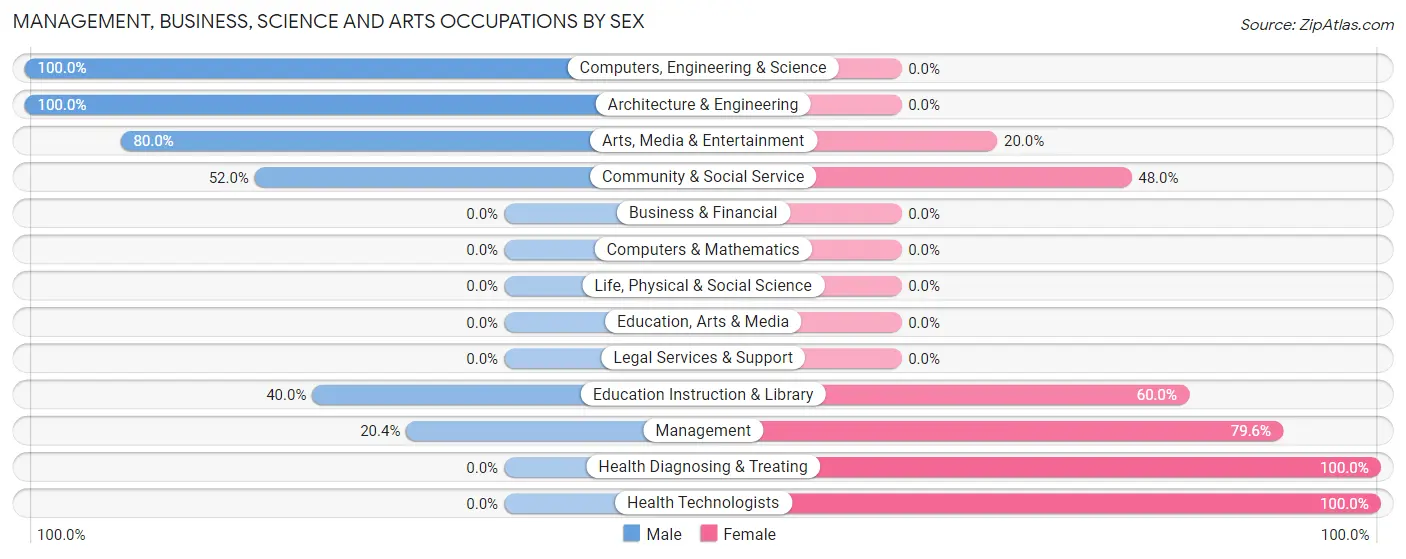
Management, Business, Science and Arts Occupations by Sex
Within the Management, Business, Science and Arts occupations in Dewey Humboldt, the most male-oriented occupations are Computers, Engineering & Science (100.0%), Architecture & Engineering (100.0%), and Arts, Media & Entertainment (80.0%), while the most female-oriented occupations are Health Diagnosing & Treating (100.0%), Health Technologists (100.0%), and Management (79.6%).
| Occupation | Male | Female |
| Management | 21 (20.4%) | 82 (79.6%) |
| Business & Financial | 0 (0.0%) | 0 (0.0%) |
| Computers, Engineering & Science | 39 (100.0%) | 0 (0.0%) |
| Computers & Mathematics | 0 (0.0%) | 0 (0.0%) |
| Architecture & Engineering | 39 (100.0%) | 0 (0.0%) |
| Life, Physical & Social Science | 0 (0.0%) | 0 (0.0%) |
| Community & Social Service | 26 (52.0%) | 24 (48.0%) |
| Education, Arts & Media | 0 (0.0%) | 0 (0.0%) |
| Legal Services & Support | 0 (0.0%) | 0 (0.0%) |
| Education Instruction & Library | 14 (40.0%) | 21 (60.0%) |
| Arts, Media & Entertainment | 12 (80.0%) | 3 (20.0%) |
| Health Diagnosing & Treating | 0 (0.0%) | 11 (100.0%) |
| Health Technologists | 0 (0.0%) | 11 (100.0%) |
| Total (Category) | 86 (42.4%) | 117 (57.6%) |
| Total (Overall) | 737 (57.6%) | 542 (42.4%) |
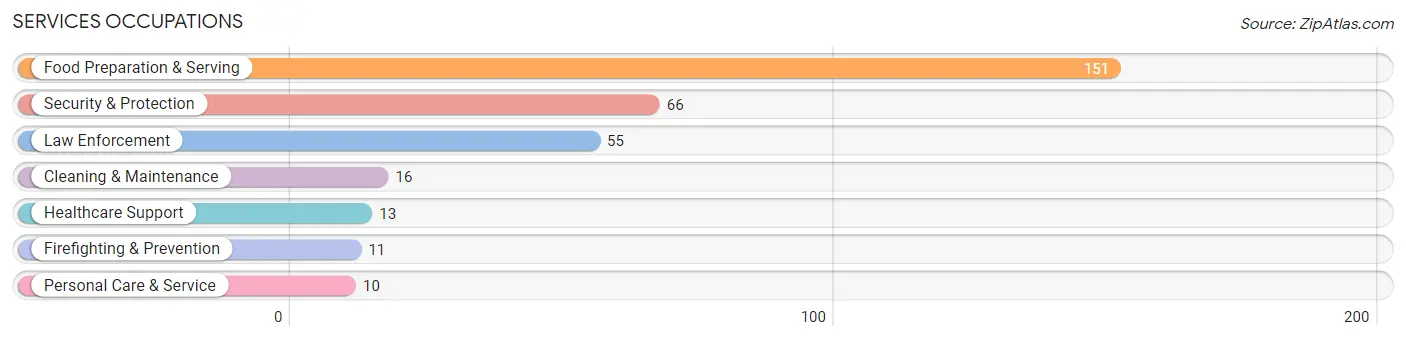
Services Occupations
The most common Services occupations in Dewey Humboldt are Food Preparation & Serving (151 | 11.8%), Security & Protection (66 | 5.2%), Law Enforcement (55 | 4.3%), Cleaning & Maintenance (16 | 1.3%), and Healthcare Support (13 | 1.0%).
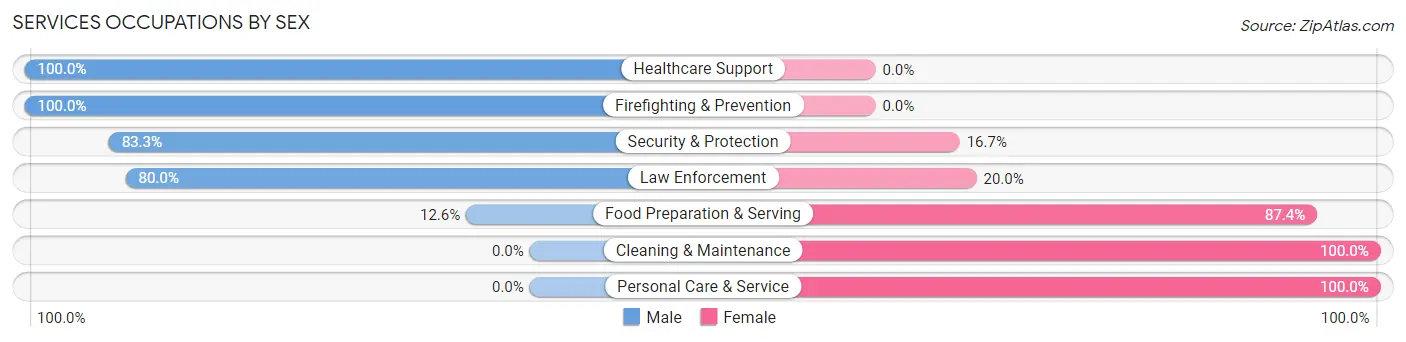
Services Occupations by Sex
Within the Services occupations in Dewey Humboldt, the most male-oriented occupations are Healthcare Support (100.0%), Firefighting & Prevention (100.0%), and Security & Protection (83.3%), while the most female-oriented occupations are Cleaning & Maintenance (100.0%), Personal Care & Service (100.0%), and Food Preparation & Serving (87.4%).
| Occupation | Male | Female |
| Healthcare Support | 13 (100.0%) | 0 (0.0%) |
| Security & Protection | 55 (83.3%) | 11 (16.7%) |
| Firefighting & Prevention | 11 (100.0%) | 0 (0.0%) |
| Law Enforcement | 44 (80.0%) | 11 (20.0%) |
| Food Preparation & Serving | 19 (12.6%) | 132 (87.4%) |
| Cleaning & Maintenance | 0 (0.0%) | 16 (100.0%) |
| Personal Care & Service | 0 (0.0%) | 10 (100.0%) |
| Total (Category) | 87 (34.0%) | 169 (66.0%) |
| Total (Overall) | 737 (57.6%) | 542 (42.4%) |
Sales and Office Occupations
The most common Sales and Office occupations in Dewey Humboldt are Sales & Related (181 | 14.1%), and Office & Administration (51 | 4.0%).
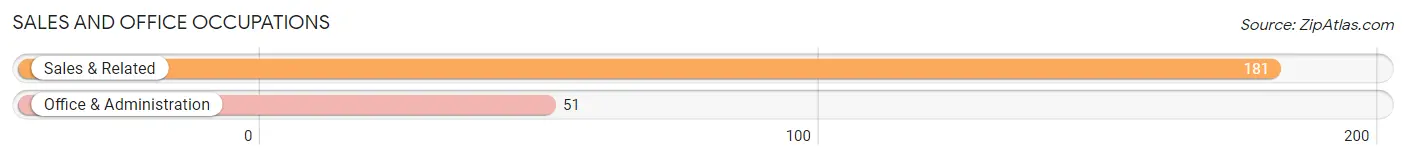
Sales and Office Occupations by Sex
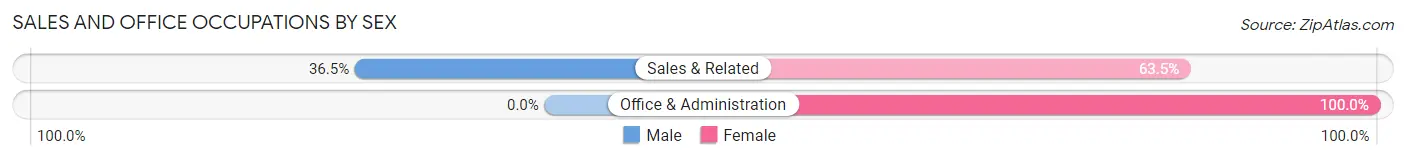
| Occupation | Male | Female |
| Sales & Related | 66 (36.5%) | 115 (63.5%) |
| Office & Administration | 0 (0.0%) | 51 (100.0%) |
| Total (Category) | 66 (28.4%) | 166 (71.6%) |
| Total (Overall) | 737 (57.6%) | 542 (42.4%) |
Natural Resources, Construction and Maintenance Occupations
The most common Natural Resources, Construction and Maintenance occupations in Dewey Humboldt are Construction & Extraction (232 | 18.1%), and Installation, Maintenance & Repair (91 | 7.1%).
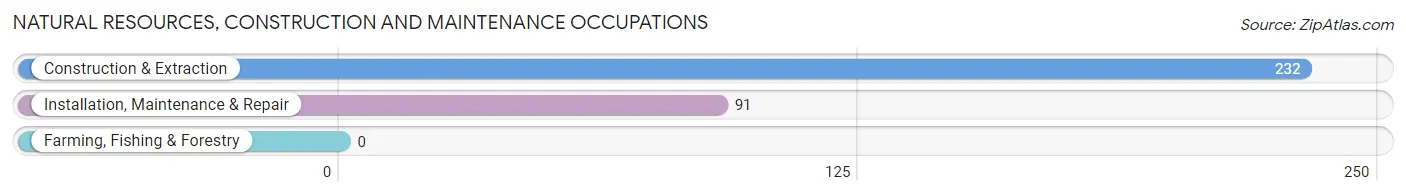
Natural Resources, Construction and Maintenance Occupations by Sex
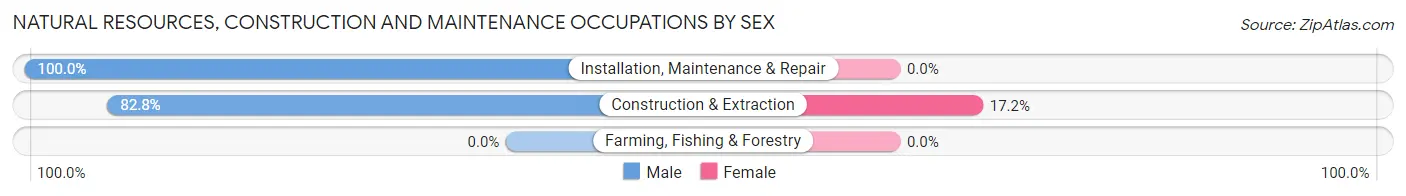
| Occupation | Male | Female |
| Farming, Fishing & Forestry | 0 (0.0%) | 0 (0.0%) |
| Construction & Extraction | 192 (82.8%) | 40 (17.2%) |
| Installation, Maintenance & Repair | 91 (100.0%) | 0 (0.0%) |
| Total (Category) | 283 (87.6%) | 40 (12.4%) |
| Total (Overall) | 737 (57.6%) | 542 (42.4%) |
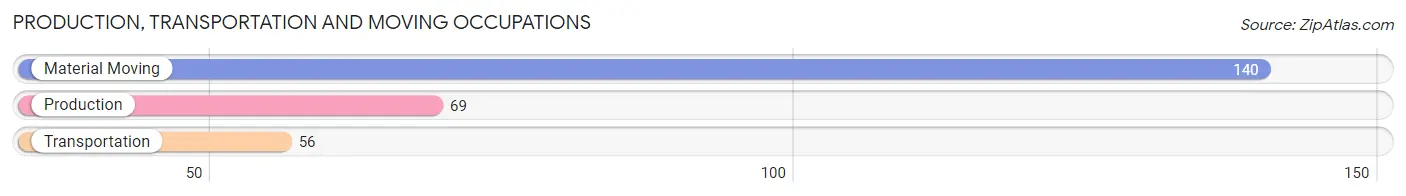
Production, Transportation and Moving Occupations
The most common Production, Transportation and Moving occupations in Dewey Humboldt are Material Moving (140 | 11.0%), Production (69 | 5.4%), and Transportation (56 | 4.4%).
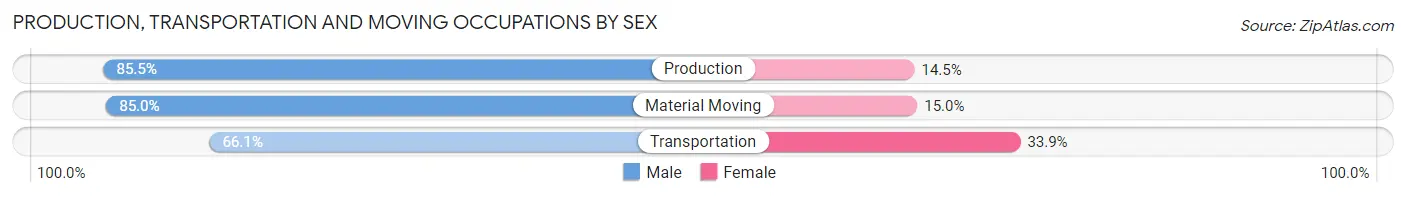
Production, Transportation and Moving Occupations by Sex
| Occupation | Male | Female |
| Production | 59 (85.5%) | 10 (14.5%) |
| Transportation | 37 (66.1%) | 19 (33.9%) |
| Material Moving | 119 (85.0%) | 21 (15.0%) |
| Total (Category) | 215 (81.1%) | 50 (18.9%) |
| Total (Overall) | 737 (57.6%) | 542 (42.4%) |
Employment Industries by Sex in Dewey Humboldt
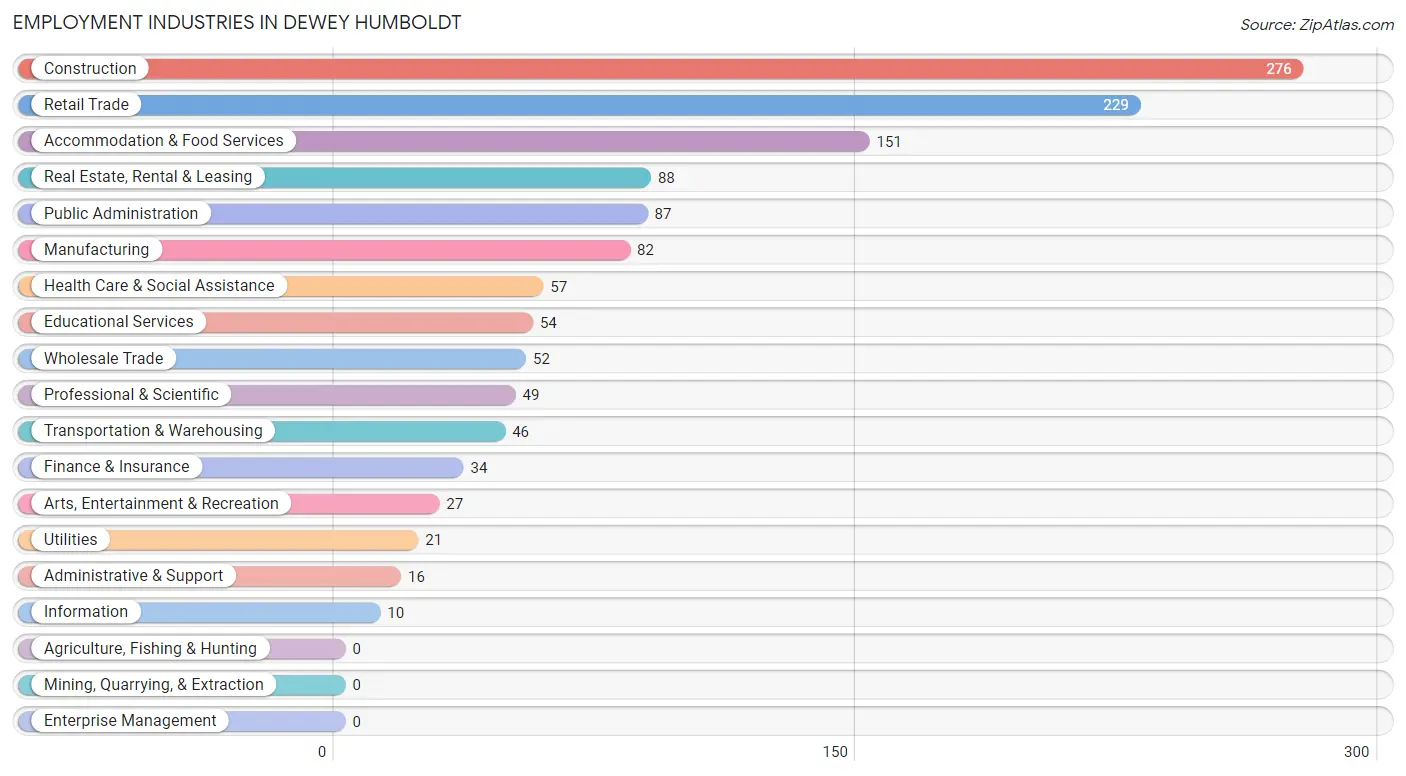
Employment Industries in Dewey Humboldt
The major employment industries in Dewey Humboldt include Construction (276 | 21.6%), Retail Trade (229 | 17.9%), Accommodation & Food Services (151 | 11.8%), Real Estate, Rental & Leasing (88 | 6.9%), and Public Administration (87 | 6.8%).
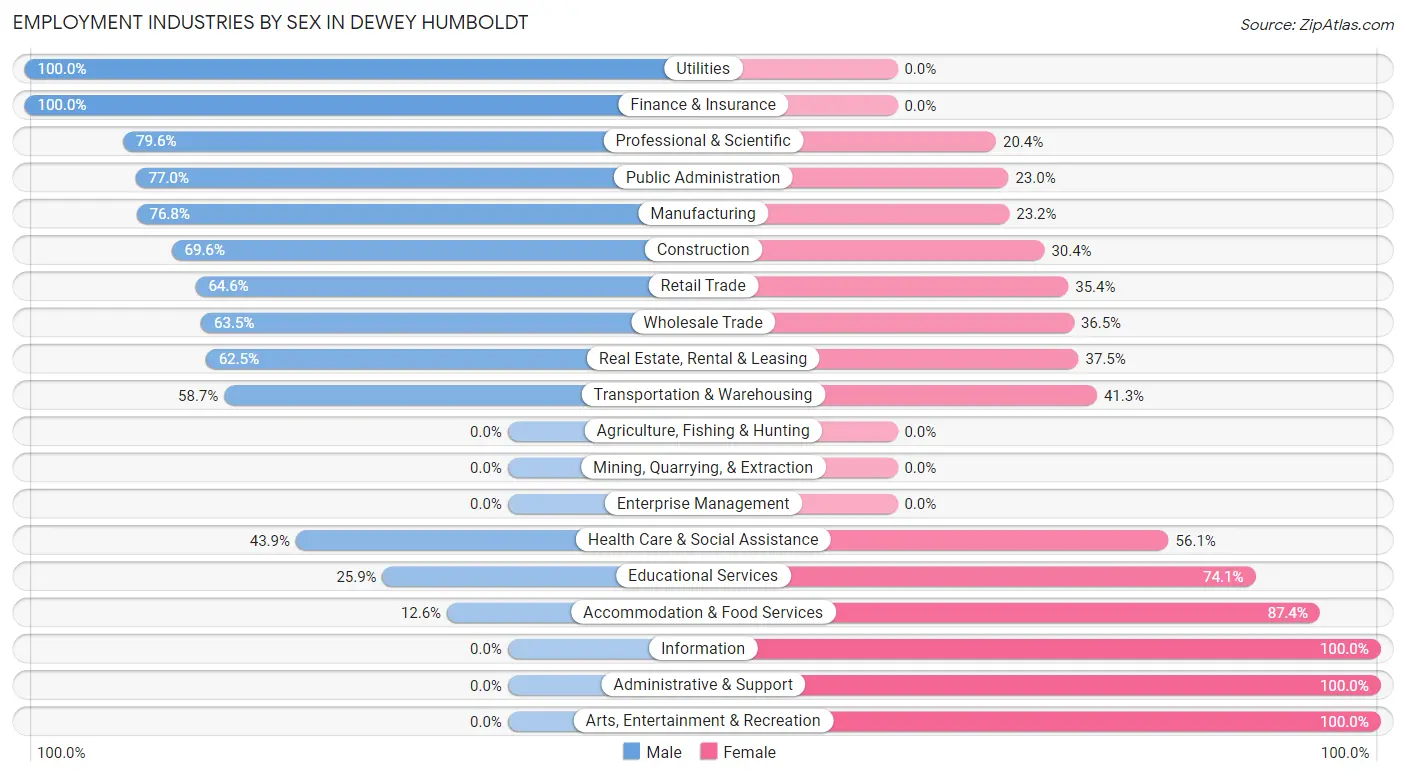
Employment Industries by Sex in Dewey Humboldt
The Dewey Humboldt industries that see more men than women are Utilities (100.0%), Finance & Insurance (100.0%), and Professional & Scientific (79.6%), whereas the industries that tend to have a higher number of women are Information (100.0%), Administrative & Support (100.0%), and Arts, Entertainment & Recreation (100.0%).
| Industry | Male | Female |
| Agriculture, Fishing & Hunting | 0 (0.0%) | 0 (0.0%) |
| Mining, Quarrying, & Extraction | 0 (0.0%) | 0 (0.0%) |
| Construction | 192 (69.6%) | 84 (30.4%) |
| Manufacturing | 63 (76.8%) | 19 (23.2%) |
| Wholesale Trade | 33 (63.5%) | 19 (36.5%) |
| Retail Trade | 148 (64.6%) | 81 (35.4%) |
| Transportation & Warehousing | 27 (58.7%) | 19 (41.3%) |
| Utilities | 21 (100.0%) | 0 (0.0%) |
| Information | 0 (0.0%) | 10 (100.0%) |
| Finance & Insurance | 34 (100.0%) | 0 (0.0%) |
| Real Estate, Rental & Leasing | 55 (62.5%) | 33 (37.5%) |
| Professional & Scientific | 39 (79.6%) | 10 (20.4%) |
| Enterprise Management | 0 (0.0%) | 0 (0.0%) |
| Administrative & Support | 0 (0.0%) | 16 (100.0%) |
| Educational Services | 14 (25.9%) | 40 (74.1%) |
| Health Care & Social Assistance | 25 (43.9%) | 32 (56.1%) |
| Arts, Entertainment & Recreation | 0 (0.0%) | 27 (100.0%) |
| Accommodation & Food Services | 19 (12.6%) | 132 (87.4%) |
| Public Administration | 67 (77.0%) | 20 (23.0%) |
| Total | 737 (57.6%) | 542 (42.4%) |
Education in Dewey Humboldt
School Enrollment in Dewey Humboldt
The most common levels of schooling among the 741 students in Dewey Humboldt are middle school (358 | 48.3%), elementary school (136 | 18.3%), and high school (132 | 17.8%).
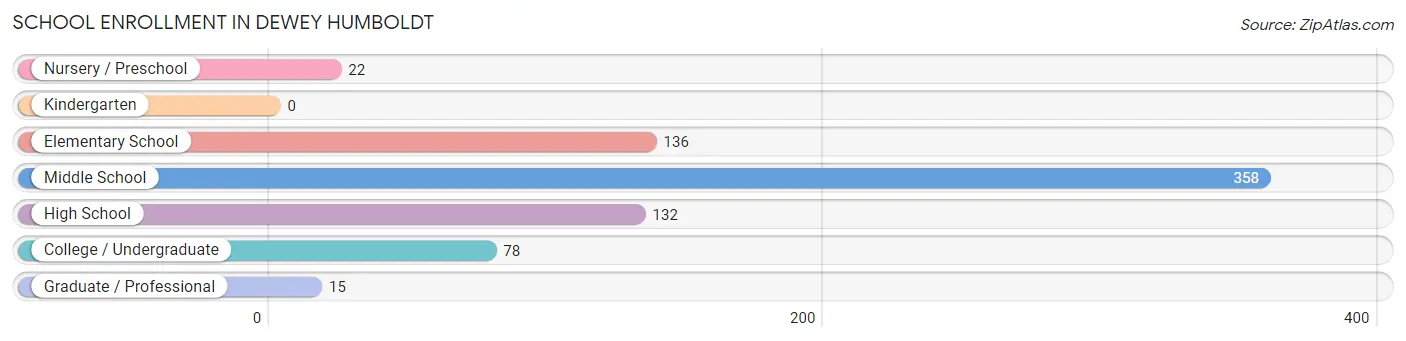
| School Level | # Students | % Students |
| Nursery / Preschool | 22 | 3.0% |
| Kindergarten | 0 | 0.0% |
| Elementary School | 136 | 18.3% |
| Middle School | 358 | 48.3% |
| High School | 132 | 17.8% |
| College / Undergraduate | 78 | 10.5% |
| Graduate / Professional | 15 | 2.0% |
| Total | 741 | 100.0% |
School Enrollment by Age by Funding Source in Dewey Humboldt
Out of a total of 741 students who are enrolled in schools in Dewey Humboldt, 268 (36.2%) attend a private institution, while the remaining 473 (63.8%) are enrolled in public schools. The age group of 15 to 17 year olds has the highest likelihood of being enrolled in private schools, with 104 (78.8% in the age bracket) enrolled. Conversely, the age group of 3 to 4 year olds has the lowest likelihood of being enrolled in a private school, with 22 (100.0% in the age bracket) attending a public institution.
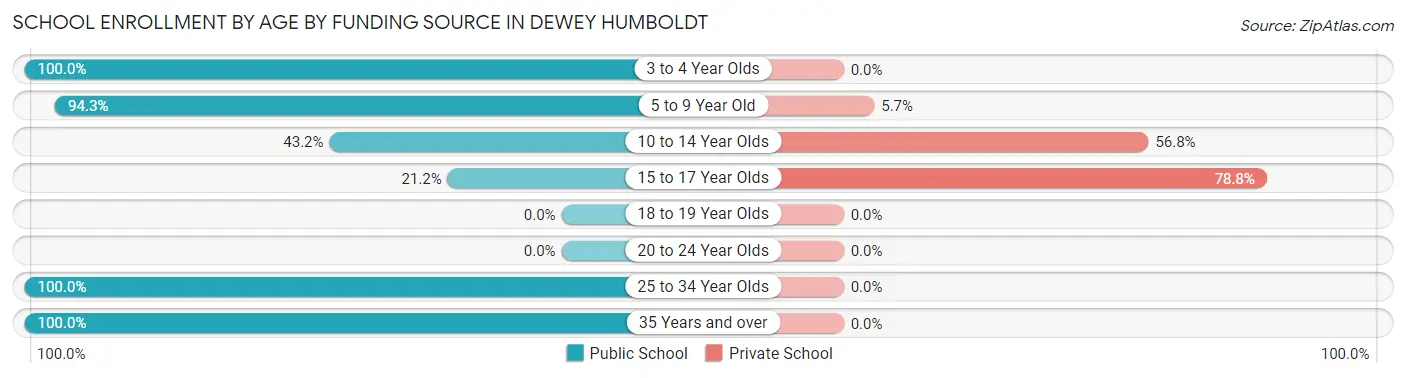
| Age Bracket | Public School | Private School |
| 3 to 4 Year Olds | 22 (100.0%) | 0 (0.0%) |
| 5 to 9 Year Old | 215 (94.3%) | 13 (5.7%) |
| 10 to 14 Year Olds | 115 (43.2%) | 151 (56.8%) |
| 15 to 17 Year Olds | 28 (21.2%) | 104 (78.8%) |
| 18 to 19 Year Olds | 0 (0.0%) | 0 (0.0%) |
| 20 to 24 Year Olds | 0 (0.0%) | 0 (0.0%) |
| 25 to 34 Year Olds | 78 (100.0%) | 0 (0.0%) |
| 35 Years and over | 15 (100.0%) | 0 (0.0%) |
| Total | 473 (63.8%) | 268 (36.2%) |
Educational Attainment by Field of Study in Dewey Humboldt
Education (162 | 23.2%), business (135 | 19.3%), liberal arts & history (135 | 19.3%), arts & humanities (64 | 9.2%), and science & technology (59 | 8.4%) are the most common fields of study among 699 individuals in Dewey Humboldt who have obtained a bachelor's degree or higher.
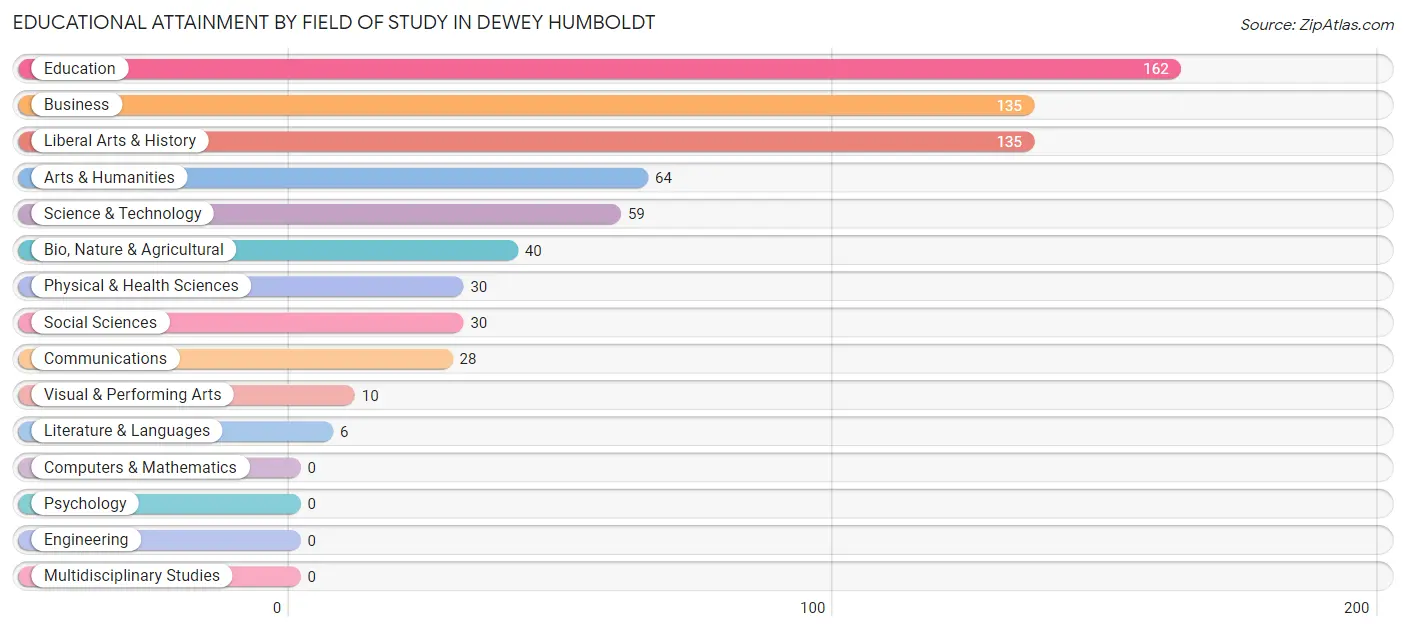
| Field of Study | # Graduates | % Graduates |
| Computers & Mathematics | 0 | 0.0% |
| Bio, Nature & Agricultural | 40 | 5.7% |
| Physical & Health Sciences | 30 | 4.3% |
| Psychology | 0 | 0.0% |
| Social Sciences | 30 | 4.3% |
| Engineering | 0 | 0.0% |
| Multidisciplinary Studies | 0 | 0.0% |
| Science & Technology | 59 | 8.4% |
| Business | 135 | 19.3% |
| Education | 162 | 23.2% |
| Literature & Languages | 6 | 0.9% |
| Liberal Arts & History | 135 | 19.3% |
| Visual & Performing Arts | 10 | 1.4% |
| Communications | 28 | 4.0% |
| Arts & Humanities | 64 | 9.2% |
| Total | 699 | 100.0% |
Transportation & Commute in Dewey Humboldt
Vehicle Availability by Sex in Dewey Humboldt
The most prevalent vehicle ownership categories in Dewey Humboldt are males with 2 vehicles (239, accounting for 32.4%) and females with 2 vehicles (99, making up 44.1%).
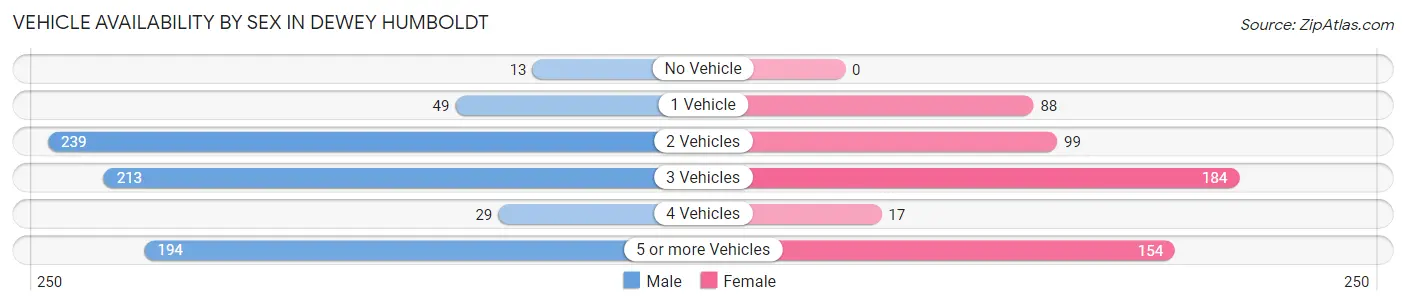
| Vehicles Available | Male | Female |
| No Vehicle | 13 (1.8%) | 0 (0.0%) |
| 1 Vehicle | 49 (6.7%) | 88 (16.2%) |
| 2 Vehicles | 239 (32.4%) | 99 (18.3%) |
| 3 Vehicles | 213 (28.9%) | 184 (34.0%) |
| 4 Vehicles | 29 (3.9%) | 17 (3.1%) |
| 5 or more Vehicles | 194 (26.3%) | 154 (28.4%) |
| Total | 737 (100.0%) | 542 (100.0%) |
Commute Time in Dewey Humboldt
The most frequently occuring commute durations in Dewey Humboldt are 20 to 24 minutes (291 commuters, 23.2%), 30 to 34 minutes (266 commuters, 21.2%), and 15 to 19 minutes (254 commuters, 20.2%).
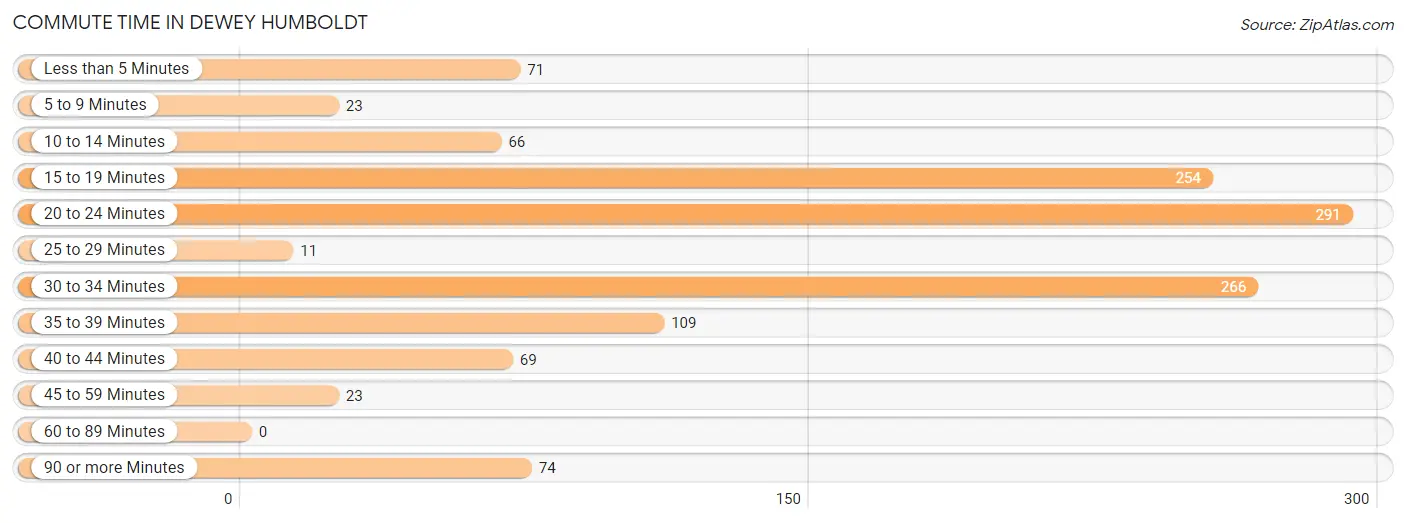
| Commute Time | # Commuters | % Commuters |
| Less than 5 Minutes | 71 | 5.7% |
| 5 to 9 Minutes | 23 | 1.8% |
| 10 to 14 Minutes | 66 | 5.2% |
| 15 to 19 Minutes | 254 | 20.2% |
| 20 to 24 Minutes | 291 | 23.2% |
| 25 to 29 Minutes | 11 | 0.9% |
| 30 to 34 Minutes | 266 | 21.2% |
| 35 to 39 Minutes | 109 | 8.7% |
| 40 to 44 Minutes | 69 | 5.5% |
| 45 to 59 Minutes | 23 | 1.8% |
| 60 to 89 Minutes | 0 | 0.0% |
| 90 or more Minutes | 74 | 5.9% |
Commute Time by Sex in Dewey Humboldt
The most common commute times in Dewey Humboldt are 15 to 19 minutes (203 commuters, 28.0%) for males and 20 to 24 minutes (192 commuters, 36.1%) for females.
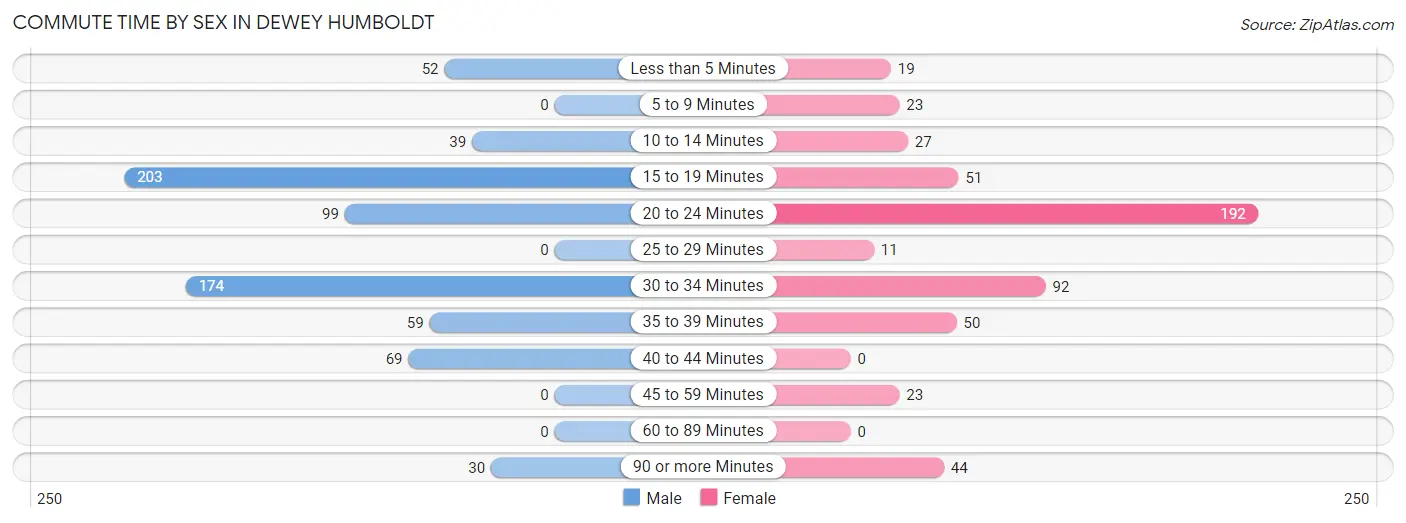
| Commute Time | Male | Female |
| Less than 5 Minutes | 52 (7.2%) | 19 (3.6%) |
| 5 to 9 Minutes | 0 (0.0%) | 23 (4.3%) |
| 10 to 14 Minutes | 39 (5.4%) | 27 (5.1%) |
| 15 to 19 Minutes | 203 (28.0%) | 51 (9.6%) |
| 20 to 24 Minutes | 99 (13.7%) | 192 (36.1%) |
| 25 to 29 Minutes | 0 (0.0%) | 11 (2.1%) |
| 30 to 34 Minutes | 174 (24.0%) | 92 (17.3%) |
| 35 to 39 Minutes | 59 (8.1%) | 50 (9.4%) |
| 40 to 44 Minutes | 69 (9.5%) | 0 (0.0%) |
| 45 to 59 Minutes | 0 (0.0%) | 23 (4.3%) |
| 60 to 89 Minutes | 0 (0.0%) | 0 (0.0%) |
| 90 or more Minutes | 30 (4.1%) | 44 (8.3%) |
Time of Departure to Work by Sex in Dewey Humboldt
The most frequent times of departure to work in Dewey Humboldt are 5:30 AM to 5:59 AM (132, 18.2%) for males and 12:00 PM to 3:59 PM (120, 22.6%) for females.
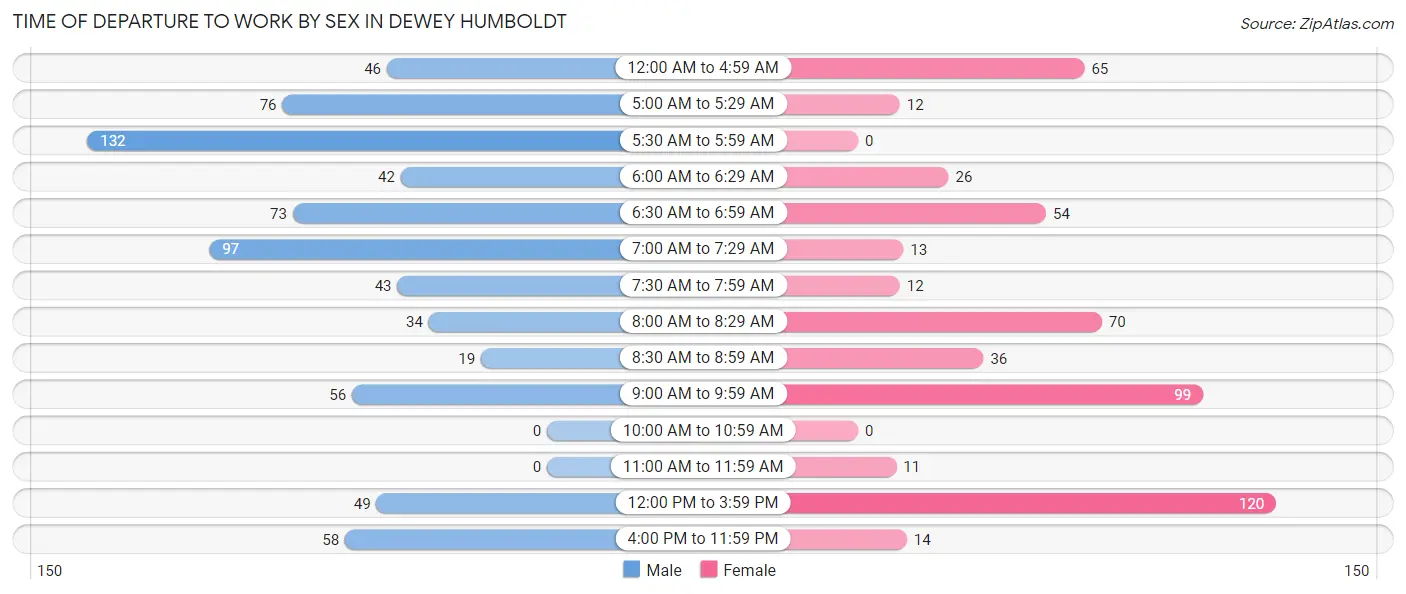
| Time of Departure | Male | Female |
| 12:00 AM to 4:59 AM | 46 (6.3%) | 65 (12.2%) |
| 5:00 AM to 5:29 AM | 76 (10.5%) | 12 (2.3%) |
| 5:30 AM to 5:59 AM | 132 (18.2%) | 0 (0.0%) |
| 6:00 AM to 6:29 AM | 42 (5.8%) | 26 (4.9%) |
| 6:30 AM to 6:59 AM | 73 (10.1%) | 54 (10.2%) |
| 7:00 AM to 7:29 AM | 97 (13.4%) | 13 (2.4%) |
| 7:30 AM to 7:59 AM | 43 (5.9%) | 12 (2.3%) |
| 8:00 AM to 8:29 AM | 34 (4.7%) | 70 (13.2%) |
| 8:30 AM to 8:59 AM | 19 (2.6%) | 36 (6.8%) |
| 9:00 AM to 9:59 AM | 56 (7.7%) | 99 (18.6%) |
| 10:00 AM to 10:59 AM | 0 (0.0%) | 0 (0.0%) |
| 11:00 AM to 11:59 AM | 0 (0.0%) | 11 (2.1%) |
| 12:00 PM to 3:59 PM | 49 (6.8%) | 120 (22.6%) |
| 4:00 PM to 11:59 PM | 58 (8.0%) | 14 (2.6%) |
| Total | 725 (100.0%) | 532 (100.0%) |
Housing Occupancy in Dewey Humboldt
Occupancy by Ownership in Dewey Humboldt
Of the total 1,786 dwellings in Dewey Humboldt, owner-occupied units account for 1,524 (85.3%), while renter-occupied units make up 262 (14.7%).
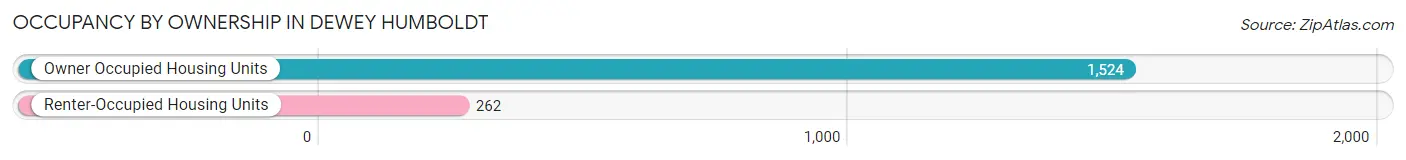
| Occupancy | # Housing Units | % Housing Units |
| Owner Occupied Housing Units | 1,524 | 85.3% |
| Renter-Occupied Housing Units | 262 | 14.7% |
| Total Occupied Housing Units | 1,786 | 100.0% |
Occupancy by Household Size in Dewey Humboldt
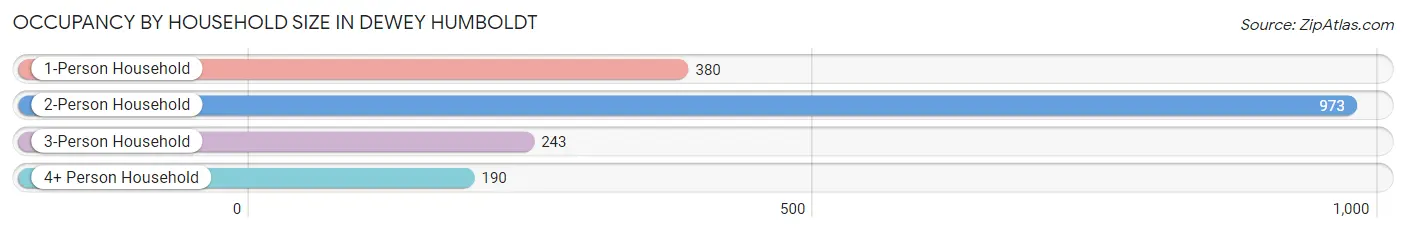
| Household Size | # Housing Units | % Housing Units |
| 1-Person Household | 380 | 21.3% |
| 2-Person Household | 973 | 54.5% |
| 3-Person Household | 243 | 13.6% |
| 4+ Person Household | 190 | 10.6% |
| Total Housing Units | 1,786 | 100.0% |
Occupancy by Ownership by Household Size in Dewey Humboldt
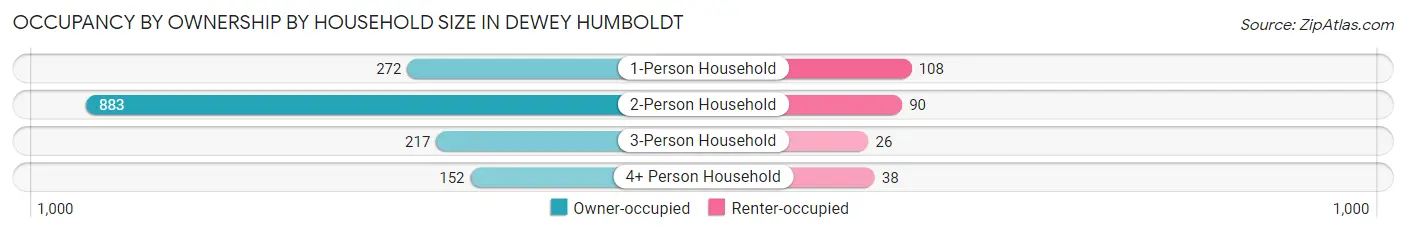
| Household Size | Owner-occupied | Renter-occupied |
| 1-Person Household | 272 (71.6%) | 108 (28.4%) |
| 2-Person Household | 883 (90.7%) | 90 (9.2%) |
| 3-Person Household | 217 (89.3%) | 26 (10.7%) |
| 4+ Person Household | 152 (80.0%) | 38 (20.0%) |
| Total Housing Units | 1,524 (85.3%) | 262 (14.7%) |
Occupancy by Educational Attainment in Dewey Humboldt
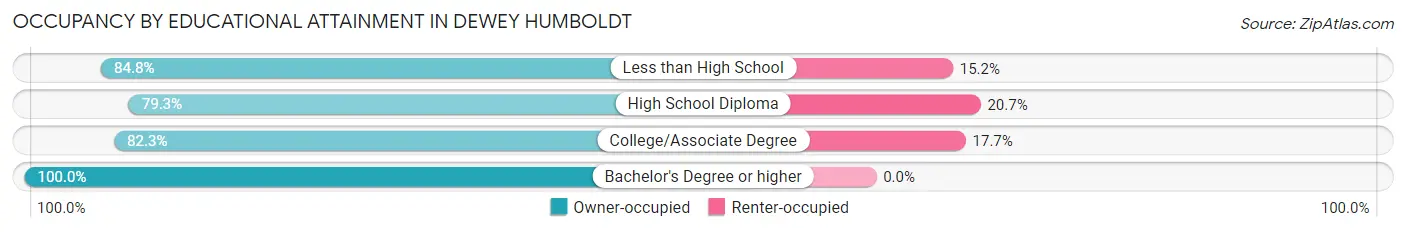
| Household Size | Owner-occupied | Renter-occupied |
| Less than High School | 201 (84.8%) | 36 (15.2%) |
| High School Diploma | 376 (79.3%) | 98 (20.7%) |
| College/Associate Degree | 594 (82.3%) | 128 (17.7%) |
| Bachelor's Degree or higher | 353 (100.0%) | 0 (0.0%) |
Occupancy by Age of Householder in Dewey Humboldt
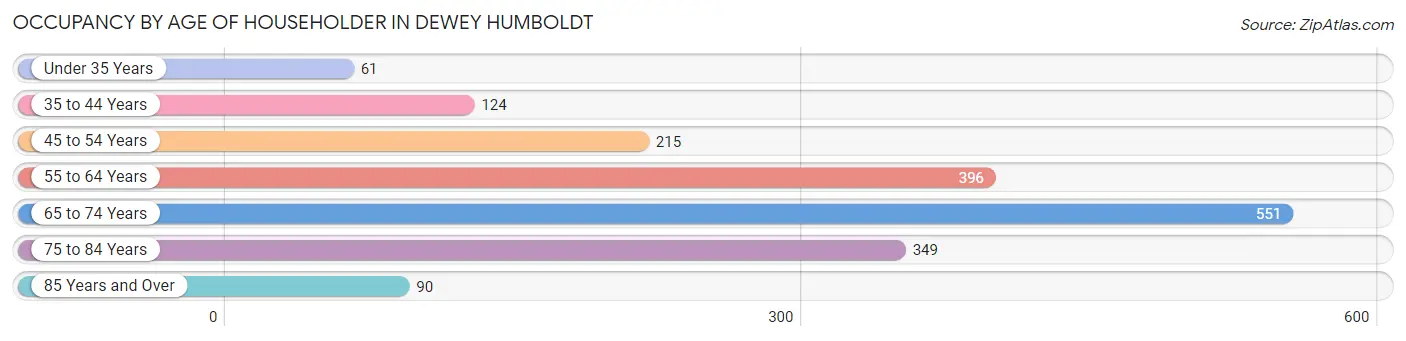
| Age Bracket | # Households | % Households |
| Under 35 Years | 61 | 3.4% |
| 35 to 44 Years | 124 | 6.9% |
| 45 to 54 Years | 215 | 12.0% |
| 55 to 64 Years | 396 | 22.2% |
| 65 to 74 Years | 551 | 30.8% |
| 75 to 84 Years | 349 | 19.5% |
| 85 Years and Over | 90 | 5.0% |
| Total | 1,786 | 100.0% |
Housing Finances in Dewey Humboldt
Median Income by Occupancy in Dewey Humboldt
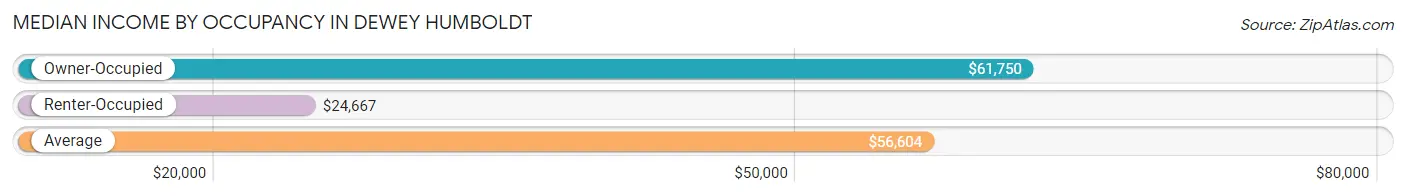
| Occupancy Type | # Households | Median Income |
| Owner-Occupied | 1,524 (85.3%) | $61,750 |
| Renter-Occupied | 262 (14.7%) | $24,667 |
| Average | 1,786 (100.0%) | $56,604 |
Occupancy by Householder Income Bracket in Dewey Humboldt
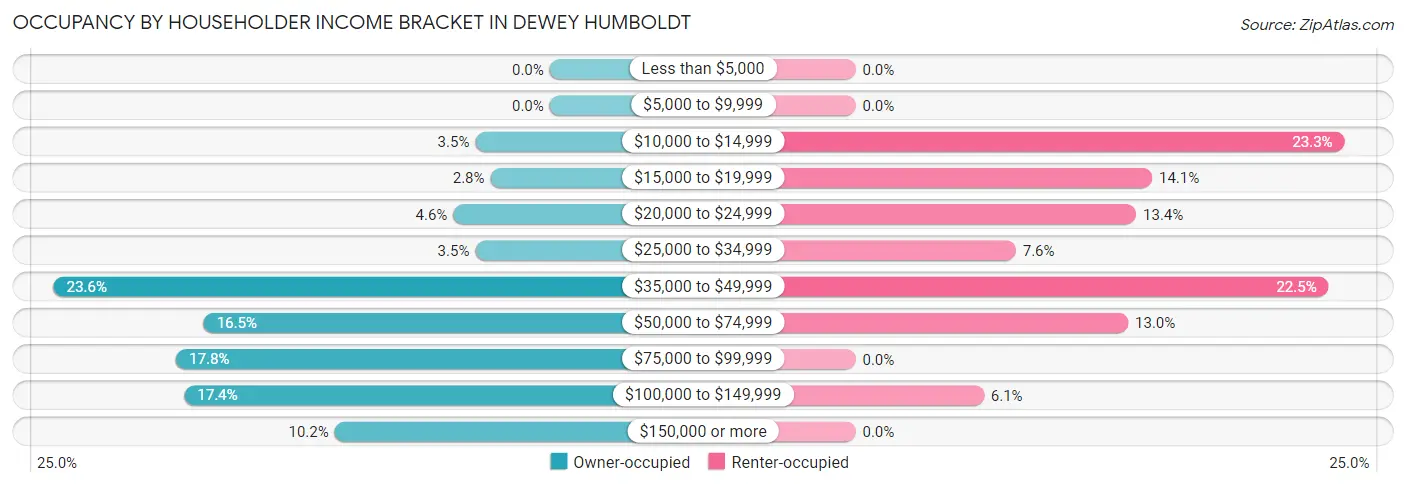
| Income Bracket | Owner-occupied | Renter-occupied |
| Less than $5,000 | 0 (0.0%) | 0 (0.0%) |
| $5,000 to $9,999 | 0 (0.0%) | 0 (0.0%) |
| $10,000 to $14,999 | 54 (3.5%) | 61 (23.3%) |
| $15,000 to $19,999 | 43 (2.8%) | 37 (14.1%) |
| $20,000 to $24,999 | 70 (4.6%) | 35 (13.4%) |
| $25,000 to $34,999 | 54 (3.5%) | 20 (7.6%) |
| $35,000 to $49,999 | 360 (23.6%) | 59 (22.5%) |
| $50,000 to $74,999 | 251 (16.5%) | 34 (13.0%) |
| $75,000 to $99,999 | 271 (17.8%) | 0 (0.0%) |
| $100,000 to $149,999 | 265 (17.4%) | 16 (6.1%) |
| $150,000 or more | 156 (10.2%) | 0 (0.0%) |
| Total | 1,524 (100.0%) | 262 (100.0%) |
Monthly Housing Cost Tiers in Dewey Humboldt
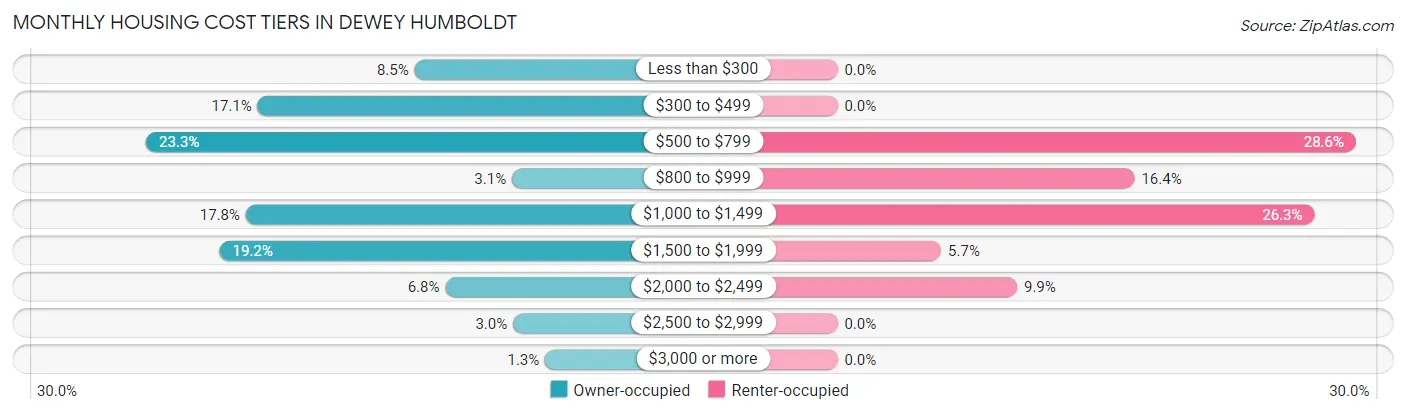
| Monthly Cost | Owner-occupied | Renter-occupied |
| Less than $300 | 129 (8.5%) | 0 (0.0%) |
| $300 to $499 | 261 (17.1%) | 0 (0.0%) |
| $500 to $799 | 355 (23.3%) | 75 (28.6%) |
| $800 to $999 | 47 (3.1%) | 43 (16.4%) |
| $1,000 to $1,499 | 271 (17.8%) | 69 (26.3%) |
| $1,500 to $1,999 | 293 (19.2%) | 15 (5.7%) |
| $2,000 to $2,499 | 103 (6.8%) | 26 (9.9%) |
| $2,500 to $2,999 | 46 (3.0%) | 0 (0.0%) |
| $3,000 or more | 19 (1.3%) | 0 (0.0%) |
| Total | 1,524 (100.0%) | 262 (100.0%) |
Physical Housing Characteristics in Dewey Humboldt
Housing Structures in Dewey Humboldt
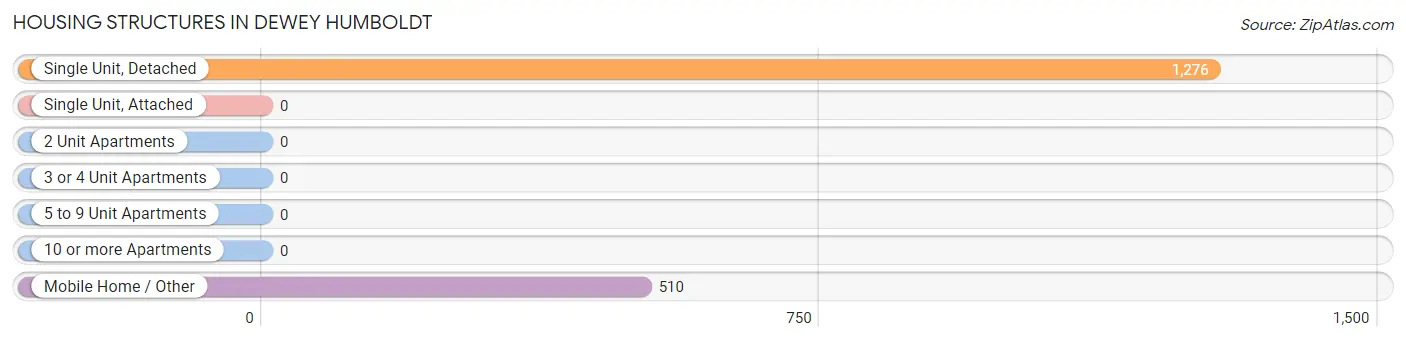
| Structure Type | # Housing Units | % Housing Units |
| Single Unit, Detached | 1,276 | 71.4% |
| Single Unit, Attached | 0 | 0.0% |
| 2 Unit Apartments | 0 | 0.0% |
| 3 or 4 Unit Apartments | 0 | 0.0% |
| 5 to 9 Unit Apartments | 0 | 0.0% |
| 10 or more Apartments | 0 | 0.0% |
| Mobile Home / Other | 510 | 28.6% |
| Total | 1,786 | 100.0% |
Housing Structures by Occupancy in Dewey Humboldt
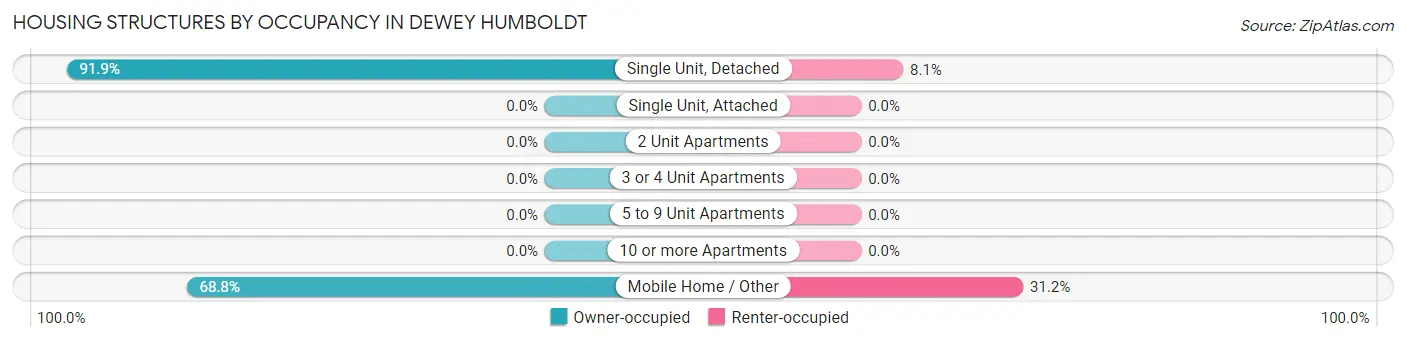
| Structure Type | Owner-occupied | Renter-occupied |
| Single Unit, Detached | 1,173 (91.9%) | 103 (8.1%) |
| Single Unit, Attached | 0 (0.0%) | 0 (0.0%) |
| 2 Unit Apartments | 0 (0.0%) | 0 (0.0%) |
| 3 or 4 Unit Apartments | 0 (0.0%) | 0 (0.0%) |
| 5 to 9 Unit Apartments | 0 (0.0%) | 0 (0.0%) |
| 10 or more Apartments | 0 (0.0%) | 0 (0.0%) |
| Mobile Home / Other | 351 (68.8%) | 159 (31.2%) |
| Total | 1,524 (85.3%) | 262 (14.7%) |
Housing Structures by Number of Rooms in Dewey Humboldt
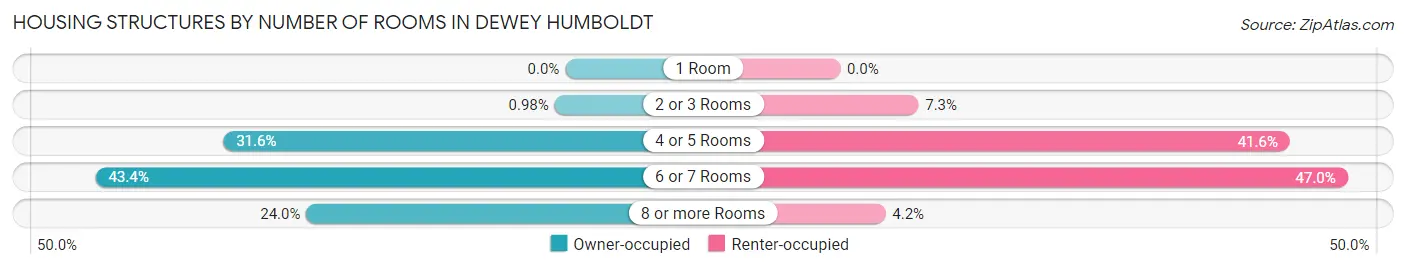
| Number of Rooms | Owner-occupied | Renter-occupied |
| 1 Room | 0 (0.0%) | 0 (0.0%) |
| 2 or 3 Rooms | 15 (1.0%) | 19 (7.2%) |
| 4 or 5 Rooms | 482 (31.6%) | 109 (41.6%) |
| 6 or 7 Rooms | 662 (43.4%) | 123 (46.9%) |
| 8 or more Rooms | 365 (23.9%) | 11 (4.2%) |
| Total | 1,524 (100.0%) | 262 (100.0%) |
Housing Structure by Heating Type in Dewey Humboldt
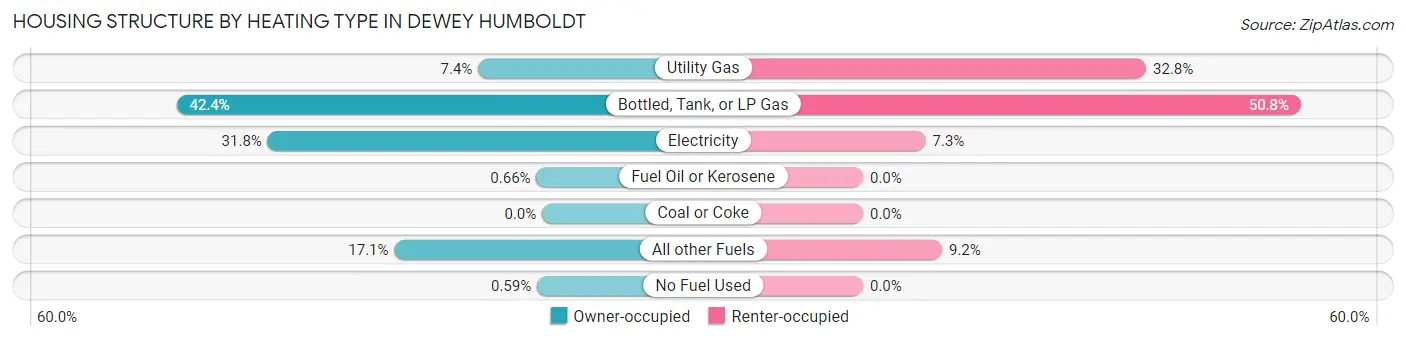
| Heating Type | Owner-occupied | Renter-occupied |
| Utility Gas | 113 (7.4%) | 86 (32.8%) |
| Bottled, Tank, or LP Gas | 646 (42.4%) | 133 (50.8%) |
| Electricity | 485 (31.8%) | 19 (7.2%) |
| Fuel Oil or Kerosene | 10 (0.7%) | 0 (0.0%) |
| Coal or Coke | 0 (0.0%) | 0 (0.0%) |
| All other Fuels | 261 (17.1%) | 24 (9.2%) |
| No Fuel Used | 9 (0.6%) | 0 (0.0%) |
| Total | 1,524 (100.0%) | 262 (100.0%) |
Household Vehicle Usage in Dewey Humboldt
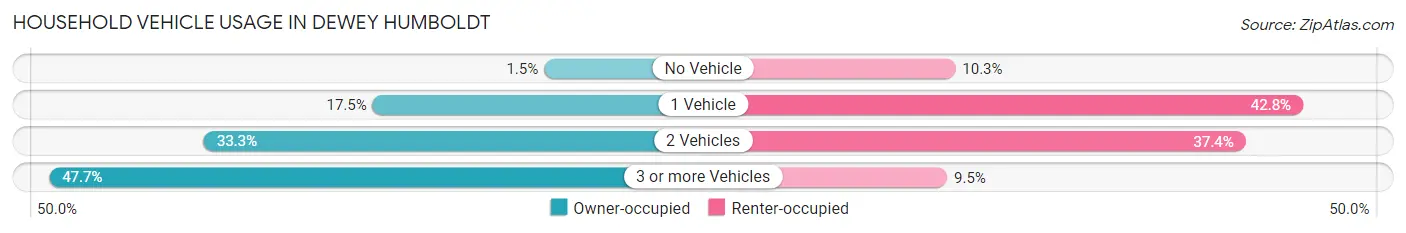
| Vehicles per Household | Owner-occupied | Renter-occupied |
| No Vehicle | 23 (1.5%) | 27 (10.3%) |
| 1 Vehicle | 267 (17.5%) | 112 (42.7%) |
| 2 Vehicles | 507 (33.3%) | 98 (37.4%) |
| 3 or more Vehicles | 727 (47.7%) | 25 (9.5%) |
| Total | 1,524 (100.0%) | 262 (100.0%) |
Real Estate & Mortgages in Dewey Humboldt
Real Estate and Mortgage Overview in Dewey Humboldt
| Characteristic | Without Mortgage | With Mortgage |
| Housing Units | 745 | 779 |
| Median Property Value | $262,500 | $375,000 |
| Median Household Income | $50,956 | $116 |
| Monthly Housing Costs | $500 | $19 |
| Real Estate Taxes | $1,780 | $68 |
Property Value by Mortgage Status in Dewey Humboldt
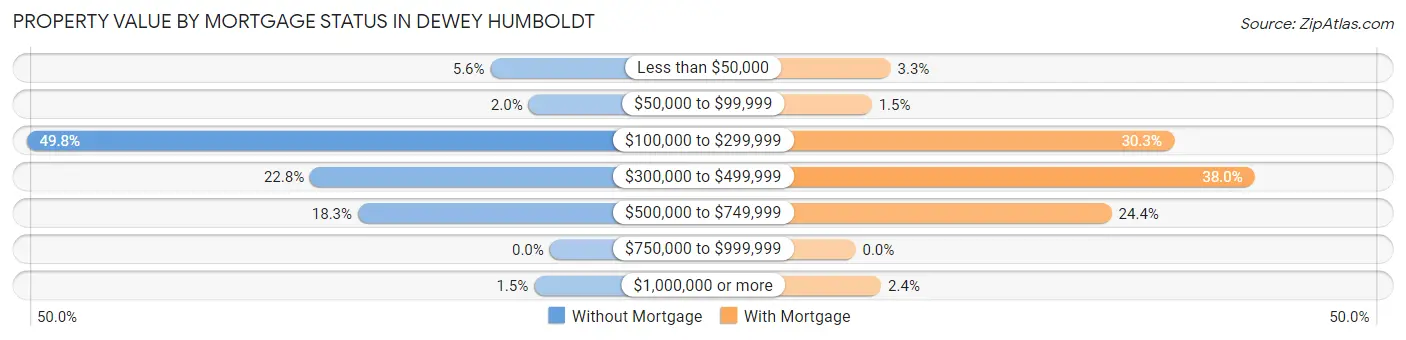
| Property Value | Without Mortgage | With Mortgage |
| Less than $50,000 | 42 (5.6%) | 26 (3.3%) |
| $50,000 to $99,999 | 15 (2.0%) | 12 (1.5%) |
| $100,000 to $299,999 | 371 (49.8%) | 236 (30.3%) |
| $300,000 to $499,999 | 170 (22.8%) | 296 (38.0%) |
| $500,000 to $749,999 | 136 (18.3%) | 190 (24.4%) |
| $750,000 to $999,999 | 0 (0.0%) | 0 (0.0%) |
| $1,000,000 or more | 11 (1.5%) | 19 (2.4%) |
| Total | 745 (100.0%) | 779 (100.0%) |
Household Income by Mortgage Status in Dewey Humboldt
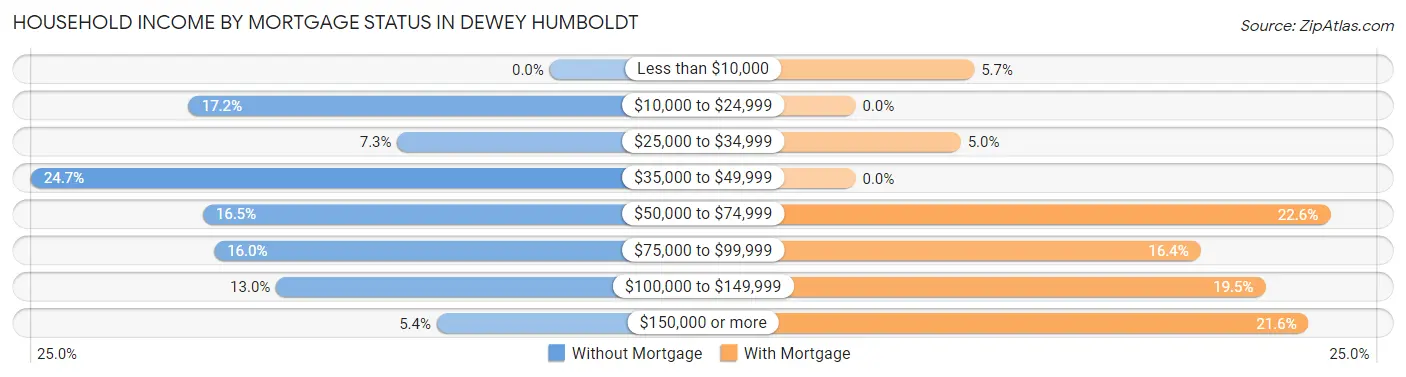
| Household Income | Without Mortgage | With Mortgage |
| Less than $10,000 | 0 (0.0%) | 44 (5.7%) |
| $10,000 to $24,999 | 128 (17.2%) | 0 (0.0%) |
| $25,000 to $34,999 | 54 (7.2%) | 39 (5.0%) |
| $35,000 to $49,999 | 184 (24.7%) | 0 (0.0%) |
| $50,000 to $74,999 | 123 (16.5%) | 176 (22.6%) |
| $75,000 to $99,999 | 119 (16.0%) | 128 (16.4%) |
| $100,000 to $149,999 | 97 (13.0%) | 152 (19.5%) |
| $150,000 or more | 40 (5.4%) | 168 (21.6%) |
| Total | 745 (100.0%) | 779 (100.0%) |
Property Value to Household Income Ratio in Dewey Humboldt
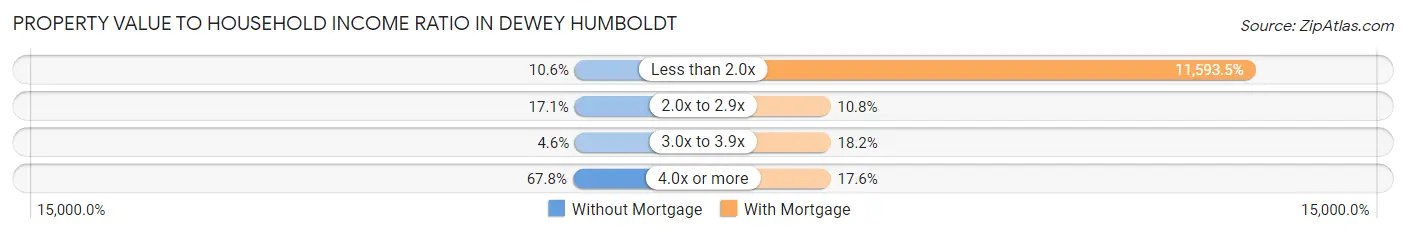
| Value-to-Income Ratio | Without Mortgage | With Mortgage |
| Less than 2.0x | 79 (10.6%) | 90,313 (11,593.4%) |
| 2.0x to 2.9x | 127 (17.1%) | 84 (10.8%) |
| 3.0x to 3.9x | 34 (4.6%) | 142 (18.2%) |
| 4.0x or more | 505 (67.8%) | 137 (17.6%) |
| Total | 745 (100.0%) | 779 (100.0%) |
Real Estate Taxes by Mortgage Status in Dewey Humboldt
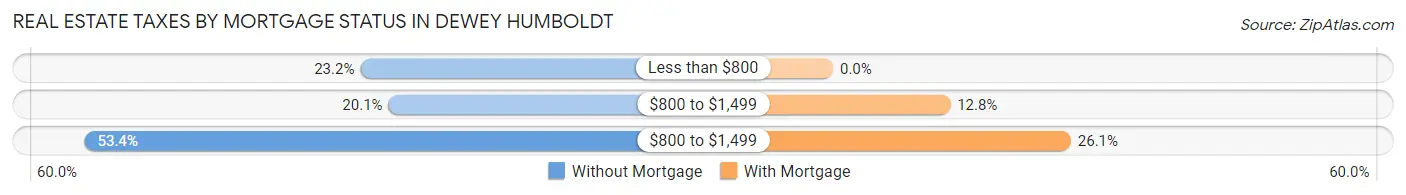
| Property Taxes | Without Mortgage | With Mortgage |
| Less than $800 | 173 (23.2%) | 0 (0.0%) |
| $800 to $1,499 | 150 (20.1%) | 100 (12.8%) |
| $800 to $1,499 | 398 (53.4%) | 203 (26.1%) |
| Total | 745 (100.0%) | 779 (100.0%) |
Health & Disability in Dewey Humboldt
Health Insurance Coverage by Age in Dewey Humboldt
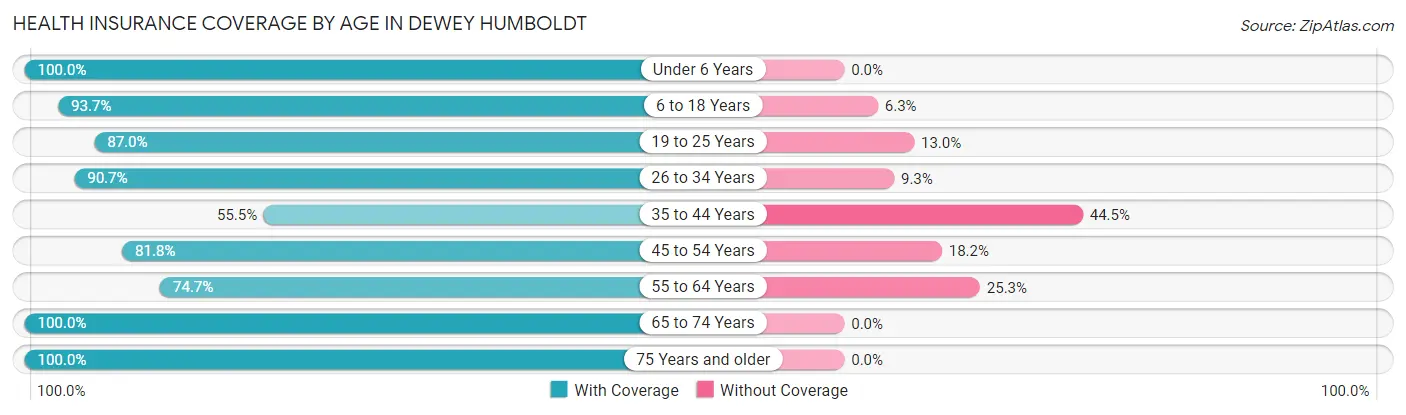
| Age Bracket | With Coverage | Without Coverage |
| Under 6 Years | 149 (100.0%) | 0 (0.0%) |
| 6 to 18 Years | 584 (93.7%) | 39 (6.3%) |
| 19 to 25 Years | 87 (87.0%) | 13 (13.0%) |
| 26 to 34 Years | 225 (90.7%) | 23 (9.3%) |
| 35 to 44 Years | 211 (55.5%) | 169 (44.5%) |
| 45 to 54 Years | 288 (81.8%) | 64 (18.2%) |
| 55 to 64 Years | 526 (74.7%) | 178 (25.3%) |
| 65 to 74 Years | 1,081 (100.0%) | 0 (0.0%) |
| 75 Years and older | 723 (100.0%) | 0 (0.0%) |
| Total | 3,874 (88.8%) | 486 (11.2%) |
Health Insurance Coverage by Citizenship Status in Dewey Humboldt
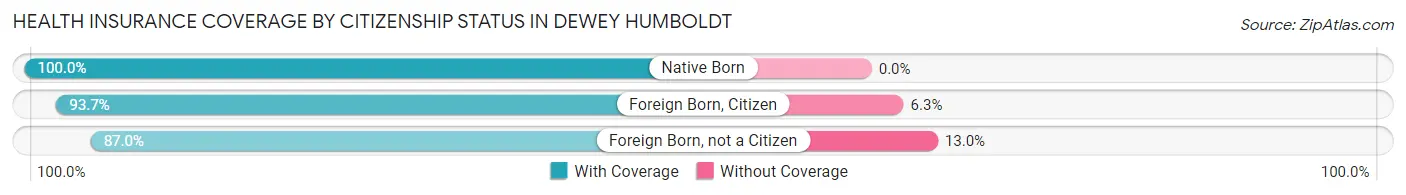
| Citizenship Status | With Coverage | Without Coverage |
| Native Born | 149 (100.0%) | 0 (0.0%) |
| Foreign Born, Citizen | 584 (93.7%) | 39 (6.3%) |
| Foreign Born, not a Citizen | 87 (87.0%) | 13 (13.0%) |
Health Insurance Coverage by Household Income in Dewey Humboldt
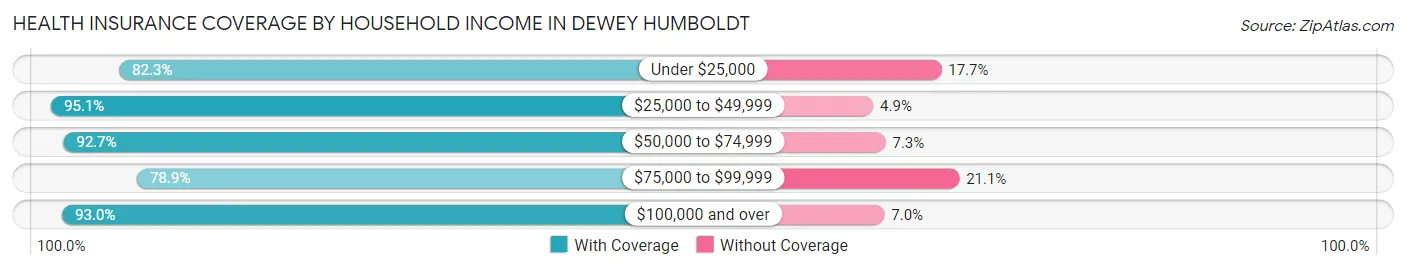
| Household Income | With Coverage | Without Coverage |
| Under $25,000 | 400 (82.3%) | 86 (17.7%) |
| $25,000 to $49,999 | 942 (95.1%) | 49 (4.9%) |
| $50,000 to $74,999 | 651 (92.7%) | 51 (7.3%) |
| $75,000 to $99,999 | 832 (78.9%) | 222 (21.1%) |
| $100,000 and over | 1,032 (93.0%) | 78 (7.0%) |
Public vs Private Health Insurance Coverage by Age in Dewey Humboldt
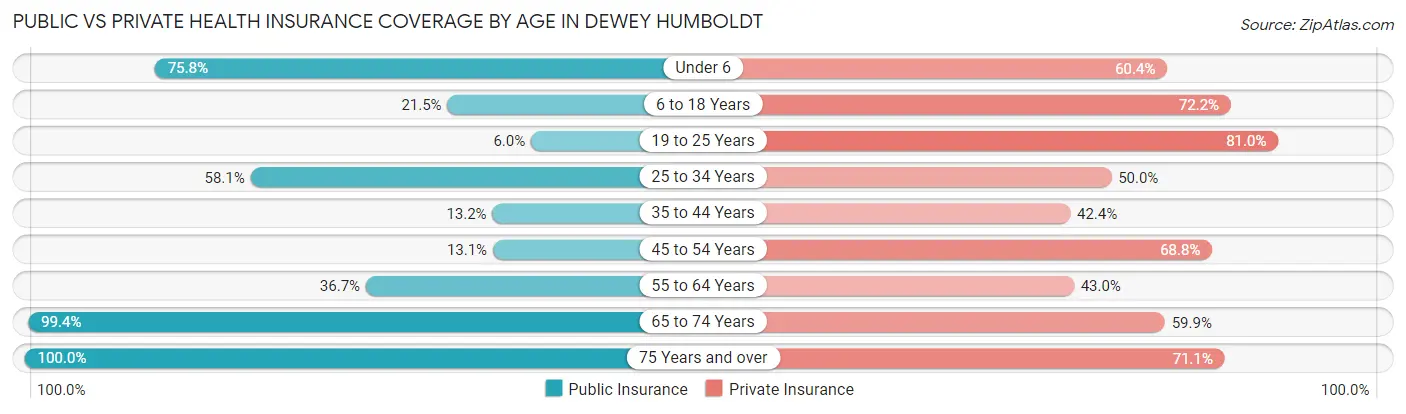
| Age Bracket | Public Insurance | Private Insurance |
| Under 6 | 113 (75.8%) | 90 (60.4%) |
| 6 to 18 Years | 134 (21.5%) | 450 (72.2%) |
| 19 to 25 Years | 6 (6.0%) | 81 (81.0%) |
| 25 to 34 Years | 144 (58.1%) | 124 (50.0%) |
| 35 to 44 Years | 50 (13.2%) | 161 (42.4%) |
| 45 to 54 Years | 46 (13.1%) | 242 (68.8%) |
| 55 to 64 Years | 258 (36.6%) | 303 (43.0%) |
| 65 to 74 Years | 1,074 (99.4%) | 648 (59.9%) |
| 75 Years and over | 723 (100.0%) | 514 (71.1%) |
| Total | 2,548 (58.4%) | 2,613 (59.9%) |
Disability Status by Sex by Age in Dewey Humboldt
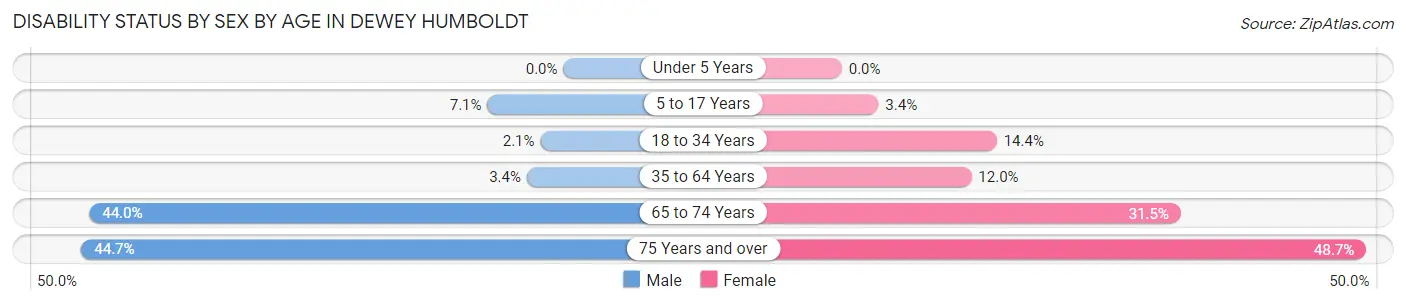
| Age Bracket | Male | Female |
| Under 5 Years | 0 (0.0%) | 0 (0.0%) |
| 5 to 17 Years | 17 (7.0%) | 13 (3.4%) |
| 18 to 34 Years | 4 (2.1%) | 23 (14.4%) |
| 35 to 64 Years | 25 (3.4%) | 84 (12.0%) |
| 65 to 74 Years | 256 (44.0%) | 157 (31.5%) |
| 75 Years and over | 157 (44.7%) | 181 (48.7%) |
Disability Class by Sex by Age in Dewey Humboldt
Disability Class: Hearing Difficulty
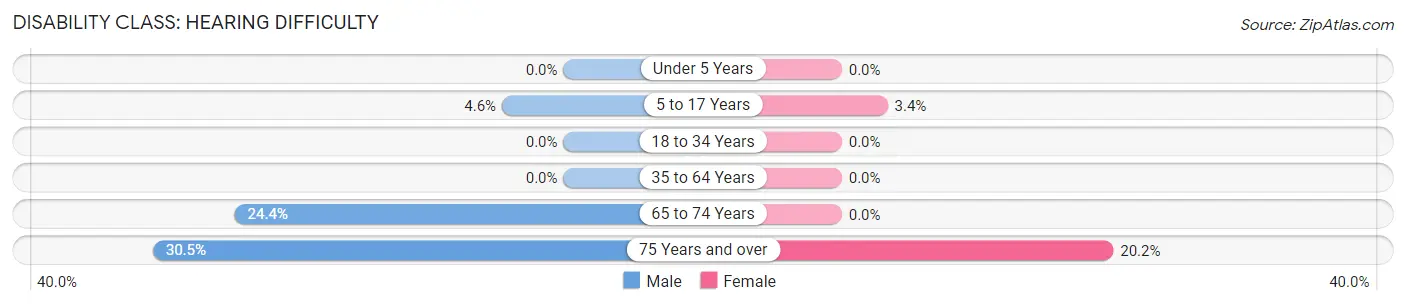
| Age Bracket | Male | Female |
| Under 5 Years | 0 (0.0%) | 0 (0.0%) |
| 5 to 17 Years | 11 (4.6%) | 13 (3.4%) |
| 18 to 34 Years | 0 (0.0%) | 0 (0.0%) |
| 35 to 64 Years | 0 (0.0%) | 0 (0.0%) |
| 65 to 74 Years | 142 (24.4%) | 0 (0.0%) |
| 75 Years and over | 107 (30.5%) | 75 (20.2%) |
Disability Class: Vision Difficulty
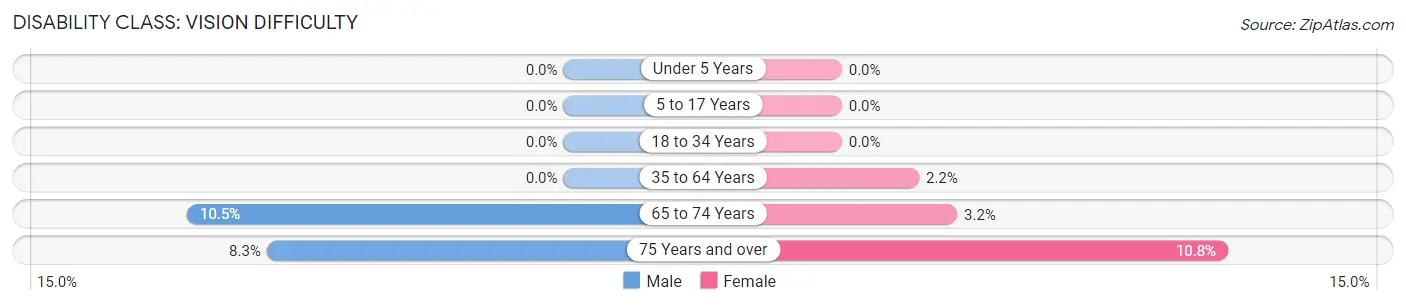
| Age Bracket | Male | Female |
| Under 5 Years | 0 (0.0%) | 0 (0.0%) |
| 5 to 17 Years | 0 (0.0%) | 0 (0.0%) |
| 18 to 34 Years | 0 (0.0%) | 0 (0.0%) |
| 35 to 64 Years | 0 (0.0%) | 15 (2.1%) |
| 65 to 74 Years | 61 (10.5%) | 16 (3.2%) |
| 75 Years and over | 29 (8.3%) | 40 (10.7%) |
Disability Class: Cognitive Difficulty
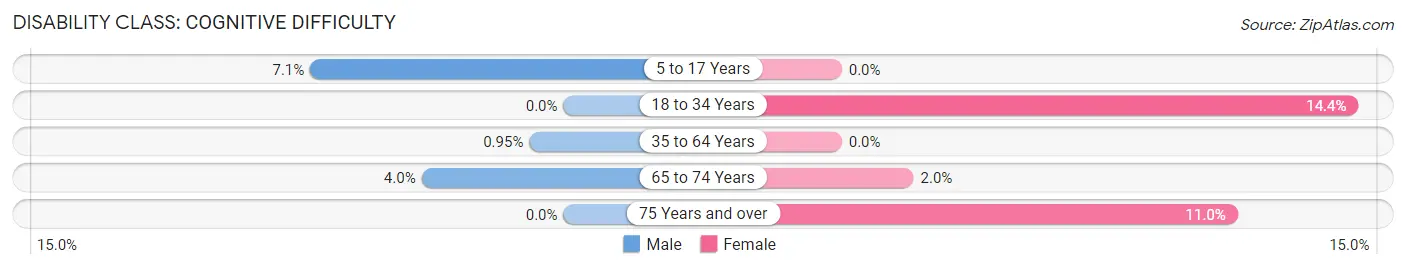
| Age Bracket | Male | Female |
| 5 to 17 Years | 17 (7.0%) | 0 (0.0%) |
| 18 to 34 Years | 0 (0.0%) | 23 (14.4%) |
| 35 to 64 Years | 7 (0.9%) | 0 (0.0%) |
| 65 to 74 Years | 23 (4.0%) | 10 (2.0%) |
| 75 Years and over | 0 (0.0%) | 41 (11.0%) |
Disability Class: Ambulatory Difficulty
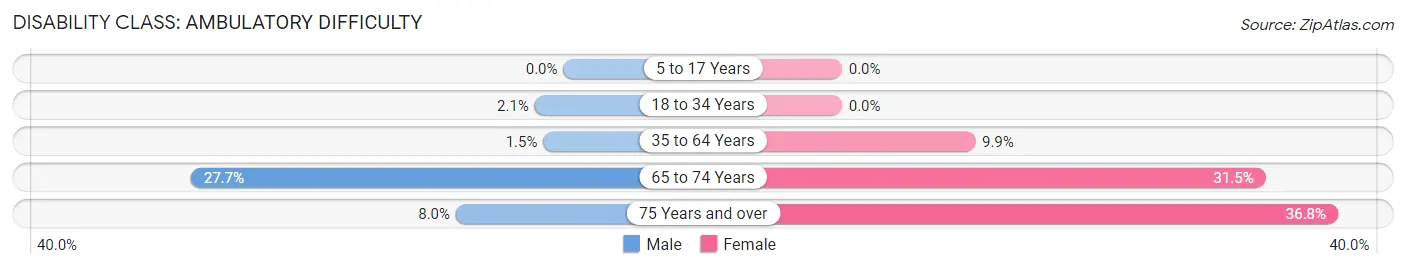
| Age Bracket | Male | Female |
| 5 to 17 Years | 0 (0.0%) | 0 (0.0%) |
| 18 to 34 Years | 4 (2.1%) | 0 (0.0%) |
| 35 to 64 Years | 11 (1.5%) | 69 (9.9%) |
| 65 to 74 Years | 161 (27.7%) | 157 (31.5%) |
| 75 Years and over | 28 (8.0%) | 137 (36.8%) |
Disability Class: Self-Care Difficulty
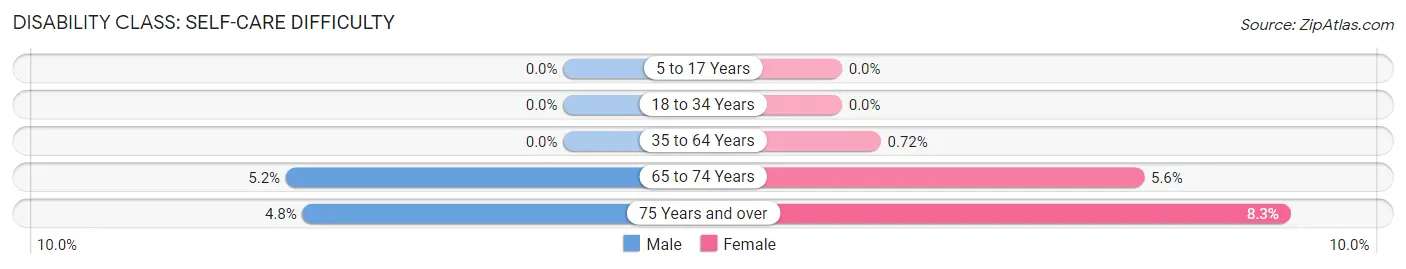
| Age Bracket | Male | Female |
| 5 to 17 Years | 0 (0.0%) | 0 (0.0%) |
| 18 to 34 Years | 0 (0.0%) | 0 (0.0%) |
| 35 to 64 Years | 0 (0.0%) | 5 (0.7%) |
| 65 to 74 Years | 30 (5.1%) | 28 (5.6%) |
| 75 Years and over | 17 (4.8%) | 31 (8.3%) |
Technology Access in Dewey Humboldt
Computing Device Access in Dewey Humboldt
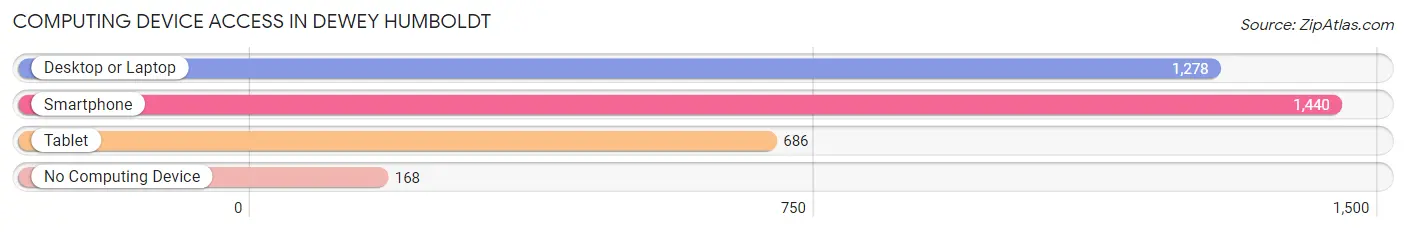
| Device Type | # Households | % Households |
| Desktop or Laptop | 1,278 | 71.6% |
| Smartphone | 1,440 | 80.6% |
| Tablet | 686 | 38.4% |
| No Computing Device | 168 | 9.4% |
| Total | 1,786 | 100.0% |
Internet Access in Dewey Humboldt
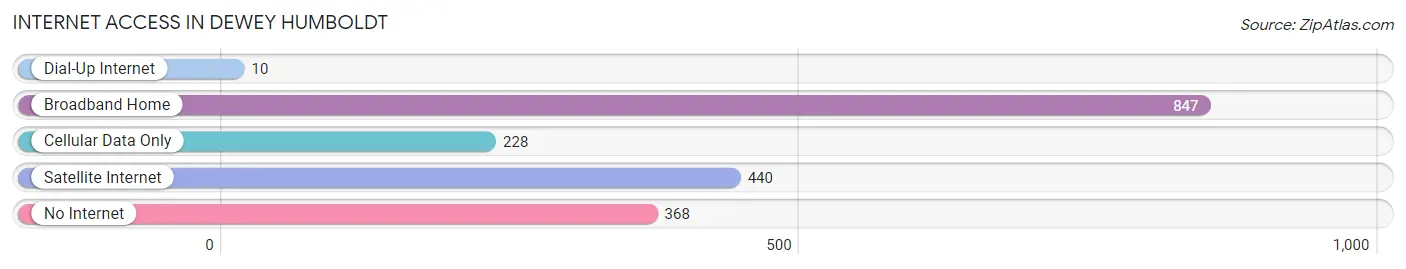
| Internet Type | # Households | % Households |
| Dial-Up Internet | 10 | 0.6% |
| Broadband Home | 847 | 47.4% |
| Cellular Data Only | 228 | 12.8% |
| Satellite Internet | 440 | 24.6% |
| No Internet | 368 | 20.6% |
| Total | 1,786 | 100.0% |
Dewey Humboldt Summary
Dewey-Humboldt is a town located in Yavapai County, Arizona. It is situated in the Bradshaw Mountains, approximately 20 miles north of Prescott. The town was founded in 1883 and was named after Admiral George Dewey and Baron Alexander von Humboldt. As of the 2010 census, the population of Dewey-Humboldt was 3,535.
History
The area that is now Dewey-Humboldt was originally inhabited by the Yavapai people. The first settlers arrived in the area in the late 1870s. The town was founded in 1883 and was named after Admiral George Dewey and Baron Alexander von Humboldt. The town was originally known as Dewey, but the name was changed to Dewey-Humboldt in 1895.
The town was a mining center in the late 19th and early 20th centuries. The area was home to several copper, gold, and silver mines. The town also had a large lumber industry. The town was also home to a large ranching industry.
In the early 20th century, the town was home to several schools, churches, and businesses. The town also had a post office, a bank, and a newspaper.
Geography
Dewey-Humboldt is located in Yavapai County, Arizona. It is situated in the Bradshaw Mountains, approximately 20 miles north of Prescott. The town is located at an elevation of 4,890 feet.
The town is located in a semi-arid climate. The average annual temperature is 64°F. The average annual precipitation is 13.5 inches.
Economy
The economy of Dewey-Humboldt is largely based on agriculture and tourism. The town is home to several farms and ranches. The town is also home to several tourist attractions, including the Bradshaw Mountains, the Prescott National Forest, and the Yavapai County Fairgrounds.
The town is also home to several businesses, including restaurants, retail stores, and service providers.
Demographics
As of the 2010 census, the population of Dewey-Humboldt was 3,535. The racial makeup of the town was 94.3% White, 0.7% Native American, 0.3% Asian, 0.2% African American, 0.1% Pacific Islander, and 4.4% from other races. Hispanic or Latino of any race were 8.2% of the population.
The median household income in Dewey-Humboldt was $41,944. The per capita income was $20,945. About 11.3% of the population was below the poverty line.
Common Questions
What is the Total Population of Dewey Humboldt?
Total Population of Dewey Humboldt is 4,363.
What is the Total Male Population of Dewey Humboldt?
Total Male Population of Dewey Humboldt is 2,252.
What is the Total Female Population of Dewey Humboldt?
Total Female Population of Dewey Humboldt is 2,111.
What is the Ratio of Males per 100 Females in Dewey Humboldt?
There are 106.68 Males per 100 Females in Dewey Humboldt.
What is the Ratio of Females per 100 Males in Dewey Humboldt?
There are 93.74 Females per 100 Males in Dewey Humboldt.
What is the Median Population Age in Dewey Humboldt?
Median Population Age in Dewey Humboldt is 60.0 Years.
What is the Average Family Size in Dewey Humboldt
Average Family Size in Dewey Humboldt is 2.8 People.
What is the Average Household Size in Dewey Humboldt
Average Household Size in Dewey Humboldt is 2.4 People.
What is Per Capita Income in Dewey Humboldt?
Per Capita income in Dewey Humboldt is $31,676.
What is the Median Family Income in Dewey Humboldt?
Median Family Income in Dewey Humboldt is $63,105.
What is the Median Household income in Dewey Humboldt?
Median Household Income in Dewey Humboldt is $56,604.
What is Income or Wage Gap in Dewey Humboldt?
Income or Wage Gap in Dewey Humboldt is 21.8%.
Women in Dewey Humboldt earn 78.2 cents for every dollar earned by a man.
What is Inequality or Gini Index in Dewey Humboldt?
Inequality or Gini Index in Dewey Humboldt is 0.41.
How Large is the Labor Force in Dewey Humboldt?
There are 1,390 People in the Labor Forcein in Dewey Humboldt.
What is the Percentage of People in the Labor Force in Dewey Humboldt?
37.6% of People are in the Labor Force in Dewey Humboldt.
What is the Unemployment Rate in Dewey Humboldt?
Unemployment Rate in Dewey Humboldt is 8.1%.