Walnut Creek, AZ
Walnut Creek Map
Walnut Creek Overview
642
TOTAL POPULATION
297
MALE POPULATION
345
FEMALE POPULATION
86.09
MALES / 100 FEMALES
116.16
FEMALES / 100 MALES
53.4
MEDIAN AGE
2.4
AVG FAMILY SIZE
2.0
AVG HOUSEHOLD SIZE
$26,977
PER CAPITA INCOME
$42,946
AVG HOUSEHOLD INCOME
21.6%
WAGE / INCOME GAP [ % ]
78.4¢/ $1
WAGE / INCOME GAP [ $ ]
0.37
INEQUALITY / GINI INDEX
255
LABOR FORCE [ PEOPLE ]
45.1%
PERCENT IN LABOR FORCE
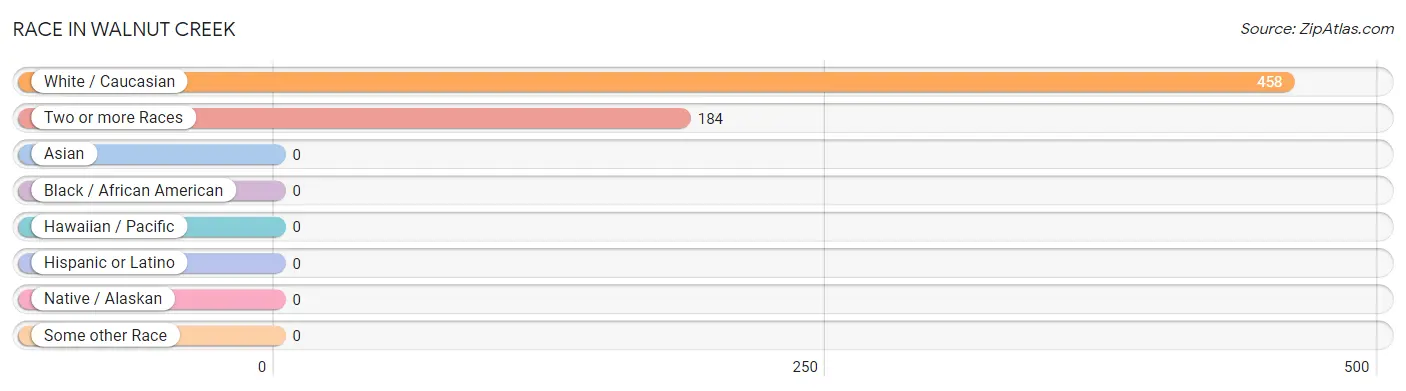
Race in Walnut Creek
The most populous races in Walnut Creek are White / Caucasian (458 | 71.3%), and Two or more Races (184 | 28.7%).
| Race | # Population | % Population |
| Asian | 0 | 0.0% |
| Black / African American | 0 | 0.0% |
| Hawaiian / Pacific | 0 | 0.0% |
| Hispanic or Latino | 0 | 0.0% |
| Native / Alaskan | 0 | 0.0% |
| White / Caucasian | 458 | 71.3% |
| Two or more Races | 184 | 28.7% |
| Some other Race | 0 | 0.0% |
| Total | 642 | 100.0% |
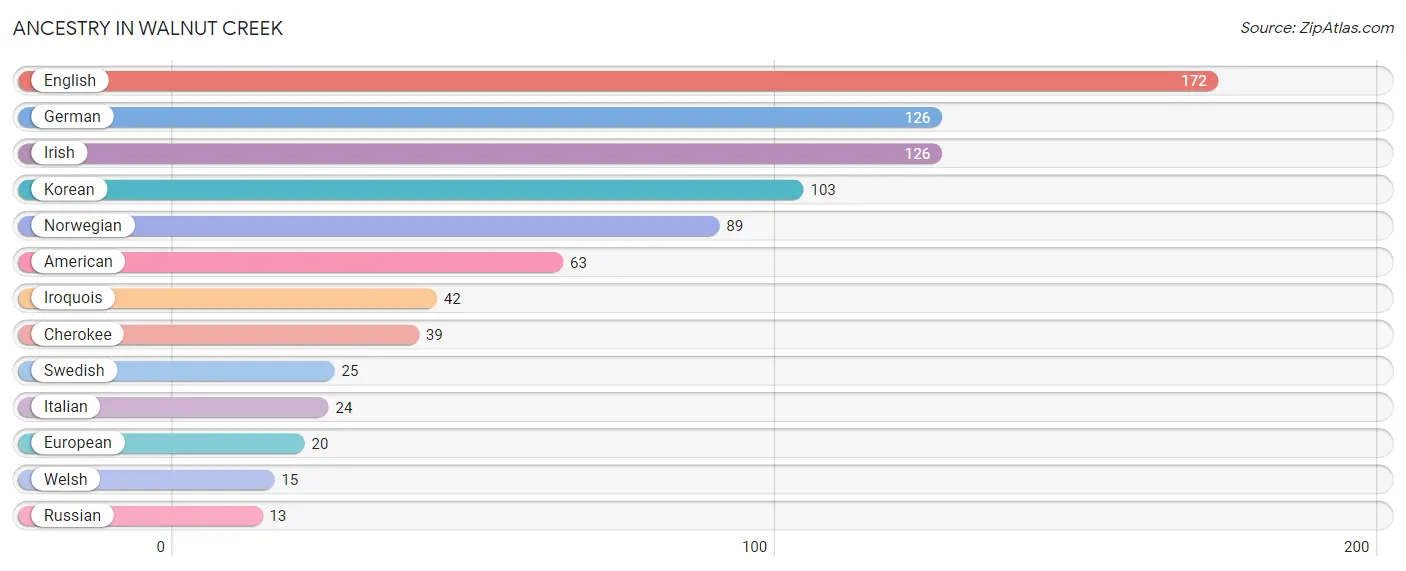
Ancestry in Walnut Creek
The most populous ancestries reported in Walnut Creek are English (172 | 26.8%), German (126 | 19.6%), Irish (126 | 19.6%), Korean (103 | 16.0%), and Norwegian (89 | 13.9%), together accounting for 96.0% of all Walnut Creek residents.
| Ancestry | # Population | % Population |
| American | 63 | 9.8% |
| Cherokee | 39 | 6.1% |
| English | 172 | 26.8% |
| European | 20 | 3.1% |
| German | 126 | 19.6% |
| Irish | 126 | 19.6% |
| Iroquois | 42 | 6.5% |
| Italian | 24 | 3.7% |
| Korean | 103 | 16.0% |
| Norwegian | 89 | 13.9% |
| Russian | 13 | 2.0% |
| Swedish | 25 | 3.9% |
| Welsh | 15 | 2.3% | View All 13 Rows |
Immigrants in Walnut Creek

| Immigration Origin | # Population | % Population | View All 0 Rows |
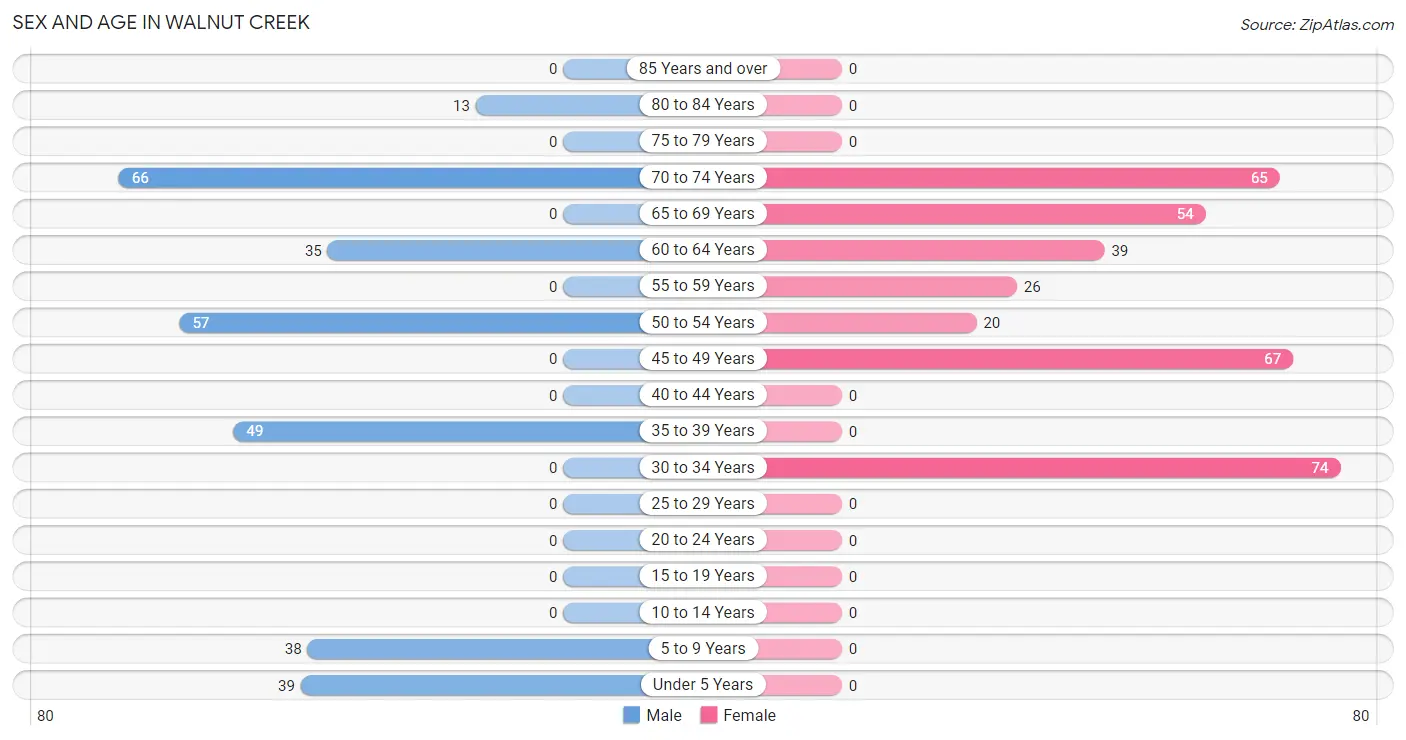
Sex and Age in Walnut Creek
Sex and Age in Walnut Creek
The most populous age groups in Walnut Creek are 70 to 74 Years (66 | 22.2%) for men and 30 to 34 Years (74 | 21.4%) for women.
| Age Bracket | Male | Female |
| Under 5 Years | 39 (13.1%) | 0 (0.0%) |
| 5 to 9 Years | 38 (12.8%) | 0 (0.0%) |
| 10 to 14 Years | 0 (0.0%) | 0 (0.0%) |
| 15 to 19 Years | 0 (0.0%) | 0 (0.0%) |
| 20 to 24 Years | 0 (0.0%) | 0 (0.0%) |
| 25 to 29 Years | 0 (0.0%) | 0 (0.0%) |
| 30 to 34 Years | 0 (0.0%) | 74 (21.4%) |
| 35 to 39 Years | 49 (16.5%) | 0 (0.0%) |
| 40 to 44 Years | 0 (0.0%) | 0 (0.0%) |
| 45 to 49 Years | 0 (0.0%) | 67 (19.4%) |
| 50 to 54 Years | 57 (19.2%) | 20 (5.8%) |
| 55 to 59 Years | 0 (0.0%) | 26 (7.5%) |
| 60 to 64 Years | 35 (11.8%) | 39 (11.3%) |
| 65 to 69 Years | 0 (0.0%) | 54 (15.7%) |
| 70 to 74 Years | 66 (22.2%) | 65 (18.8%) |
| 75 to 79 Years | 0 (0.0%) | 0 (0.0%) |
| 80 to 84 Years | 13 (4.4%) | 0 (0.0%) |
| 85 Years and over | 0 (0.0%) | 0 (0.0%) |
| Total | 297 (100.0%) | 345 (100.0%) |
Families and Households in Walnut Creek
Median Family Size in Walnut Creek
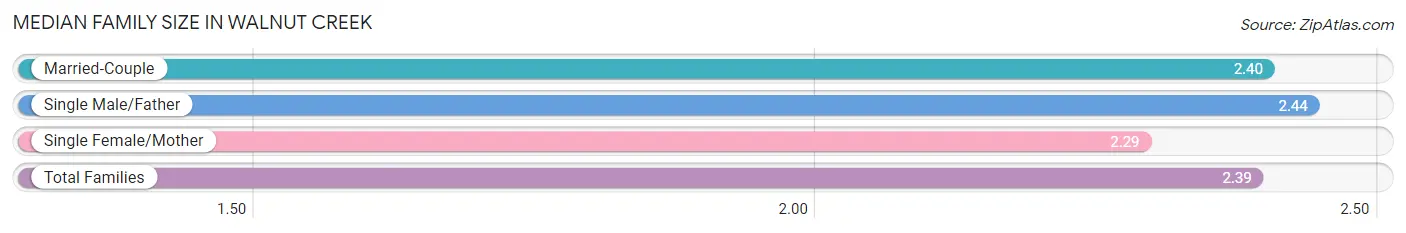
The median family size in Walnut Creek is 2.39 persons per family, with single male/father families (16 | 7.4%) accounting for the largest median family size of 2.44 persons per family. On the other hand, single female/mother families (28 | 13.0%) represent the smallest median family size with 2.29 persons per family.
| Family Type | # Families | Family Size |
| Married-Couple | 171 (79.5%) | 2.40 |
| Single Male/Father | 16 (7.4%) | 2.44 |
| Single Female/Mother | 28 (13.0%) | 2.29 |
| Total Families | 215 (100.0%) | 2.39 |
Median Household Size in Walnut Creek
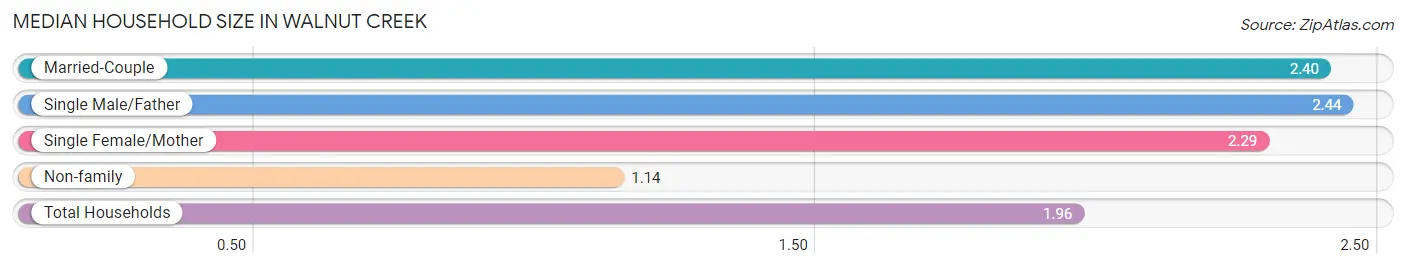
The median household size in Walnut Creek is 1.96 persons per household, with single male/father households (16 | 4.9%) accounting for the largest median household size of 2.44 persons per household. non-family households (112 | 34.3%) represent the smallest median household size with 1.14 persons per household.
| Household Type | # Households | Household Size |
| Married-Couple | 171 (52.3%) | 2.40 |
| Single Male/Father | 16 (4.9%) | 2.44 |
| Single Female/Mother | 28 (8.6%) | 2.29 |
| Non-family | 112 (34.3%) | 1.14 |
| Total Households | 327 (100.0%) | 1.96 |
Household Size by Marriage Status in Walnut Creek
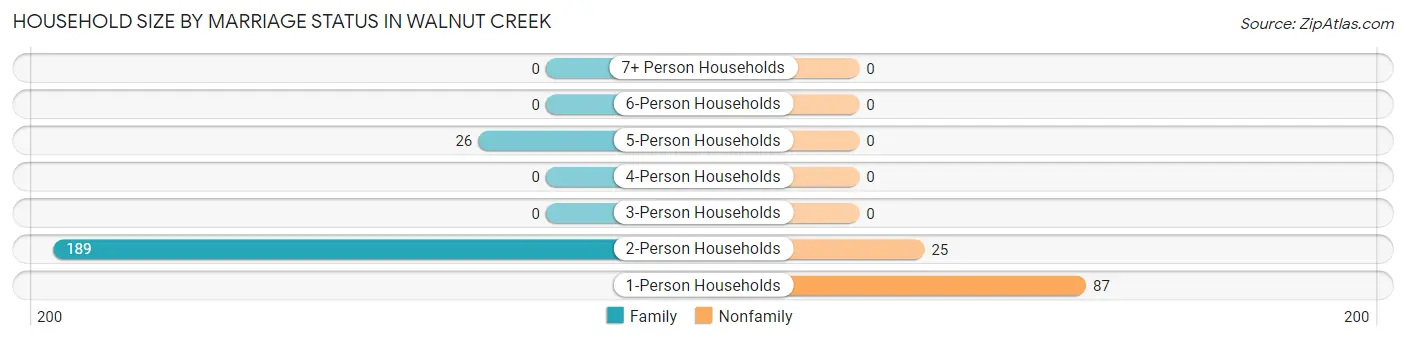
Out of a total of 327 households in Walnut Creek, 215 (65.7%) are family households, while 112 (34.3%) are nonfamily households. The most numerous type of family households are 2-person households, comprising 189, and the most common type of nonfamily households are 1-person households, comprising 87.
| Household Size | Family Households | Nonfamily Households |
| 1-Person Households | - | 87 (26.6%) |
| 2-Person Households | 189 (57.8%) | 25 (7.6%) |
| 3-Person Households | 0 (0.0%) | 0 (0.0%) |
| 4-Person Households | 0 (0.0%) | 0 (0.0%) |
| 5-Person Households | 26 (8.0%) | 0 (0.0%) |
| 6-Person Households | 0 (0.0%) | 0 (0.0%) |
| 7+ Person Households | 0 (0.0%) | 0 (0.0%) |
| Total | 215 (65.7%) | 112 (34.3%) |
Female Fertility in Walnut Creek
Fertility by Age in Walnut Creek
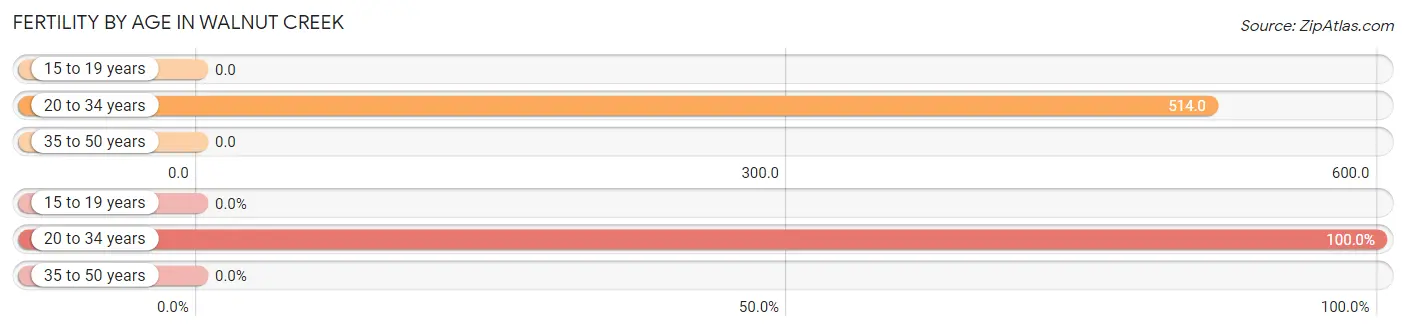
Average fertility rate in Walnut Creek is 270.0 births per 1,000 women. Women in the age bracket of 20 to 34 years have the highest fertility rate with 514.0 births per 1,000 women. Women in the age bracket of 20 to 34 years acount for 100.0% of all women with births.
| Age Bracket | Women with Births | Births / 1,000 Women |
| 15 to 19 years | 0 (0.0%) | 0.0 |
| 20 to 34 years | 38 (100.0%) | 514.0 |
| 35 to 50 years | 0 (0.0%) | 0.0 |
| Total | 38 (100.0%) | 270.0 |
Fertility by Age by Marriage Status in Walnut Creek
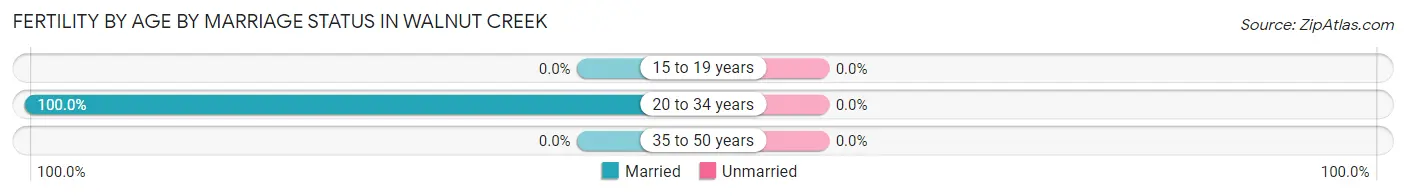
| Age Bracket | Married | Unmarried |
| 15 to 19 years | 0 (0.0%) | 0 (0.0%) |
| 20 to 34 years | 38 (100.0%) | 0 (0.0%) |
| 35 to 50 years | 0 (0.0%) | 0 (0.0%) |
| Total | 38 (100.0%) | 0 (0.0%) |
Fertility by Education in Walnut Creek
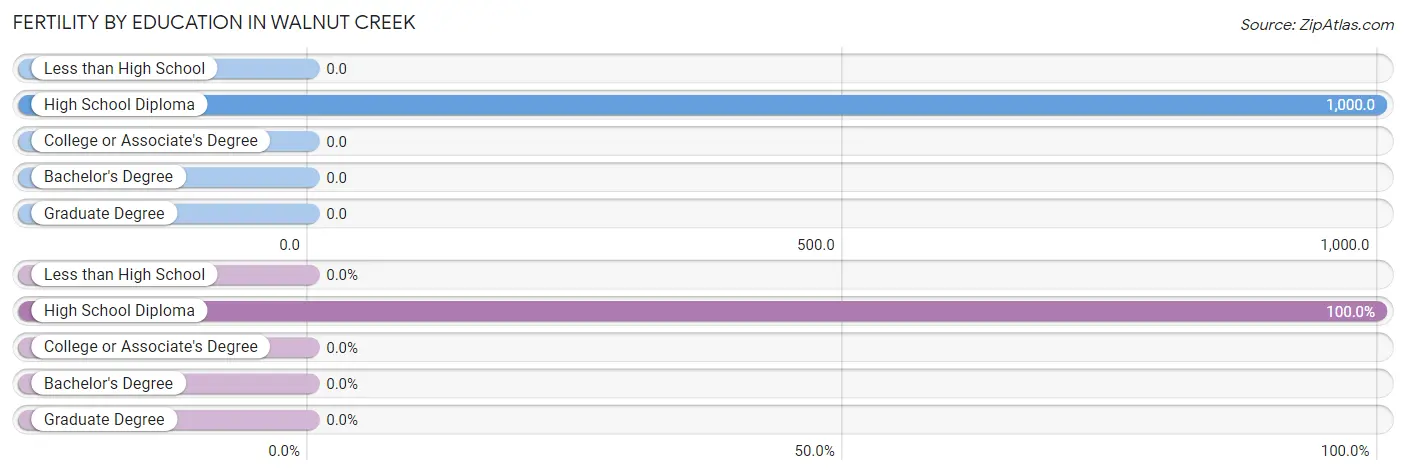
| Educational Attainment | Women with Births | Births / 1,000 Women |
| Less than High School | 0 (0.0%) | 0.0 |
| High School Diploma | 38 (100.0%) | 1,000.0 |
| College or Associate's Degree | 0 (0.0%) | 0.0 |
| Bachelor's Degree | 0 (0.0%) | 0.0 |
| Graduate Degree | 0 (0.0%) | 0.0 |
| Total | 38 (100.0%) | 270.0 |
Fertility by Education by Marriage Status in Walnut Creek
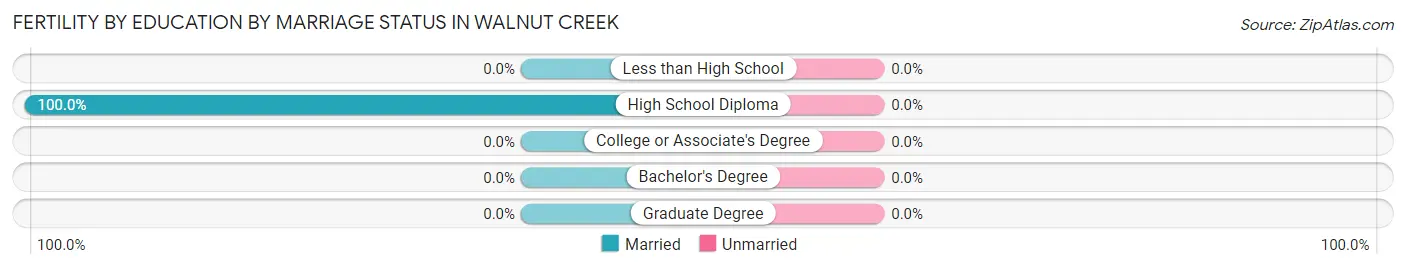
| Educational Attainment | Married | Unmarried |
| Less than High School | 0 (0.0%) | 0 (0.0%) |
| High School Diploma | 38 (100.0%) | 0 (0.0%) |
| College or Associate's Degree | 0 (0.0%) | 0 (0.0%) |
| Bachelor's Degree | 0 (0.0%) | 0 (0.0%) |
| Graduate Degree | 0 (0.0%) | 0 (0.0%) |
| Total | 38 (100.0%) | 0 (0.0%) |
Income in Walnut Creek
Income Overview in Walnut Creek
| Characteristic | Number | Measure |
| Per Capita Income | 642 | $26,977 |
| Median Family Income | 215 | $0 |
| Mean Family Income | 215 | $60,387 |
| Median Household Income | 327 | $42,946 |
| Mean Household Income | 327 | $52,442 |
| Income Deficit | 215 | $0 |
| Wage / Income Gap (%) | 642 | 21.62% |
| Wage / Income Gap ($) | 642 | 78.38¢ per $1 |
| Gini / Inequality Index | 642 | 0.37 |
Earnings by Sex in Walnut Creek
Average Earnings in Walnut Creek are $42,997, $34,543 for men and $44,071 for women, a difference of 21.6%.
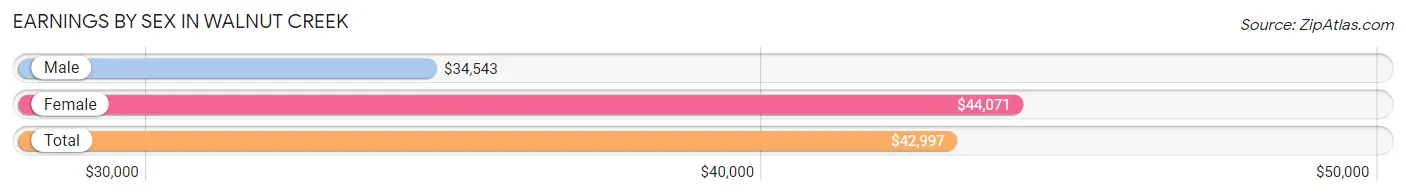
| Sex | Number | Average Earnings |
| Male | 67 (26.3%) | $34,543 |
| Female | 188 (73.7%) | $44,071 |
| Total | 255 (100.0%) | $42,997 |
Earnings by Sex by Income Bracket in Walnut Creek
The most common earnings brackets in Walnut Creek are $30,000 to $34,999 for men (41 | 61.2%) and $40,000 to $44,999 for women (78 | 41.5%).
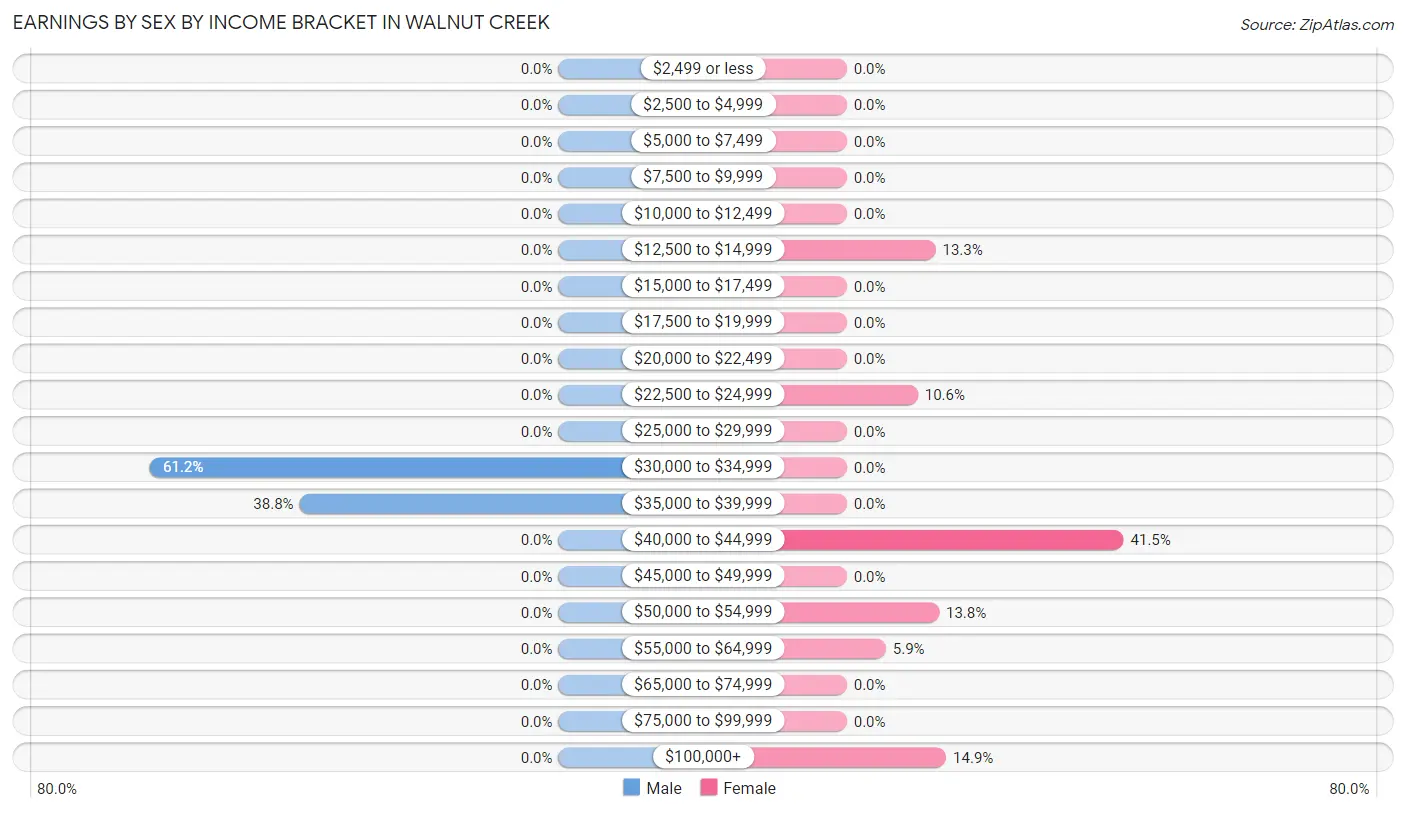
| Income | Male | Female |
| $2,499 or less | 0 (0.0%) | 0 (0.0%) |
| $2,500 to $4,999 | 0 (0.0%) | 0 (0.0%) |
| $5,000 to $7,499 | 0 (0.0%) | 0 (0.0%) |
| $7,500 to $9,999 | 0 (0.0%) | 0 (0.0%) |
| $10,000 to $12,499 | 0 (0.0%) | 0 (0.0%) |
| $12,500 to $14,999 | 0 (0.0%) | 25 (13.3%) |
| $15,000 to $17,499 | 0 (0.0%) | 0 (0.0%) |
| $17,500 to $19,999 | 0 (0.0%) | 0 (0.0%) |
| $20,000 to $22,499 | 0 (0.0%) | 0 (0.0%) |
| $22,500 to $24,999 | 0 (0.0%) | 20 (10.6%) |
| $25,000 to $29,999 | 0 (0.0%) | 0 (0.0%) |
| $30,000 to $34,999 | 41 (61.2%) | 0 (0.0%) |
| $35,000 to $39,999 | 26 (38.8%) | 0 (0.0%) |
| $40,000 to $44,999 | 0 (0.0%) | 78 (41.5%) |
| $45,000 to $49,999 | 0 (0.0%) | 0 (0.0%) |
| $50,000 to $54,999 | 0 (0.0%) | 26 (13.8%) |
| $55,000 to $64,999 | 0 (0.0%) | 11 (5.9%) |
| $65,000 to $74,999 | 0 (0.0%) | 0 (0.0%) |
| $75,000 to $99,999 | 0 (0.0%) | 0 (0.0%) |
| $100,000+ | 0 (0.0%) | 28 (14.9%) |
| Total | 67 (100.0%) | 188 (100.0%) |
Earnings by Sex by Educational Attainment in Walnut Creek
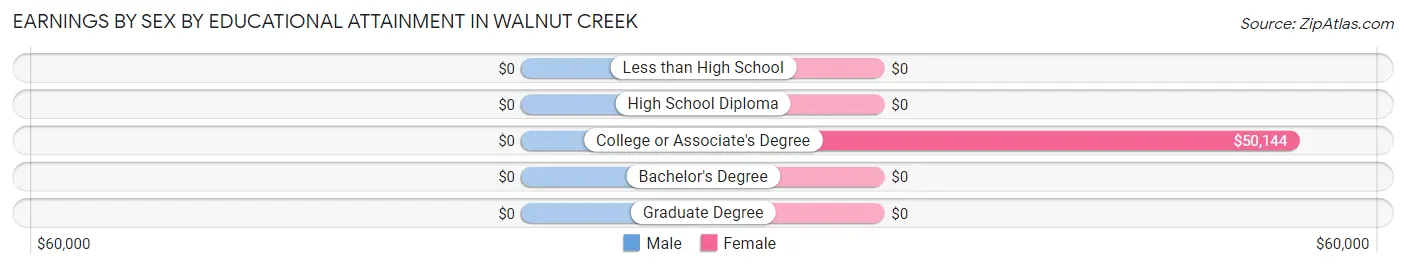
| Educational Attainment | Male Income | Female Income |
| Less than High School | - | - |
| High School Diploma | - | - |
| College or Associate's Degree | - | - |
| Bachelor's Degree | - | - |
| Graduate Degree | - | - |
| Total | $34,543 | $44,071 |
Family Income in Walnut Creek
Family Income Brackets in Walnut Creek
According to the Walnut Creek family income data, there are 73 families falling into the $15,000 to $24,999 income range, which is the most common income bracket and makes up 34.0% of all families.
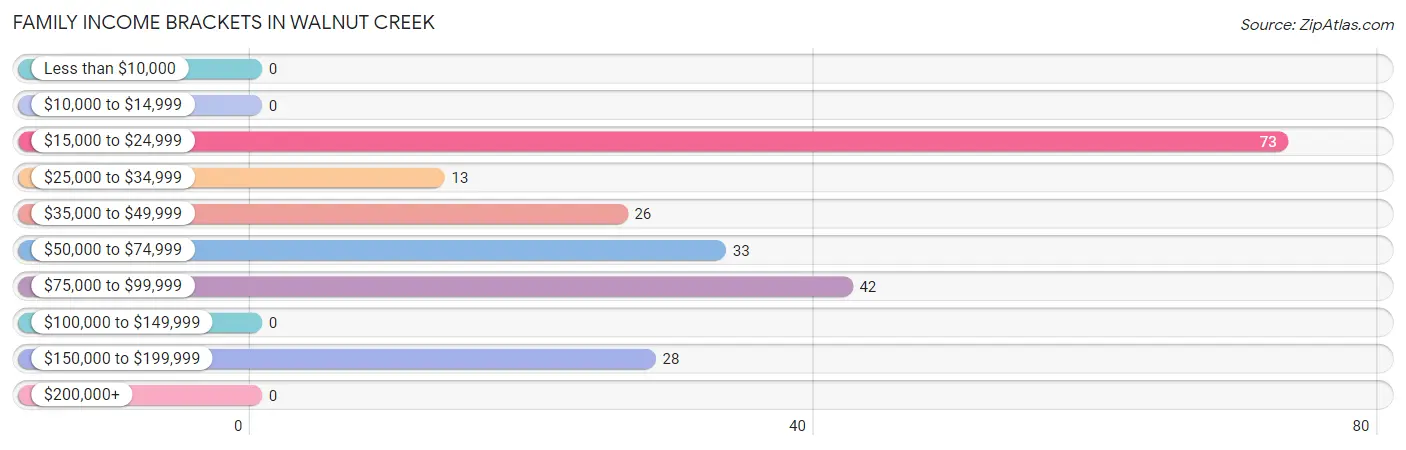
| Income Bracket | # Families | % Families |
| Less than $10,000 | 0 | 0.0% |
| $10,000 to $14,999 | 0 | 0.0% |
| $15,000 to $24,999 | 73 | 34.0% |
| $25,000 to $34,999 | 13 | 6.0% |
| $35,000 to $49,999 | 26 | 12.1% |
| $50,000 to $74,999 | 33 | 15.3% |
| $75,000 to $99,999 | 42 | 19.5% |
| $100,000 to $149,999 | 0 | 0.0% |
| $150,000 to $199,999 | 28 | 13.0% |
| $200,000+ | 0 | 0.0% |
Family Income by Famaliy Size in Walnut Creek
2-person families (189 | 87.9%) account for the highest median family income in Walnut Creek with $56,250 per family, while 2-person families (189 | 87.9%) have the highest median income of $28,125 per family member.
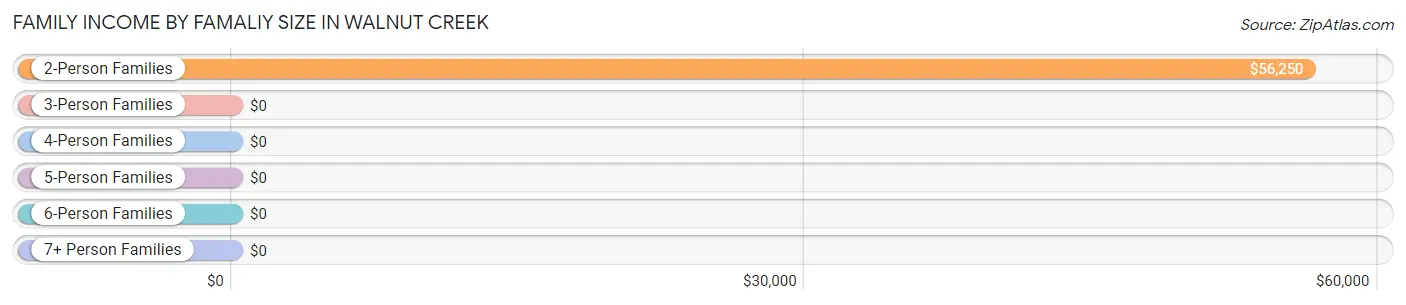
| Income Bracket | # Families | Median Income |
| 2-Person Families | 189 (87.9%) | $56,250 |
| 3-Person Families | 0 (0.0%) | $0 |
| 4-Person Families | 0 (0.0%) | $0 |
| 5-Person Families | 26 (12.1%) | $0 |
| 6-Person Families | 0 (0.0%) | $0 |
| 7+ Person Families | 0 (0.0%) | $0 |
| Total | 215 (100.0%) | $0 |
Family Income by Number of Earners in Walnut Creek
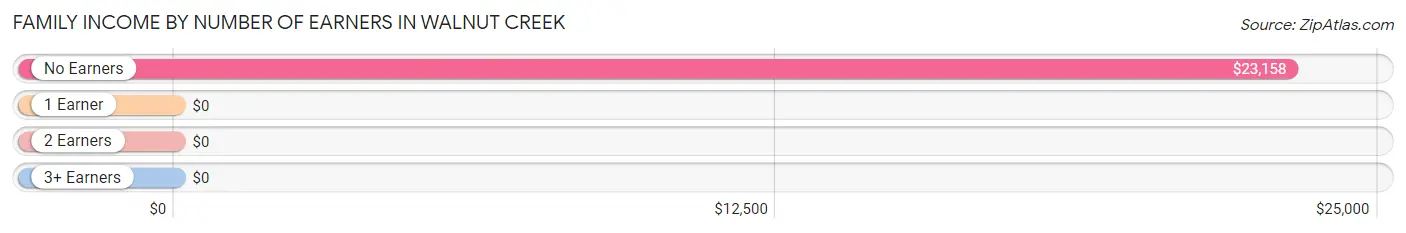
| Number of Earners | # Families | Median Income |
| No Earners | 118 (54.9%) | $23,158 |
| 1 Earner | 26 (12.1%) | $0 |
| 2 Earners | 71 (33.0%) | $0 |
| 3+ Earners | 0 (0.0%) | $0 |
| Total | 215 (100.0%) | $0 |
Household Income in Walnut Creek
Household Income Brackets in Walnut Creek
With 83 households falling in the category, the $35,000 to $49,999 income range is the most frequent in Walnut Creek, accounting for 25.4% of all households.
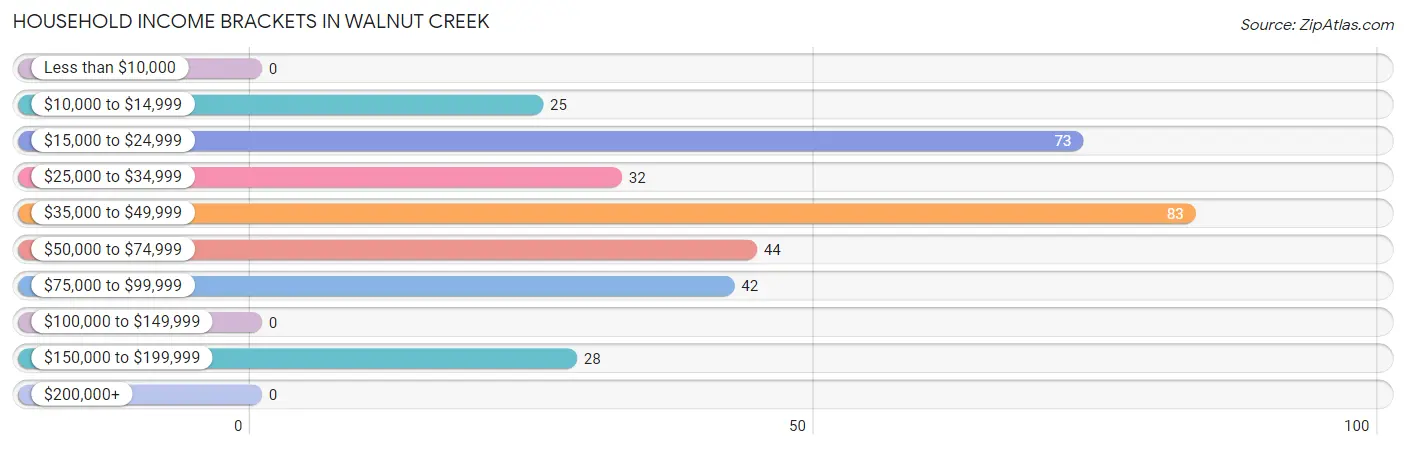
| Income Bracket | # Households | % Households |
| Less than $10,000 | 0 | 0.0% |
| $10,000 to $14,999 | 25 | 7.6% |
| $15,000 to $24,999 | 73 | 22.3% |
| $25,000 to $34,999 | 32 | 9.8% |
| $35,000 to $49,999 | 83 | 25.4% |
| $50,000 to $74,999 | 44 | 13.5% |
| $75,000 to $99,999 | 42 | 12.8% |
| $100,000 to $149,999 | 0 | 0.0% |
| $150,000 to $199,999 | 28 | 8.6% |
| $200,000+ | 0 | 0.0% |
Household Income by Householder Age in Walnut Creek
The median household income in Walnut Creek is $42,946, with the highest median household income of $55,882 found in the 45 to 64 years age bracket for the primary householder. A total of 184 households (56.3%) fall into this category.
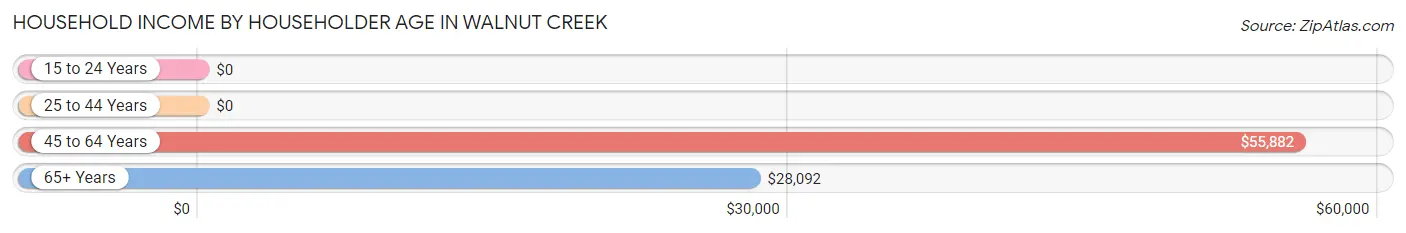
| Income Bracket | # Households | Median Income |
| 15 to 24 Years | 0 (0.0%) | $0 |
| 25 to 44 Years | 26 (8.0%) | $0 |
| 45 to 64 Years | 184 (56.3%) | $55,882 |
| 65+ Years | 117 (35.8%) | $28,092 |
| Total | 327 (100.0%) | $42,946 |
Poverty in Walnut Creek
Income Below Poverty by Sex and Age in Walnut Creek
With 5.4% poverty level for males and 7.2% for females among the residents of Walnut Creek, 45 to 54 year old males and 45 to 54 year old females are the most vulnerable to poverty, with 16 males (28.1%) and 25 females (28.7%) in their respective age groups living below the poverty level.
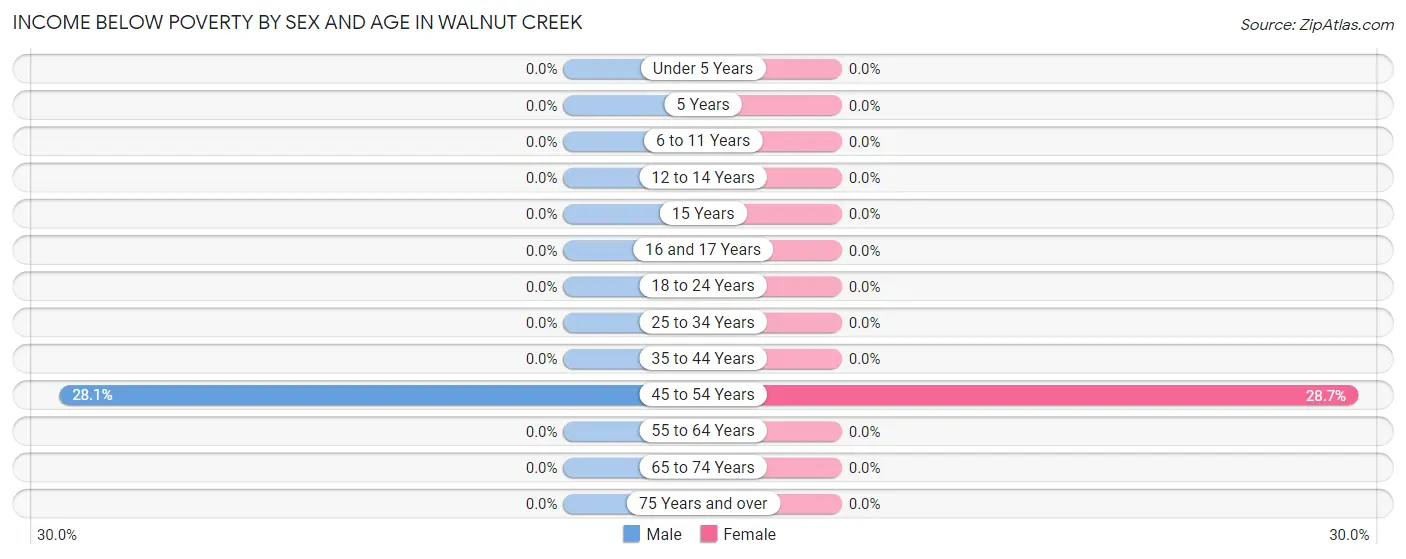
| Age Bracket | Male | Female |
| Under 5 Years | 0 (0.0%) | 0 (0.0%) |
| 5 Years | 0 (0.0%) | 0 (0.0%) |
| 6 to 11 Years | 0 (0.0%) | 0 (0.0%) |
| 12 to 14 Years | 0 (0.0%) | 0 (0.0%) |
| 15 Years | 0 (0.0%) | 0 (0.0%) |
| 16 and 17 Years | 0 (0.0%) | 0 (0.0%) |
| 18 to 24 Years | 0 (0.0%) | 0 (0.0%) |
| 25 to 34 Years | 0 (0.0%) | 0 (0.0%) |
| 35 to 44 Years | 0 (0.0%) | 0 (0.0%) |
| 45 to 54 Years | 16 (28.1%) | 25 (28.7%) |
| 55 to 64 Years | 0 (0.0%) | 0 (0.0%) |
| 65 to 74 Years | 0 (0.0%) | 0 (0.0%) |
| 75 Years and over | 0 (0.0%) | 0 (0.0%) |
| Total | 16 (5.4%) | 25 (7.2%) |
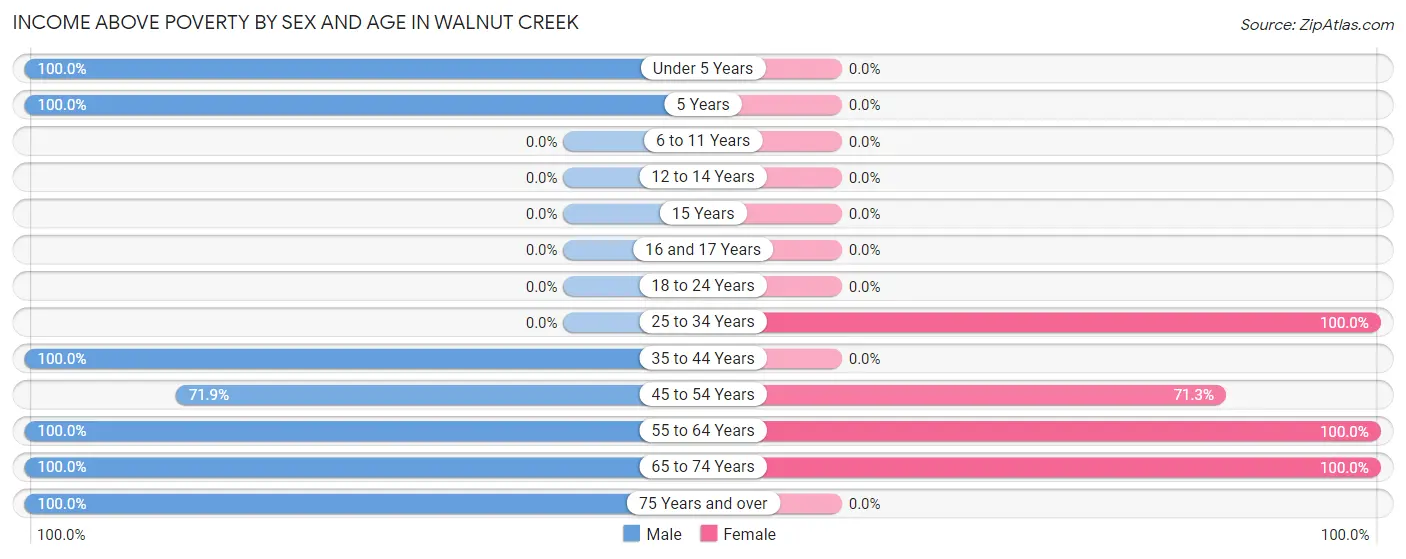
Income Above Poverty by Sex and Age in Walnut Creek
According to the poverty statistics in Walnut Creek, males aged under 5 years and females aged 25 to 34 years are the age groups that are most secure financially, with 100.0% of males and 100.0% of females in these age groups living above the poverty line.
| Age Bracket | Male | Female |
| Under 5 Years | 39 (100.0%) | 0 (0.0%) |
| 5 Years | 38 (100.0%) | 0 (0.0%) |
| 6 to 11 Years | 0 (0.0%) | 0 (0.0%) |
| 12 to 14 Years | 0 (0.0%) | 0 (0.0%) |
| 15 Years | 0 (0.0%) | 0 (0.0%) |
| 16 and 17 Years | 0 (0.0%) | 0 (0.0%) |
| 18 to 24 Years | 0 (0.0%) | 0 (0.0%) |
| 25 to 34 Years | 0 (0.0%) | 74 (100.0%) |
| 35 to 44 Years | 49 (100.0%) | 0 (0.0%) |
| 45 to 54 Years | 41 (71.9%) | 62 (71.3%) |
| 55 to 64 Years | 35 (100.0%) | 65 (100.0%) |
| 65 to 74 Years | 66 (100.0%) | 119 (100.0%) |
| 75 Years and over | 13 (100.0%) | 0 (0.0%) |
| Total | 281 (94.6%) | 320 (92.7%) |
Income Below Poverty Among Married-Couple Families in Walnut Creek
| Children | Above Poverty | Below Poverty |
| No Children | 145 (100.0%) | 0 (0.0%) |
| 1 or 2 Children | 0 (0.0%) | 0 (0.0%) |
| 3 or 4 Children | 26 (100.0%) | 0 (0.0%) |
| 5 or more Children | 0 (0.0%) | 0 (0.0%) |
| Total | 171 (100.0%) | 0 (0.0%) |
Income Below Poverty Among Single-Parent Households in Walnut Creek
| Children | Single Father | Single Mother |
| No Children | 0 (0.0%) | 0 (0.0%) |
| 1 or 2 Children | 0 (0.0%) | 0 (0.0%) |
| 3 or 4 Children | 0 (0.0%) | 0 (0.0%) |
| 5 or more Children | 0 (0.0%) | 0 (0.0%) |
| Total | 0 (0.0%) | 0 (0.0%) |
Income Below Poverty Among Married-Couple vs Single-Parent Households in Walnut Creek

| Children | Married-Couple Families | Single-Parent Households |
| No Children | 0 (0.0%) | 0 (0.0%) |
| 1 or 2 Children | 0 (0.0%) | 0 (0.0%) |
| 3 or 4 Children | 0 (0.0%) | 0 (0.0%) |
| 5 or more Children | 0 (0.0%) | 0 (0.0%) |
| Total | 0 (0.0%) | 0 (0.0%) |
Employment Characteristics in Walnut Creek
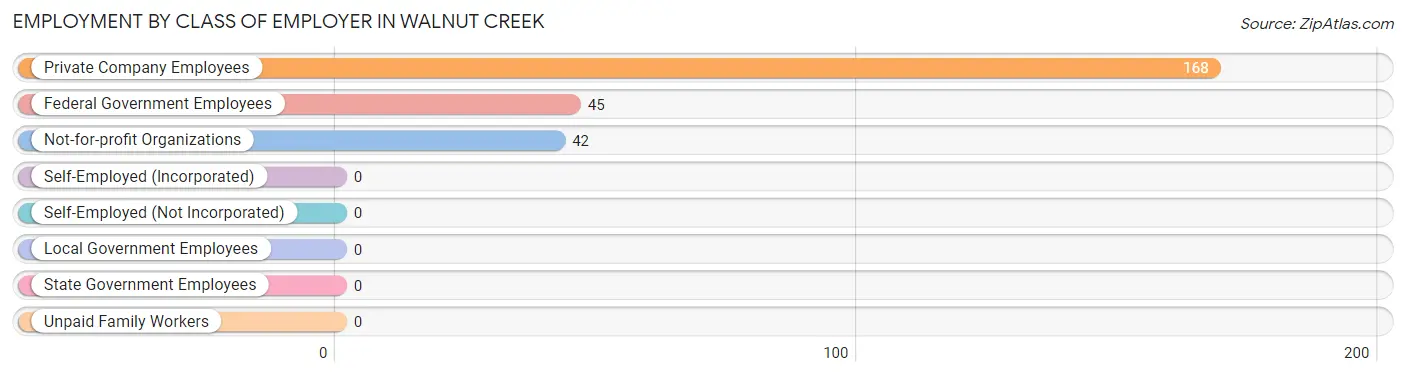
Employment by Class of Employer in Walnut Creek
Among the 255 employed individuals in Walnut Creek, private company employees (168 | 65.9%), federal government employees (45 | 17.6%), and not-for-profit organizations (42 | 16.5%) make up the most common classes of employment.
| Employer Class | # Employees | % Employees |
| Private Company Employees | 168 | 65.9% |
| Self-Employed (Incorporated) | 0 | 0.0% |
| Self-Employed (Not Incorporated) | 0 | 0.0% |
| Not-for-profit Organizations | 42 | 16.5% |
| Local Government Employees | 0 | 0.0% |
| State Government Employees | 0 | 0.0% |
| Federal Government Employees | 45 | 17.6% |
| Unpaid Family Workers | 0 | 0.0% |
| Total | 255 | 100.0% |
Employment Status by Age in Walnut Creek
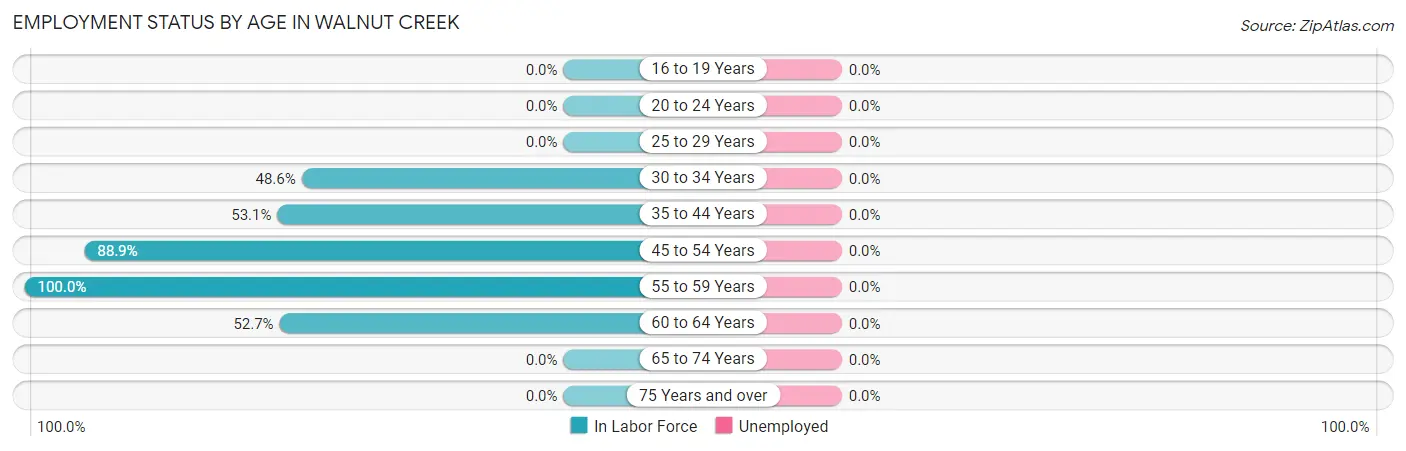
| Age Bracket | In Labor Force | Unemployed |
| 16 to 19 Years | 0 (0.0%) | 0 (0.0%) |
| 20 to 24 Years | 0 (0.0%) | 0 (0.0%) |
| 25 to 29 Years | 0 (0.0%) | 0 (0.0%) |
| 30 to 34 Years | 36 (48.6%) | 0 (0.0%) |
| 35 to 44 Years | 26 (53.1%) | 0 (0.0%) |
| 45 to 54 Years | 128 (88.9%) | 0 (0.0%) |
| 55 to 59 Years | 26 (100.0%) | 0 (0.0%) |
| 60 to 64 Years | 39 (52.7%) | 0 (0.0%) |
| 65 to 74 Years | 0 (0.0%) | 0 (0.0%) |
| 75 Years and over | 0 (0.0%) | 0 (0.0%) |
| Total | 255 (45.1%) | 0 (0.0%) |
Employment Status by Educational Attainment in Walnut Creek
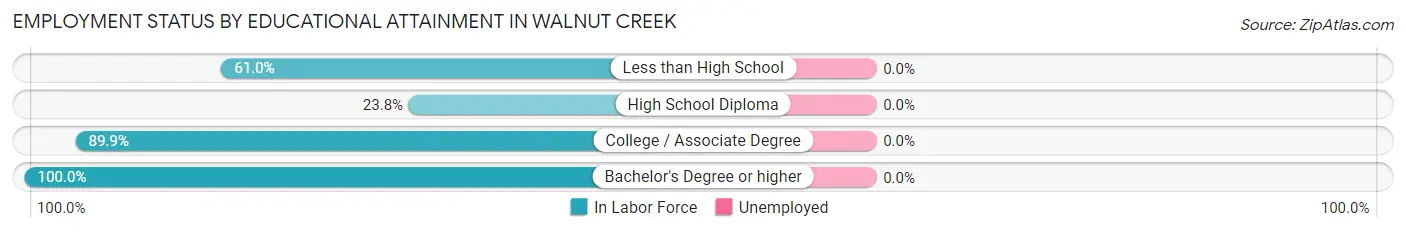
| Educational Attainment | In Labor Force | Unemployed |
| Less than High School | 25 (61.0%) | 0 (0.0%) |
| High School Diploma | 24 (23.8%) | 0 (0.0%) |
| College / Associate Degree | 170 (89.9%) | 0 (0.0%) |
| Bachelor's Degree or higher | 36 (100.0%) | 0 (0.0%) |
| Total | 255 (69.5%) | 0 (0.0%) |
Employment Occupations by Sex in Walnut Creek
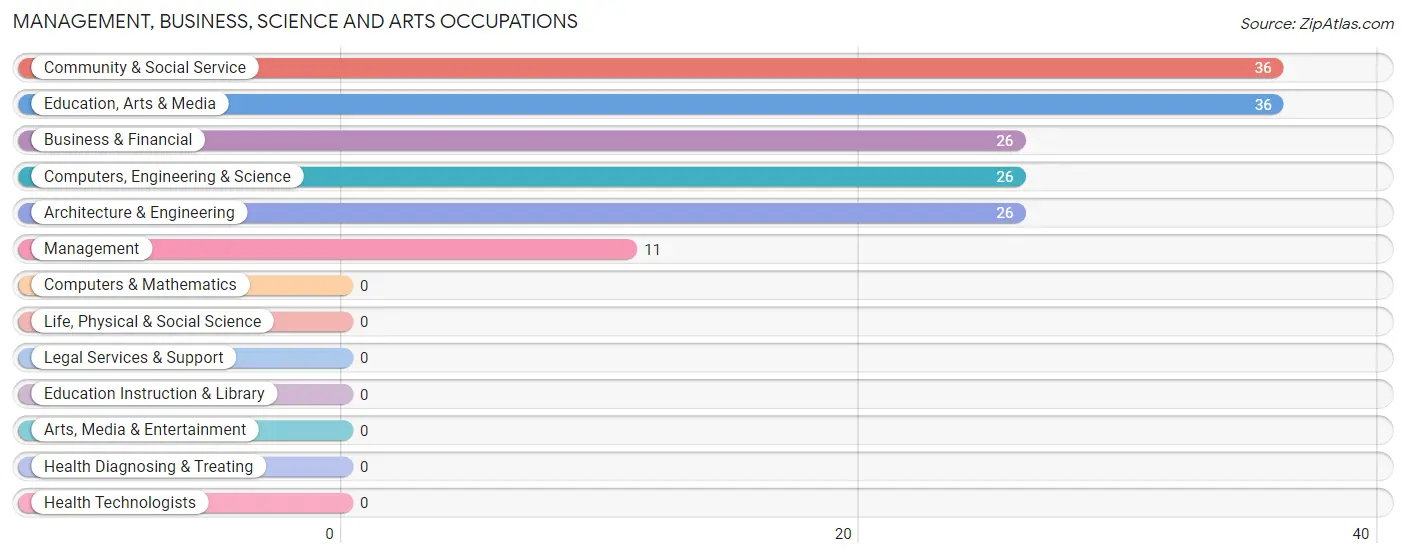
Management, Business, Science and Arts Occupations
The most common Management, Business, Science and Arts occupations in Walnut Creek are Community & Social Service (36 | 14.1%), Education, Arts & Media (36 | 14.1%), Business & Financial (26 | 10.2%), Computers, Engineering & Science (26 | 10.2%), and Architecture & Engineering (26 | 10.2%).
Management, Business, Science and Arts Occupations by Sex
Within the Management, Business, Science and Arts occupations in Walnut Creek, the most male-oriented occupations are Computers, Engineering & Science (100.0%), and Architecture & Engineering (100.0%), while the most female-oriented occupations are Management (100.0%), Business & Financial (100.0%), and Community & Social Service (100.0%).
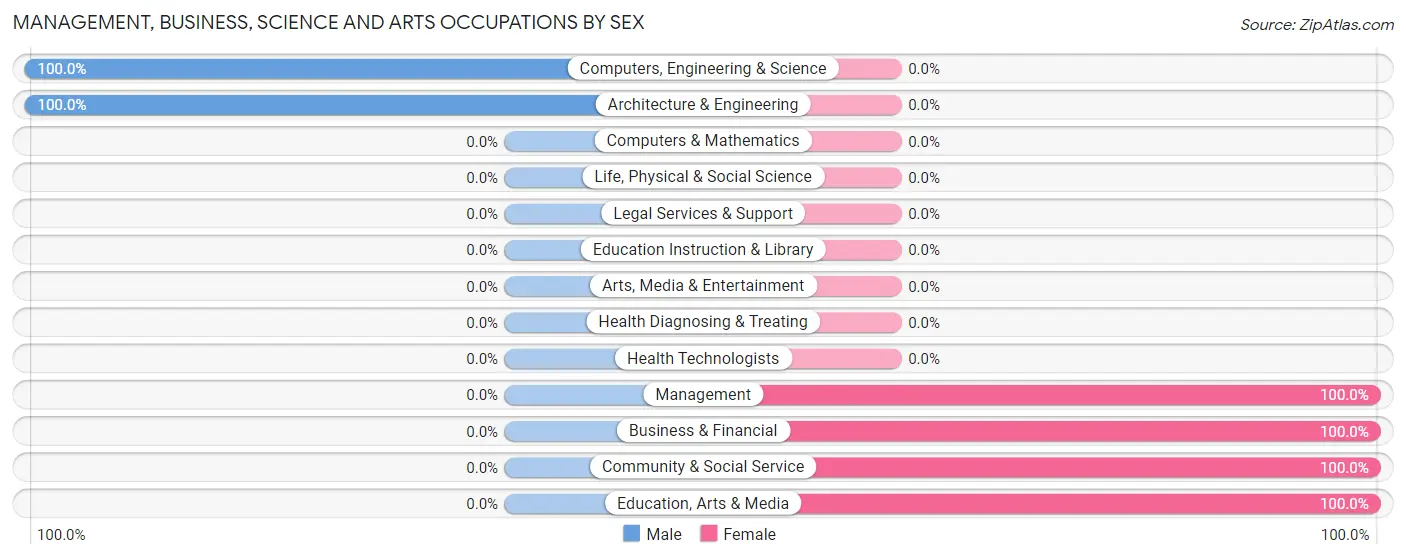
| Occupation | Male | Female |
| Management | 0 (0.0%) | 11 (100.0%) |
| Business & Financial | 0 (0.0%) | 26 (100.0%) |
| Computers, Engineering & Science | 26 (100.0%) | 0 (0.0%) |
| Computers & Mathematics | 0 (0.0%) | 0 (0.0%) |
| Architecture & Engineering | 26 (100.0%) | 0 (0.0%) |
| Life, Physical & Social Science | 0 (0.0%) | 0 (0.0%) |
| Community & Social Service | 0 (0.0%) | 36 (100.0%) |
| Education, Arts & Media | 0 (0.0%) | 36 (100.0%) |
| Legal Services & Support | 0 (0.0%) | 0 (0.0%) |
| Education Instruction & Library | 0 (0.0%) | 0 (0.0%) |
| Arts, Media & Entertainment | 0 (0.0%) | 0 (0.0%) |
| Health Diagnosing & Treating | 0 (0.0%) | 0 (0.0%) |
| Health Technologists | 0 (0.0%) | 0 (0.0%) |
| Total (Category) | 26 (26.3%) | 73 (73.7%) |
| Total (Overall) | 67 (26.3%) | 188 (73.7%) |
Services Occupations
Services Occupations by Sex
| Occupation | Male | Female |
| Healthcare Support | 0 (0.0%) | 0 (0.0%) |
| Security & Protection | 0 (0.0%) | 0 (0.0%) |
| Firefighting & Prevention | 0 (0.0%) | 0 (0.0%) |
| Law Enforcement | 0 (0.0%) | 0 (0.0%) |
| Food Preparation & Serving | 0 (0.0%) | 0 (0.0%) |
| Cleaning & Maintenance | 0 (0.0%) | 0 (0.0%) |
| Personal Care & Service | 0 (0.0%) | 0 (0.0%) |
| Total (Category) | 0 (0.0%) | 0 (0.0%) |
| Total (Overall) | 67 (26.3%) | 188 (73.7%) |
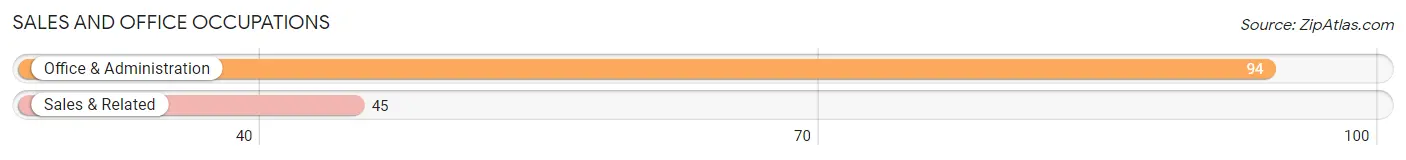
Sales and Office Occupations
The most common Sales and Office occupations in Walnut Creek are Office & Administration (94 | 36.9%), and Sales & Related (45 | 17.6%).
Sales and Office Occupations by Sex
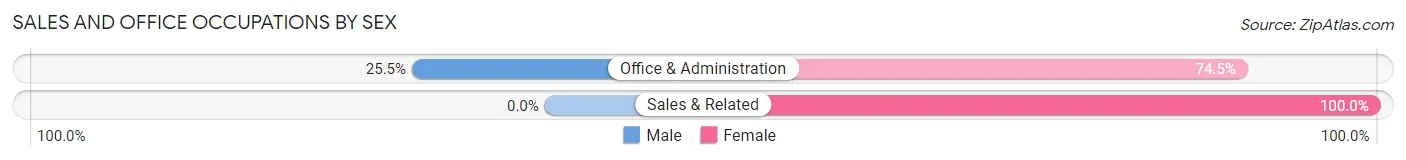
| Occupation | Male | Female |
| Sales & Related | 0 (0.0%) | 45 (100.0%) |
| Office & Administration | 24 (25.5%) | 70 (74.5%) |
| Total (Category) | 24 (17.3%) | 115 (82.7%) |
| Total (Overall) | 67 (26.3%) | 188 (73.7%) |
Natural Resources, Construction and Maintenance Occupations
Natural Resources, Construction and Maintenance Occupations by Sex
| Occupation | Male | Female |
| Farming, Fishing & Forestry | 0 (0.0%) | 0 (0.0%) |
| Construction & Extraction | 0 (0.0%) | 0 (0.0%) |
| Installation, Maintenance & Repair | 0 (0.0%) | 0 (0.0%) |
| Total (Category) | 0 (0.0%) | 0 (0.0%) |
| Total (Overall) | 67 (26.3%) | 188 (73.7%) |
Production, Transportation and Moving Occupations
The most common Production, Transportation and Moving occupations in Walnut Creek are , and Transportation (17 | 6.7%).
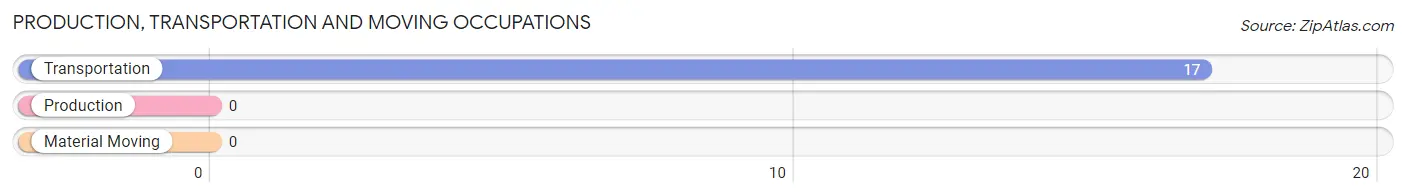
Production, Transportation and Moving Occupations by Sex
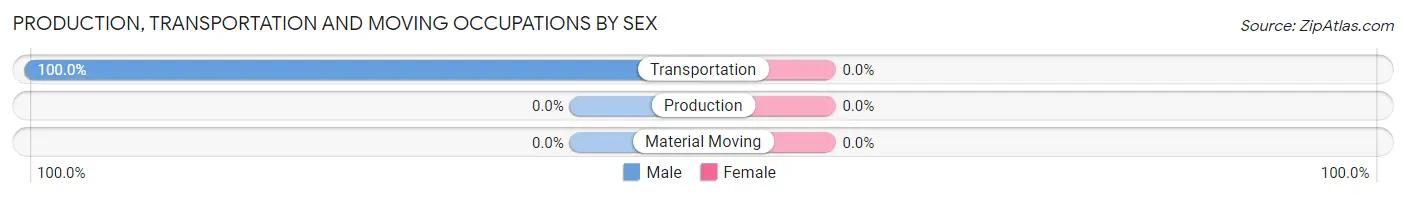
| Occupation | Male | Female |
| Production | 0 (0.0%) | 0 (0.0%) |
| Transportation | 17 (100.0%) | 0 (0.0%) |
| Material Moving | 0 (0.0%) | 0 (0.0%) |
| Total (Category) | 17 (100.0%) | 0 (0.0%) |
| Total (Overall) | 67 (26.3%) | 188 (73.7%) |
Employment Industries by Sex in Walnut Creek
Employment Industries in Walnut Creek
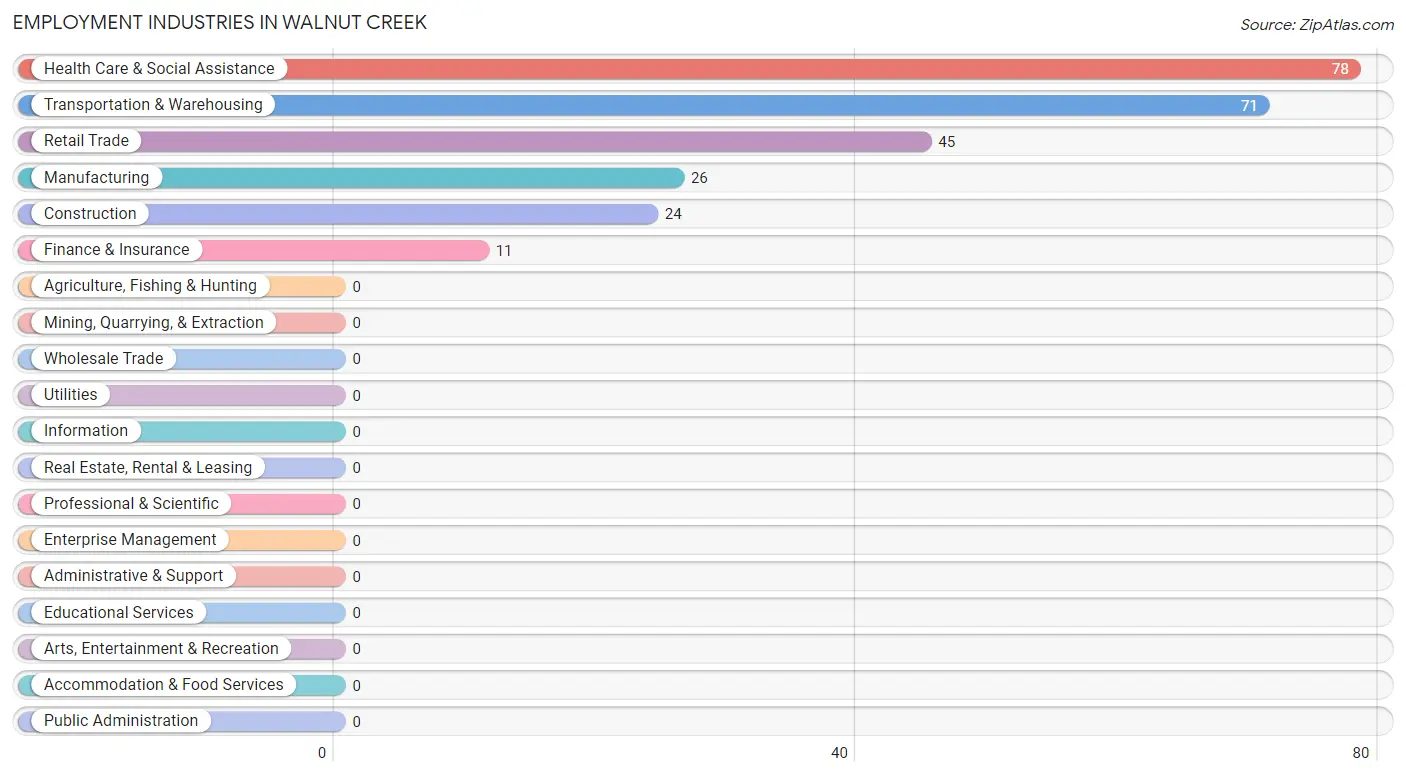
The major employment industries in Walnut Creek include Health Care & Social Assistance (78 | 30.6%), Transportation & Warehousing (71 | 27.8%), Retail Trade (45 | 17.6%), Manufacturing (26 | 10.2%), and Construction (24 | 9.4%).
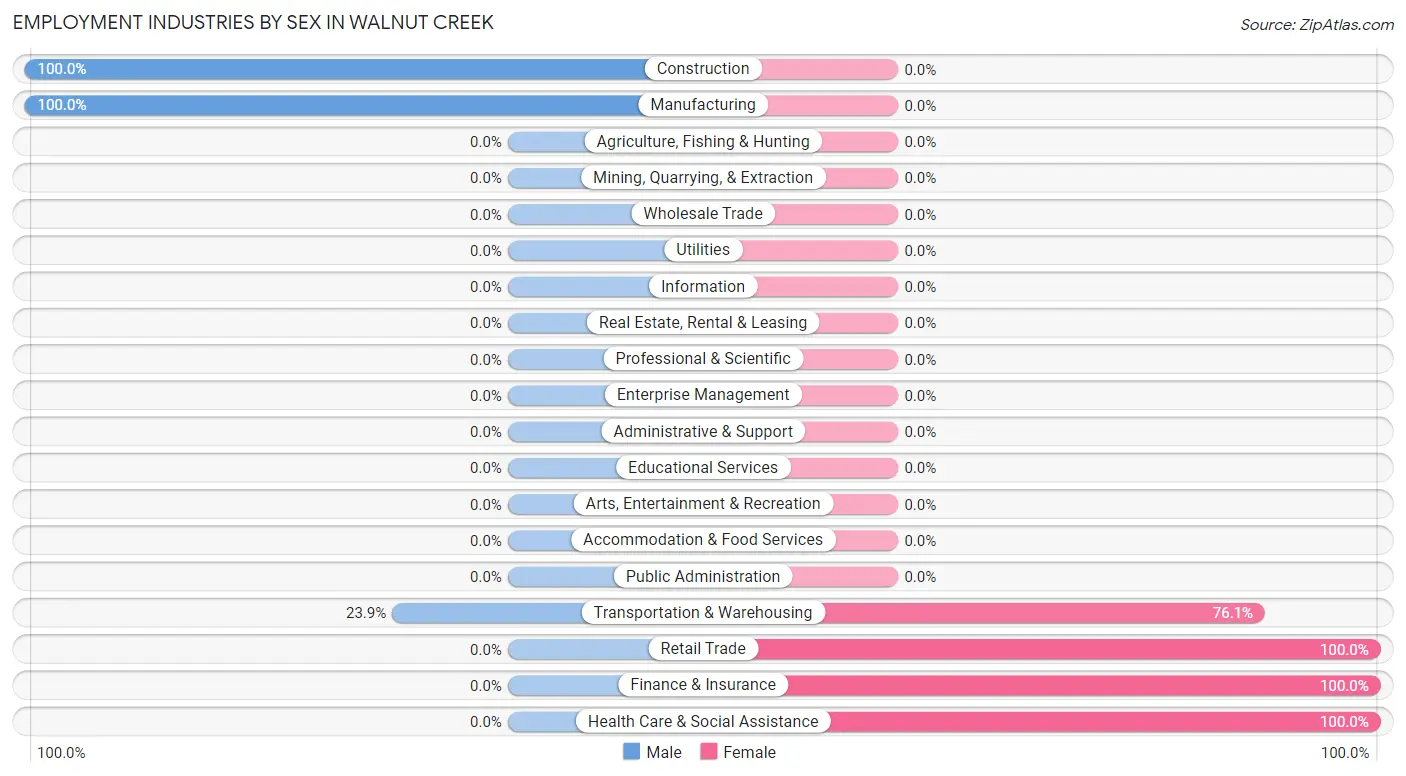
Employment Industries by Sex in Walnut Creek
The Walnut Creek industries that see more men than women are Construction (100.0%), Manufacturing (100.0%), and Transportation & Warehousing (23.9%), whereas the industries that tend to have a higher number of women are Retail Trade (100.0%), Finance & Insurance (100.0%), and Health Care & Social Assistance (100.0%).
| Industry | Male | Female |
| Agriculture, Fishing & Hunting | 0 (0.0%) | 0 (0.0%) |
| Mining, Quarrying, & Extraction | 0 (0.0%) | 0 (0.0%) |
| Construction | 24 (100.0%) | 0 (0.0%) |
| Manufacturing | 26 (100.0%) | 0 (0.0%) |
| Wholesale Trade | 0 (0.0%) | 0 (0.0%) |
| Retail Trade | 0 (0.0%) | 45 (100.0%) |
| Transportation & Warehousing | 17 (23.9%) | 54 (76.1%) |
| Utilities | 0 (0.0%) | 0 (0.0%) |
| Information | 0 (0.0%) | 0 (0.0%) |
| Finance & Insurance | 0 (0.0%) | 11 (100.0%) |
| Real Estate, Rental & Leasing | 0 (0.0%) | 0 (0.0%) |
| Professional & Scientific | 0 (0.0%) | 0 (0.0%) |
| Enterprise Management | 0 (0.0%) | 0 (0.0%) |
| Administrative & Support | 0 (0.0%) | 0 (0.0%) |
| Educational Services | 0 (0.0%) | 0 (0.0%) |
| Health Care & Social Assistance | 0 (0.0%) | 78 (100.0%) |
| Arts, Entertainment & Recreation | 0 (0.0%) | 0 (0.0%) |
| Accommodation & Food Services | 0 (0.0%) | 0 (0.0%) |
| Public Administration | 0 (0.0%) | 0 (0.0%) |
| Total | 67 (26.3%) | 188 (73.7%) |
Education in Walnut Creek
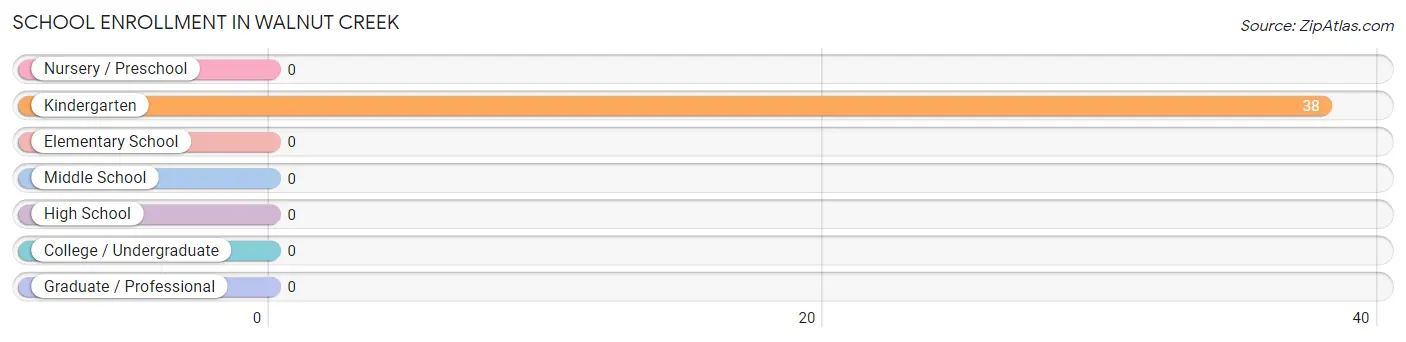
School Enrollment in Walnut Creek
| School Level | # Students | % Students |
| Nursery / Preschool | 0 | 0.0% |
| Kindergarten | 38 | 100.0% |
| Elementary School | 0 | 0.0% |
| Middle School | 0 | 0.0% |
| High School | 0 | 0.0% |
| College / Undergraduate | 0 | 0.0% |
| Graduate / Professional | 0 | 0.0% |
| Total | 38 | 100.0% |
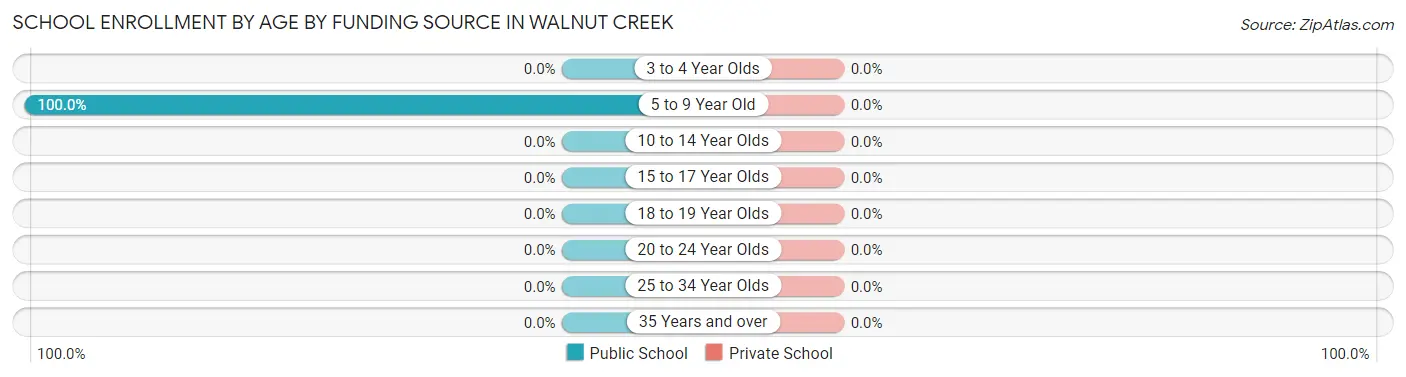
School Enrollment by Age by Funding Source in Walnut Creek
| Age Bracket | Public School | Private School |
| 3 to 4 Year Olds | 0 (0.0%) | 0 (0.0%) |
| 5 to 9 Year Old | 38 (100.0%) | 0 (0.0%) |
| 10 to 14 Year Olds | 0 (0.0%) | 0 (0.0%) |
| 15 to 17 Year Olds | 0 (0.0%) | 0 (0.0%) |
| 18 to 19 Year Olds | 0 (0.0%) | 0 (0.0%) |
| 20 to 24 Year Olds | 0 (0.0%) | 0 (0.0%) |
| 25 to 34 Year Olds | 0 (0.0%) | 0 (0.0%) |
| 35 Years and over | 0 (0.0%) | 0 (0.0%) |
| Total | 38 (100.0%) | 0 (0.0%) |
Educational Attainment by Field of Study in Walnut Creek
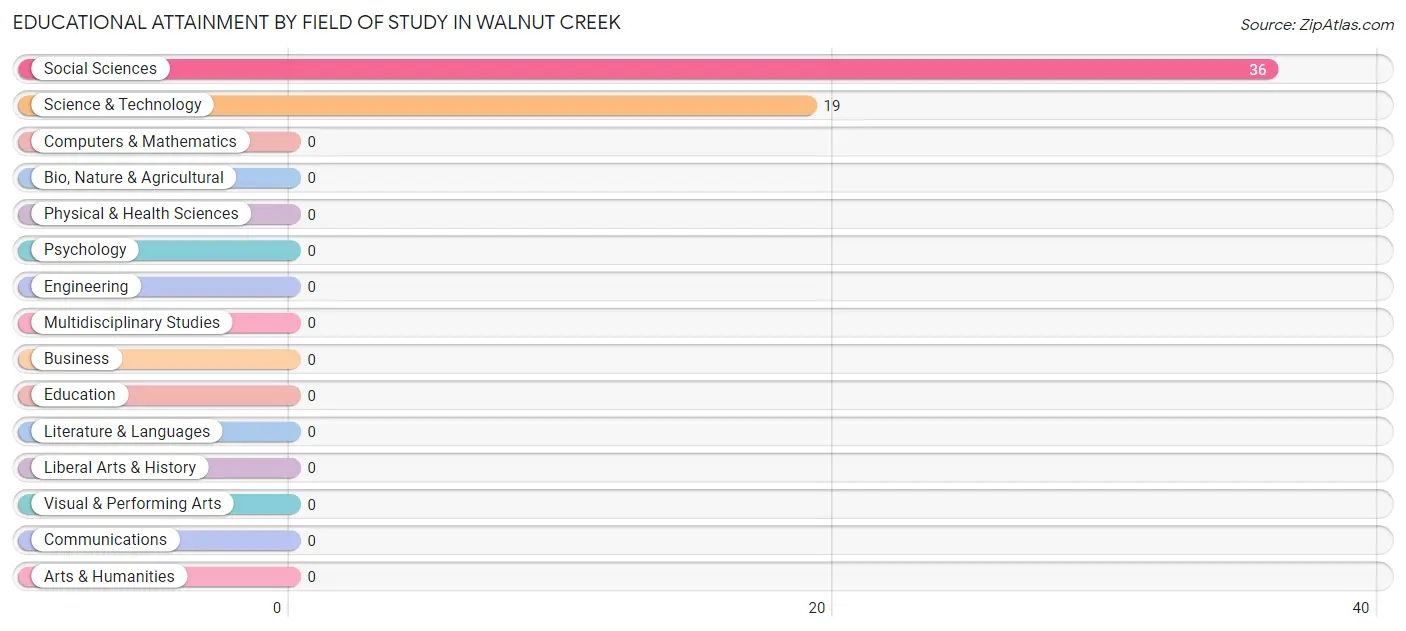
Social sciences (36 | 65.4%), and science & technology (19 | 34.5%) are the most common fields of study among 55 individuals in Walnut Creek who have obtained a bachelor's degree or higher.
| Field of Study | # Graduates | % Graduates |
| Computers & Mathematics | 0 | 0.0% |
| Bio, Nature & Agricultural | 0 | 0.0% |
| Physical & Health Sciences | 0 | 0.0% |
| Psychology | 0 | 0.0% |
| Social Sciences | 36 | 65.4% |
| Engineering | 0 | 0.0% |
| Multidisciplinary Studies | 0 | 0.0% |
| Science & Technology | 19 | 34.5% |
| Business | 0 | 0.0% |
| Education | 0 | 0.0% |
| Literature & Languages | 0 | 0.0% |
| Liberal Arts & History | 0 | 0.0% |
| Visual & Performing Arts | 0 | 0.0% |
| Communications | 0 | 0.0% |
| Arts & Humanities | 0 | 0.0% |
| Total | 55 | 100.0% |
Transportation & Commute in Walnut Creek
Vehicle Availability by Sex in Walnut Creek
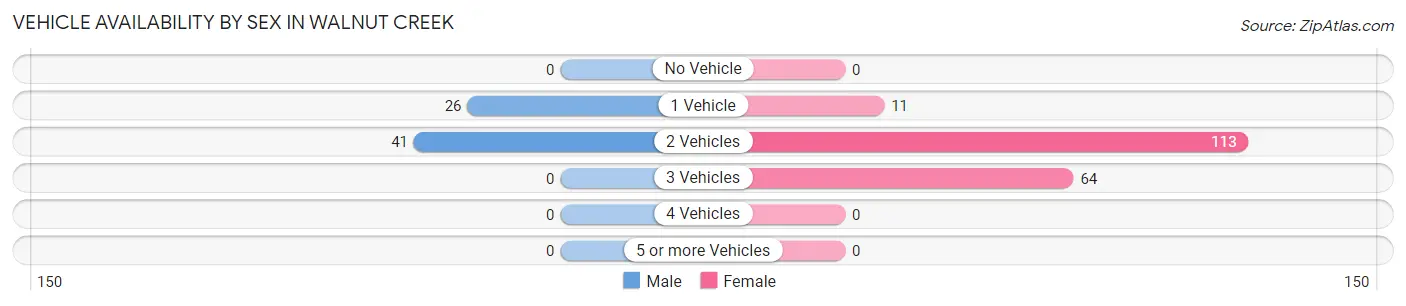
The most prevalent vehicle ownership categories in Walnut Creek are males with 2 vehicles (41, accounting for 61.2%) and females with 2 vehicles (113, making up 21.8%).
| Vehicles Available | Male | Female |
| No Vehicle | 0 (0.0%) | 0 (0.0%) |
| 1 Vehicle | 26 (38.8%) | 11 (5.9%) |
| 2 Vehicles | 41 (61.2%) | 113 (60.1%) |
| 3 Vehicles | 0 (0.0%) | 64 (34.0%) |
| 4 Vehicles | 0 (0.0%) | 0 (0.0%) |
| 5 or more Vehicles | 0 (0.0%) | 0 (0.0%) |
| Total | 67 (100.0%) | 188 (100.0%) |
Commute Time in Walnut Creek
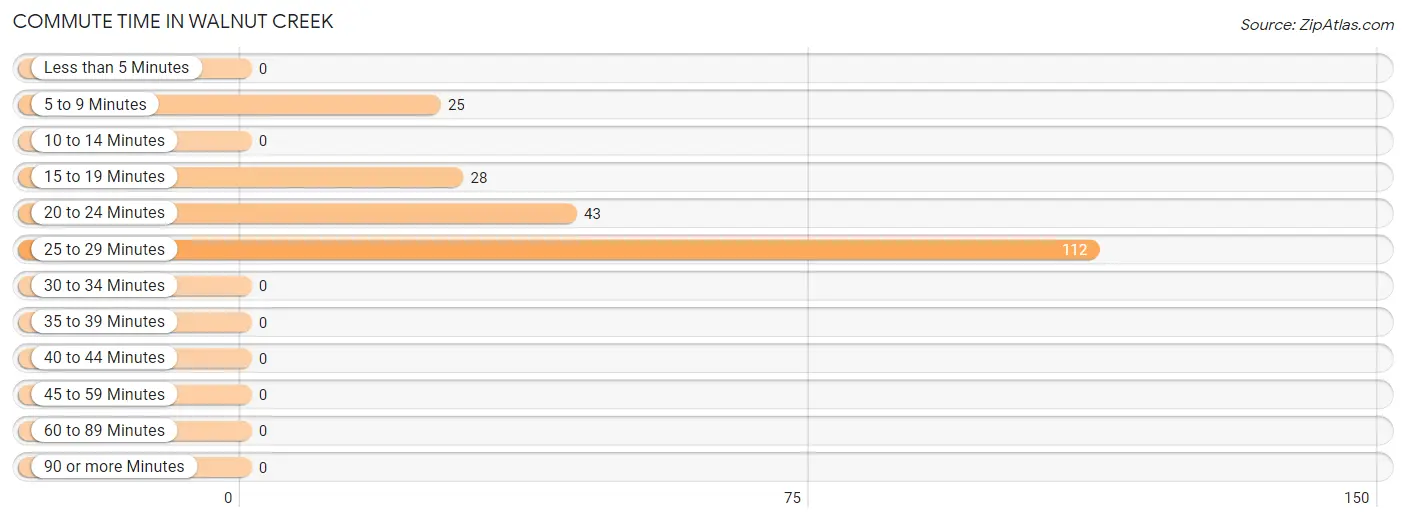
The most frequently occuring commute durations in Walnut Creek are 25 to 29 minutes (112 commuters, 53.8%), 20 to 24 minutes (43 commuters, 20.7%), and 15 to 19 minutes (28 commuters, 13.5%).
| Commute Time | # Commuters | % Commuters |
| Less than 5 Minutes | 0 | 0.0% |
| 5 to 9 Minutes | 25 | 12.0% |
| 10 to 14 Minutes | 0 | 0.0% |
| 15 to 19 Minutes | 28 | 13.5% |
| 20 to 24 Minutes | 43 | 20.7% |
| 25 to 29 Minutes | 112 | 53.8% |
| 30 to 34 Minutes | 0 | 0.0% |
| 35 to 39 Minutes | 0 | 0.0% |
| 40 to 44 Minutes | 0 | 0.0% |
| 45 to 59 Minutes | 0 | 0.0% |
| 60 to 89 Minutes | 0 | 0.0% |
| 90 or more Minutes | 0 | 0.0% |
Commute Time by Sex in Walnut Creek
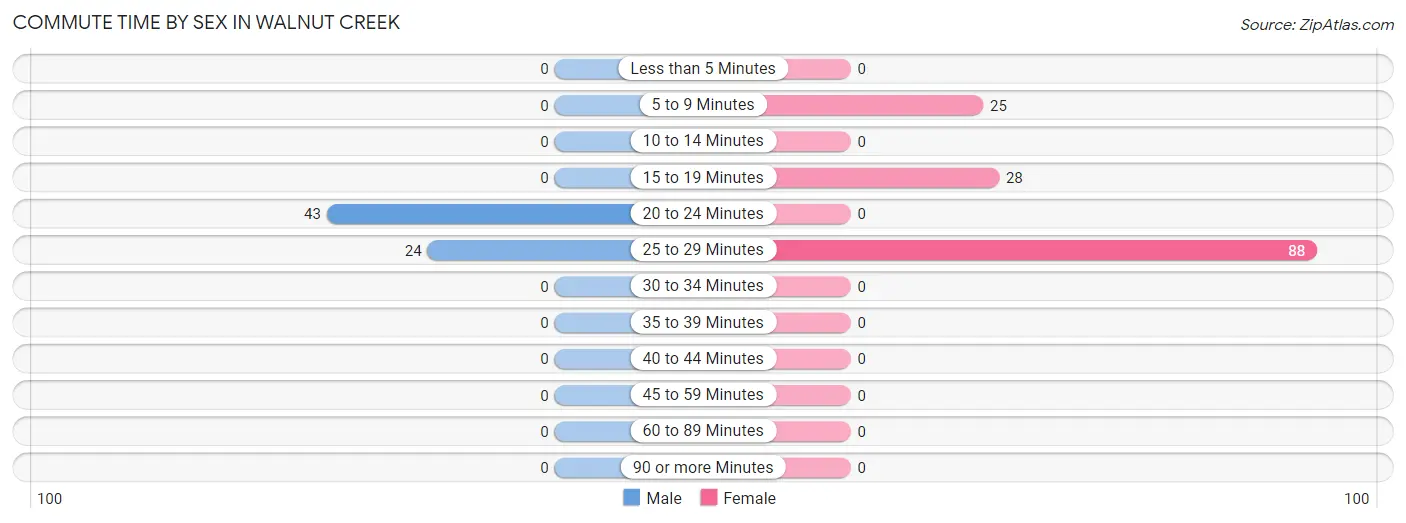
The most common commute times in Walnut Creek are 20 to 24 minutes (43 commuters, 64.2%) for males and 25 to 29 minutes (88 commuters, 62.4%) for females.
| Commute Time | Male | Female |
| Less than 5 Minutes | 0 (0.0%) | 0 (0.0%) |
| 5 to 9 Minutes | 0 (0.0%) | 25 (17.7%) |
| 10 to 14 Minutes | 0 (0.0%) | 0 (0.0%) |
| 15 to 19 Minutes | 0 (0.0%) | 28 (19.9%) |
| 20 to 24 Minutes | 43 (64.2%) | 0 (0.0%) |
| 25 to 29 Minutes | 24 (35.8%) | 88 (62.4%) |
| 30 to 34 Minutes | 0 (0.0%) | 0 (0.0%) |
| 35 to 39 Minutes | 0 (0.0%) | 0 (0.0%) |
| 40 to 44 Minutes | 0 (0.0%) | 0 (0.0%) |
| 45 to 59 Minutes | 0 (0.0%) | 0 (0.0%) |
| 60 to 89 Minutes | 0 (0.0%) | 0 (0.0%) |
| 90 or more Minutes | 0 (0.0%) | 0 (0.0%) |
Time of Departure to Work by Sex in Walnut Creek
The most frequent times of departure to work in Walnut Creek are 12:00 PM to 3:59 PM (26, 38.8%) for males and 7:00 AM to 7:29 AM (67, 47.5%) for females.
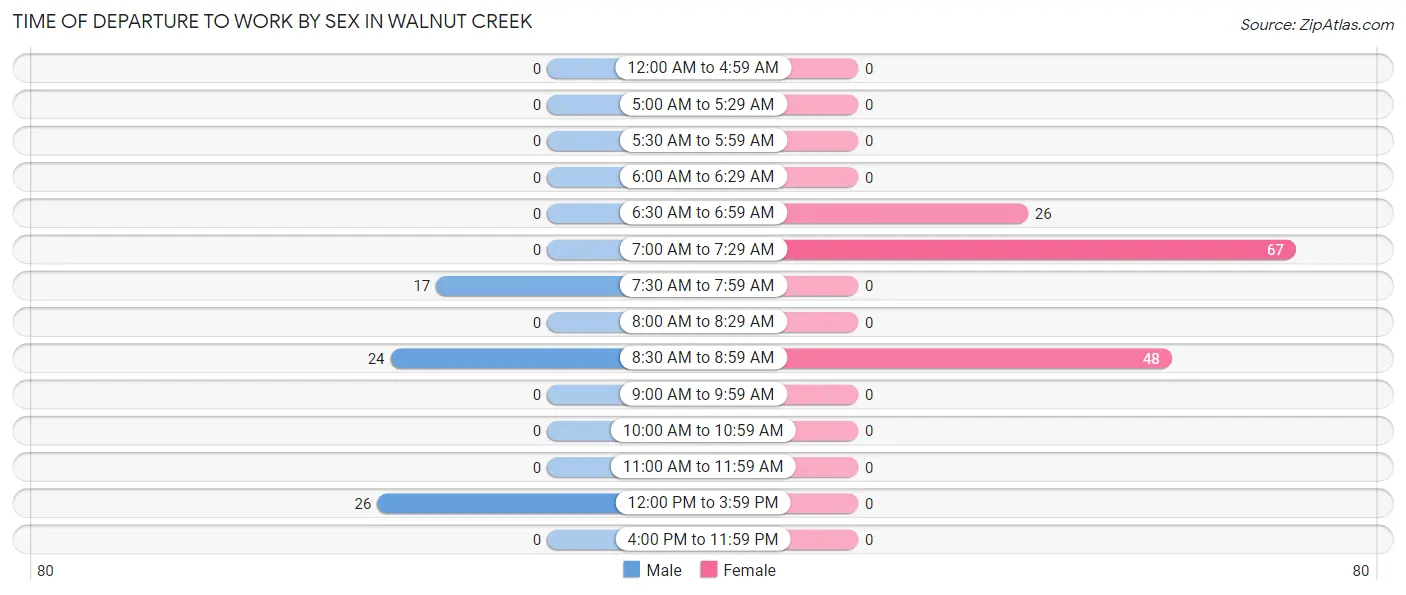
| Time of Departure | Male | Female |
| 12:00 AM to 4:59 AM | 0 (0.0%) | 0 (0.0%) |
| 5:00 AM to 5:29 AM | 0 (0.0%) | 0 (0.0%) |
| 5:30 AM to 5:59 AM | 0 (0.0%) | 0 (0.0%) |
| 6:00 AM to 6:29 AM | 0 (0.0%) | 0 (0.0%) |
| 6:30 AM to 6:59 AM | 0 (0.0%) | 26 (18.4%) |
| 7:00 AM to 7:29 AM | 0 (0.0%) | 67 (47.5%) |
| 7:30 AM to 7:59 AM | 17 (25.4%) | 0 (0.0%) |
| 8:00 AM to 8:29 AM | 0 (0.0%) | 0 (0.0%) |
| 8:30 AM to 8:59 AM | 24 (35.8%) | 48 (34.0%) |
| 9:00 AM to 9:59 AM | 0 (0.0%) | 0 (0.0%) |
| 10:00 AM to 10:59 AM | 0 (0.0%) | 0 (0.0%) |
| 11:00 AM to 11:59 AM | 0 (0.0%) | 0 (0.0%) |
| 12:00 PM to 3:59 PM | 26 (38.8%) | 0 (0.0%) |
| 4:00 PM to 11:59 PM | 0 (0.0%) | 0 (0.0%) |
| Total | 67 (100.0%) | 141 (100.0%) |
Housing Occupancy in Walnut Creek
Occupancy by Ownership in Walnut Creek
Of the total 327 dwellings in Walnut Creek, owner-occupied units account for 301 (92.0%), while renter-occupied units make up 26 (8.0%).
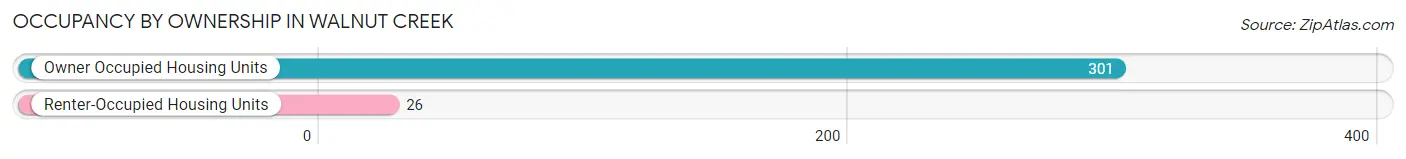
| Occupancy | # Housing Units | % Housing Units |
| Owner Occupied Housing Units | 301 | 92.0% |
| Renter-Occupied Housing Units | 26 | 8.0% |
| Total Occupied Housing Units | 327 | 100.0% |
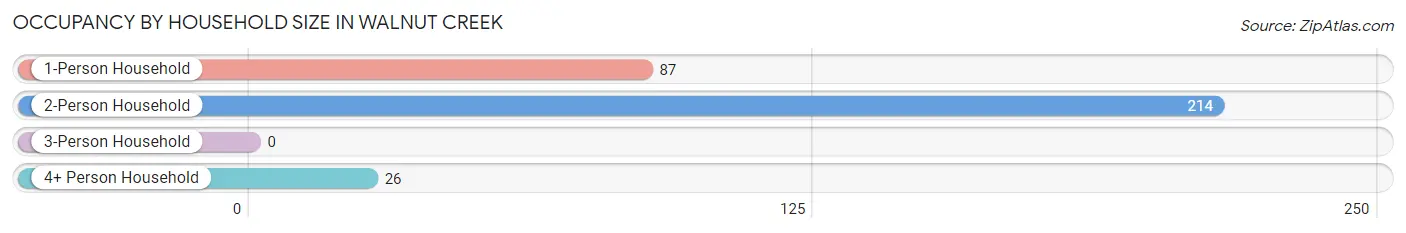
Occupancy by Household Size in Walnut Creek
| Household Size | # Housing Units | % Housing Units |
| 1-Person Household | 87 | 26.6% |
| 2-Person Household | 214 | 65.4% |
| 3-Person Household | 0 | 0.0% |
| 4+ Person Household | 26 | 8.0% |
| Total Housing Units | 327 | 100.0% |
Occupancy by Ownership by Household Size in Walnut Creek

| Household Size | Owner-occupied | Renter-occupied |
| 1-Person Household | 87 (100.0%) | 0 (0.0%) |
| 2-Person Household | 214 (100.0%) | 0 (0.0%) |
| 3-Person Household | 0 (0.0%) | 0 (0.0%) |
| 4+ Person Household | 0 (0.0%) | 26 (100.0%) |
| Total Housing Units | 301 (92.0%) | 26 (8.0%) |
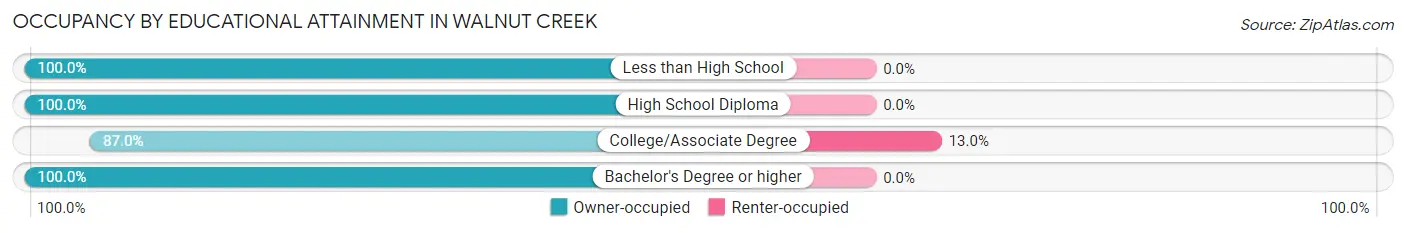
Occupancy by Educational Attainment in Walnut Creek
| Household Size | Owner-occupied | Renter-occupied |
| Less than High School | 25 (100.0%) | 0 (0.0%) |
| High School Diploma | 83 (100.0%) | 0 (0.0%) |
| College/Associate Degree | 174 (87.0%) | 26 (13.0%) |
| Bachelor's Degree or higher | 19 (100.0%) | 0 (0.0%) |
Occupancy by Age of Householder in Walnut Creek
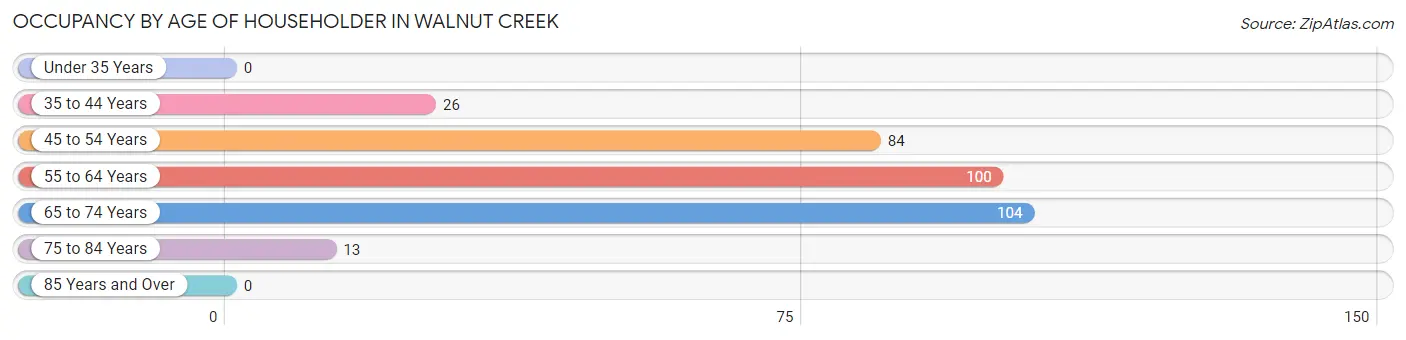
| Age Bracket | # Households | % Households |
| Under 35 Years | 0 | 0.0% |
| 35 to 44 Years | 26 | 8.0% |
| 45 to 54 Years | 84 | 25.7% |
| 55 to 64 Years | 100 | 30.6% |
| 65 to 74 Years | 104 | 31.8% |
| 75 to 84 Years | 13 | 4.0% |
| 85 Years and Over | 0 | 0.0% |
| Total | 327 | 100.0% |
Housing Finances in Walnut Creek
Median Income by Occupancy in Walnut Creek
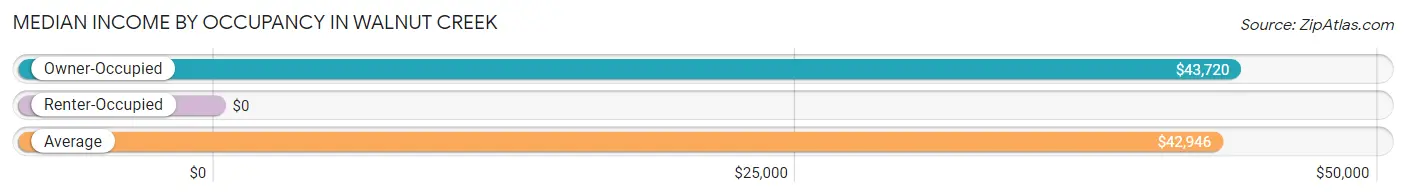
| Occupancy Type | # Households | Median Income |
| Owner-Occupied | 301 (92.0%) | $43,720 |
| Renter-Occupied | 26 (8.0%) | $0 |
| Average | 327 (100.0%) | $42,946 |
Occupancy by Householder Income Bracket in Walnut Creek
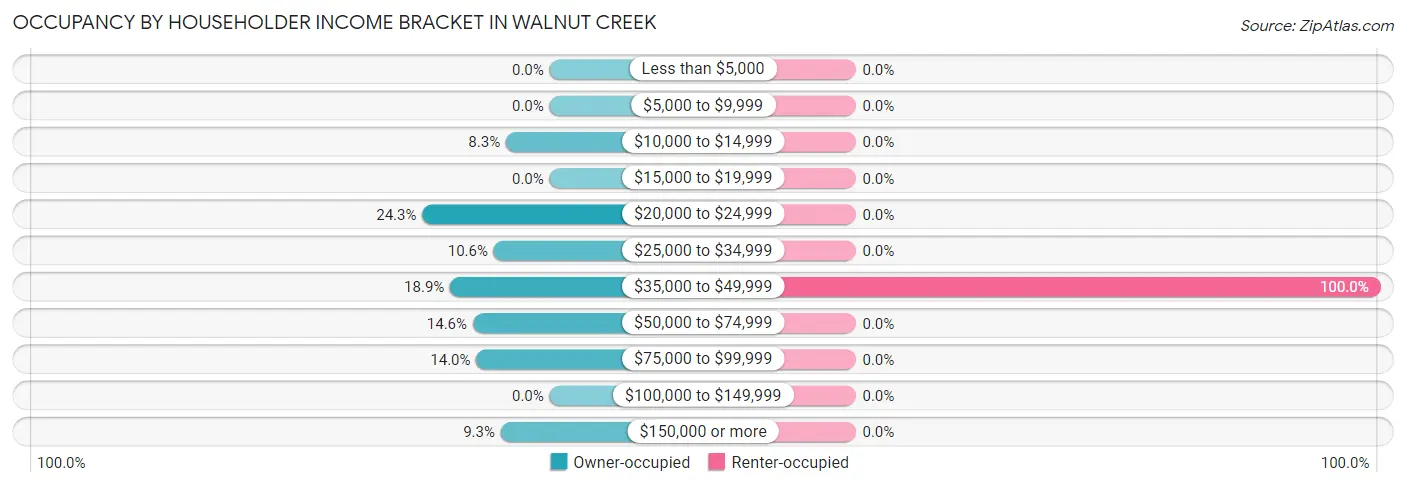
| Income Bracket | Owner-occupied | Renter-occupied |
| Less than $5,000 | 0 (0.0%) | 0 (0.0%) |
| $5,000 to $9,999 | 0 (0.0%) | 0 (0.0%) |
| $10,000 to $14,999 | 25 (8.3%) | 0 (0.0%) |
| $15,000 to $19,999 | 0 (0.0%) | 0 (0.0%) |
| $20,000 to $24,999 | 73 (24.2%) | 0 (0.0%) |
| $25,000 to $34,999 | 32 (10.6%) | 0 (0.0%) |
| $35,000 to $49,999 | 57 (18.9%) | 26 (100.0%) |
| $50,000 to $74,999 | 44 (14.6%) | 0 (0.0%) |
| $75,000 to $99,999 | 42 (14.0%) | 0 (0.0%) |
| $100,000 to $149,999 | 0 (0.0%) | 0 (0.0%) |
| $150,000 or more | 28 (9.3%) | 0 (0.0%) |
| Total | 301 (100.0%) | 26 (100.0%) |
Monthly Housing Cost Tiers in Walnut Creek
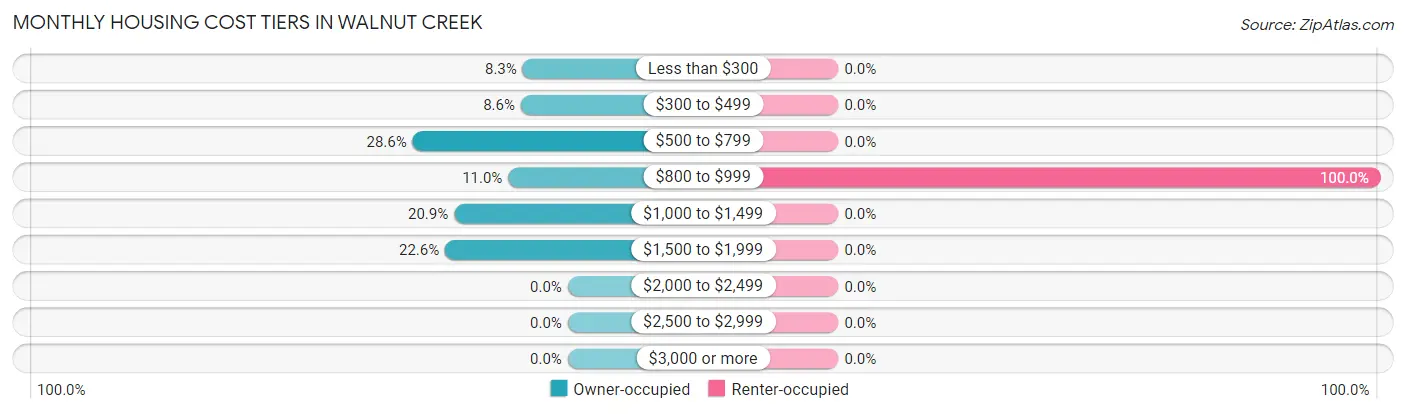
| Monthly Cost | Owner-occupied | Renter-occupied |
| Less than $300 | 25 (8.3%) | 0 (0.0%) |
| $300 to $499 | 26 (8.6%) | 0 (0.0%) |
| $500 to $799 | 86 (28.6%) | 0 (0.0%) |
| $800 to $999 | 33 (11.0%) | 26 (100.0%) |
| $1,000 to $1,499 | 63 (20.9%) | 0 (0.0%) |
| $1,500 to $1,999 | 68 (22.6%) | 0 (0.0%) |
| $2,000 to $2,499 | 0 (0.0%) | 0 (0.0%) |
| $2,500 to $2,999 | 0 (0.0%) | 0 (0.0%) |
| $3,000 or more | 0 (0.0%) | 0 (0.0%) |
| Total | 301 (100.0%) | 26 (100.0%) |
Physical Housing Characteristics in Walnut Creek
Housing Structures in Walnut Creek
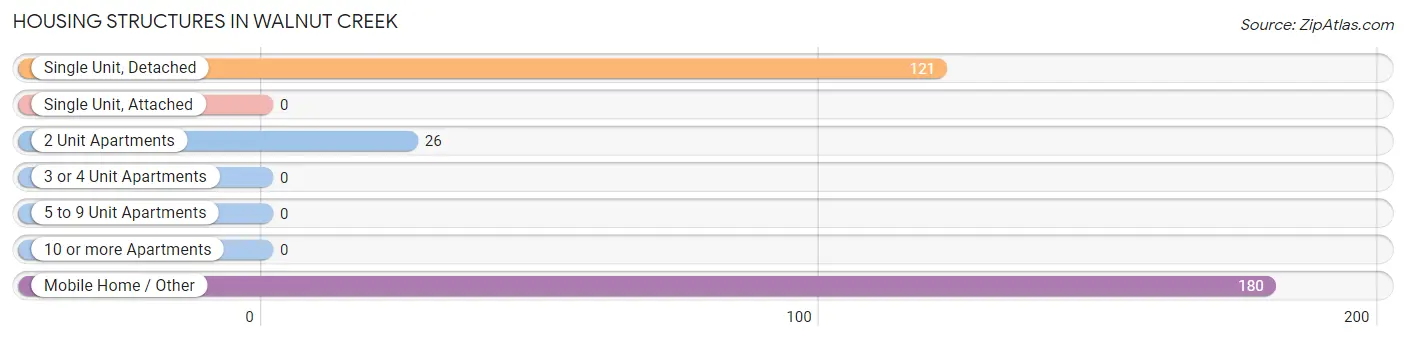
| Structure Type | # Housing Units | % Housing Units |
| Single Unit, Detached | 121 | 37.0% |
| Single Unit, Attached | 0 | 0.0% |
| 2 Unit Apartments | 26 | 8.0% |
| 3 or 4 Unit Apartments | 0 | 0.0% |
| 5 to 9 Unit Apartments | 0 | 0.0% |
| 10 or more Apartments | 0 | 0.0% |
| Mobile Home / Other | 180 | 55.0% |
| Total | 327 | 100.0% |
Housing Structures by Occupancy in Walnut Creek
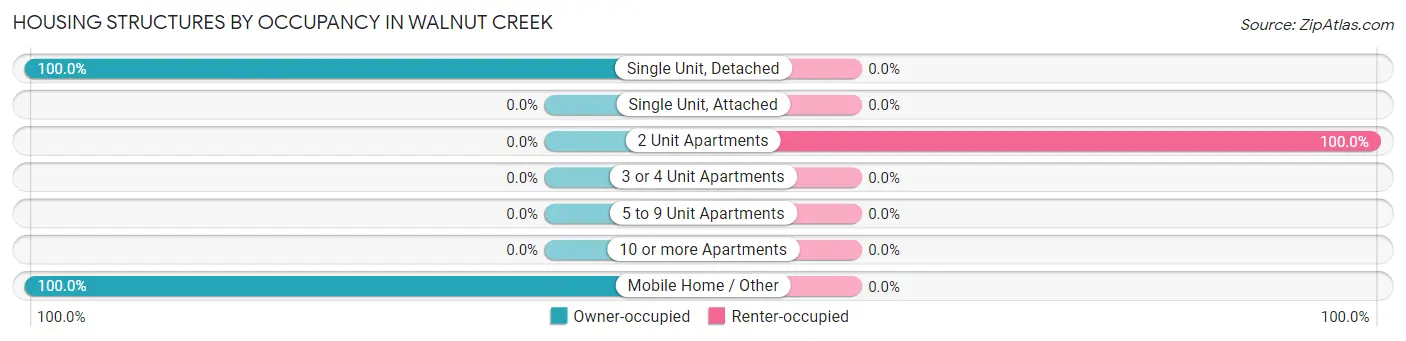
| Structure Type | Owner-occupied | Renter-occupied |
| Single Unit, Detached | 121 (100.0%) | 0 (0.0%) |
| Single Unit, Attached | 0 (0.0%) | 0 (0.0%) |
| 2 Unit Apartments | 0 (0.0%) | 26 (100.0%) |
| 3 or 4 Unit Apartments | 0 (0.0%) | 0 (0.0%) |
| 5 to 9 Unit Apartments | 0 (0.0%) | 0 (0.0%) |
| 10 or more Apartments | 0 (0.0%) | 0 (0.0%) |
| Mobile Home / Other | 180 (100.0%) | 0 (0.0%) |
| Total | 301 (92.0%) | 26 (8.0%) |
Housing Structures by Number of Rooms in Walnut Creek
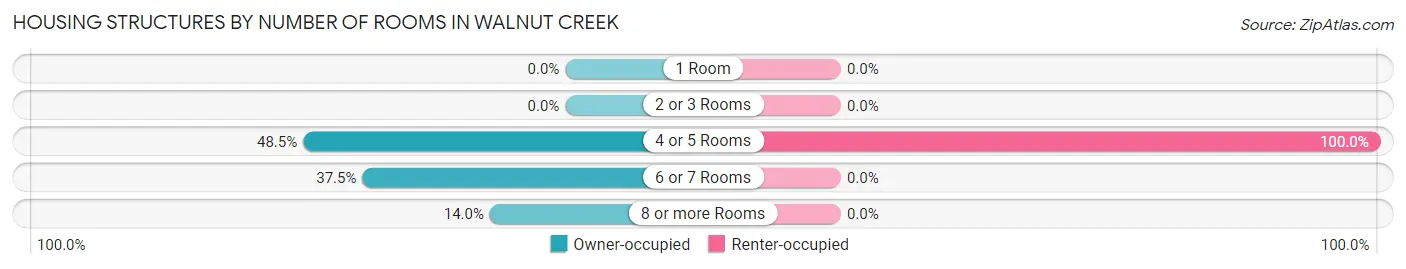
| Number of Rooms | Owner-occupied | Renter-occupied |
| 1 Room | 0 (0.0%) | 0 (0.0%) |
| 2 or 3 Rooms | 0 (0.0%) | 0 (0.0%) |
| 4 or 5 Rooms | 146 (48.5%) | 26 (100.0%) |
| 6 or 7 Rooms | 113 (37.5%) | 0 (0.0%) |
| 8 or more Rooms | 42 (14.0%) | 0 (0.0%) |
| Total | 301 (100.0%) | 26 (100.0%) |
Housing Structure by Heating Type in Walnut Creek
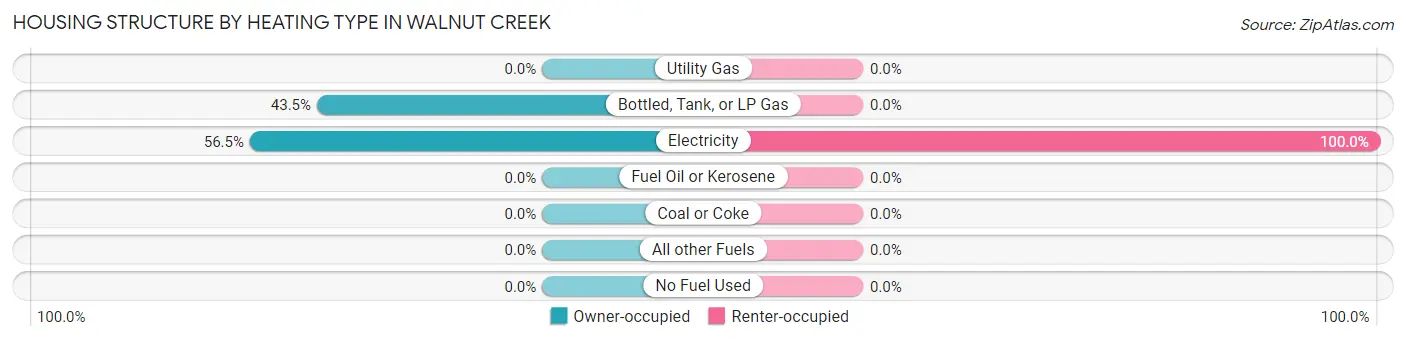
| Heating Type | Owner-occupied | Renter-occupied |
| Utility Gas | 0 (0.0%) | 0 (0.0%) |
| Bottled, Tank, or LP Gas | 131 (43.5%) | 0 (0.0%) |
| Electricity | 170 (56.5%) | 26 (100.0%) |
| Fuel Oil or Kerosene | 0 (0.0%) | 0 (0.0%) |
| Coal or Coke | 0 (0.0%) | 0 (0.0%) |
| All other Fuels | 0 (0.0%) | 0 (0.0%) |
| No Fuel Used | 0 (0.0%) | 0 (0.0%) |
| Total | 301 (100.0%) | 26 (100.0%) |
Household Vehicle Usage in Walnut Creek
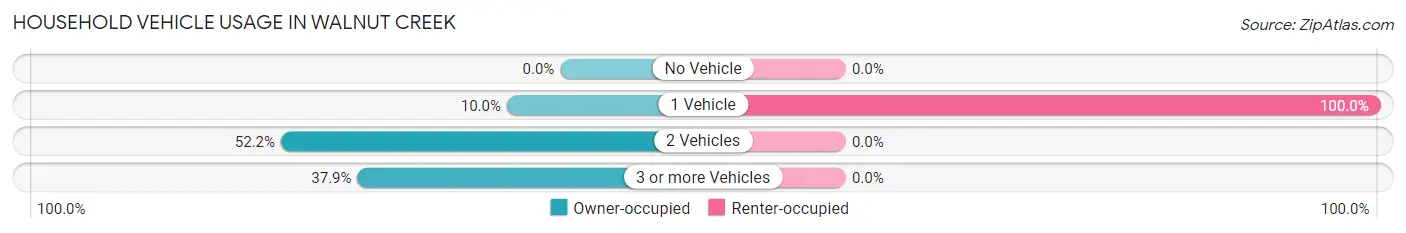
| Vehicles per Household | Owner-occupied | Renter-occupied |
| No Vehicle | 0 (0.0%) | 0 (0.0%) |
| 1 Vehicle | 30 (10.0%) | 26 (100.0%) |
| 2 Vehicles | 157 (52.2%) | 0 (0.0%) |
| 3 or more Vehicles | 114 (37.9%) | 0 (0.0%) |
| Total | 301 (100.0%) | 26 (100.0%) |
Real Estate & Mortgages in Walnut Creek
Real Estate and Mortgage Overview in Walnut Creek
| Characteristic | Without Mortgage | With Mortgage |
| Housing Units | 105 | 196 |
| Median Property Value | $261,600 | $185,600 |
| Median Household Income | $21,273 | $28 |
| Monthly Housing Costs | $503 | $0 |
| Real Estate Taxes | - | - |
Property Value by Mortgage Status in Walnut Creek
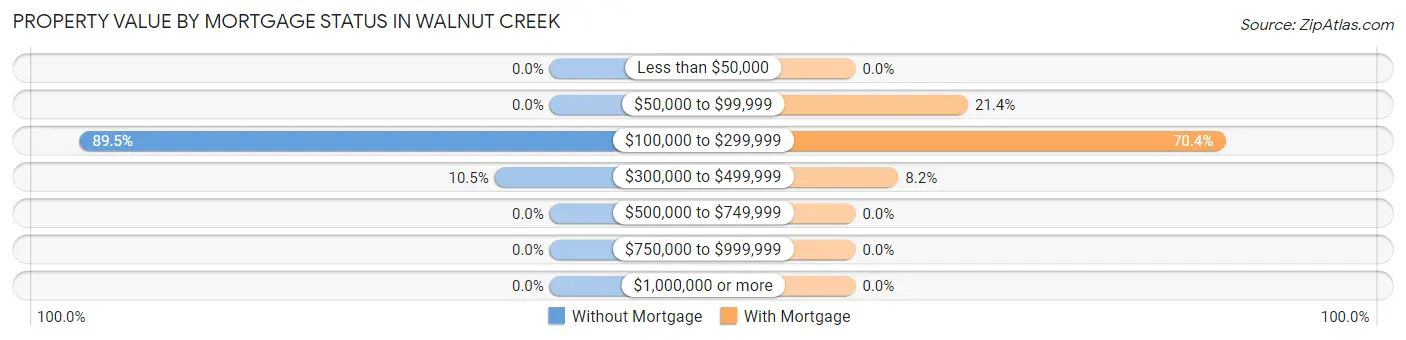
| Property Value | Without Mortgage | With Mortgage |
| Less than $50,000 | 0 (0.0%) | 0 (0.0%) |
| $50,000 to $99,999 | 0 (0.0%) | 42 (21.4%) |
| $100,000 to $299,999 | 94 (89.5%) | 138 (70.4%) |
| $300,000 to $499,999 | 11 (10.5%) | 16 (8.2%) |
| $500,000 to $749,999 | 0 (0.0%) | 0 (0.0%) |
| $750,000 to $999,999 | 0 (0.0%) | 0 (0.0%) |
| $1,000,000 or more | 0 (0.0%) | 0 (0.0%) |
| Total | 105 (100.0%) | 196 (100.0%) |
Household Income by Mortgage Status in Walnut Creek
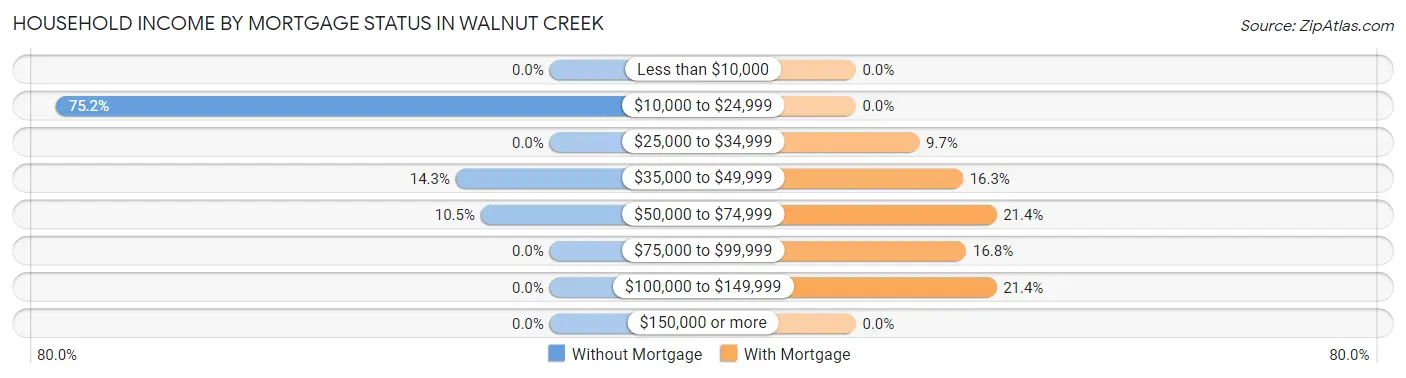
| Household Income | Without Mortgage | With Mortgage |
| Less than $10,000 | 0 (0.0%) | 0 (0.0%) |
| $10,000 to $24,999 | 79 (75.2%) | 0 (0.0%) |
| $25,000 to $34,999 | 0 (0.0%) | 19 (9.7%) |
| $35,000 to $49,999 | 15 (14.3%) | 32 (16.3%) |
| $50,000 to $74,999 | 11 (10.5%) | 42 (21.4%) |
| $75,000 to $99,999 | 0 (0.0%) | 33 (16.8%) |
| $100,000 to $149,999 | 0 (0.0%) | 42 (21.4%) |
| $150,000 or more | 0 (0.0%) | 0 (0.0%) |
| Total | 105 (100.0%) | 196 (100.0%) |
Property Value to Household Income Ratio in Walnut Creek
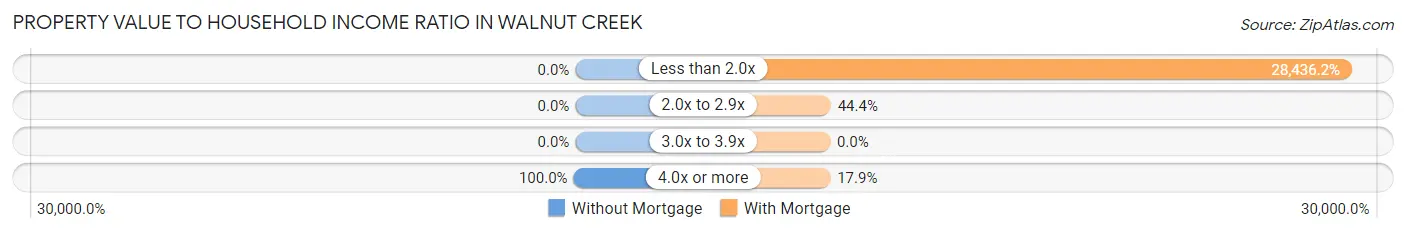
| Value-to-Income Ratio | Without Mortgage | With Mortgage |
| Less than 2.0x | 0 (0.0%) | 55,735 (28,436.2%) |
| 2.0x to 2.9x | 0 (0.0%) | 87 (44.4%) |
| 3.0x to 3.9x | 0 (0.0%) | 0 (0.0%) |
| 4.0x or more | 105 (100.0%) | 35 (17.9%) |
| Total | 105 (100.0%) | 196 (100.0%) |
Real Estate Taxes by Mortgage Status in Walnut Creek
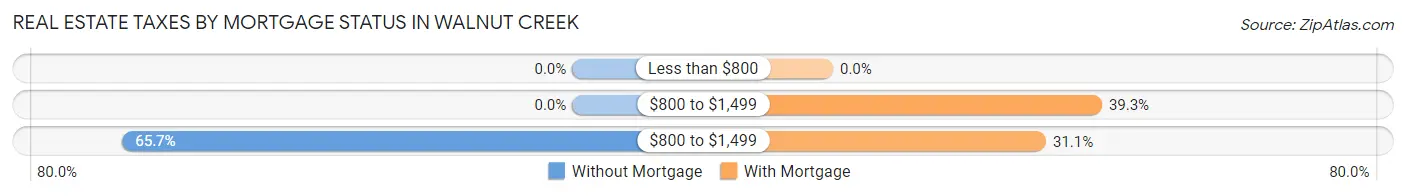
| Property Taxes | Without Mortgage | With Mortgage |
| Less than $800 | 0 (0.0%) | 0 (0.0%) |
| $800 to $1,499 | 0 (0.0%) | 77 (39.3%) |
| $800 to $1,499 | 69 (65.7%) | 61 (31.1%) |
| Total | 105 (100.0%) | 196 (100.0%) |
Health & Disability in Walnut Creek
Health Insurance Coverage by Age in Walnut Creek
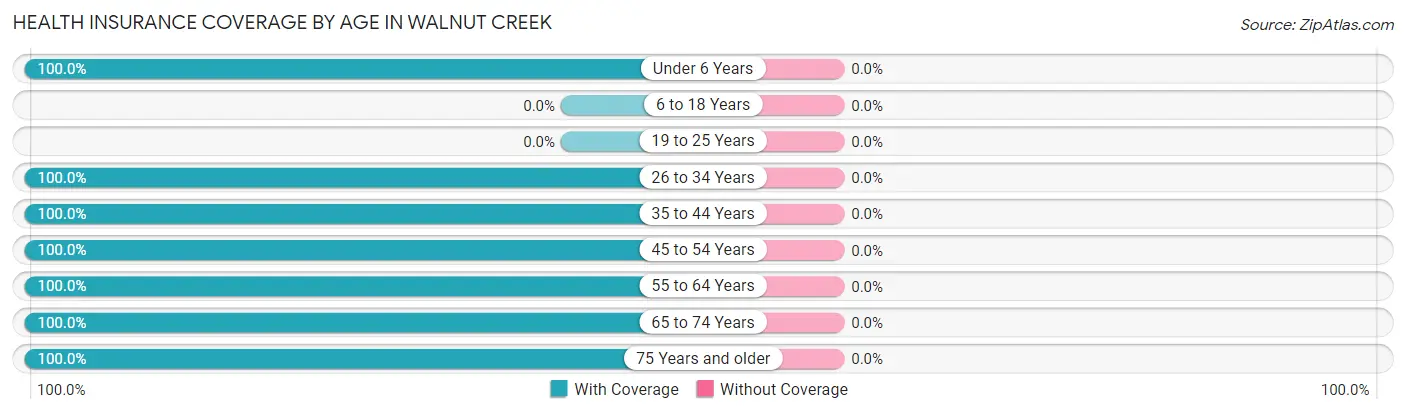
| Age Bracket | With Coverage | Without Coverage |
| Under 6 Years | 77 (100.0%) | 0 (0.0%) |
| 6 to 18 Years | 0 (0.0%) | 0 (0.0%) |
| 19 to 25 Years | 0 (0.0%) | 0 (0.0%) |
| 26 to 34 Years | 74 (100.0%) | 0 (0.0%) |
| 35 to 44 Years | 49 (100.0%) | 0 (0.0%) |
| 45 to 54 Years | 144 (100.0%) | 0 (0.0%) |
| 55 to 64 Years | 100 (100.0%) | 0 (0.0%) |
| 65 to 74 Years | 185 (100.0%) | 0 (0.0%) |
| 75 Years and older | 13 (100.0%) | 0 (0.0%) |
| Total | 642 (100.0%) | 0 (0.0%) |
Health Insurance Coverage by Citizenship Status in Walnut Creek
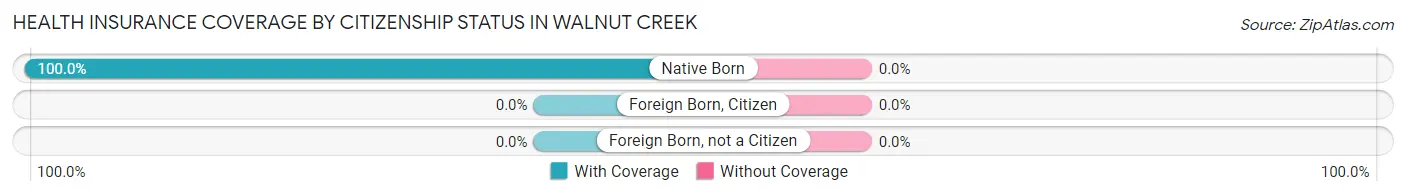
| Citizenship Status | With Coverage | Without Coverage |
| Native Born | 77 (100.0%) | 0 (0.0%) |
| Foreign Born, Citizen | 0 (0.0%) | 0 (0.0%) |
| Foreign Born, not a Citizen | 0 (0.0%) | 0 (0.0%) |
Health Insurance Coverage by Household Income in Walnut Creek
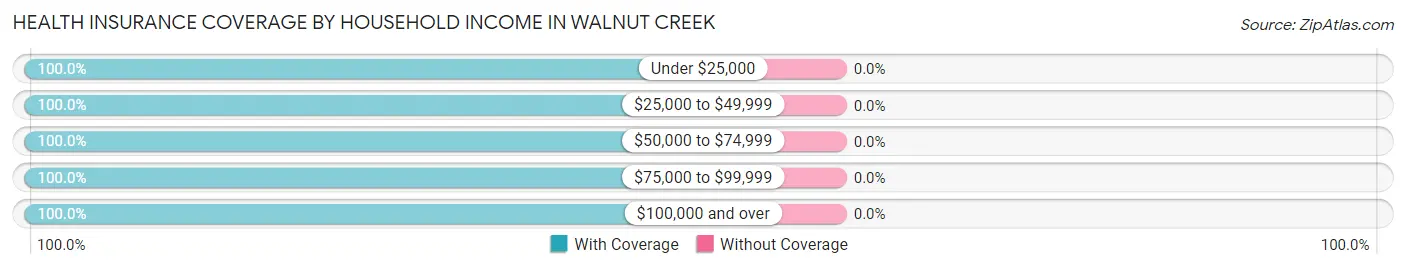
| Household Income | With Coverage | Without Coverage |
| Under $25,000 | 167 (100.0%) | 0 (0.0%) |
| $25,000 to $49,999 | 241 (100.0%) | 0 (0.0%) |
| $50,000 to $74,999 | 81 (100.0%) | 0 (0.0%) |
| $75,000 to $99,999 | 89 (100.0%) | 0 (0.0%) |
| $100,000 and over | 64 (100.0%) | 0 (0.0%) |
Public vs Private Health Insurance Coverage by Age in Walnut Creek
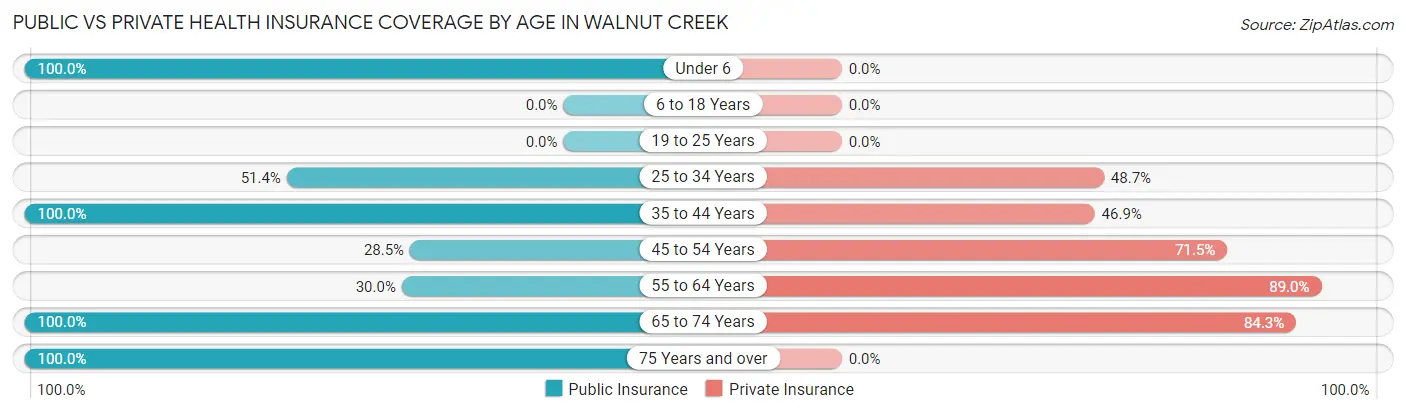
| Age Bracket | Public Insurance | Private Insurance |
| Under 6 | 77 (100.0%) | 0 (0.0%) |
| 6 to 18 Years | 0 (0.0%) | 0 (0.0%) |
| 19 to 25 Years | 0 (0.0%) | 0 (0.0%) |
| 25 to 34 Years | 38 (51.3%) | 36 (48.6%) |
| 35 to 44 Years | 49 (100.0%) | 23 (46.9%) |
| 45 to 54 Years | 41 (28.5%) | 103 (71.5%) |
| 55 to 64 Years | 30 (30.0%) | 89 (89.0%) |
| 65 to 74 Years | 185 (100.0%) | 156 (84.3%) |
| 75 Years and over | 13 (100.0%) | 0 (0.0%) |
| Total | 433 (67.4%) | 407 (63.4%) |
Disability Status by Sex by Age in Walnut Creek
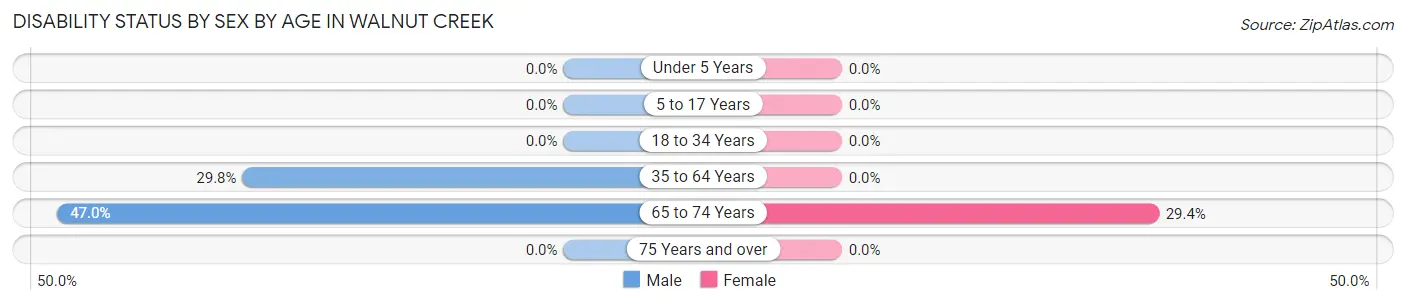
| Age Bracket | Male | Female |
| Under 5 Years | 0 (0.0%) | 0 (0.0%) |
| 5 to 17 Years | 0 (0.0%) | 0 (0.0%) |
| 18 to 34 Years | 0 (0.0%) | 0 (0.0%) |
| 35 to 64 Years | 42 (29.8%) | 0 (0.0%) |
| 65 to 74 Years | 31 (47.0%) | 35 (29.4%) |
| 75 Years and over | 0 (0.0%) | 0 (0.0%) |
Disability Class by Sex by Age in Walnut Creek
Disability Class: Hearing Difficulty
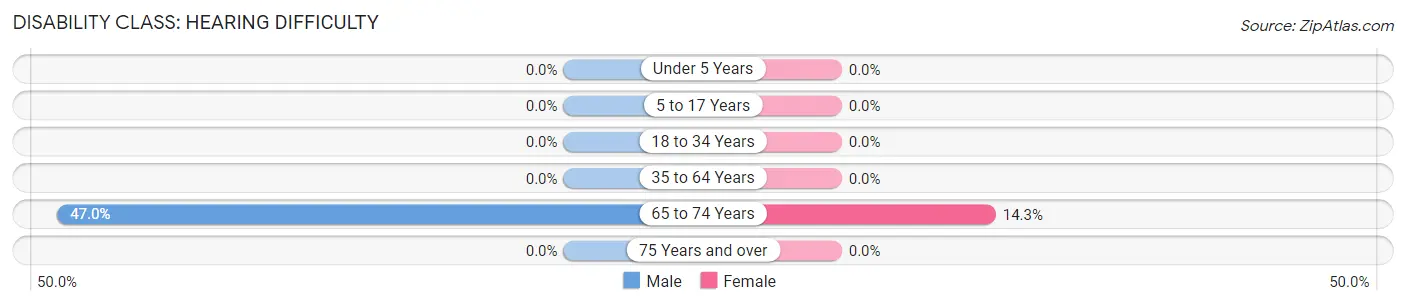
| Age Bracket | Male | Female |
| Under 5 Years | 0 (0.0%) | 0 (0.0%) |
| 5 to 17 Years | 0 (0.0%) | 0 (0.0%) |
| 18 to 34 Years | 0 (0.0%) | 0 (0.0%) |
| 35 to 64 Years | 0 (0.0%) | 0 (0.0%) |
| 65 to 74 Years | 31 (47.0%) | 17 (14.3%) |
| 75 Years and over | 0 (0.0%) | 0 (0.0%) |
Disability Class: Vision Difficulty
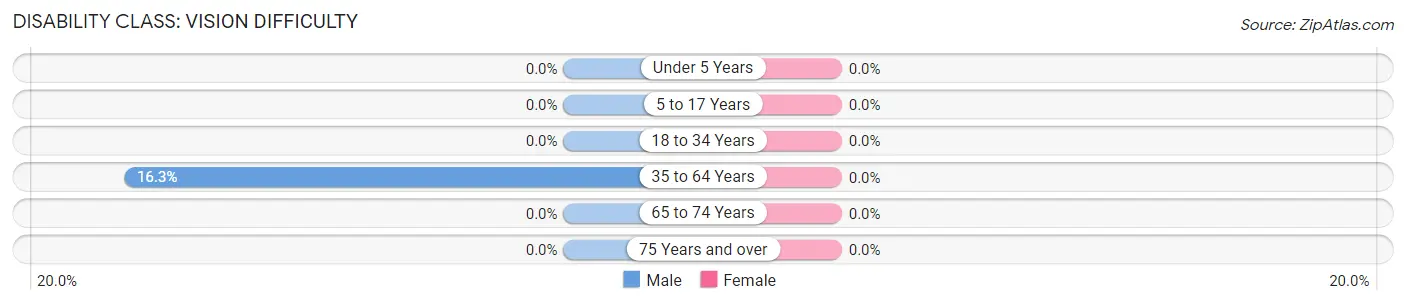
| Age Bracket | Male | Female |
| Under 5 Years | 0 (0.0%) | 0 (0.0%) |
| 5 to 17 Years | 0 (0.0%) | 0 (0.0%) |
| 18 to 34 Years | 0 (0.0%) | 0 (0.0%) |
| 35 to 64 Years | 23 (16.3%) | 0 (0.0%) |
| 65 to 74 Years | 0 (0.0%) | 0 (0.0%) |
| 75 Years and over | 0 (0.0%) | 0 (0.0%) |
Disability Class: Cognitive Difficulty

| Age Bracket | Male | Female |
| 5 to 17 Years | 0 (0.0%) | 0 (0.0%) |
| 18 to 34 Years | 0 (0.0%) | 0 (0.0%) |
| 35 to 64 Years | 42 (29.8%) | 0 (0.0%) |
| 65 to 74 Years | 16 (24.2%) | 35 (29.4%) |
| 75 Years and over | 0 (0.0%) | 0 (0.0%) |
Disability Class: Ambulatory Difficulty
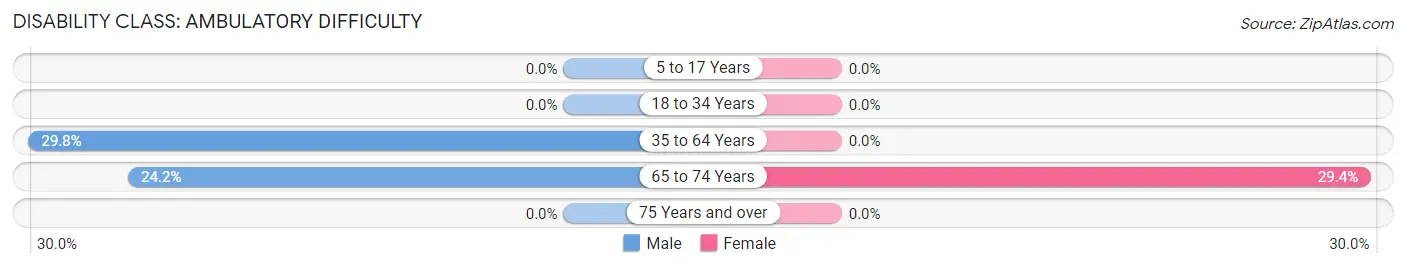
| Age Bracket | Male | Female |
| 5 to 17 Years | 0 (0.0%) | 0 (0.0%) |
| 18 to 34 Years | 0 (0.0%) | 0 (0.0%) |
| 35 to 64 Years | 42 (29.8%) | 0 (0.0%) |
| 65 to 74 Years | 16 (24.2%) | 35 (29.4%) |
| 75 Years and over | 0 (0.0%) | 0 (0.0%) |
Disability Class: Self-Care Difficulty
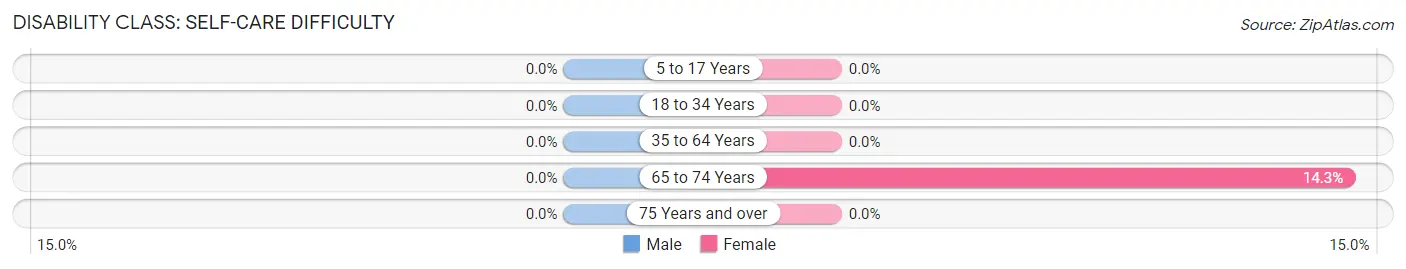
| Age Bracket | Male | Female |
| 5 to 17 Years | 0 (0.0%) | 0 (0.0%) |
| 18 to 34 Years | 0 (0.0%) | 0 (0.0%) |
| 35 to 64 Years | 0 (0.0%) | 0 (0.0%) |
| 65 to 74 Years | 0 (0.0%) | 17 (14.3%) |
| 75 Years and over | 0 (0.0%) | 0 (0.0%) |
Technology Access in Walnut Creek
Computing Device Access in Walnut Creek
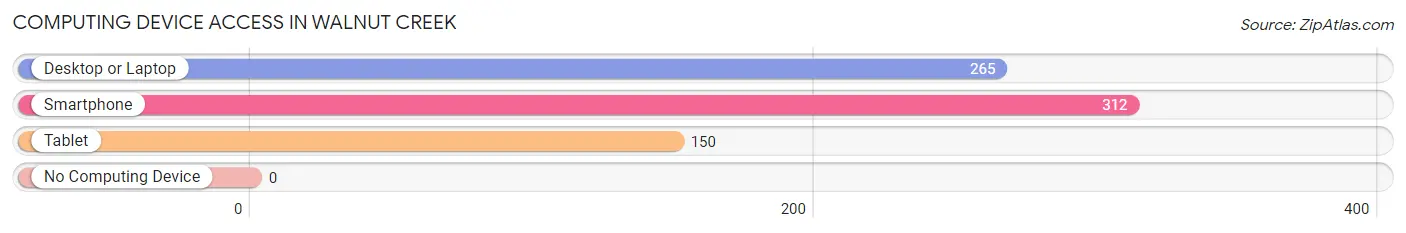
| Device Type | # Households | % Households |
| Desktop or Laptop | 265 | 81.0% |
| Smartphone | 312 | 95.4% |
| Tablet | 150 | 45.9% |
| No Computing Device | 0 | 0.0% |
| Total | 327 | 100.0% |
Internet Access in Walnut Creek
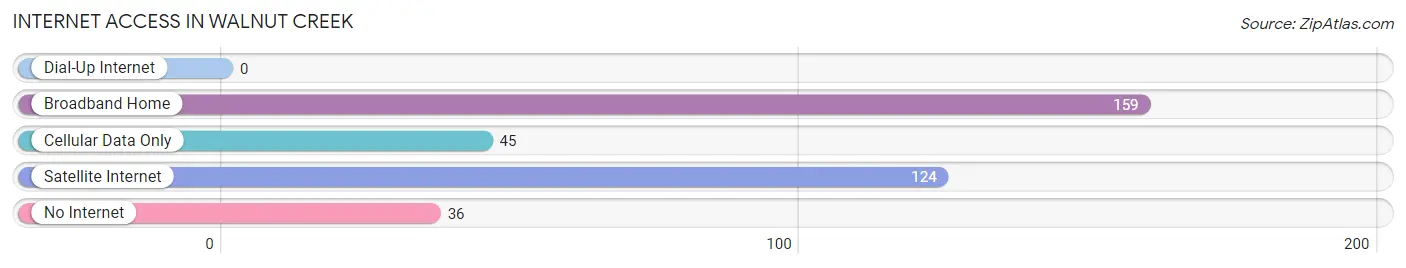
| Internet Type | # Households | % Households |
| Dial-Up Internet | 0 | 0.0% |
| Broadband Home | 159 | 48.6% |
| Cellular Data Only | 45 | 13.8% |
| Satellite Internet | 124 | 37.9% |
| No Internet | 36 | 11.0% |
| Total | 327 | 100.0% |
Walnut Creek Summary
Walnut Creek, Arizona is a small unincorporated community located in the White Mountains of Arizona. It is situated in Navajo County, approximately 30 miles east of Show Low and 40 miles west of Springerville. The community is located at an elevation of 6,400 feet and is surrounded by the Apache-Sitgreaves National Forest.
History
The area around Walnut Creek was first settled by the Navajo people in the late 1800s. The first non-Native American settlers arrived in the area in the early 1900s. The community was originally known as “Walnut Creek Crossing” and was named after the creek that runs through the area. The creek was named for the abundance of walnut trees that grew along its banks.
In the early 1900s, the area was home to a number of small farms and ranches. The community was also home to a small sawmill and a general store. The sawmill was owned by the local ranchers and was used to cut lumber for the construction of homes and other buildings.
In the 1950s, the area began to experience a population boom as people moved to the area to take advantage of the area’s natural beauty and recreational opportunities. The population of Walnut Creek grew to over 500 people by the 1970s.
Geography
Walnut Creek is located in the White Mountains of Arizona. The area is characterized by rolling hills, pine forests, and meadows. The area is also home to a number of lakes, streams, and rivers. The climate in the area is semi-arid, with hot summers and cold winters.
The area around Walnut Creek is home to a variety of wildlife, including deer, elk, bear, mountain lions, and a variety of birds. The area is also home to a number of endangered species, including the Mexican spotted owl and the Apache trout.
Economy
The economy of Walnut Creek is largely based on tourism and recreation. The area is home to a number of resorts, campgrounds, and other recreational facilities. The area is also home to a number of small businesses, including restaurants, stores, and other services.
The area is also home to a number of logging and timber companies. The timber industry is an important part of the local economy, as it provides jobs and income for many of the area’s residents.
Demographics
As of the 2010 census, the population of Walnut Creek was 545. The population is largely white (90.2%), with a small percentage of Native American (4.2%) and Hispanic (3.3%) residents. The median household income in the area is $37,500.
Conclusion
Walnut Creek, Arizona is a small unincorporated community located in the White Mountains of Arizona. The area is characterized by rolling hills, pine forests, and meadows. The economy of the area is largely based on tourism and recreation, as well as logging and timber. The population of Walnut Creek is largely white, with a small percentage of Native American and Hispanic residents.
Common Questions
What is the Total Population of Walnut Creek?
Total Population of Walnut Creek is 642.
What is the Total Male Population of Walnut Creek?
Total Male Population of Walnut Creek is 297.
What is the Total Female Population of Walnut Creek?
Total Female Population of Walnut Creek is 345.
What is the Ratio of Males per 100 Females in Walnut Creek?
There are 86.09 Males per 100 Females in Walnut Creek.
What is the Ratio of Females per 100 Males in Walnut Creek?
There are 116.16 Females per 100 Males in Walnut Creek.
What is the Median Population Age in Walnut Creek?
Median Population Age in Walnut Creek is 53.4 Years.
What is the Average Family Size in Walnut Creek
Average Family Size in Walnut Creek is 2.4 People.
What is the Average Household Size in Walnut Creek
Average Household Size in Walnut Creek is 2.0 People.
What is Per Capita Income in Walnut Creek?
Per Capita income in Walnut Creek is $26,977.
What is the Median Household income in Walnut Creek?
Median Household Income in Walnut Creek is $42,946.
What is Income or Wage Gap in Walnut Creek?
Income or Wage Gap in Walnut Creek is 21.6%.
Women in Walnut Creek earn 78.4 cents for every dollar earned by a man.
What is Inequality or Gini Index in Walnut Creek?
Inequality or Gini Index in Walnut Creek is 0.37.
How Large is the Labor Force in Walnut Creek?
There are 255 People in the Labor Forcein in Walnut Creek.
What is the Percentage of People in the Labor Force in Walnut Creek?
45.1% of People are in the Labor Force in Walnut Creek.