Eagar, AZ
Eagar Map
Eagar Overview
4,425
TOTAL POPULATION
2,386
MALE POPULATION
2,039
FEMALE POPULATION
117.02
MALES / 100 FEMALES
85.46
FEMALES / 100 MALES
38.9
MEDIAN AGE
3.3
AVG FAMILY SIZE
2.9
AVG HOUSEHOLD SIZE
$31,827
PER CAPITA INCOME
$89,260
AVG FAMILY INCOME
$82,538
AVG HOUSEHOLD INCOME
16.9%
WAGE / INCOME GAP [ % ]
83.1¢/ $1
WAGE / INCOME GAP [ $ ]
0.37
INEQUALITY / GINI INDEX
1,608
LABOR FORCE [ PEOPLE ]
47.3%
PERCENT IN LABOR FORCE
0.9%
UNEMPLOYMENT RATE
Eagar Zip Codes
Eagar Area Codes
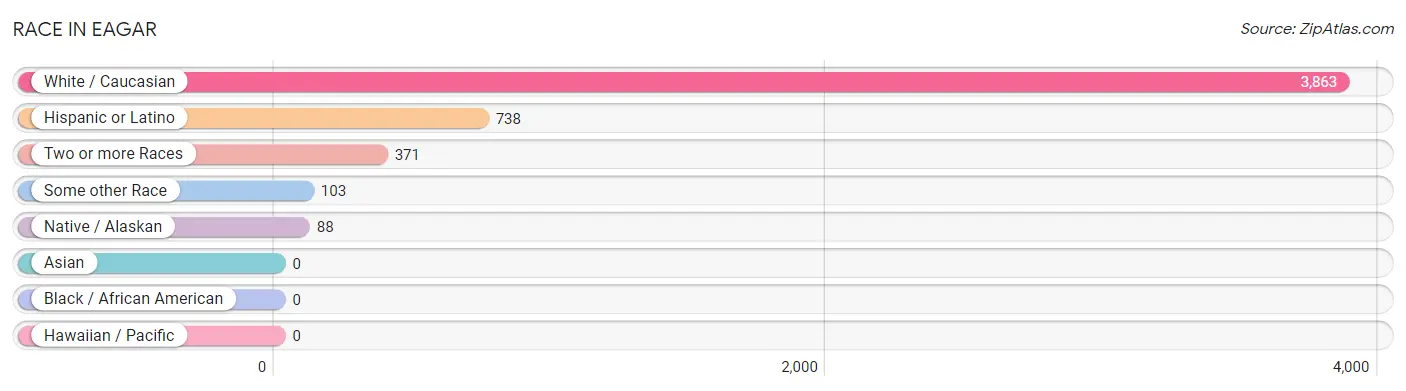
Race in Eagar
The most populous races in Eagar are White / Caucasian (3,863 | 87.3%), Hispanic or Latino (738 | 16.7%), and Two or more Races (371 | 8.4%).
| Race | # Population | % Population |
| Asian | 0 | 0.0% |
| Black / African American | 0 | 0.0% |
| Hawaiian / Pacific | 0 | 0.0% |
| Hispanic or Latino | 738 | 16.7% |
| Native / Alaskan | 88 | 2.0% |
| White / Caucasian | 3,863 | 87.3% |
| Two or more Races | 371 | 8.4% |
| Some other Race | 103 | 2.3% |
| Total | 4,425 | 100.0% |
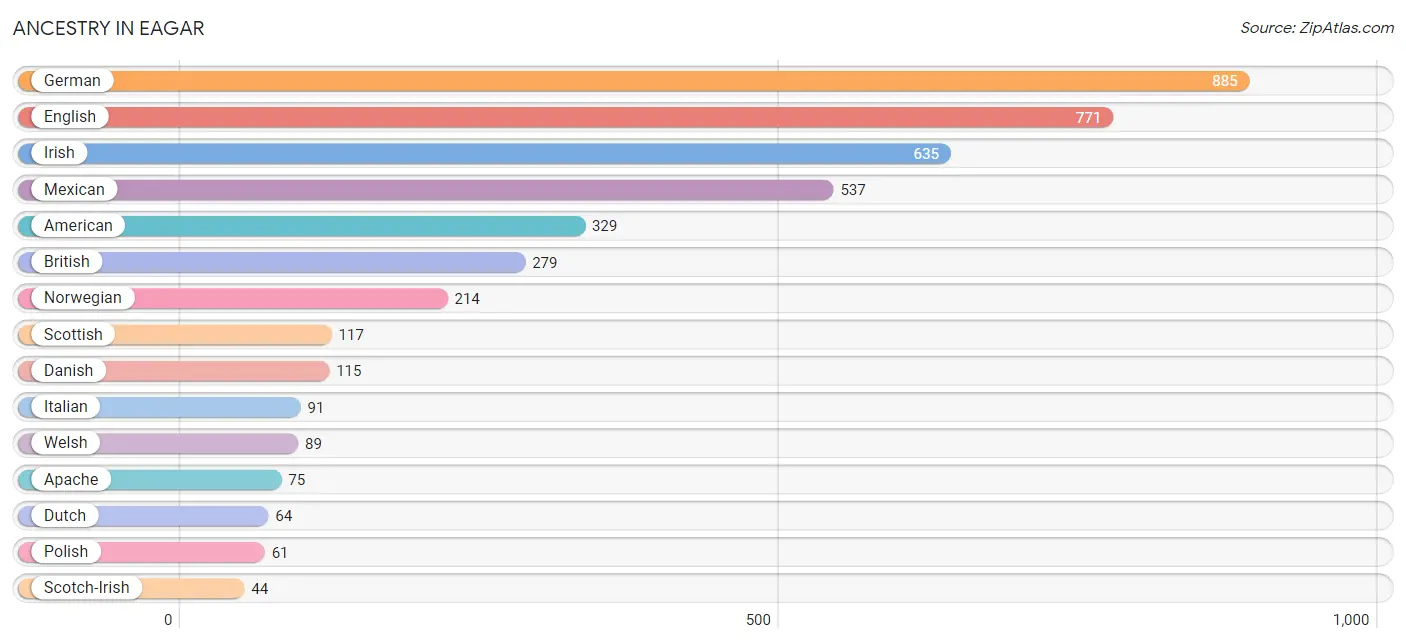
Ancestry in Eagar
The most populous ancestries reported in Eagar are German (885 | 20.0%), English (771 | 17.4%), Irish (635 | 14.3%), Mexican (537 | 12.1%), and American (329 | 7.4%), together accounting for 71.3% of all Eagar residents.
| Ancestry | # Population | % Population |
| American | 329 | 7.4% |
| Apache | 75 | 1.7% |
| Austrian | 6 | 0.1% |
| British | 279 | 6.3% |
| Canadian | 16 | 0.4% |
| Choctaw | 3 | 0.1% |
| Cuban | 18 | 0.4% |
| Danish | 115 | 2.6% |
| Dutch | 64 | 1.5% |
| Eastern European | 15 | 0.3% |
| English | 771 | 17.4% |
| French Canadian | 32 | 0.7% |
| German | 885 | 20.0% |
| Irish | 635 | 14.3% |
| Italian | 91 | 2.1% |
| Mexican | 537 | 12.1% |
| Navajo | 4 | 0.1% |
| Nigerian | 30 | 0.7% |
| Northern European | 43 | 1.0% |
| Norwegian | 214 | 4.8% |
| Osage | 9 | 0.2% |
| Polish | 61 | 1.4% |
| Puerto Rican | 24 | 0.5% |
| Scotch-Irish | 44 | 1.0% |
| Scottish | 117 | 2.6% |
| Serbian | 31 | 0.7% |
| Spaniard | 20 | 0.4% |
| Subsaharan African | 30 | 0.7% |
| Swedish | 26 | 0.6% |
| Swiss | 9 | 0.2% |
| Welsh | 89 | 2.0% | View All 31 Rows |
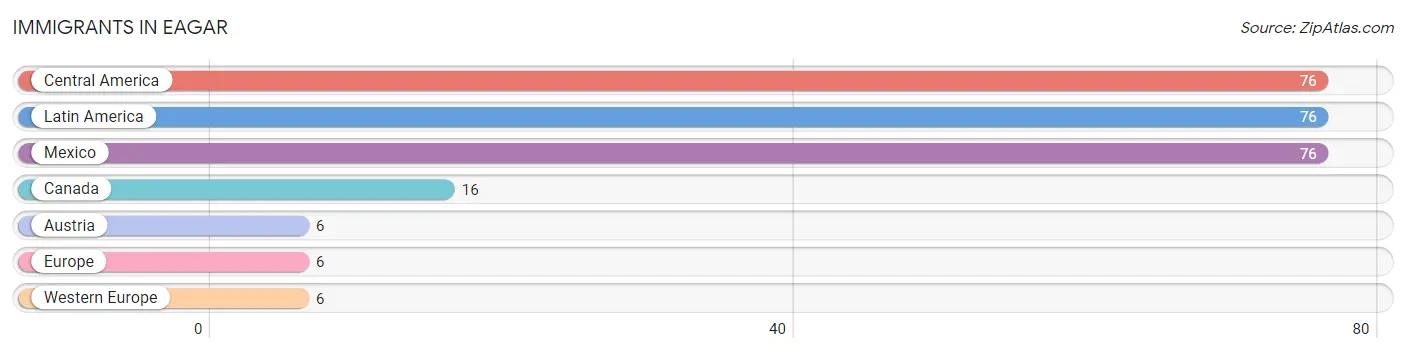
Immigrants in Eagar
The most numerous immigrant groups reported in Eagar came from Central America (76 | 1.7%), Latin America (76 | 1.7%), Mexico (76 | 1.7%), Canada (16 | 0.4%), and Austria (6 | 0.1%), together accounting for 5.7% of all Eagar residents.
| Immigration Origin | # Population | % Population |
| Austria | 6 | 0.1% |
| Canada | 16 | 0.4% |
| Central America | 76 | 1.7% |
| Europe | 6 | 0.1% |
| Latin America | 76 | 1.7% |
| Mexico | 76 | 1.7% |
| Western Europe | 6 | 0.1% | View All 7 Rows |
Sex and Age in Eagar
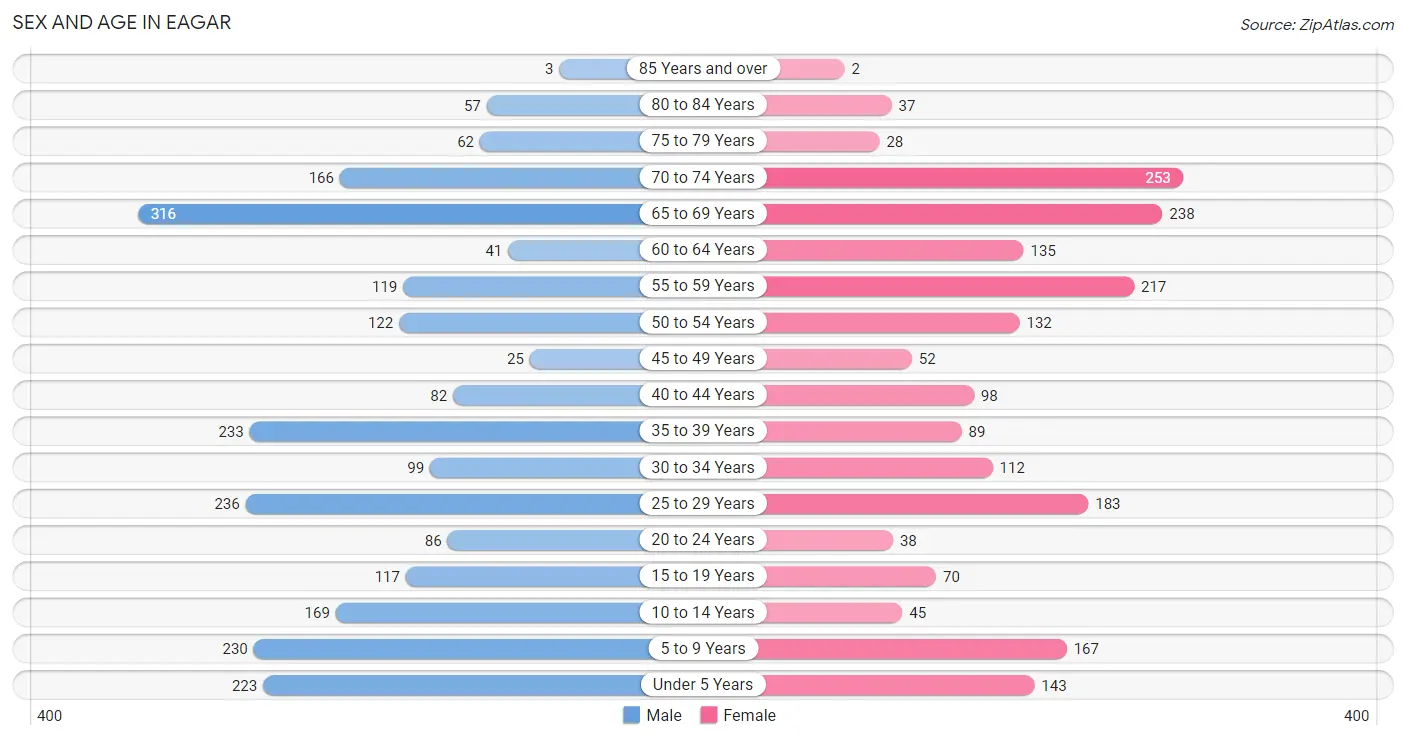
Sex and Age in Eagar
The most populous age groups in Eagar are 65 to 69 Years (316 | 13.2%) for men and 70 to 74 Years (253 | 12.4%) for women.
| Age Bracket | Male | Female |
| Under 5 Years | 223 (9.3%) | 143 (7.0%) |
| 5 to 9 Years | 230 (9.6%) | 167 (8.2%) |
| 10 to 14 Years | 169 (7.1%) | 45 (2.2%) |
| 15 to 19 Years | 117 (4.9%) | 70 (3.4%) |
| 20 to 24 Years | 86 (3.6%) | 38 (1.9%) |
| 25 to 29 Years | 236 (9.9%) | 183 (9.0%) |
| 30 to 34 Years | 99 (4.2%) | 112 (5.5%) |
| 35 to 39 Years | 233 (9.8%) | 89 (4.4%) |
| 40 to 44 Years | 82 (3.4%) | 98 (4.8%) |
| 45 to 49 Years | 25 (1.1%) | 52 (2.5%) |
| 50 to 54 Years | 122 (5.1%) | 132 (6.5%) |
| 55 to 59 Years | 119 (5.0%) | 217 (10.6%) |
| 60 to 64 Years | 41 (1.7%) | 135 (6.6%) |
| 65 to 69 Years | 316 (13.2%) | 238 (11.7%) |
| 70 to 74 Years | 166 (7.0%) | 253 (12.4%) |
| 75 to 79 Years | 62 (2.6%) | 28 (1.4%) |
| 80 to 84 Years | 57 (2.4%) | 37 (1.8%) |
| 85 Years and over | 3 (0.1%) | 2 (0.1%) |
| Total | 2,386 (100.0%) | 2,039 (100.0%) |
Families and Households in Eagar
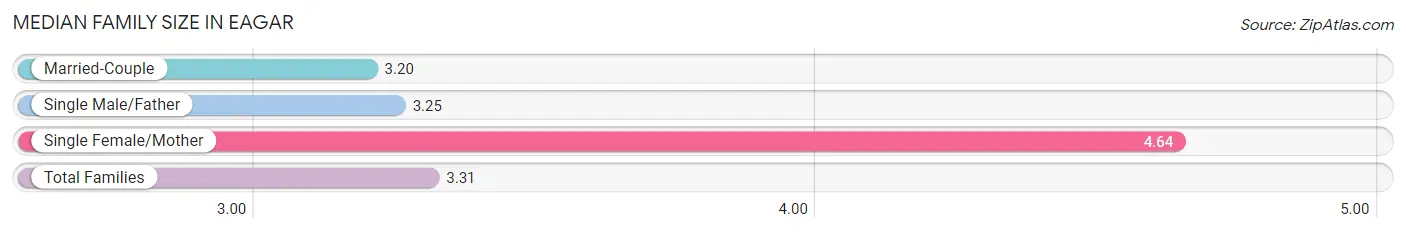
Median Family Size in Eagar
The median family size in Eagar is 3.31 persons per family, with single female/mother families (80 | 7.1%) accounting for the largest median family size of 4.64 persons per family. On the other hand, married-couple families (970 | 86.4%) represent the smallest median family size with 3.20 persons per family.
| Family Type | # Families | Family Size |
| Married-Couple | 970 (86.4%) | 3.20 |
| Single Male/Father | 73 (6.5%) | 3.25 |
| Single Female/Mother | 80 (7.1%) | 4.64 |
| Total Families | 1,123 (100.0%) | 3.31 |
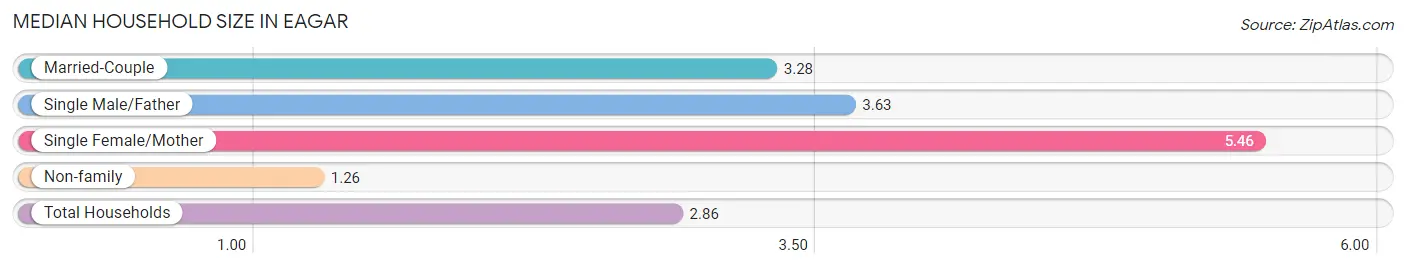
Median Household Size in Eagar
The median household size in Eagar is 2.86 persons per household, with single female/mother households (80 | 5.2%) accounting for the largest median household size of 5.46 persons per household. non-family households (416 | 27.0%) represent the smallest median household size with 1.26 persons per household.
| Household Type | # Households | Household Size |
| Married-Couple | 970 (63.0%) | 3.28 |
| Single Male/Father | 73 (4.7%) | 3.63 |
| Single Female/Mother | 80 (5.2%) | 5.46 |
| Non-family | 416 (27.0%) | 1.26 |
| Total Households | 1,539 (100.0%) | 2.86 |
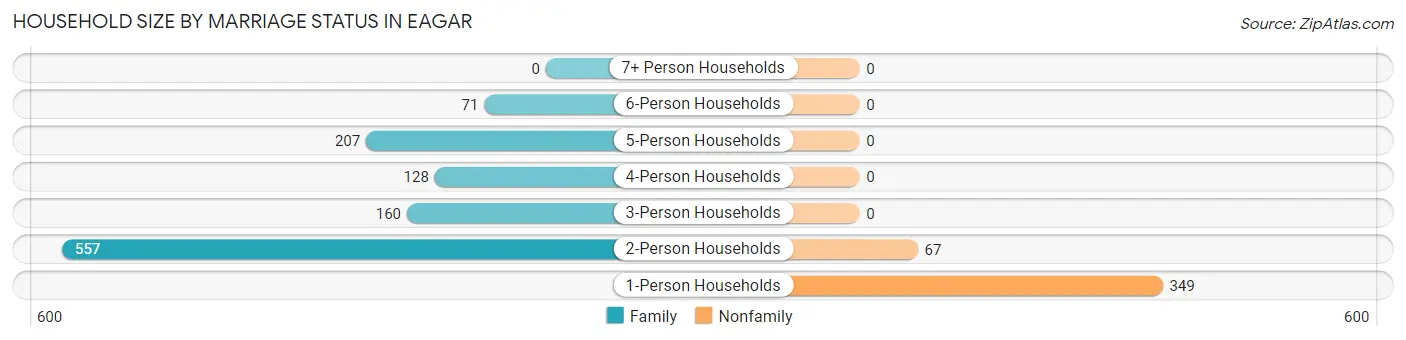
Household Size by Marriage Status in Eagar
Out of a total of 1,539 households in Eagar, 1,123 (73.0%) are family households, while 416 (27.0%) are nonfamily households. The most numerous type of family households are 2-person households, comprising 557, and the most common type of nonfamily households are 1-person households, comprising 349.
| Household Size | Family Households | Nonfamily Households |
| 1-Person Households | - | 349 (22.7%) |
| 2-Person Households | 557 (36.2%) | 67 (4.3%) |
| 3-Person Households | 160 (10.4%) | 0 (0.0%) |
| 4-Person Households | 128 (8.3%) | 0 (0.0%) |
| 5-Person Households | 207 (13.5%) | 0 (0.0%) |
| 6-Person Households | 71 (4.6%) | 0 (0.0%) |
| 7+ Person Households | 0 (0.0%) | 0 (0.0%) |
| Total | 1,123 (73.0%) | 416 (27.0%) |
Female Fertility in Eagar
Fertility by Age in Eagar
Average fertility rate in Eagar is 67.0 births per 1,000 women. Women in the age bracket of 35 to 50 years have the highest fertility rate with 80.0 births per 1,000 women. Women in the age bracket of 20 to 34 years acount for 53.3% of all women with births.
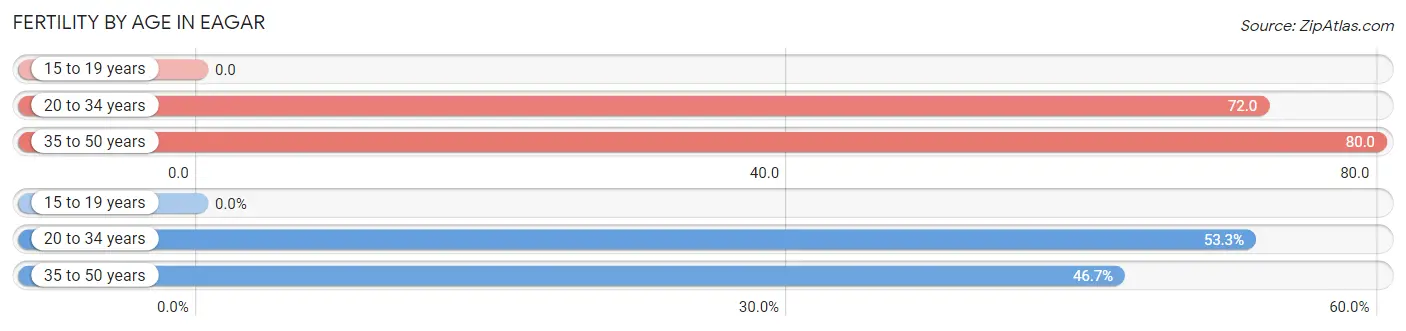
| Age Bracket | Women with Births | Births / 1,000 Women |
| 15 to 19 years | 0 (0.0%) | 0.0 |
| 20 to 34 years | 24 (53.3%) | 72.0 |
| 35 to 50 years | 21 (46.7%) | 80.0 |
| Total | 45 (100.0%) | 67.0 |
Fertility by Age by Marriage Status in Eagar
46.7% of women with births (45) in Eagar are married. The highest percentage of unmarried women with births falls into 20 to 34 years age bracket with 100.0% of them unmarried at the time of birth, while the lowest percentage of unmarried women with births belong to 35 to 50 years age bracket with 0.0% of them unmarried.
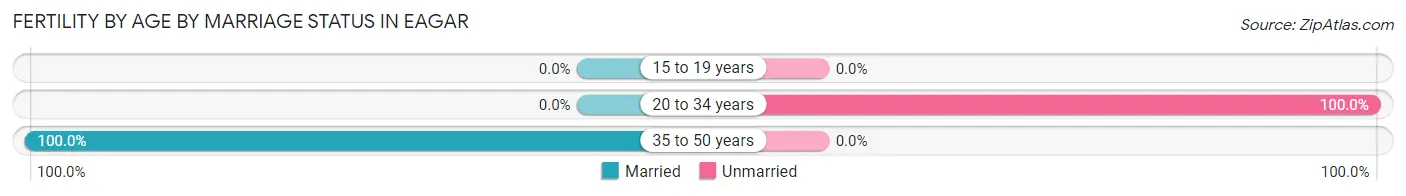
| Age Bracket | Married | Unmarried |
| 15 to 19 years | 0 (0.0%) | 0 (0.0%) |
| 20 to 34 years | 0 (0.0%) | 24 (100.0%) |
| 35 to 50 years | 21 (100.0%) | 0 (0.0%) |
| Total | 21 (46.7%) | 24 (53.3%) |
Fertility by Education in Eagar
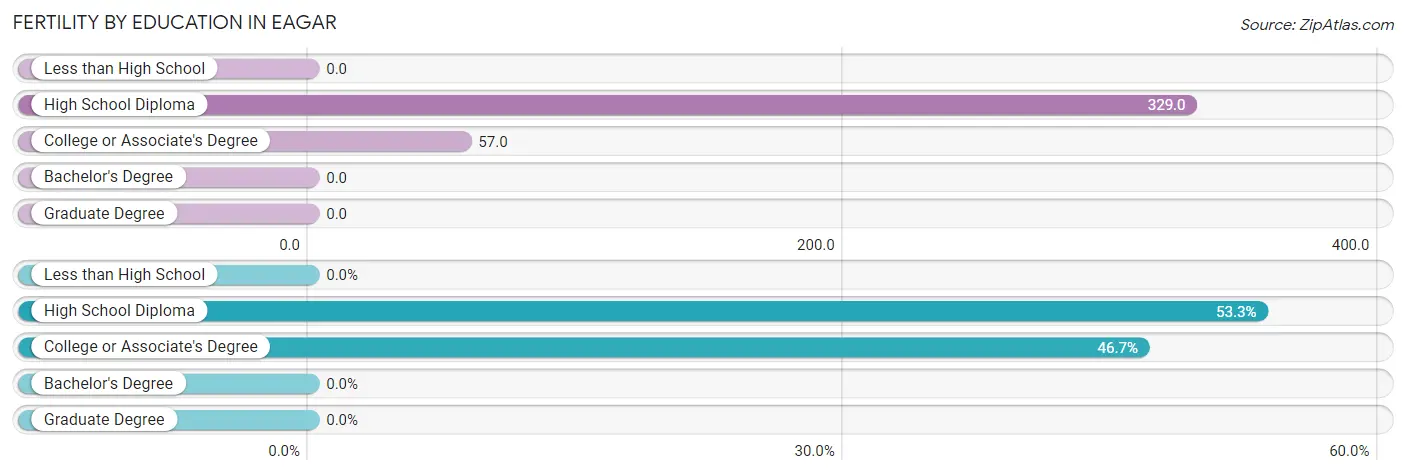
| Educational Attainment | Women with Births | Births / 1,000 Women |
| Less than High School | 0 (0.0%) | 0.0 |
| High School Diploma | 24 (53.3%) | 329.0 |
| College or Associate's Degree | 21 (46.7%) | 57.0 |
| Bachelor's Degree | 0 (0.0%) | 0.0 |
| Graduate Degree | 0 (0.0%) | 0.0 |
| Total | 45 (100.0%) | 67.0 |
Fertility by Education by Marriage Status in Eagar
53.3% of women with births in Eagar are unmarried. Women with the educational attainment of college or associate's degree are most likely to be married with 100.0% of them married at childbirth, while women with the educational attainment of high school diploma are least likely to be married with 100.0% of them unmarried at childbirth.
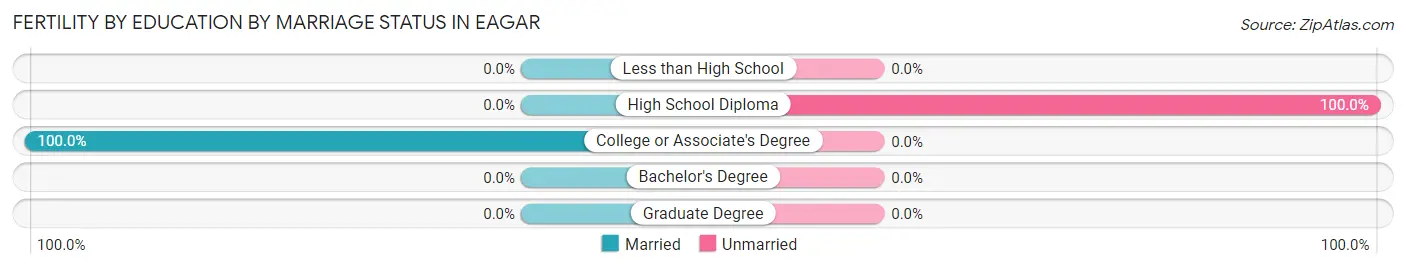
| Educational Attainment | Married | Unmarried |
| Less than High School | 0 (0.0%) | 0 (0.0%) |
| High School Diploma | 0 (0.0%) | 24 (100.0%) |
| College or Associate's Degree | 21 (100.0%) | 0 (0.0%) |
| Bachelor's Degree | 0 (0.0%) | 0 (0.0%) |
| Graduate Degree | 0 (0.0%) | 0 (0.0%) |
| Total | 21 (46.7%) | 24 (53.3%) |
Income in Eagar
Income Overview in Eagar
Per Capita Income in Eagar is $31,827, while median incomes of families and households are $89,260 and $82,538 respectively.
| Characteristic | Number | Measure |
| Per Capita Income | 4,425 | $31,827 |
| Median Family Income | 1,123 | $89,260 |
| Mean Family Income | 1,123 | $94,392 |
| Median Household Income | 1,539 | $82,538 |
| Mean Household Income | 1,539 | $85,345 |
| Income Deficit | 1,123 | $0 |
| Wage / Income Gap (%) | 4,425 | 16.87% |
| Wage / Income Gap ($) | 4,425 | 83.13¢ per $1 |
| Gini / Inequality Index | 4,425 | 0.37 |
Earnings by Sex in Eagar
Average Earnings in Eagar are $43,466, $51,161 for men and $42,528 for women, a difference of 16.9%.
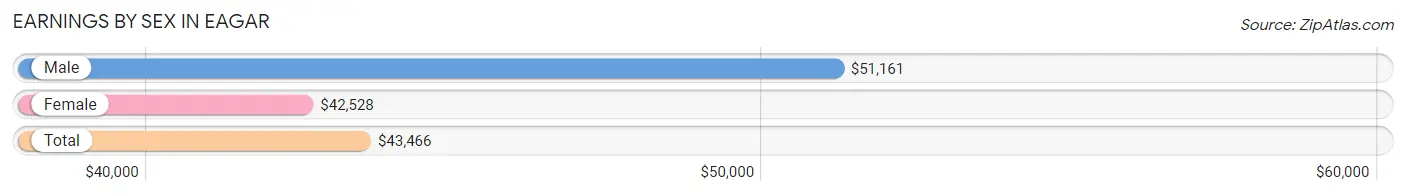
| Sex | Number | Average Earnings |
| Male | 1,070 (59.7%) | $51,161 |
| Female | 722 (40.3%) | $42,528 |
| Total | 1,792 (100.0%) | $43,466 |
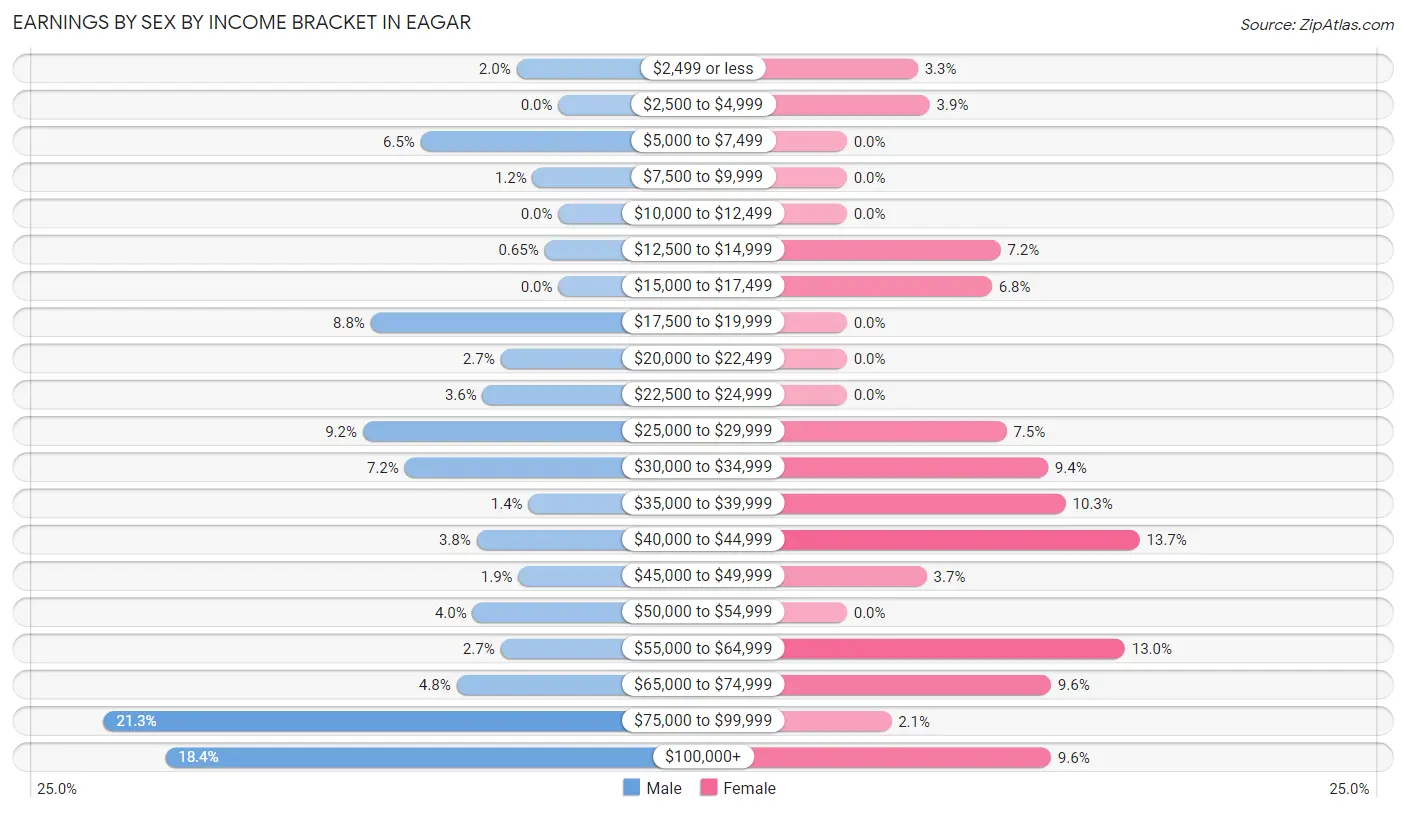
Earnings by Sex by Income Bracket in Eagar
The most common earnings brackets in Eagar are $75,000 to $99,999 for men (228 | 21.3%) and $40,000 to $44,999 for women (99 | 13.7%).
| Income | Male | Female |
| $2,499 or less | 21 (2.0%) | 24 (3.3%) |
| $2,500 to $4,999 | 0 (0.0%) | 28 (3.9%) |
| $5,000 to $7,499 | 69 (6.5%) | 0 (0.0%) |
| $7,500 to $9,999 | 13 (1.2%) | 0 (0.0%) |
| $10,000 to $12,499 | 0 (0.0%) | 0 (0.0%) |
| $12,500 to $14,999 | 7 (0.6%) | 52 (7.2%) |
| $15,000 to $17,499 | 0 (0.0%) | 49 (6.8%) |
| $17,500 to $19,999 | 94 (8.8%) | 0 (0.0%) |
| $20,000 to $22,499 | 29 (2.7%) | 0 (0.0%) |
| $22,500 to $24,999 | 38 (3.5%) | 0 (0.0%) |
| $25,000 to $29,999 | 98 (9.2%) | 54 (7.5%) |
| $30,000 to $34,999 | 77 (7.2%) | 68 (9.4%) |
| $35,000 to $39,999 | 15 (1.4%) | 74 (10.2%) |
| $40,000 to $44,999 | 41 (3.8%) | 99 (13.7%) |
| $45,000 to $49,999 | 20 (1.9%) | 27 (3.7%) |
| $50,000 to $54,999 | 43 (4.0%) | 0 (0.0%) |
| $55,000 to $64,999 | 29 (2.7%) | 94 (13.0%) |
| $65,000 to $74,999 | 51 (4.8%) | 69 (9.6%) |
| $75,000 to $99,999 | 228 (21.3%) | 15 (2.1%) |
| $100,000+ | 197 (18.4%) | 69 (9.6%) |
| Total | 1,070 (100.0%) | 722 (100.0%) |
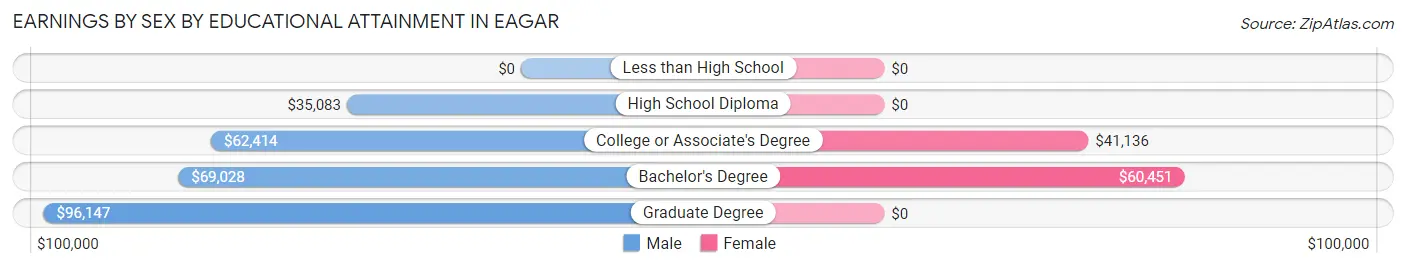
Earnings by Sex by Educational Attainment in Eagar
Average earnings in Eagar are $66,063 for men and $43,068 for women, a difference of 34.8%. Men with an educational attainment of graduate degree enjoy the highest average annual earnings of $96,147, while those with high school diploma education earn the least with $35,083. Women with an educational attainment of bachelor's degree earn the most with the average annual earnings of $60,451, while those with college or associate's degree education have the smallest earnings of $41,136.
| Educational Attainment | Male Income | Female Income |
| Less than High School | - | - |
| High School Diploma | $35,083 | $0 |
| College or Associate's Degree | $62,414 | $41,136 |
| Bachelor's Degree | $69,028 | $60,451 |
| Graduate Degree | $96,147 | $0 |
| Total | $66,063 | $43,068 |
Family Income in Eagar
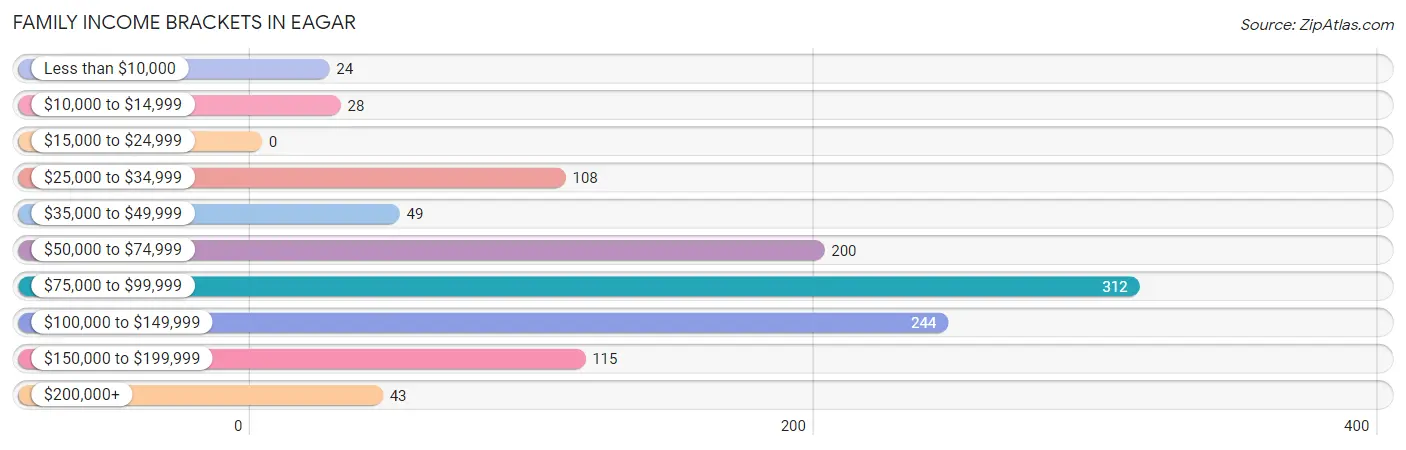
Family Income Brackets in Eagar
According to the Eagar family income data, there are 312 families falling into the $75,000 to $99,999 income range, which is the most common income bracket and makes up 27.8% of all families.
| Income Bracket | # Families | % Families |
| Less than $10,000 | 24 | 2.1% |
| $10,000 to $14,999 | 28 | 2.5% |
| $15,000 to $24,999 | 0 | 0.0% |
| $25,000 to $34,999 | 108 | 9.6% |
| $35,000 to $49,999 | 49 | 4.4% |
| $50,000 to $74,999 | 200 | 17.8% |
| $75,000 to $99,999 | 312 | 27.8% |
| $100,000 to $149,999 | 244 | 21.7% |
| $150,000 to $199,999 | 115 | 10.2% |
| $200,000+ | 43 | 3.8% |
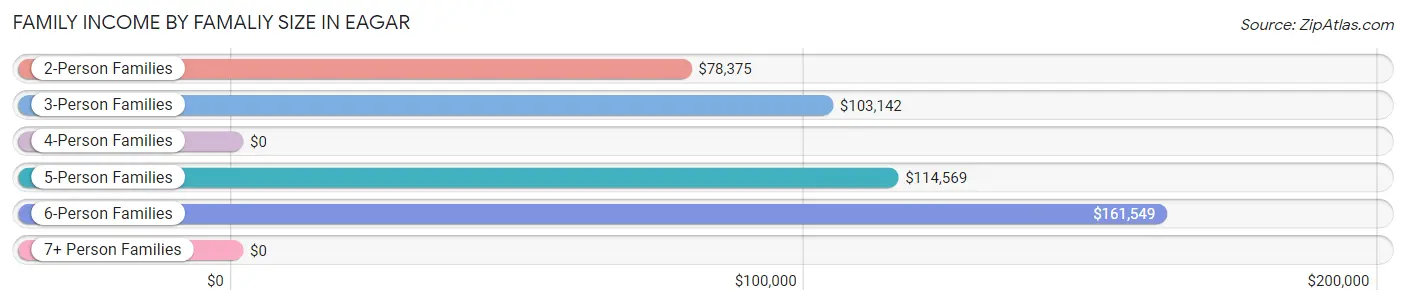
Family Income by Famaliy Size in Eagar
6-person families (71 | 6.3%) account for the highest median family income in Eagar with $161,549 per family, while 2-person families (557 | 49.6%) have the highest median income of $39,188 per family member.
| Income Bracket | # Families | Median Income |
| 2-Person Families | 557 (49.6%) | $78,375 |
| 3-Person Families | 205 (18.2%) | $103,142 |
| 4-Person Families | 176 (15.7%) | $0 |
| 5-Person Families | 114 (10.2%) | $114,569 |
| 6-Person Families | 71 (6.3%) | $161,549 |
| 7+ Person Families | 0 (0.0%) | $0 |
| Total | 1,123 (100.0%) | $89,260 |
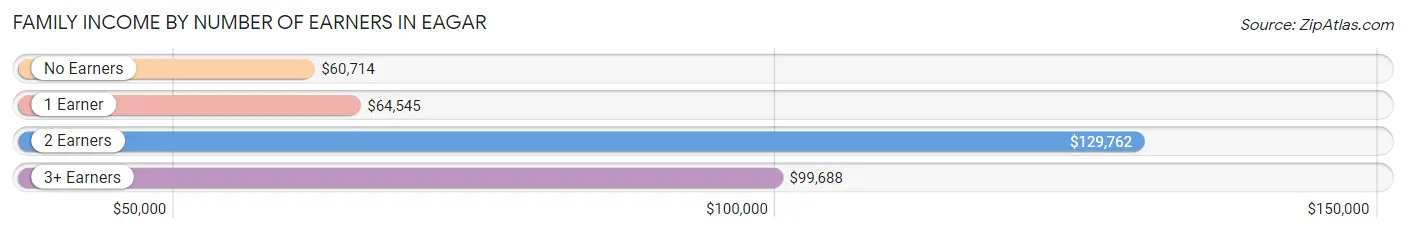
Family Income by Number of Earners in Eagar
The median family income in Eagar is $89,260, with families comprising 2 earners (446) having the highest median family income of $129,762, while families with no earners (298) have the lowest median family income of $60,714, accounting for 39.7% and 26.5% of families, respectively.
| Number of Earners | # Families | Median Income |
| No Earners | 298 (26.5%) | $60,714 |
| 1 Earner | 308 (27.4%) | $64,545 |
| 2 Earners | 446 (39.7%) | $129,762 |
| 3+ Earners | 71 (6.3%) | $99,688 |
| Total | 1,123 (100.0%) | $89,260 |
Household Income in Eagar
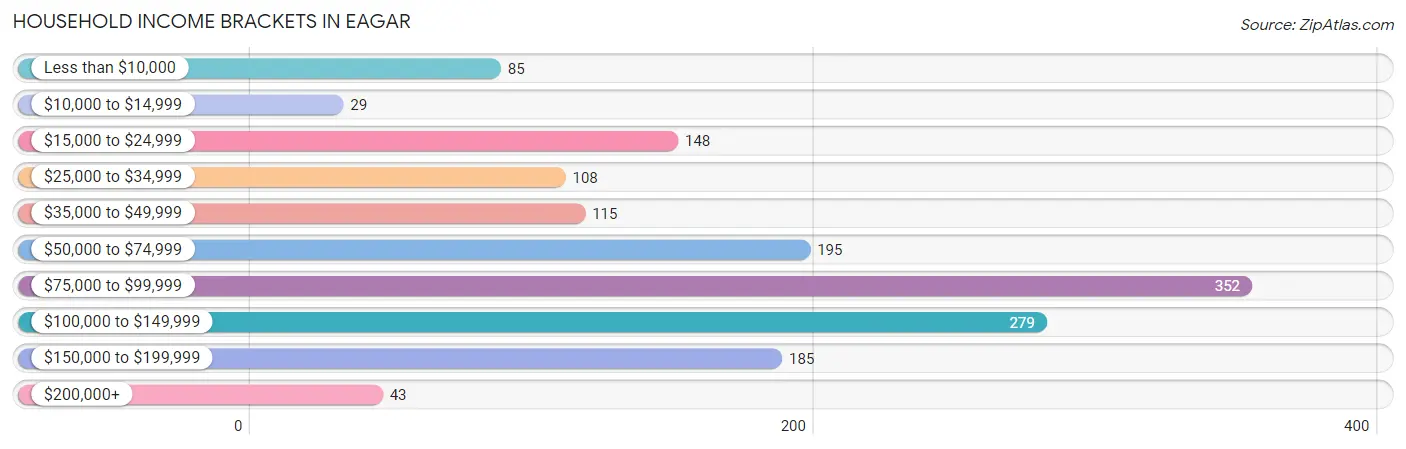
Household Income Brackets in Eagar
With 352 households falling in the category, the $75,000 to $99,999 income range is the most frequent in Eagar, accounting for 22.9% of all households. In contrast, only 29 households (1.9%) fall into the $10,000 to $14,999 income bracket, making it the least populous group.
| Income Bracket | # Households | % Households |
| Less than $10,000 | 85 | 5.5% |
| $10,000 to $14,999 | 29 | 1.9% |
| $15,000 to $24,999 | 148 | 9.6% |
| $25,000 to $34,999 | 108 | 7.0% |
| $35,000 to $49,999 | 115 | 7.5% |
| $50,000 to $74,999 | 195 | 12.7% |
| $75,000 to $99,999 | 352 | 22.9% |
| $100,000 to $149,999 | 279 | 18.1% |
| $150,000 to $199,999 | 185 | 12.0% |
| $200,000+ | 43 | 2.8% |
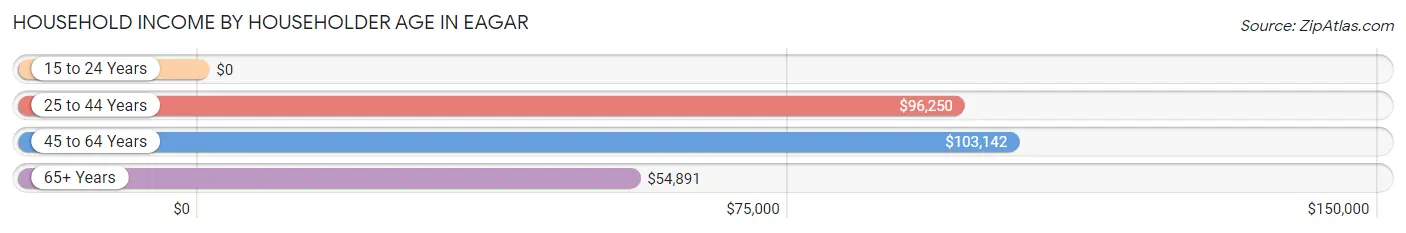
Household Income by Householder Age in Eagar
The median household income in Eagar is $82,538, with the highest median household income of $103,142 found in the 45 to 64 years age bracket for the primary householder. A total of 437 households (28.4%) fall into this category.
| Income Bracket | # Households | Median Income |
| 15 to 24 Years | 0 (0.0%) | $0 |
| 25 to 44 Years | 468 (30.4%) | $96,250 |
| 45 to 64 Years | 437 (28.4%) | $103,142 |
| 65+ Years | 634 (41.2%) | $54,891 |
| Total | 1,539 (100.0%) | $82,538 |
Poverty in Eagar
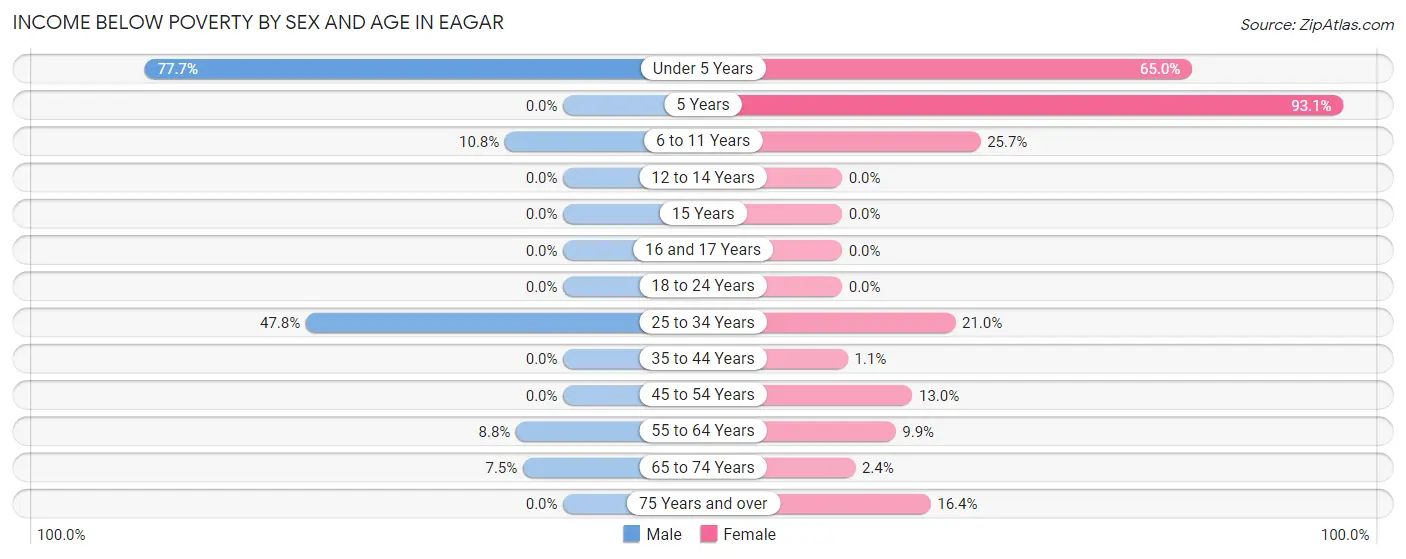
Income Below Poverty by Sex and Age in Eagar
With 17.0% poverty level for males and 14.9% for females among the residents of Eagar, under 5 year old males and 5 year old females are the most vulnerable to poverty, with 157 males (77.7%) and 27 females (93.1%) in their respective age groups living below the poverty level.
| Age Bracket | Male | Female |
| Under 5 Years | 157 (77.7%) | 93 (65.0%) |
| 5 Years | 0 (0.0%) | 27 (93.1%) |
| 6 to 11 Years | 36 (10.8%) | 37 (25.7%) |
| 12 to 14 Years | 0 (0.0%) | 0 (0.0%) |
| 15 Years | 0 (0.0%) | 0 (0.0%) |
| 16 and 17 Years | 0 (0.0%) | 0 (0.0%) |
| 18 to 24 Years | 0 (0.0%) | 0 (0.0%) |
| 25 to 34 Years | 160 (47.8%) | 62 (21.0%) |
| 35 to 44 Years | 0 (0.0%) | 2 (1.1%) |
| 45 to 54 Years | 0 (0.0%) | 24 (13.0%) |
| 55 to 64 Years | 14 (8.7%) | 35 (9.9%) |
| 65 to 74 Years | 36 (7.5%) | 12 (2.4%) |
| 75 Years and over | 0 (0.0%) | 11 (16.4%) |
| Total | 403 (17.0%) | 303 (14.9%) |
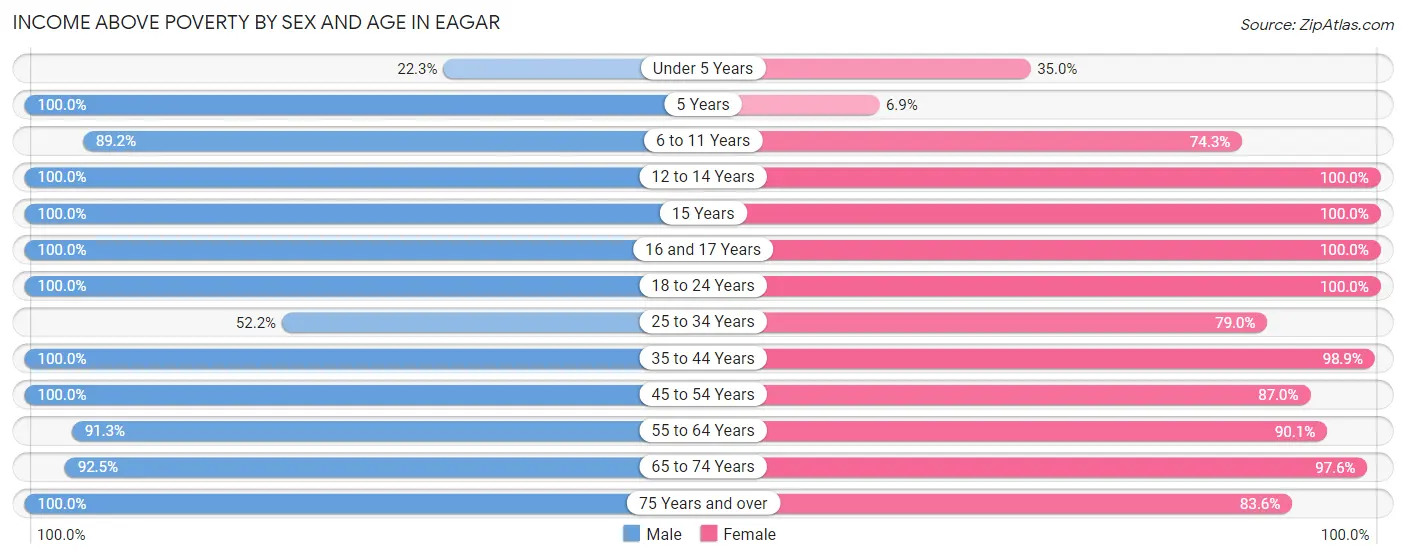
Income Above Poverty by Sex and Age in Eagar
According to the poverty statistics in Eagar, males aged 5 years and females aged 12 to 14 years are the age groups that are most secure financially, with 100.0% of males and 100.0% of females in these age groups living above the poverty line.
| Age Bracket | Male | Female |
| Under 5 Years | 45 (22.3%) | 50 (35.0%) |
| 5 Years | 37 (100.0%) | 2 (6.9%) |
| 6 to 11 Years | 297 (89.2%) | 107 (74.3%) |
| 12 to 14 Years | 29 (100.0%) | 39 (100.0%) |
| 15 Years | 35 (100.0%) | 14 (100.0%) |
| 16 and 17 Years | 29 (100.0%) | 56 (100.0%) |
| 18 to 24 Years | 139 (100.0%) | 38 (100.0%) |
| 25 to 34 Years | 175 (52.2%) | 233 (79.0%) |
| 35 to 44 Years | 315 (100.0%) | 185 (98.9%) |
| 45 to 54 Years | 147 (100.0%) | 160 (87.0%) |
| 55 to 64 Years | 146 (91.2%) | 317 (90.1%) |
| 65 to 74 Years | 446 (92.5%) | 479 (97.6%) |
| 75 Years and over | 122 (100.0%) | 56 (83.6%) |
| Total | 1,962 (83.0%) | 1,736 (85.1%) |
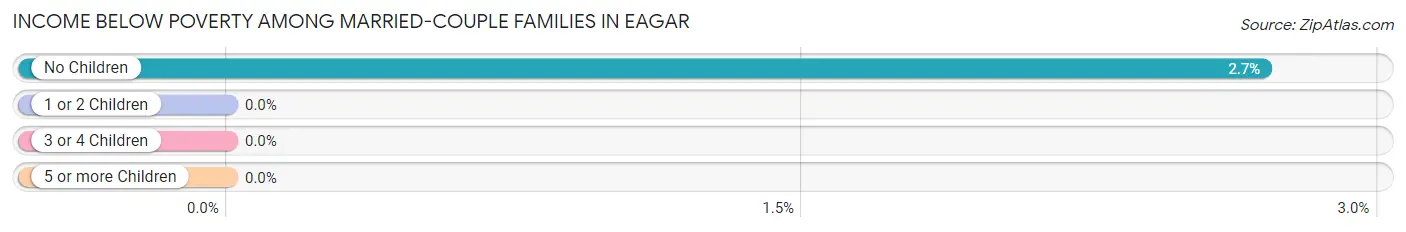
Income Below Poverty Among Married-Couple Families in Eagar
The poverty statistics for married-couple families in Eagar show that 1.9% or 18 of the total 970 families live below the poverty line. Families with no children have the highest poverty rate of 2.7%, comprising of 18 families. On the other hand, families with 1 or 2 children have the lowest poverty rate of 0.0%, which includes 0 families.
| Children | Above Poverty | Below Poverty |
| No Children | 649 (97.3%) | 18 (2.7%) |
| 1 or 2 Children | 138 (100.0%) | 0 (0.0%) |
| 3 or 4 Children | 165 (100.0%) | 0 (0.0%) |
| 5 or more Children | 0 (0.0%) | 0 (0.0%) |
| Total | 952 (98.1%) | 18 (1.9%) |
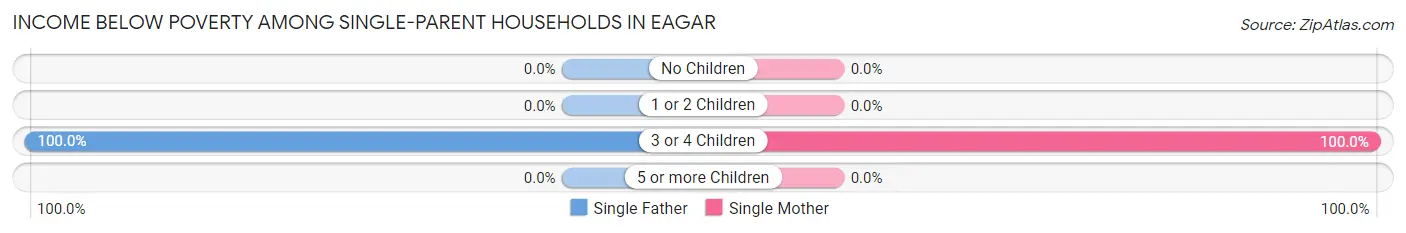
Income Below Poverty Among Single-Parent Households in Eagar
According to the poverty data in Eagar, 61.6% or 45 single-father households and 42.5% or 34 single-mother households are living below the poverty line. Among single-father households, those with 3 or 4 children have the highest poverty rate, with 45 households (100.0%) experiencing poverty. Likewise, among single-mother households, those with 3 or 4 children have the highest poverty rate, with 34 households (100.0%) falling below the poverty line.
| Children | Single Father | Single Mother |
| No Children | 0 (0.0%) | 0 (0.0%) |
| 1 or 2 Children | 0 (0.0%) | 0 (0.0%) |
| 3 or 4 Children | 45 (100.0%) | 34 (100.0%) |
| 5 or more Children | 0 (0.0%) | 0 (0.0%) |
| Total | 45 (61.6%) | 34 (42.5%) |
Income Below Poverty Among Married-Couple vs Single-Parent Households in Eagar
The poverty data for Eagar shows that 18 of the married-couple family households (1.9%) and 79 of the single-parent households (51.6%) are living below the poverty level. Within the married-couple family households, those with no children have the highest poverty rate, with 18 households (2.7%) falling below the poverty line. Among the single-parent households, those with 3 or 4 children have the highest poverty rate, with 79 household (100.0%) living below poverty.
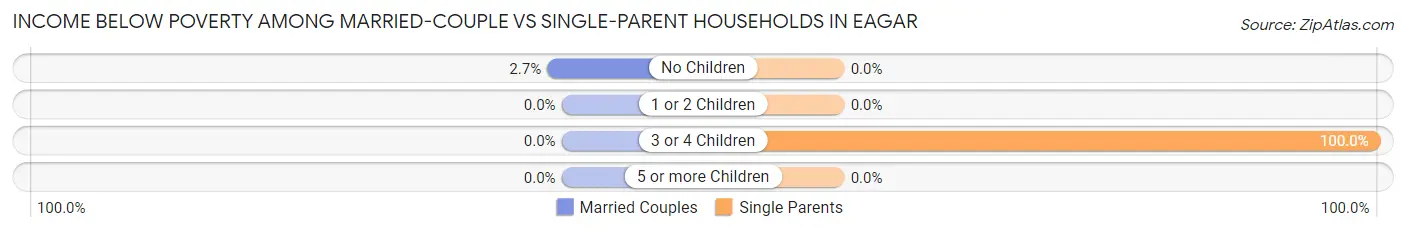
| Children | Married-Couple Families | Single-Parent Households |
| No Children | 18 (2.7%) | 0 (0.0%) |
| 1 or 2 Children | 0 (0.0%) | 0 (0.0%) |
| 3 or 4 Children | 0 (0.0%) | 79 (100.0%) |
| 5 or more Children | 0 (0.0%) | 0 (0.0%) |
| Total | 18 (1.9%) | 79 (51.6%) |
Employment Characteristics in Eagar
Employment by Class of Employer in Eagar
Among the 1,581 employed individuals in Eagar, private company employees (842 | 53.3%), local government employees (290 | 18.3%), and state government employees (150 | 9.5%) make up the most common classes of employment.
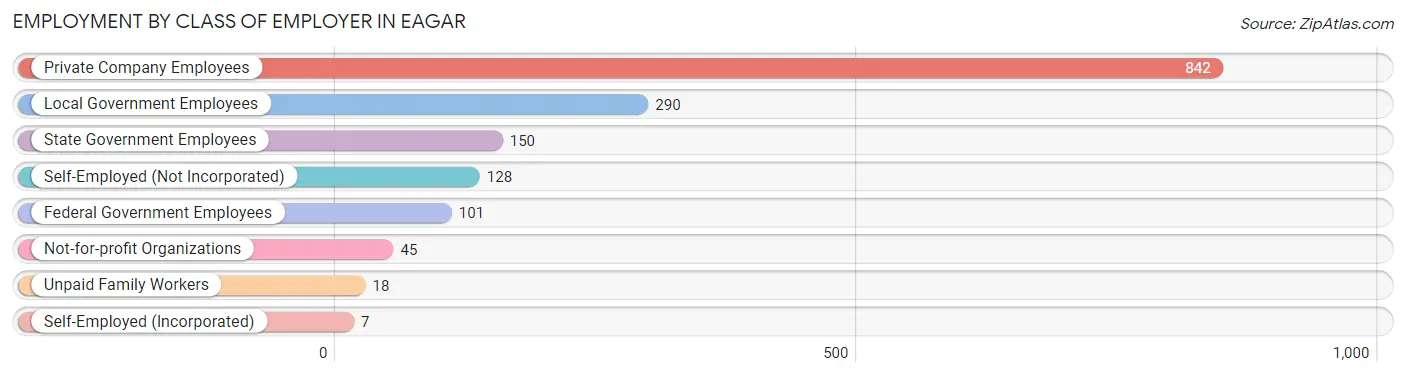
| Employer Class | # Employees | % Employees |
| Private Company Employees | 842 | 53.3% |
| Self-Employed (Incorporated) | 7 | 0.4% |
| Self-Employed (Not Incorporated) | 128 | 8.1% |
| Not-for-profit Organizations | 45 | 2.9% |
| Local Government Employees | 290 | 18.3% |
| State Government Employees | 150 | 9.5% |
| Federal Government Employees | 101 | 6.4% |
| Unpaid Family Workers | 18 | 1.1% |
| Total | 1,581 | 100.0% |
Employment Status by Age in Eagar
According to the labor force statistics for Eagar, out of the total population over 16 years of age (3,399), 47.3% or 1,608 individuals are in the labor force, with 0.9% or 14 of them unemployed. The age group with the highest labor force participation rate is 20 to 24 years, with 100.0% or 124 individuals in the labor force. Within the labor force, the 20 to 24 years age range has the highest percentage of unemployed individuals, with 8.9% or 11 of them being unemployed.
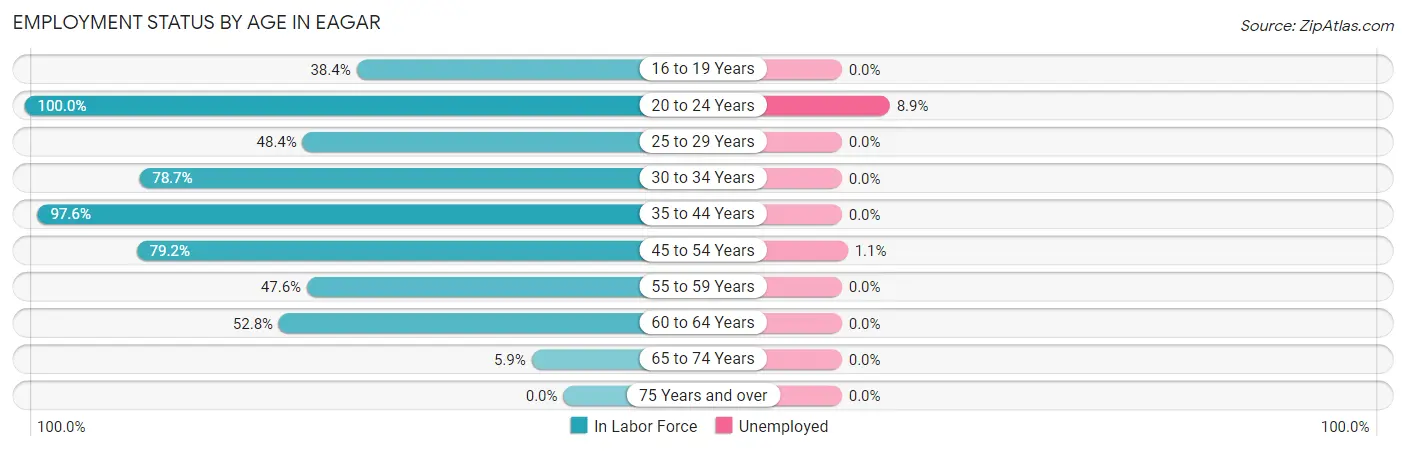
| Age Bracket | In Labor Force | Unemployed |
| 16 to 19 Years | 53 (38.4%) | 0 (0.0%) |
| 20 to 24 Years | 124 (100.0%) | 11 (8.9%) |
| 25 to 29 Years | 203 (48.4%) | 0 (0.0%) |
| 30 to 34 Years | 166 (78.7%) | 0 (0.0%) |
| 35 to 44 Years | 490 (97.6%) | 0 (0.0%) |
| 45 to 54 Years | 262 (79.2%) | 3 (1.1%) |
| 55 to 59 Years | 160 (47.6%) | 0 (0.0%) |
| 60 to 64 Years | 93 (52.8%) | 0 (0.0%) |
| 65 to 74 Years | 57 (5.9%) | 0 (0.0%) |
| 75 Years and over | 0 (0.0%) | 0 (0.0%) |
| Total | 1,608 (47.3%) | 14 (0.9%) |
Employment Status by Educational Attainment in Eagar
According to labor force statistics for Eagar, 69.6% of individuals (1,375) out of the total population between 25 and 64 years of age (1,975) are in the labor force, with 0.2% or 3 of them being unemployed. The group with the highest labor force participation rate are those with the educational attainment of bachelor's degree or higher, with 100.0% or 461 individuals in the labor force. Within the labor force, individuals with college / associate degree education have the highest percentage of unemployment, with 0.5% or 3 of them being unemployed.
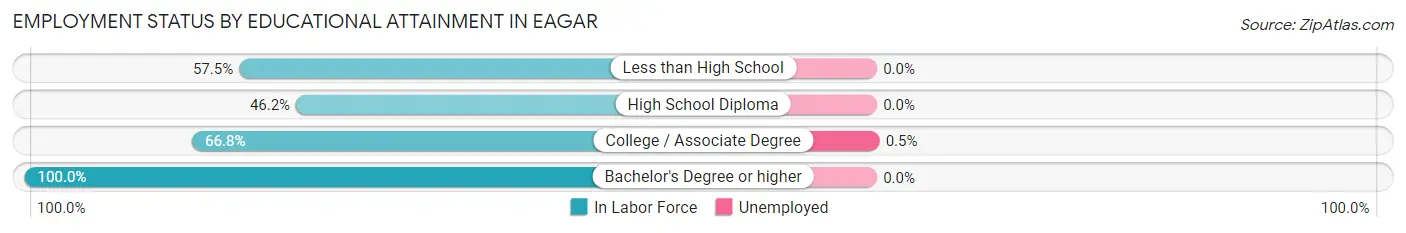
| Educational Attainment | In Labor Force | Unemployed |
| Less than High School | 88 (57.5%) | 0 (0.0%) |
| High School Diploma | 190 (46.2%) | 0 (0.0%) |
| College / Associate Degree | 635 (66.8%) | 5 (0.5%) |
| Bachelor's Degree or higher | 461 (100.0%) | 0 (0.0%) |
| Total | 1,375 (69.6%) | 4 (0.2%) |
Employment Occupations by Sex in Eagar
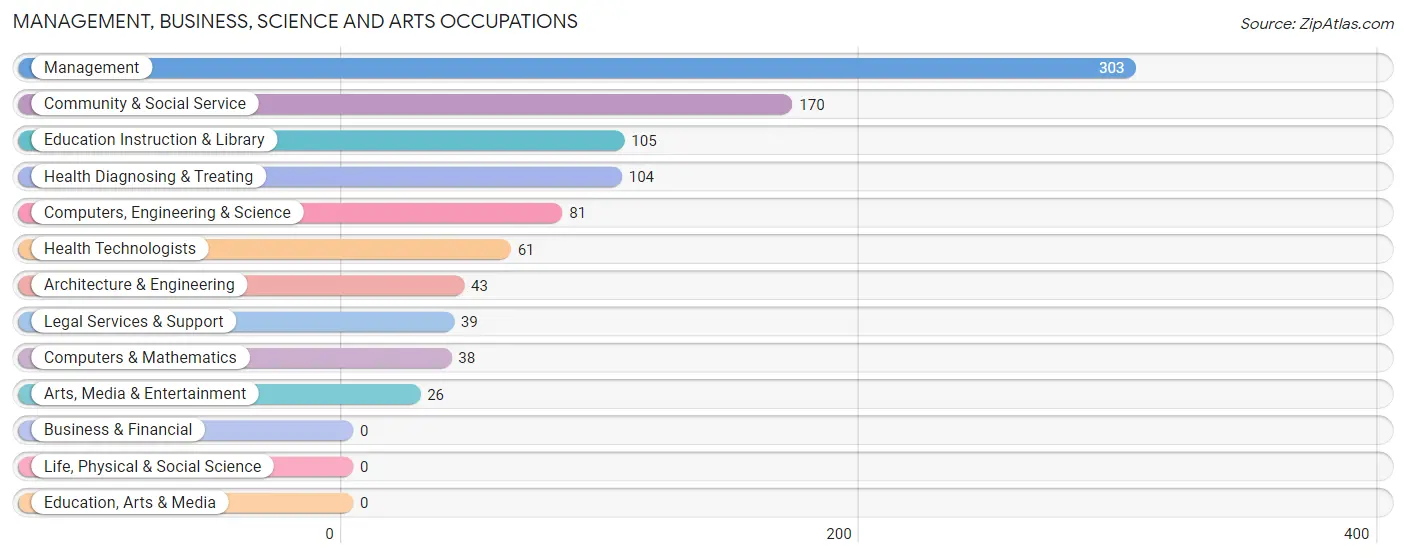
Management, Business, Science and Arts Occupations
The most common Management, Business, Science and Arts occupations in Eagar are Management (303 | 19.0%), Community & Social Service (170 | 10.7%), Education Instruction & Library (105 | 6.6%), Health Diagnosing & Treating (104 | 6.5%), and Computers, Engineering & Science (81 | 5.1%).
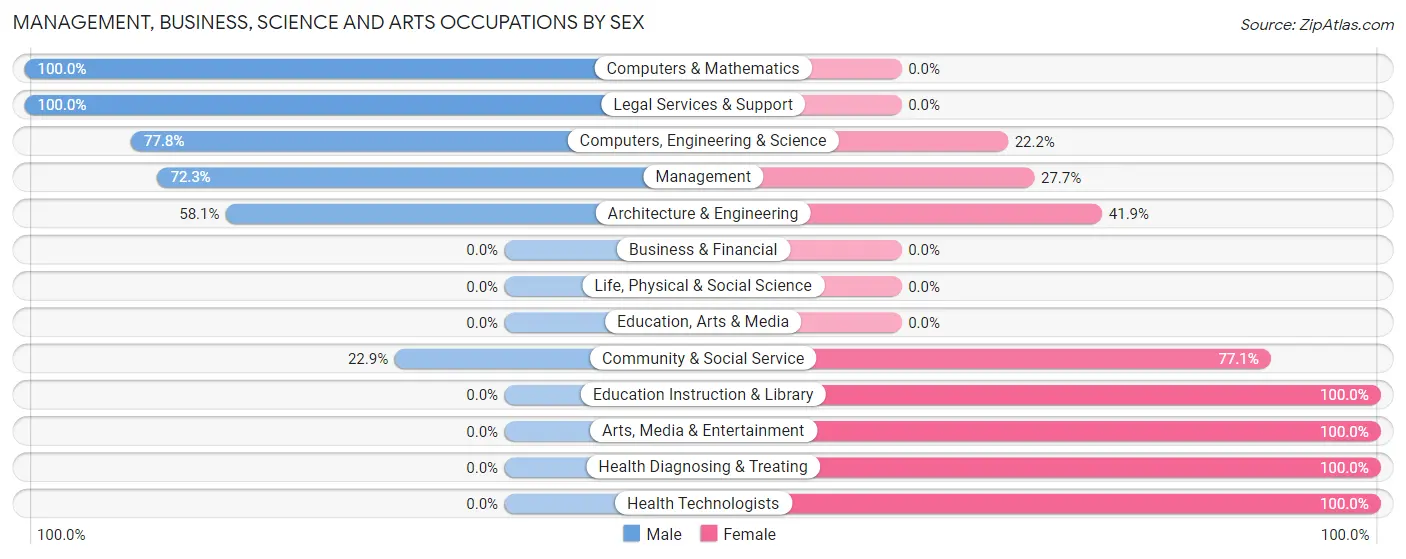
Management, Business, Science and Arts Occupations by Sex
Within the Management, Business, Science and Arts occupations in Eagar, the most male-oriented occupations are Computers & Mathematics (100.0%), Legal Services & Support (100.0%), and Computers, Engineering & Science (77.8%), while the most female-oriented occupations are Education Instruction & Library (100.0%), Arts, Media & Entertainment (100.0%), and Health Diagnosing & Treating (100.0%).
| Occupation | Male | Female |
| Management | 219 (72.3%) | 84 (27.7%) |
| Business & Financial | 0 (0.0%) | 0 (0.0%) |
| Computers, Engineering & Science | 63 (77.8%) | 18 (22.2%) |
| Computers & Mathematics | 38 (100.0%) | 0 (0.0%) |
| Architecture & Engineering | 25 (58.1%) | 18 (41.9%) |
| Life, Physical & Social Science | 0 (0.0%) | 0 (0.0%) |
| Community & Social Service | 39 (22.9%) | 131 (77.1%) |
| Education, Arts & Media | 0 (0.0%) | 0 (0.0%) |
| Legal Services & Support | 39 (100.0%) | 0 (0.0%) |
| Education Instruction & Library | 0 (0.0%) | 105 (100.0%) |
| Arts, Media & Entertainment | 0 (0.0%) | 26 (100.0%) |
| Health Diagnosing & Treating | 0 (0.0%) | 104 (100.0%) |
| Health Technologists | 0 (0.0%) | 61 (100.0%) |
| Total (Category) | 321 (48.8%) | 337 (51.2%) |
| Total (Overall) | 872 (54.7%) | 722 (45.3%) |
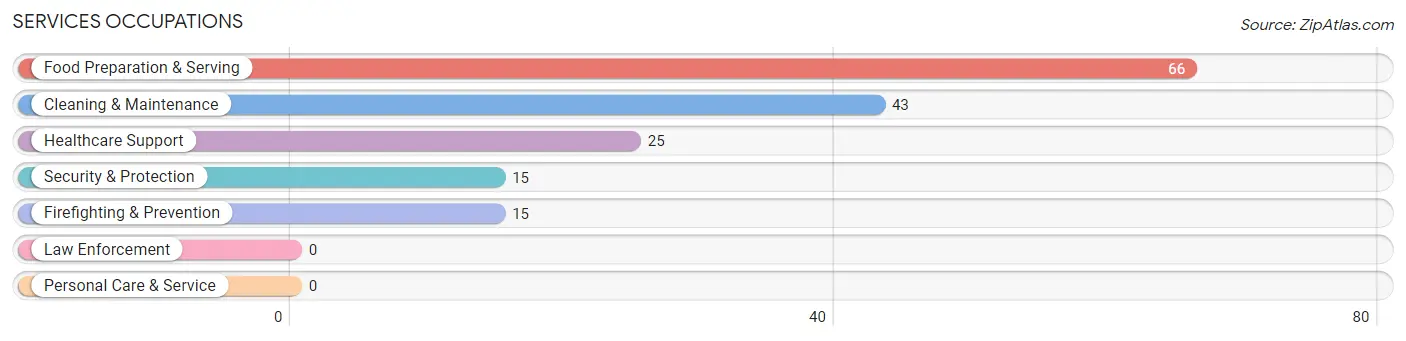
Services Occupations
The most common Services occupations in Eagar are Food Preparation & Serving (66 | 4.1%), Cleaning & Maintenance (43 | 2.7%), Healthcare Support (25 | 1.6%), Security & Protection (15 | 0.9%), and Firefighting & Prevention (15 | 0.9%).
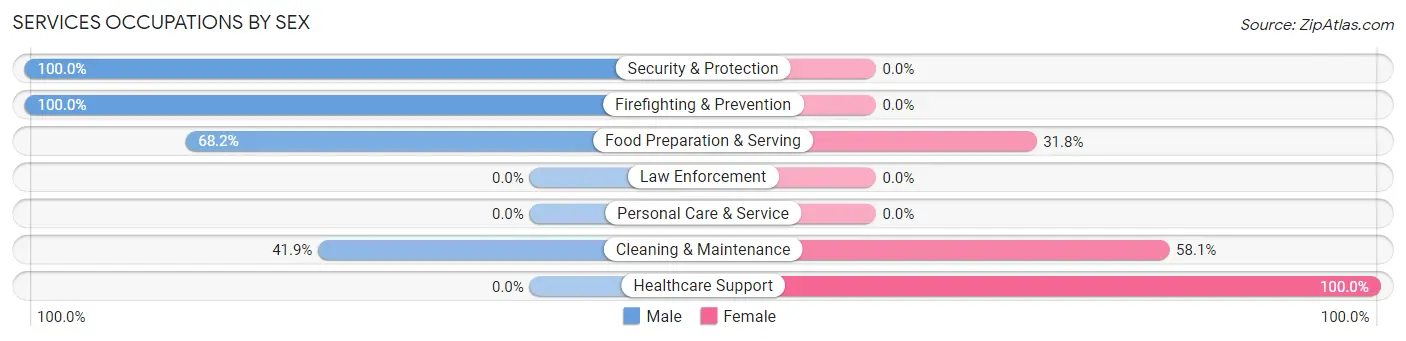
Services Occupations by Sex
Within the Services occupations in Eagar, the most male-oriented occupations are Security & Protection (100.0%), Firefighting & Prevention (100.0%), and Food Preparation & Serving (68.2%), while the most female-oriented occupations are Healthcare Support (100.0%), Cleaning & Maintenance (58.1%), and Food Preparation & Serving (31.8%).
| Occupation | Male | Female |
| Healthcare Support | 0 (0.0%) | 25 (100.0%) |
| Security & Protection | 15 (100.0%) | 0 (0.0%) |
| Firefighting & Prevention | 15 (100.0%) | 0 (0.0%) |
| Law Enforcement | 0 (0.0%) | 0 (0.0%) |
| Food Preparation & Serving | 45 (68.2%) | 21 (31.8%) |
| Cleaning & Maintenance | 18 (41.9%) | 25 (58.1%) |
| Personal Care & Service | 0 (0.0%) | 0 (0.0%) |
| Total (Category) | 78 (52.3%) | 71 (47.6%) |
| Total (Overall) | 872 (54.7%) | 722 (45.3%) |
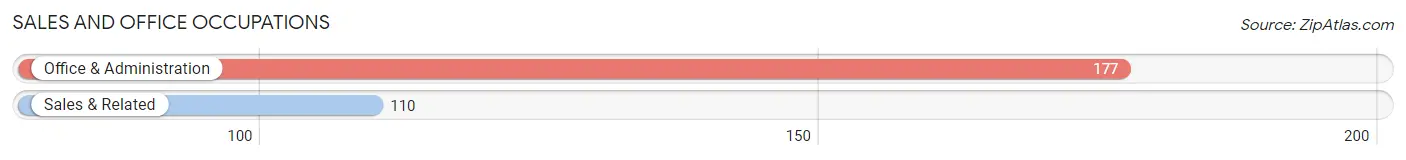
Sales and Office Occupations
The most common Sales and Office occupations in Eagar are Office & Administration (177 | 11.1%), and Sales & Related (110 | 6.9%).
Sales and Office Occupations by Sex
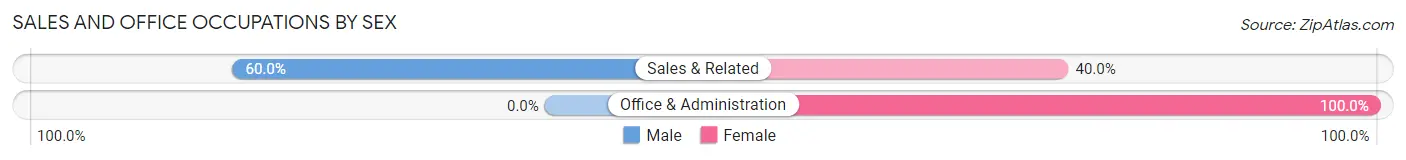
| Occupation | Male | Female |
| Sales & Related | 66 (60.0%) | 44 (40.0%) |
| Office & Administration | 0 (0.0%) | 177 (100.0%) |
| Total (Category) | 66 (23.0%) | 221 (77.0%) |
| Total (Overall) | 872 (54.7%) | 722 (45.3%) |
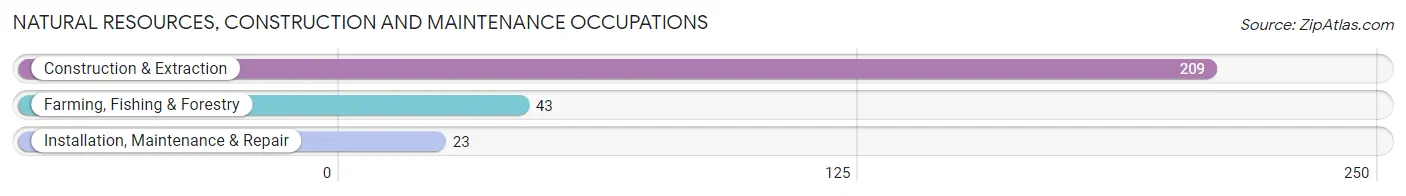
Natural Resources, Construction and Maintenance Occupations
The most common Natural Resources, Construction and Maintenance occupations in Eagar are Construction & Extraction (209 | 13.1%), Farming, Fishing & Forestry (43 | 2.7%), and Installation, Maintenance & Repair (23 | 1.4%).
Natural Resources, Construction and Maintenance Occupations by Sex
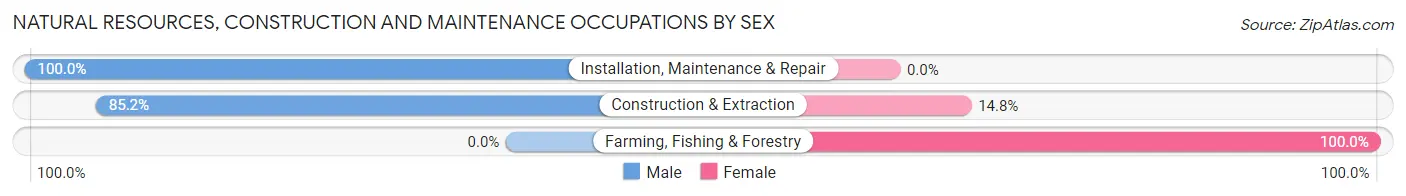
| Occupation | Male | Female |
| Farming, Fishing & Forestry | 0 (0.0%) | 43 (100.0%) |
| Construction & Extraction | 178 (85.2%) | 31 (14.8%) |
| Installation, Maintenance & Repair | 23 (100.0%) | 0 (0.0%) |
| Total (Category) | 201 (73.1%) | 74 (26.9%) |
| Total (Overall) | 872 (54.7%) | 722 (45.3%) |
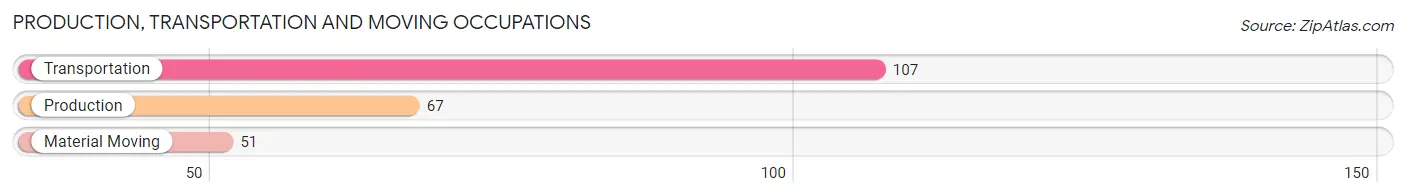
Production, Transportation and Moving Occupations
The most common Production, Transportation and Moving occupations in Eagar are Transportation (107 | 6.7%), Production (67 | 4.2%), and Material Moving (51 | 3.2%).
Production, Transportation and Moving Occupations by Sex
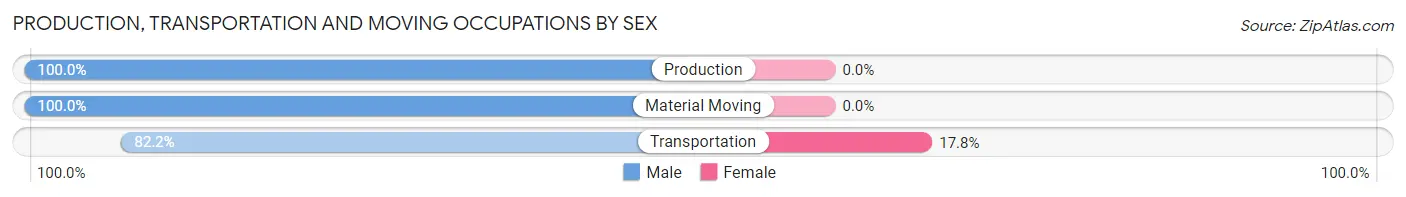
| Occupation | Male | Female |
| Production | 67 (100.0%) | 0 (0.0%) |
| Transportation | 88 (82.2%) | 19 (17.8%) |
| Material Moving | 51 (100.0%) | 0 (0.0%) |
| Total (Category) | 206 (91.6%) | 19 (8.4%) |
| Total (Overall) | 872 (54.7%) | 722 (45.3%) |
Employment Industries by Sex in Eagar
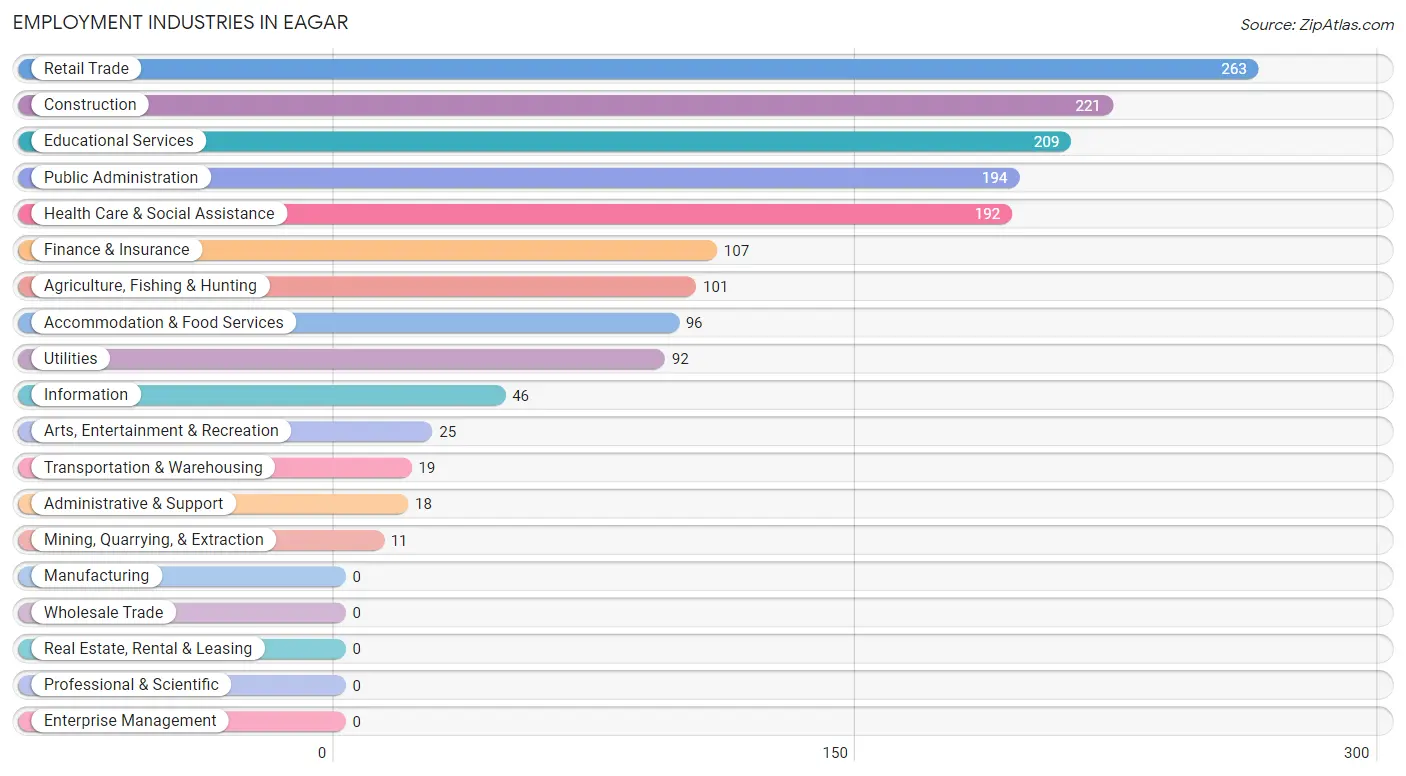
Employment Industries in Eagar
The major employment industries in Eagar include Retail Trade (263 | 16.5%), Construction (221 | 13.9%), Educational Services (209 | 13.1%), Public Administration (194 | 12.2%), and Health Care & Social Assistance (192 | 12.0%).
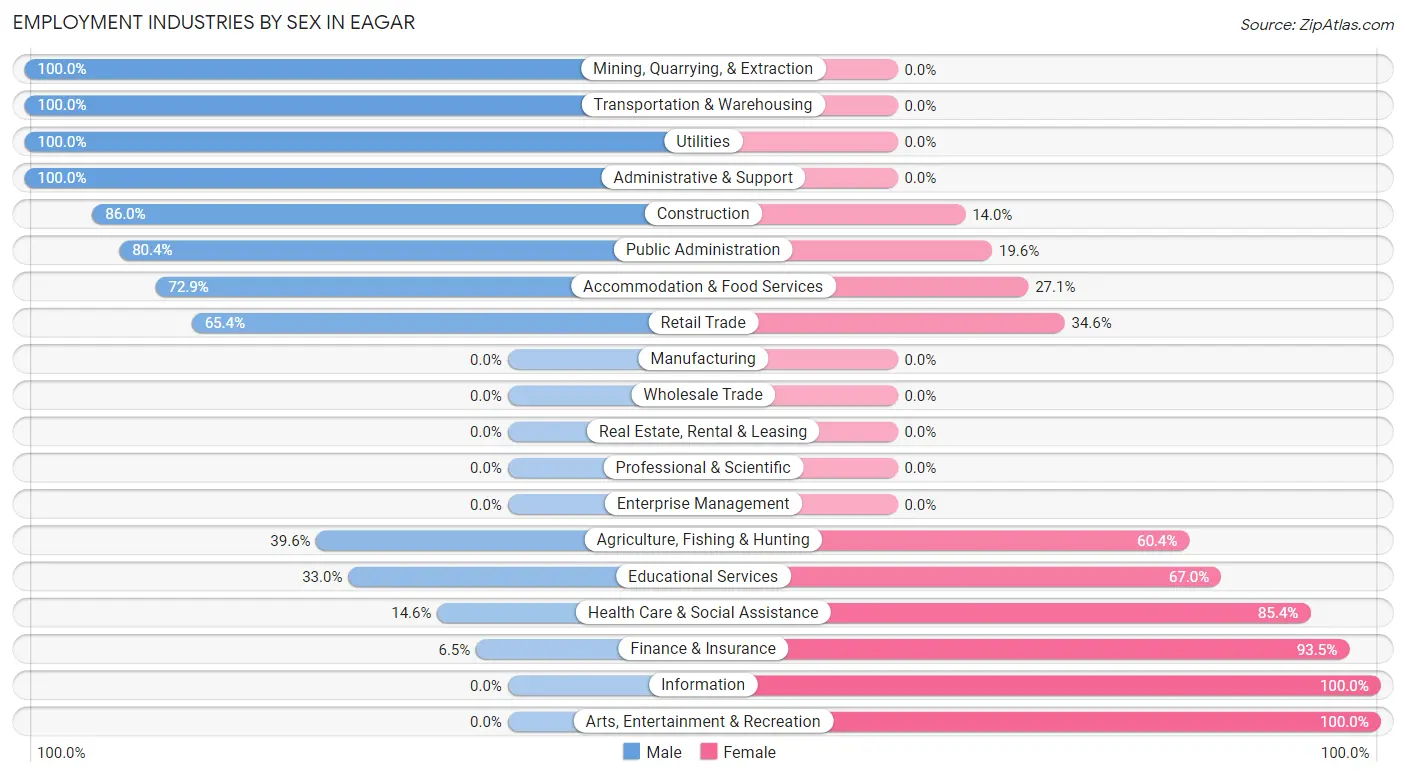
Employment Industries by Sex in Eagar
The Eagar industries that see more men than women are Mining, Quarrying, & Extraction (100.0%), Transportation & Warehousing (100.0%), and Utilities (100.0%), whereas the industries that tend to have a higher number of women are Information (100.0%), Arts, Entertainment & Recreation (100.0%), and Finance & Insurance (93.5%).
| Industry | Male | Female |
| Agriculture, Fishing & Hunting | 40 (39.6%) | 61 (60.4%) |
| Mining, Quarrying, & Extraction | 11 (100.0%) | 0 (0.0%) |
| Construction | 190 (86.0%) | 31 (14.0%) |
| Manufacturing | 0 (0.0%) | 0 (0.0%) |
| Wholesale Trade | 0 (0.0%) | 0 (0.0%) |
| Retail Trade | 172 (65.4%) | 91 (34.6%) |
| Transportation & Warehousing | 19 (100.0%) | 0 (0.0%) |
| Utilities | 92 (100.0%) | 0 (0.0%) |
| Information | 0 (0.0%) | 46 (100.0%) |
| Finance & Insurance | 7 (6.5%) | 100 (93.5%) |
| Real Estate, Rental & Leasing | 0 (0.0%) | 0 (0.0%) |
| Professional & Scientific | 0 (0.0%) | 0 (0.0%) |
| Enterprise Management | 0 (0.0%) | 0 (0.0%) |
| Administrative & Support | 18 (100.0%) | 0 (0.0%) |
| Educational Services | 69 (33.0%) | 140 (67.0%) |
| Health Care & Social Assistance | 28 (14.6%) | 164 (85.4%) |
| Arts, Entertainment & Recreation | 0 (0.0%) | 25 (100.0%) |
| Accommodation & Food Services | 70 (72.9%) | 26 (27.1%) |
| Public Administration | 156 (80.4%) | 38 (19.6%) |
| Total | 872 (54.7%) | 722 (45.3%) |
Education in Eagar
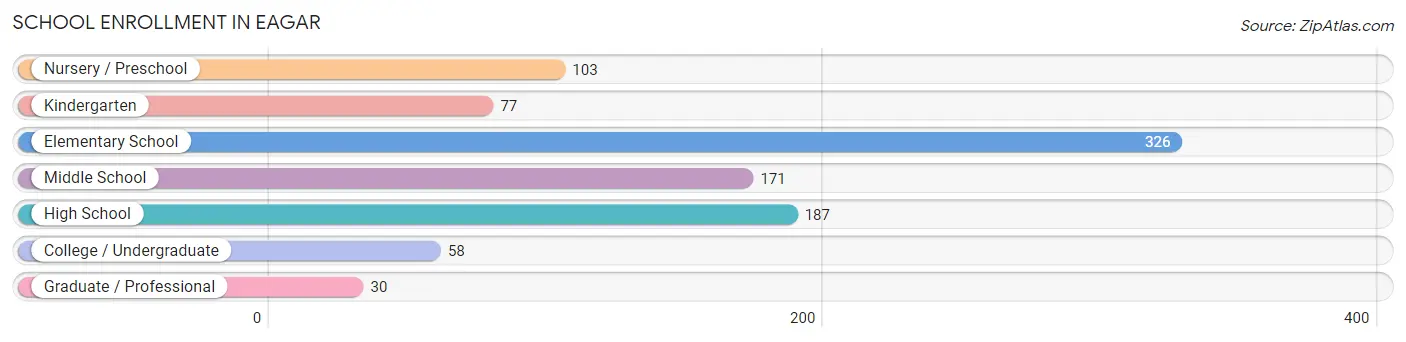
School Enrollment in Eagar
The most common levels of schooling among the 952 students in Eagar are elementary school (326 | 34.2%), high school (187 | 19.6%), and middle school (171 | 18.0%).
| School Level | # Students | % Students |
| Nursery / Preschool | 103 | 10.8% |
| Kindergarten | 77 | 8.1% |
| Elementary School | 326 | 34.2% |
| Middle School | 171 | 18.0% |
| High School | 187 | 19.6% |
| College / Undergraduate | 58 | 6.1% |
| Graduate / Professional | 30 | 3.2% |
| Total | 952 | 100.0% |
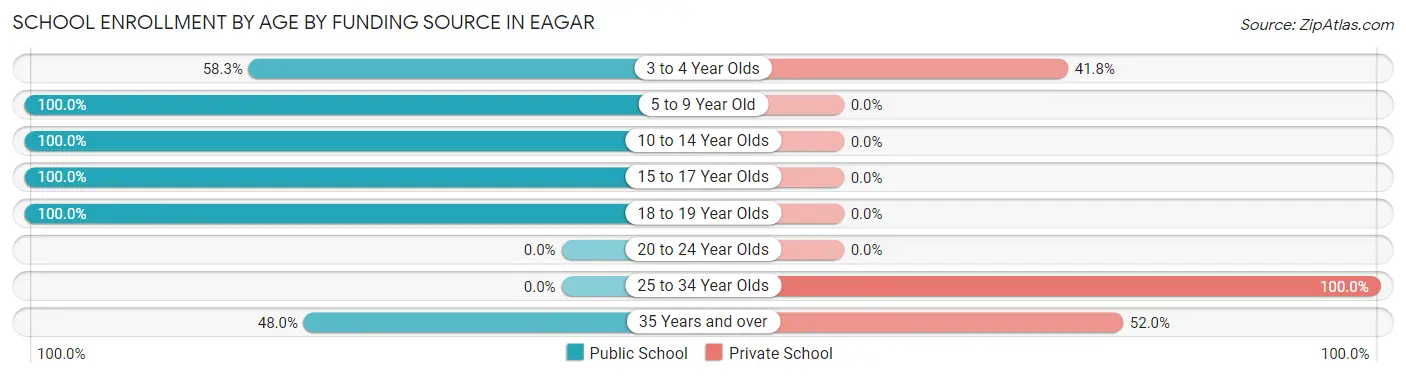
School Enrollment by Age by Funding Source in Eagar
Out of a total of 952 students who are enrolled in schools in Eagar, 107 (11.2%) attend a private institution, while the remaining 845 (88.8%) are enrolled in public schools. The age group of 25 to 34 year olds has the highest likelihood of being enrolled in private schools, with 38 (100.0% in the age bracket) enrolled. Conversely, the age group of 5 to 9 year old has the lowest likelihood of being enrolled in a private school, with 360 (100.0% in the age bracket) attending a public institution.
| Age Bracket | Public School | Private School |
| 3 to 4 Year Olds | 60 (58.3%) | 43 (41.7%) |
| 5 to 9 Year Old | 360 (100.0%) | 0 (0.0%) |
| 10 to 14 Year Olds | 214 (100.0%) | 0 (0.0%) |
| 15 to 17 Year Olds | 134 (100.0%) | 0 (0.0%) |
| 18 to 19 Year Olds | 53 (100.0%) | 0 (0.0%) |
| 20 to 24 Year Olds | 0 (0.0%) | 0 (0.0%) |
| 25 to 34 Year Olds | 0 (0.0%) | 38 (100.0%) |
| 35 Years and over | 24 (48.0%) | 26 (52.0%) |
| Total | 845 (88.8%) | 107 (11.2%) |
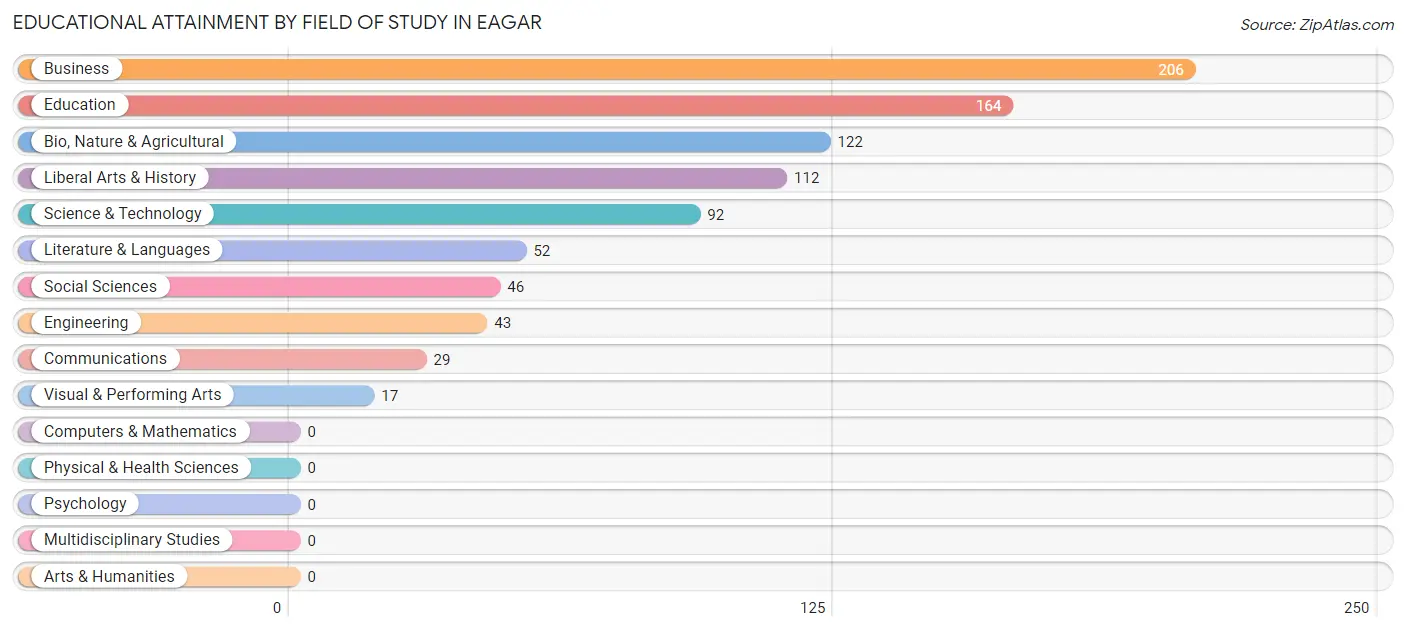
Educational Attainment by Field of Study in Eagar
Business (206 | 23.3%), education (164 | 18.6%), bio, nature & agricultural (122 | 13.8%), liberal arts & history (112 | 12.7%), and science & technology (92 | 10.4%) are the most common fields of study among 883 individuals in Eagar who have obtained a bachelor's degree or higher.
| Field of Study | # Graduates | % Graduates |
| Computers & Mathematics | 0 | 0.0% |
| Bio, Nature & Agricultural | 122 | 13.8% |
| Physical & Health Sciences | 0 | 0.0% |
| Psychology | 0 | 0.0% |
| Social Sciences | 46 | 5.2% |
| Engineering | 43 | 4.9% |
| Multidisciplinary Studies | 0 | 0.0% |
| Science & Technology | 92 | 10.4% |
| Business | 206 | 23.3% |
| Education | 164 | 18.6% |
| Literature & Languages | 52 | 5.9% |
| Liberal Arts & History | 112 | 12.7% |
| Visual & Performing Arts | 17 | 1.9% |
| Communications | 29 | 3.3% |
| Arts & Humanities | 0 | 0.0% |
| Total | 883 | 100.0% |
Transportation & Commute in Eagar
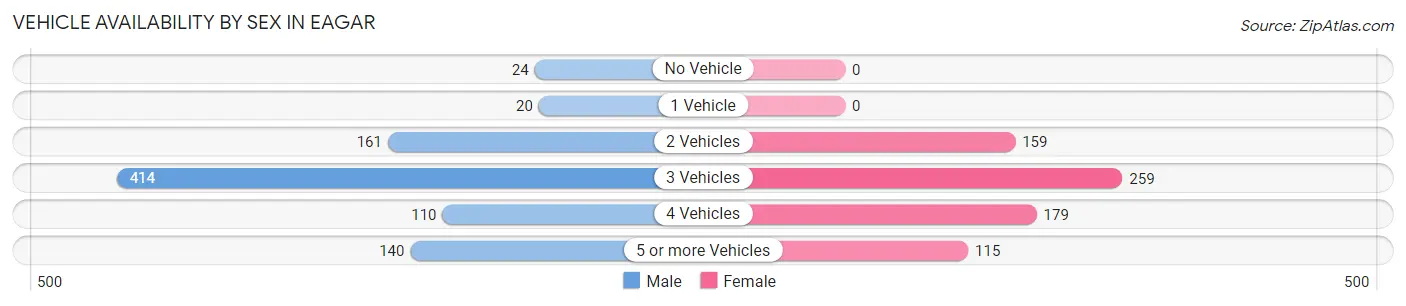
Vehicle Availability by Sex in Eagar
The most prevalent vehicle ownership categories in Eagar are males with 3 vehicles (414, accounting for 47.6%) and females with 3 vehicles (259, making up 58.2%).
| Vehicles Available | Male | Female |
| No Vehicle | 24 (2.8%) | 0 (0.0%) |
| 1 Vehicle | 20 (2.3%) | 0 (0.0%) |
| 2 Vehicles | 161 (18.5%) | 159 (22.3%) |
| 3 Vehicles | 414 (47.6%) | 259 (36.4%) |
| 4 Vehicles | 110 (12.7%) | 179 (25.1%) |
| 5 or more Vehicles | 140 (16.1%) | 115 (16.2%) |
| Total | 869 (100.0%) | 712 (100.0%) |
Commute Time in Eagar
The most frequently occuring commute durations in Eagar are 5 to 9 minutes (611 commuters, 40.0%), 10 to 14 minutes (278 commuters, 18.2%), and 30 to 34 minutes (131 commuters, 8.6%).
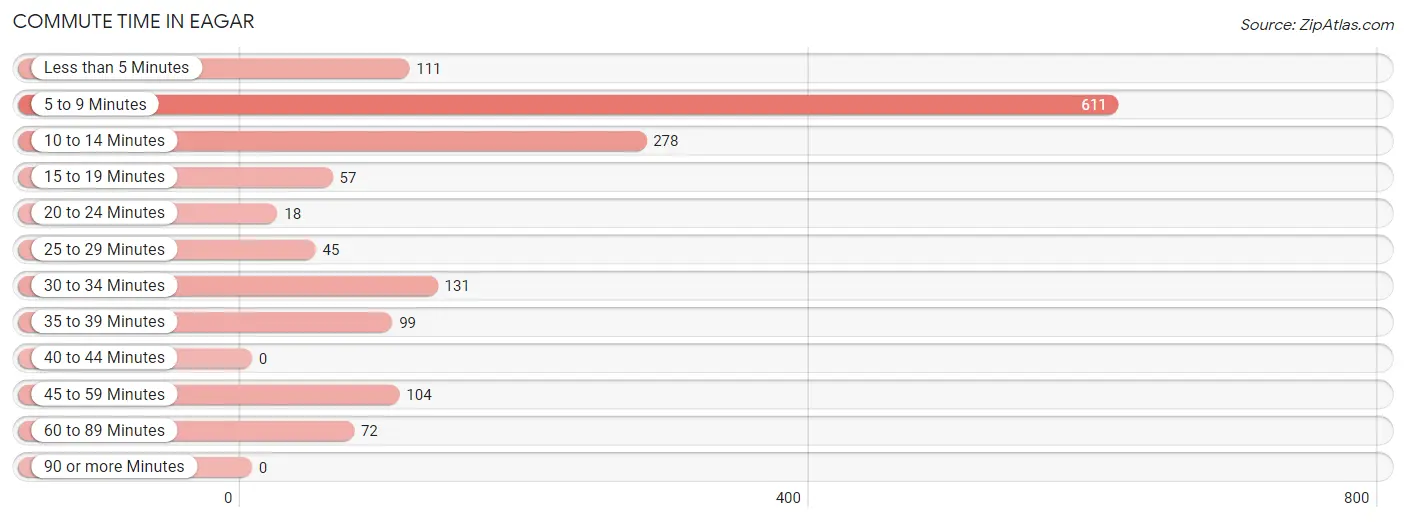
| Commute Time | # Commuters | % Commuters |
| Less than 5 Minutes | 111 | 7.3% |
| 5 to 9 Minutes | 611 | 40.0% |
| 10 to 14 Minutes | 278 | 18.2% |
| 15 to 19 Minutes | 57 | 3.7% |
| 20 to 24 Minutes | 18 | 1.2% |
| 25 to 29 Minutes | 45 | 2.9% |
| 30 to 34 Minutes | 131 | 8.6% |
| 35 to 39 Minutes | 99 | 6.5% |
| 40 to 44 Minutes | 0 | 0.0% |
| 45 to 59 Minutes | 104 | 6.8% |
| 60 to 89 Minutes | 72 | 4.7% |
| 90 or more Minutes | 0 | 0.0% |
Commute Time by Sex in Eagar
The most common commute times in Eagar are 5 to 9 minutes (329 commuters, 39.9%) for males and 5 to 9 minutes (282 commuters, 40.2%) for females.
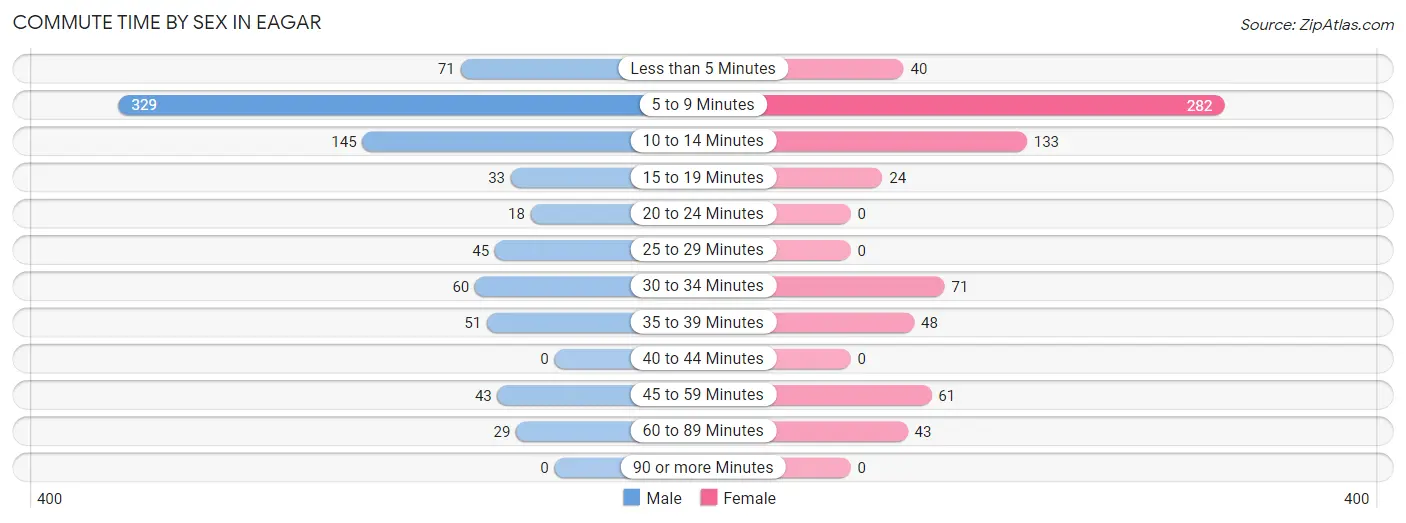
| Commute Time | Male | Female |
| Less than 5 Minutes | 71 (8.6%) | 40 (5.7%) |
| 5 to 9 Minutes | 329 (39.9%) | 282 (40.2%) |
| 10 to 14 Minutes | 145 (17.6%) | 133 (19.0%) |
| 15 to 19 Minutes | 33 (4.0%) | 24 (3.4%) |
| 20 to 24 Minutes | 18 (2.2%) | 0 (0.0%) |
| 25 to 29 Minutes | 45 (5.5%) | 0 (0.0%) |
| 30 to 34 Minutes | 60 (7.3%) | 71 (10.1%) |
| 35 to 39 Minutes | 51 (6.2%) | 48 (6.8%) |
| 40 to 44 Minutes | 0 (0.0%) | 0 (0.0%) |
| 45 to 59 Minutes | 43 (5.2%) | 61 (8.7%) |
| 60 to 89 Minutes | 29 (3.5%) | 43 (6.1%) |
| 90 or more Minutes | 0 (0.0%) | 0 (0.0%) |
Time of Departure to Work by Sex in Eagar
The most frequent times of departure to work in Eagar are 7:00 AM to 7:29 AM (212, 25.7%) for males and 6:30 AM to 6:59 AM (150, 21.4%) for females.
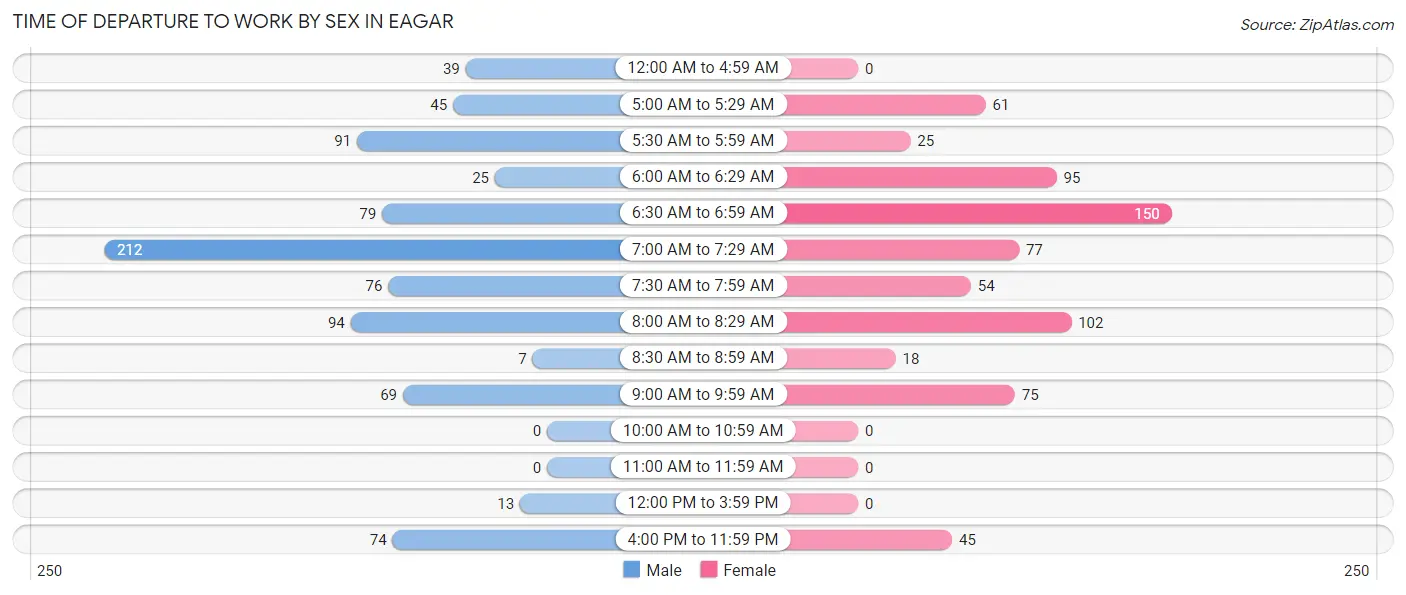
| Time of Departure | Male | Female |
| 12:00 AM to 4:59 AM | 39 (4.7%) | 0 (0.0%) |
| 5:00 AM to 5:29 AM | 45 (5.5%) | 61 (8.7%) |
| 5:30 AM to 5:59 AM | 91 (11.0%) | 25 (3.6%) |
| 6:00 AM to 6:29 AM | 25 (3.0%) | 95 (13.5%) |
| 6:30 AM to 6:59 AM | 79 (9.6%) | 150 (21.4%) |
| 7:00 AM to 7:29 AM | 212 (25.7%) | 77 (11.0%) |
| 7:30 AM to 7:59 AM | 76 (9.2%) | 54 (7.7%) |
| 8:00 AM to 8:29 AM | 94 (11.4%) | 102 (14.5%) |
| 8:30 AM to 8:59 AM | 7 (0.9%) | 18 (2.6%) |
| 9:00 AM to 9:59 AM | 69 (8.4%) | 75 (10.7%) |
| 10:00 AM to 10:59 AM | 0 (0.0%) | 0 (0.0%) |
| 11:00 AM to 11:59 AM | 0 (0.0%) | 0 (0.0%) |
| 12:00 PM to 3:59 PM | 13 (1.6%) | 0 (0.0%) |
| 4:00 PM to 11:59 PM | 74 (9.0%) | 45 (6.4%) |
| Total | 824 (100.0%) | 702 (100.0%) |
Housing Occupancy in Eagar
Occupancy by Ownership in Eagar
Of the total 1,539 dwellings in Eagar, owner-occupied units account for 1,272 (82.7%), while renter-occupied units make up 267 (17.3%).
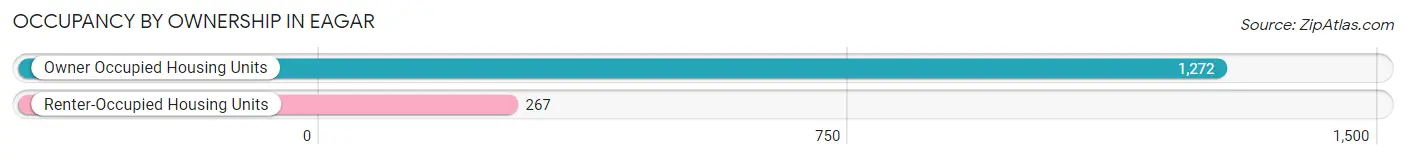
| Occupancy | # Housing Units | % Housing Units |
| Owner Occupied Housing Units | 1,272 | 82.7% |
| Renter-Occupied Housing Units | 267 | 17.3% |
| Total Occupied Housing Units | 1,539 | 100.0% |
Occupancy by Household Size in Eagar
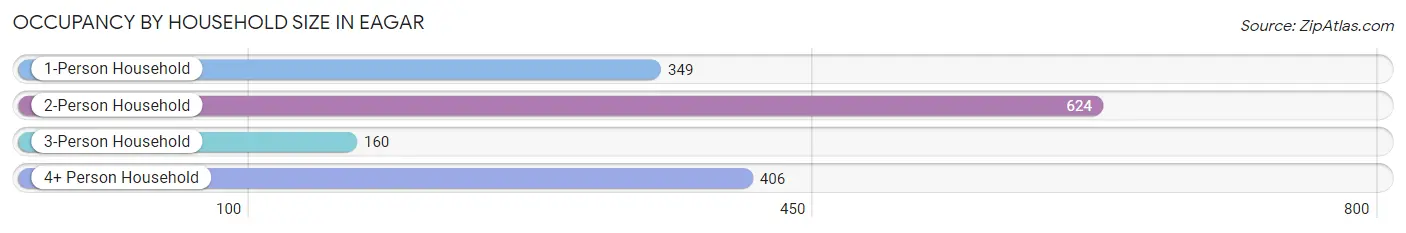
| Household Size | # Housing Units | % Housing Units |
| 1-Person Household | 349 | 22.7% |
| 2-Person Household | 624 | 40.6% |
| 3-Person Household | 160 | 10.4% |
| 4+ Person Household | 406 | 26.4% |
| Total Housing Units | 1,539 | 100.0% |
Occupancy by Ownership by Household Size in Eagar
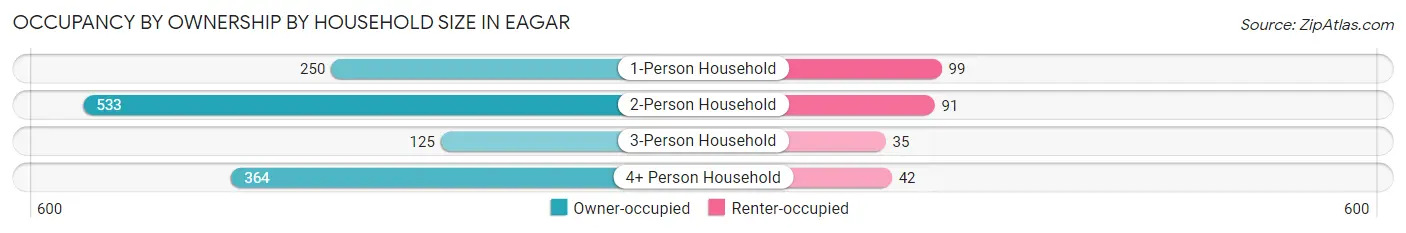
| Household Size | Owner-occupied | Renter-occupied |
| 1-Person Household | 250 (71.6%) | 99 (28.4%) |
| 2-Person Household | 533 (85.4%) | 91 (14.6%) |
| 3-Person Household | 125 (78.1%) | 35 (21.9%) |
| 4+ Person Household | 364 (89.7%) | 42 (10.3%) |
| Total Housing Units | 1,272 (82.7%) | 267 (17.3%) |
Occupancy by Educational Attainment in Eagar
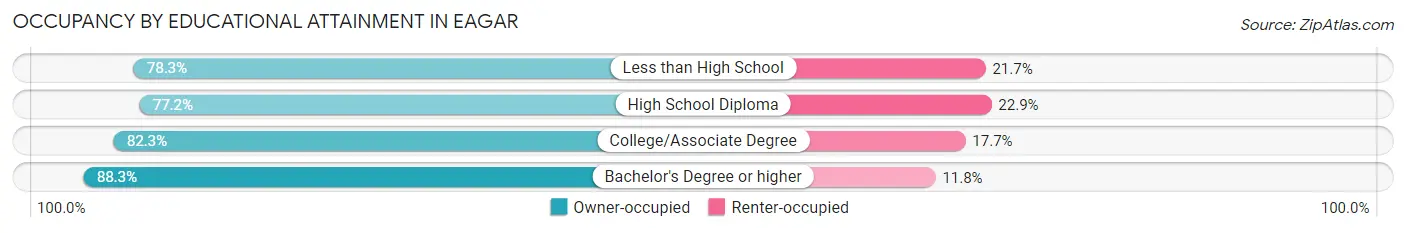
| Household Size | Owner-occupied | Renter-occupied |
| Less than High School | 94 (78.3%) | 26 (21.7%) |
| High School Diploma | 206 (77.1%) | 61 (22.9%) |
| College/Associate Degree | 619 (82.3%) | 133 (17.7%) |
| Bachelor's Degree or higher | 353 (88.2%) | 47 (11.7%) |
Occupancy by Age of Householder in Eagar
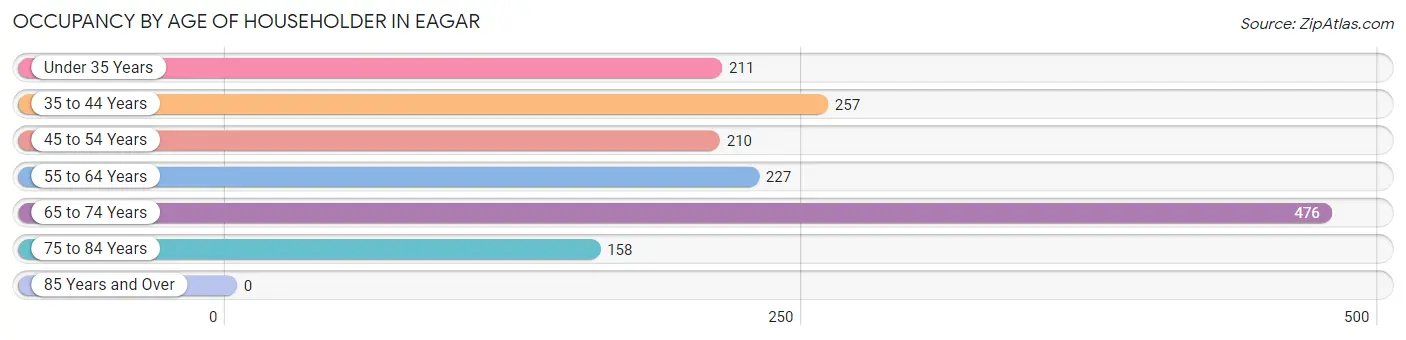
| Age Bracket | # Households | % Households |
| Under 35 Years | 211 | 13.7% |
| 35 to 44 Years | 257 | 16.7% |
| 45 to 54 Years | 210 | 13.7% |
| 55 to 64 Years | 227 | 14.7% |
| 65 to 74 Years | 476 | 30.9% |
| 75 to 84 Years | 158 | 10.3% |
| 85 Years and Over | 0 | 0.0% |
| Total | 1,539 | 100.0% |
Housing Finances in Eagar
Median Income by Occupancy in Eagar
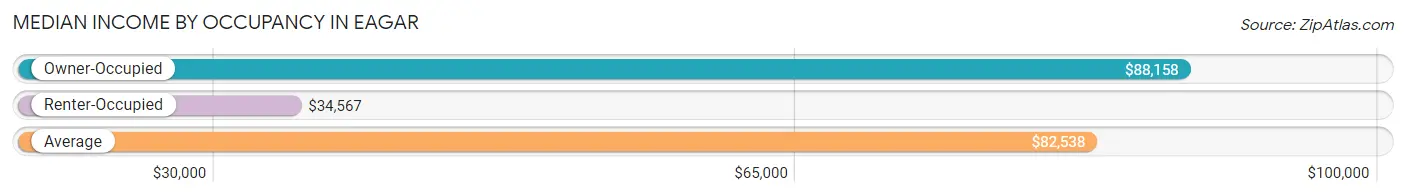
| Occupancy Type | # Households | Median Income |
| Owner-Occupied | 1,272 (82.7%) | $88,158 |
| Renter-Occupied | 267 (17.3%) | $34,567 |
| Average | 1,539 (100.0%) | $82,538 |
Occupancy by Householder Income Bracket in Eagar
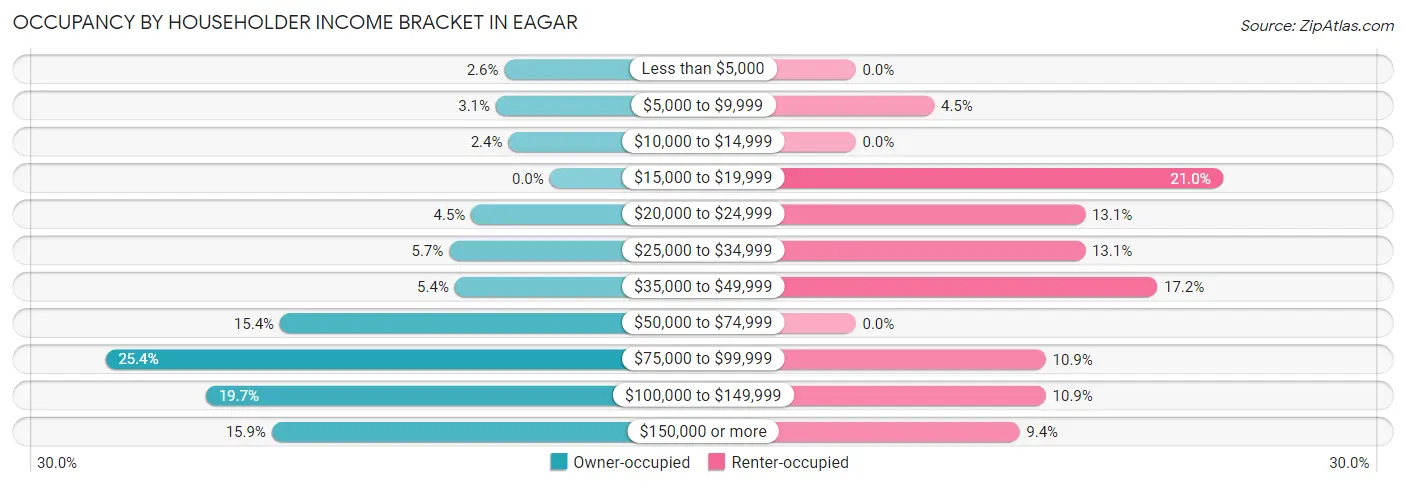
| Income Bracket | Owner-occupied | Renter-occupied |
| Less than $5,000 | 33 (2.6%) | 0 (0.0%) |
| $5,000 to $9,999 | 39 (3.1%) | 12 (4.5%) |
| $10,000 to $14,999 | 30 (2.4%) | 0 (0.0%) |
| $15,000 to $19,999 | 0 (0.0%) | 56 (21.0%) |
| $20,000 to $24,999 | 57 (4.5%) | 35 (13.1%) |
| $25,000 to $34,999 | 73 (5.7%) | 35 (13.1%) |
| $35,000 to $49,999 | 69 (5.4%) | 46 (17.2%) |
| $50,000 to $74,999 | 196 (15.4%) | 0 (0.0%) |
| $75,000 to $99,999 | 323 (25.4%) | 29 (10.9%) |
| $100,000 to $149,999 | 250 (19.7%) | 29 (10.9%) |
| $150,000 or more | 202 (15.9%) | 25 (9.4%) |
| Total | 1,272 (100.0%) | 267 (100.0%) |
Monthly Housing Cost Tiers in Eagar
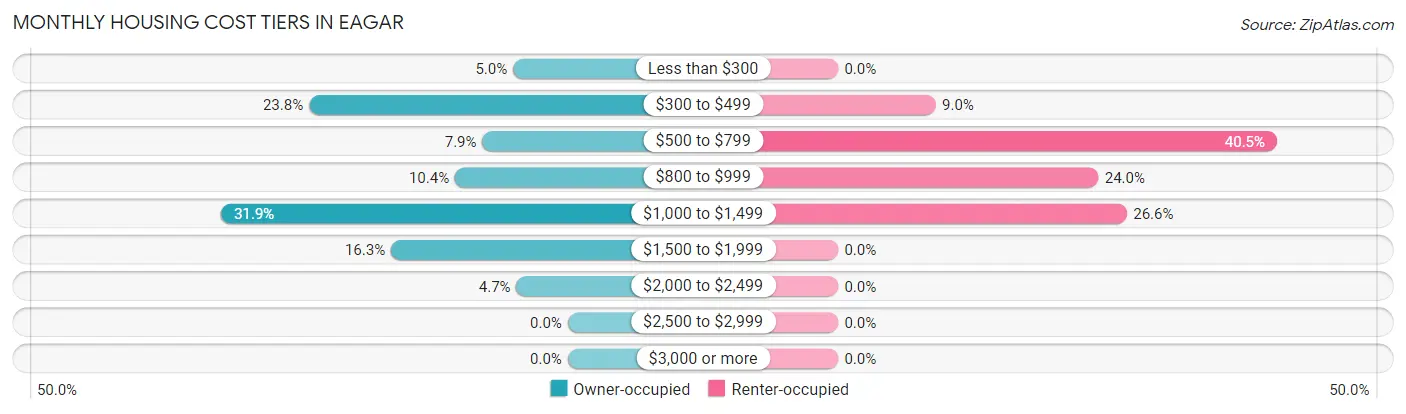
| Monthly Cost | Owner-occupied | Renter-occupied |
| Less than $300 | 64 (5.0%) | 0 (0.0%) |
| $300 to $499 | 303 (23.8%) | 24 (9.0%) |
| $500 to $799 | 100 (7.9%) | 108 (40.5%) |
| $800 to $999 | 132 (10.4%) | 64 (24.0%) |
| $1,000 to $1,499 | 406 (31.9%) | 71 (26.6%) |
| $1,500 to $1,999 | 207 (16.3%) | 0 (0.0%) |
| $2,000 to $2,499 | 60 (4.7%) | 0 (0.0%) |
| $2,500 to $2,999 | 0 (0.0%) | 0 (0.0%) |
| $3,000 or more | 0 (0.0%) | 0 (0.0%) |
| Total | 1,272 (100.0%) | 267 (100.0%) |
Physical Housing Characteristics in Eagar
Housing Structures in Eagar
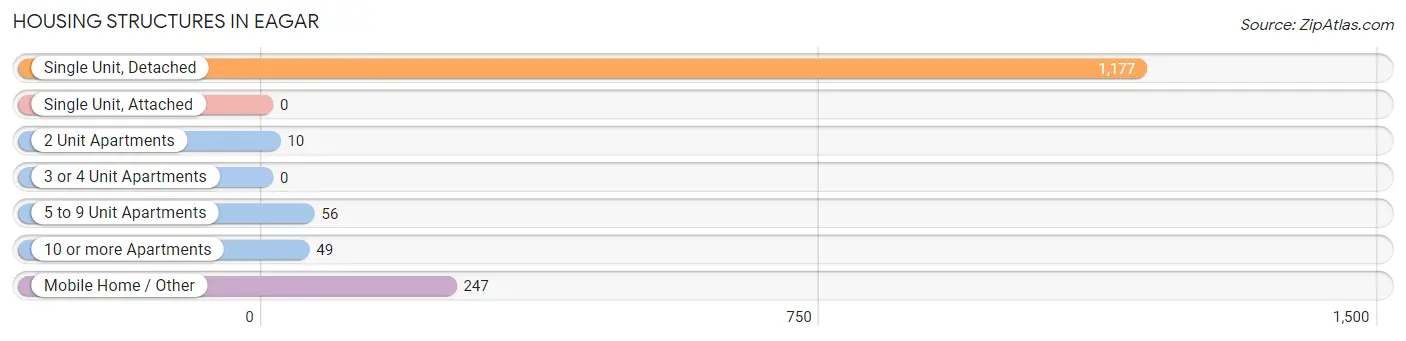
| Structure Type | # Housing Units | % Housing Units |
| Single Unit, Detached | 1,177 | 76.5% |
| Single Unit, Attached | 0 | 0.0% |
| 2 Unit Apartments | 10 | 0.6% |
| 3 or 4 Unit Apartments | 0 | 0.0% |
| 5 to 9 Unit Apartments | 56 | 3.6% |
| 10 or more Apartments | 49 | 3.2% |
| Mobile Home / Other | 247 | 16.1% |
| Total | 1,539 | 100.0% |
Housing Structures by Occupancy in Eagar
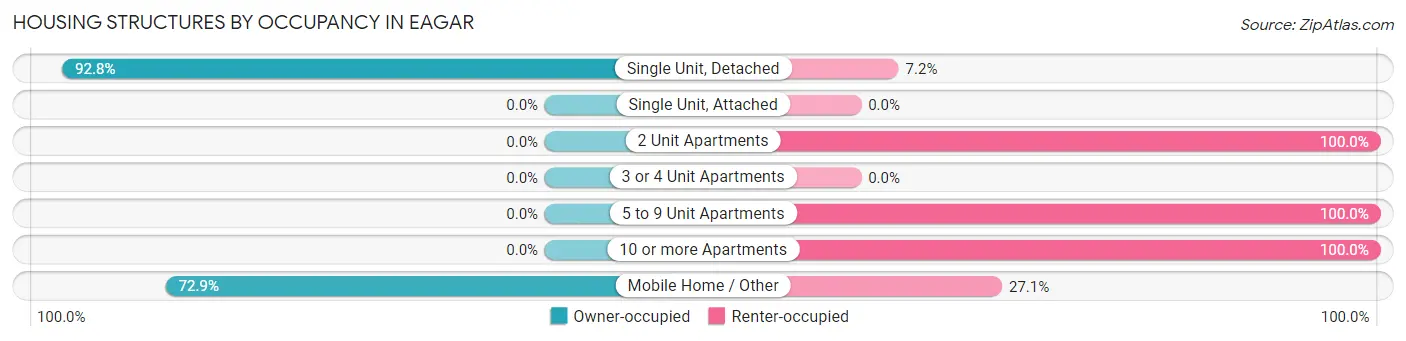
| Structure Type | Owner-occupied | Renter-occupied |
| Single Unit, Detached | 1,092 (92.8%) | 85 (7.2%) |
| Single Unit, Attached | 0 (0.0%) | 0 (0.0%) |
| 2 Unit Apartments | 0 (0.0%) | 10 (100.0%) |
| 3 or 4 Unit Apartments | 0 (0.0%) | 0 (0.0%) |
| 5 to 9 Unit Apartments | 0 (0.0%) | 56 (100.0%) |
| 10 or more Apartments | 0 (0.0%) | 49 (100.0%) |
| Mobile Home / Other | 180 (72.9%) | 67 (27.1%) |
| Total | 1,272 (82.7%) | 267 (17.3%) |
Housing Structures by Number of Rooms in Eagar
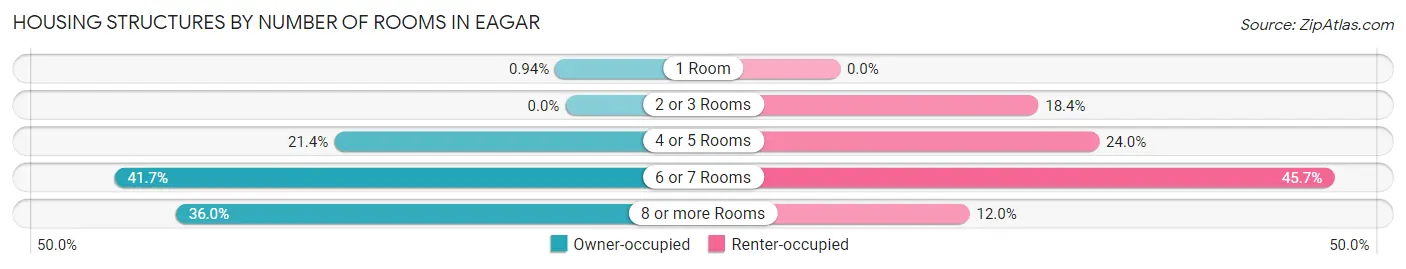
| Number of Rooms | Owner-occupied | Renter-occupied |
| 1 Room | 12 (0.9%) | 0 (0.0%) |
| 2 or 3 Rooms | 0 (0.0%) | 49 (18.3%) |
| 4 or 5 Rooms | 272 (21.4%) | 64 (24.0%) |
| 6 or 7 Rooms | 530 (41.7%) | 122 (45.7%) |
| 8 or more Rooms | 458 (36.0%) | 32 (12.0%) |
| Total | 1,272 (100.0%) | 267 (100.0%) |
Housing Structure by Heating Type in Eagar
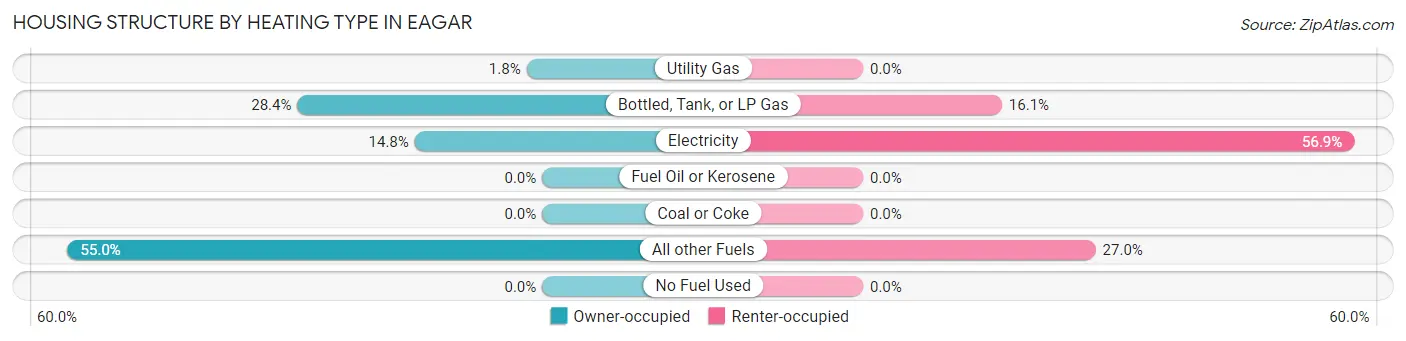
| Heating Type | Owner-occupied | Renter-occupied |
| Utility Gas | 23 (1.8%) | 0 (0.0%) |
| Bottled, Tank, or LP Gas | 361 (28.4%) | 43 (16.1%) |
| Electricity | 188 (14.8%) | 152 (56.9%) |
| Fuel Oil or Kerosene | 0 (0.0%) | 0 (0.0%) |
| Coal or Coke | 0 (0.0%) | 0 (0.0%) |
| All other Fuels | 700 (55.0%) | 72 (27.0%) |
| No Fuel Used | 0 (0.0%) | 0 (0.0%) |
| Total | 1,272 (100.0%) | 267 (100.0%) |
Household Vehicle Usage in Eagar
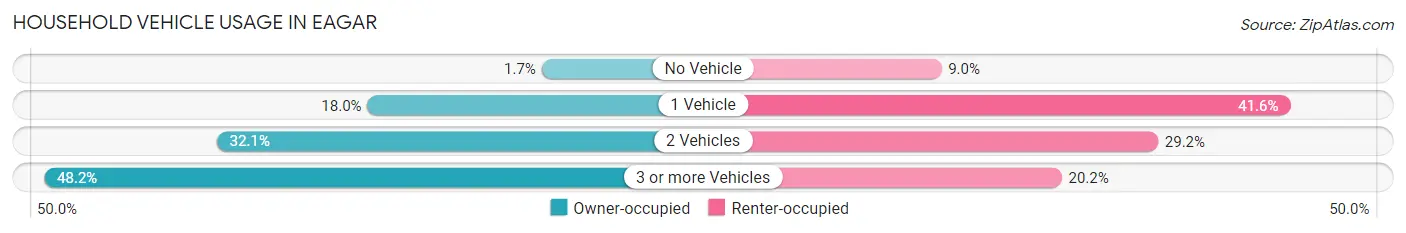
| Vehicles per Household | Owner-occupied | Renter-occupied |
| No Vehicle | 22 (1.7%) | 24 (9.0%) |
| 1 Vehicle | 229 (18.0%) | 111 (41.6%) |
| 2 Vehicles | 408 (32.1%) | 78 (29.2%) |
| 3 or more Vehicles | 613 (48.2%) | 54 (20.2%) |
| Total | 1,272 (100.0%) | 267 (100.0%) |
Real Estate & Mortgages in Eagar
Real Estate and Mortgage Overview in Eagar
| Characteristic | Without Mortgage | With Mortgage |
| Housing Units | 448 | 824 |
| Median Property Value | $197,400 | $214,500 |
| Median Household Income | $61,905 | $153 |
| Monthly Housing Costs | $347 | $0 |
| Real Estate Taxes | $514 | $21 |
Property Value by Mortgage Status in Eagar
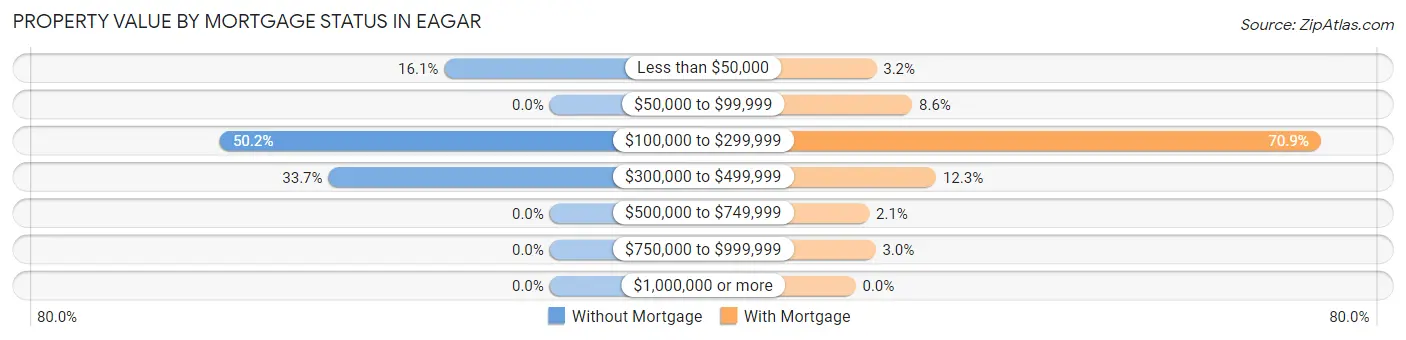
| Property Value | Without Mortgage | With Mortgage |
| Less than $50,000 | 72 (16.1%) | 26 (3.2%) |
| $50,000 to $99,999 | 0 (0.0%) | 71 (8.6%) |
| $100,000 to $299,999 | 225 (50.2%) | 584 (70.9%) |
| $300,000 to $499,999 | 151 (33.7%) | 101 (12.3%) |
| $500,000 to $749,999 | 0 (0.0%) | 17 (2.1%) |
| $750,000 to $999,999 | 0 (0.0%) | 25 (3.0%) |
| $1,000,000 or more | 0 (0.0%) | 0 (0.0%) |
| Total | 448 (100.0%) | 824 (100.0%) |
Household Income by Mortgage Status in Eagar
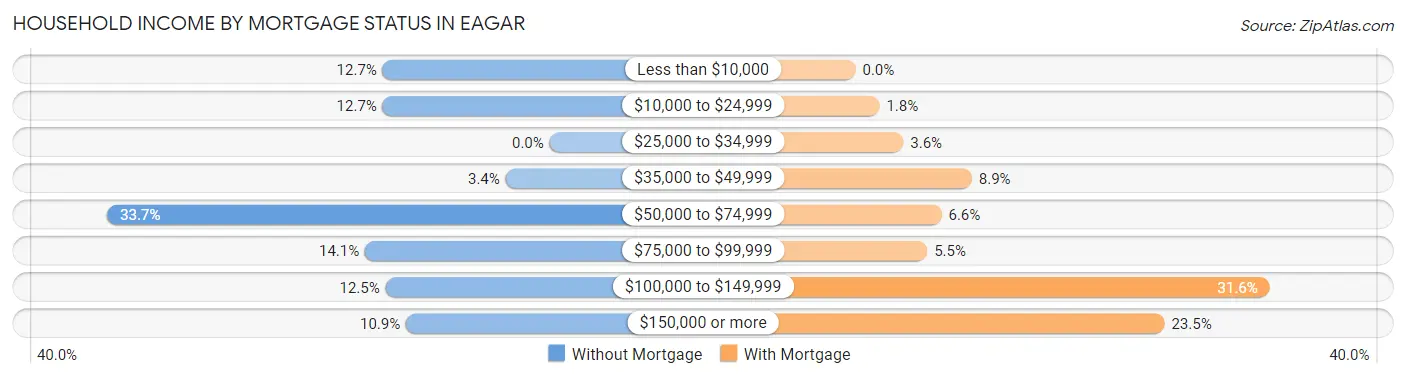
| Household Income | Without Mortgage | With Mortgage |
| Less than $10,000 | 57 (12.7%) | 0 (0.0%) |
| $10,000 to $24,999 | 57 (12.7%) | 15 (1.8%) |
| $25,000 to $34,999 | 0 (0.0%) | 30 (3.6%) |
| $35,000 to $49,999 | 15 (3.4%) | 73 (8.9%) |
| $50,000 to $74,999 | 151 (33.7%) | 54 (6.6%) |
| $75,000 to $99,999 | 63 (14.1%) | 45 (5.5%) |
| $100,000 to $149,999 | 56 (12.5%) | 260 (31.6%) |
| $150,000 or more | 49 (10.9%) | 194 (23.5%) |
| Total | 448 (100.0%) | 824 (100.0%) |
Property Value to Household Income Ratio in Eagar
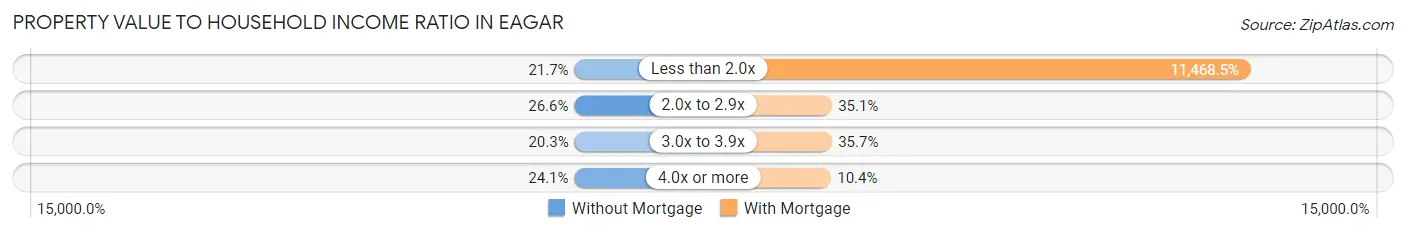
| Value-to-Income Ratio | Without Mortgage | With Mortgage |
| Less than 2.0x | 97 (21.6%) | 94,500 (11,468.4%) |
| 2.0x to 2.9x | 119 (26.6%) | 289 (35.1%) |
| 3.0x to 3.9x | 91 (20.3%) | 294 (35.7%) |
| 4.0x or more | 108 (24.1%) | 86 (10.4%) |
| Total | 448 (100.0%) | 824 (100.0%) |
Real Estate Taxes by Mortgage Status in Eagar
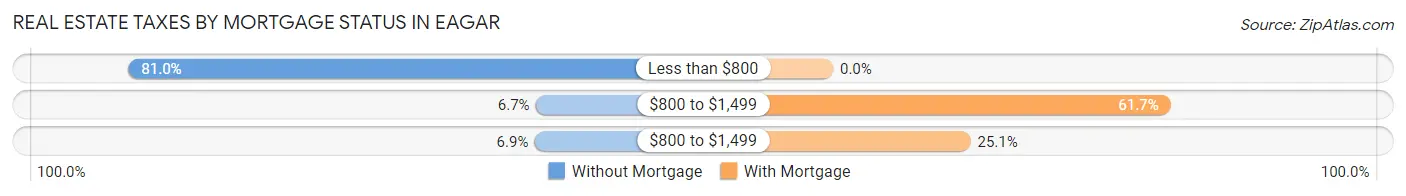
| Property Taxes | Without Mortgage | With Mortgage |
| Less than $800 | 363 (81.0%) | 0 (0.0%) |
| $800 to $1,499 | 30 (6.7%) | 508 (61.7%) |
| $800 to $1,499 | 31 (6.9%) | 207 (25.1%) |
| Total | 448 (100.0%) | 824 (100.0%) |
Health & Disability in Eagar
Health Insurance Coverage by Age in Eagar
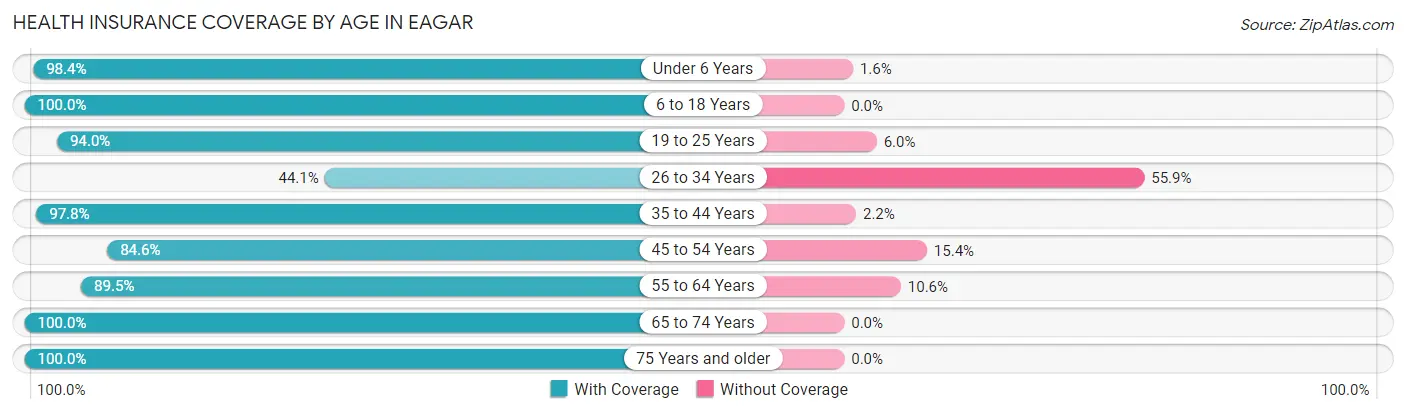
| Age Bracket | With Coverage | Without Coverage |
| Under 6 Years | 425 (98.4%) | 7 (1.6%) |
| 6 to 18 Years | 698 (100.0%) | 0 (0.0%) |
| 19 to 25 Years | 171 (94.0%) | 11 (6.0%) |
| 26 to 34 Years | 267 (44.1%) | 339 (55.9%) |
| 35 to 44 Years | 491 (97.8%) | 11 (2.2%) |
| 45 to 54 Years | 280 (84.6%) | 51 (15.4%) |
| 55 to 64 Years | 458 (89.4%) | 54 (10.5%) |
| 65 to 74 Years | 973 (100.0%) | 0 (0.0%) |
| 75 Years and older | 189 (100.0%) | 0 (0.0%) |
| Total | 3,952 (89.3%) | 473 (10.7%) |
Health Insurance Coverage by Citizenship Status in Eagar
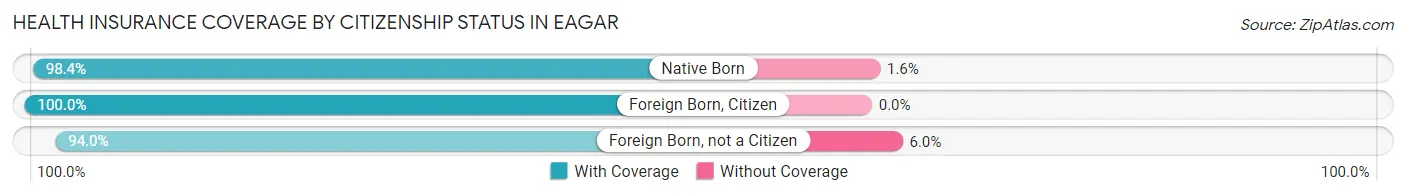
| Citizenship Status | With Coverage | Without Coverage |
| Native Born | 425 (98.4%) | 7 (1.6%) |
| Foreign Born, Citizen | 698 (100.0%) | 0 (0.0%) |
| Foreign Born, not a Citizen | 171 (94.0%) | 11 (6.0%) |
Health Insurance Coverage by Household Income in Eagar
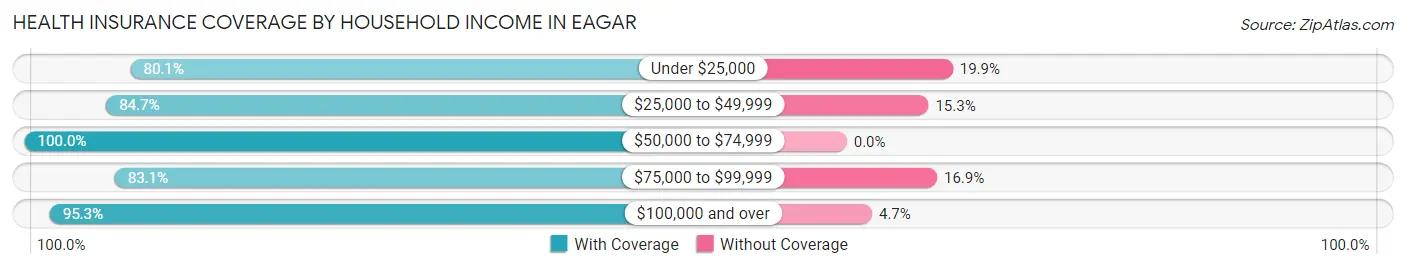
| Household Income | With Coverage | Without Coverage |
| Under $25,000 | 444 (80.1%) | 110 (19.9%) |
| $25,000 to $49,999 | 559 (84.7%) | 101 (15.3%) |
| $50,000 to $74,999 | 440 (100.0%) | 0 (0.0%) |
| $75,000 to $99,999 | 899 (83.1%) | 183 (16.9%) |
| $100,000 and over | 1,590 (95.3%) | 79 (4.7%) |
Public vs Private Health Insurance Coverage by Age in Eagar
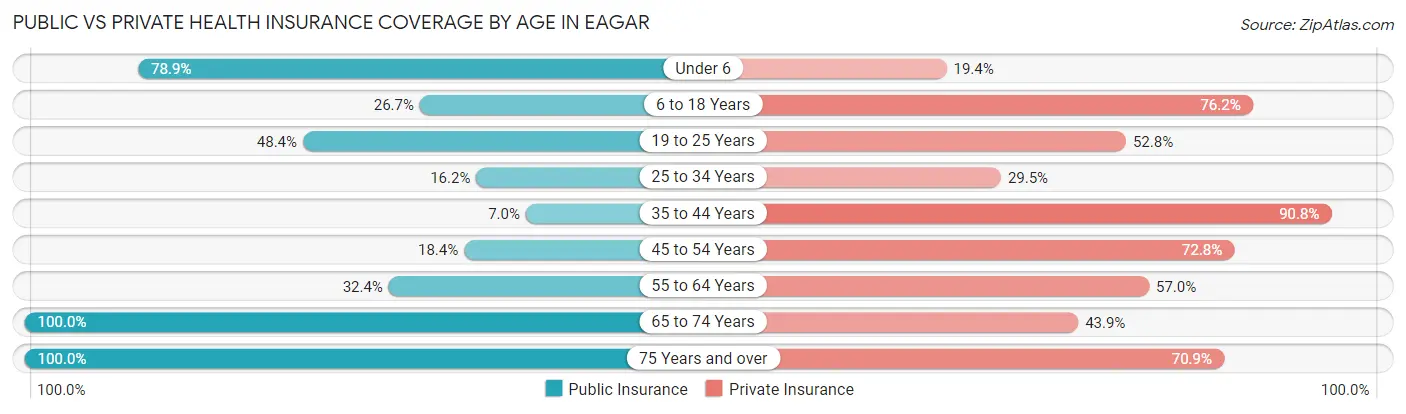
| Age Bracket | Public Insurance | Private Insurance |
| Under 6 | 341 (78.9%) | 84 (19.4%) |
| 6 to 18 Years | 186 (26.7%) | 532 (76.2%) |
| 19 to 25 Years | 88 (48.3%) | 96 (52.7%) |
| 25 to 34 Years | 98 (16.2%) | 179 (29.5%) |
| 35 to 44 Years | 35 (7.0%) | 456 (90.8%) |
| 45 to 54 Years | 61 (18.4%) | 241 (72.8%) |
| 55 to 64 Years | 166 (32.4%) | 292 (57.0%) |
| 65 to 74 Years | 973 (100.0%) | 427 (43.9%) |
| 75 Years and over | 189 (100.0%) | 134 (70.9%) |
| Total | 2,137 (48.3%) | 2,441 (55.2%) |
Disability Status by Sex by Age in Eagar
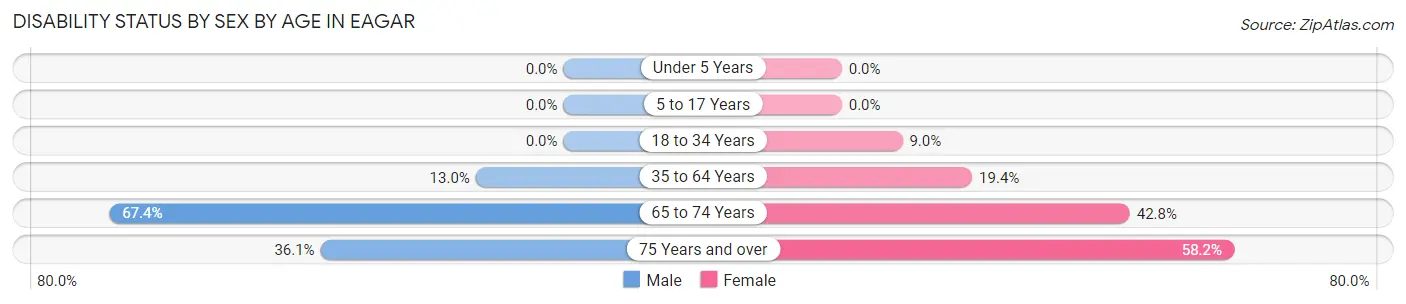
| Age Bracket | Male | Female |
| Under 5 Years | 0 (0.0%) | 0 (0.0%) |
| 5 to 17 Years | 0 (0.0%) | 0 (0.0%) |
| 18 to 34 Years | 0 (0.0%) | 30 (9.0%) |
| 35 to 64 Years | 81 (13.0%) | 140 (19.4%) |
| 65 to 74 Years | 325 (67.4%) | 210 (42.8%) |
| 75 Years and over | 44 (36.1%) | 39 (58.2%) |
Disability Class by Sex by Age in Eagar
Disability Class: Hearing Difficulty
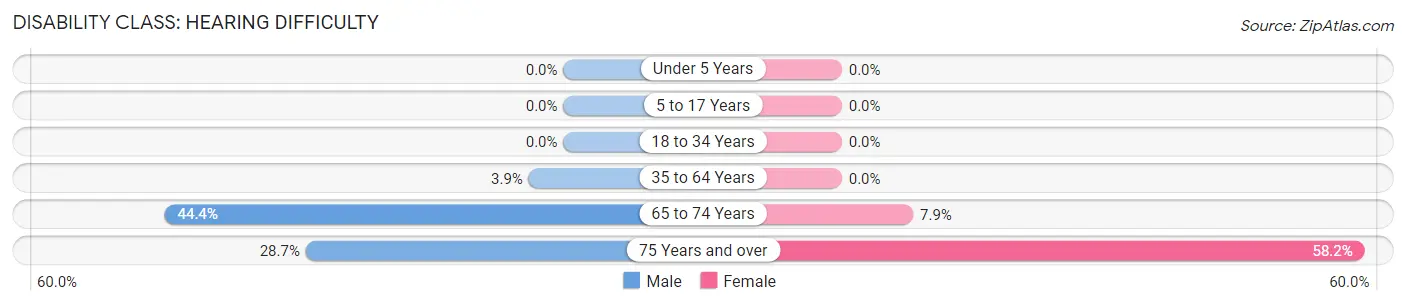
| Age Bracket | Male | Female |
| Under 5 Years | 0 (0.0%) | 0 (0.0%) |
| 5 to 17 Years | 0 (0.0%) | 0 (0.0%) |
| 18 to 34 Years | 0 (0.0%) | 0 (0.0%) |
| 35 to 64 Years | 24 (3.9%) | 0 (0.0%) |
| 65 to 74 Years | 214 (44.4%) | 39 (7.9%) |
| 75 Years and over | 35 (28.7%) | 39 (58.2%) |
Disability Class: Vision Difficulty
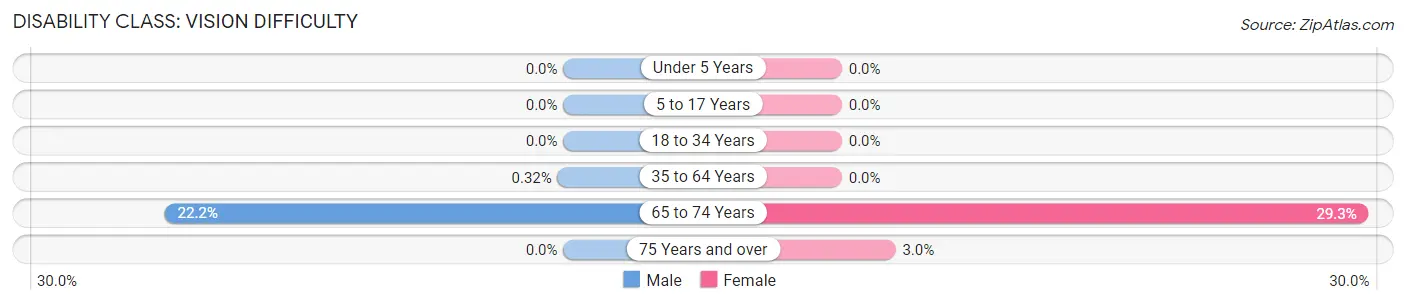
| Age Bracket | Male | Female |
| Under 5 Years | 0 (0.0%) | 0 (0.0%) |
| 5 to 17 Years | 0 (0.0%) | 0 (0.0%) |
| 18 to 34 Years | 0 (0.0%) | 0 (0.0%) |
| 35 to 64 Years | 2 (0.3%) | 0 (0.0%) |
| 65 to 74 Years | 107 (22.2%) | 144 (29.3%) |
| 75 Years and over | 0 (0.0%) | 2 (3.0%) |
Disability Class: Cognitive Difficulty
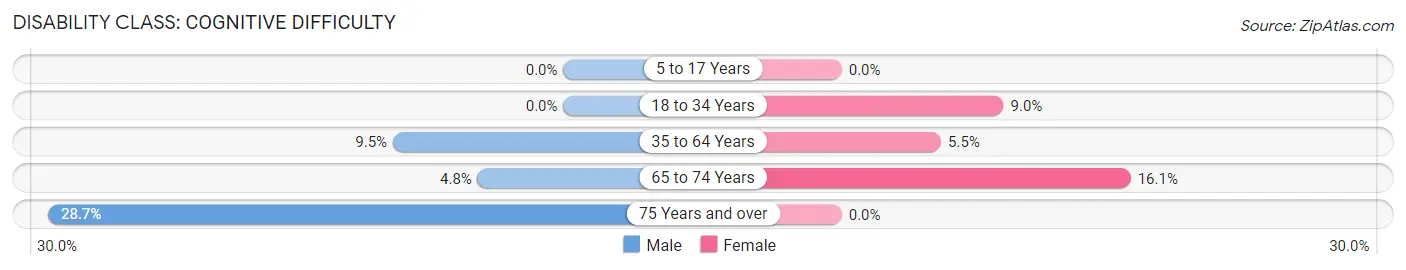
| Age Bracket | Male | Female |
| 5 to 17 Years | 0 (0.0%) | 0 (0.0%) |
| 18 to 34 Years | 0 (0.0%) | 30 (9.0%) |
| 35 to 64 Years | 59 (9.5%) | 40 (5.5%) |
| 65 to 74 Years | 23 (4.8%) | 79 (16.1%) |
| 75 Years and over | 35 (28.7%) | 0 (0.0%) |
Disability Class: Ambulatory Difficulty
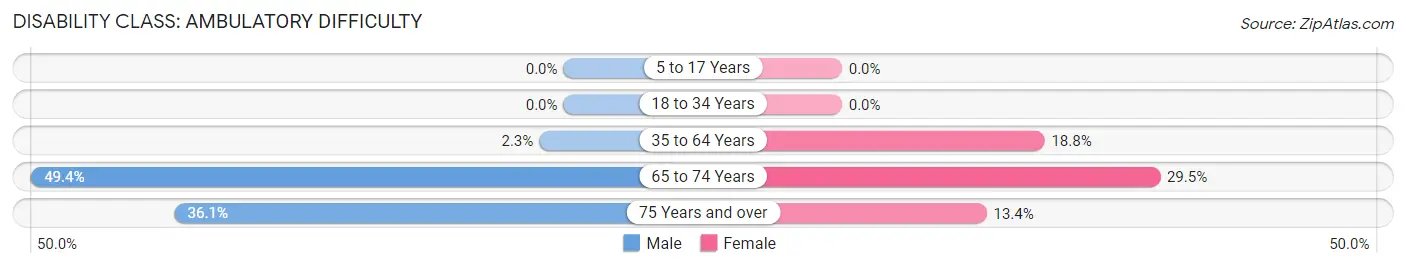
| Age Bracket | Male | Female |
| 5 to 17 Years | 0 (0.0%) | 0 (0.0%) |
| 18 to 34 Years | 0 (0.0%) | 0 (0.0%) |
| 35 to 64 Years | 14 (2.2%) | 136 (18.8%) |
| 65 to 74 Years | 238 (49.4%) | 145 (29.5%) |
| 75 Years and over | 44 (36.1%) | 9 (13.4%) |
Disability Class: Self-Care Difficulty
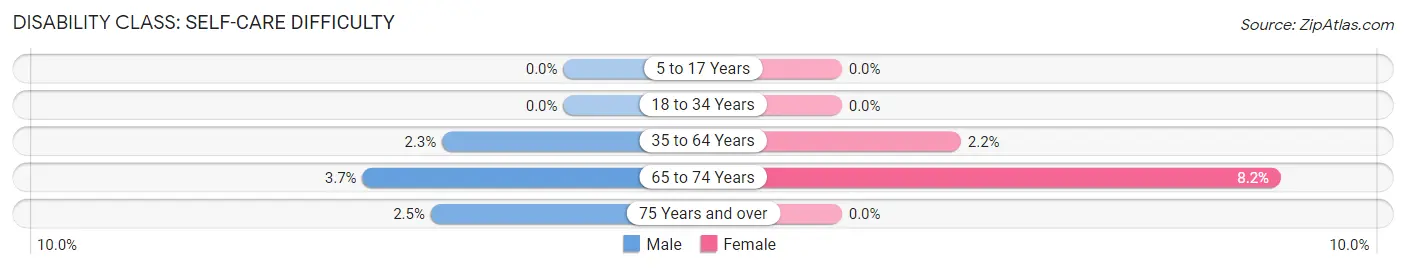
| Age Bracket | Male | Female |
| 5 to 17 Years | 0 (0.0%) | 0 (0.0%) |
| 18 to 34 Years | 0 (0.0%) | 0 (0.0%) |
| 35 to 64 Years | 14 (2.2%) | 16 (2.2%) |
| 65 to 74 Years | 18 (3.7%) | 40 (8.2%) |
| 75 Years and over | 3 (2.5%) | 0 (0.0%) |
Technology Access in Eagar
Computing Device Access in Eagar
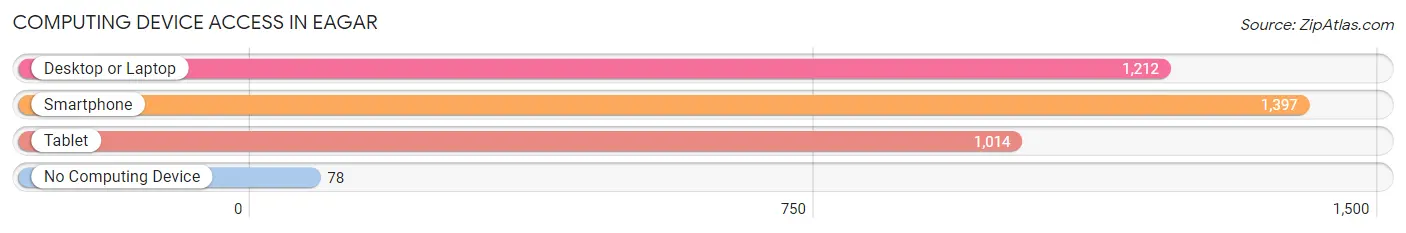
| Device Type | # Households | % Households |
| Desktop or Laptop | 1,212 | 78.7% |
| Smartphone | 1,397 | 90.8% |
| Tablet | 1,014 | 65.9% |
| No Computing Device | 78 | 5.1% |
| Total | 1,539 | 100.0% |
Internet Access in Eagar
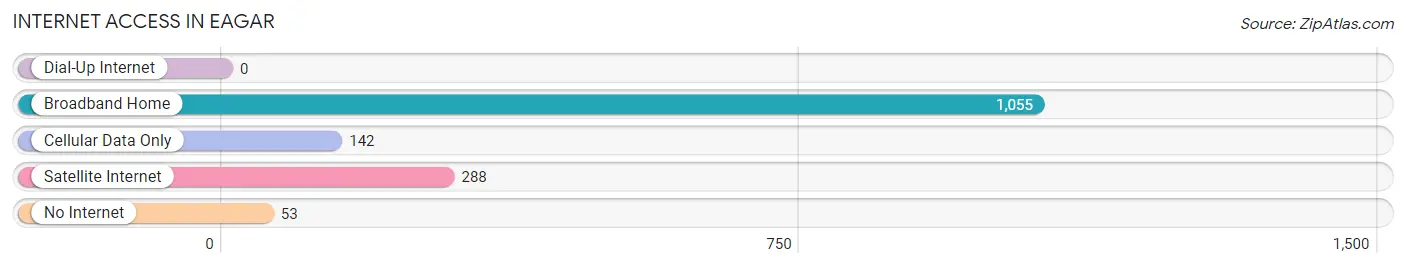
| Internet Type | # Households | % Households |
| Dial-Up Internet | 0 | 0.0% |
| Broadband Home | 1,055 | 68.5% |
| Cellular Data Only | 142 | 9.2% |
| Satellite Internet | 288 | 18.7% |
| No Internet | 53 | 3.4% |
| Total | 1,539 | 100.0% |
Eagar Summary
Eagar, Arizona is a small town located in Apache County in the northeastern part of the state. It is situated in the White Mountains, a mountain range in the southwestern United States. The town is located at an elevation of 6,000 feet and has a population of approximately 3,000 people.
History
Eagar was founded in 1876 by a group of Mormon settlers who were looking for a place to settle and practice their faith. The town was named after one of the settlers, William Eagar. The settlers built a fort and a school, and the town quickly grew. By the early 1900s, Eagar had become a thriving community with a population of over 1,000 people.
The town was an important stop on the Arizona and New Mexico Railway, which connected the town to the rest of the state. The railway was a major factor in the growth of the town, as it allowed for the transportation of goods and people.
In the early 1900s, the town was also a major center for the timber industry. The White Mountains were home to a large number of pine trees, and the timber industry provided jobs for many of the town's residents.
Geography
Eagar is located in the White Mountains, a mountain range in the southwestern United States. The town is situated at an elevation of 6,000 feet and is surrounded by the Apache-Sitgreaves National Forest. The town is located in a valley surrounded by mountains, and the area is known for its scenic beauty.
The climate in Eagar is semi-arid, with hot summers and cold winters. The average temperature in the summer is around 90 degrees Fahrenheit, and the average temperature in the winter is around 30 degrees Fahrenheit.
Economy
The economy of Eagar is largely based on tourism and the timber industry. The town is a popular destination for outdoor enthusiasts, and the nearby Apache-Sitgreaves National Forest provides a variety of recreational activities. The timber industry is also an important part of the local economy, as the White Mountains are home to a large number of pine trees.
The town is also home to a number of small businesses, including restaurants, shops, and hotels. The town is also home to a number of manufacturing companies, including a furniture factory and a woodworking shop.
Demographics
As of the 2010 census, the population of Eagar was 3,072. The racial makeup of the town was 94.3% White, 0.7% African American, 0.7% Native American, 0.3% Asian, 0.1% Pacific Islander, and 3.9% from other races. The median household income was $31,250, and the median family income was $37,500.
Eagar is a small town with a close-knit community. The town is home to a number of churches, and the local school district is highly rated. The town is also home to a number of parks and recreational facilities, including a golf course and a swimming pool.
Common Questions
What is the Total Population of Eagar?
Total Population of Eagar is 4,425.
What is the Total Male Population of Eagar?
Total Male Population of Eagar is 2,386.
What is the Total Female Population of Eagar?
Total Female Population of Eagar is 2,039.
What is the Ratio of Males per 100 Females in Eagar?
There are 117.02 Males per 100 Females in Eagar.
What is the Ratio of Females per 100 Males in Eagar?
There are 85.46 Females per 100 Males in Eagar.
What is the Median Population Age in Eagar?
Median Population Age in Eagar is 38.9 Years.
What is the Average Family Size in Eagar
Average Family Size in Eagar is 3.3 People.
What is the Average Household Size in Eagar
Average Household Size in Eagar is 2.9 People.
What is Per Capita Income in Eagar?
Per Capita income in Eagar is $31,827.
What is the Median Family Income in Eagar?
Median Family Income in Eagar is $89,260.
What is the Median Household income in Eagar?
Median Household Income in Eagar is $82,538.
What is Income or Wage Gap in Eagar?
Income or Wage Gap in Eagar is 16.9%.
Women in Eagar earn 83.1 cents for every dollar earned by a man.
What is Inequality or Gini Index in Eagar?
Inequality or Gini Index in Eagar is 0.37.
How Large is the Labor Force in Eagar?
There are 1,608 People in the Labor Forcein in Eagar.
What is the Percentage of People in the Labor Force in Eagar?
47.3% of People are in the Labor Force in Eagar.
What is the Unemployment Rate in Eagar?
Unemployment Rate in Eagar is 0.9%.