Zip Codes with the Highest Percentage of Population Employed in Architecture & Engineering in Gilbert, AZ
RELATED REPORTS & OPTIONS
Architecture & Engineering
Gilbert
Compare Zip Codes
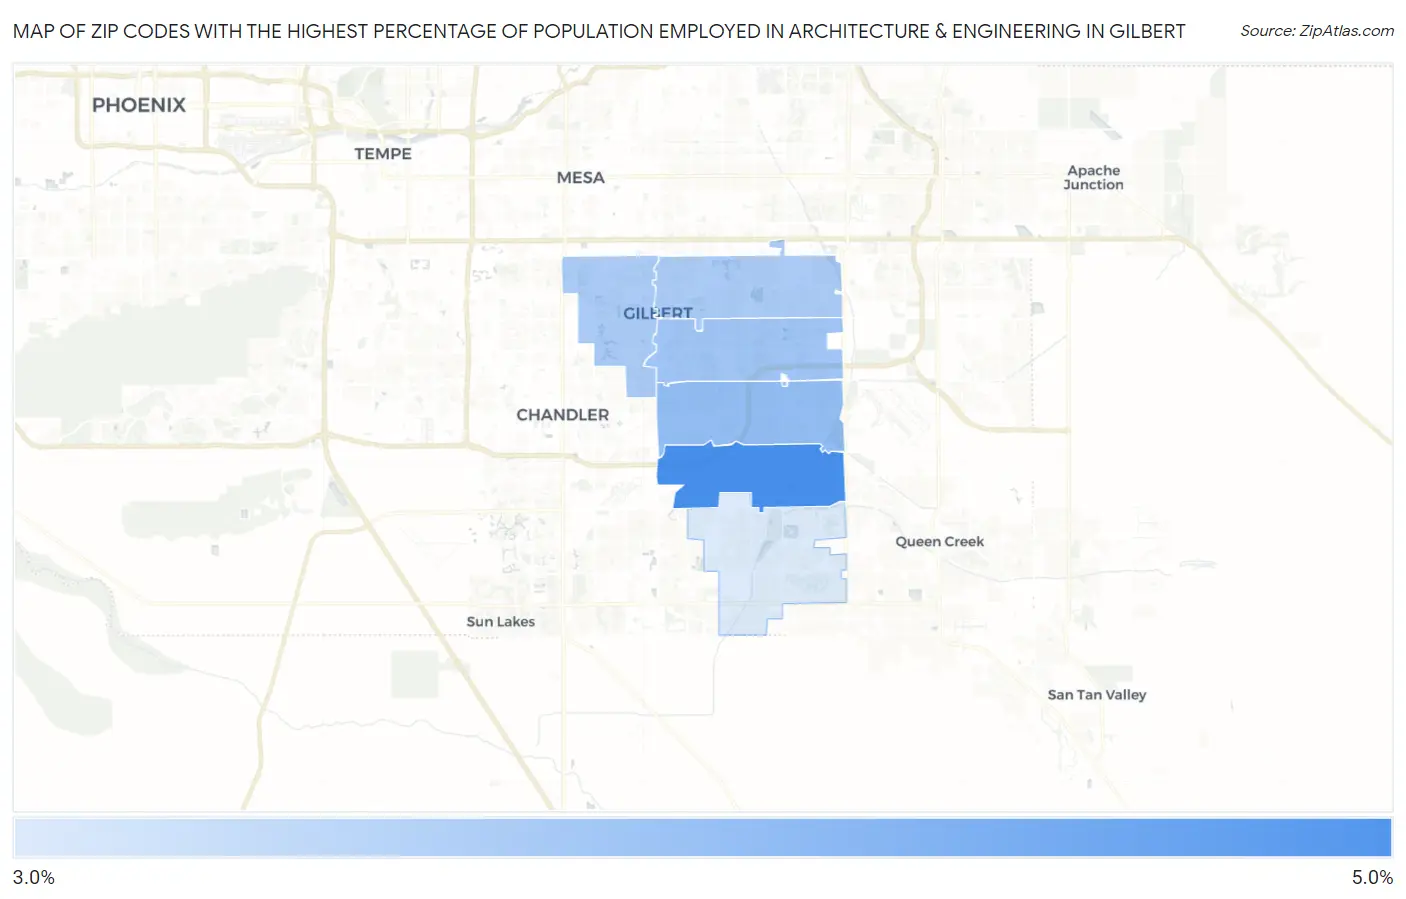
Map of Zip Codes with the Highest Percentage of Population Employed in Architecture & Engineering in Gilbert
0.0%
5.0%
Zip Codes with the Highest Percentage of Population Employed in Architecture & Engineering in Gilbert, AZ
| Zip Code | % Employed | vs State | vs National | |
| 1. | 85297 | 4.5% | 2.4%(+2.08)#33 | 2.1%(+2.33)#2,162 |
| 2. | 85295 | 3.8% | 2.4%(+1.37)#50 | 2.1%(+1.61)#3,181 |
| 3. | 85296 | 3.6% | 2.4%(+1.23)#56 | 2.1%(+1.47)#3,475 |
| 4. | 85234 | 3.5% | 2.4%(+1.15)#60 | 2.1%(+1.39)#3,639 |
| 5. | 85233 | 3.5% | 2.4%(+1.14)#61 | 2.1%(+1.38)#3,654 |
| 6. | 85298 | 3.1% | 2.4%(+0.671)#71 | 2.1%(+0.913)#4,843 |
1
Common Questions
What are the Top 5 Zip Codes with the Highest Percentage of Population Employed in Architecture & Engineering in Gilbert, AZ?
Top 5 Zip Codes with the Highest Percentage of Population Employed in Architecture & Engineering in Gilbert, AZ are:
What zip code has the Highest Percentage of Population Employed in Architecture & Engineering in Gilbert, AZ?
85297 has the Highest Percentage of Population Employed in Architecture & Engineering in Gilbert, AZ with 4.5%.
What is the Percentage of Population Employed in Architecture & Engineering in Gilbert, AZ?
Percentage of Population Employed in Architecture & Engineering in Gilbert is 3.7%.
What is the Percentage of Population Employed in Architecture & Engineering in Arizona?
Percentage of Population Employed in Architecture & Engineering in Arizona is 2.4%.
What is the Percentage of Population Employed in Architecture & Engineering in the United States?
Percentage of Population Employed in Architecture & Engineering in the United States is 2.1%.