Mountainaire, AZ
Mountainaire Map
Mountainaire Overview
945
TOTAL POPULATION
506
MALE POPULATION
439
FEMALE POPULATION
115.26
MALES / 100 FEMALES
86.76
FEMALES / 100 MALES
51.8
MEDIAN AGE
2.3
AVG FAMILY SIZE
2.0
AVG HOUSEHOLD SIZE
$44,857
PER CAPITA INCOME
$122,601
AVG FAMILY INCOME
$92,788
AVG HOUSEHOLD INCOME
20.6%
WAGE / INCOME GAP [ % ]
79.4¢/ $1
WAGE / INCOME GAP [ $ ]
0.37
INEQUALITY / GINI INDEX
623
LABOR FORCE [ PEOPLE ]
68.2%
PERCENT IN LABOR FORCE
6.4%
UNEMPLOYMENT RATE
Race in Mountainaire
The most populous races in Mountainaire are White / Caucasian (870 | 92.1%), Hispanic or Latino (71 | 7.5%), and Some other Race (40 | 4.2%).
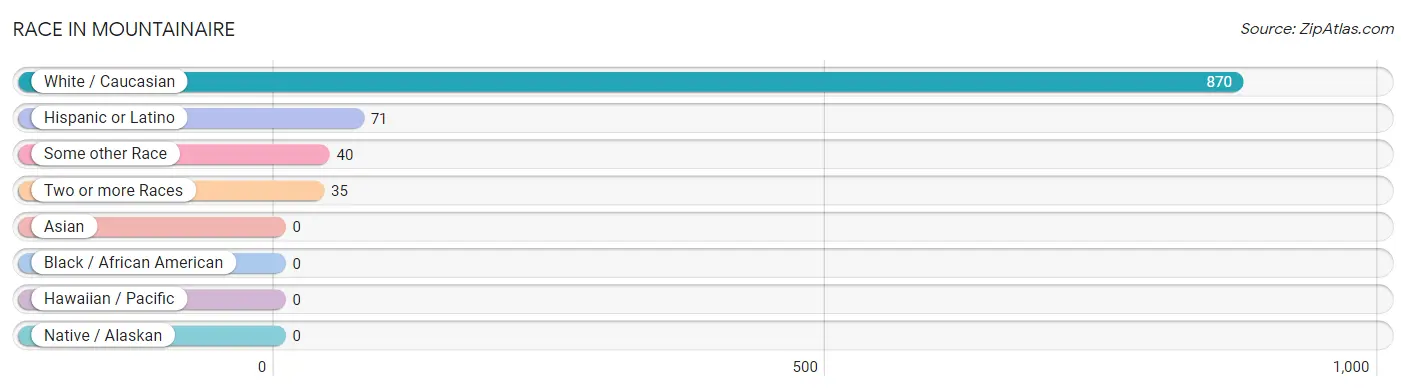
| Race | # Population | % Population |
| Asian | 0 | 0.0% |
| Black / African American | 0 | 0.0% |
| Hawaiian / Pacific | 0 | 0.0% |
| Hispanic or Latino | 71 | 7.5% |
| Native / Alaskan | 0 | 0.0% |
| White / Caucasian | 870 | 92.1% |
| Two or more Races | 35 | 3.7% |
| Some other Race | 40 | 4.2% |
| Total | 945 | 100.0% |
Ancestry in Mountainaire
The most populous ancestries reported in Mountainaire are German (183 | 19.4%), Irish (179 | 18.9%), English (178 | 18.8%), Scottish (80 | 8.5%), and Swedish (77 | 8.2%), together accounting for 73.8% of all Mountainaire residents.
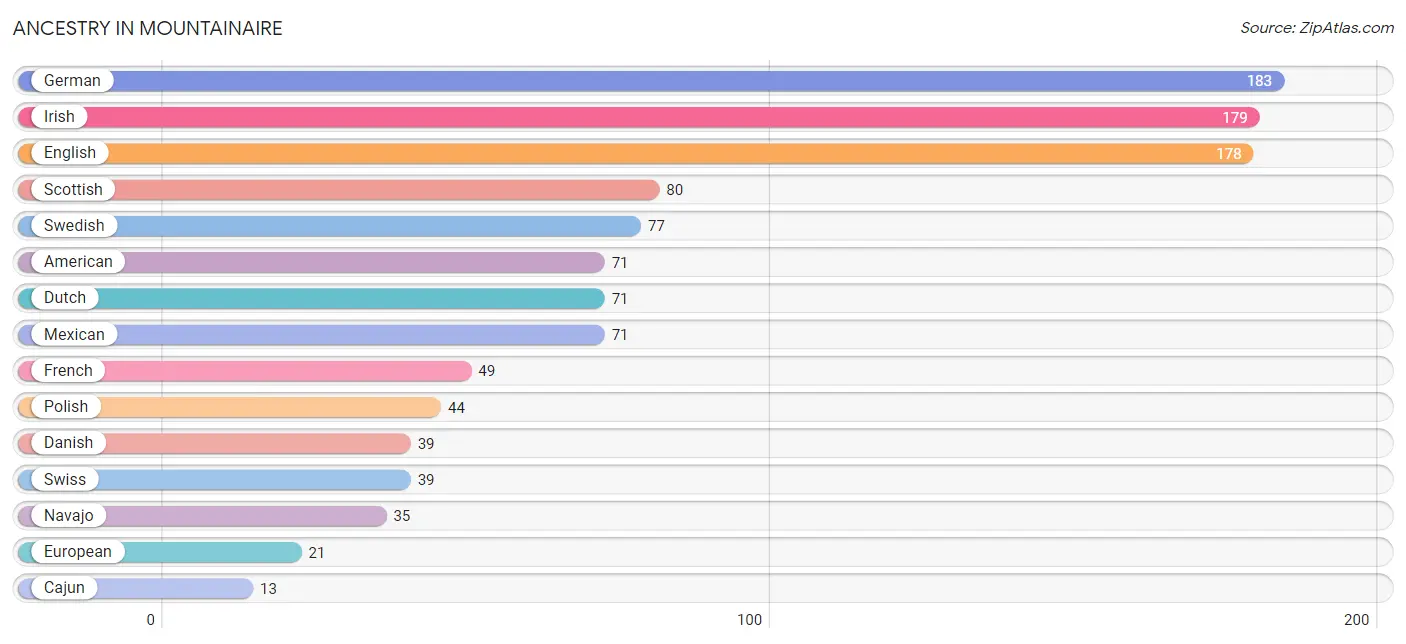
| Ancestry | # Population | % Population |
| American | 71 | 7.5% |
| Cajun | 13 | 1.4% |
| Danish | 39 | 4.1% |
| Dutch | 71 | 7.5% |
| English | 178 | 18.8% |
| European | 21 | 2.2% |
| French | 49 | 5.2% |
| German | 183 | 19.4% |
| Irish | 179 | 18.9% |
| Italian | 10 | 1.1% |
| Mexican | 71 | 7.5% |
| Navajo | 35 | 3.7% |
| Northern European | 11 | 1.2% |
| Polish | 44 | 4.7% |
| Scottish | 80 | 8.5% |
| Swedish | 77 | 8.2% |
| Swiss | 39 | 4.1% | View All 17 Rows |
Immigrants in Mountainaire

| Immigration Origin | # Population | % Population | View All 0 Rows |
Sex and Age in Mountainaire
Sex and Age in Mountainaire
The most populous age groups in Mountainaire are 30 to 34 Years (97 | 19.2%) for men and 25 to 29 Years (91 | 20.7%) for women.
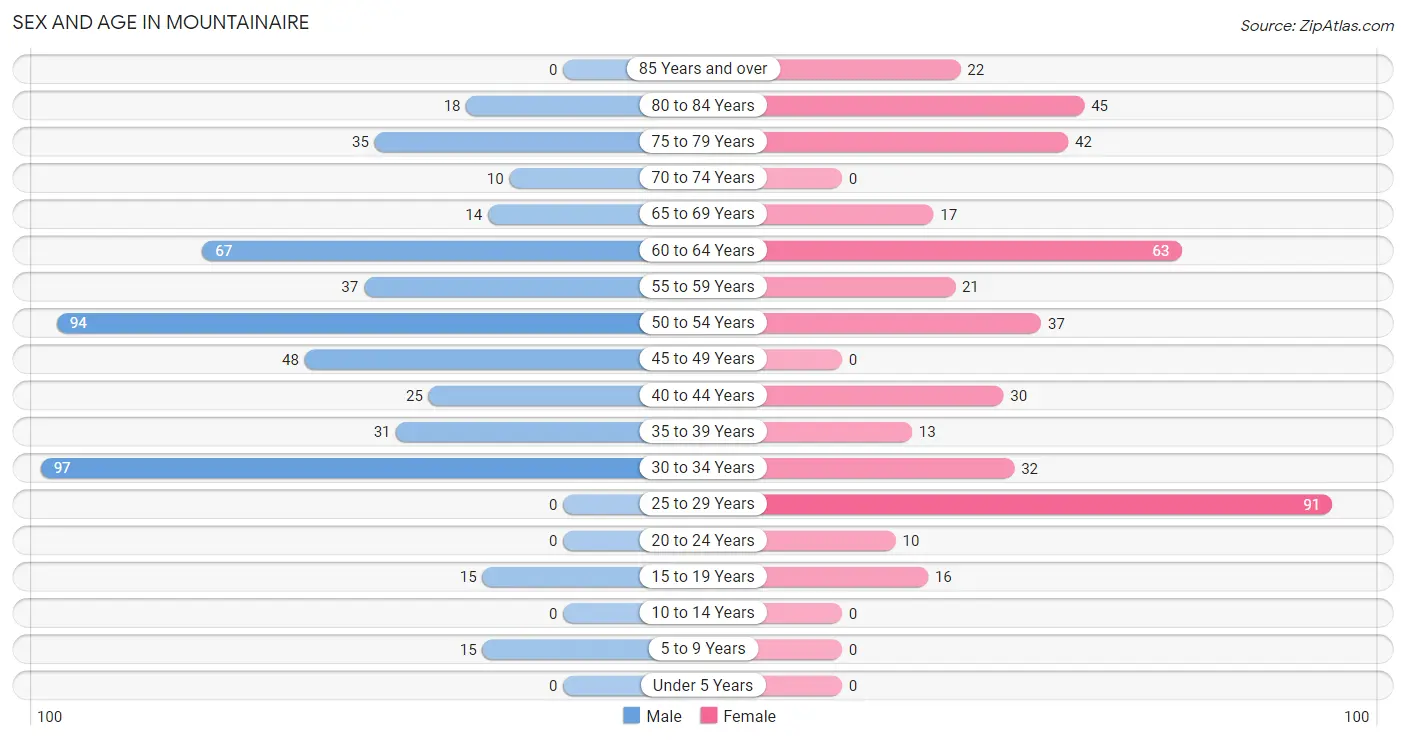
| Age Bracket | Male | Female |
| Under 5 Years | 0 (0.0%) | 0 (0.0%) |
| 5 to 9 Years | 15 (3.0%) | 0 (0.0%) |
| 10 to 14 Years | 0 (0.0%) | 0 (0.0%) |
| 15 to 19 Years | 15 (3.0%) | 16 (3.6%) |
| 20 to 24 Years | 0 (0.0%) | 10 (2.3%) |
| 25 to 29 Years | 0 (0.0%) | 91 (20.7%) |
| 30 to 34 Years | 97 (19.2%) | 32 (7.3%) |
| 35 to 39 Years | 31 (6.1%) | 13 (3.0%) |
| 40 to 44 Years | 25 (4.9%) | 30 (6.8%) |
| 45 to 49 Years | 48 (9.5%) | 0 (0.0%) |
| 50 to 54 Years | 94 (18.6%) | 37 (8.4%) |
| 55 to 59 Years | 37 (7.3%) | 21 (4.8%) |
| 60 to 64 Years | 67 (13.2%) | 63 (14.3%) |
| 65 to 69 Years | 14 (2.8%) | 17 (3.9%) |
| 70 to 74 Years | 10 (2.0%) | 0 (0.0%) |
| 75 to 79 Years | 35 (6.9%) | 42 (9.6%) |
| 80 to 84 Years | 18 (3.6%) | 45 (10.2%) |
| 85 Years and over | 0 (0.0%) | 22 (5.0%) |
| Total | 506 (100.0%) | 439 (100.0%) |
Families and Households in Mountainaire
Median Family Size in Mountainaire
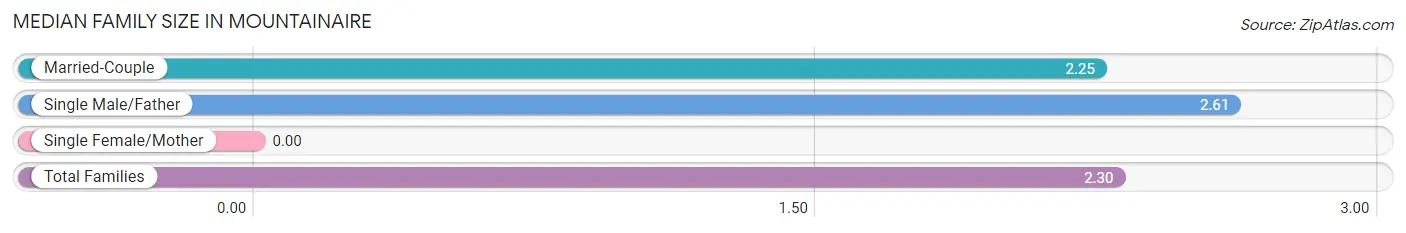
| Family Type | # Families | Family Size |
| Married-Couple | 209 (84.6%) | 2.25 |
| Single Male/Father | 38 (15.4%) | 2.61 |
| Single Female/Mother | 0 (0.0%) | - |
| Total Families | 247 (100.0%) | 2.30 |
Median Household Size in Mountainaire
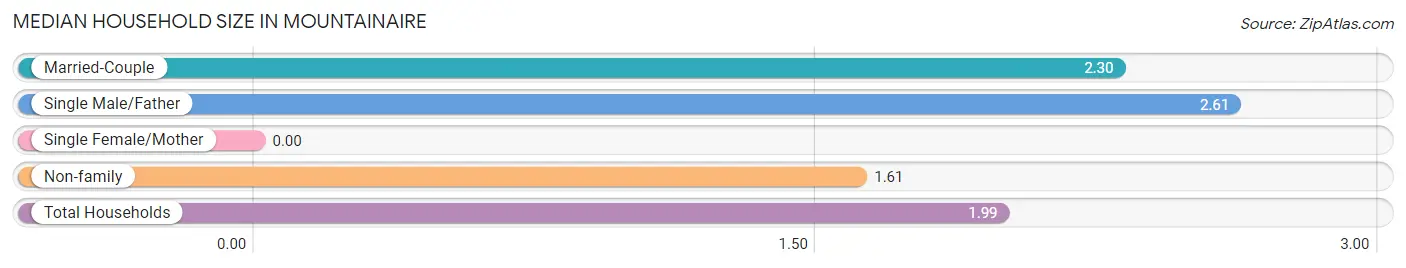
| Household Type | # Households | Household Size |
| Married-Couple | 209 (44.0%) | 2.30 |
| Single Male/Father | 38 (8.0%) | 2.61 |
| Single Female/Mother | 0 (0.0%) | - |
| Non-family | 228 (48.0%) | 1.61 |
| Total Households | 475 (100.0%) | 1.99 |
Household Size by Marriage Status in Mountainaire
Out of a total of 475 households in Mountainaire, 247 (52.0%) are family households, while 228 (48.0%) are nonfamily households. The most numerous type of family households are 2-person households, comprising 181, and the most common type of nonfamily households are 1-person households, comprising 121.
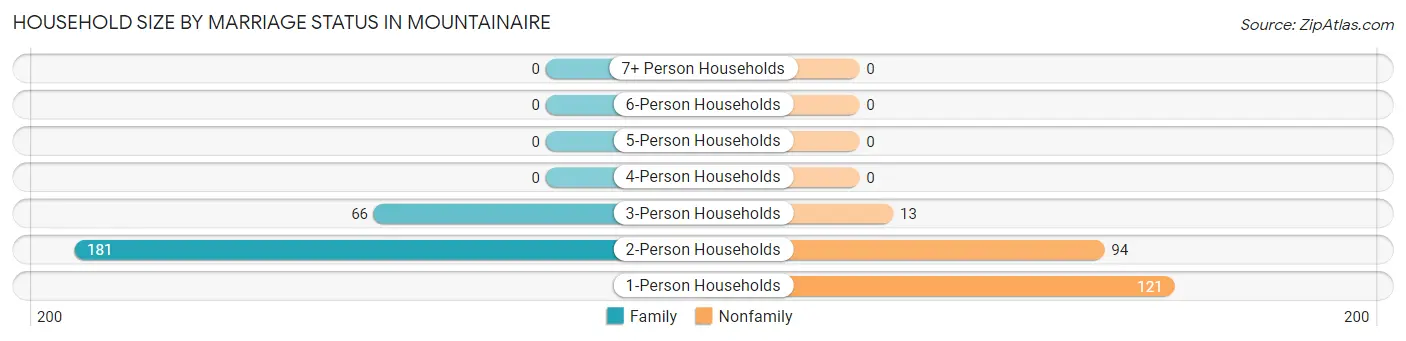
| Household Size | Family Households | Nonfamily Households |
| 1-Person Households | - | 121 (25.5%) |
| 2-Person Households | 181 (38.1%) | 94 (19.8%) |
| 3-Person Households | 66 (13.9%) | 13 (2.7%) |
| 4-Person Households | 0 (0.0%) | 0 (0.0%) |
| 5-Person Households | 0 (0.0%) | 0 (0.0%) |
| 6-Person Households | 0 (0.0%) | 0 (0.0%) |
| 7+ Person Households | 0 (0.0%) | 0 (0.0%) |
| Total | 247 (52.0%) | 228 (48.0%) |
Female Fertility in Mountainaire
Fertility by Age in Mountainaire
| Age Bracket | Women with Births | Births / 1,000 Women |
| 15 to 19 years | 0 (0.0%) | 0.0 |
| 20 to 34 years | 0 (0.0%) | 0.0 |
| 35 to 50 years | 0 (0.0%) | 0.0 |
| Total | 0 (0.0%) | 0.0 |
Fertility by Age by Marriage Status in Mountainaire
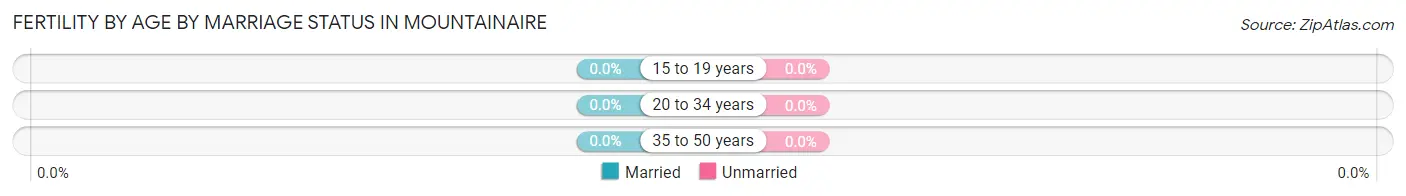
| Age Bracket | Married | Unmarried |
| 15 to 19 years | 0 (0.0%) | 0 (0.0%) |
| 20 to 34 years | 0 (0.0%) | 0 (0.0%) |
| 35 to 50 years | 0 (0.0%) | 0 (0.0%) |
| Total | 0 (0.0%) | 0 (0.0%) |
Fertility by Education in Mountainaire
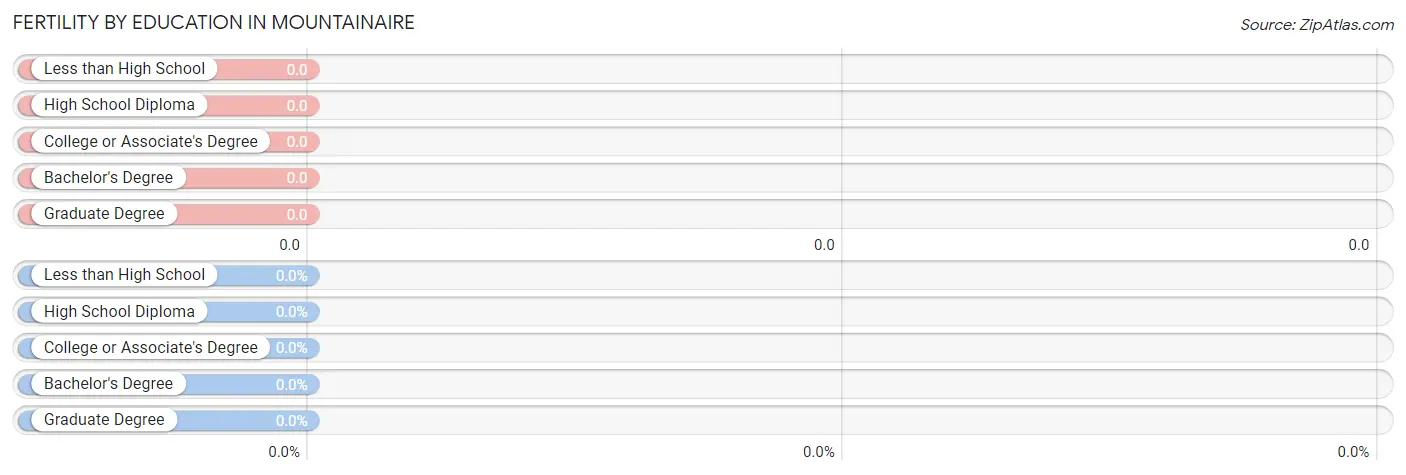
| Educational Attainment | Women with Births | Births / 1,000 Women |
| Less than High School | 0 (0.0%) | 0.0 |
| High School Diploma | 0 (0.0%) | 0.0 |
| College or Associate's Degree | 0 (0.0%) | 0.0 |
| Bachelor's Degree | 0 (0.0%) | 0.0 |
| Graduate Degree | 0 (0.0%) | 0.0 |
| Total | 0 (0.0%) | 0.0 |
Fertility by Education by Marriage Status in Mountainaire
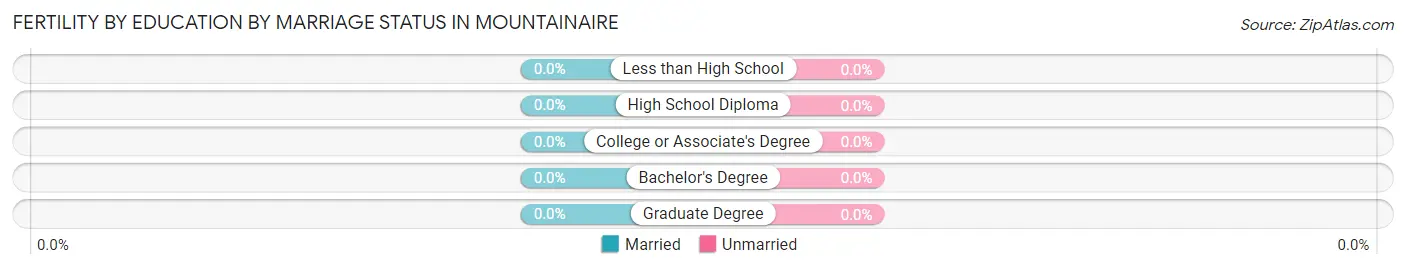
| Educational Attainment | Married | Unmarried |
| Less than High School | 0 (0.0%) | 0 (0.0%) |
| High School Diploma | 0 (0.0%) | 0 (0.0%) |
| College or Associate's Degree | 0 (0.0%) | 0 (0.0%) |
| Bachelor's Degree | 0 (0.0%) | 0 (0.0%) |
| Graduate Degree | 0 (0.0%) | 0 (0.0%) |
| Total | 0 (0.0%) | 0 (0.0%) |
Income in Mountainaire
Income Overview in Mountainaire
Per Capita Income in Mountainaire is $44,857, while median incomes of families and households are $122,601 and $92,788 respectively.
| Characteristic | Number | Measure |
| Per Capita Income | 945 | $44,857 |
| Median Family Income | 247 | $122,601 |
| Mean Family Income | 247 | $115,016 |
| Median Household Income | 475 | $92,788 |
| Mean Household Income | 475 | $89,231 |
| Income Deficit | 247 | $0 |
| Wage / Income Gap (%) | 945 | 20.62% |
| Wage / Income Gap ($) | 945 | 79.38¢ per $1 |
| Gini / Inequality Index | 945 | 0.37 |
Earnings by Sex in Mountainaire
Average Earnings in Mountainaire are $43,021, $41,313 for men and $52,045 for women, a difference of 20.6%.
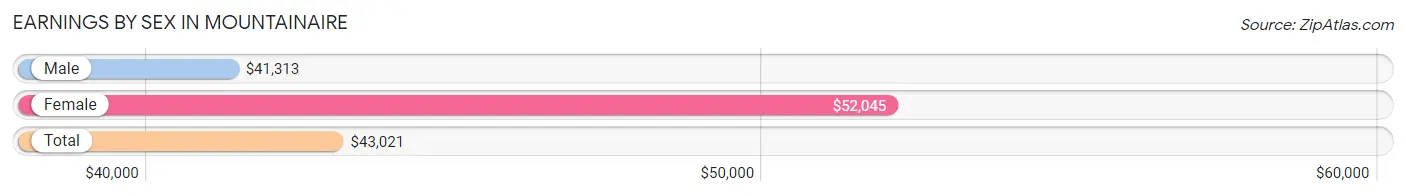
| Sex | Number | Average Earnings |
| Male | 409 (65.2%) | $41,313 |
| Female | 218 (34.8%) | $52,045 |
| Total | 627 (100.0%) | $43,021 |
Earnings by Sex by Income Bracket in Mountainaire
The most common earnings brackets in Mountainaire are $75,000 to $99,999 for men (93 | 22.7%) and $100,000+ for women (67 | 30.7%).
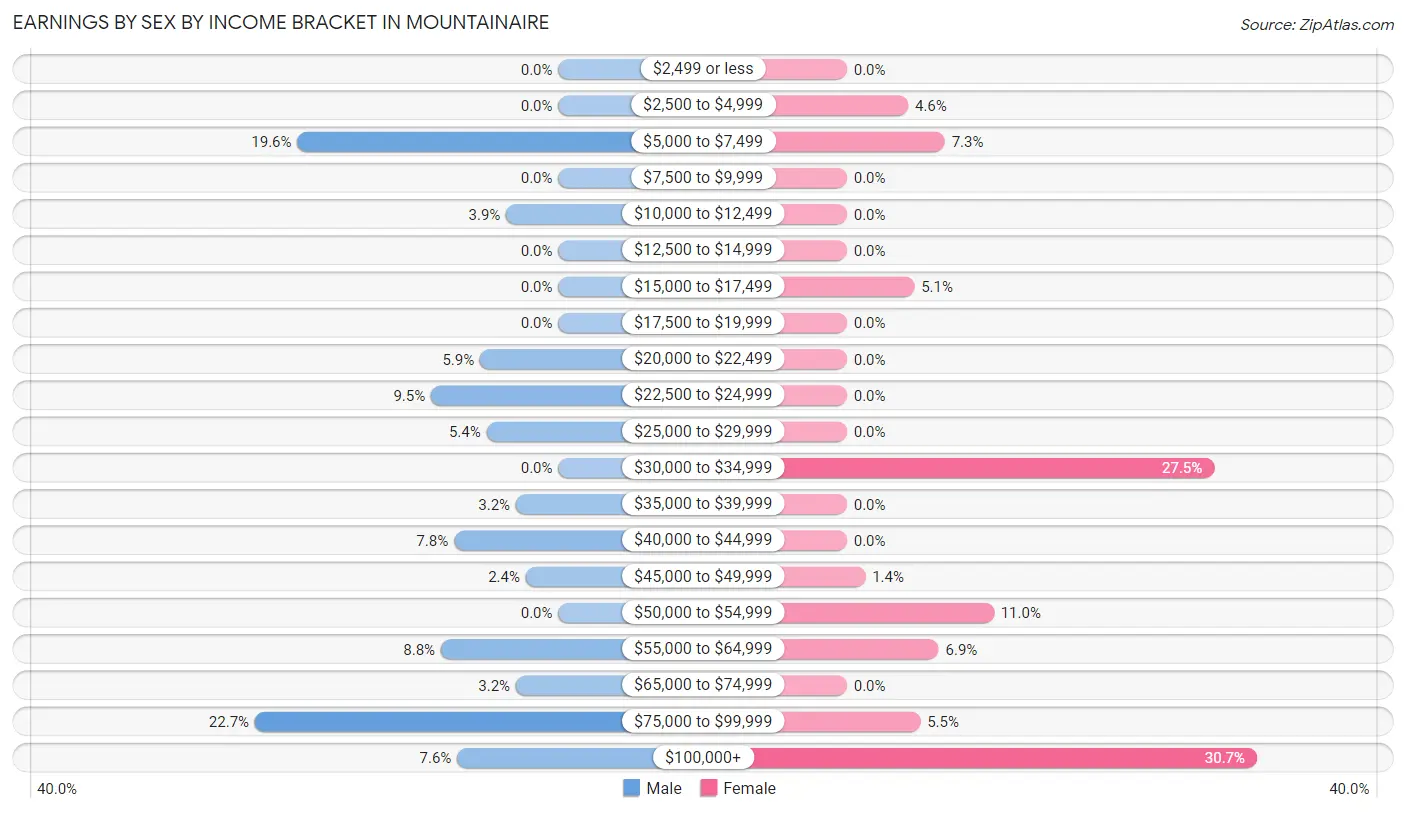
| Income | Male | Female |
| $2,499 or less | 0 (0.0%) | 0 (0.0%) |
| $2,500 to $4,999 | 0 (0.0%) | 10 (4.6%) |
| $5,000 to $7,499 | 80 (19.6%) | 16 (7.3%) |
| $7,500 to $9,999 | 0 (0.0%) | 0 (0.0%) |
| $10,000 to $12,499 | 16 (3.9%) | 0 (0.0%) |
| $12,500 to $14,999 | 0 (0.0%) | 0 (0.0%) |
| $15,000 to $17,499 | 0 (0.0%) | 11 (5.1%) |
| $17,500 to $19,999 | 0 (0.0%) | 0 (0.0%) |
| $20,000 to $22,499 | 24 (5.9%) | 0 (0.0%) |
| $22,500 to $24,999 | 39 (9.5%) | 0 (0.0%) |
| $25,000 to $29,999 | 22 (5.4%) | 0 (0.0%) |
| $30,000 to $34,999 | 0 (0.0%) | 60 (27.5%) |
| $35,000 to $39,999 | 13 (3.2%) | 0 (0.0%) |
| $40,000 to $44,999 | 32 (7.8%) | 0 (0.0%) |
| $45,000 to $49,999 | 10 (2.4%) | 3 (1.4%) |
| $50,000 to $54,999 | 0 (0.0%) | 24 (11.0%) |
| $55,000 to $64,999 | 36 (8.8%) | 15 (6.9%) |
| $65,000 to $74,999 | 13 (3.2%) | 0 (0.0%) |
| $75,000 to $99,999 | 93 (22.7%) | 12 (5.5%) |
| $100,000+ | 31 (7.6%) | 67 (30.7%) |
| Total | 409 (100.0%) | 218 (100.0%) |
Earnings by Sex by Educational Attainment in Mountainaire
Average earnings in Mountainaire are $41,313 for men and $53,077 for women, a difference of 22.2%. Men with an educational attainment of bachelor's degree enjoy the highest average annual earnings of $62,700, while those with bachelor's degree education earn the least with $62,700. Women with an educational attainment of graduate degree earn the most with the average annual earnings of $118,325, while those with bachelor's degree education have the smallest earnings of $34,349.
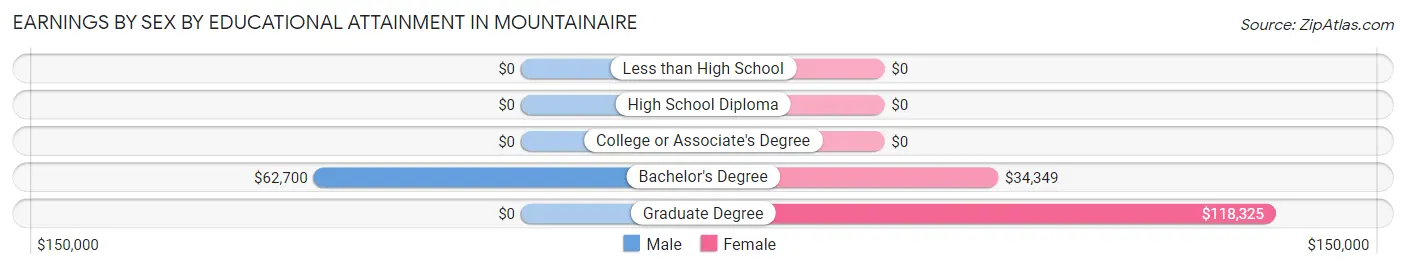
| Educational Attainment | Male Income | Female Income |
| Less than High School | - | - |
| High School Diploma | - | - |
| College or Associate's Degree | - | - |
| Bachelor's Degree | $62,700 | $34,349 |
| Graduate Degree | - | - |
| Total | $41,313 | $53,077 |
Family Income in Mountainaire
Family Income Brackets in Mountainaire
According to the Mountainaire family income data, there are 123 families falling into the $100,000 to $149,999 income range, which is the most common income bracket and makes up 49.8% of all families.
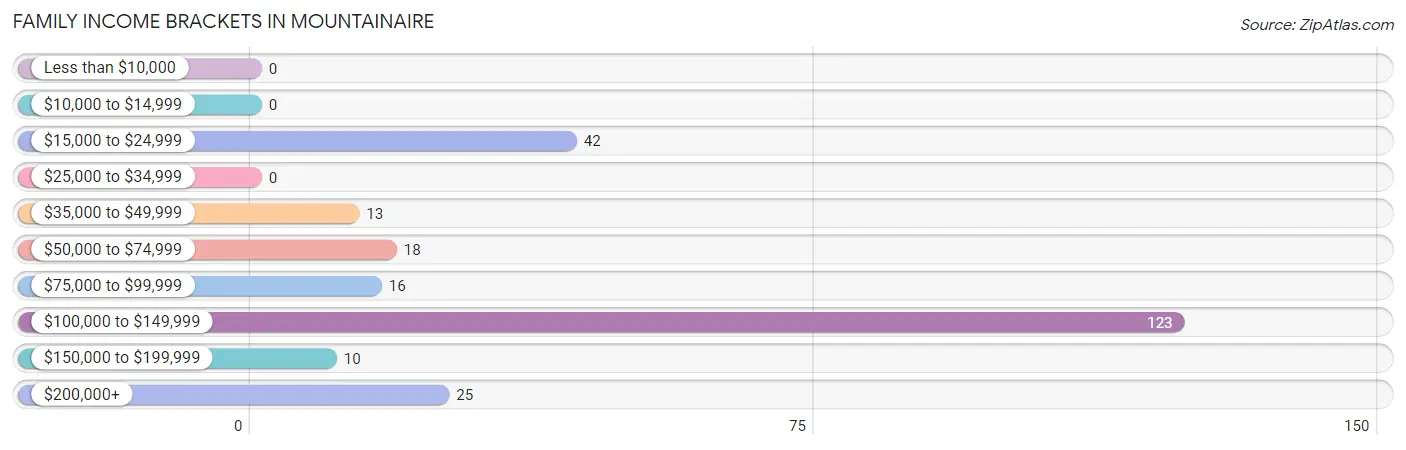
| Income Bracket | # Families | % Families |
| Less than $10,000 | 0 | 0.0% |
| $10,000 to $14,999 | 0 | 0.0% |
| $15,000 to $24,999 | 42 | 17.0% |
| $25,000 to $34,999 | 0 | 0.0% |
| $35,000 to $49,999 | 13 | 5.3% |
| $50,000 to $74,999 | 18 | 7.3% |
| $75,000 to $99,999 | 16 | 6.5% |
| $100,000 to $149,999 | 123 | 49.8% |
| $150,000 to $199,999 | 10 | 4.0% |
| $200,000+ | 25 | 10.1% |
Family Income by Famaliy Size in Mountainaire
3-person families (56 | 22.7%) account for the highest median family income in Mountainaire with $147,000 per family, while 2-person families (191 | 77.3%) have the highest median income of $60,156 per family member.
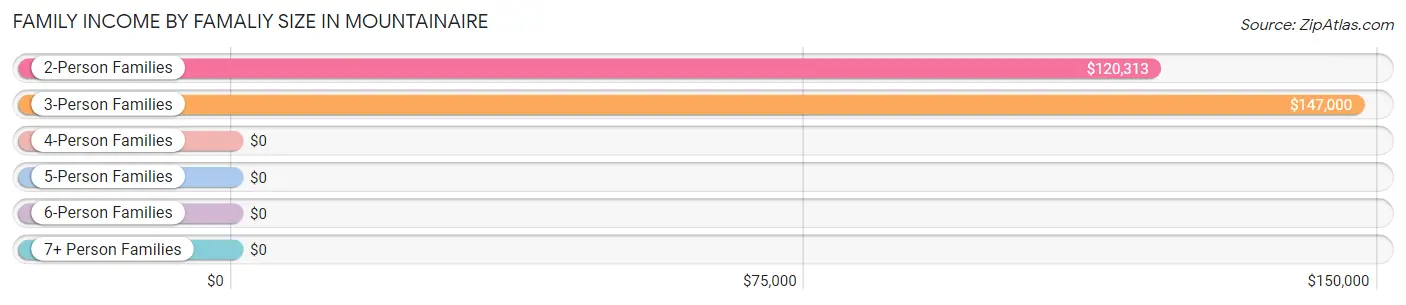
| Income Bracket | # Families | Median Income |
| 2-Person Families | 191 (77.3%) | $120,313 |
| 3-Person Families | 56 (22.7%) | $147,000 |
| 4-Person Families | 0 (0.0%) | $0 |
| 5-Person Families | 0 (0.0%) | $0 |
| 6-Person Families | 0 (0.0%) | $0 |
| 7+ Person Families | 0 (0.0%) | $0 |
| Total | 247 (100.0%) | $122,601 |
Family Income by Number of Earners in Mountainaire
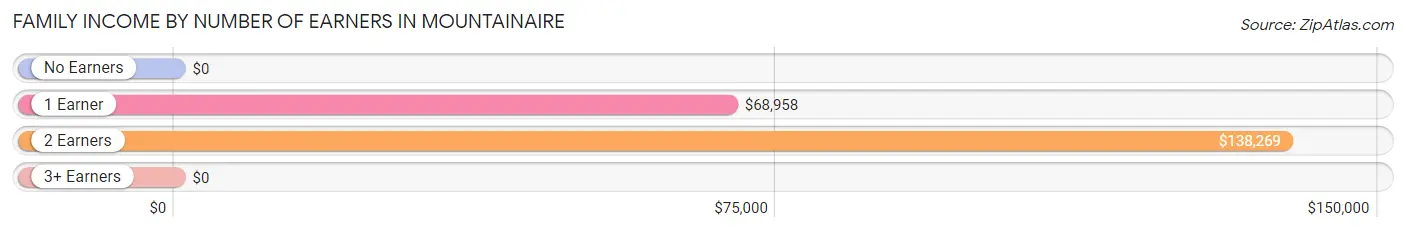
| Number of Earners | # Families | Median Income |
| No Earners | 52 (21.0%) | $0 |
| 1 Earner | 47 (19.0%) | $68,958 |
| 2 Earners | 148 (59.9%) | $138,269 |
| 3+ Earners | 0 (0.0%) | $0 |
| Total | 247 (100.0%) | $122,601 |
Household Income in Mountainaire
Household Income Brackets in Mountainaire
With 178 households falling in the category, the $100,000 to $149,999 income range is the most frequent in Mountainaire, accounting for 37.5% of all households.
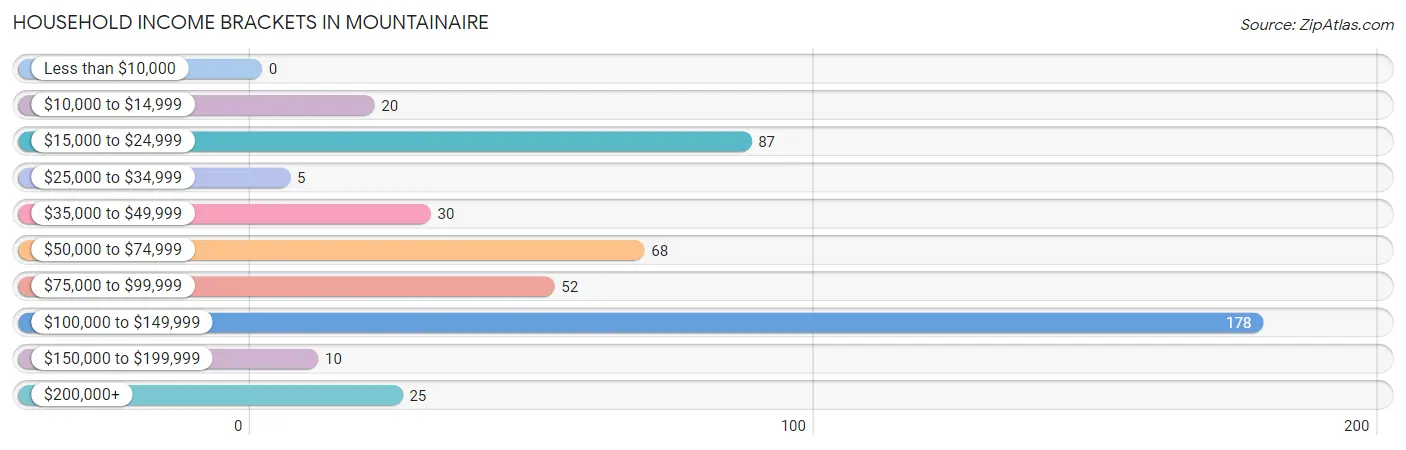
| Income Bracket | # Households | % Households |
| Less than $10,000 | 0 | 0.0% |
| $10,000 to $14,999 | 20 | 4.2% |
| $15,000 to $24,999 | 87 | 18.3% |
| $25,000 to $34,999 | 5 | 1.1% |
| $35,000 to $49,999 | 30 | 6.3% |
| $50,000 to $74,999 | 68 | 14.3% |
| $75,000 to $99,999 | 52 | 10.9% |
| $100,000 to $149,999 | 178 | 37.5% |
| $150,000 to $199,999 | 10 | 2.1% |
| $200,000+ | 25 | 5.3% |
Household Income by Householder Age in Mountainaire
The median household income in Mountainaire is $92,788, with the highest median household income of $104,554 found in the 45 to 64 years age bracket for the primary householder. A total of 189 households (39.8%) fall into this category.
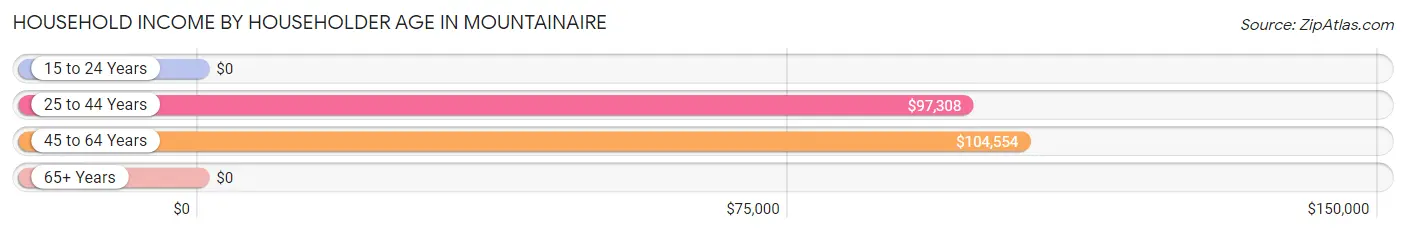
| Income Bracket | # Households | Median Income |
| 15 to 24 Years | 0 (0.0%) | $0 |
| 25 to 44 Years | 150 (31.6%) | $97,308 |
| 45 to 64 Years | 189 (39.8%) | $104,554 |
| 65+ Years | 136 (28.6%) | $0 |
| Total | 475 (100.0%) | $92,788 |
Poverty in Mountainaire
Income Below Poverty by Sex and Age in Mountainaire
With 4.0% poverty level for males and 9.1% for females among the residents of Mountainaire, 35 to 44 year old males and 18 to 24 year old females are the most vulnerable to poverty, with 16 males (28.6%) and 10 females (100.0%) in their respective age groups living below the poverty level.
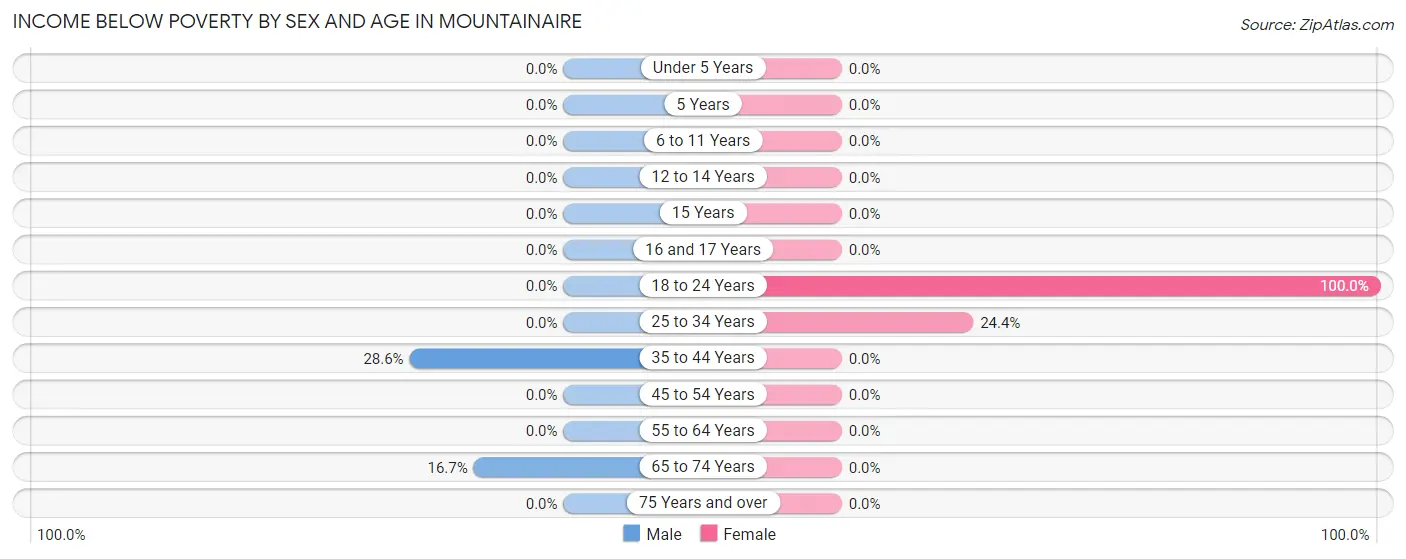
| Age Bracket | Male | Female |
| Under 5 Years | 0 (0.0%) | 0 (0.0%) |
| 5 Years | 0 (0.0%) | 0 (0.0%) |
| 6 to 11 Years | 0 (0.0%) | 0 (0.0%) |
| 12 to 14 Years | 0 (0.0%) | 0 (0.0%) |
| 15 Years | 0 (0.0%) | 0 (0.0%) |
| 16 and 17 Years | 0 (0.0%) | 0 (0.0%) |
| 18 to 24 Years | 0 (0.0%) | 10 (100.0%) |
| 25 to 34 Years | 0 (0.0%) | 30 (24.4%) |
| 35 to 44 Years | 16 (28.6%) | 0 (0.0%) |
| 45 to 54 Years | 0 (0.0%) | 0 (0.0%) |
| 55 to 64 Years | 0 (0.0%) | 0 (0.0%) |
| 65 to 74 Years | 4 (16.7%) | 0 (0.0%) |
| 75 Years and over | 0 (0.0%) | 0 (0.0%) |
| Total | 20 (4.0%) | 40 (9.1%) |
Income Above Poverty by Sex and Age in Mountainaire
According to the poverty statistics in Mountainaire, males aged 6 to 11 years and females aged 15 years are the age groups that are most secure financially, with 100.0% of males and 100.0% of females in these age groups living above the poverty line.
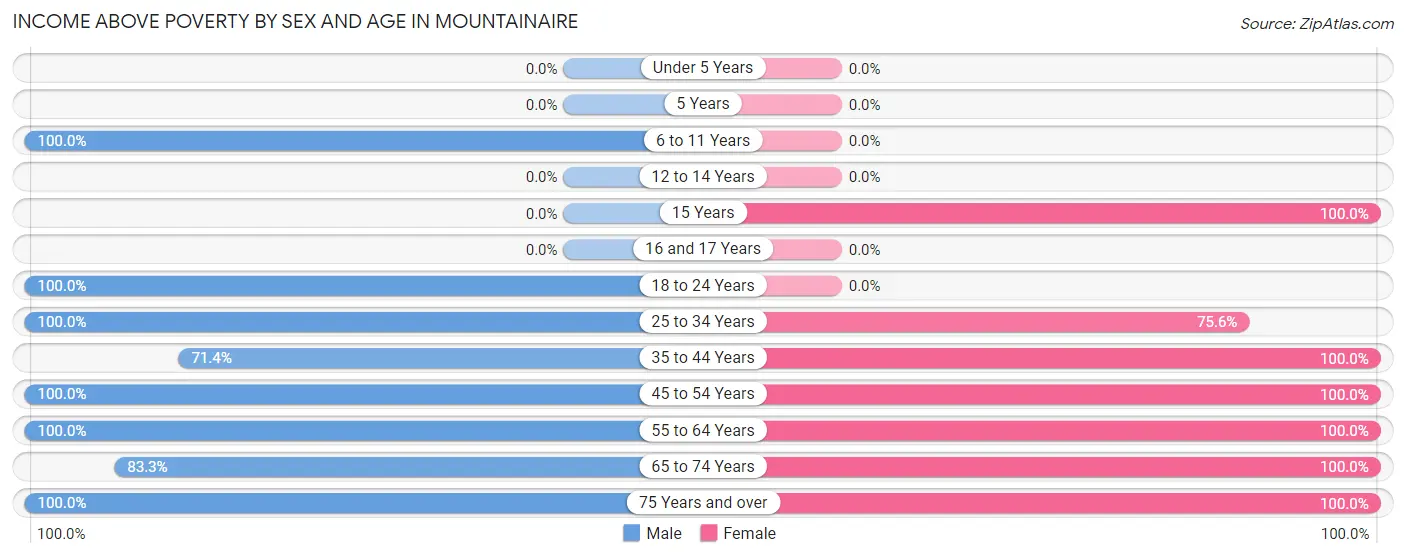
| Age Bracket | Male | Female |
| Under 5 Years | 0 (0.0%) | 0 (0.0%) |
| 5 Years | 0 (0.0%) | 0 (0.0%) |
| 6 to 11 Years | 15 (100.0%) | 0 (0.0%) |
| 12 to 14 Years | 0 (0.0%) | 0 (0.0%) |
| 15 Years | 0 (0.0%) | 16 (100.0%) |
| 16 and 17 Years | 0 (0.0%) | 0 (0.0%) |
| 18 to 24 Years | 15 (100.0%) | 0 (0.0%) |
| 25 to 34 Years | 97 (100.0%) | 93 (75.6%) |
| 35 to 44 Years | 40 (71.4%) | 43 (100.0%) |
| 45 to 54 Years | 142 (100.0%) | 37 (100.0%) |
| 55 to 64 Years | 104 (100.0%) | 84 (100.0%) |
| 65 to 74 Years | 20 (83.3%) | 17 (100.0%) |
| 75 Years and over | 53 (100.0%) | 109 (100.0%) |
| Total | 486 (96.1%) | 399 (90.9%) |
Income Below Poverty Among Married-Couple Families in Mountainaire
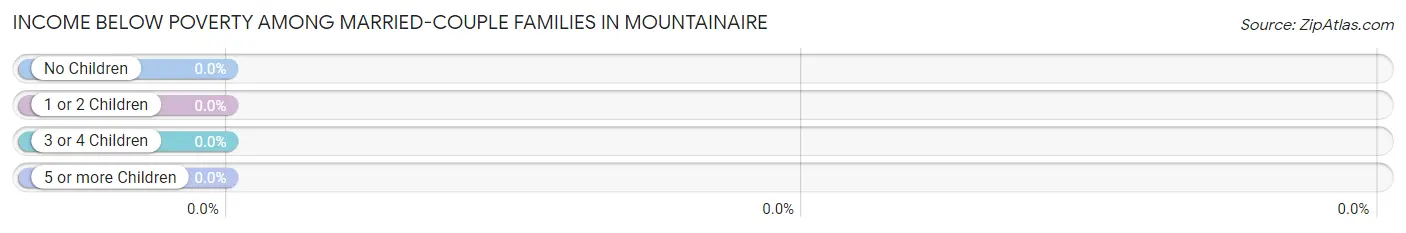
| Children | Above Poverty | Below Poverty |
| No Children | 178 (100.0%) | 0 (0.0%) |
| 1 or 2 Children | 31 (100.0%) | 0 (0.0%) |
| 3 or 4 Children | 0 (0.0%) | 0 (0.0%) |
| 5 or more Children | 0 (0.0%) | 0 (0.0%) |
| Total | 209 (100.0%) | 0 (0.0%) |
Income Below Poverty Among Single-Parent Households in Mountainaire
| Children | Single Father | Single Mother |
| No Children | 0 (0.0%) | 0 (0.0%) |
| 1 or 2 Children | 0 (0.0%) | 0 (0.0%) |
| 3 or 4 Children | 0 (0.0%) | 0 (0.0%) |
| 5 or more Children | 0 (0.0%) | 0 (0.0%) |
| Total | 0 (0.0%) | 0 (0.0%) |
Income Below Poverty Among Married-Couple vs Single-Parent Households in Mountainaire
| Children | Married-Couple Families | Single-Parent Households |
| No Children | 0 (0.0%) | 0 (0.0%) |
| 1 or 2 Children | 0 (0.0%) | 0 (0.0%) |
| 3 or 4 Children | 0 (0.0%) | 0 (0.0%) |
| 5 or more Children | 0 (0.0%) | 0 (0.0%) |
| Total | 0 (0.0%) | 0 (0.0%) |
Employment Characteristics in Mountainaire
Employment by Class of Employer in Mountainaire
Among the 574 employed individuals in Mountainaire, private company employees (394 | 68.6%), state government employees (71 | 12.4%), and not-for-profit organizations (42 | 7.3%) make up the most common classes of employment.
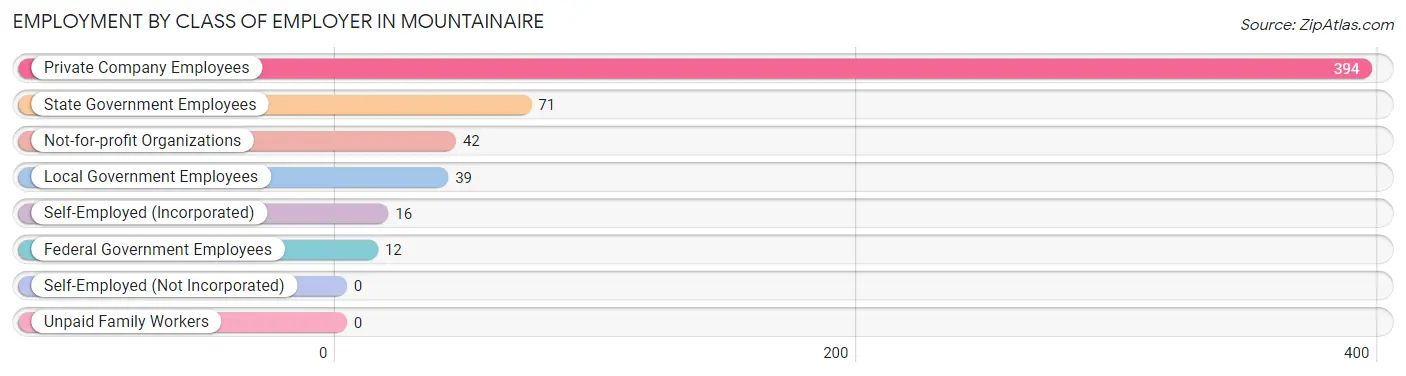
| Employer Class | # Employees | % Employees |
| Private Company Employees | 394 | 68.6% |
| Self-Employed (Incorporated) | 16 | 2.8% |
| Self-Employed (Not Incorporated) | 0 | 0.0% |
| Not-for-profit Organizations | 42 | 7.3% |
| Local Government Employees | 39 | 6.8% |
| State Government Employees | 71 | 12.4% |
| Federal Government Employees | 12 | 2.1% |
| Unpaid Family Workers | 0 | 0.0% |
| Total | 574 | 100.0% |
Employment Status by Age in Mountainaire
According to the labor force statistics for Mountainaire, out of the total population over 16 years of age (914), 68.2% or 623 individuals are in the labor force, with 6.4% or 40 of them unemployed. The age group with the highest labor force participation rate is 20 to 24 years, with 100.0% or 10 individuals in the labor force. Within the labor force, the 55 to 59 years age range has the highest percentage of unemployed individuals, with 50.0% or 24 of them being unemployed.
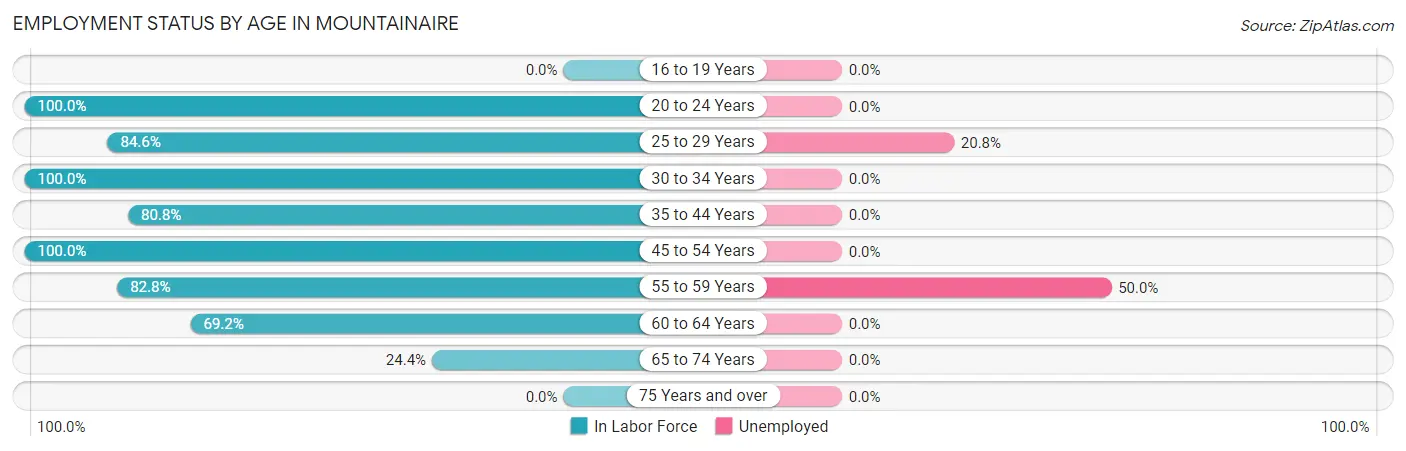
| Age Bracket | In Labor Force | Unemployed |
| 16 to 19 Years | 0 (0.0%) | 0 (0.0%) |
| 20 to 24 Years | 10 (100.0%) | 0 (0.0%) |
| 25 to 29 Years | 77 (84.6%) | 16 (20.8%) |
| 30 to 34 Years | 129 (100.0%) | 0 (0.0%) |
| 35 to 44 Years | 80 (80.8%) | 0 (0.0%) |
| 45 to 54 Years | 179 (100.0%) | 0 (0.0%) |
| 55 to 59 Years | 48 (82.8%) | 24 (50.0%) |
| 60 to 64 Years | 90 (69.2%) | 0 (0.0%) |
| 65 to 74 Years | 10 (24.4%) | 0 (0.0%) |
| 75 Years and over | 0 (0.0%) | 0 (0.0%) |
| Total | 623 (68.2%) | 40 (6.4%) |
Employment Status by Educational Attainment in Mountainaire
According to labor force statistics for Mountainaire, 87.9% of individuals (603) out of the total population between 25 and 64 years of age (686) are in the labor force, with 6.6% or 40 of them being unemployed. The group with the highest labor force participation rate are those with the educational attainment of bachelor's degree or higher, with 97.0% or 482 individuals in the labor force. Within the labor force, individuals with bachelor's degree or higher education have the highest percentage of unemployment, with 8.3% or 40 of them being unemployed.
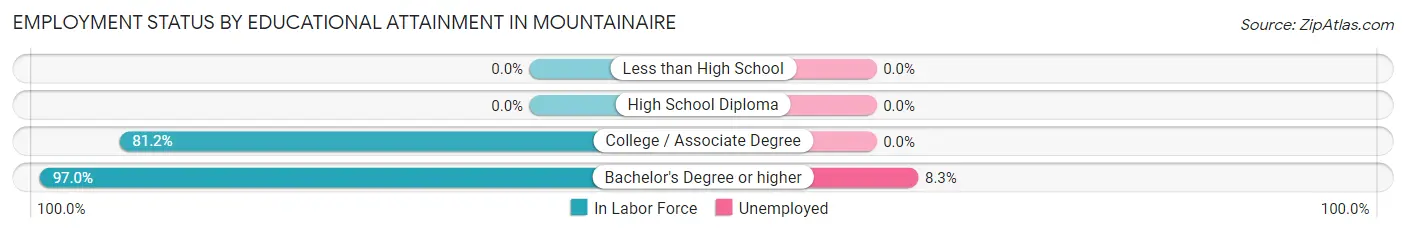
| Educational Attainment | In Labor Force | Unemployed |
| Less than High School | 0 (0.0%) | 0 (0.0%) |
| High School Diploma | 0 (0.0%) | 0 (0.0%) |
| College / Associate Degree | 121 (81.2%) | 0 (0.0%) |
| Bachelor's Degree or higher | 482 (97.0%) | 41 (8.3%) |
| Total | 603 (87.9%) | 45 (6.6%) |
Employment Occupations by Sex in Mountainaire
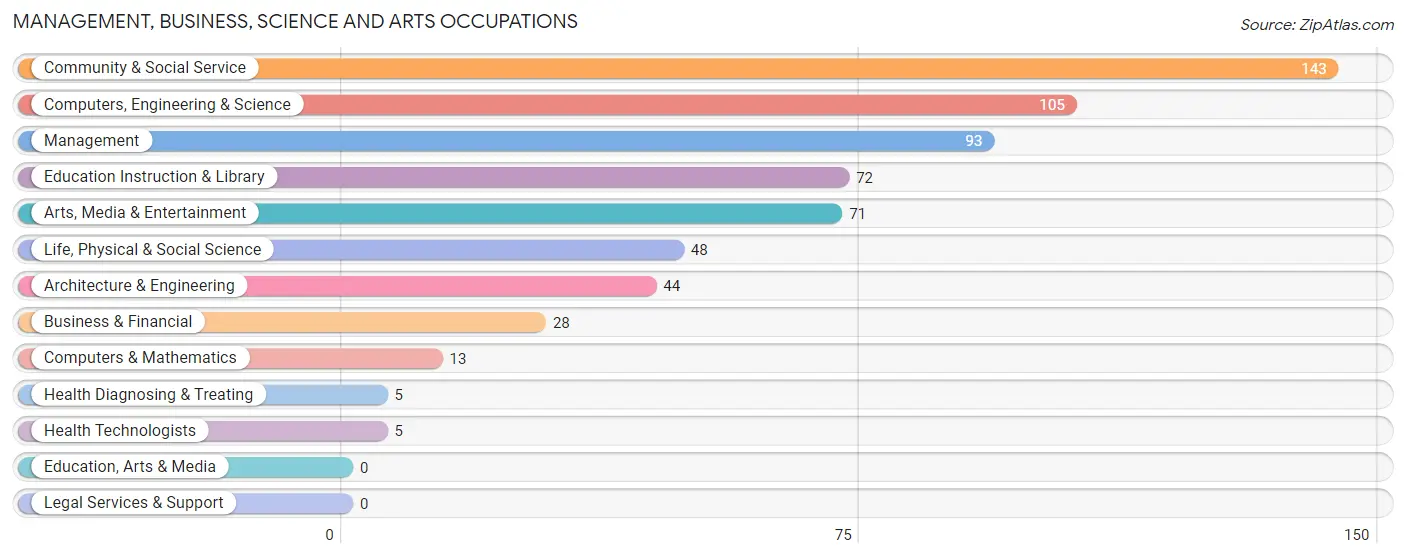
Management, Business, Science and Arts Occupations
The most common Management, Business, Science and Arts occupations in Mountainaire are Community & Social Service (143 | 24.5%), Computers, Engineering & Science (105 | 18.0%), Management (93 | 16.0%), Education Instruction & Library (72 | 12.3%), and Arts, Media & Entertainment (71 | 12.2%).
Management, Business, Science and Arts Occupations by Sex
Within the Management, Business, Science and Arts occupations in Mountainaire, the most male-oriented occupations are Life, Physical & Social Science (100.0%), Arts, Media & Entertainment (100.0%), and Computers, Engineering & Science (75.2%), while the most female-oriented occupations are Computers & Mathematics (100.0%), Health Diagnosing & Treating (100.0%), and Health Technologists (100.0%).
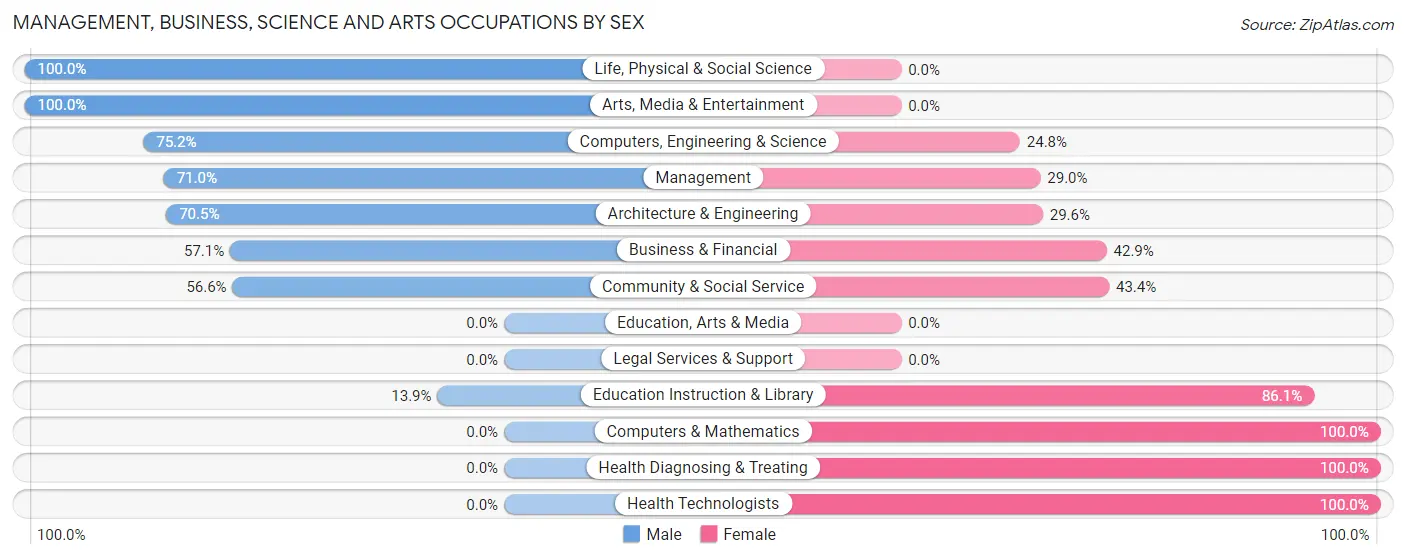
| Occupation | Male | Female |
| Management | 66 (71.0%) | 27 (29.0%) |
| Business & Financial | 16 (57.1%) | 12 (42.9%) |
| Computers, Engineering & Science | 79 (75.2%) | 26 (24.8%) |
| Computers & Mathematics | 0 (0.0%) | 13 (100.0%) |
| Architecture & Engineering | 31 (70.5%) | 13 (29.5%) |
| Life, Physical & Social Science | 48 (100.0%) | 0 (0.0%) |
| Community & Social Service | 81 (56.6%) | 62 (43.4%) |
| Education, Arts & Media | 0 (0.0%) | 0 (0.0%) |
| Legal Services & Support | 0 (0.0%) | 0 (0.0%) |
| Education Instruction & Library | 10 (13.9%) | 62 (86.1%) |
| Arts, Media & Entertainment | 71 (100.0%) | 0 (0.0%) |
| Health Diagnosing & Treating | 0 (0.0%) | 5 (100.0%) |
| Health Technologists | 0 (0.0%) | 5 (100.0%) |
| Total (Category) | 242 (64.7%) | 132 (35.3%) |
| Total (Overall) | 381 (65.3%) | 202 (34.6%) |
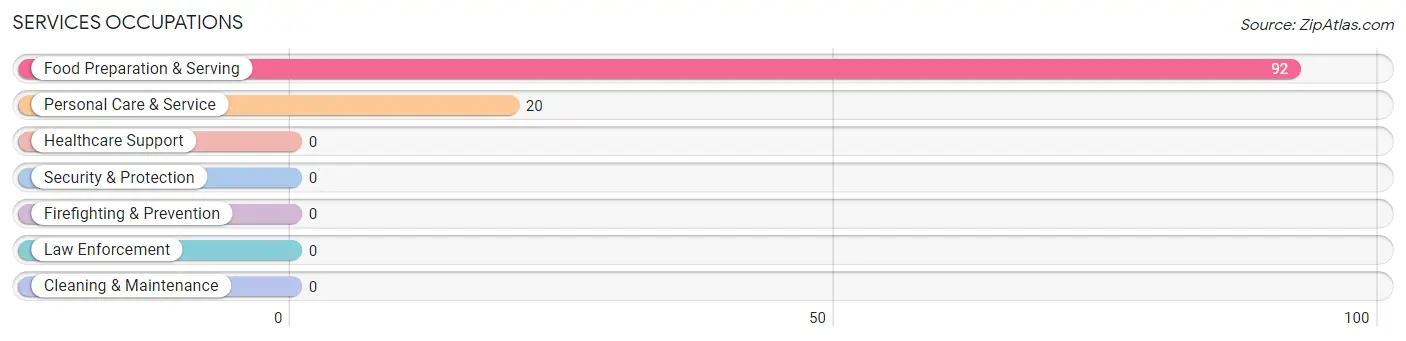
Services Occupations
The most common Services occupations in Mountainaire are Food Preparation & Serving (92 | 15.8%), and Personal Care & Service (20 | 3.4%).
Services Occupations by Sex
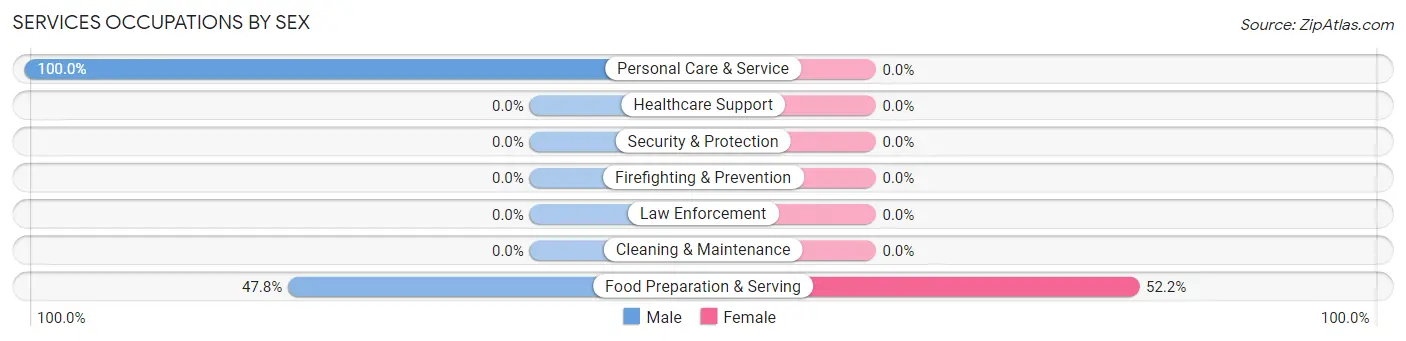
| Occupation | Male | Female |
| Healthcare Support | 0 (0.0%) | 0 (0.0%) |
| Security & Protection | 0 (0.0%) | 0 (0.0%) |
| Firefighting & Prevention | 0 (0.0%) | 0 (0.0%) |
| Law Enforcement | 0 (0.0%) | 0 (0.0%) |
| Food Preparation & Serving | 44 (47.8%) | 48 (52.2%) |
| Cleaning & Maintenance | 0 (0.0%) | 0 (0.0%) |
| Personal Care & Service | 20 (100.0%) | 0 (0.0%) |
| Total (Category) | 64 (57.1%) | 48 (42.9%) |
| Total (Overall) | 381 (65.3%) | 202 (34.6%) |
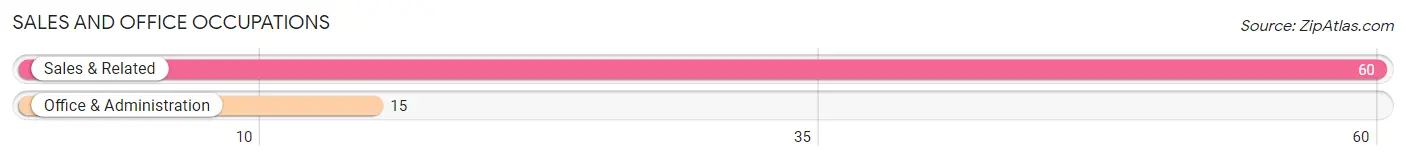
Sales and Office Occupations
The most common Sales and Office occupations in Mountainaire are Sales & Related (60 | 10.3%), and Office & Administration (15 | 2.6%).
Sales and Office Occupations by Sex
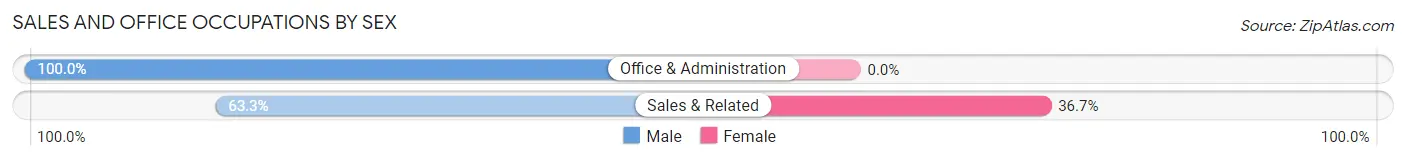
| Occupation | Male | Female |
| Sales & Related | 38 (63.3%) | 22 (36.7%) |
| Office & Administration | 15 (100.0%) | 0 (0.0%) |
| Total (Category) | 53 (70.7%) | 22 (29.3%) |
| Total (Overall) | 381 (65.3%) | 202 (34.6%) |
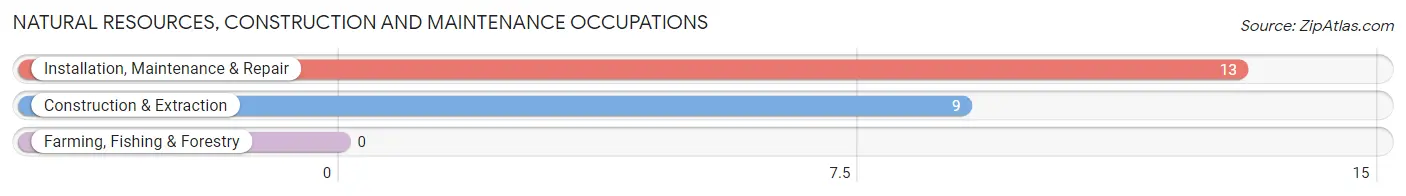
Natural Resources, Construction and Maintenance Occupations
The most common Natural Resources, Construction and Maintenance occupations in Mountainaire are Installation, Maintenance & Repair (13 | 2.2%), and Construction & Extraction (9 | 1.5%).
Natural Resources, Construction and Maintenance Occupations by Sex
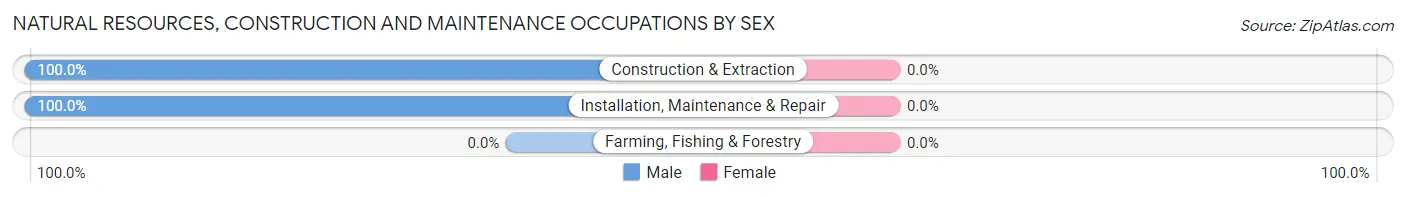
| Occupation | Male | Female |
| Farming, Fishing & Forestry | 0 (0.0%) | 0 (0.0%) |
| Construction & Extraction | 9 (100.0%) | 0 (0.0%) |
| Installation, Maintenance & Repair | 13 (100.0%) | 0 (0.0%) |
| Total (Category) | 22 (100.0%) | 0 (0.0%) |
| Total (Overall) | 381 (65.3%) | 202 (34.6%) |
Production, Transportation and Moving Occupations
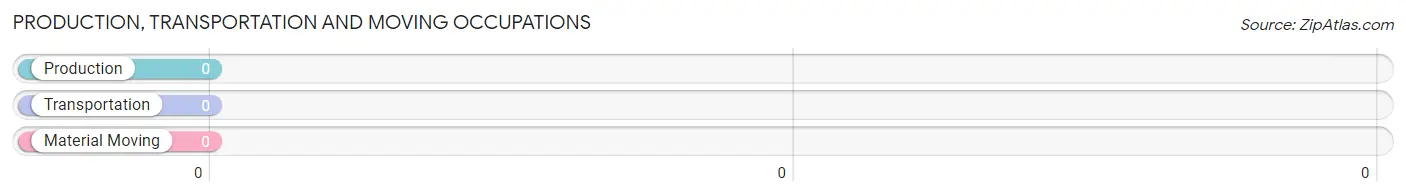
Production, Transportation and Moving Occupations by Sex
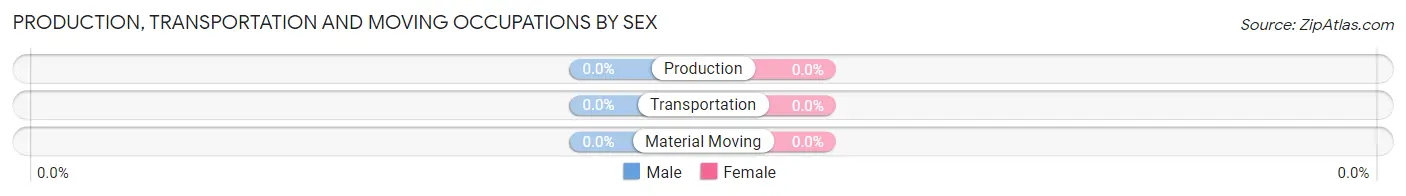
| Occupation | Male | Female |
| Production | 0 (0.0%) | 0 (0.0%) |
| Transportation | 0 (0.0%) | 0 (0.0%) |
| Material Moving | 0 (0.0%) | 0 (0.0%) |
| Total (Category) | 0 (0.0%) | 0 (0.0%) |
| Total (Overall) | 381 (65.3%) | 202 (34.6%) |
Employment Industries by Sex in Mountainaire
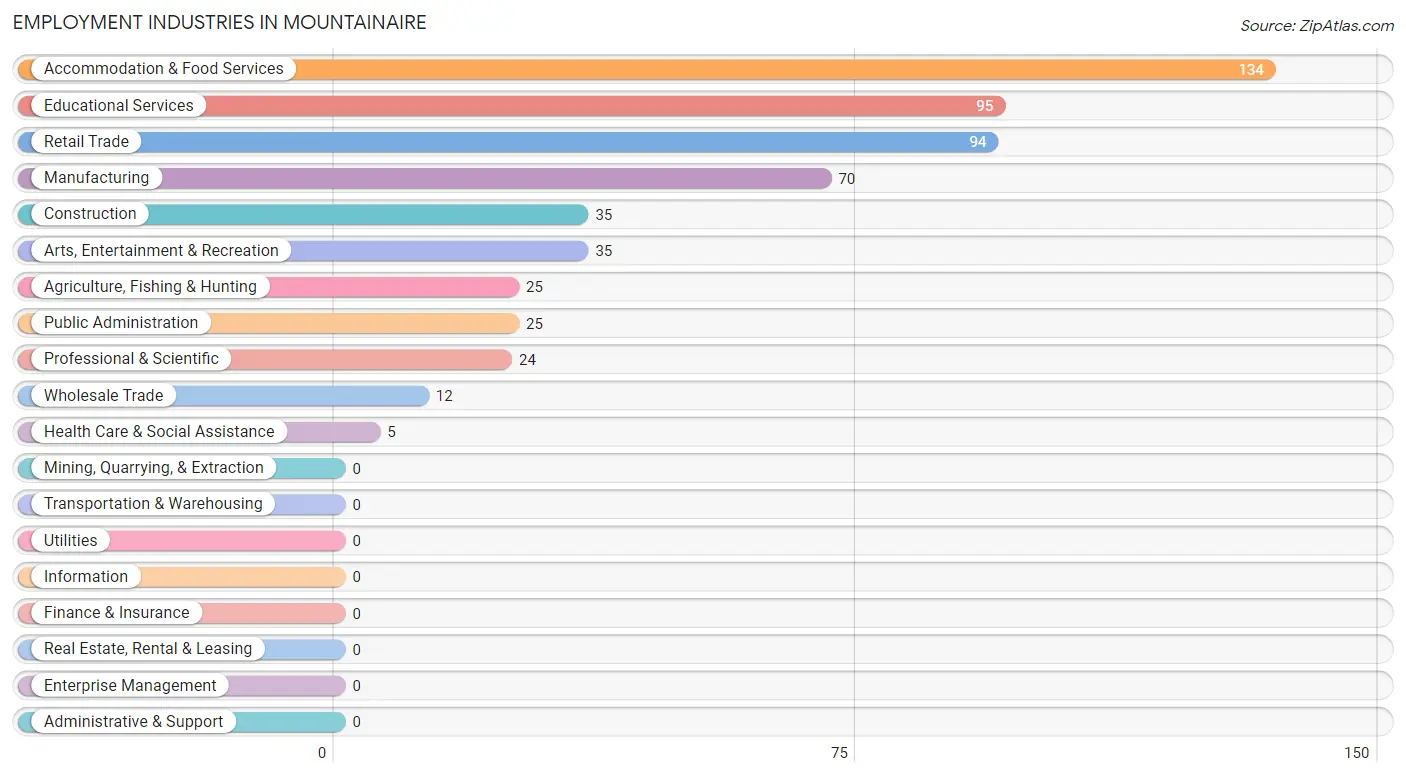
Employment Industries in Mountainaire
The major employment industries in Mountainaire include Accommodation & Food Services (134 | 23.0%), Educational Services (95 | 16.3%), Retail Trade (94 | 16.1%), Manufacturing (70 | 12.0%), and Construction (35 | 6.0%).
Employment Industries by Sex in Mountainaire
The Mountainaire industries that see more men than women are Agriculture, Fishing & Hunting (100.0%), Construction (100.0%), and Public Administration (100.0%), whereas the industries that tend to have a higher number of women are Wholesale Trade (100.0%), Professional & Scientific (100.0%), and Health Care & Social Assistance (100.0%).
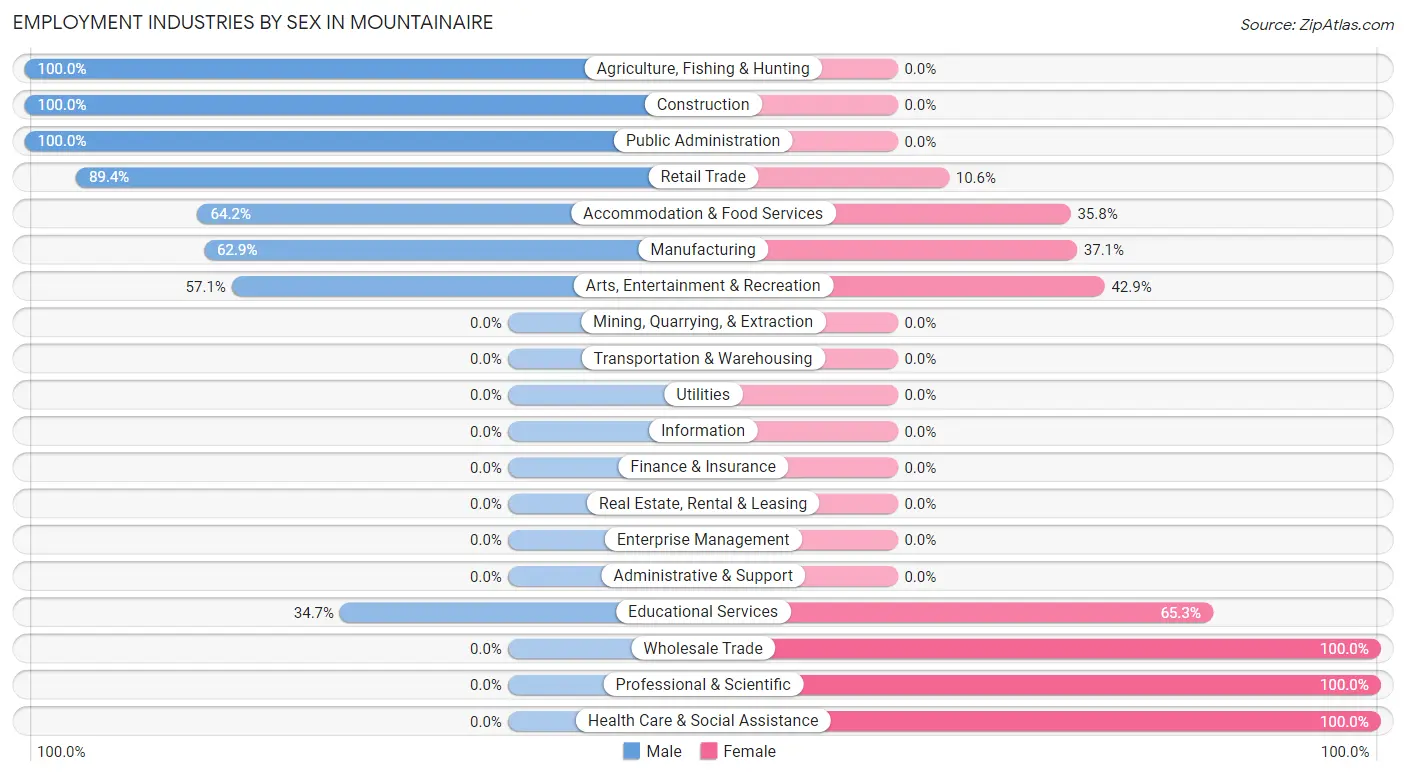
| Industry | Male | Female |
| Agriculture, Fishing & Hunting | 25 (100.0%) | 0 (0.0%) |
| Mining, Quarrying, & Extraction | 0 (0.0%) | 0 (0.0%) |
| Construction | 35 (100.0%) | 0 (0.0%) |
| Manufacturing | 44 (62.9%) | 26 (37.1%) |
| Wholesale Trade | 0 (0.0%) | 12 (100.0%) |
| Retail Trade | 84 (89.4%) | 10 (10.6%) |
| Transportation & Warehousing | 0 (0.0%) | 0 (0.0%) |
| Utilities | 0 (0.0%) | 0 (0.0%) |
| Information | 0 (0.0%) | 0 (0.0%) |
| Finance & Insurance | 0 (0.0%) | 0 (0.0%) |
| Real Estate, Rental & Leasing | 0 (0.0%) | 0 (0.0%) |
| Professional & Scientific | 0 (0.0%) | 24 (100.0%) |
| Enterprise Management | 0 (0.0%) | 0 (0.0%) |
| Administrative & Support | 0 (0.0%) | 0 (0.0%) |
| Educational Services | 33 (34.7%) | 62 (65.3%) |
| Health Care & Social Assistance | 0 (0.0%) | 5 (100.0%) |
| Arts, Entertainment & Recreation | 20 (57.1%) | 15 (42.9%) |
| Accommodation & Food Services | 86 (64.2%) | 48 (35.8%) |
| Public Administration | 25 (100.0%) | 0 (0.0%) |
| Total | 381 (65.3%) | 202 (34.6%) |
Education in Mountainaire
School Enrollment in Mountainaire
The most common levels of schooling among the 151 students in Mountainaire are college / undergraduate (120 | 79.5%), high school (16 | 10.6%), and elementary school (15 | 9.9%).
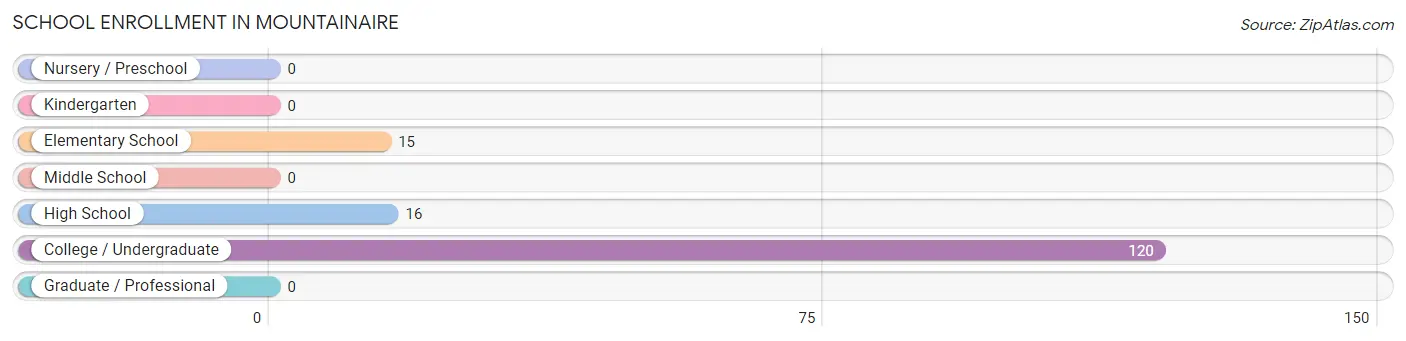
| School Level | # Students | % Students |
| Nursery / Preschool | 0 | 0.0% |
| Kindergarten | 0 | 0.0% |
| Elementary School | 15 | 9.9% |
| Middle School | 0 | 0.0% |
| High School | 16 | 10.6% |
| College / Undergraduate | 120 | 79.5% |
| Graduate / Professional | 0 | 0.0% |
| Total | 151 | 100.0% |
School Enrollment by Age by Funding Source in Mountainaire
Out of a total of 151 students who are enrolled in schools in Mountainaire, 31 (20.5%) attend a private institution, while the remaining 120 (79.5%) are enrolled in public schools. The age group of 15 to 17 year olds has the highest likelihood of being enrolled in private schools, with 16 (100.0% in the age bracket) enrolled. Conversely, the age group of 5 to 9 year old has the lowest likelihood of being enrolled in a private school, with 15 (100.0% in the age bracket) attending a public institution.
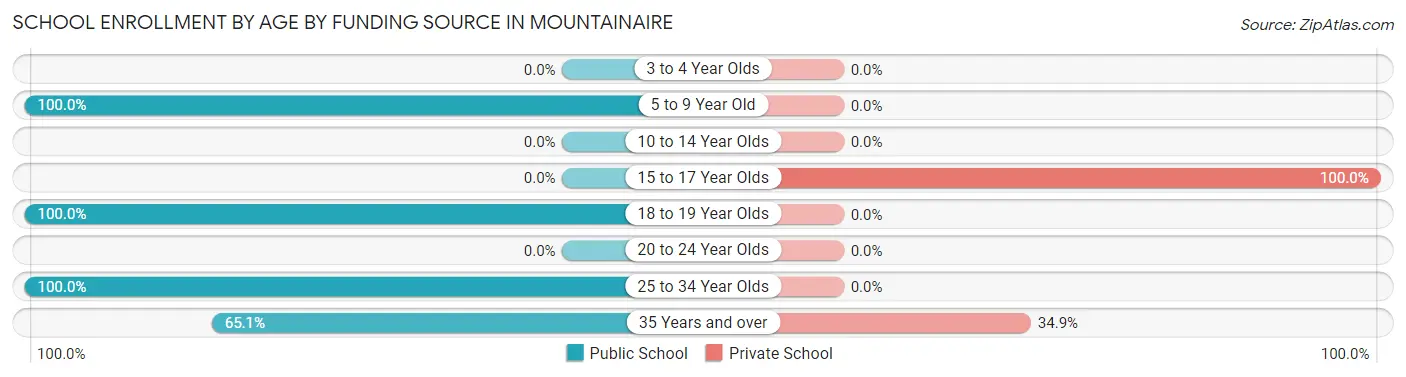
| Age Bracket | Public School | Private School |
| 3 to 4 Year Olds | 0 (0.0%) | 0 (0.0%) |
| 5 to 9 Year Old | 15 (100.0%) | 0 (0.0%) |
| 10 to 14 Year Olds | 0 (0.0%) | 0 (0.0%) |
| 15 to 17 Year Olds | 0 (0.0%) | 16 (100.0%) |
| 18 to 19 Year Olds | 15 (100.0%) | 0 (0.0%) |
| 20 to 24 Year Olds | 0 (0.0%) | 0 (0.0%) |
| 25 to 34 Year Olds | 62 (100.0%) | 0 (0.0%) |
| 35 Years and over | 28 (65.1%) | 15 (34.9%) |
| Total | 120 (79.5%) | 31 (20.5%) |
Educational Attainment by Field of Study in Mountainaire
Education (146 | 20.8%), arts & humanities (109 | 15.5%), bio, nature & agricultural (98 | 14.0%), visual & performing arts (83 | 11.8%), and business (82 | 11.7%) are the most common fields of study among 702 individuals in Mountainaire who have obtained a bachelor's degree or higher.
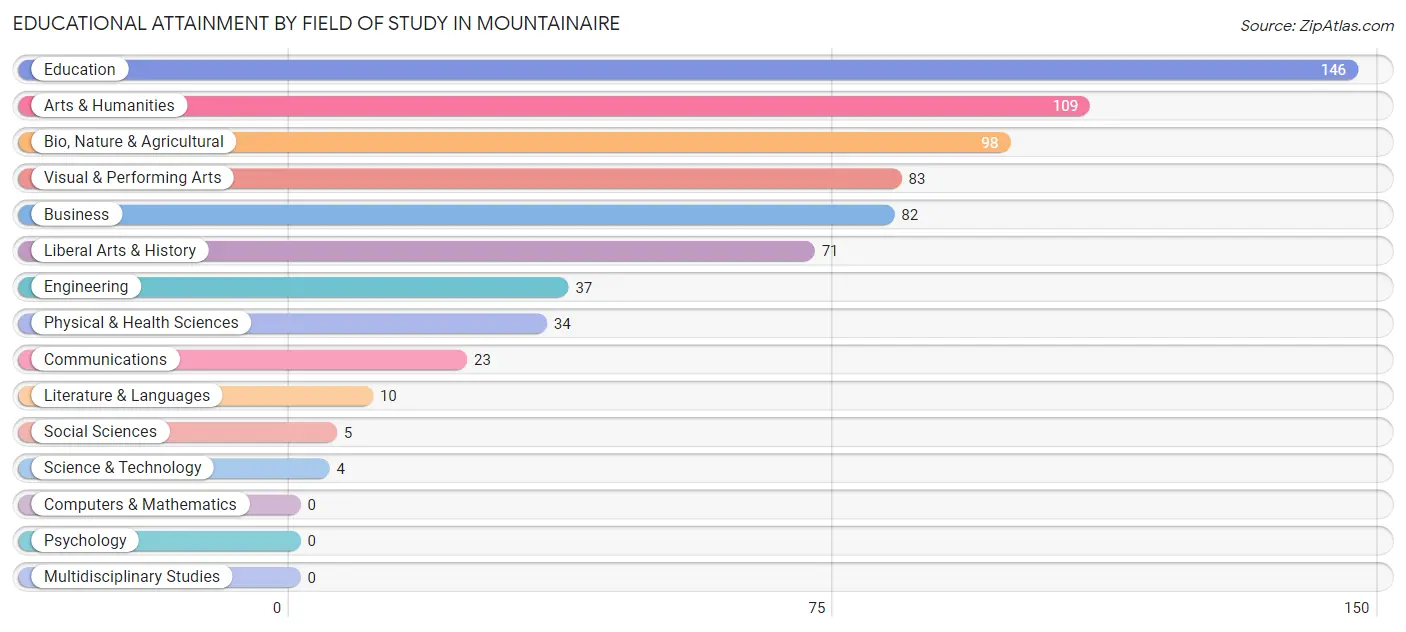
| Field of Study | # Graduates | % Graduates |
| Computers & Mathematics | 0 | 0.0% |
| Bio, Nature & Agricultural | 98 | 14.0% |
| Physical & Health Sciences | 34 | 4.8% |
| Psychology | 0 | 0.0% |
| Social Sciences | 5 | 0.7% |
| Engineering | 37 | 5.3% |
| Multidisciplinary Studies | 0 | 0.0% |
| Science & Technology | 4 | 0.6% |
| Business | 82 | 11.7% |
| Education | 146 | 20.8% |
| Literature & Languages | 10 | 1.4% |
| Liberal Arts & History | 71 | 10.1% |
| Visual & Performing Arts | 83 | 11.8% |
| Communications | 23 | 3.3% |
| Arts & Humanities | 109 | 15.5% |
| Total | 702 | 100.0% |
Transportation & Commute in Mountainaire
Vehicle Availability by Sex in Mountainaire
The most prevalent vehicle ownership categories in Mountainaire are males with 2 vehicles (168, accounting for 45.2%) and females with 2 vehicles (101, making up 83.2%).

| Vehicles Available | Male | Female |
| No Vehicle | 5 (1.3%) | 0 (0.0%) |
| 1 Vehicle | 123 (33.1%) | 37 (18.3%) |
| 2 Vehicles | 168 (45.2%) | 101 (50.0%) |
| 3 Vehicles | 66 (17.7%) | 26 (12.9%) |
| 4 Vehicles | 10 (2.7%) | 33 (16.3%) |
| 5 or more Vehicles | 0 (0.0%) | 5 (2.5%) |
| Total | 372 (100.0%) | 202 (100.0%) |
Commute Time in Mountainaire
The most frequently occuring commute durations in Mountainaire are 20 to 24 minutes (225 commuters, 44.0%), 15 to 19 minutes (196 commuters, 38.3%), and 30 to 34 minutes (25 commuters, 4.9%).
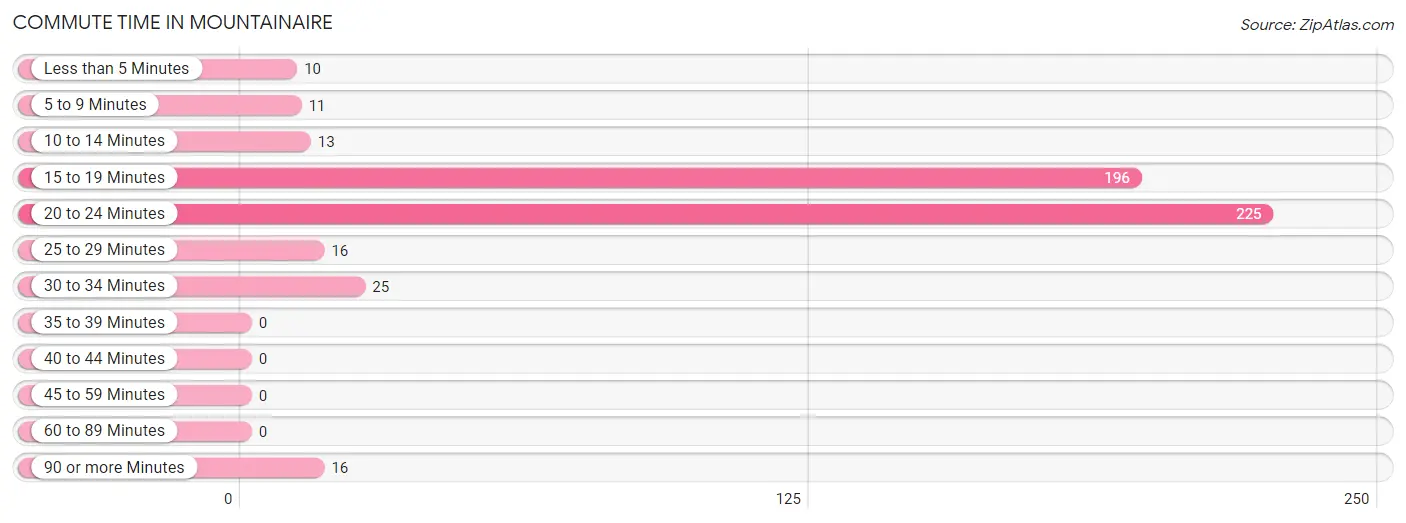
| Commute Time | # Commuters | % Commuters |
| Less than 5 Minutes | 10 | 1.9% |
| 5 to 9 Minutes | 11 | 2.1% |
| 10 to 14 Minutes | 13 | 2.5% |
| 15 to 19 Minutes | 196 | 38.3% |
| 20 to 24 Minutes | 225 | 44.0% |
| 25 to 29 Minutes | 16 | 3.1% |
| 30 to 34 Minutes | 25 | 4.9% |
| 35 to 39 Minutes | 0 | 0.0% |
| 40 to 44 Minutes | 0 | 0.0% |
| 45 to 59 Minutes | 0 | 0.0% |
| 60 to 89 Minutes | 0 | 0.0% |
| 90 or more Minutes | 16 | 3.1% |
Commute Time by Sex in Mountainaire
The most common commute times in Mountainaire are 20 to 24 minutes (167 commuters, 48.1%) for males and 15 to 19 minutes (88 commuters, 53.3%) for females.
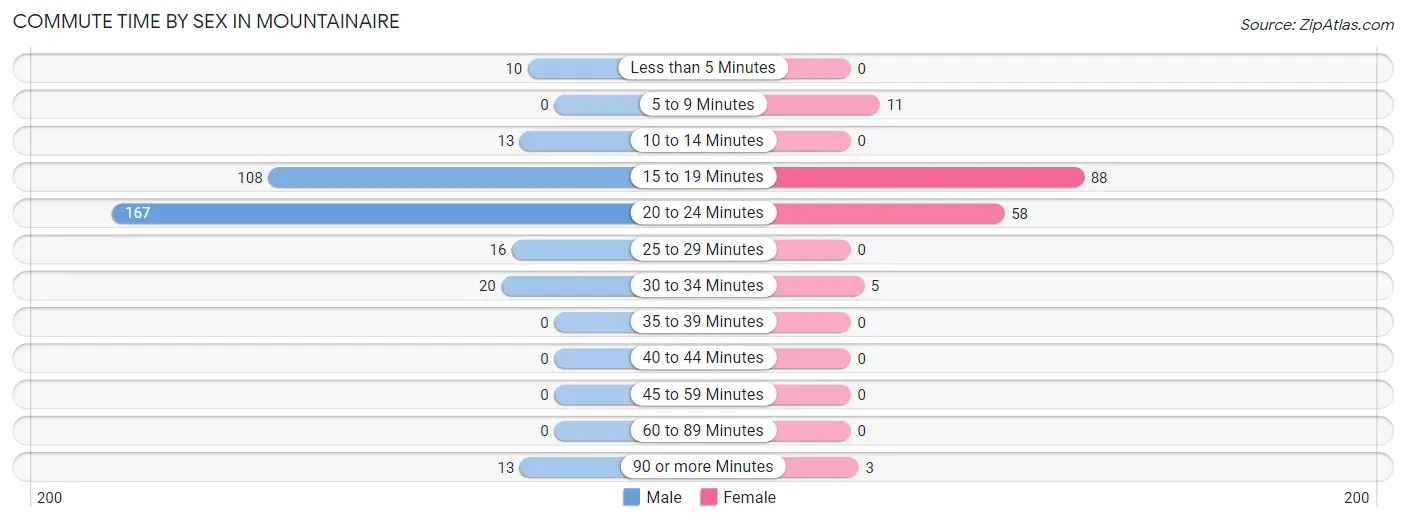
| Commute Time | Male | Female |
| Less than 5 Minutes | 10 (2.9%) | 0 (0.0%) |
| 5 to 9 Minutes | 0 (0.0%) | 11 (6.7%) |
| 10 to 14 Minutes | 13 (3.7%) | 0 (0.0%) |
| 15 to 19 Minutes | 108 (31.1%) | 88 (53.3%) |
| 20 to 24 Minutes | 167 (48.1%) | 58 (35.1%) |
| 25 to 29 Minutes | 16 (4.6%) | 0 (0.0%) |
| 30 to 34 Minutes | 20 (5.8%) | 5 (3.0%) |
| 35 to 39 Minutes | 0 (0.0%) | 0 (0.0%) |
| 40 to 44 Minutes | 0 (0.0%) | 0 (0.0%) |
| 45 to 59 Minutes | 0 (0.0%) | 0 (0.0%) |
| 60 to 89 Minutes | 0 (0.0%) | 0 (0.0%) |
| 90 or more Minutes | 13 (3.7%) | 3 (1.8%) |
Time of Departure to Work by Sex in Mountainaire
The most frequent times of departure to work in Mountainaire are 8:00 AM to 8:29 AM (99, 28.5%) for males and 8:30 AM to 8:59 AM (73, 44.2%) for females.
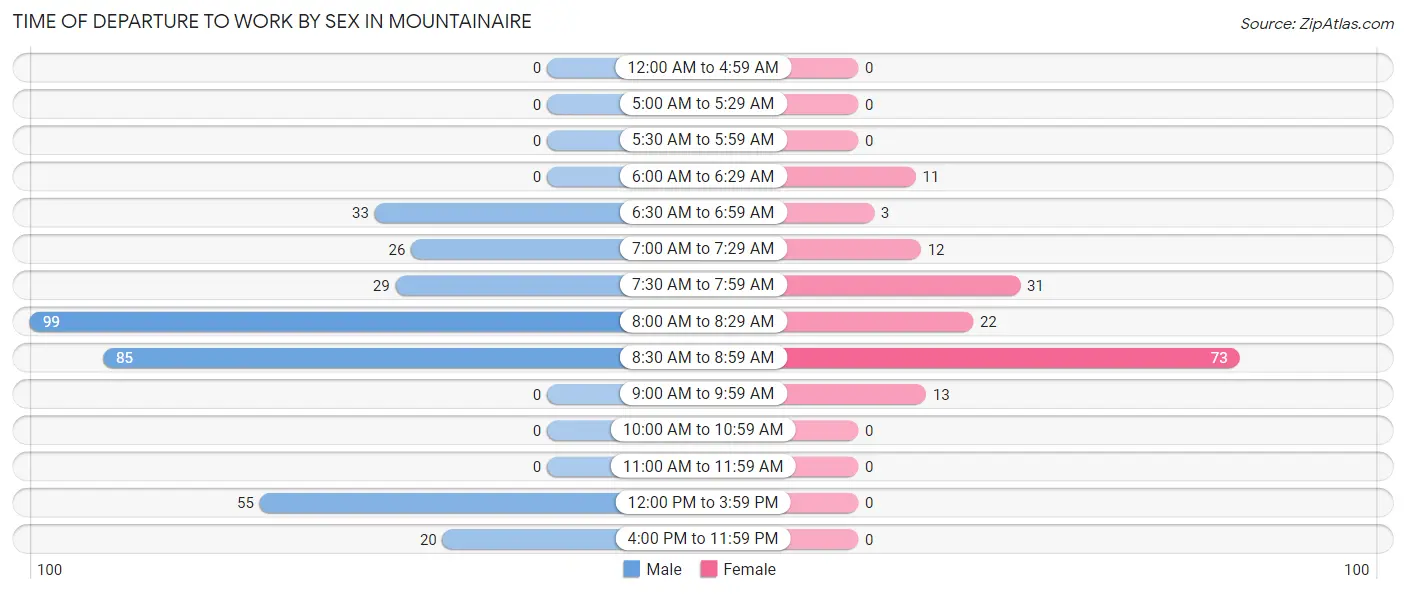
| Time of Departure | Male | Female |
| 12:00 AM to 4:59 AM | 0 (0.0%) | 0 (0.0%) |
| 5:00 AM to 5:29 AM | 0 (0.0%) | 0 (0.0%) |
| 5:30 AM to 5:59 AM | 0 (0.0%) | 0 (0.0%) |
| 6:00 AM to 6:29 AM | 0 (0.0%) | 11 (6.7%) |
| 6:30 AM to 6:59 AM | 33 (9.5%) | 3 (1.8%) |
| 7:00 AM to 7:29 AM | 26 (7.5%) | 12 (7.3%) |
| 7:30 AM to 7:59 AM | 29 (8.4%) | 31 (18.8%) |
| 8:00 AM to 8:29 AM | 99 (28.5%) | 22 (13.3%) |
| 8:30 AM to 8:59 AM | 85 (24.5%) | 73 (44.2%) |
| 9:00 AM to 9:59 AM | 0 (0.0%) | 13 (7.9%) |
| 10:00 AM to 10:59 AM | 0 (0.0%) | 0 (0.0%) |
| 11:00 AM to 11:59 AM | 0 (0.0%) | 0 (0.0%) |
| 12:00 PM to 3:59 PM | 55 (15.9%) | 0 (0.0%) |
| 4:00 PM to 11:59 PM | 20 (5.8%) | 0 (0.0%) |
| Total | 347 (100.0%) | 165 (100.0%) |
Housing Occupancy in Mountainaire
Occupancy by Ownership in Mountainaire
Of the total 475 dwellings in Mountainaire, owner-occupied units account for 434 (91.4%), while renter-occupied units make up 41 (8.6%).
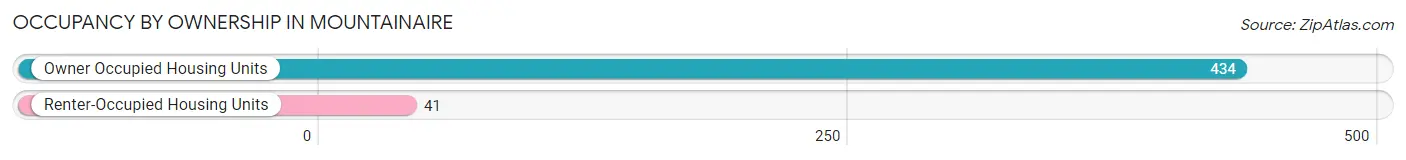
| Occupancy | # Housing Units | % Housing Units |
| Owner Occupied Housing Units | 434 | 91.4% |
| Renter-Occupied Housing Units | 41 | 8.6% |
| Total Occupied Housing Units | 475 | 100.0% |
Occupancy by Household Size in Mountainaire
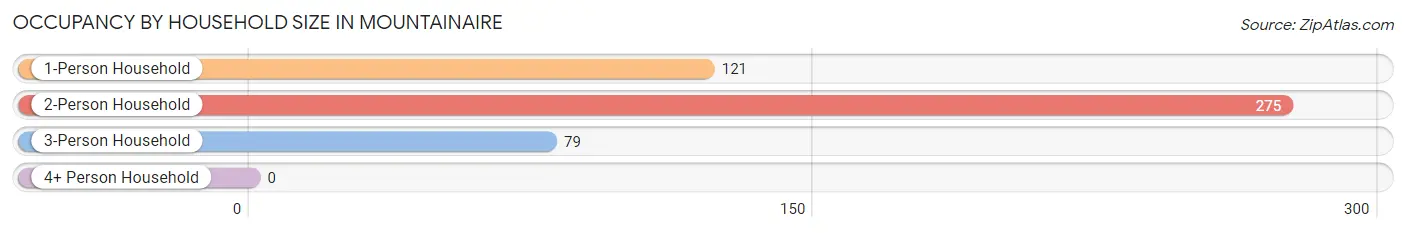
| Household Size | # Housing Units | % Housing Units |
| 1-Person Household | 121 | 25.5% |
| 2-Person Household | 275 | 57.9% |
| 3-Person Household | 79 | 16.6% |
| 4+ Person Household | 0 | 0.0% |
| Total Housing Units | 475 | 100.0% |
Occupancy by Ownership by Household Size in Mountainaire
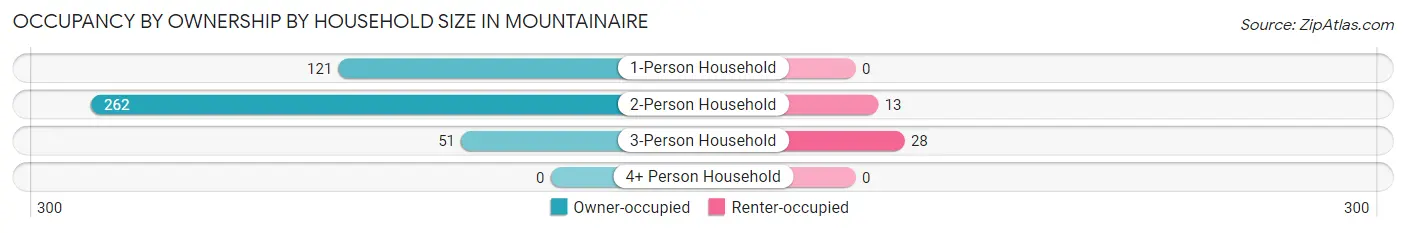
| Household Size | Owner-occupied | Renter-occupied |
| 1-Person Household | 121 (100.0%) | 0 (0.0%) |
| 2-Person Household | 262 (95.3%) | 13 (4.7%) |
| 3-Person Household | 51 (64.6%) | 28 (35.4%) |
| 4+ Person Household | 0 (0.0%) | 0 (0.0%) |
| Total Housing Units | 434 (91.4%) | 41 (8.6%) |
Occupancy by Educational Attainment in Mountainaire
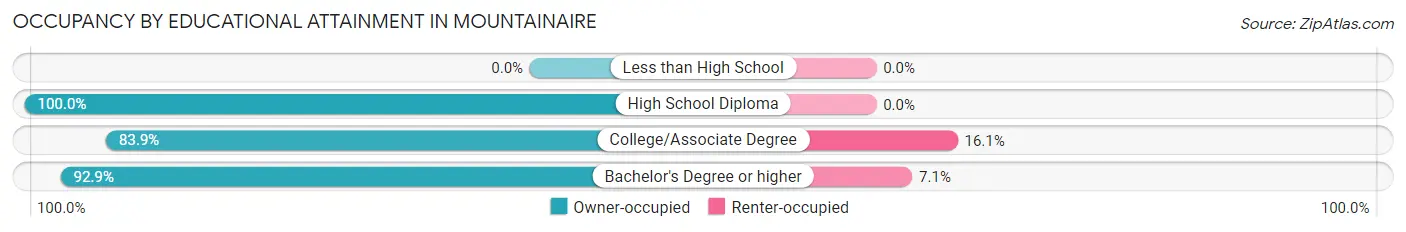
| Household Size | Owner-occupied | Renter-occupied |
| Less than High School | 0 (0.0%) | 0 (0.0%) |
| High School Diploma | 18 (100.0%) | 0 (0.0%) |
| College/Associate Degree | 78 (83.9%) | 15 (16.1%) |
| Bachelor's Degree or higher | 338 (92.9%) | 26 (7.1%) |
Occupancy by Age of Householder in Mountainaire
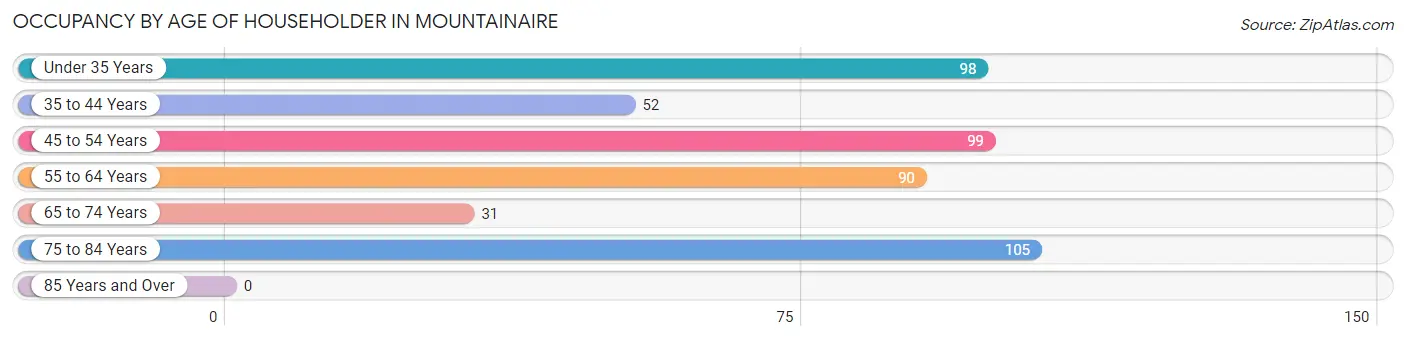
| Age Bracket | # Households | % Households |
| Under 35 Years | 98 | 20.6% |
| 35 to 44 Years | 52 | 11.0% |
| 45 to 54 Years | 99 | 20.8% |
| 55 to 64 Years | 90 | 19.0% |
| 65 to 74 Years | 31 | 6.5% |
| 75 to 84 Years | 105 | 22.1% |
| 85 Years and Over | 0 | 0.0% |
| Total | 475 | 100.0% |
Housing Finances in Mountainaire
Median Income by Occupancy in Mountainaire
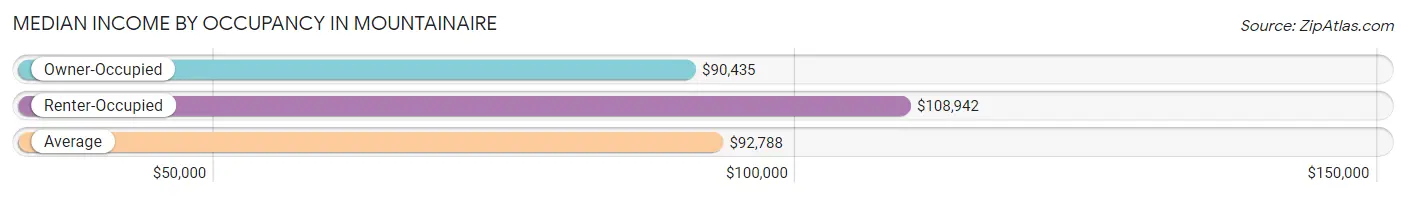
| Occupancy Type | # Households | Median Income |
| Owner-Occupied | 434 (91.4%) | $90,435 |
| Renter-Occupied | 41 (8.6%) | $108,942 |
| Average | 475 (100.0%) | $92,788 |
Occupancy by Householder Income Bracket in Mountainaire
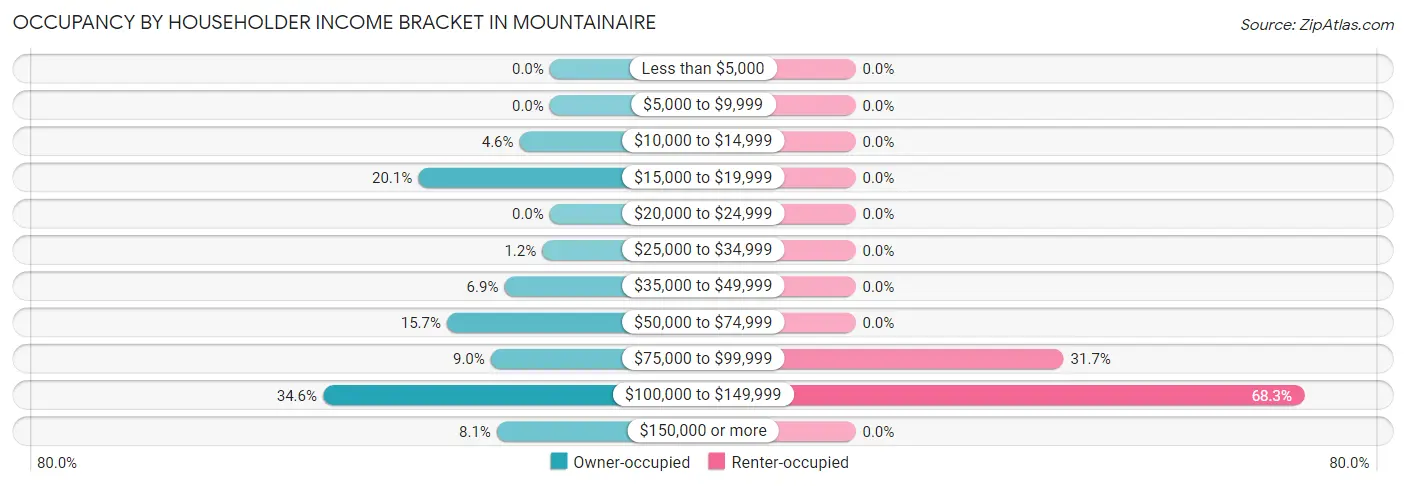
| Income Bracket | Owner-occupied | Renter-occupied |
| Less than $5,000 | 0 (0.0%) | 0 (0.0%) |
| $5,000 to $9,999 | 0 (0.0%) | 0 (0.0%) |
| $10,000 to $14,999 | 20 (4.6%) | 0 (0.0%) |
| $15,000 to $19,999 | 87 (20.1%) | 0 (0.0%) |
| $20,000 to $24,999 | 0 (0.0%) | 0 (0.0%) |
| $25,000 to $34,999 | 5 (1.1%) | 0 (0.0%) |
| $35,000 to $49,999 | 30 (6.9%) | 0 (0.0%) |
| $50,000 to $74,999 | 68 (15.7%) | 0 (0.0%) |
| $75,000 to $99,999 | 39 (9.0%) | 13 (31.7%) |
| $100,000 to $149,999 | 150 (34.6%) | 28 (68.3%) |
| $150,000 or more | 35 (8.1%) | 0 (0.0%) |
| Total | 434 (100.0%) | 41 (100.0%) |
Monthly Housing Cost Tiers in Mountainaire
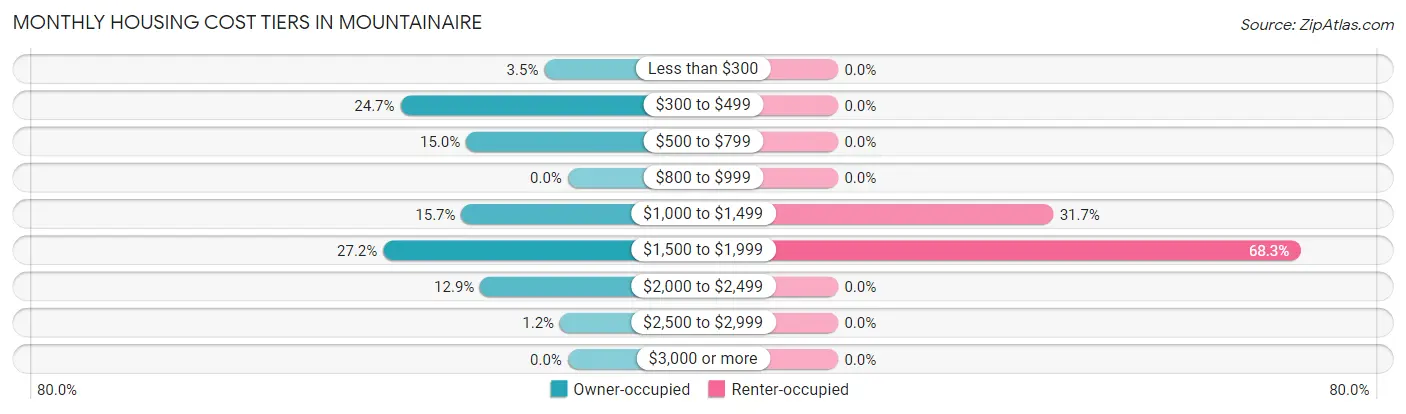
| Monthly Cost | Owner-occupied | Renter-occupied |
| Less than $300 | 15 (3.5%) | 0 (0.0%) |
| $300 to $499 | 107 (24.6%) | 0 (0.0%) |
| $500 to $799 | 65 (15.0%) | 0 (0.0%) |
| $800 to $999 | 0 (0.0%) | 0 (0.0%) |
| $1,000 to $1,499 | 68 (15.7%) | 13 (31.7%) |
| $1,500 to $1,999 | 118 (27.2%) | 28 (68.3%) |
| $2,000 to $2,499 | 56 (12.9%) | 0 (0.0%) |
| $2,500 to $2,999 | 5 (1.1%) | 0 (0.0%) |
| $3,000 or more | 0 (0.0%) | 0 (0.0%) |
| Total | 434 (100.0%) | 41 (100.0%) |
Physical Housing Characteristics in Mountainaire
Housing Structures in Mountainaire
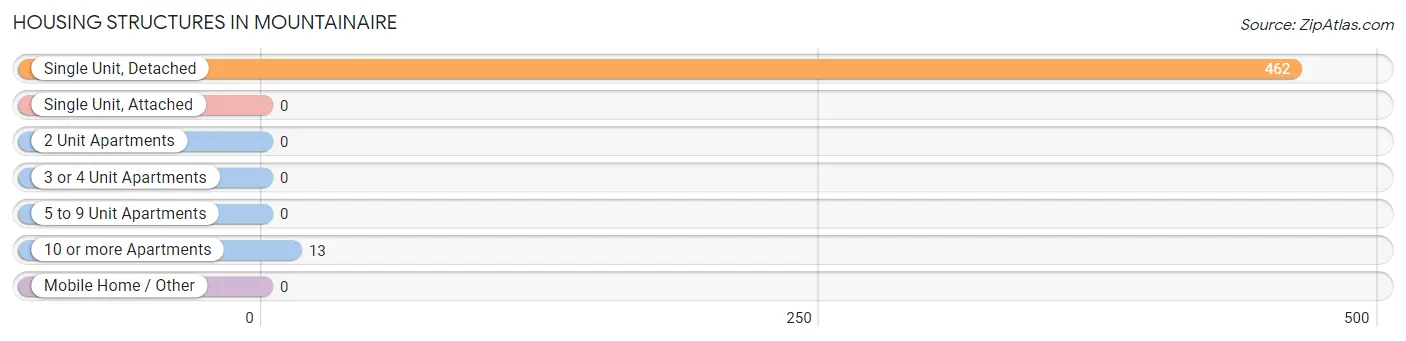
| Structure Type | # Housing Units | % Housing Units |
| Single Unit, Detached | 462 | 97.3% |
| Single Unit, Attached | 0 | 0.0% |
| 2 Unit Apartments | 0 | 0.0% |
| 3 or 4 Unit Apartments | 0 | 0.0% |
| 5 to 9 Unit Apartments | 0 | 0.0% |
| 10 or more Apartments | 13 | 2.7% |
| Mobile Home / Other | 0 | 0.0% |
| Total | 475 | 100.0% |
Housing Structures by Occupancy in Mountainaire
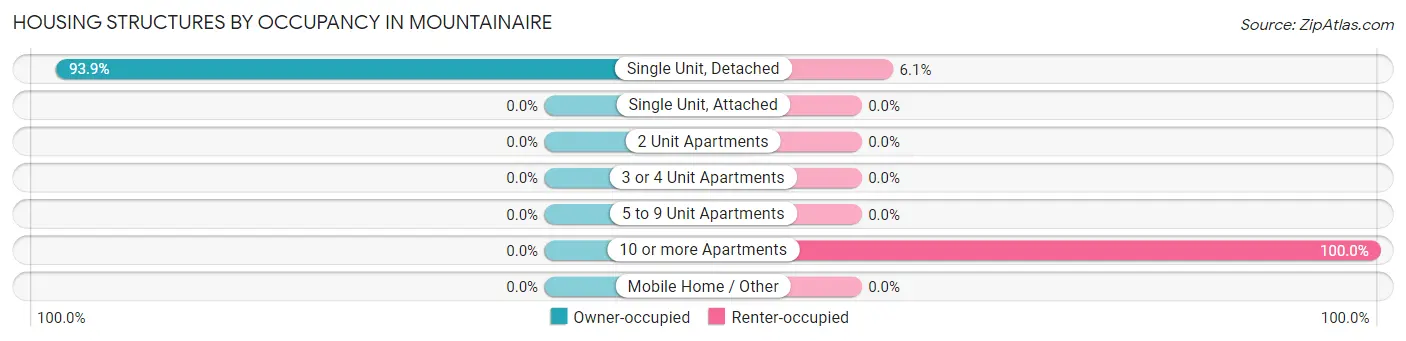
| Structure Type | Owner-occupied | Renter-occupied |
| Single Unit, Detached | 434 (93.9%) | 28 (6.1%) |
| Single Unit, Attached | 0 (0.0%) | 0 (0.0%) |
| 2 Unit Apartments | 0 (0.0%) | 0 (0.0%) |
| 3 or 4 Unit Apartments | 0 (0.0%) | 0 (0.0%) |
| 5 to 9 Unit Apartments | 0 (0.0%) | 0 (0.0%) |
| 10 or more Apartments | 0 (0.0%) | 13 (100.0%) |
| Mobile Home / Other | 0 (0.0%) | 0 (0.0%) |
| Total | 434 (91.4%) | 41 (8.6%) |
Housing Structures by Number of Rooms in Mountainaire
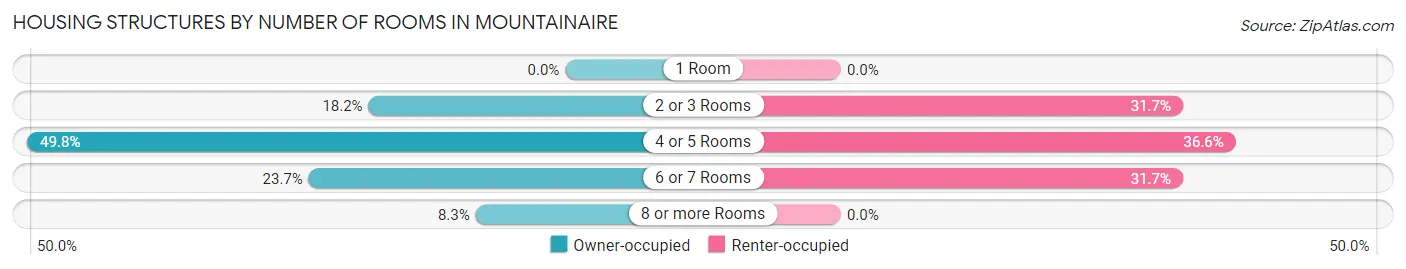
| Number of Rooms | Owner-occupied | Renter-occupied |
| 1 Room | 0 (0.0%) | 0 (0.0%) |
| 2 or 3 Rooms | 79 (18.2%) | 13 (31.7%) |
| 4 or 5 Rooms | 216 (49.8%) | 15 (36.6%) |
| 6 or 7 Rooms | 103 (23.7%) | 13 (31.7%) |
| 8 or more Rooms | 36 (8.3%) | 0 (0.0%) |
| Total | 434 (100.0%) | 41 (100.0%) |
Housing Structure by Heating Type in Mountainaire
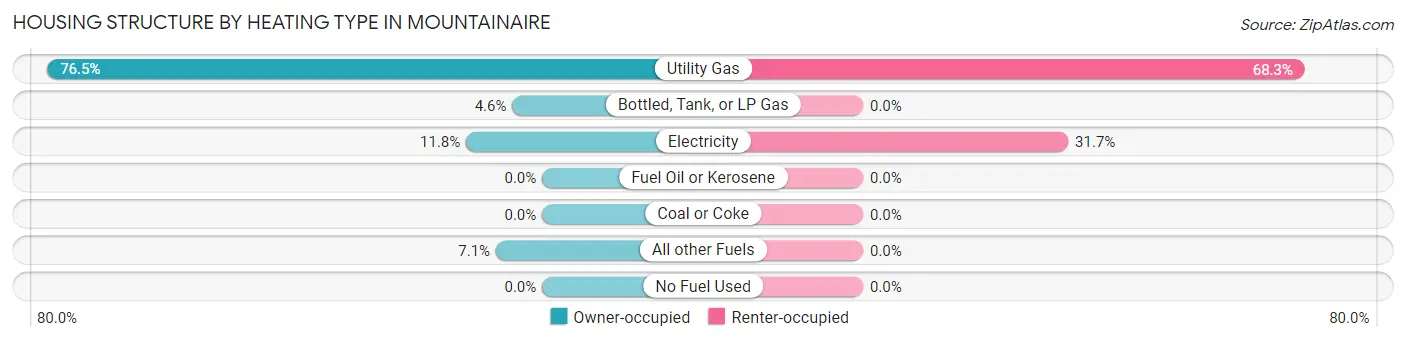
| Heating Type | Owner-occupied | Renter-occupied |
| Utility Gas | 332 (76.5%) | 28 (68.3%) |
| Bottled, Tank, or LP Gas | 20 (4.6%) | 0 (0.0%) |
| Electricity | 51 (11.7%) | 13 (31.7%) |
| Fuel Oil or Kerosene | 0 (0.0%) | 0 (0.0%) |
| Coal or Coke | 0 (0.0%) | 0 (0.0%) |
| All other Fuels | 31 (7.1%) | 0 (0.0%) |
| No Fuel Used | 0 (0.0%) | 0 (0.0%) |
| Total | 434 (100.0%) | 41 (100.0%) |
Household Vehicle Usage in Mountainaire
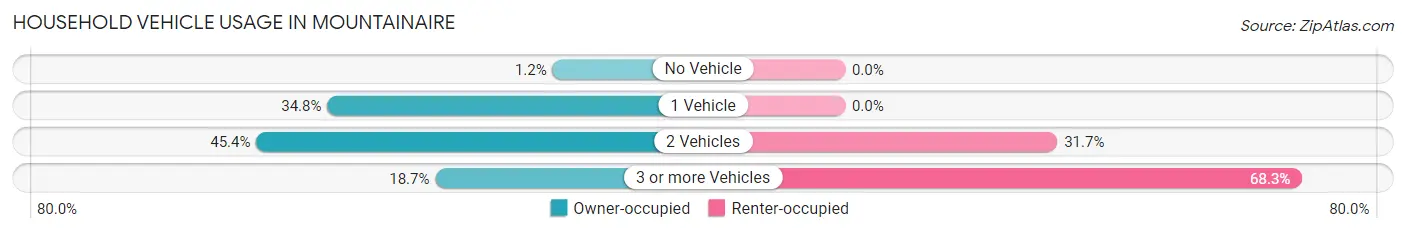
| Vehicles per Household | Owner-occupied | Renter-occupied |
| No Vehicle | 5 (1.1%) | 0 (0.0%) |
| 1 Vehicle | 151 (34.8%) | 0 (0.0%) |
| 2 Vehicles | 197 (45.4%) | 13 (31.7%) |
| 3 or more Vehicles | 81 (18.7%) | 28 (68.3%) |
| Total | 434 (100.0%) | 41 (100.0%) |
Real Estate & Mortgages in Mountainaire
Real Estate and Mortgage Overview in Mountainaire
| Characteristic | Without Mortgage | With Mortgage |
| Housing Units | 132 | 302 |
| Median Property Value | $433,300 | $423,300 |
| Median Household Income | - | - |
| Monthly Housing Costs | $341 | $0 |
| Real Estate Taxes | $1,667 | $0 |
Property Value by Mortgage Status in Mountainaire
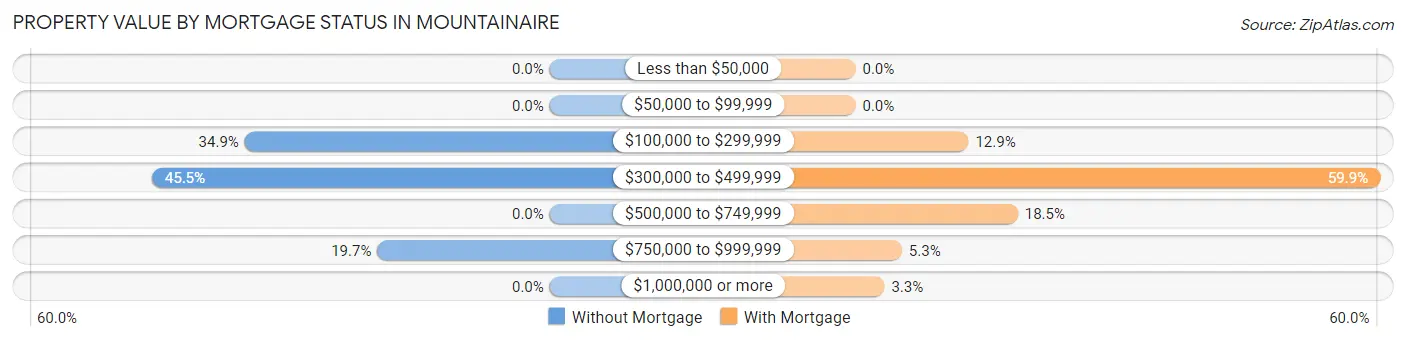
| Property Value | Without Mortgage | With Mortgage |
| Less than $50,000 | 0 (0.0%) | 0 (0.0%) |
| $50,000 to $99,999 | 0 (0.0%) | 0 (0.0%) |
| $100,000 to $299,999 | 46 (34.8%) | 39 (12.9%) |
| $300,000 to $499,999 | 60 (45.5%) | 181 (59.9%) |
| $500,000 to $749,999 | 0 (0.0%) | 56 (18.5%) |
| $750,000 to $999,999 | 26 (19.7%) | 16 (5.3%) |
| $1,000,000 or more | 0 (0.0%) | 10 (3.3%) |
| Total | 132 (100.0%) | 302 (100.0%) |
Household Income by Mortgage Status in Mountainaire
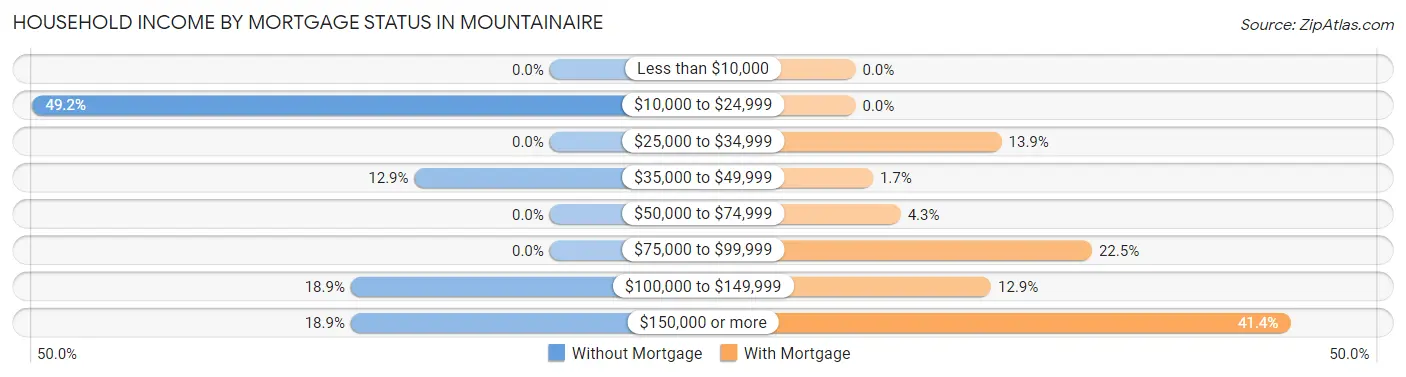
| Household Income | Without Mortgage | With Mortgage |
| Less than $10,000 | 0 (0.0%) | 0 (0.0%) |
| $10,000 to $24,999 | 65 (49.2%) | 0 (0.0%) |
| $25,000 to $34,999 | 0 (0.0%) | 42 (13.9%) |
| $35,000 to $49,999 | 17 (12.9%) | 5 (1.7%) |
| $50,000 to $74,999 | 0 (0.0%) | 13 (4.3%) |
| $75,000 to $99,999 | 0 (0.0%) | 68 (22.5%) |
| $100,000 to $149,999 | 25 (18.9%) | 39 (12.9%) |
| $150,000 or more | 25 (18.9%) | 125 (41.4%) |
| Total | 132 (100.0%) | 302 (100.0%) |
Property Value to Household Income Ratio in Mountainaire
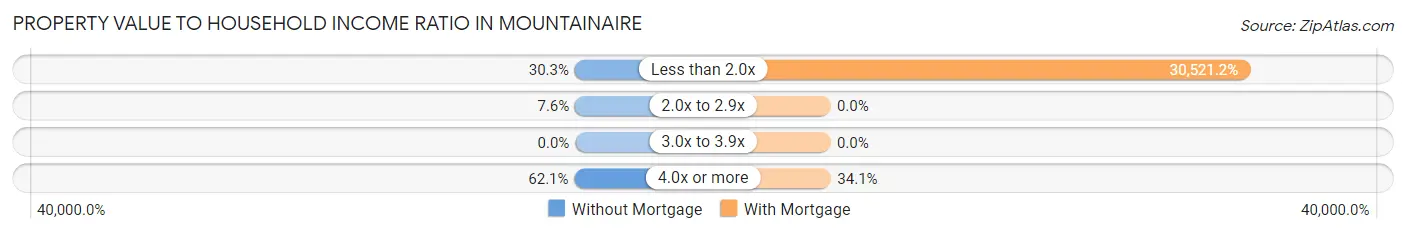
| Value-to-Income Ratio | Without Mortgage | With Mortgage |
| Less than 2.0x | 40 (30.3%) | 92,174 (30,521.2%) |
| 2.0x to 2.9x | 10 (7.6%) | 0 (0.0%) |
| 3.0x to 3.9x | 0 (0.0%) | 0 (0.0%) |
| 4.0x or more | 82 (62.1%) | 103 (34.1%) |
| Total | 132 (100.0%) | 302 (100.0%) |
Real Estate Taxes by Mortgage Status in Mountainaire
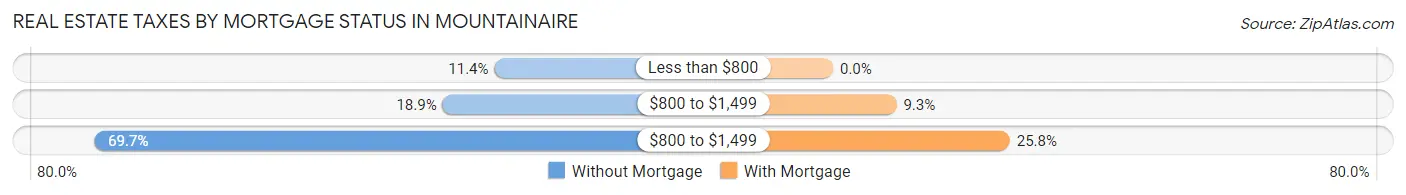
| Property Taxes | Without Mortgage | With Mortgage |
| Less than $800 | 15 (11.4%) | 0 (0.0%) |
| $800 to $1,499 | 25 (18.9%) | 28 (9.3%) |
| $800 to $1,499 | 92 (69.7%) | 78 (25.8%) |
| Total | 132 (100.0%) | 302 (100.0%) |
Health & Disability in Mountainaire
Health Insurance Coverage by Age in Mountainaire
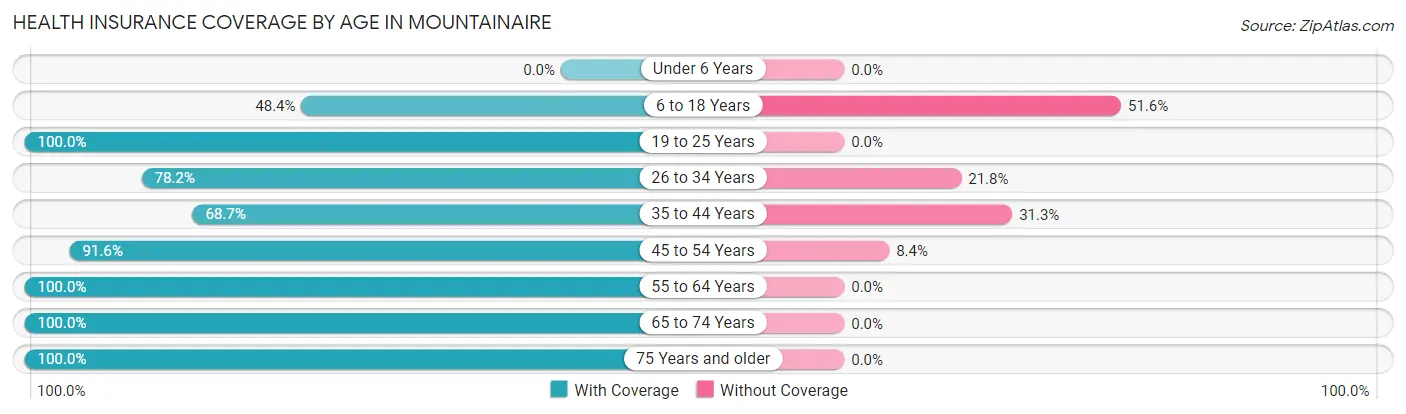
| Age Bracket | With Coverage | Without Coverage |
| Under 6 Years | 0 (0.0%) | 0 (0.0%) |
| 6 to 18 Years | 15 (48.4%) | 16 (51.6%) |
| 19 to 25 Years | 25 (100.0%) | 0 (0.0%) |
| 26 to 34 Years | 172 (78.2%) | 48 (21.8%) |
| 35 to 44 Years | 68 (68.7%) | 31 (31.3%) |
| 45 to 54 Years | 164 (91.6%) | 15 (8.4%) |
| 55 to 64 Years | 188 (100.0%) | 0 (0.0%) |
| 65 to 74 Years | 41 (100.0%) | 0 (0.0%) |
| 75 Years and older | 162 (100.0%) | 0 (0.0%) |
| Total | 835 (88.4%) | 110 (11.6%) |
Health Insurance Coverage by Citizenship Status in Mountainaire
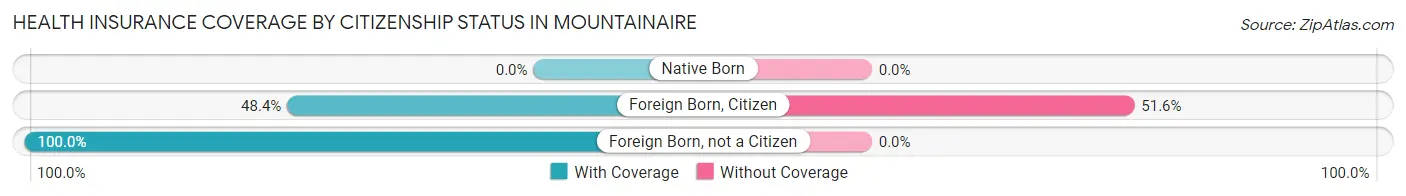
| Citizenship Status | With Coverage | Without Coverage |
| Native Born | 0 (0.0%) | 0 (0.0%) |
| Foreign Born, Citizen | 15 (48.4%) | 16 (51.6%) |
| Foreign Born, not a Citizen | 25 (100.0%) | 0 (0.0%) |
Health Insurance Coverage by Household Income in Mountainaire
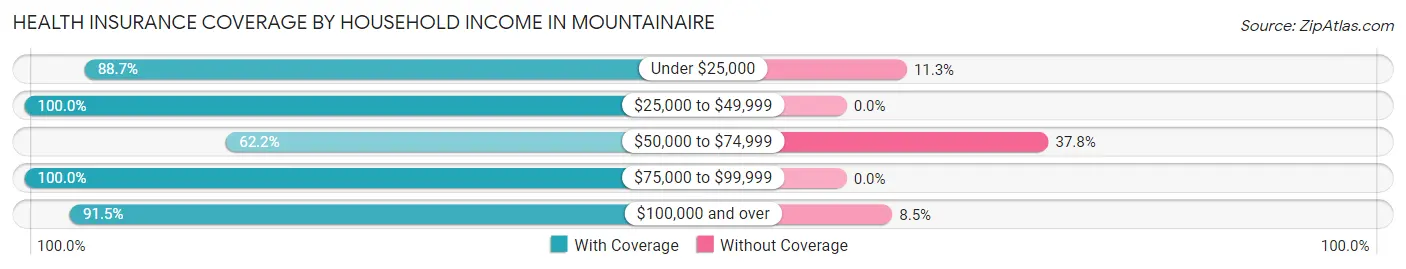
| Household Income | With Coverage | Without Coverage |
| Under $25,000 | 126 (88.7%) | 16 (11.3%) |
| $25,000 to $49,999 | 50 (100.0%) | 0 (0.0%) |
| $50,000 to $74,999 | 79 (62.2%) | 48 (37.8%) |
| $75,000 to $99,999 | 87 (100.0%) | 0 (0.0%) |
| $100,000 and over | 493 (91.5%) | 46 (8.5%) |
Public vs Private Health Insurance Coverage by Age in Mountainaire
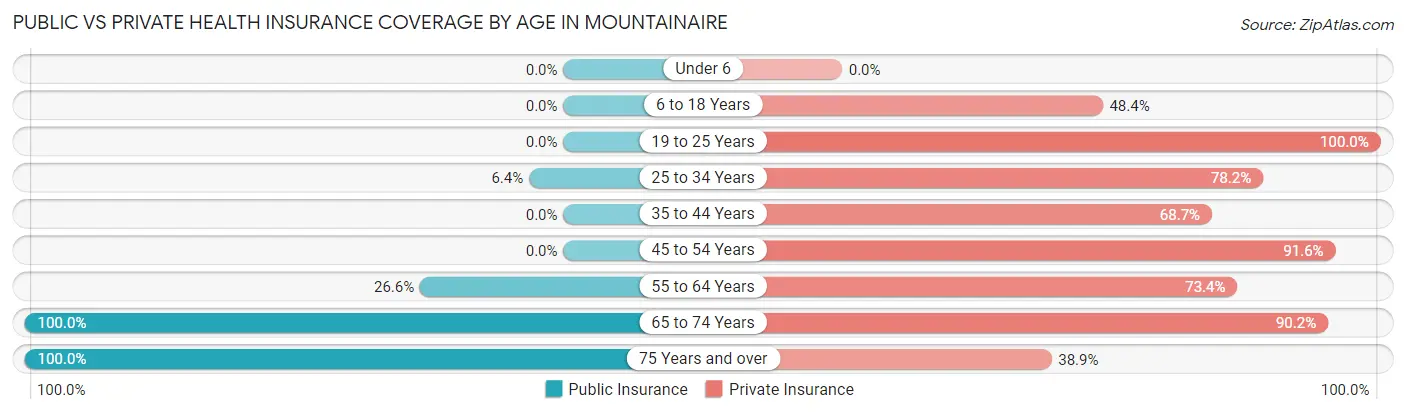
| Age Bracket | Public Insurance | Private Insurance |
| Under 6 | 0 (0.0%) | 0 (0.0%) |
| 6 to 18 Years | 0 (0.0%) | 15 (48.4%) |
| 19 to 25 Years | 0 (0.0%) | 25 (100.0%) |
| 25 to 34 Years | 14 (6.4%) | 172 (78.2%) |
| 35 to 44 Years | 0 (0.0%) | 68 (68.7%) |
| 45 to 54 Years | 0 (0.0%) | 164 (91.6%) |
| 55 to 64 Years | 50 (26.6%) | 138 (73.4%) |
| 65 to 74 Years | 41 (100.0%) | 37 (90.2%) |
| 75 Years and over | 162 (100.0%) | 63 (38.9%) |
| Total | 267 (28.2%) | 682 (72.2%) |
Disability Status by Sex by Age in Mountainaire
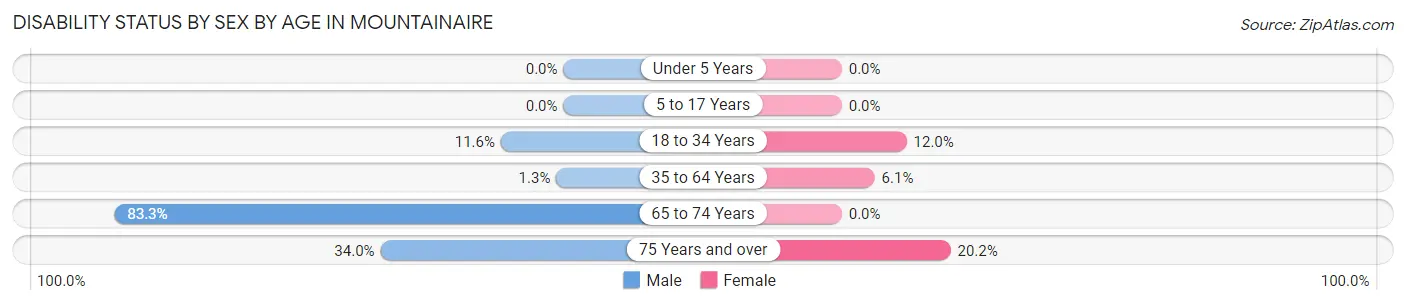
| Age Bracket | Male | Female |
| Under 5 Years | 0 (0.0%) | 0 (0.0%) |
| 5 to 17 Years | 0 (0.0%) | 0 (0.0%) |
| 18 to 34 Years | 13 (11.6%) | 16 (12.0%) |
| 35 to 64 Years | 4 (1.3%) | 10 (6.1%) |
| 65 to 74 Years | 20 (83.3%) | 0 (0.0%) |
| 75 Years and over | 18 (34.0%) | 22 (20.2%) |
Disability Class by Sex by Age in Mountainaire
Disability Class: Hearing Difficulty
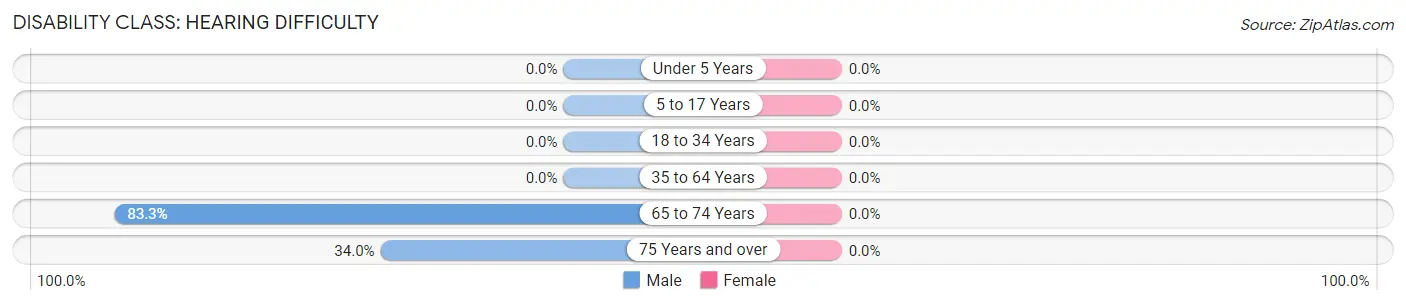
| Age Bracket | Male | Female |
| Under 5 Years | 0 (0.0%) | 0 (0.0%) |
| 5 to 17 Years | 0 (0.0%) | 0 (0.0%) |
| 18 to 34 Years | 0 (0.0%) | 0 (0.0%) |
| 35 to 64 Years | 0 (0.0%) | 0 (0.0%) |
| 65 to 74 Years | 20 (83.3%) | 0 (0.0%) |
| 75 Years and over | 18 (34.0%) | 0 (0.0%) |
Disability Class: Vision Difficulty
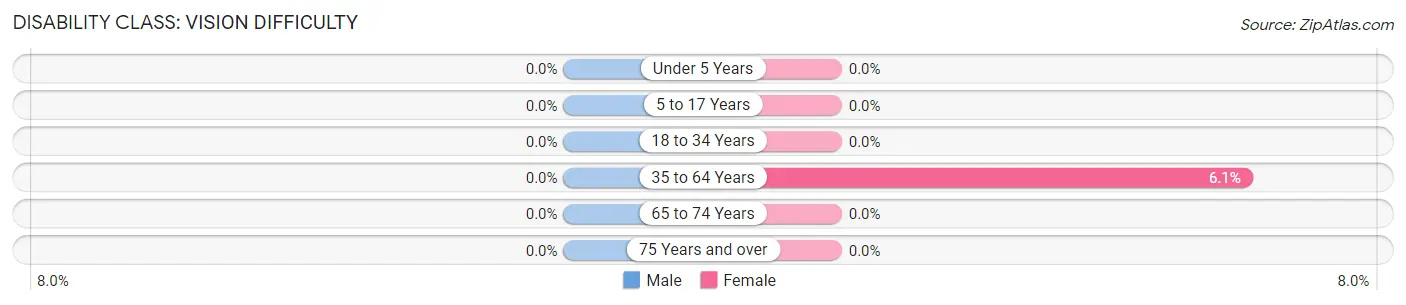
| Age Bracket | Male | Female |
| Under 5 Years | 0 (0.0%) | 0 (0.0%) |
| 5 to 17 Years | 0 (0.0%) | 0 (0.0%) |
| 18 to 34 Years | 0 (0.0%) | 0 (0.0%) |
| 35 to 64 Years | 0 (0.0%) | 10 (6.1%) |
| 65 to 74 Years | 0 (0.0%) | 0 (0.0%) |
| 75 Years and over | 0 (0.0%) | 0 (0.0%) |
Disability Class: Cognitive Difficulty
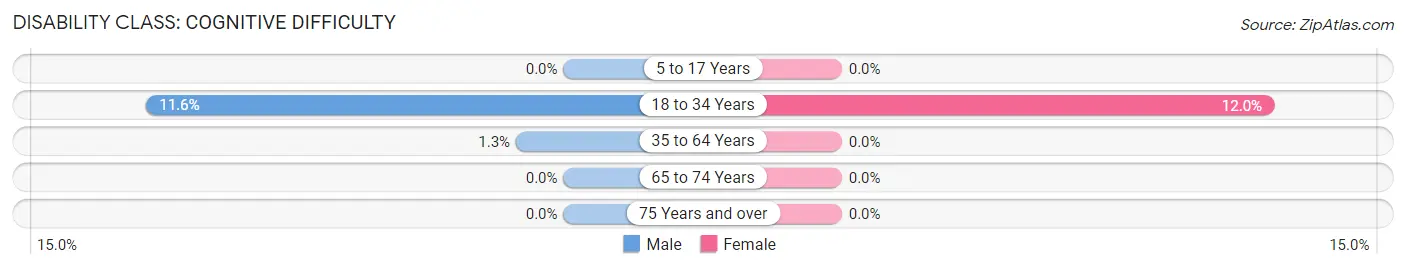
| Age Bracket | Male | Female |
| 5 to 17 Years | 0 (0.0%) | 0 (0.0%) |
| 18 to 34 Years | 13 (11.6%) | 16 (12.0%) |
| 35 to 64 Years | 4 (1.3%) | 0 (0.0%) |
| 65 to 74 Years | 0 (0.0%) | 0 (0.0%) |
| 75 Years and over | 0 (0.0%) | 0 (0.0%) |
Disability Class: Ambulatory Difficulty
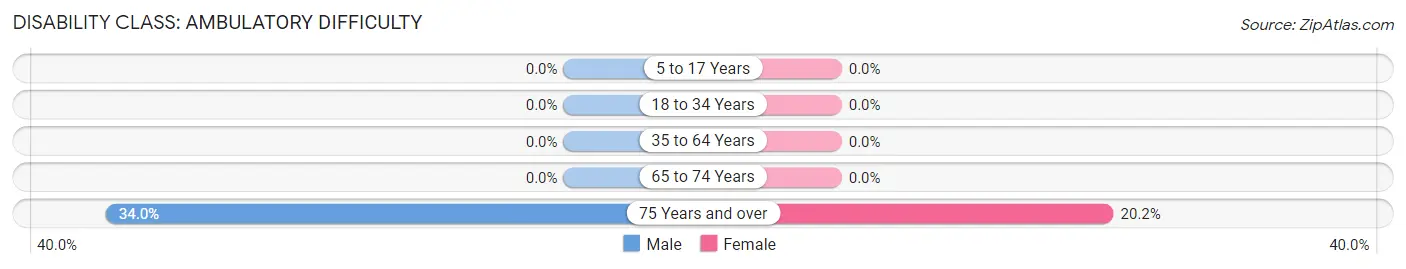
| Age Bracket | Male | Female |
| 5 to 17 Years | 0 (0.0%) | 0 (0.0%) |
| 18 to 34 Years | 0 (0.0%) | 0 (0.0%) |
| 35 to 64 Years | 0 (0.0%) | 0 (0.0%) |
| 65 to 74 Years | 0 (0.0%) | 0 (0.0%) |
| 75 Years and over | 18 (34.0%) | 22 (20.2%) |
Disability Class: Self-Care Difficulty
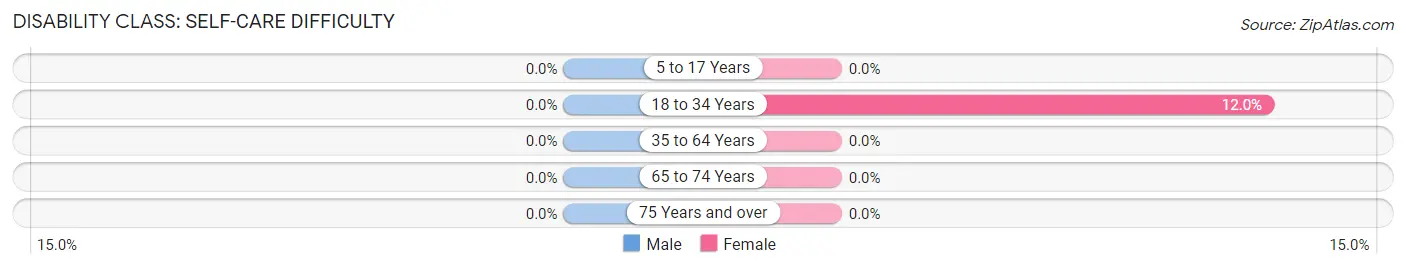
| Age Bracket | Male | Female |
| 5 to 17 Years | 0 (0.0%) | 0 (0.0%) |
| 18 to 34 Years | 0 (0.0%) | 16 (12.0%) |
| 35 to 64 Years | 0 (0.0%) | 0 (0.0%) |
| 65 to 74 Years | 0 (0.0%) | 0 (0.0%) |
| 75 Years and over | 0 (0.0%) | 0 (0.0%) |
Technology Access in Mountainaire
Computing Device Access in Mountainaire
| Device Type | # Households | % Households |
| Desktop or Laptop | 475 | 100.0% |
| Smartphone | 475 | 100.0% |
| Tablet | 305 | 64.2% |
| No Computing Device | 0 | 0.0% |
| Total | 475 | 100.0% |
Internet Access in Mountainaire
| Internet Type | # Households | % Households |
| Dial-Up Internet | 0 | 0.0% |
| Broadband Home | 401 | 84.4% |
| Cellular Data Only | 39 | 8.2% |
| Satellite Internet | 21 | 4.4% |
| No Internet | 4 | 0.8% |
| Total | 475 | 100.0% |
Mountainaire Summary
Mountainaire is an unincorporated community located in Coconino County, Arizona, United States. It is located in the Coconino National Forest, approximately 10 miles (16 km) north of Flagstaff. The community is situated at an elevation of 6,890 feet (2,100 m).
History
Mountainaire was founded in the early 1900s as a logging camp. The community was named after the nearby mountain range, the San Francisco Peaks. The first post office was established in the area in 1912.
In the 1920s, the area was developed as a summer resort. The first resort, the Mountainaire Inn, was built in 1924. The resort was popular with tourists from the Phoenix area.
In the 1950s, the area was developed as a residential community. The first homes were built in the area in 1954. The community has grown steadily since then, and today it is home to over 1,000 people.
Geography
Mountainaire is located in the Coconino National Forest, approximately 10 miles (16 km) north of Flagstaff. The community is situated at an elevation of 6,890 feet (2,100 m). The area is surrounded by mountains, including the San Francisco Peaks, the highest mountain range in Arizona.
The climate in Mountainaire is semi-arid, with hot summers and cold winters. The average annual temperature is 52°F (11°C). The average annual precipitation is 17.5 inches (44.5 cm).
Economy
Mountainaire is primarily a residential community, with most of its residents commuting to Flagstaff for work. The community is also home to several small businesses, including a gas station, a grocery store, and a restaurant.
Demographics
As of the 2010 census, there were 1,072 people living in Mountainaire. The racial makeup of the community was 94.3% White, 0.7% Native American, 0.3% Asian, 0.2% African American, 0.1% Pacific Islander, and 4.4% from other races. Hispanic or Latino of any race were 5.2% of the population.
The median household income in Mountainaire was $45,000, and the median family income was $50,000. The per capita income was $20,000. About 8.3% of families and 10.2% of the population were below the poverty line.
Common Questions
What is the Total Population of Mountainaire?
Total Population of Mountainaire is 945.
What is the Total Male Population of Mountainaire?
Total Male Population of Mountainaire is 506.
What is the Total Female Population of Mountainaire?
Total Female Population of Mountainaire is 439.
What is the Ratio of Males per 100 Females in Mountainaire?
There are 115.26 Males per 100 Females in Mountainaire.
What is the Ratio of Females per 100 Males in Mountainaire?
There are 86.76 Females per 100 Males in Mountainaire.
What is the Median Population Age in Mountainaire?
Median Population Age in Mountainaire is 51.8 Years.
What is the Average Family Size in Mountainaire
Average Family Size in Mountainaire is 2.3 People.
What is the Average Household Size in Mountainaire
Average Household Size in Mountainaire is 2.0 People.
What is Per Capita Income in Mountainaire?
Per Capita income in Mountainaire is $44,857.
What is the Median Family Income in Mountainaire?
Median Family Income in Mountainaire is $122,601.
What is the Median Household income in Mountainaire?
Median Household Income in Mountainaire is $92,788.
What is Income or Wage Gap in Mountainaire?
Income or Wage Gap in Mountainaire is 20.6%.
Women in Mountainaire earn 79.4 cents for every dollar earned by a man.
What is Inequality or Gini Index in Mountainaire?
Inequality or Gini Index in Mountainaire is 0.37.
How Large is the Labor Force in Mountainaire?
There are 623 People in the Labor Forcein in Mountainaire.
What is the Percentage of People in the Labor Force in Mountainaire?
68.2% of People are in the Labor Force in Mountainaire.
What is the Unemployment Rate in Mountainaire?
Unemployment Rate in Mountainaire is 6.4%.