Cities with the Largest Hispanic or Latino Community in Arizona
RELATED REPORTS & OPTIONS
Hispanic or Latino
Arizona
Compare Cities
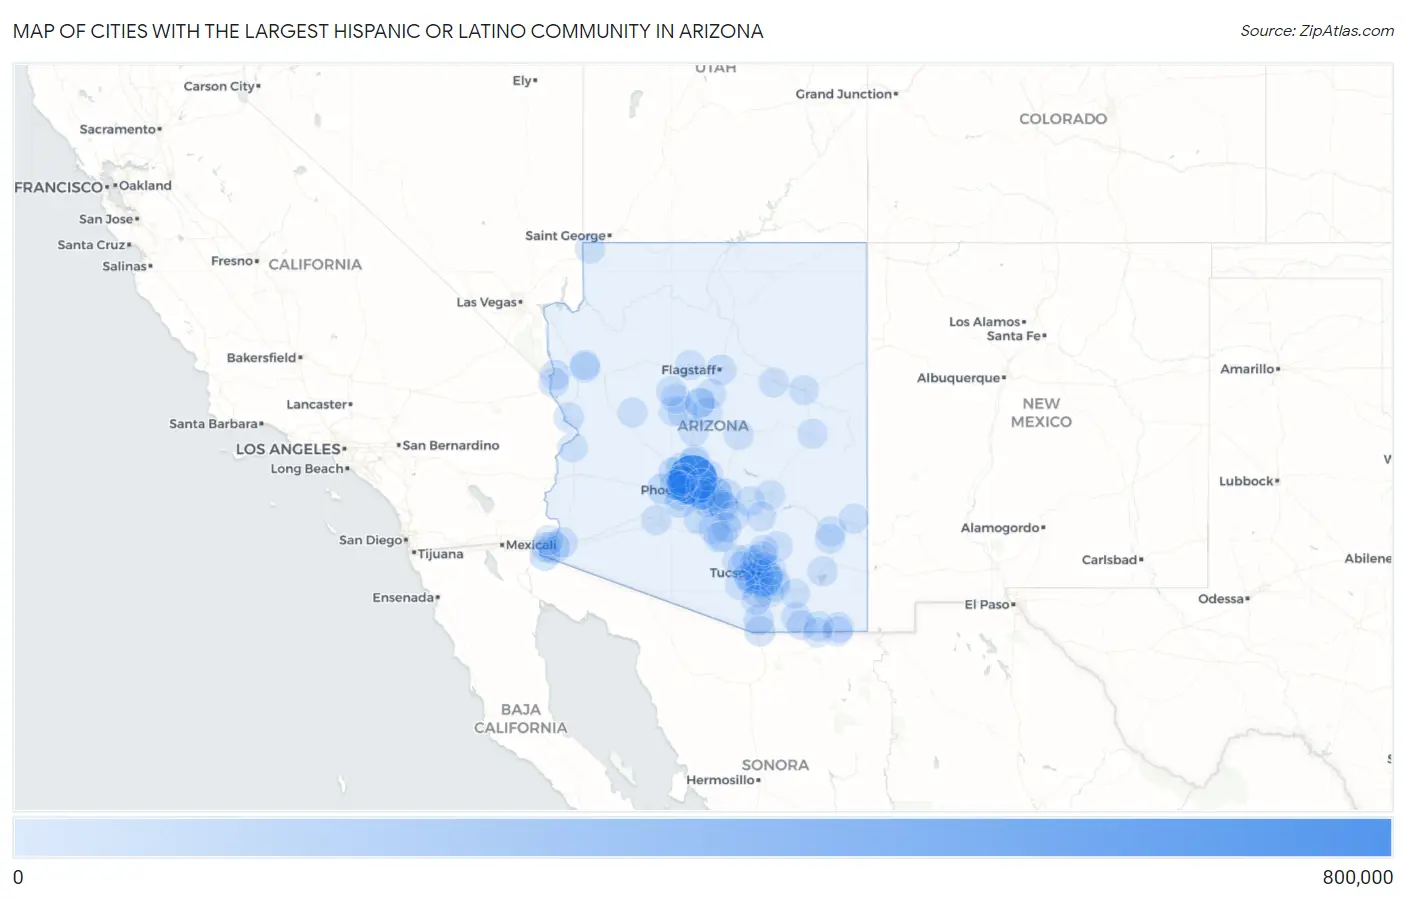
Map of Cities with the Largest Hispanic or Latino Community in Arizona
0
800,000
Cities with the Largest Hispanic or Latino Community in Arizona
| City | Hispanic or Latino | vs State | vs National | |
| 1. | Phoenix | 691,205 | 2,297,513(30.08%)#1 | 61,755,866(1.12%)#6 |
| 2. | Tucson | 242,228 | 2,297,513(10.54%)#2 | 61,755,866(0.39%)#19 |
| 3. | Mesa | 137,665 | 2,297,513(5.99%)#3 | 61,755,866(0.22%)#37 |
| 4. | Glendale | 100,191 | 2,297,513(4.36%)#4 | 61,755,866(0.16%)#64 |
| 5. | Yuma | 59,825 | 2,297,513(2.60%)#5 | 61,755,866(0.10%)#125 |
| 6. | Chandler | 58,453 | 2,297,513(2.54%)#6 | 61,755,866(0.09%)#130 |
| 7. | Avondale | 49,292 | 2,297,513(2.15%)#7 | 61,755,866(0.08%)#162 |
| 8. | Gilbert | 46,916 | 2,297,513(2.04%)#8 | 61,755,866(0.08%)#180 |
| 9. | Tempe | 42,497 | 2,297,513(1.85%)#9 | 61,755,866(0.07%)#207 |
| 10. | Buckeye | 42,435 | 2,297,513(1.85%)#10 | 61,755,866(0.07%)#208 |
| 11. | Peoria | 41,004 | 2,297,513(1.78%)#11 | 61,755,866(0.07%)#218 |
| 12. | San Luis | 33,150 | 2,297,513(1.44%)#12 | 61,755,866(0.05%)#281 |
| 13. | Goodyear | 31,348 | 2,297,513(1.36%)#13 | 61,755,866(0.05%)#298 |
| 14. | Surprise | 30,439 | 2,297,513(1.32%)#14 | 61,755,866(0.05%)#306 |
| 15. | San Tan Valley | 26,754 | 2,297,513(1.16%)#15 | 61,755,866(0.04%)#349 |
| 16. | Scottsdale | 25,081 | 2,297,513(1.09%)#16 | 61,755,866(0.04%)#379 |
| 17. | Casa Grande | 24,625 | 2,297,513(1.07%)#17 | 61,755,866(0.04%)#384 |
| 18. | Drexel Heights | 24,346 | 2,297,513(1.06%)#18 | 61,755,866(0.04%)#392 |
| 19. | Maricopa | 19,416 | 2,297,513(0.85%)#19 | 61,755,866(0.03%)#485 |
| 20. | Nogales | 18,741 | 2,297,513(0.82%)#20 | 61,755,866(0.03%)#498 |
| 21. | Rio Rico | 18,672 | 2,297,513(0.81%)#21 | 61,755,866(0.03%)#500 |
| 22. | Casas Adobes | 17,689 | 2,297,513(0.77%)#22 | 61,755,866(0.03%)#538 |
| 23. | El Mirage | 17,567 | 2,297,513(0.76%)#23 | 61,755,866(0.03%)#543 |
| 24. | Marana | 14,892 | 2,297,513(0.65%)#24 | 61,755,866(0.02%)#622 |
| 25. | Flagstaff | 14,587 | 2,297,513(0.63%)#25 | 61,755,866(0.02%)#635 |
| 26. | Douglas | 13,791 | 2,297,513(0.60%)#26 | 61,755,866(0.02%)#681 |
| 27. | Somerton | 13,731 | 2,297,513(0.60%)#27 | 61,755,866(0.02%)#687 |
| 28. | Sahuarita | 13,429 | 2,297,513(0.58%)#28 | 61,755,866(0.02%)#698 |
| 29. | Sierra Vista | 11,117 | 2,297,513(0.48%)#29 | 61,755,866(0.02%)#822 |
| 30. | Queen Creek | 10,180 | 2,297,513(0.44%)#30 | 61,755,866(0.02%)#898 |
| 31. | Bullhead City | 10,154 | 2,297,513(0.44%)#31 | 61,755,866(0.02%)#900 |
| 32. | Valencia West | 9,614 | 2,297,513(0.42%)#32 | 61,755,866(0.02%)#953 |
| 33. | Prescott Valley | 9,426 | 2,297,513(0.41%)#33 | 61,755,866(0.02%)#968 |
| 34. | Florence | 8,983 | 2,297,513(0.39%)#34 | 61,755,866(0.01%)#1,006 |
| 35. | Lake Havasu City | 8,972 | 2,297,513(0.39%)#35 | 61,755,866(0.01%)#1,008 |
| 36. | Flowing Wells | 8,419 | 2,297,513(0.37%)#36 | 61,755,866(0.01%)#1,065 |
| 37. | Eloy | 7,982 | 2,297,513(0.35%)#37 | 61,755,866(0.01%)#1,111 |
| 38. | Coolidge | 7,621 | 2,297,513(0.33%)#38 | 61,755,866(0.01%)#1,153 |
| 39. | Fortuna Foothills | 7,458 | 2,297,513(0.32%)#39 | 61,755,866(0.01%)#1,168 |
| 40. | Apache Junction | 6,976 | 2,297,513(0.30%)#40 | 61,755,866(0.01%)#1,220 |
| 41. | Oro Valley | 6,793 | 2,297,513(0.30%)#41 | 61,755,866(0.01%)#1,247 |
| 42. | Catalina Foothills | 6,148 | 2,297,513(0.27%)#42 | 61,755,866(0.01%)#1,343 |
| 43. | Tolleson | 5,857 | 2,297,513(0.25%)#43 | 61,755,866(0.01%)#1,394 |
| 44. | Kingman | 5,492 | 2,297,513(0.24%)#44 | 61,755,866(0.01%)#1,462 |
| 45. | Tucson Estates | 5,444 | 2,297,513(0.24%)#45 | 61,755,866(0.01%)#1,469 |
| 46. | Safford | 5,182 | 2,297,513(0.23%)#46 | 61,755,866(0.01%)#1,525 |
| 47. | Summit | 4,445 | 2,297,513(0.19%)#47 | 61,755,866(0.01%)#1,713 |
| 48. | Guadalupe | 4,043 | 2,297,513(0.18%)#48 | 61,755,866(0.01%)#1,851 |
| 49. | Prescott | 3,987 | 2,297,513(0.17%)#49 | 61,755,866(0.01%)#1,875 |
| 50. | Sierra Vista Southeast | 3,722 | 2,297,513(0.16%)#50 | 61,755,866(0.01%)#1,972 |
| 51. | Vail | 3,447 | 2,297,513(0.15%)#51 | 61,755,866(0.01%)#2,082 |
| 52. | Winslow | 3,385 | 2,297,513(0.15%)#52 | 61,755,866(0.01%)#2,109 |
| 53. | South Tucson | 3,336 | 2,297,513(0.15%)#53 | 61,755,866(0.01%)#2,135 |
| 54. | Globe | 3,327 | 2,297,513(0.14%)#54 | 61,755,866(0.01%)#2,137 |
| 55. | Arizona City | 3,177 | 2,297,513(0.14%)#55 | 61,755,866(0.01%)#2,218 |
| 56. | Avenue B And C | 3,006 | 2,297,513(0.13%)#56 | 61,755,866(0.00%)#2,287 |
| 57. | Youngtown | 2,945 | 2,297,513(0.13%)#57 | 61,755,866(0.00%)#2,329 |
| 58. | Camp Verde | 2,770 | 2,297,513(0.12%)#58 | 61,755,866(0.00%)#2,427 |
| 59. | Tucson Mountains | 2,681 | 2,297,513(0.12%)#59 | 61,755,866(0.00%)#2,483 |
| 60. | Fort Mohave | 2,679 | 2,297,513(0.12%)#60 | 61,755,866(0.00%)#2,488 |
| 61. | Picture Rocks | 2,432 | 2,297,513(0.11%)#61 | 61,755,866(0.00%)#2,651 |
| 62. | Clifton | 2,280 | 2,297,513(0.10%)#62 | 61,755,866(0.00%)#2,756 |
| 63. | Cottonwood | 2,275 | 2,297,513(0.10%)#63 | 61,755,866(0.00%)#2,762 |
| 64. | Anthem | 2,253 | 2,297,513(0.10%)#64 | 61,755,866(0.00%)#2,780 |
| 65. | New Kingman Butler | 2,216 | 2,297,513(0.10%)#65 | 61,755,866(0.00%)#2,814 |
| 66. | Verde Village | 2,169 | 2,297,513(0.09%)#66 | 61,755,866(0.00%)#2,855 |
| 67. | Show Low | 2,138 | 2,297,513(0.09%)#67 | 61,755,866(0.00%)#2,893 |
| 68. | Chino Valley | 2,131 | 2,297,513(0.09%)#68 | 61,755,866(0.00%)#2,899 |
| 69. | Payson | 2,122 | 2,297,513(0.09%)#69 | 61,755,866(0.00%)#2,913 |
| 70. | Sun City | 2,063 | 2,297,513(0.09%)#70 | 61,755,866(0.00%)#2,967 |
| 71. | Corona De Tucson | 1,943 | 2,297,513(0.08%)#71 | 61,755,866(0.00%)#3,104 |
| 72. | Willcox | 1,928 | 2,297,513(0.08%)#72 | 61,755,866(0.00%)#3,127 |
| 73. | San Manuel | 1,884 | 2,297,513(0.08%)#73 | 61,755,866(0.00%)#3,168 |
| 74. | Sedona | 1,875 | 2,297,513(0.08%)#74 | 61,755,866(0.00%)#3,176 |
| 75. | Three Points | 1,718 | 2,297,513(0.07%)#75 | 61,755,866(0.00%)#3,344 |
| 76. | Parker | 1,701 | 2,297,513(0.07%)#76 | 61,755,866(0.00%)#3,365 |
| 77. | Holbrook | 1,669 | 2,297,513(0.07%)#77 | 61,755,866(0.00%)#3,396 |
| 78. | Litchfield Park | 1,615 | 2,297,513(0.07%)#78 | 61,755,866(0.00%)#3,473 |
| 79. | Superior | 1,584 | 2,297,513(0.07%)#79 | 61,755,866(0.00%)#3,508 |
| 80. | New River | 1,563 | 2,297,513(0.07%)#80 | 61,755,866(0.00%)#3,534 |
| 81. | Tanque Verde | 1,531 | 2,297,513(0.07%)#81 | 61,755,866(0.00%)#3,583 |
| 82. | Pirtleville | 1,483 | 2,297,513(0.06%)#82 | 61,755,866(0.00%)#3,658 |
| 83. | Catalina | 1,482 | 2,297,513(0.06%)#83 | 61,755,866(0.00%)#3,660 |
| 84. | Bagdad | 1,465 | 2,297,513(0.06%)#84 | 61,755,866(0.00%)#3,678 |
| 85. | Williams | 1,458 | 2,297,513(0.06%)#85 | 61,755,866(0.00%)#3,693 |
| 86. | Paradise Valley | 1,417 | 2,297,513(0.06%)#86 | 61,755,866(0.00%)#3,756 |
| 87. | Cordes Lakes | 1,414 | 2,297,513(0.06%)#87 | 61,755,866(0.00%)#3,768 |
| 88. | Bisbee | 1,356 | 2,297,513(0.06%)#88 | 61,755,866(0.00%)#3,866 |
| 89. | Rincon Valley | 1,248 | 2,297,513(0.05%)#89 | 61,755,866(0.00%)#4,055 |
| 90. | Gila Bend | 1,173 | 2,297,513(0.05%)#90 | 61,755,866(0.00%)#4,222 |
| 91. | Benson | 1,159 | 2,297,513(0.05%)#91 | 61,755,866(0.00%)#4,243 |
| 92. | Beaver Dam | 1,151 | 2,297,513(0.05%)#92 | 61,755,866(0.00%)#4,253 |
| 93. | Green Valley | 1,127 | 2,297,513(0.05%)#93 | 61,755,866(0.00%)#4,298 |
| 94. | Citrus Park | 1,102 | 2,297,513(0.05%)#94 | 61,755,866(0.00%)#4,354 |
| 95. | Naco | 1,102 | 2,297,513(0.05%)#95 | 61,755,866(0.00%)#4,355 |
| 96. | Paulden | 1,080 | 2,297,513(0.05%)#96 | 61,755,866(0.00%)#4,415 |
| 97. | Avra Valley | 1,075 | 2,297,513(0.05%)#97 | 61,755,866(0.00%)#4,425 |
| 98. | Kearny | 1,062 | 2,297,513(0.05%)#98 | 61,755,866(0.00%)#4,462 |
| 99. | Swift Trail Junction | 1,042 | 2,297,513(0.05%)#99 | 61,755,866(0.00%)#4,514 |
| 100. | Saddlebrooke | 1,015 | 2,297,513(0.04%)#100 | 61,755,866(0.00%)#4,574 |
Common Questions
What are the Top 10 Cities with the Largest Hispanic or Latino Community in Arizona?
Top 10 Cities with the Largest Hispanic or Latino Community in Arizona are:
What city has the Largest Hispanic or Latino Community in Arizona?
Phoenix has the Largest Hispanic or Latino Community in Arizona with 691,205.
What is the Total Hispanic or Latino Population in the State of Arizona?
Total Hispanic or Latino Population in Arizona is 2,297,513.
What is the Total Hispanic or Latino Population in the United States?
Total Hispanic or Latino Population in the United States is 61,755,866.