Cities with the Most Births per 1,000 Women Over the Age of 35 in Arizona
RELATED REPORTS & OPTIONS
Highest Birth Rate | Women 35+
Arizona
Compare Cities
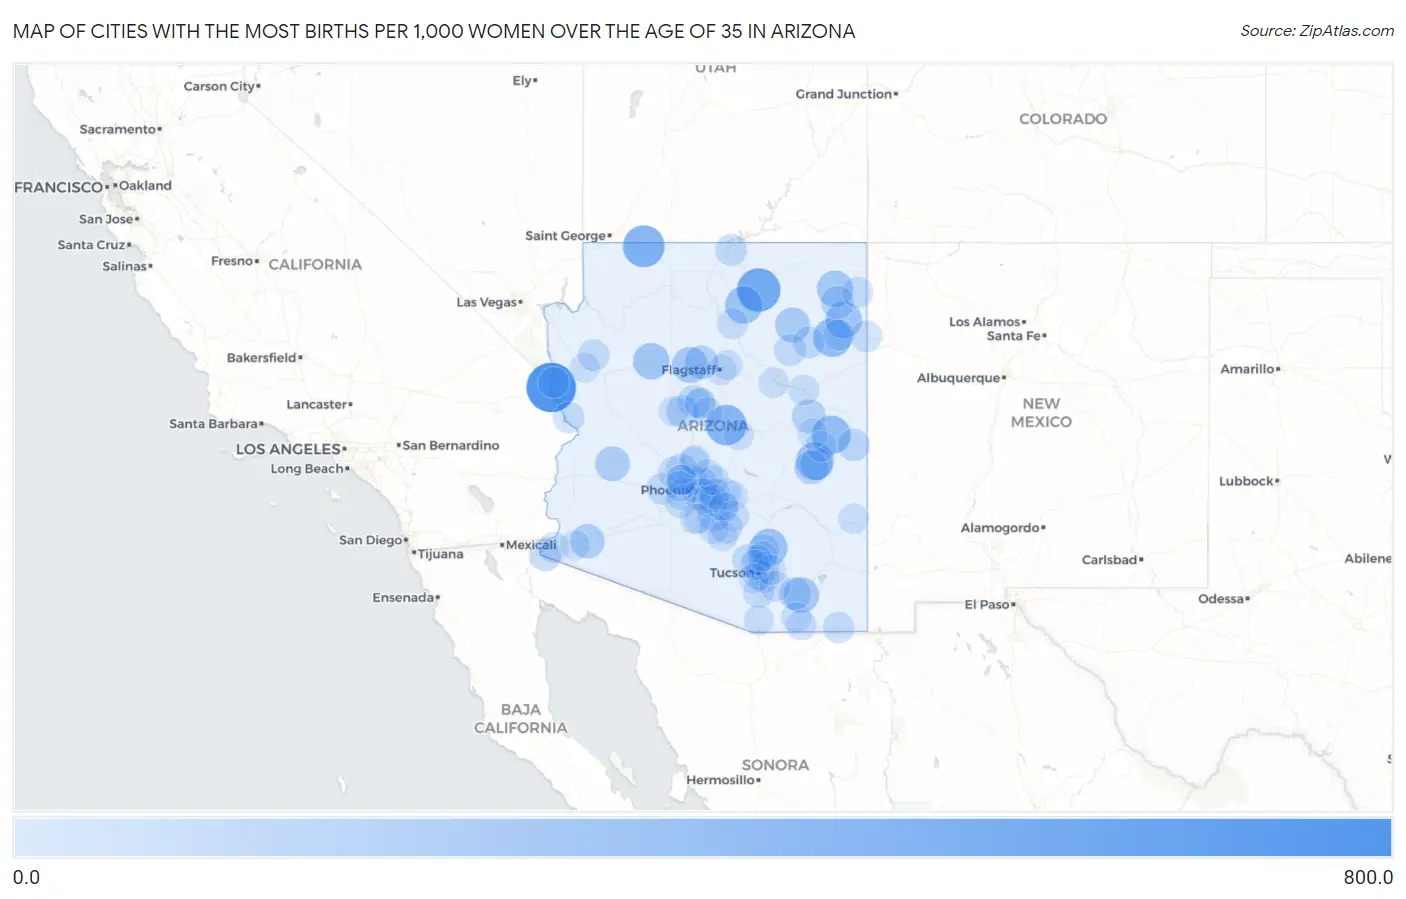
Map of Cities with the Most Births per 1,000 Women Over the Age of 35 in Arizona
0.0
800.0
Cities with the Most Births per 1,000 Women Over the Age of 35 in Arizona
| City | Births / 1,000 Women | vs State | vs National | |
| 1. | Willow Valley | 659.0 | 33.0(+626)#1 | 32.0(+627)#83 |
| 2. | Tonalea | 450.0 | 33.0(+417)#2 | 32.0(+418)#172 |
| 3. | Centennial Park | 394.0 | 33.0(+361)#3 | 32.0(+362)#216 |
| 4. | Strawberry | 355.0 | 33.0(+322)#4 | 32.0(+323)#258 |
| 5. | Cornfields | 292.0 | 33.0(+259)#5 | 32.0(+260)#356 |
| 6. | Vernon | 289.0 | 33.0(+256)#6 | 32.0(+257)#364 |
| 7. | Yuma Proving Ground | 284.0 | 33.0(+251)#7 | 32.0(+252)#376 |
| 8. | Rainbow City | 268.0 | 33.0(+235)#8 | 32.0(+236)#413 |
| 9. | Moenkopi | 250.0 | 33.0(+217)#9 | 32.0(+218)#462 |
| 10. | Oracle | 247.0 | 33.0(+214)#10 | 32.0(+215)#493 |
| 11. | Nazlini | 224.0 | 33.0(+191)#11 | 32.0(+192)#568 |
| 12. | Seligman | 214.0 | 33.0(+181)#12 | 32.0(+182)#616 |
| 13. | Many Farms | 210.0 | 33.0(+177)#13 | 32.0(+178)#646 |
| 14. | Williams | 202.0 | 33.0(+169)#14 | 32.0(+170)#680 |
| 15. | St David | 191.0 | 33.0(+158)#15 | 32.0(+159)#756 |
| 16. | First Mesa | 167.0 | 33.0(+134)#16 | 32.0(+135)#902 |
| 17. | Wenden | 162.0 | 33.0(+129)#17 | 32.0(+130)#953 |
| 18. | Tacna | 148.0 | 33.0(+115)#18 | 32.0(+116)#1,099 |
| 19. | Parks | 133.0 | 33.0(+100.0)#19 | 32.0(+101)#1,281 |
| 20. | Snowflake | 130.0 | 33.0(+97.0)#20 | 32.0(+98.0)#1,331 |
| 21. | Canyon Day | 117.0 | 33.0(+84.0)#21 | 32.0(+85.0)#1,555 |
| 22. | Chinle | 105.0 | 33.0(+72.0)#22 | 32.0(+73.0)#1,823 |
| 23. | Whiteriver | 94.0 | 33.0(+61.0)#23 | 32.0(+62.0)#2,112 |
| 24. | Paradise Valley | 93.0 | 33.0(+60.0)#24 | 32.0(+61.0)#2,131 |
| 25. | Benson | 89.0 | 33.0(+56.0)#25 | 32.0(+57.0)#2,248 |
| 26. | Jerome | 88.0 | 33.0(+55.0)#26 | 32.0(+56.0)#2,305 |
| 27. | Circle | 83.0 | 33.0(+50.0)#27 | 32.0(+51.0)#2,453 |
| 28. | Prescott Valley | 81.0 | 33.0(+48.0)#28 | 32.0(+49.0)#2,516 |
| 29. | Guadalupe | 81.0 | 33.0(+48.0)#29 | 32.0(+49.0)#2,530 |
| 30. | Eagar | 80.0 | 33.0(+47.0)#30 | 32.0(+48.0)#2,557 |
| 31. | San Luis | 78.0 | 33.0(+45.0)#31 | 32.0(+46.0)#2,613 |
| 32. | Sacaton | 78.0 | 33.0(+45.0)#32 | 32.0(+46.0)#2,635 |
| 33. | Coolidge | 72.0 | 33.0(+39.0)#33 | 32.0(+40.0)#2,901 |
| 34. | Tees Toh | 68.0 | 33.0(+35.0)#34 | 32.0(+36.0)#3,136 |
| 35. | Whitecone | 67.0 | 33.0(+34.0)#35 | 32.0(+35.0)#3,182 |
| 36. | Lechee | 65.0 | 33.0(+32.0)#36 | 32.0(+33.0)#3,294 |
| 37. | Buckeye | 64.0 | 33.0(+31.0)#37 | 32.0(+32.0)#3,317 |
| 38. | Saddlebrooke | 64.0 | 33.0(+31.0)#38 | 32.0(+32.0)#3,333 |
| 39. | Valle Vista | 57.0 | 33.0(+24.0)#39 | 32.0(+25.0)#3,827 |
| 40. | Surprise | 54.0 | 33.0(+21.0)#40 | 32.0(+22.0)#4,017 |
| 41. | Window Rock | 52.0 | 33.0(+19.0)#41 | 32.0(+20.0)#4,295 |
| 42. | Lake Havasu City | 51.0 | 33.0(+18.0)#42 | 32.0(+19.0)#4,316 |
| 43. | Douglas | 49.0 | 33.0(+16.0)#43 | 32.0(+17.0)#4,529 |
| 44. | Ganado | 48.0 | 33.0(+15.0)#44 | 32.0(+16.0)#4,700 |
| 45. | Scottsdale | 45.0 | 33.0(+12.0)#45 | 32.0(+13.0)#4,913 |
| 46. | Catalina Foothills | 43.0 | 33.0(+10.00)#46 | 32.0(+11.0)#5,157 |
| 47. | Tsaile | 43.0 | 33.0(+10.00)#47 | 32.0(+11.0)#5,242 |
| 48. | Goodyear | 42.0 | 33.0(+9.00)#48 | 32.0(+10.00)#5,283 |
| 49. | Queen Creek | 41.0 | 33.0(+8.00)#49 | 32.0(+9.00)#5,399 |
| 50. | Marana | 39.0 | 33.0(+6.00)#50 | 32.0(+7.00)#5,682 |
| 51. | Tempe | 38.0 | 33.0(+5.00)#51 | 32.0(+6.00)#5,801 |
| 52. | Fort Mohave | 38.0 | 33.0(+5.00)#52 | 32.0(+6.00)#5,853 |
| 53. | Holbrook | 37.0 | 33.0(+4.00)#53 | 32.0(+5.00)#6,080 |
| 54. | Yuma | 36.0 | 33.0(+3.00)#54 | 32.0(+4.00)#6,151 |
| 55. | Avondale | 36.0 | 33.0(+3.00)#55 | 32.0(+4.00)#6,153 |
| 56. | Sahuarita | 36.0 | 33.0(+3.00)#56 | 32.0(+4.00)#6,172 |
| 57. | Phoenix | 35.0 | 33.0(+2.00)#57 | 32.0(+3.00)#6,314 |
| 58. | Verde Village | 35.0 | 33.0(+2.00)#58 | 32.0(+3.00)#6,370 |
| 59. | Cameron | 35.0 | 33.0(+2.00)#59 | 32.0(+3.00)#6,437 |
| 60. | Gold Canyon | 34.0 | 33.0(+1.000)#60 | 32.0(+2.00)#6,528 |
| 61. | Apache Junction | 33.0 | 33.0(=0.000)#61 | 32.0(+1.000)#6,643 |
| 62. | Mcnary | 33.0 | 33.0(=0.000)#62 | 32.0(+1.000)#6,783 |
| 63. | Tucson | 32.0 | 33.0(-1.000)#63 | 32.0(=0.000)#6,805 |
| 64. | Glendale | 32.0 | 33.0(-1.000)#64 | 32.0(=0.000)#6,808 |
| 65. | Mesa | 31.0 | 33.0(-2.00)#65 | 32.0(-1.000)#6,966 |
| 66. | Peoria | 31.0 | 33.0(-2.00)#66 | 32.0(-1.000)#6,974 |
| 67. | Anthem | 31.0 | 33.0(-2.00)#67 | 32.0(-1.000)#7,026 |
| 68. | South Tucson | 31.0 | 33.0(-2.00)#68 | 32.0(-1.000)#7,072 |
| 69. | Winslow | 29.0 | 33.0(-4.00)#69 | 32.0(-3.00)#7,415 |
| 70. | Litchfield Park | 29.0 | 33.0(-4.00)#70 | 32.0(-3.00)#7,426 |
| 71. | Ak Chin Village | 29.0 | 33.0(-4.00)#71 | 32.0(-3.00)#7,484 |
| 72. | Chandler | 28.0 | 33.0(-5.00)#72 | 32.0(-4.00)#7,523 |
| 73. | Gilbert | 26.0 | 33.0(-7.00)#73 | 32.0(-6.00)#7,879 |
| 74. | Vail | 26.0 | 33.0(-7.00)#74 | 32.0(-6.00)#7,935 |
| 75. | Prescott | 25.0 | 33.0(-8.00)#75 | 32.0(-7.00)#8,081 |
| 76. | Florence | 25.0 | 33.0(-8.00)#76 | 32.0(-7.00)#8,099 |
| 77. | Sierra Vista | 23.0 | 33.0(-10.00)#77 | 32.0(-9.00)#8,429 |
| 78. | El Mirage | 23.0 | 33.0(-10.00)#78 | 32.0(-9.00)#8,435 |
| 79. | Sierra Vista Southeast | 23.0 | 33.0(-10.00)#79 | 32.0(-9.00)#8,470 |
| 80. | Tanque Verde | 22.0 | 33.0(-11.0)#80 | 32.0(-10.00)#8,658 |
| 81. | Casa Grande | 21.0 | 33.0(-12.0)#81 | 32.0(-11.0)#8,787 |
| 82. | Cottonwood | 21.0 | 33.0(-12.0)#82 | 32.0(-11.0)#8,845 |
| 83. | Camp Verde | 21.0 | 33.0(-12.0)#83 | 32.0(-11.0)#8,847 |
| 84. | Flagstaff | 20.0 | 33.0(-13.0)#84 | 32.0(-12.0)#8,951 |
| 85. | Clifton | 19.0 | 33.0(-14.0)#85 | 32.0(-13.0)#9,214 |
| 86. | Oro Valley | 18.0 | 33.0(-15.0)#86 | 32.0(-14.0)#9,297 |
| 87. | Fountain Hills | 18.0 | 33.0(-15.0)#87 | 32.0(-14.0)#9,313 |
| 88. | Payson | 18.0 | 33.0(-15.0)#88 | 32.0(-14.0)#9,330 |
| 89. | Rio Rico | 17.0 | 33.0(-16.0)#89 | 32.0(-15.0)#9,491 |
| 90. | San Tan Valley | 16.0 | 33.0(-17.0)#90 | 32.0(-16.0)#9,622 |
| 91. | Doney Park | 16.0 | 33.0(-17.0)#91 | 32.0(-16.0)#9,714 |
| 92. | New River | 14.0 | 33.0(-19.0)#92 | 32.0(-18.0)#9,935 |
| 93. | Casas Adobes | 13.0 | 33.0(-20.0)#93 | 32.0(-19.0)#10,041 |
| 94. | Drexel Heights | 13.0 | 33.0(-20.0)#94 | 32.0(-19.0)#10,055 |
| 95. | Eloy | 13.0 | 33.0(-20.0)#95 | 32.0(-19.0)#10,081 |
| 96. | Maricopa | 12.0 | 33.0(-21.0)#96 | 32.0(-20.0)#10,172 |
| 97. | Kingman | 11.0 | 33.0(-22.0)#97 | 32.0(-21.0)#10,299 |
| 98. | Show Low | 11.0 | 33.0(-22.0)#98 | 32.0(-21.0)#10,338 |
| 99. | Wellton | 11.0 | 33.0(-22.0)#99 | 32.0(-21.0)#10,397 |
| 100. | Catalina | 10.0 | 33.0(-23.0)#100 | 32.0(-22.0)#10,522 |
Common Questions
What are the Top 10 Cities with the Most Births per 1,000 Women Over the Age of 35 in Arizona?
Top 10 Cities with the Most Births per 1,000 Women Over the Age of 35 in Arizona are:
#1
659.0
#2
450.0
#3
394.0
#4
355.0
#5
292.0
#6
289.0
#7
268.0
#8
250.0
#9
247.0
#10
224.0
What city has the Most Births per 1,000 Women Over the Age of 35 in Arizona?
Willow Valley has the Most Births per 1,000 Women Over the Age of 35 in Arizona with 659.0.
What is the Number of Births per 1,000 Women Over the Age of 35 in the State of Arizona?
Number of Births per 1,000 Women Over the Age of 35 in Arizona is 33.0.
What is the Number of Births per 1,000 Women Over the Age of 35 in the United States?
Number of Births per 1,000 Women Over the Age of 35 in the United States is 32.0.