Zip Codes with the Highest Percentage of Population Employed in Architecture & Engineering in Yuma, AZ
RELATED REPORTS & OPTIONS
Architecture & Engineering
Yuma
Compare Zip Codes
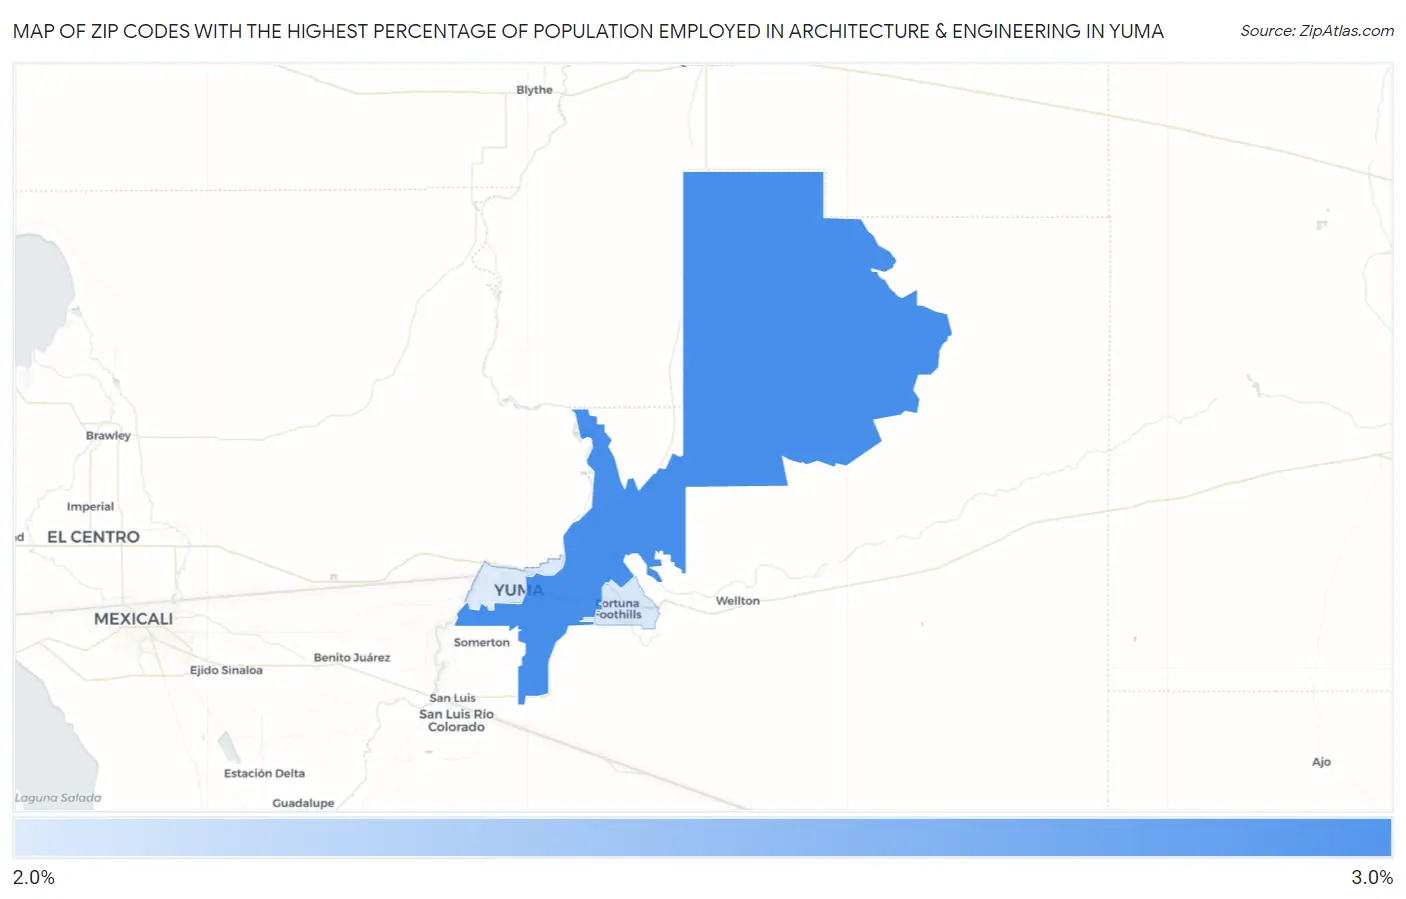
Map of Zip Codes with the Highest Percentage of Population Employed in Architecture & Engineering in Yuma
0.0%
3.0%
Zip Codes with the Highest Percentage of Population Employed in Architecture & Engineering in Yuma, AZ
| Zip Code | % Employed | vs State | vs National | |
| 1. | 85365 | 2.6% | 2.4%(+0.258)#92 | 2.1%(+0.500)#6,369 |
| 2. | 85367 | 2.1% | 2.4%(-0.329)#134 | 2.1%(-0.087)#9,242 |
| 3. | 85364 | 2.0% | 2.4%(-0.349)#139 | 2.1%(-0.107)#9,355 |
1
Common Questions
What are the Top Zip Codes with the Highest Percentage of Population Employed in Architecture & Engineering in Yuma, AZ?
Top Zip Codes with the Highest Percentage of Population Employed in Architecture & Engineering in Yuma, AZ are:
What zip code has the Highest Percentage of Population Employed in Architecture & Engineering in Yuma, AZ?
85365 has the Highest Percentage of Population Employed in Architecture & Engineering in Yuma, AZ with 2.6%.
What is the Percentage of Population Employed in Architecture & Engineering in Yuma, AZ?
Percentage of Population Employed in Architecture & Engineering in Yuma is 2.2%.
What is the Percentage of Population Employed in Architecture & Engineering in Arizona?
Percentage of Population Employed in Architecture & Engineering in Arizona is 2.4%.
What is the Percentage of Population Employed in Architecture & Engineering in the United States?
Percentage of Population Employed in Architecture & Engineering in the United States is 2.1%.