Zip Codes with the Highest Percentage of Population Employed in Life, Physical & Social Science in Snohomish, WA
RELATED REPORTS & OPTIONS
Life, Physical & Social Science
Snohomish
Compare Zip Codes
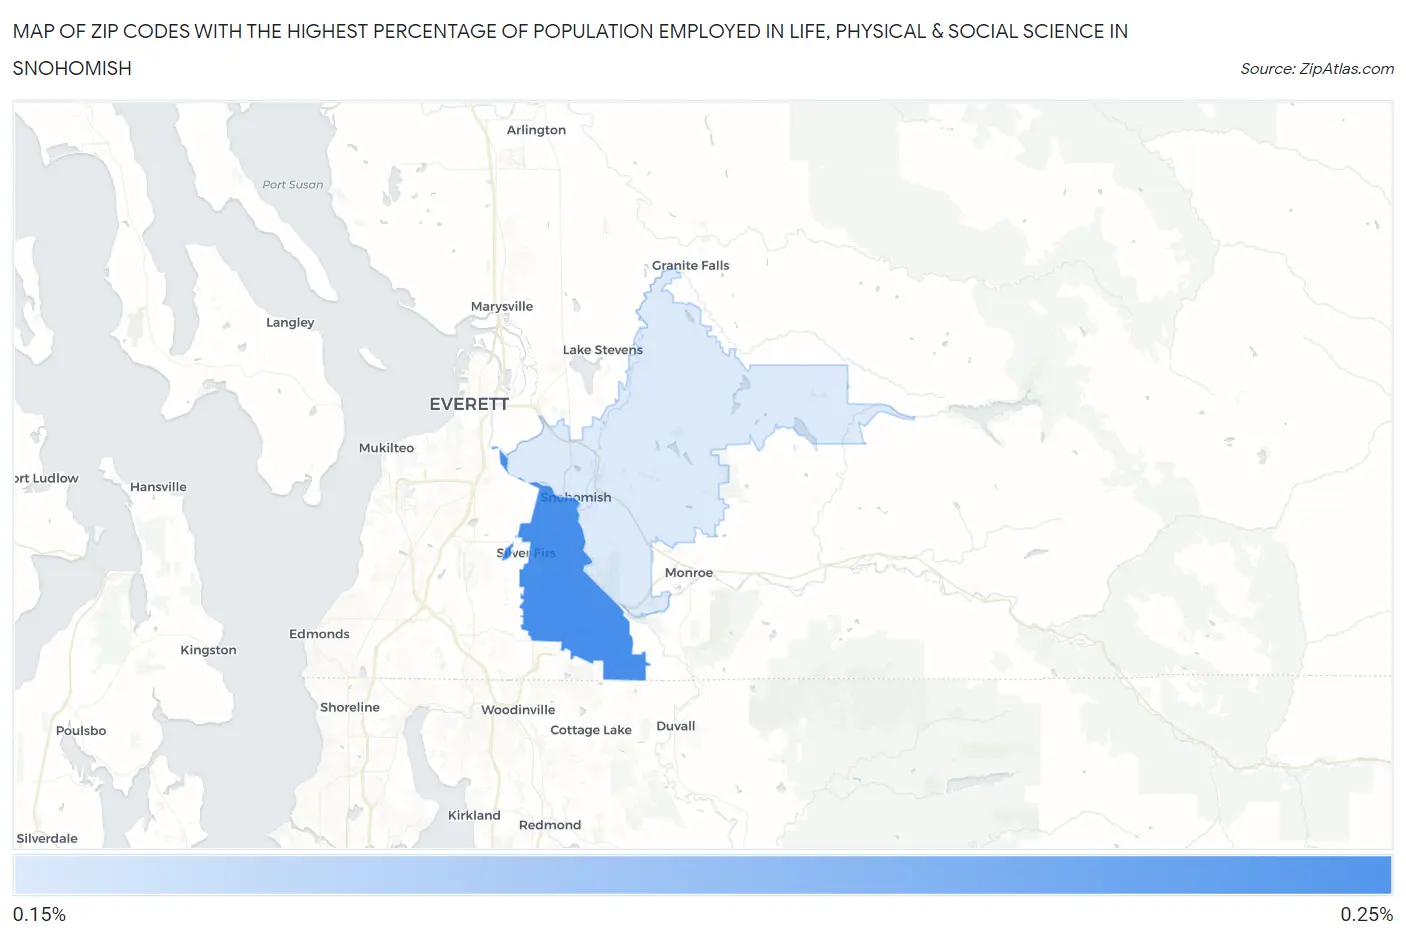
Map of Zip Codes with the Highest Percentage of Population Employed in Life, Physical & Social Science in Snohomish
0.0%
0.25%
Zip Codes with the Highest Percentage of Population Employed in Life, Physical & Social Science in Snohomish, WA
| Zip Code | % Employed | vs State | vs National | |
| 1. | 98296 | 0.22% | 1.3%(-1.09)#382 | 1.1%(-0.871)#17,977 |
| 2. | 98290 | 0.18% | 1.3%(-1.13)#384 | 1.1%(-0.909)#18,380 |
1
Common Questions
What are the Top Zip Codes with the Highest Percentage of Population Employed in Life, Physical & Social Science in Snohomish, WA?
Top Zip Codes with the Highest Percentage of Population Employed in Life, Physical & Social Science in Snohomish, WA are:
What zip code has the Highest Percentage of Population Employed in Life, Physical & Social Science in Snohomish, WA?
98296 has the Highest Percentage of Population Employed in Life, Physical & Social Science in Snohomish, WA with 0.22%.
What is the Percentage of Population Employed in Life, Physical & Social Science in Snohomish, WA?
Percentage of Population Employed in Life, Physical & Social Science in Snohomish is 0.15%.
What is the Percentage of Population Employed in Life, Physical & Social Science in Washington?
Percentage of Population Employed in Life, Physical & Social Science in Washington is 1.3%.
What is the Percentage of Population Employed in Life, Physical & Social Science in the United States?
Percentage of Population Employed in Life, Physical & Social Science in the United States is 1.1%.