Kingston, WA
Kingston Map
Kingston Overview
2,999
TOTAL POPULATION
1,171
MALE POPULATION
1,828
FEMALE POPULATION
64.06
MALES / 100 FEMALES
156.11
FEMALES / 100 MALES
43.3
MEDIAN AGE
3.1
AVG FAMILY SIZE
2.7
AVG HOUSEHOLD SIZE
$42,308
PER CAPITA INCOME
$98,077
AVG FAMILY INCOME
$96,645
AVG HOUSEHOLD INCOME
55.9%
WAGE / INCOME GAP [ % ]
44.1¢/ $1
WAGE / INCOME GAP [ $ ]
0.38
INEQUALITY / GINI INDEX
1,647
LABOR FORCE [ PEOPLE ]
64.2%
PERCENT IN LABOR FORCE
4.6%
UNEMPLOYMENT RATE
Kingston Zip Codes
Kingston Area Codes
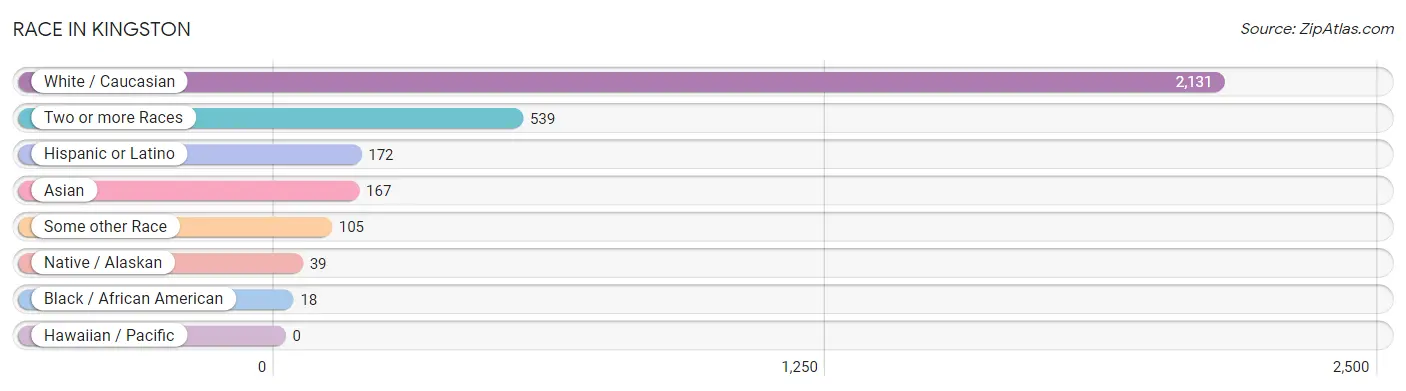
Race in Kingston
The most populous races in Kingston are White / Caucasian (2,131 | 71.1%), Two or more Races (539 | 18.0%), and Hispanic or Latino (172 | 5.7%).
| Race | # Population | % Population |
| Asian | 167 | 5.6% |
| Black / African American | 18 | 0.6% |
| Hawaiian / Pacific | 0 | 0.0% |
| Hispanic or Latino | 172 | 5.7% |
| Native / Alaskan | 39 | 1.3% |
| White / Caucasian | 2,131 | 71.1% |
| Two or more Races | 539 | 18.0% |
| Some other Race | 105 | 3.5% |
| Total | 2,999 | 100.0% |
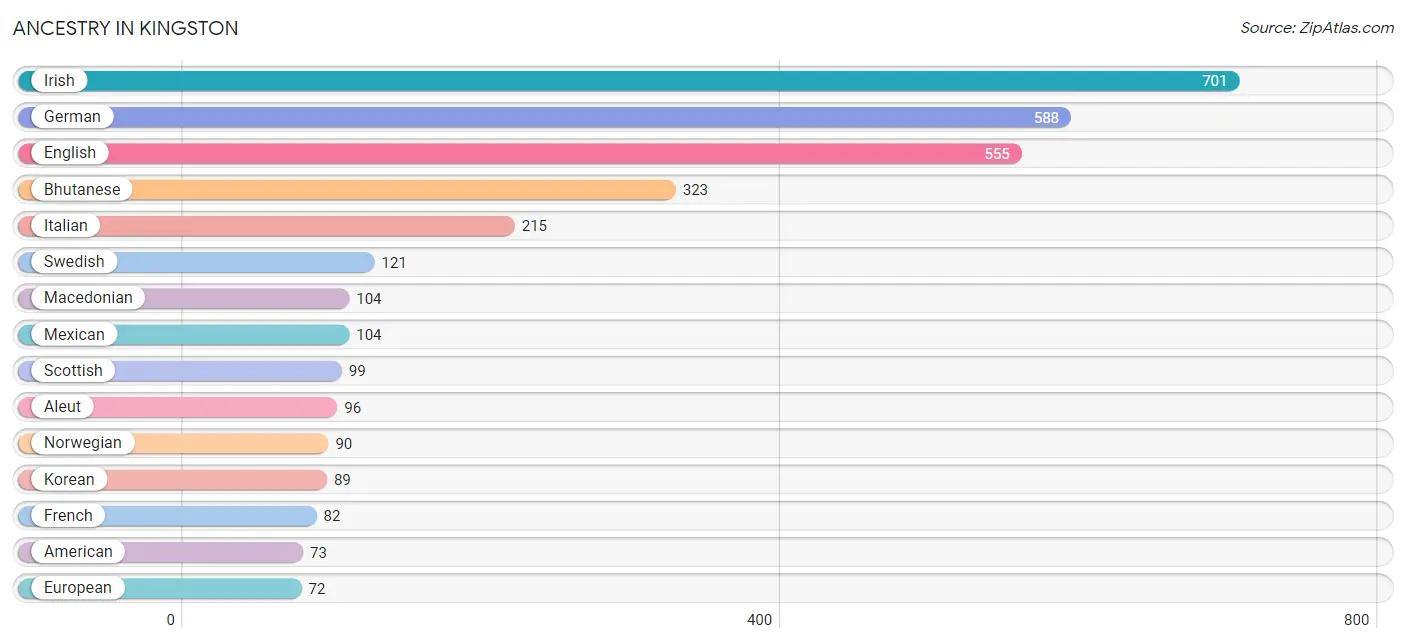
Ancestry in Kingston
The most populous ancestries reported in Kingston are Irish (701 | 23.4%), German (588 | 19.6%), English (555 | 18.5%), Bhutanese (323 | 10.8%), and Italian (215 | 7.2%), together accounting for 79.4% of all Kingston residents.
| Ancestry | # Population | % Population |
| Aleut | 96 | 3.2% |
| American | 73 | 2.4% |
| Apache | 21 | 0.7% |
| Bhutanese | 323 | 10.8% |
| British | 10 | 0.3% |
| Central American | 68 | 2.3% |
| Cherokee | 8 | 0.3% |
| Danish | 13 | 0.4% |
| Dutch | 55 | 1.8% |
| Eastern European | 42 | 1.4% |
| English | 555 | 18.5% |
| European | 72 | 2.4% |
| Finnish | 14 | 0.5% |
| French | 82 | 2.7% |
| French Canadian | 18 | 0.6% |
| German | 588 | 19.6% |
| Greek | 12 | 0.4% |
| Indian (Asian) | 65 | 2.2% |
| Irish | 701 | 23.4% |
| Italian | 215 | 7.2% |
| Korean | 89 | 3.0% |
| Latvian | 30 | 1.0% |
| Macedonian | 104 | 3.5% |
| Mexican | 104 | 3.5% |
| Northern European | 39 | 1.3% |
| Norwegian | 90 | 3.0% |
| Pakistani | 13 | 0.4% |
| Polish | 48 | 1.6% |
| Portuguese | 8 | 0.3% |
| Puget Sound Salish | 16 | 0.5% |
| Russian | 44 | 1.5% |
| Salvadoran | 68 | 2.3% |
| Scandinavian | 30 | 1.0% |
| Scotch-Irish | 20 | 0.7% |
| Scottish | 99 | 3.3% |
| Swedish | 121 | 4.0% |
| Swiss | 25 | 0.8% |
| Welsh | 16 | 0.5% | View All 38 Rows |
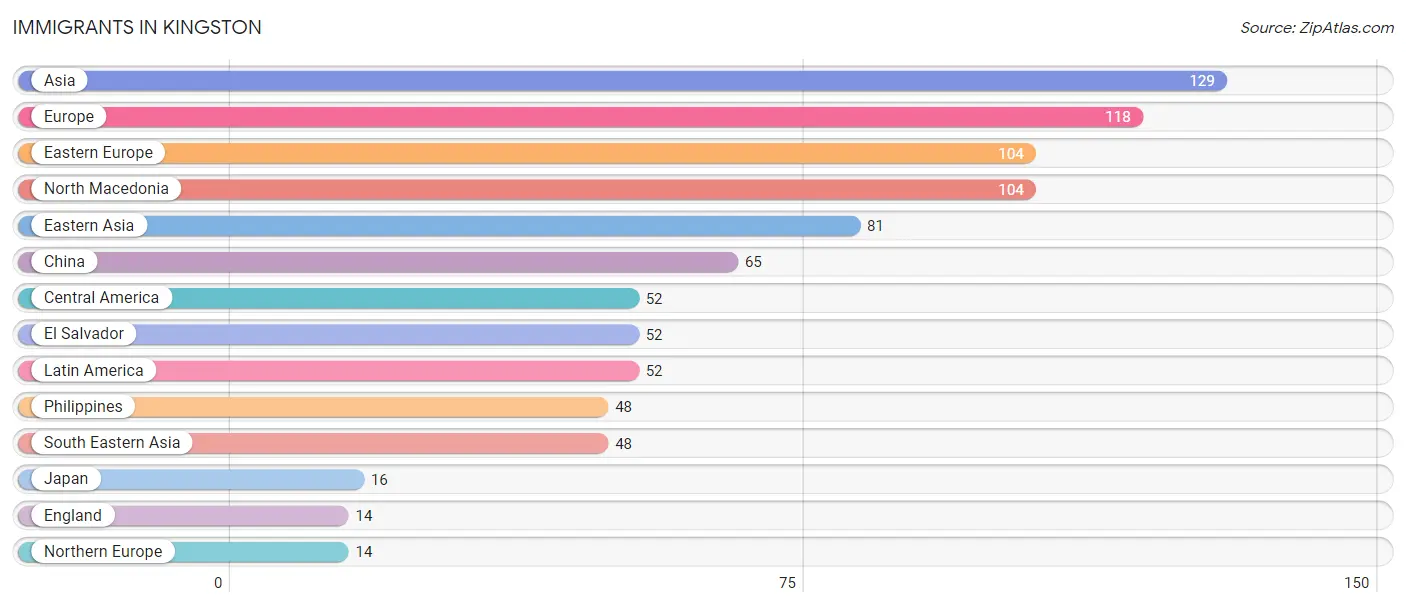
Immigrants in Kingston
The most numerous immigrant groups reported in Kingston came from Asia (129 | 4.3%), Europe (118 | 3.9%), Eastern Europe (104 | 3.5%), North Macedonia (104 | 3.5%), and Eastern Asia (81 | 2.7%), together accounting for 17.9% of all Kingston residents.
| Immigration Origin | # Population | % Population |
| Asia | 129 | 4.3% |
| Central America | 52 | 1.7% |
| China | 65 | 2.2% |
| Eastern Asia | 81 | 2.7% |
| Eastern Europe | 104 | 3.5% |
| El Salvador | 52 | 1.7% |
| England | 14 | 0.5% |
| Europe | 118 | 3.9% |
| Japan | 16 | 0.5% |
| Latin America | 52 | 1.7% |
| North Macedonia | 104 | 3.5% |
| Northern Europe | 14 | 0.5% |
| Philippines | 48 | 1.6% |
| South Eastern Asia | 48 | 1.6% | View All 14 Rows |
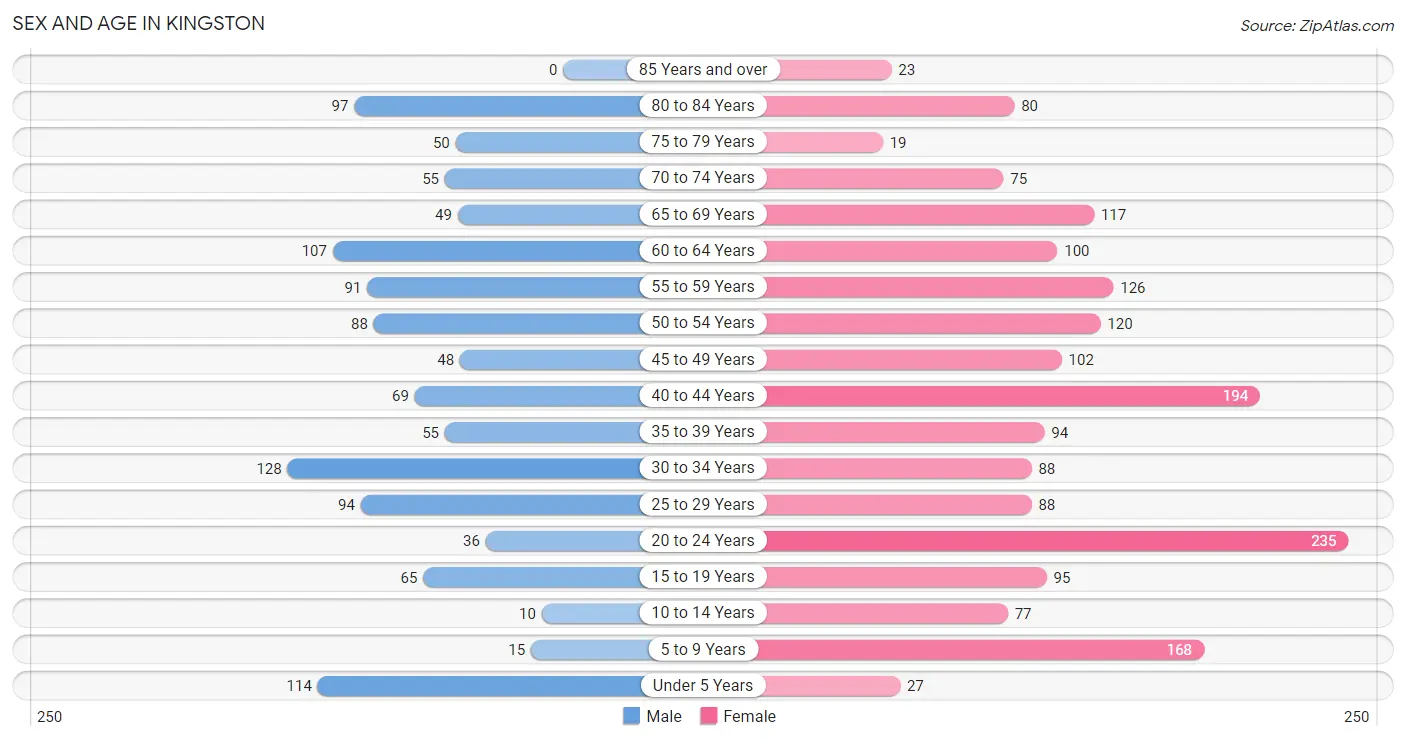
Sex and Age in Kingston
Sex and Age in Kingston
The most populous age groups in Kingston are 30 to 34 Years (128 | 10.9%) for men and 20 to 24 Years (235 | 12.9%) for women.
| Age Bracket | Male | Female |
| Under 5 Years | 114 (9.7%) | 27 (1.5%) |
| 5 to 9 Years | 15 (1.3%) | 168 (9.2%) |
| 10 to 14 Years | 10 (0.9%) | 77 (4.2%) |
| 15 to 19 Years | 65 (5.6%) | 95 (5.2%) |
| 20 to 24 Years | 36 (3.1%) | 235 (12.9%) |
| 25 to 29 Years | 94 (8.0%) | 88 (4.8%) |
| 30 to 34 Years | 128 (10.9%) | 88 (4.8%) |
| 35 to 39 Years | 55 (4.7%) | 94 (5.1%) |
| 40 to 44 Years | 69 (5.9%) | 194 (10.6%) |
| 45 to 49 Years | 48 (4.1%) | 102 (5.6%) |
| 50 to 54 Years | 88 (7.5%) | 120 (6.6%) |
| 55 to 59 Years | 91 (7.8%) | 126 (6.9%) |
| 60 to 64 Years | 107 (9.1%) | 100 (5.5%) |
| 65 to 69 Years | 49 (4.2%) | 117 (6.4%) |
| 70 to 74 Years | 55 (4.7%) | 75 (4.1%) |
| 75 to 79 Years | 50 (4.3%) | 19 (1.0%) |
| 80 to 84 Years | 97 (8.3%) | 80 (4.4%) |
| 85 Years and over | 0 (0.0%) | 23 (1.3%) |
| Total | 1,171 (100.0%) | 1,828 (100.0%) |
Families and Households in Kingston
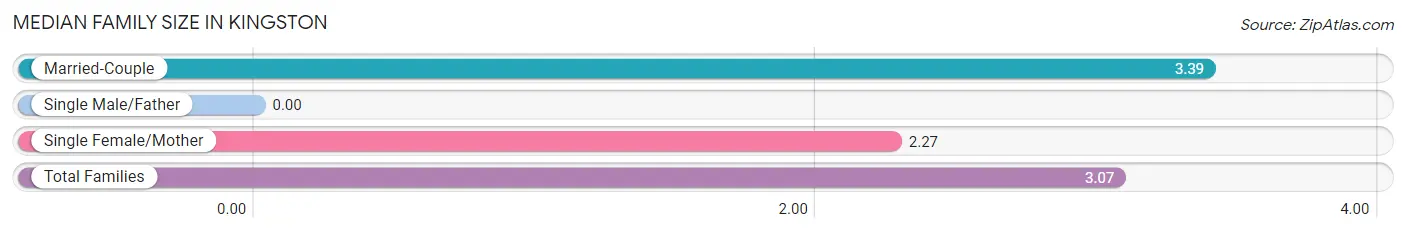
Median Family Size in Kingston
| Family Type | # Families | Family Size |
| Married-Couple | 586 (71.5%) | 3.39 |
| Single Male/Father | 0 (0.0%) | - |
| Single Female/Mother | 234 (28.5%) | 2.27 |
| Total Families | 820 (100.0%) | 3.07 |
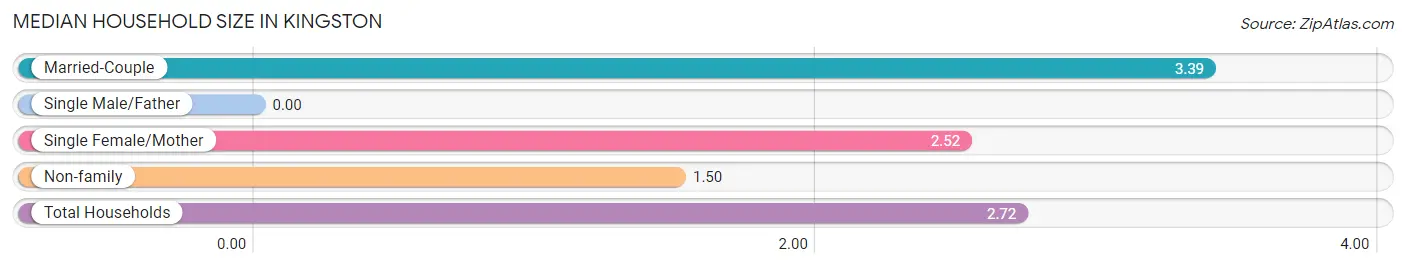
Median Household Size in Kingston
| Household Type | # Households | Household Size |
| Married-Couple | 586 (53.2%) | 3.39 |
| Single Male/Father | 0 (0.0%) | - |
| Single Female/Mother | 234 (21.2%) | 2.52 |
| Non-family | 281 (25.5%) | 1.50 |
| Total Households | 1,101 (100.0%) | 2.72 |
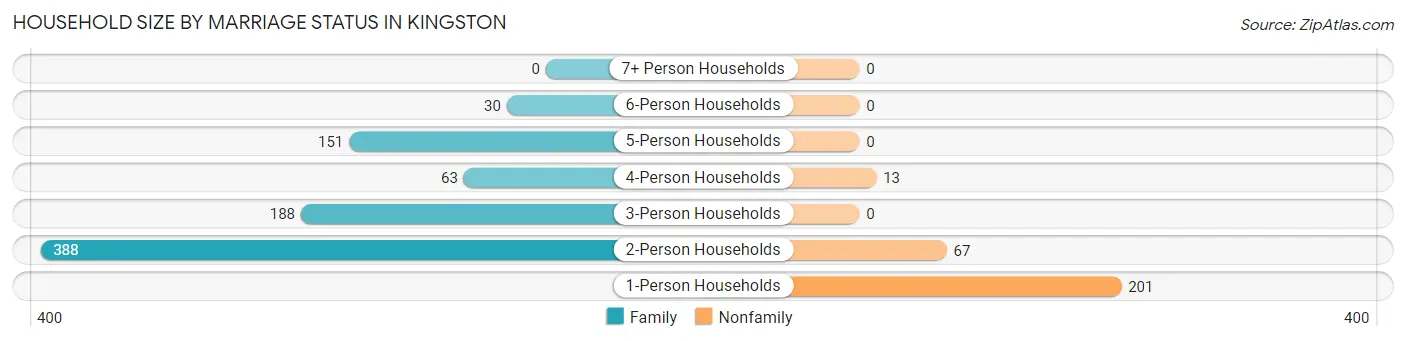
Household Size by Marriage Status in Kingston
Out of a total of 1,101 households in Kingston, 820 (74.5%) are family households, while 281 (25.5%) are nonfamily households. The most numerous type of family households are 2-person households, comprising 388, and the most common type of nonfamily households are 1-person households, comprising 201.
| Household Size | Family Households | Nonfamily Households |
| 1-Person Households | - | 201 (18.3%) |
| 2-Person Households | 388 (35.2%) | 67 (6.1%) |
| 3-Person Households | 188 (17.1%) | 0 (0.0%) |
| 4-Person Households | 63 (5.7%) | 13 (1.2%) |
| 5-Person Households | 151 (13.7%) | 0 (0.0%) |
| 6-Person Households | 30 (2.7%) | 0 (0.0%) |
| 7+ Person Households | 0 (0.0%) | 0 (0.0%) |
| Total | 820 (74.5%) | 281 (25.5%) |
Female Fertility in Kingston
Fertility by Age in Kingston
| Age Bracket | Women with Births | Births / 1,000 Women |
| 15 to 19 years | 0 (0.0%) | 0.0 |
| 20 to 34 years | 0 (0.0%) | 0.0 |
| 35 to 50 years | 0 (0.0%) | 0.0 |
| Total | 0 (0.0%) | 0.0 |
Fertility by Age by Marriage Status in Kingston
| Age Bracket | Married | Unmarried |
| 15 to 19 years | 0 (0.0%) | 0 (0.0%) |
| 20 to 34 years | 0 (0.0%) | 0 (0.0%) |
| 35 to 50 years | 0 (0.0%) | 0 (0.0%) |
| Total | 0 (0.0%) | 0 (0.0%) |
Fertility by Education in Kingston
| Educational Attainment | Women with Births | Births / 1,000 Women |
| Less than High School | 0 (0.0%) | 0.0 |
| High School Diploma | 0 (0.0%) | 0.0 |
| College or Associate's Degree | 0 (0.0%) | 0.0 |
| Bachelor's Degree | 0 (0.0%) | 0.0 |
| Graduate Degree | 0 (0.0%) | 0.0 |
| Total | 0 (0.0%) | 0.0 |
Fertility by Education by Marriage Status in Kingston
| Educational Attainment | Married | Unmarried |
| Less than High School | 0 (0.0%) | 0 (0.0%) |
| High School Diploma | 0 (0.0%) | 0 (0.0%) |
| College or Associate's Degree | 0 (0.0%) | 0 (0.0%) |
| Bachelor's Degree | 0 (0.0%) | 0 (0.0%) |
| Graduate Degree | 0 (0.0%) | 0 (0.0%) |
| Total | 0 (0.0%) | 0 (0.0%) |
Income in Kingston
Income Overview in Kingston
Per Capita Income in Kingston is $42,308, while median incomes of families and households are $98,077 and $96,645 respectively.
| Characteristic | Number | Measure |
| Per Capita Income | 2,999 | $42,308 |
| Median Family Income | 820 | $98,077 |
| Mean Family Income | 820 | $126,406 |
| Median Household Income | 1,101 | $96,645 |
| Mean Household Income | 1,101 | $111,155 |
| Income Deficit | 820 | $0 |
| Wage / Income Gap (%) | 2,999 | 55.91% |
| Wage / Income Gap ($) | 2,999 | 44.09¢ per $1 |
| Gini / Inequality Index | 2,999 | 0.38 |
Earnings by Sex in Kingston
Average Earnings in Kingston are $46,033, $86,792 for men and $38,269 for women, a difference of 55.9%.
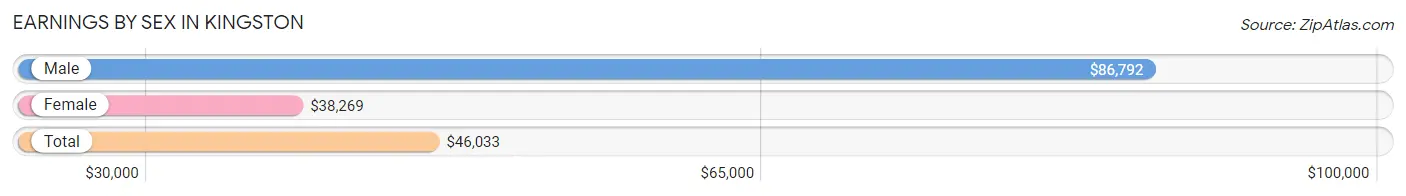
| Sex | Number | Average Earnings |
| Male | 643 (37.8%) | $86,792 |
| Female | 1,058 (62.2%) | $38,269 |
| Total | 1,701 (100.0%) | $46,033 |
Earnings by Sex by Income Bracket in Kingston
The most common earnings brackets in Kingston are $100,000+ for men (226 | 35.1%) and $75,000 to $99,999 for women (137 | 13.0%).
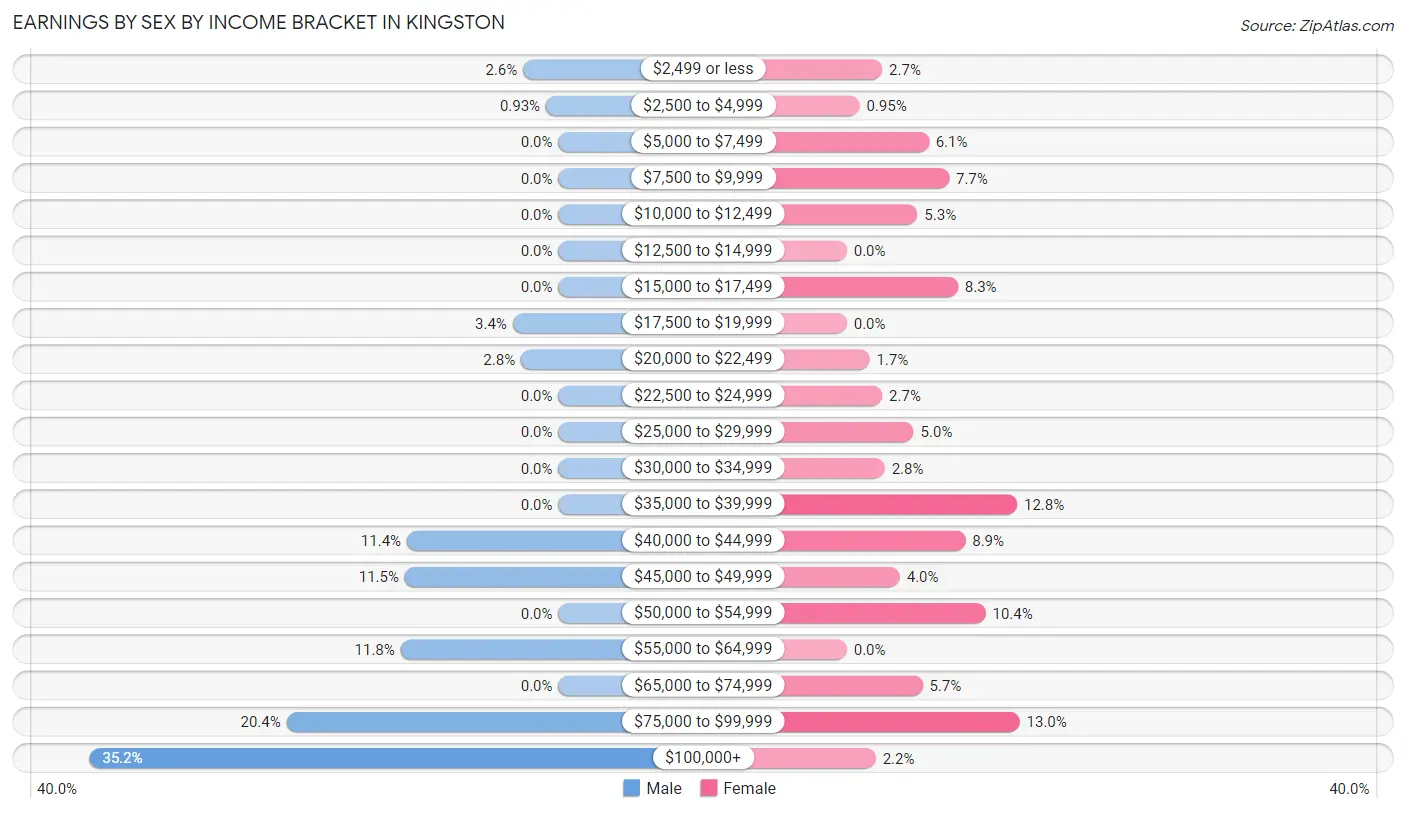
| Income | Male | Female |
| $2,499 or less | 17 (2.6%) | 28 (2.6%) |
| $2,500 to $4,999 | 6 (0.9%) | 10 (0.9%) |
| $5,000 to $7,499 | 0 (0.0%) | 65 (6.1%) |
| $7,500 to $9,999 | 0 (0.0%) | 81 (7.7%) |
| $10,000 to $12,499 | 0 (0.0%) | 56 (5.3%) |
| $12,500 to $14,999 | 0 (0.0%) | 0 (0.0%) |
| $15,000 to $17,499 | 0 (0.0%) | 88 (8.3%) |
| $17,500 to $19,999 | 22 (3.4%) | 0 (0.0%) |
| $20,000 to $22,499 | 18 (2.8%) | 18 (1.7%) |
| $22,500 to $24,999 | 0 (0.0%) | 28 (2.6%) |
| $25,000 to $29,999 | 0 (0.0%) | 53 (5.0%) |
| $30,000 to $34,999 | 0 (0.0%) | 30 (2.8%) |
| $35,000 to $39,999 | 0 (0.0%) | 135 (12.8%) |
| $40,000 to $44,999 | 73 (11.4%) | 94 (8.9%) |
| $45,000 to $49,999 | 74 (11.5%) | 42 (4.0%) |
| $50,000 to $54,999 | 0 (0.0%) | 110 (10.4%) |
| $55,000 to $64,999 | 76 (11.8%) | 0 (0.0%) |
| $65,000 to $74,999 | 0 (0.0%) | 60 (5.7%) |
| $75,000 to $99,999 | 131 (20.4%) | 137 (13.0%) |
| $100,000+ | 226 (35.1%) | 23 (2.2%) |
| Total | 643 (100.0%) | 1,058 (100.0%) |
Earnings by Sex by Educational Attainment in Kingston
Average earnings in Kingston are $88,048 for men and $41,691 for women, a difference of 52.6%. Men with an educational attainment of graduate degree enjoy the highest average annual earnings of $138,417, while those with less than high school education earn the least with $48,472. Women with an educational attainment of bachelor's degree earn the most with the average annual earnings of $50,536, while those with college or associate's degree education have the smallest earnings of $28,113.
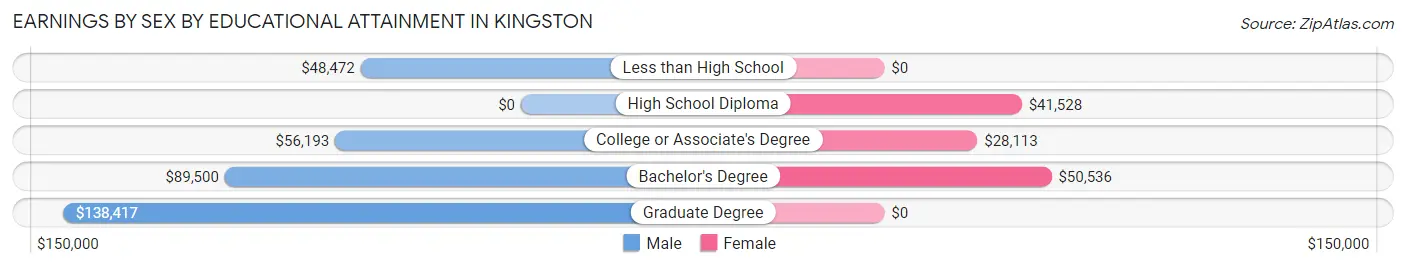
| Educational Attainment | Male Income | Female Income |
| Less than High School | $48,472 | $0 |
| High School Diploma | - | - |
| College or Associate's Degree | $56,193 | $28,113 |
| Bachelor's Degree | $89,500 | $50,536 |
| Graduate Degree | $138,417 | $0 |
| Total | $88,048 | $41,691 |
Family Income in Kingston
Family Income Brackets in Kingston
According to the Kingston family income data, there are 190 families falling into the $75,000 to $99,999 income range, which is the most common income bracket and makes up 23.2% of all families.
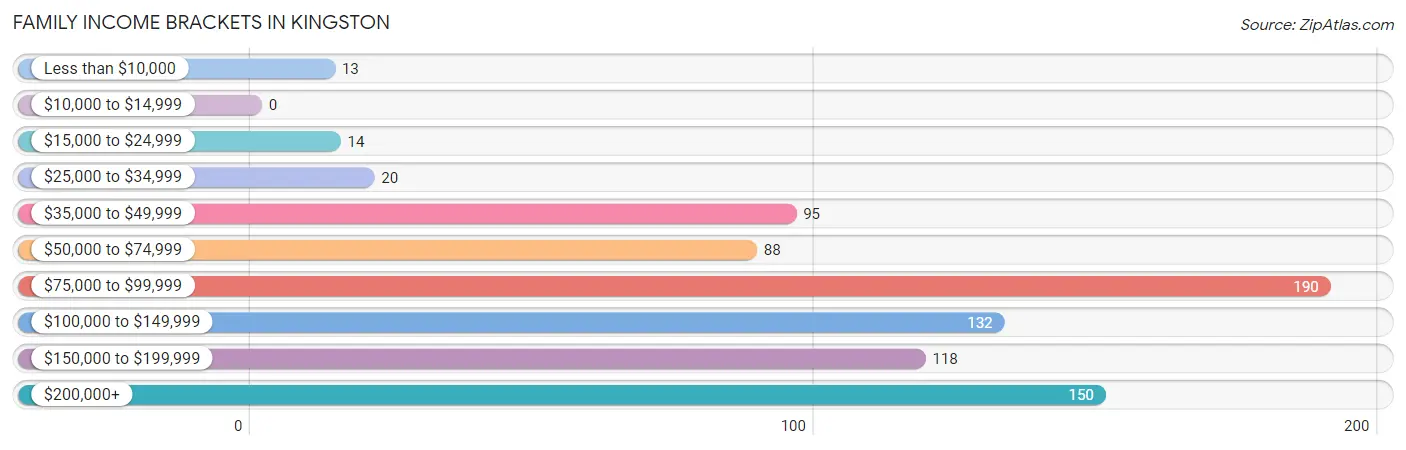
| Income Bracket | # Families | % Families |
| Less than $10,000 | 13 | 1.6% |
| $10,000 to $14,999 | 0 | 0.0% |
| $15,000 to $24,999 | 14 | 1.7% |
| $25,000 to $34,999 | 20 | 2.4% |
| $35,000 to $49,999 | 95 | 11.6% |
| $50,000 to $74,999 | 88 | 10.7% |
| $75,000 to $99,999 | 190 | 23.2% |
| $100,000 to $149,999 | 132 | 16.1% |
| $150,000 to $199,999 | 118 | 14.4% |
| $200,000+ | 150 | 18.3% |
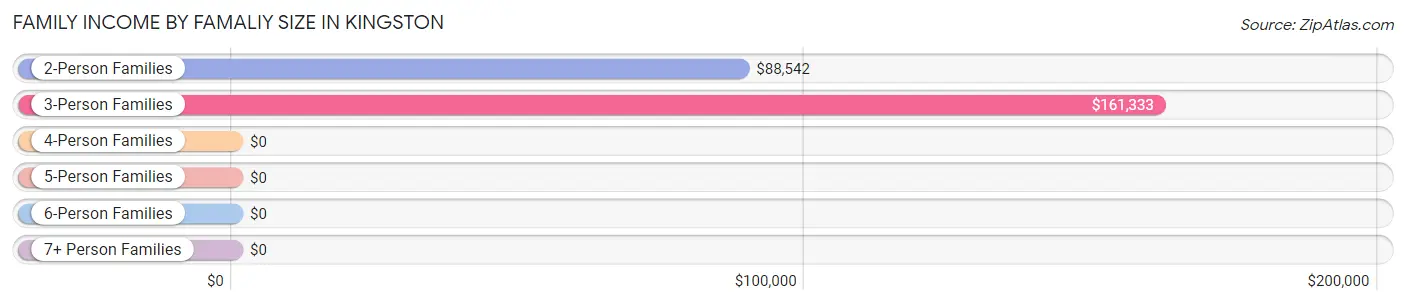
Family Income by Famaliy Size in Kingston
3-person families (98 | 11.9%) account for the highest median family income in Kingston with $161,333 per family, while 3-person families (98 | 11.9%) have the highest median income of $53,778 per family member.
| Income Bracket | # Families | Median Income |
| 2-Person Families | 478 (58.3%) | $88,542 |
| 3-Person Families | 98 (11.9%) | $161,333 |
| 4-Person Families | 63 (7.7%) | $0 |
| 5-Person Families | 151 (18.4%) | $0 |
| 6-Person Families | 30 (3.7%) | $0 |
| 7+ Person Families | 0 (0.0%) | $0 |
| Total | 820 (100.0%) | $98,077 |
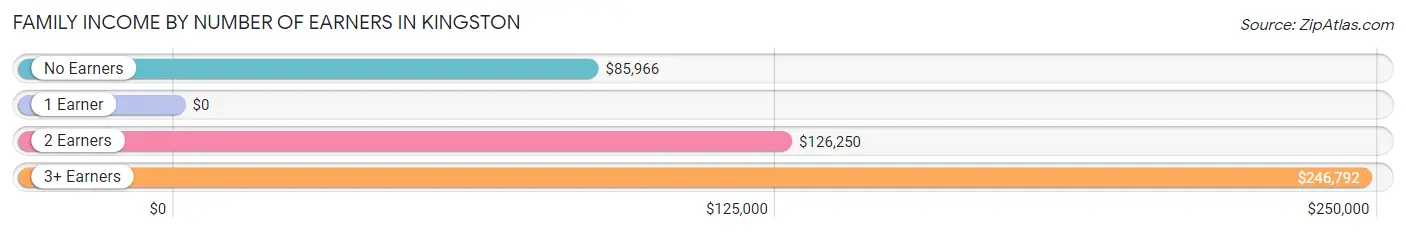
Family Income by Number of Earners in Kingston
| Number of Earners | # Families | Median Income |
| No Earners | 171 (20.8%) | $85,966 |
| 1 Earner | 148 (18.0%) | $0 |
| 2 Earners | 378 (46.1%) | $126,250 |
| 3+ Earners | 123 (15.0%) | $246,792 |
| Total | 820 (100.0%) | $98,077 |
Household Income in Kingston
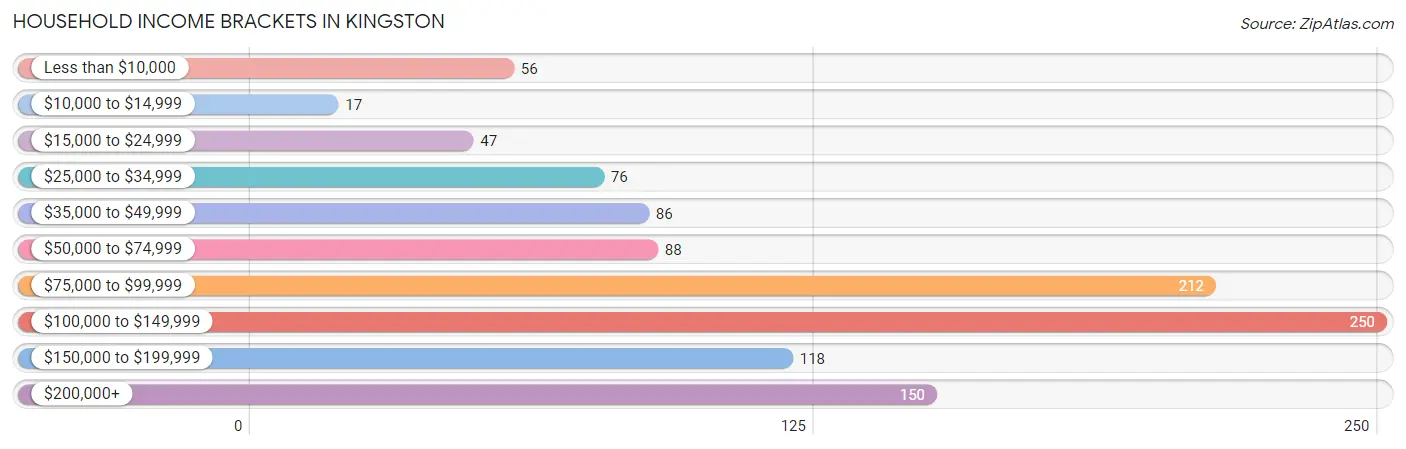
Household Income Brackets in Kingston
With 250 households falling in the category, the $100,000 to $149,999 income range is the most frequent in Kingston, accounting for 22.7% of all households. In contrast, only 17 households (1.5%) fall into the $10,000 to $14,999 income bracket, making it the least populous group.
| Income Bracket | # Households | % Households |
| Less than $10,000 | 56 | 5.1% |
| $10,000 to $14,999 | 17 | 1.5% |
| $15,000 to $24,999 | 47 | 4.3% |
| $25,000 to $34,999 | 76 | 6.9% |
| $35,000 to $49,999 | 86 | 7.8% |
| $50,000 to $74,999 | 88 | 8.0% |
| $75,000 to $99,999 | 212 | 19.3% |
| $100,000 to $149,999 | 250 | 22.7% |
| $150,000 to $199,999 | 118 | 10.7% |
| $200,000+ | 150 | 13.6% |
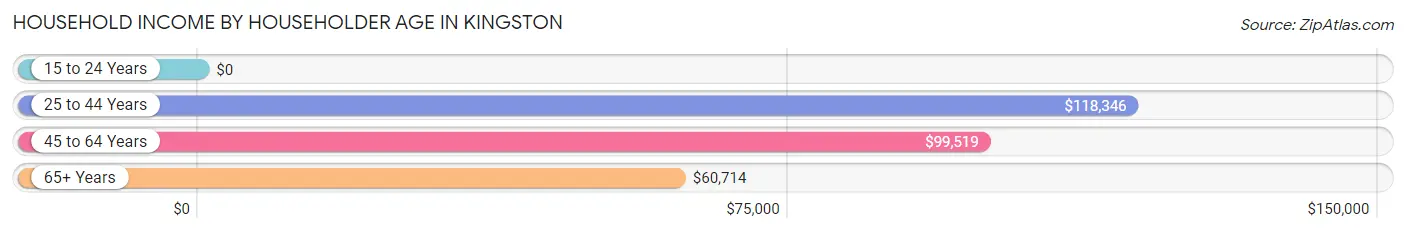
Household Income by Householder Age in Kingston
The median household income in Kingston is $96,645, with the highest median household income of $118,346 found in the 25 to 44 years age bracket for the primary householder. A total of 316 households (28.7%) fall into this category. Meanwhile, the 15 to 24 years age bracket for the primary householder has the lowest median household income of $0, with 16 households (1.5%) in this group.
| Income Bracket | # Households | Median Income |
| 15 to 24 Years | 16 (1.5%) | $0 |
| 25 to 44 Years | 316 (28.7%) | $118,346 |
| 45 to 64 Years | 413 (37.5%) | $99,519 |
| 65+ Years | 356 (32.3%) | $60,714 |
| Total | 1,101 (100.0%) | $96,645 |
Poverty in Kingston
Income Below Poverty by Sex and Age in Kingston
With 11.4% poverty level for males and 4.3% for females among the residents of Kingston, 12 to 14 year old males and 16 and 17 year old females are the most vulnerable to poverty, with 10 males (100.0%) and 6 females (42.9%) in their respective age groups living below the poverty level.
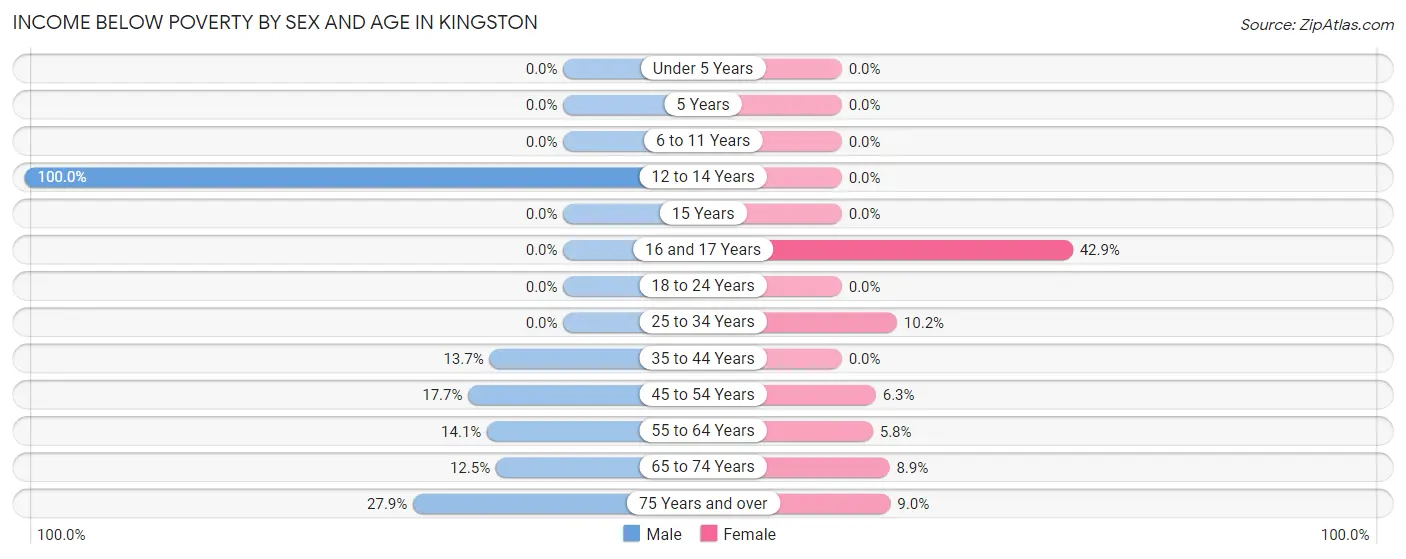
| Age Bracket | Male | Female |
| Under 5 Years | 0 (0.0%) | 0 (0.0%) |
| 5 Years | 0 (0.0%) | 0 (0.0%) |
| 6 to 11 Years | 0 (0.0%) | 0 (0.0%) |
| 12 to 14 Years | 10 (100.0%) | 0 (0.0%) |
| 15 Years | 0 (0.0%) | 0 (0.0%) |
| 16 and 17 Years | 0 (0.0%) | 6 (42.9%) |
| 18 to 24 Years | 0 (0.0%) | 0 (0.0%) |
| 25 to 34 Years | 0 (0.0%) | 18 (10.2%) |
| 35 to 44 Years | 17 (13.7%) | 0 (0.0%) |
| 45 to 54 Years | 24 (17.6%) | 14 (6.3%) |
| 55 to 64 Years | 28 (14.1%) | 13 (5.8%) |
| 65 to 74 Years | 13 (12.5%) | 17 (8.8%) |
| 75 Years and over | 41 (27.9%) | 11 (9.0%) |
| Total | 133 (11.4%) | 79 (4.3%) |
Income Above Poverty by Sex and Age in Kingston
According to the poverty statistics in Kingston, males aged under 5 years and females aged under 5 years are the age groups that are most secure financially, with 100.0% of males and 100.0% of females in these age groups living above the poverty line.
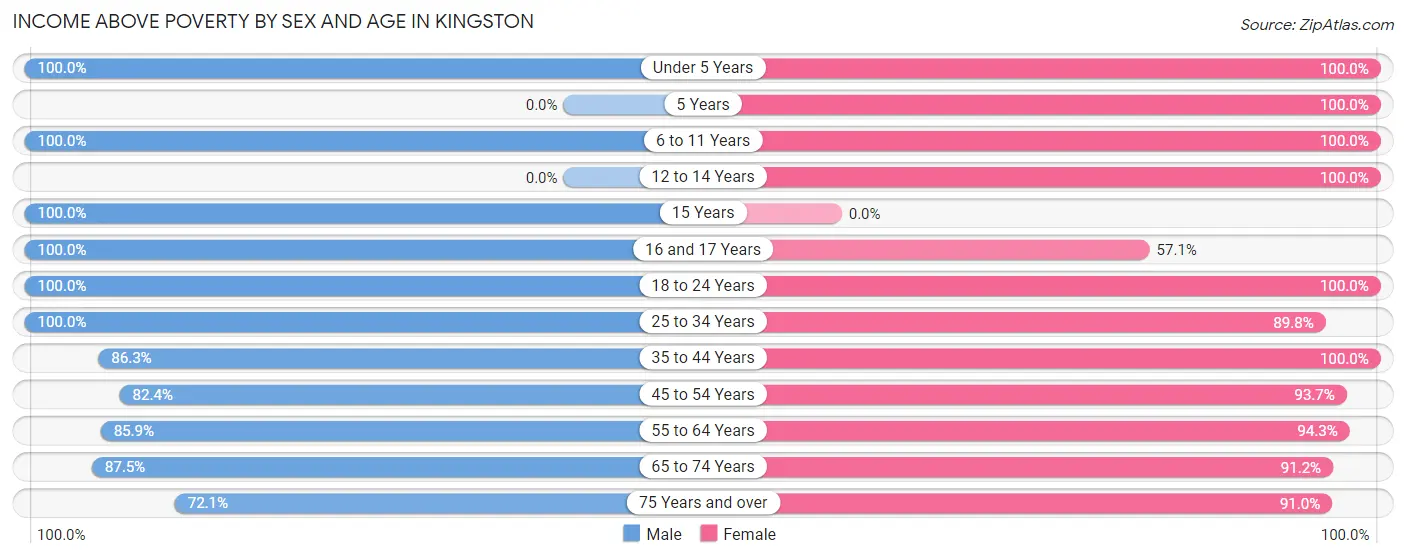
| Age Bracket | Male | Female |
| Under 5 Years | 114 (100.0%) | 27 (100.0%) |
| 5 Years | 0 (0.0%) | 45 (100.0%) |
| 6 to 11 Years | 15 (100.0%) | 134 (100.0%) |
| 12 to 14 Years | 0 (0.0%) | 66 (100.0%) |
| 15 Years | 22 (100.0%) | 0 (0.0%) |
| 16 and 17 Years | 43 (100.0%) | 8 (57.1%) |
| 18 to 24 Years | 36 (100.0%) | 316 (100.0%) |
| 25 to 34 Years | 222 (100.0%) | 158 (89.8%) |
| 35 to 44 Years | 107 (86.3%) | 288 (100.0%) |
| 45 to 54 Years | 112 (82.4%) | 208 (93.7%) |
| 55 to 64 Years | 170 (85.9%) | 213 (94.3%) |
| 65 to 74 Years | 91 (87.5%) | 175 (91.1%) |
| 75 Years and over | 106 (72.1%) | 111 (91.0%) |
| Total | 1,038 (88.6%) | 1,749 (95.7%) |
Income Below Poverty Among Married-Couple Families in Kingston
The poverty statistics for married-couple families in Kingston show that 2.2% or 13 of the total 586 families live below the poverty line. Families with no children have the highest poverty rate of 3.5%, comprising of 13 families. On the other hand, families with 1 or 2 children have the lowest poverty rate of 0.0%, which includes 0 families.
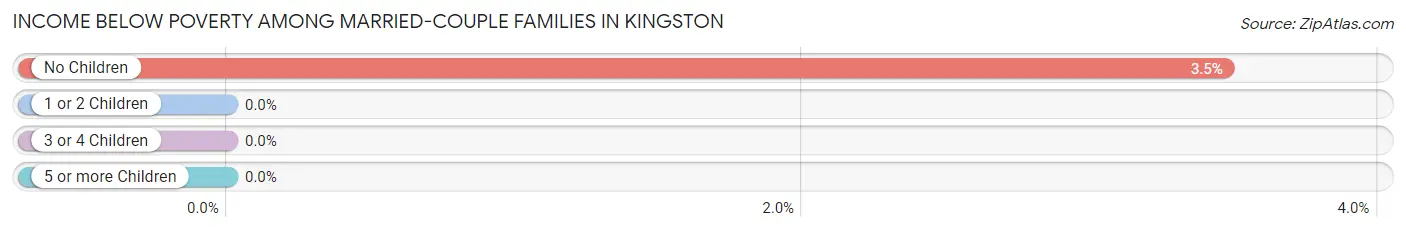
| Children | Above Poverty | Below Poverty |
| No Children | 362 (96.5%) | 13 (3.5%) |
| 1 or 2 Children | 131 (100.0%) | 0 (0.0%) |
| 3 or 4 Children | 80 (100.0%) | 0 (0.0%) |
| 5 or more Children | 0 (0.0%) | 0 (0.0%) |
| Total | 573 (97.8%) | 13 (2.2%) |
Income Below Poverty Among Single-Parent Households in Kingston
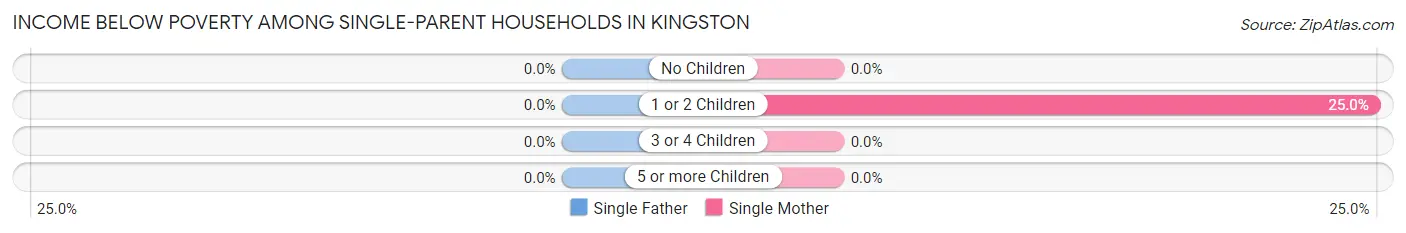
| Children | Single Father | Single Mother |
| No Children | 0 (0.0%) | 0 (0.0%) |
| 1 or 2 Children | 0 (0.0%) | 14 (25.0%) |
| 3 or 4 Children | 0 (0.0%) | 0 (0.0%) |
| 5 or more Children | 0 (0.0%) | 0 (0.0%) |
| Total | 0 (0.0%) | 14 (6.0%) |
Income Below Poverty Among Married-Couple vs Single-Parent Households in Kingston
The poverty data for Kingston shows that 13 of the married-couple family households (2.2%) and 14 of the single-parent households (6.0%) are living below the poverty level. Within the married-couple family households, those with no children have the highest poverty rate, with 13 households (3.5%) falling below the poverty line. Among the single-parent households, those with 1 or 2 children have the highest poverty rate, with 14 household (25.0%) living below poverty.
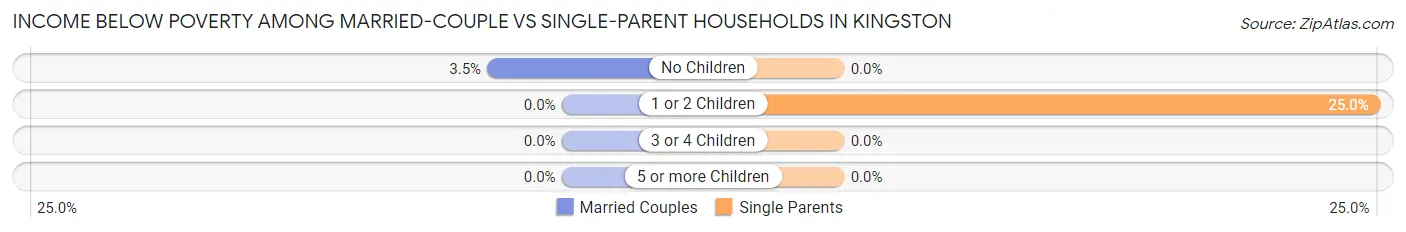
| Children | Married-Couple Families | Single-Parent Households |
| No Children | 13 (3.5%) | 0 (0.0%) |
| 1 or 2 Children | 0 (0.0%) | 14 (25.0%) |
| 3 or 4 Children | 0 (0.0%) | 0 (0.0%) |
| 5 or more Children | 0 (0.0%) | 0 (0.0%) |
| Total | 13 (2.2%) | 14 (6.0%) |
Employment Characteristics in Kingston
Employment by Class of Employer in Kingston
Among the 1,573 employed individuals in Kingston, private company employees (1,037 | 65.9%), federal government employees (199 | 12.7%), and local government employees (130 | 8.3%) make up the most common classes of employment.
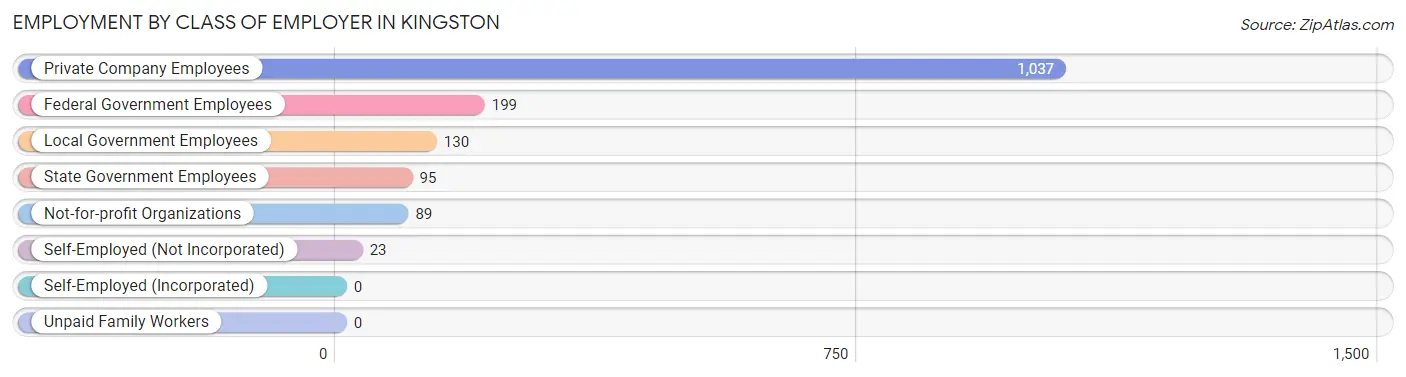
| Employer Class | # Employees | % Employees |
| Private Company Employees | 1,037 | 65.9% |
| Self-Employed (Incorporated) | 0 | 0.0% |
| Self-Employed (Not Incorporated) | 23 | 1.5% |
| Not-for-profit Organizations | 89 | 5.7% |
| Local Government Employees | 130 | 8.3% |
| State Government Employees | 95 | 6.0% |
| Federal Government Employees | 199 | 12.7% |
| Unpaid Family Workers | 0 | 0.0% |
| Total | 1,573 | 100.0% |
Employment Status by Age in Kingston
According to the labor force statistics for Kingston, out of the total population over 16 years of age (2,566), 64.2% or 1,647 individuals are in the labor force, with 4.6% or 76 of them unemployed. The age group with the highest labor force participation rate is 35 to 44 years, with 100.0% or 412 individuals in the labor force. Within the labor force, the 60 to 64 years age range has the highest percentage of unemployed individuals, with 32.8% or 44 of them being unemployed.
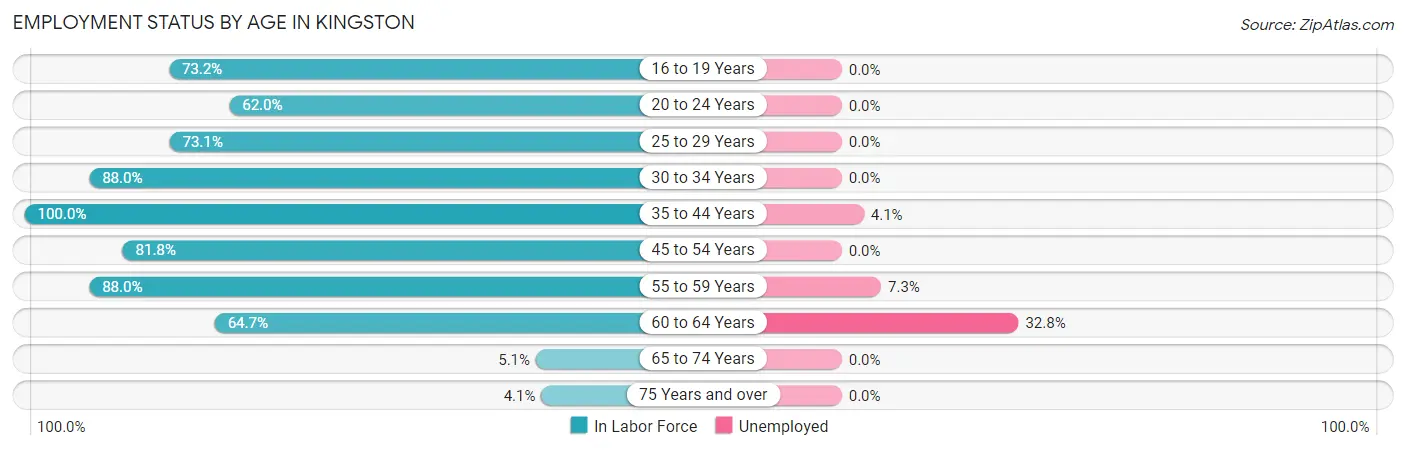
| Age Bracket | In Labor Force | Unemployed |
| 16 to 19 Years | 101 (73.2%) | 0 (0.0%) |
| 20 to 24 Years | 168 (62.0%) | 0 (0.0%) |
| 25 to 29 Years | 133 (73.1%) | 0 (0.0%) |
| 30 to 34 Years | 190 (88.0%) | 0 (0.0%) |
| 35 to 44 Years | 412 (100.0%) | 17 (4.1%) |
| 45 to 54 Years | 293 (81.8%) | 0 (0.0%) |
| 55 to 59 Years | 191 (88.0%) | 14 (7.3%) |
| 60 to 64 Years | 134 (64.7%) | 44 (32.8%) |
| 65 to 74 Years | 15 (5.1%) | 0 (0.0%) |
| 75 Years and over | 11 (4.1%) | 0 (0.0%) |
| Total | 1,647 (64.2%) | 76 (4.6%) |
Employment Status by Educational Attainment in Kingston
According to labor force statistics for Kingston, 85.0% of individuals (1,353) out of the total population between 25 and 64 years of age (1,592) are in the labor force, with 5.5% or 74 of them being unemployed. The group with the highest labor force participation rate are those with the educational attainment of bachelor's degree or higher, with 90.0% or 647 individuals in the labor force. Within the labor force, individuals with high school diploma education have the highest percentage of unemployment, with 7.8% or 17 of them being unemployed.
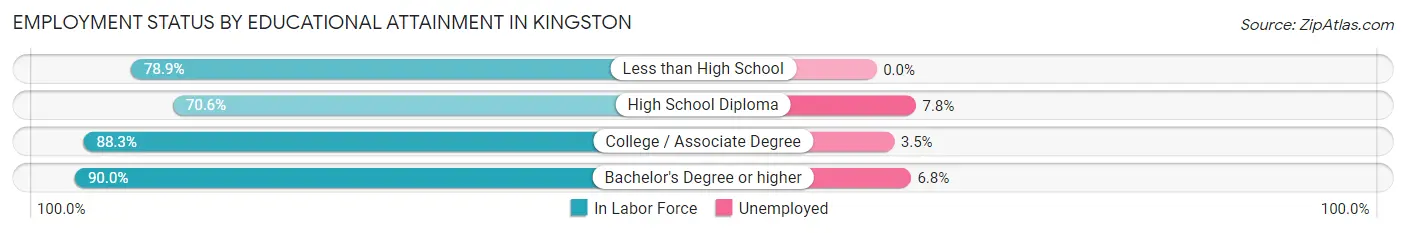
| Educational Attainment | In Labor Force | Unemployed |
| Less than High School | 86 (78.9%) | 0 (0.0%) |
| High School Diploma | 219 (70.6%) | 24 (7.8%) |
| College / Associate Degree | 401 (88.3%) | 16 (3.5%) |
| Bachelor's Degree or higher | 647 (90.0%) | 49 (6.8%) |
| Total | 1,353 (85.0%) | 88 (5.5%) |
Employment Occupations by Sex in Kingston
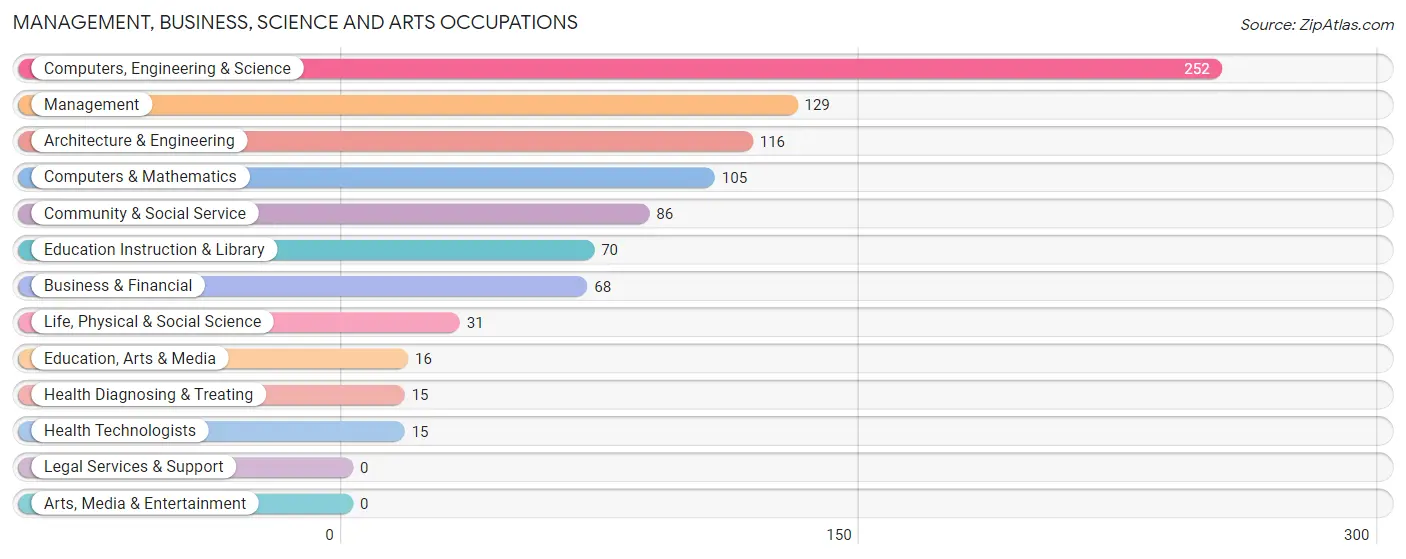
Management, Business, Science and Arts Occupations
The most common Management, Business, Science and Arts occupations in Kingston are Computers, Engineering & Science (252 | 16.0%), Management (129 | 8.2%), Architecture & Engineering (116 | 7.4%), Computers & Mathematics (105 | 6.7%), and Community & Social Service (86 | 5.5%).
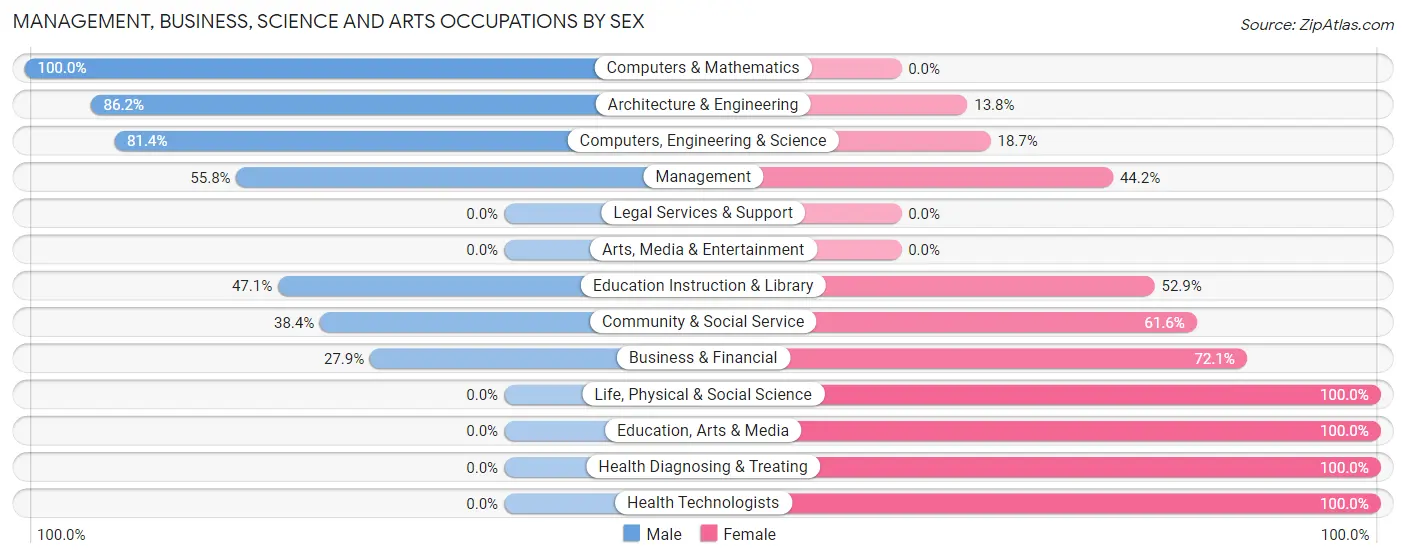
Management, Business, Science and Arts Occupations by Sex
Within the Management, Business, Science and Arts occupations in Kingston, the most male-oriented occupations are Computers & Mathematics (100.0%), Architecture & Engineering (86.2%), and Computers, Engineering & Science (81.4%), while the most female-oriented occupations are Life, Physical & Social Science (100.0%), Education, Arts & Media (100.0%), and Health Diagnosing & Treating (100.0%).
| Occupation | Male | Female |
| Management | 72 (55.8%) | 57 (44.2%) |
| Business & Financial | 19 (27.9%) | 49 (72.1%) |
| Computers, Engineering & Science | 205 (81.4%) | 47 (18.6%) |
| Computers & Mathematics | 105 (100.0%) | 0 (0.0%) |
| Architecture & Engineering | 100 (86.2%) | 16 (13.8%) |
| Life, Physical & Social Science | 0 (0.0%) | 31 (100.0%) |
| Community & Social Service | 33 (38.4%) | 53 (61.6%) |
| Education, Arts & Media | 0 (0.0%) | 16 (100.0%) |
| Legal Services & Support | 0 (0.0%) | 0 (0.0%) |
| Education Instruction & Library | 33 (47.1%) | 37 (52.9%) |
| Arts, Media & Entertainment | 0 (0.0%) | 0 (0.0%) |
| Health Diagnosing & Treating | 0 (0.0%) | 15 (100.0%) |
| Health Technologists | 0 (0.0%) | 15 (100.0%) |
| Total (Category) | 329 (59.8%) | 221 (40.2%) |
| Total (Overall) | 643 (40.9%) | 930 (59.1%) |
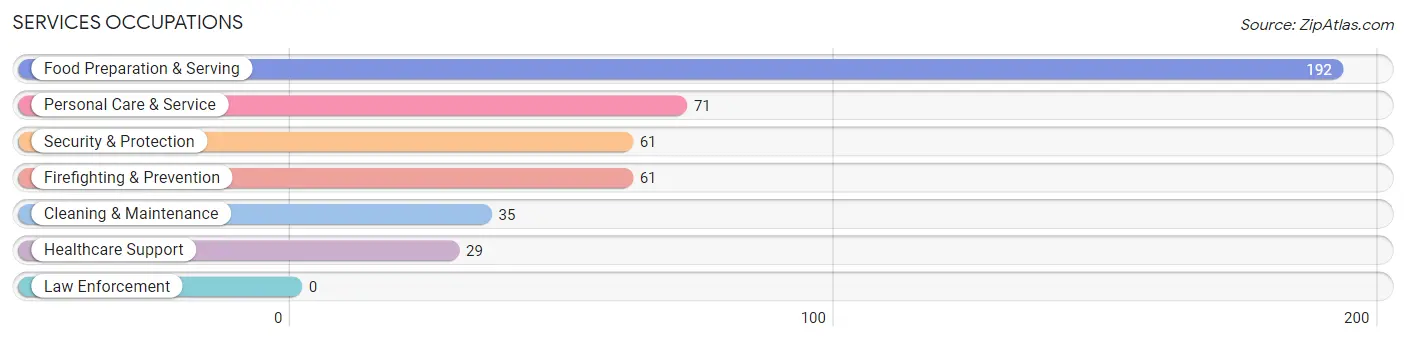
Services Occupations
The most common Services occupations in Kingston are Food Preparation & Serving (192 | 12.2%), Personal Care & Service (71 | 4.5%), Security & Protection (61 | 3.9%), Firefighting & Prevention (61 | 3.9%), and Cleaning & Maintenance (35 | 2.2%).
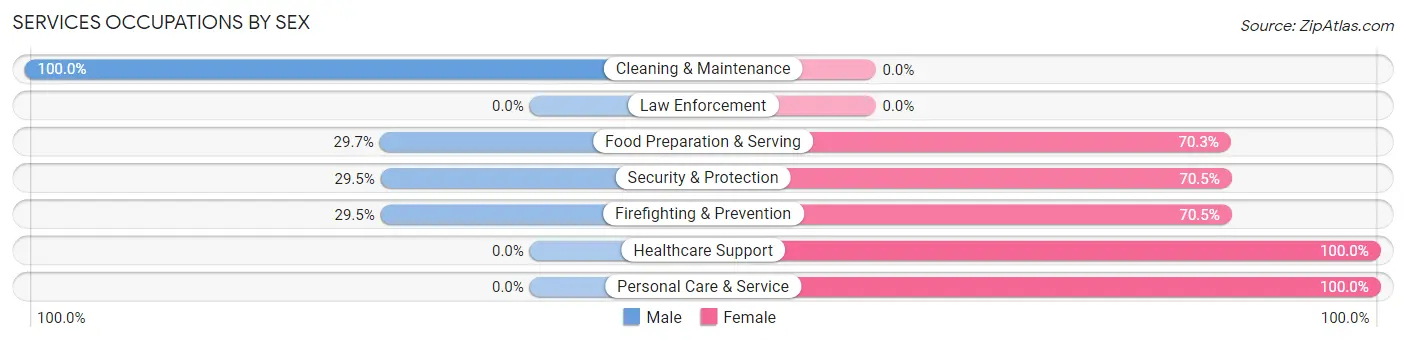
Services Occupations by Sex
Within the Services occupations in Kingston, the most male-oriented occupations are Cleaning & Maintenance (100.0%), Food Preparation & Serving (29.7%), and Security & Protection (29.5%), while the most female-oriented occupations are Healthcare Support (100.0%), Personal Care & Service (100.0%), and Security & Protection (70.5%).
| Occupation | Male | Female |
| Healthcare Support | 0 (0.0%) | 29 (100.0%) |
| Security & Protection | 18 (29.5%) | 43 (70.5%) |
| Firefighting & Prevention | 18 (29.5%) | 43 (70.5%) |
| Law Enforcement | 0 (0.0%) | 0 (0.0%) |
| Food Preparation & Serving | 57 (29.7%) | 135 (70.3%) |
| Cleaning & Maintenance | 35 (100.0%) | 0 (0.0%) |
| Personal Care & Service | 0 (0.0%) | 71 (100.0%) |
| Total (Category) | 110 (28.3%) | 278 (71.7%) |
| Total (Overall) | 643 (40.9%) | 930 (59.1%) |
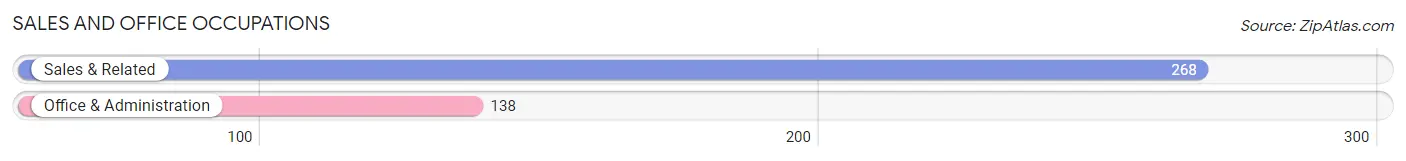
Sales and Office Occupations
The most common Sales and Office occupations in Kingston are Sales & Related (268 | 17.0%), and Office & Administration (138 | 8.8%).
Sales and Office Occupations by Sex
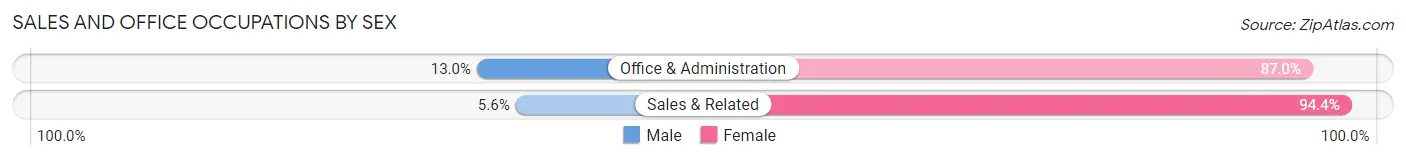
| Occupation | Male | Female |
| Sales & Related | 15 (5.6%) | 253 (94.4%) |
| Office & Administration | 18 (13.0%) | 120 (87.0%) |
| Total (Category) | 33 (8.1%) | 373 (91.9%) |
| Total (Overall) | 643 (40.9%) | 930 (59.1%) |
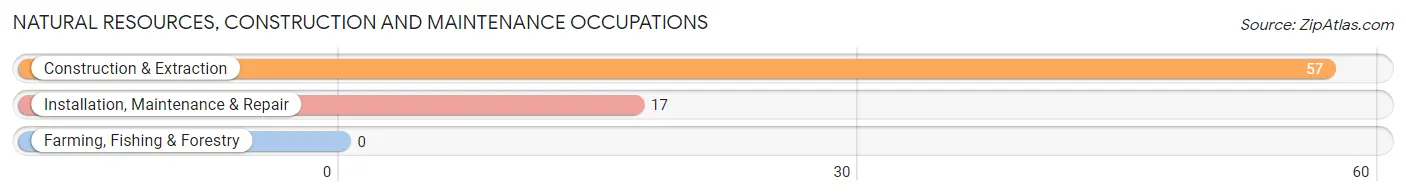
Natural Resources, Construction and Maintenance Occupations
The most common Natural Resources, Construction and Maintenance occupations in Kingston are Construction & Extraction (57 | 3.6%), and Installation, Maintenance & Repair (17 | 1.1%).
Natural Resources, Construction and Maintenance Occupations by Sex
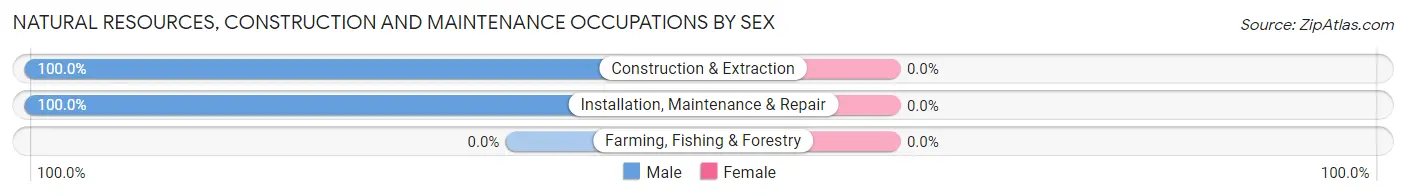
| Occupation | Male | Female |
| Farming, Fishing & Forestry | 0 (0.0%) | 0 (0.0%) |
| Construction & Extraction | 57 (100.0%) | 0 (0.0%) |
| Installation, Maintenance & Repair | 17 (100.0%) | 0 (0.0%) |
| Total (Category) | 74 (100.0%) | 0 (0.0%) |
| Total (Overall) | 643 (40.9%) | 930 (59.1%) |
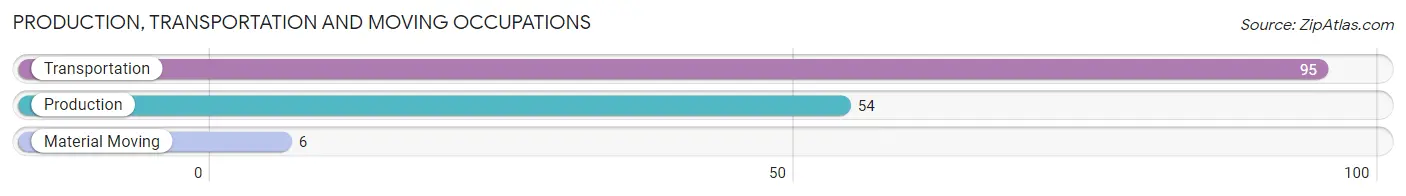
Production, Transportation and Moving Occupations
The most common Production, Transportation and Moving occupations in Kingston are Transportation (95 | 6.0%), Production (54 | 3.4%), and Material Moving (6 | 0.4%).
Production, Transportation and Moving Occupations by Sex
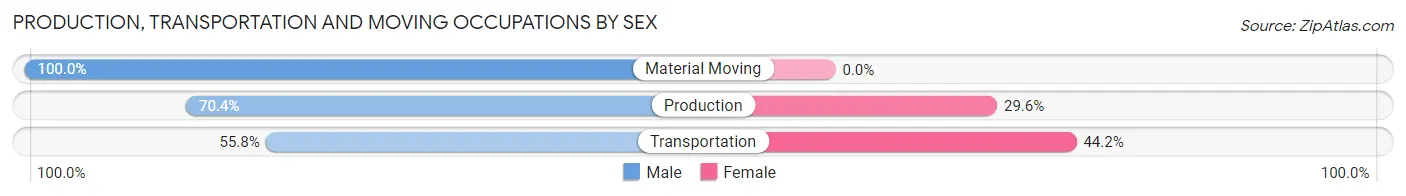
| Occupation | Male | Female |
| Production | 38 (70.4%) | 16 (29.6%) |
| Transportation | 53 (55.8%) | 42 (44.2%) |
| Material Moving | 6 (100.0%) | 0 (0.0%) |
| Total (Category) | 97 (62.6%) | 58 (37.4%) |
| Total (Overall) | 643 (40.9%) | 930 (59.1%) |
Employment Industries by Sex in Kingston
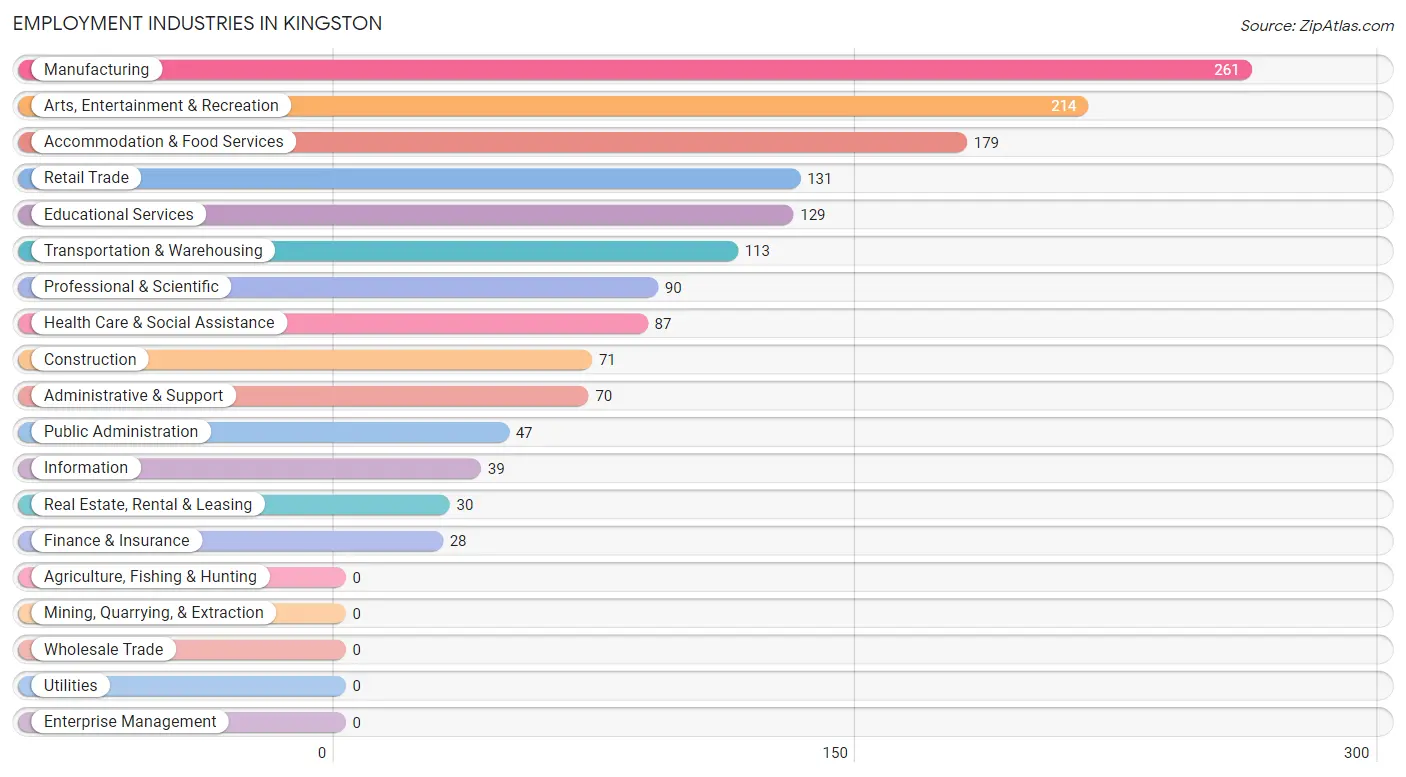
Employment Industries in Kingston
The major employment industries in Kingston include Manufacturing (261 | 16.6%), Arts, Entertainment & Recreation (214 | 13.6%), Accommodation & Food Services (179 | 11.4%), Retail Trade (131 | 8.3%), and Educational Services (129 | 8.2%).
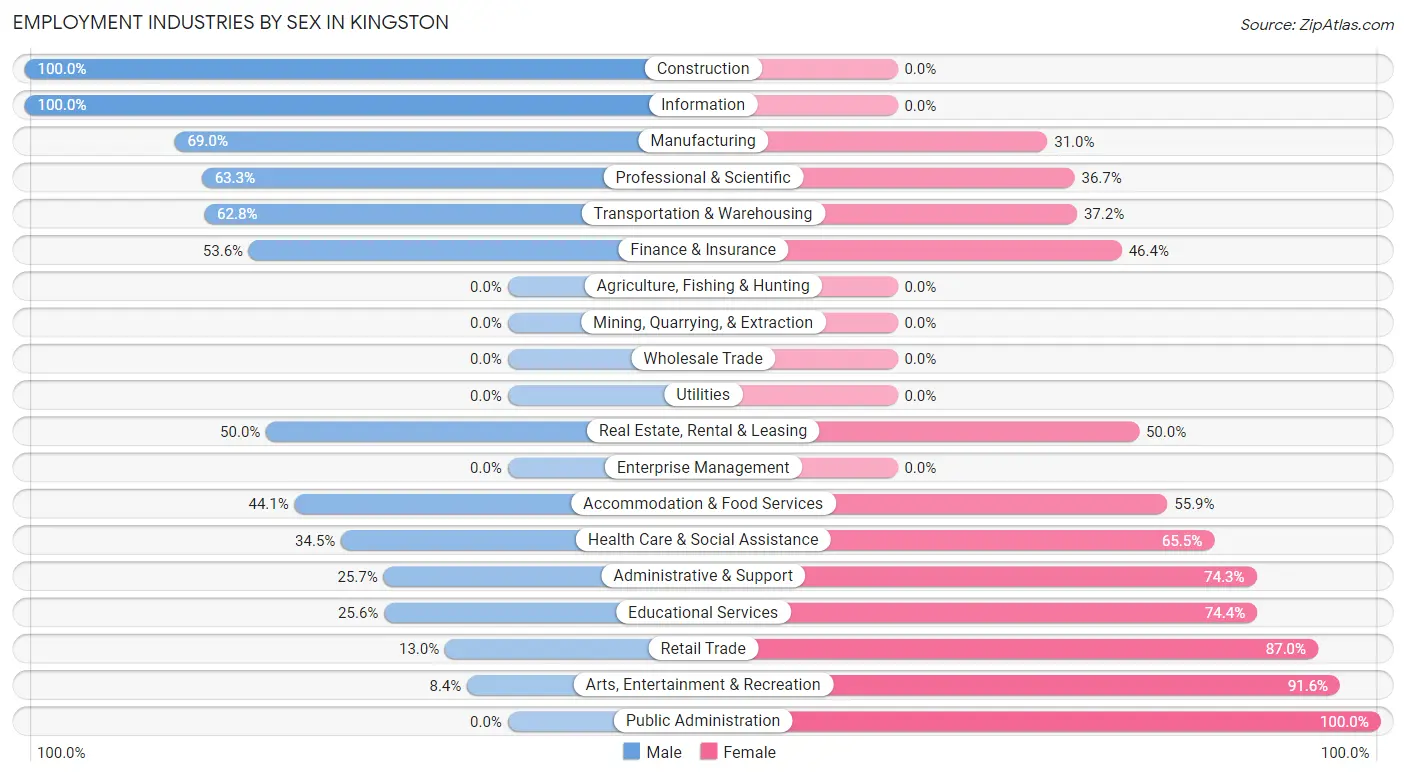
Employment Industries by Sex in Kingston
The Kingston industries that see more men than women are Construction (100.0%), Information (100.0%), and Manufacturing (69.0%), whereas the industries that tend to have a higher number of women are Public Administration (100.0%), Arts, Entertainment & Recreation (91.6%), and Retail Trade (87.0%).
| Industry | Male | Female |
| Agriculture, Fishing & Hunting | 0 (0.0%) | 0 (0.0%) |
| Mining, Quarrying, & Extraction | 0 (0.0%) | 0 (0.0%) |
| Construction | 71 (100.0%) | 0 (0.0%) |
| Manufacturing | 180 (69.0%) | 81 (31.0%) |
| Wholesale Trade | 0 (0.0%) | 0 (0.0%) |
| Retail Trade | 17 (13.0%) | 114 (87.0%) |
| Transportation & Warehousing | 71 (62.8%) | 42 (37.2%) |
| Utilities | 0 (0.0%) | 0 (0.0%) |
| Information | 39 (100.0%) | 0 (0.0%) |
| Finance & Insurance | 15 (53.6%) | 13 (46.4%) |
| Real Estate, Rental & Leasing | 15 (50.0%) | 15 (50.0%) |
| Professional & Scientific | 57 (63.3%) | 33 (36.7%) |
| Enterprise Management | 0 (0.0%) | 0 (0.0%) |
| Administrative & Support | 18 (25.7%) | 52 (74.3%) |
| Educational Services | 33 (25.6%) | 96 (74.4%) |
| Health Care & Social Assistance | 30 (34.5%) | 57 (65.5%) |
| Arts, Entertainment & Recreation | 18 (8.4%) | 196 (91.6%) |
| Accommodation & Food Services | 79 (44.1%) | 100 (55.9%) |
| Public Administration | 0 (0.0%) | 47 (100.0%) |
| Total | 643 (40.9%) | 930 (59.1%) |
Education in Kingston
School Enrollment in Kingston
The most common levels of schooling among the 706 students in Kingston are college / undergraduate (299 | 42.3%), elementary school (138 | 19.6%), and middle school (87 | 12.3%).
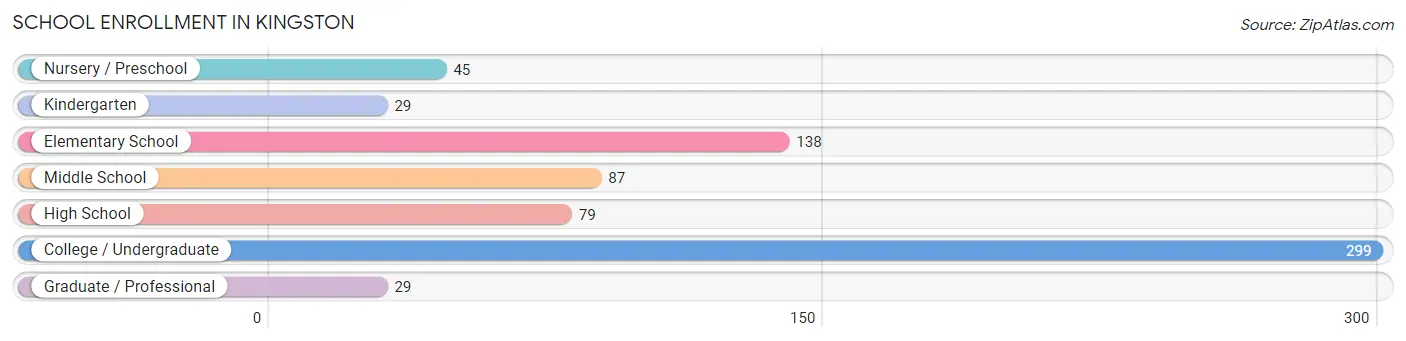
| School Level | # Students | % Students |
| Nursery / Preschool | 45 | 6.4% |
| Kindergarten | 29 | 4.1% |
| Elementary School | 138 | 19.6% |
| Middle School | 87 | 12.3% |
| High School | 79 | 11.2% |
| College / Undergraduate | 299 | 42.3% |
| Graduate / Professional | 29 | 4.1% |
| Total | 706 | 100.0% |
School Enrollment by Age by Funding Source in Kingston
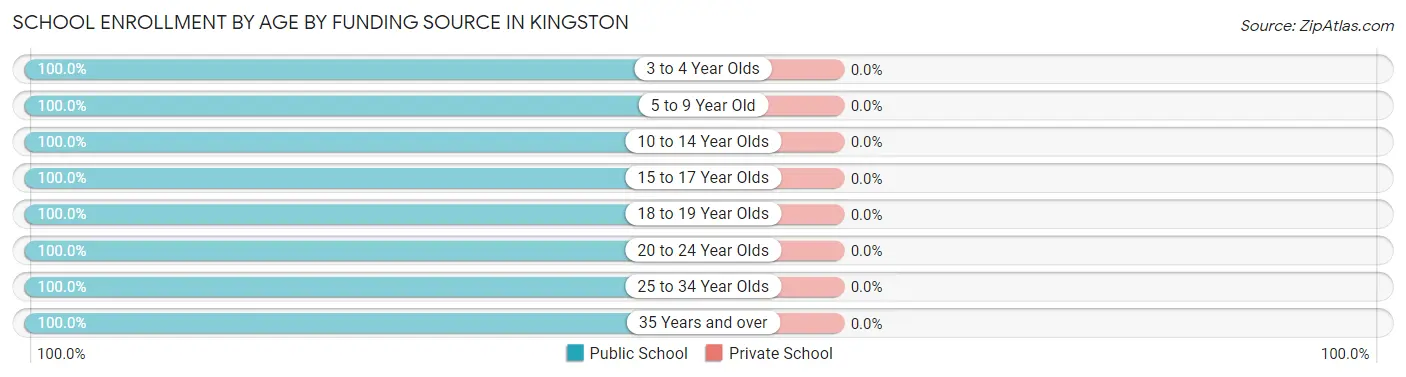
| Age Bracket | Public School | Private School |
| 3 to 4 Year Olds | 29 (100.0%) | 0 (0.0%) |
| 5 to 9 Year Old | 183 (100.0%) | 0 (0.0%) |
| 10 to 14 Year Olds | 87 (100.0%) | 0 (0.0%) |
| 15 to 17 Year Olds | 79 (100.0%) | 0 (0.0%) |
| 18 to 19 Year Olds | 81 (100.0%) | 0 (0.0%) |
| 20 to 24 Year Olds | 166 (100.0%) | 0 (0.0%) |
| 25 to 34 Year Olds | 36 (100.0%) | 0 (0.0%) |
| 35 Years and over | 45 (100.0%) | 0 (0.0%) |
| Total | 706 (100.0%) | 0 (0.0%) |
Educational Attainment by Field of Study in Kingston
Education (133 | 14.4%), engineering (115 | 12.4%), social sciences (104 | 11.2%), bio, nature & agricultural (84 | 9.1%), and liberal arts & history (84 | 9.1%) are the most common fields of study among 926 individuals in Kingston who have obtained a bachelor's degree or higher.
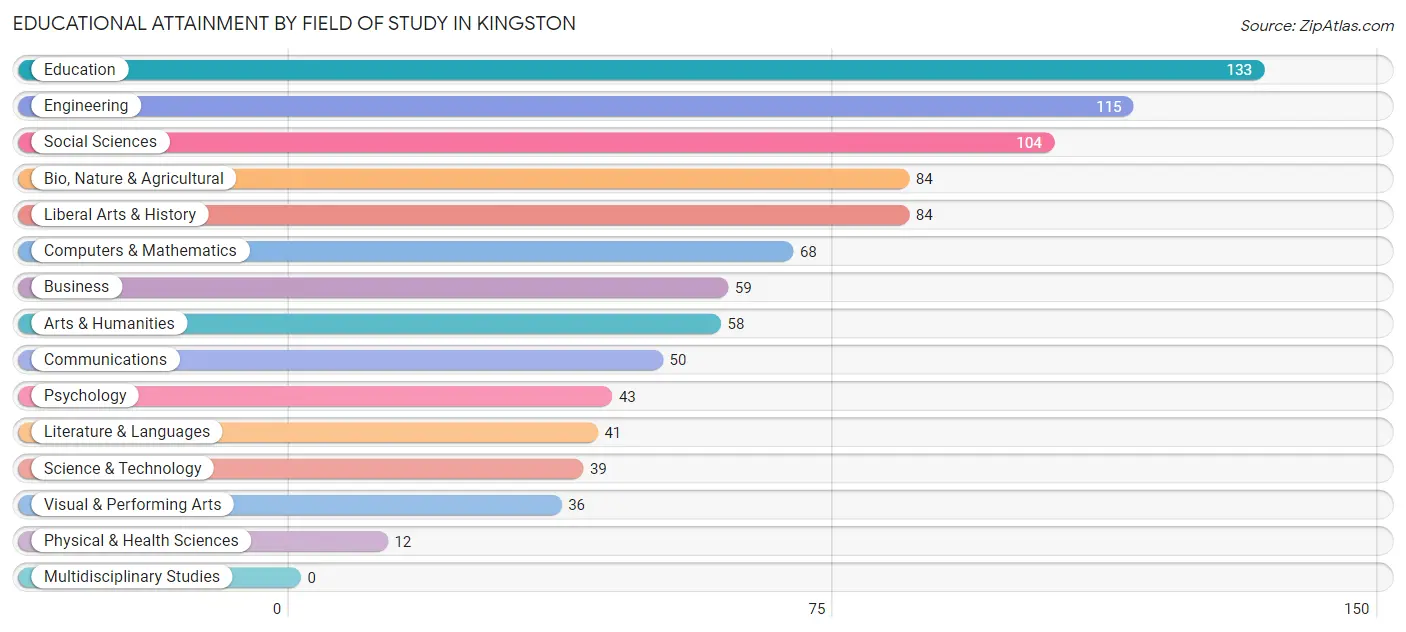
| Field of Study | # Graduates | % Graduates |
| Computers & Mathematics | 68 | 7.3% |
| Bio, Nature & Agricultural | 84 | 9.1% |
| Physical & Health Sciences | 12 | 1.3% |
| Psychology | 43 | 4.6% |
| Social Sciences | 104 | 11.2% |
| Engineering | 115 | 12.4% |
| Multidisciplinary Studies | 0 | 0.0% |
| Science & Technology | 39 | 4.2% |
| Business | 59 | 6.4% |
| Education | 133 | 14.4% |
| Literature & Languages | 41 | 4.4% |
| Liberal Arts & History | 84 | 9.1% |
| Visual & Performing Arts | 36 | 3.9% |
| Communications | 50 | 5.4% |
| Arts & Humanities | 58 | 6.3% |
| Total | 926 | 100.0% |
Transportation & Commute in Kingston
Vehicle Availability by Sex in Kingston
The most prevalent vehicle ownership categories in Kingston are males with 2 vehicles (223, accounting for 34.7%) and females with 2 vehicles (449, making up 24.0%).
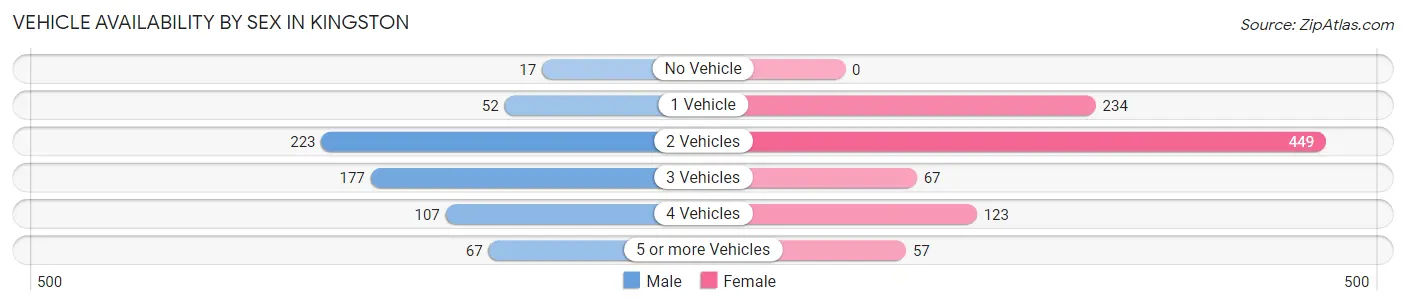
| Vehicles Available | Male | Female |
| No Vehicle | 17 (2.6%) | 0 (0.0%) |
| 1 Vehicle | 52 (8.1%) | 234 (25.2%) |
| 2 Vehicles | 223 (34.7%) | 449 (48.3%) |
| 3 Vehicles | 177 (27.5%) | 67 (7.2%) |
| 4 Vehicles | 107 (16.6%) | 123 (13.2%) |
| 5 or more Vehicles | 67 (10.4%) | 57 (6.1%) |
| Total | 643 (100.0%) | 930 (100.0%) |
Commute Time in Kingston
The most frequently occuring commute durations in Kingston are 10 to 14 minutes (198 commuters, 14.6%), 15 to 19 minutes (162 commuters, 12.0%), and 90 or more minutes (144 commuters, 10.6%).
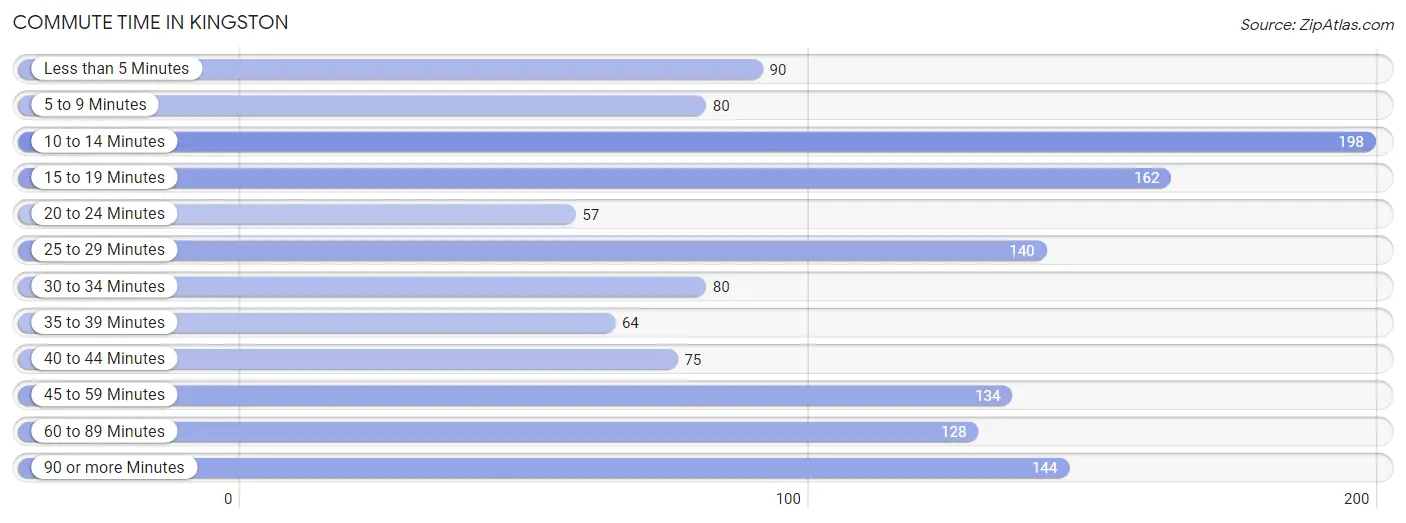
| Commute Time | # Commuters | % Commuters |
| Less than 5 Minutes | 90 | 6.7% |
| 5 to 9 Minutes | 80 | 5.9% |
| 10 to 14 Minutes | 198 | 14.6% |
| 15 to 19 Minutes | 162 | 12.0% |
| 20 to 24 Minutes | 57 | 4.2% |
| 25 to 29 Minutes | 140 | 10.4% |
| 30 to 34 Minutes | 80 | 5.9% |
| 35 to 39 Minutes | 64 | 4.7% |
| 40 to 44 Minutes | 75 | 5.6% |
| 45 to 59 Minutes | 134 | 9.9% |
| 60 to 89 Minutes | 128 | 9.5% |
| 90 or more Minutes | 144 | 10.6% |
Commute Time by Sex in Kingston
The most common commute times in Kingston are 90 or more minutes (92 commuters, 16.4%) for males and 10 to 14 minutes (157 commuters, 19.8%) for females.
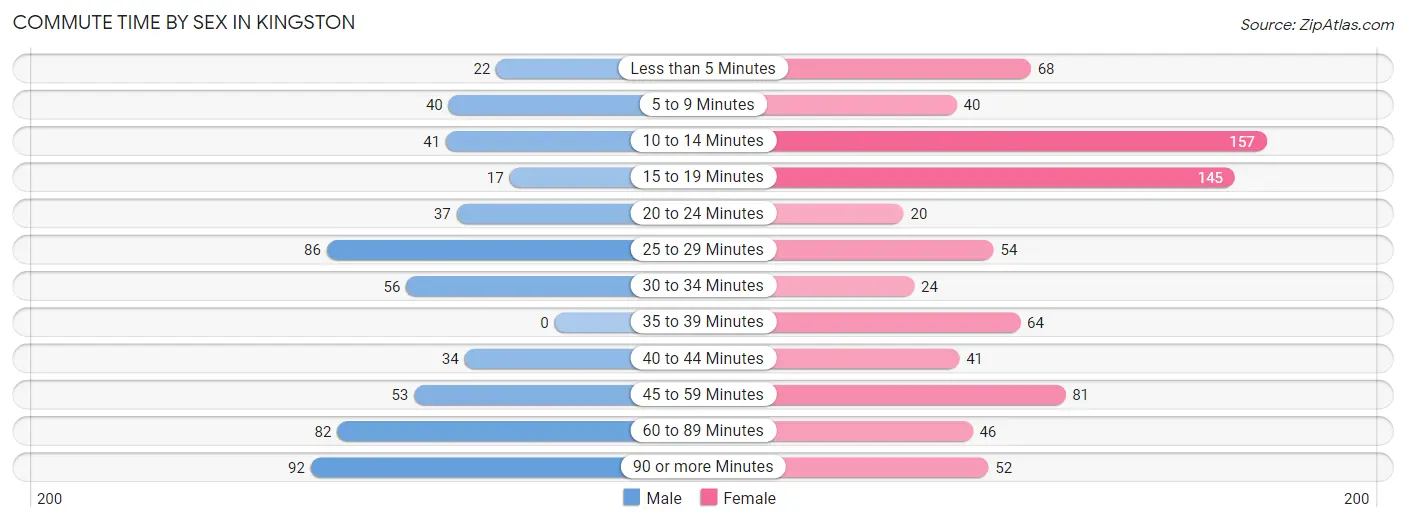
| Commute Time | Male | Female |
| Less than 5 Minutes | 22 (3.9%) | 68 (8.6%) |
| 5 to 9 Minutes | 40 (7.1%) | 40 (5.1%) |
| 10 to 14 Minutes | 41 (7.3%) | 157 (19.8%) |
| 15 to 19 Minutes | 17 (3.0%) | 145 (18.3%) |
| 20 to 24 Minutes | 37 (6.6%) | 20 (2.5%) |
| 25 to 29 Minutes | 86 (15.4%) | 54 (6.8%) |
| 30 to 34 Minutes | 56 (10.0%) | 24 (3.0%) |
| 35 to 39 Minutes | 0 (0.0%) | 64 (8.1%) |
| 40 to 44 Minutes | 34 (6.1%) | 41 (5.2%) |
| 45 to 59 Minutes | 53 (9.5%) | 81 (10.2%) |
| 60 to 89 Minutes | 82 (14.6%) | 46 (5.8%) |
| 90 or more Minutes | 92 (16.4%) | 52 (6.6%) |
Time of Departure to Work by Sex in Kingston
The most frequent times of departure to work in Kingston are 5:00 AM to 5:29 AM (103, 18.4%) for males and 7:00 AM to 7:29 AM (243, 30.7%) for females.
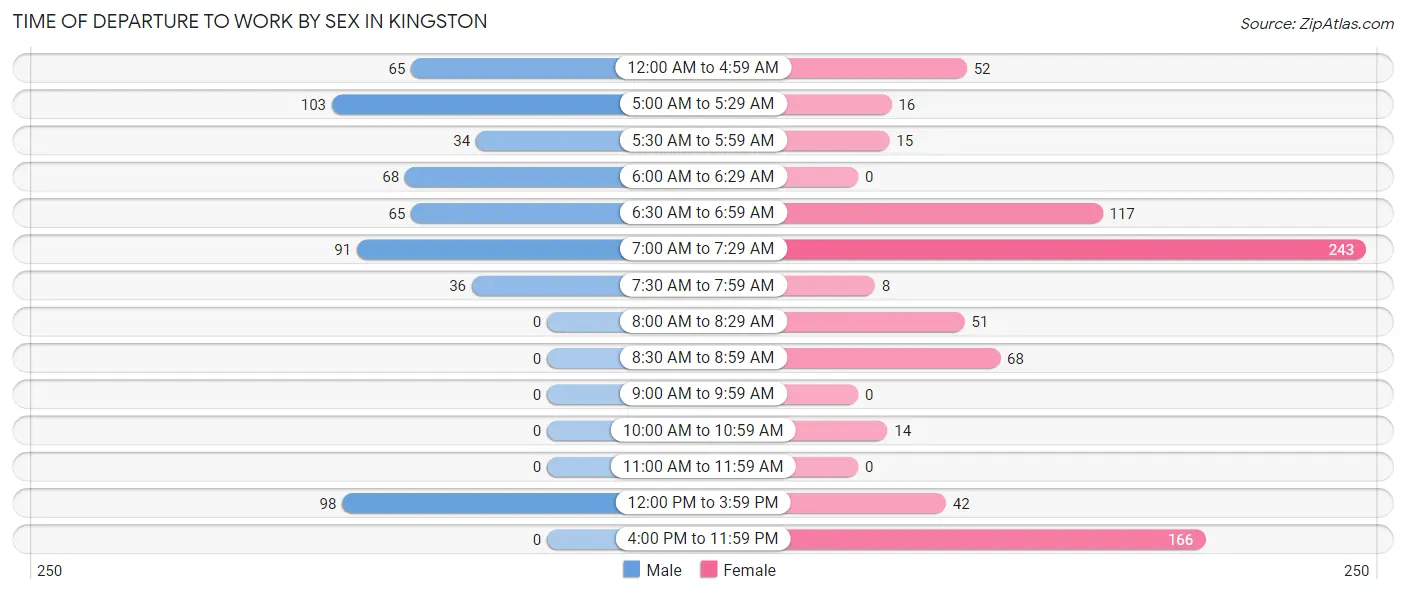
| Time of Departure | Male | Female |
| 12:00 AM to 4:59 AM | 65 (11.6%) | 52 (6.6%) |
| 5:00 AM to 5:29 AM | 103 (18.4%) | 16 (2.0%) |
| 5:30 AM to 5:59 AM | 34 (6.1%) | 15 (1.9%) |
| 6:00 AM to 6:29 AM | 68 (12.1%) | 0 (0.0%) |
| 6:30 AM to 6:59 AM | 65 (11.6%) | 117 (14.8%) |
| 7:00 AM to 7:29 AM | 91 (16.3%) | 243 (30.7%) |
| 7:30 AM to 7:59 AM | 36 (6.4%) | 8 (1.0%) |
| 8:00 AM to 8:29 AM | 0 (0.0%) | 51 (6.4%) |
| 8:30 AM to 8:59 AM | 0 (0.0%) | 68 (8.6%) |
| 9:00 AM to 9:59 AM | 0 (0.0%) | 0 (0.0%) |
| 10:00 AM to 10:59 AM | 0 (0.0%) | 14 (1.8%) |
| 11:00 AM to 11:59 AM | 0 (0.0%) | 0 (0.0%) |
| 12:00 PM to 3:59 PM | 98 (17.5%) | 42 (5.3%) |
| 4:00 PM to 11:59 PM | 0 (0.0%) | 166 (21.0%) |
| Total | 560 (100.0%) | 792 (100.0%) |
Housing Occupancy in Kingston
Occupancy by Ownership in Kingston
Of the total 1,101 dwellings in Kingston, owner-occupied units account for 744 (67.6%), while renter-occupied units make up 357 (32.4%).
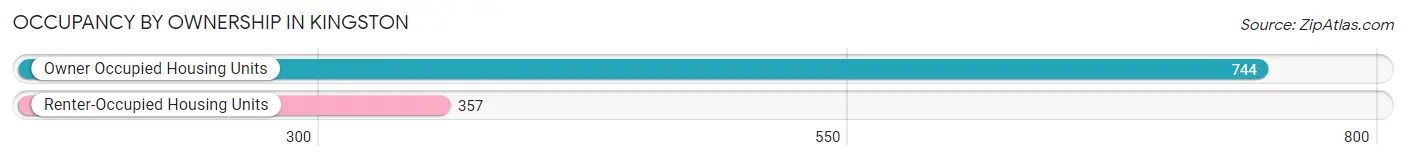
| Occupancy | # Housing Units | % Housing Units |
| Owner Occupied Housing Units | 744 | 67.6% |
| Renter-Occupied Housing Units | 357 | 32.4% |
| Total Occupied Housing Units | 1,101 | 100.0% |
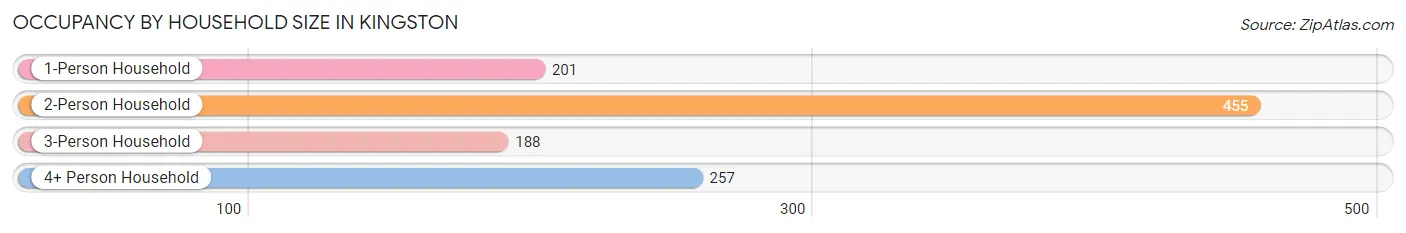
Occupancy by Household Size in Kingston
| Household Size | # Housing Units | % Housing Units |
| 1-Person Household | 201 | 18.3% |
| 2-Person Household | 455 | 41.3% |
| 3-Person Household | 188 | 17.1% |
| 4+ Person Household | 257 | 23.3% |
| Total Housing Units | 1,101 | 100.0% |
Occupancy by Ownership by Household Size in Kingston
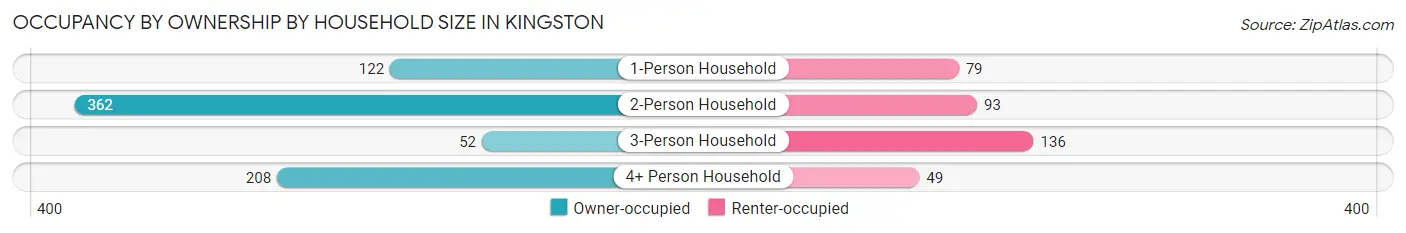
| Household Size | Owner-occupied | Renter-occupied |
| 1-Person Household | 122 (60.7%) | 79 (39.3%) |
| 2-Person Household | 362 (79.6%) | 93 (20.4%) |
| 3-Person Household | 52 (27.7%) | 136 (72.3%) |
| 4+ Person Household | 208 (80.9%) | 49 (19.1%) |
| Total Housing Units | 744 (67.6%) | 357 (32.4%) |
Occupancy by Educational Attainment in Kingston
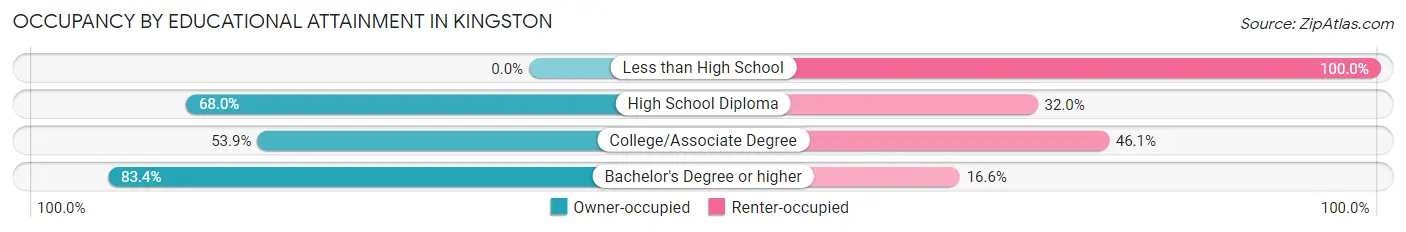
| Household Size | Owner-occupied | Renter-occupied |
| Less than High School | 0 (0.0%) | 31 (100.0%) |
| High School Diploma | 119 (68.0%) | 56 (32.0%) |
| College/Associate Degree | 222 (53.9%) | 190 (46.1%) |
| Bachelor's Degree or higher | 403 (83.4%) | 80 (16.6%) |
Occupancy by Age of Householder in Kingston
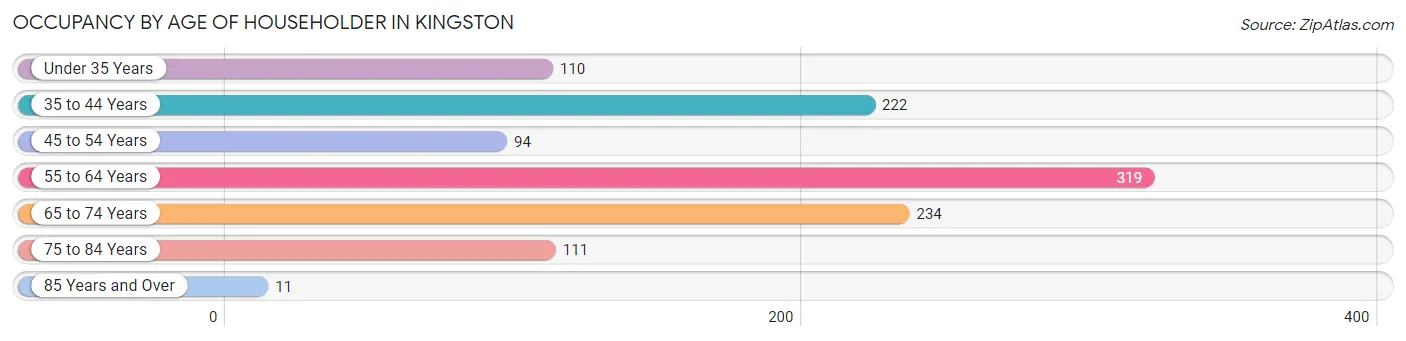
| Age Bracket | # Households | % Households |
| Under 35 Years | 110 | 10.0% |
| 35 to 44 Years | 222 | 20.2% |
| 45 to 54 Years | 94 | 8.5% |
| 55 to 64 Years | 319 | 29.0% |
| 65 to 74 Years | 234 | 21.2% |
| 75 to 84 Years | 111 | 10.1% |
| 85 Years and Over | 11 | 1.0% |
| Total | 1,101 | 100.0% |
Housing Finances in Kingston
Median Income by Occupancy in Kingston
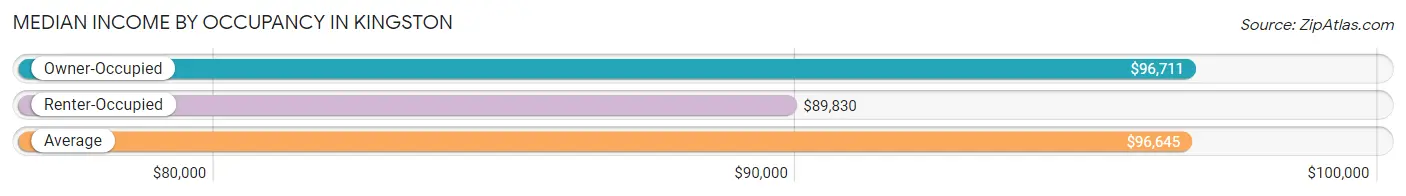
| Occupancy Type | # Households | Median Income |
| Owner-Occupied | 744 (67.6%) | $96,711 |
| Renter-Occupied | 357 (32.4%) | $89,830 |
| Average | 1,101 (100.0%) | $96,645 |
Occupancy by Householder Income Bracket in Kingston
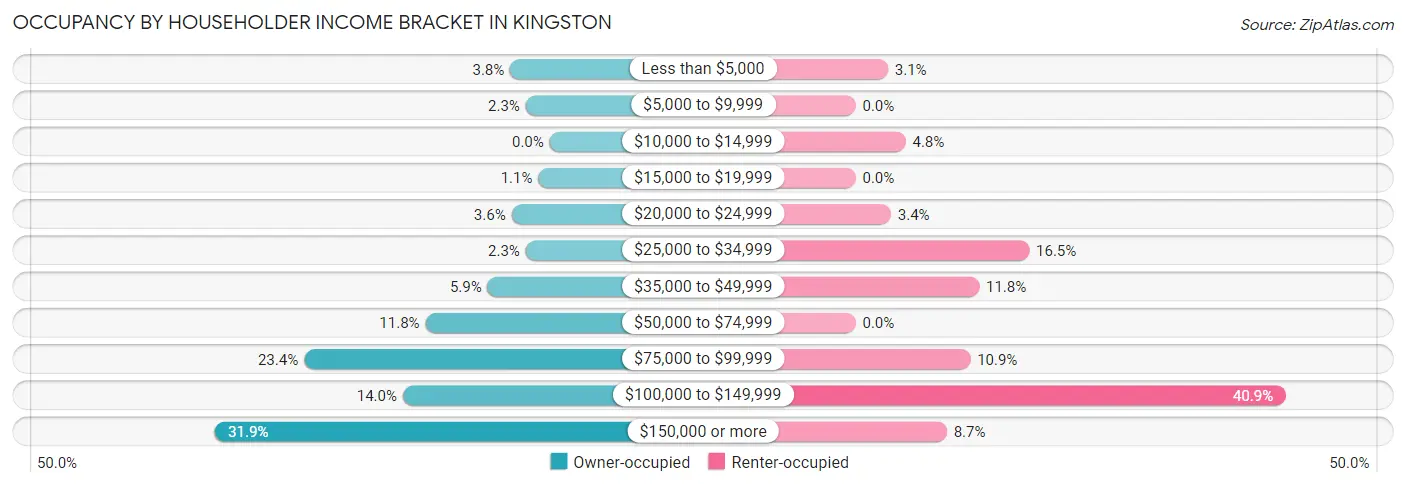
| Income Bracket | Owner-occupied | Renter-occupied |
| Less than $5,000 | 28 (3.8%) | 11 (3.1%) |
| $5,000 to $9,999 | 17 (2.3%) | 0 (0.0%) |
| $10,000 to $14,999 | 0 (0.0%) | 17 (4.8%) |
| $15,000 to $19,999 | 8 (1.1%) | 0 (0.0%) |
| $20,000 to $24,999 | 27 (3.6%) | 12 (3.4%) |
| $25,000 to $34,999 | 17 (2.3%) | 59 (16.5%) |
| $35,000 to $49,999 | 44 (5.9%) | 42 (11.8%) |
| $50,000 to $74,999 | 88 (11.8%) | 0 (0.0%) |
| $75,000 to $99,999 | 174 (23.4%) | 39 (10.9%) |
| $100,000 to $149,999 | 104 (14.0%) | 146 (40.9%) |
| $150,000 or more | 237 (31.9%) | 31 (8.7%) |
| Total | 744 (100.0%) | 357 (100.0%) |
Monthly Housing Cost Tiers in Kingston
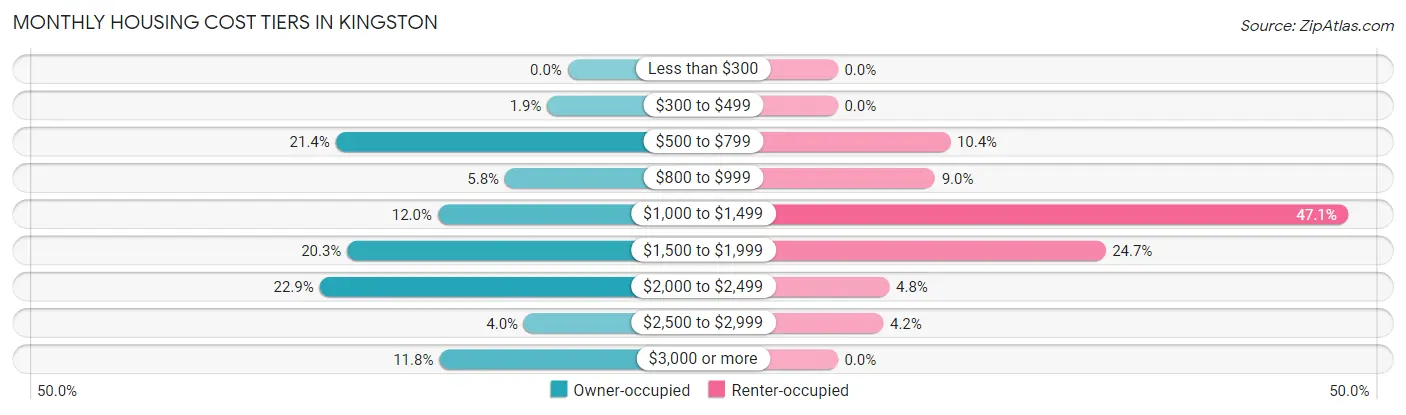
| Monthly Cost | Owner-occupied | Renter-occupied |
| Less than $300 | 0 (0.0%) | 0 (0.0%) |
| $300 to $499 | 14 (1.9%) | 0 (0.0%) |
| $500 to $799 | 159 (21.4%) | 37 (10.4%) |
| $800 to $999 | 43 (5.8%) | 32 (9.0%) |
| $1,000 to $1,499 | 89 (12.0%) | 168 (47.1%) |
| $1,500 to $1,999 | 151 (20.3%) | 88 (24.6%) |
| $2,000 to $2,499 | 170 (22.9%) | 17 (4.8%) |
| $2,500 to $2,999 | 30 (4.0%) | 15 (4.2%) |
| $3,000 or more | 88 (11.8%) | 0 (0.0%) |
| Total | 744 (100.0%) | 357 (100.0%) |
Physical Housing Characteristics in Kingston
Housing Structures in Kingston
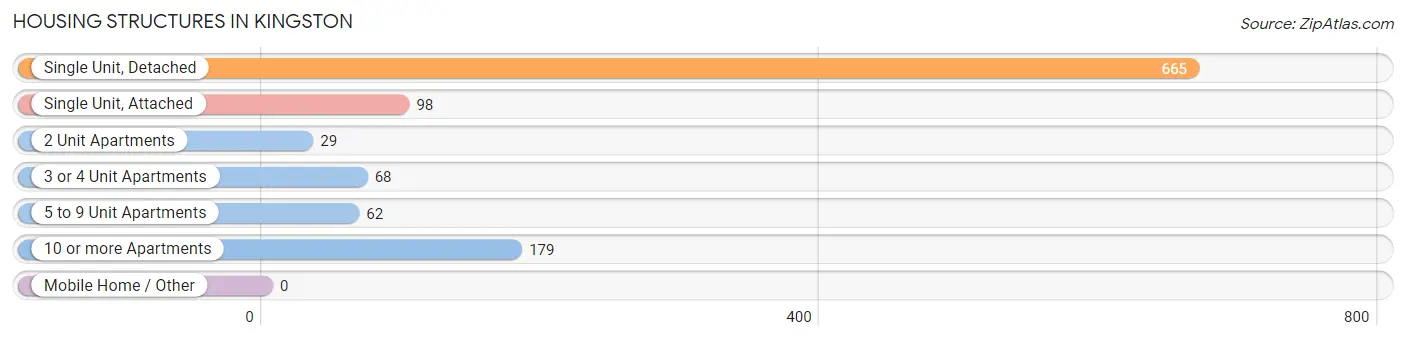
| Structure Type | # Housing Units | % Housing Units |
| Single Unit, Detached | 665 | 60.4% |
| Single Unit, Attached | 98 | 8.9% |
| 2 Unit Apartments | 29 | 2.6% |
| 3 or 4 Unit Apartments | 68 | 6.2% |
| 5 to 9 Unit Apartments | 62 | 5.6% |
| 10 or more Apartments | 179 | 16.3% |
| Mobile Home / Other | 0 | 0.0% |
| Total | 1,101 | 100.0% |
Housing Structures by Occupancy in Kingston
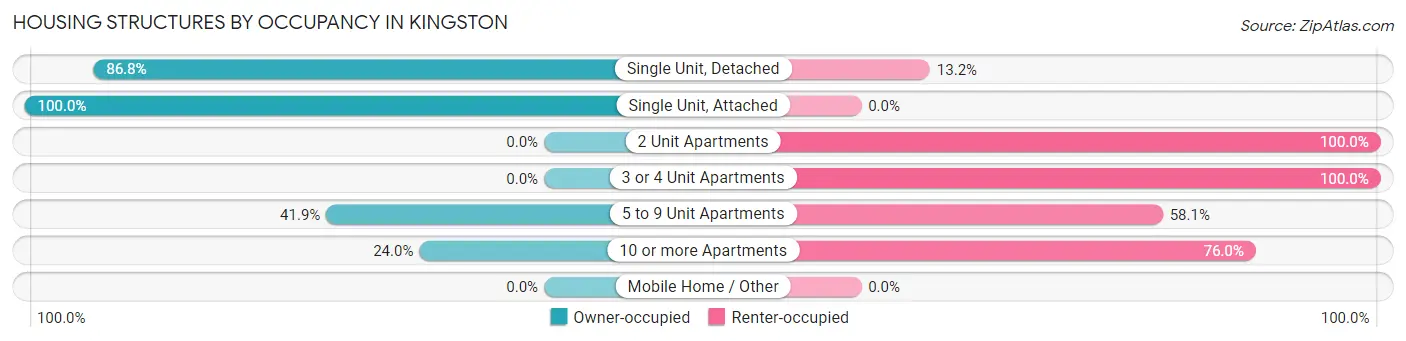
| Structure Type | Owner-occupied | Renter-occupied |
| Single Unit, Detached | 577 (86.8%) | 88 (13.2%) |
| Single Unit, Attached | 98 (100.0%) | 0 (0.0%) |
| 2 Unit Apartments | 0 (0.0%) | 29 (100.0%) |
| 3 or 4 Unit Apartments | 0 (0.0%) | 68 (100.0%) |
| 5 to 9 Unit Apartments | 26 (41.9%) | 36 (58.1%) |
| 10 or more Apartments | 43 (24.0%) | 136 (76.0%) |
| Mobile Home / Other | 0 (0.0%) | 0 (0.0%) |
| Total | 744 (67.6%) | 357 (32.4%) |
Housing Structures by Number of Rooms in Kingston
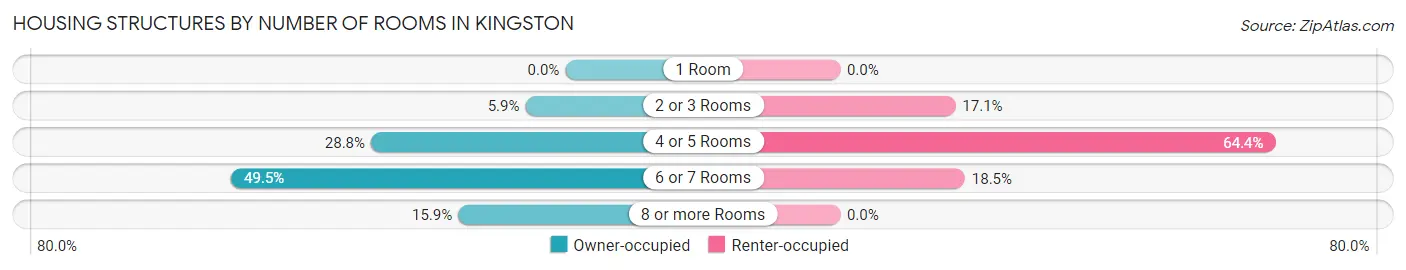
| Number of Rooms | Owner-occupied | Renter-occupied |
| 1 Room | 0 (0.0%) | 0 (0.0%) |
| 2 or 3 Rooms | 44 (5.9%) | 61 (17.1%) |
| 4 or 5 Rooms | 214 (28.8%) | 230 (64.4%) |
| 6 or 7 Rooms | 368 (49.5%) | 66 (18.5%) |
| 8 or more Rooms | 118 (15.9%) | 0 (0.0%) |
| Total | 744 (100.0%) | 357 (100.0%) |
Housing Structure by Heating Type in Kingston
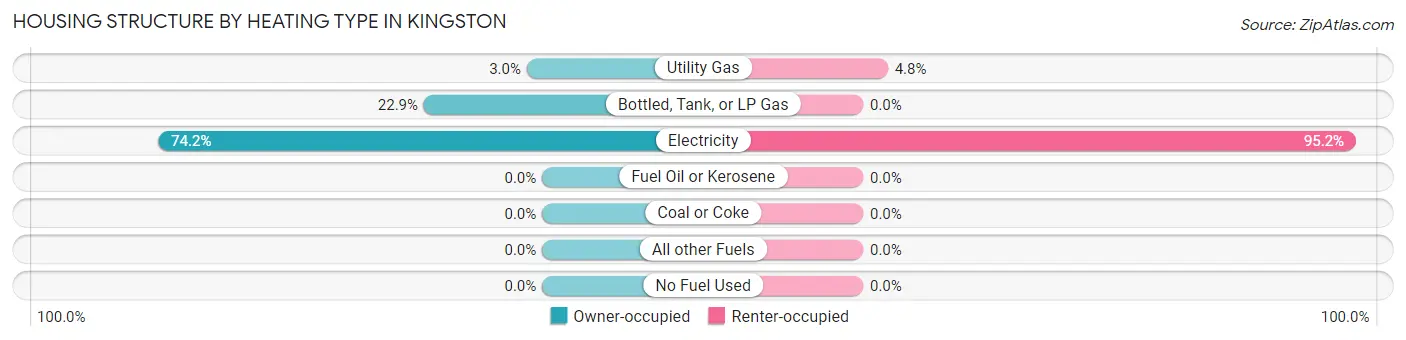
| Heating Type | Owner-occupied | Renter-occupied |
| Utility Gas | 22 (3.0%) | 17 (4.8%) |
| Bottled, Tank, or LP Gas | 170 (22.9%) | 0 (0.0%) |
| Electricity | 552 (74.2%) | 340 (95.2%) |
| Fuel Oil or Kerosene | 0 (0.0%) | 0 (0.0%) |
| Coal or Coke | 0 (0.0%) | 0 (0.0%) |
| All other Fuels | 0 (0.0%) | 0 (0.0%) |
| No Fuel Used | 0 (0.0%) | 0 (0.0%) |
| Total | 744 (100.0%) | 357 (100.0%) |
Household Vehicle Usage in Kingston
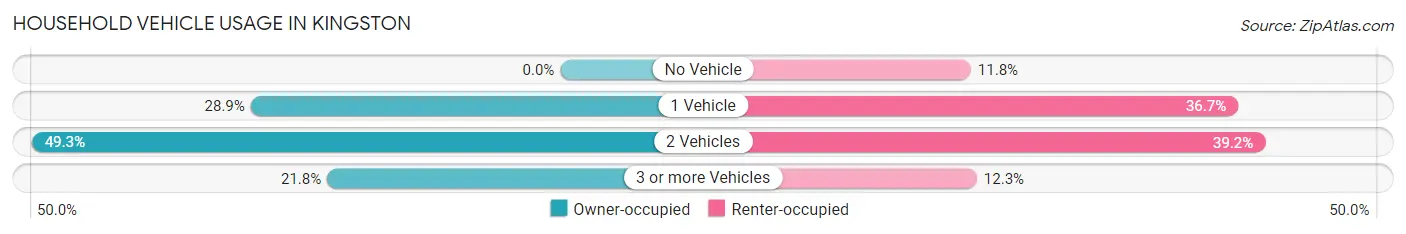
| Vehicles per Household | Owner-occupied | Renter-occupied |
| No Vehicle | 0 (0.0%) | 42 (11.8%) |
| 1 Vehicle | 215 (28.9%) | 131 (36.7%) |
| 2 Vehicles | 367 (49.3%) | 140 (39.2%) |
| 3 or more Vehicles | 162 (21.8%) | 44 (12.3%) |
| Total | 744 (100.0%) | 357 (100.0%) |
Real Estate & Mortgages in Kingston
Real Estate and Mortgage Overview in Kingston
| Characteristic | Without Mortgage | With Mortgage |
| Housing Units | 206 | 538 |
| Median Property Value | $500,000 | $420,000 |
| Median Household Income | $84,107 | $237 |
| Monthly Housing Costs | $793 | $88 |
| Real Estate Taxes | $3,615 | $8 |
Property Value by Mortgage Status in Kingston
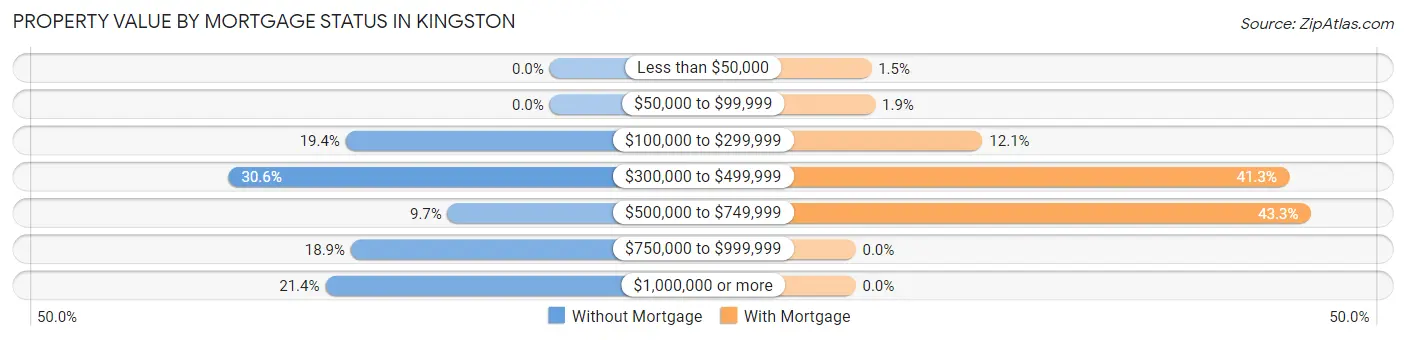
| Property Value | Without Mortgage | With Mortgage |
| Less than $50,000 | 0 (0.0%) | 8 (1.5%) |
| $50,000 to $99,999 | 0 (0.0%) | 10 (1.9%) |
| $100,000 to $299,999 | 40 (19.4%) | 65 (12.1%) |
| $300,000 to $499,999 | 63 (30.6%) | 222 (41.3%) |
| $500,000 to $749,999 | 20 (9.7%) | 233 (43.3%) |
| $750,000 to $999,999 | 39 (18.9%) | 0 (0.0%) |
| $1,000,000 or more | 44 (21.4%) | 0 (0.0%) |
| Total | 206 (100.0%) | 538 (100.0%) |
Household Income by Mortgage Status in Kingston
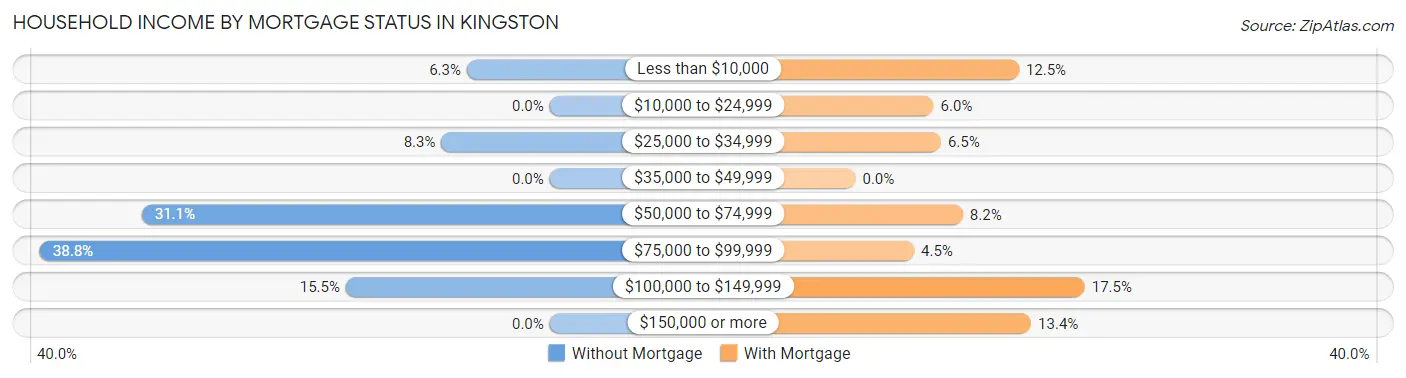
| Household Income | Without Mortgage | With Mortgage |
| Less than $10,000 | 13 (6.3%) | 67 (12.4%) |
| $10,000 to $24,999 | 0 (0.0%) | 32 (5.9%) |
| $25,000 to $34,999 | 17 (8.3%) | 35 (6.5%) |
| $35,000 to $49,999 | 0 (0.0%) | 0 (0.0%) |
| $50,000 to $74,999 | 64 (31.1%) | 44 (8.2%) |
| $75,000 to $99,999 | 80 (38.8%) | 24 (4.5%) |
| $100,000 to $149,999 | 32 (15.5%) | 94 (17.5%) |
| $150,000 or more | 0 (0.0%) | 72 (13.4%) |
| Total | 206 (100.0%) | 538 (100.0%) |
Property Value to Household Income Ratio in Kingston
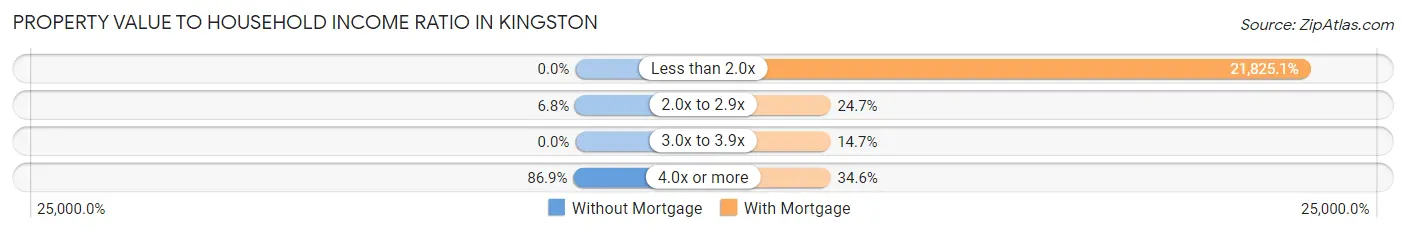
| Value-to-Income Ratio | Without Mortgage | With Mortgage |
| Less than 2.0x | 0 (0.0%) | 117,419 (21,825.1%) |
| 2.0x to 2.9x | 14 (6.8%) | 133 (24.7%) |
| 3.0x to 3.9x | 0 (0.0%) | 79 (14.7%) |
| 4.0x or more | 179 (86.9%) | 186 (34.6%) |
| Total | 206 (100.0%) | 538 (100.0%) |
Real Estate Taxes by Mortgage Status in Kingston
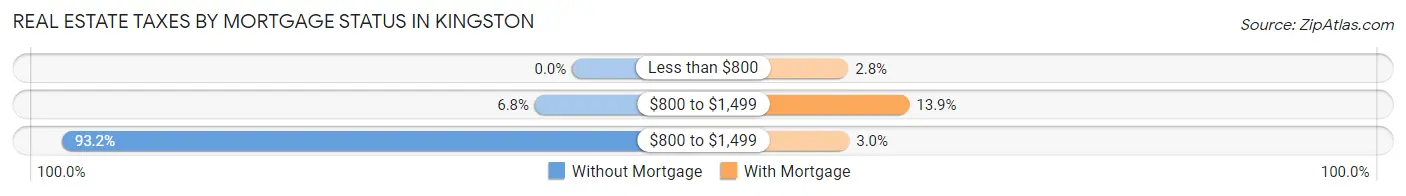
| Property Taxes | Without Mortgage | With Mortgage |
| Less than $800 | 0 (0.0%) | 15 (2.8%) |
| $800 to $1,499 | 14 (6.8%) | 75 (13.9%) |
| $800 to $1,499 | 192 (93.2%) | 16 (3.0%) |
| Total | 206 (100.0%) | 538 (100.0%) |
Health & Disability in Kingston
Health Insurance Coverage by Age in Kingston
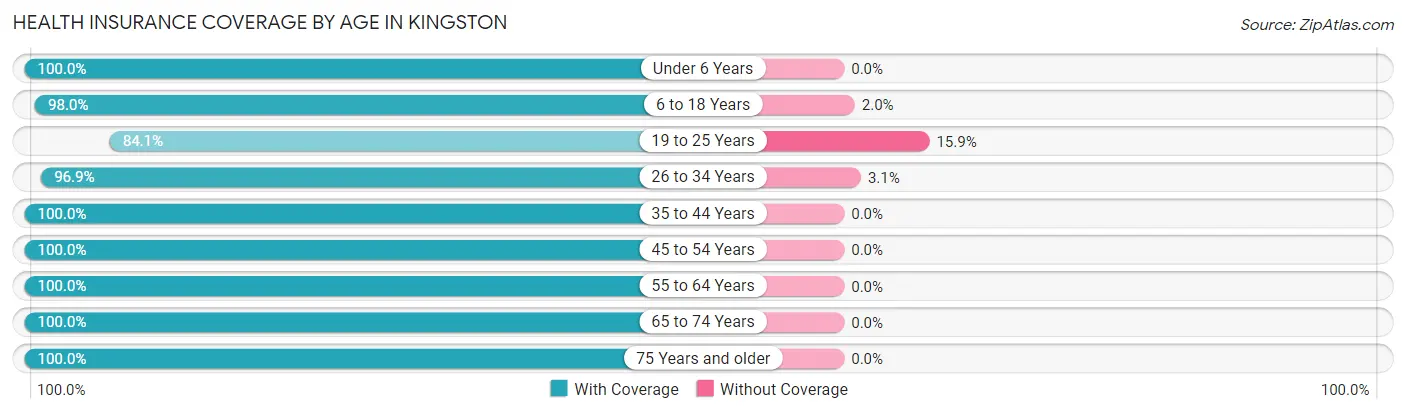
| Age Bracket | With Coverage | Without Coverage |
| Under 6 Years | 186 (100.0%) | 0 (0.0%) |
| 6 to 18 Years | 298 (98.0%) | 6 (2.0%) |
| 19 to 25 Years | 360 (84.1%) | 68 (15.9%) |
| 26 to 34 Years | 312 (96.9%) | 10 (3.1%) |
| 35 to 44 Years | 412 (100.0%) | 0 (0.0%) |
| 45 to 54 Years | 358 (100.0%) | 0 (0.0%) |
| 55 to 64 Years | 424 (100.0%) | 0 (0.0%) |
| 65 to 74 Years | 296 (100.0%) | 0 (0.0%) |
| 75 Years and older | 269 (100.0%) | 0 (0.0%) |
| Total | 2,915 (97.2%) | 84 (2.8%) |
Health Insurance Coverage by Citizenship Status in Kingston
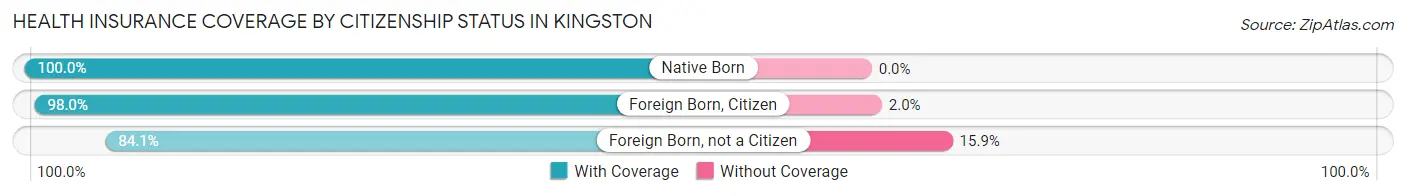
| Citizenship Status | With Coverage | Without Coverage |
| Native Born | 186 (100.0%) | 0 (0.0%) |
| Foreign Born, Citizen | 298 (98.0%) | 6 (2.0%) |
| Foreign Born, not a Citizen | 360 (84.1%) | 68 (15.9%) |
Health Insurance Coverage by Household Income in Kingston
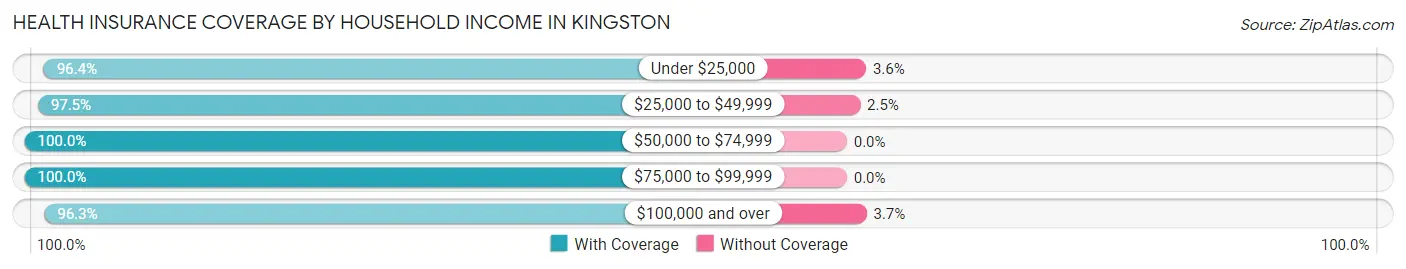
| Household Income | With Coverage | Without Coverage |
| Under $25,000 | 161 (96.4%) | 6 (3.6%) |
| $25,000 to $49,999 | 391 (97.5%) | 10 (2.5%) |
| $50,000 to $74,999 | 201 (100.0%) | 0 (0.0%) |
| $75,000 to $99,999 | 391 (100.0%) | 0 (0.0%) |
| $100,000 and over | 1,771 (96.3%) | 68 (3.7%) |
Public vs Private Health Insurance Coverage by Age in Kingston
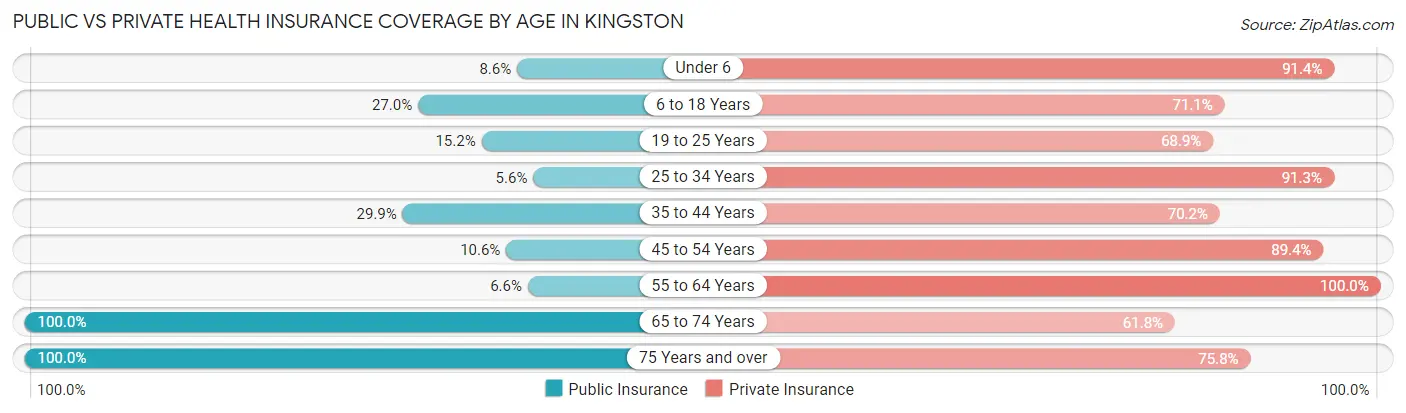
| Age Bracket | Public Insurance | Private Insurance |
| Under 6 | 16 (8.6%) | 170 (91.4%) |
| 6 to 18 Years | 82 (27.0%) | 216 (71.1%) |
| 19 to 25 Years | 65 (15.2%) | 295 (68.9%) |
| 25 to 34 Years | 18 (5.6%) | 294 (91.3%) |
| 35 to 44 Years | 123 (29.8%) | 289 (70.2%) |
| 45 to 54 Years | 38 (10.6%) | 320 (89.4%) |
| 55 to 64 Years | 28 (6.6%) | 424 (100.0%) |
| 65 to 74 Years | 296 (100.0%) | 183 (61.8%) |
| 75 Years and over | 269 (100.0%) | 204 (75.8%) |
| Total | 935 (31.2%) | 2,395 (79.9%) |
Disability Status by Sex by Age in Kingston
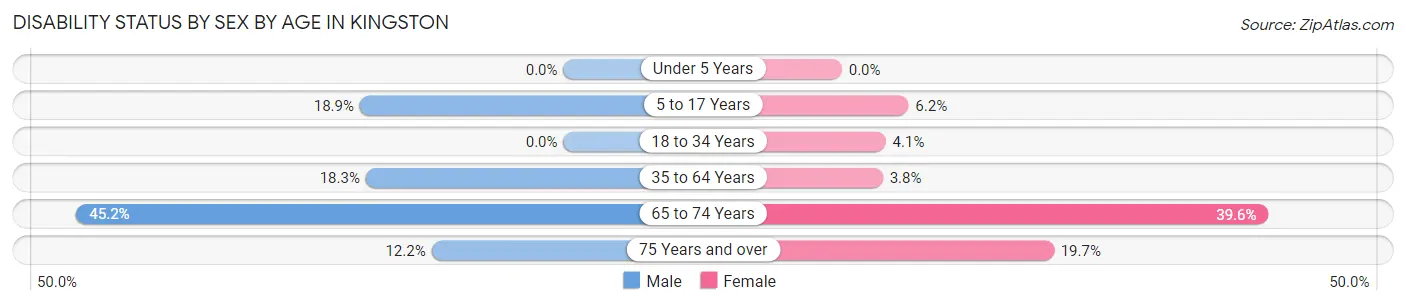
| Age Bracket | Male | Female |
| Under 5 Years | 0 (0.0%) | 0 (0.0%) |
| 5 to 17 Years | 17 (18.9%) | 16 (6.2%) |
| 18 to 34 Years | 0 (0.0%) | 20 (4.1%) |
| 35 to 64 Years | 84 (18.3%) | 28 (3.8%) |
| 65 to 74 Years | 47 (45.2%) | 76 (39.6%) |
| 75 Years and over | 18 (12.2%) | 24 (19.7%) |
Disability Class by Sex by Age in Kingston
Disability Class: Hearing Difficulty
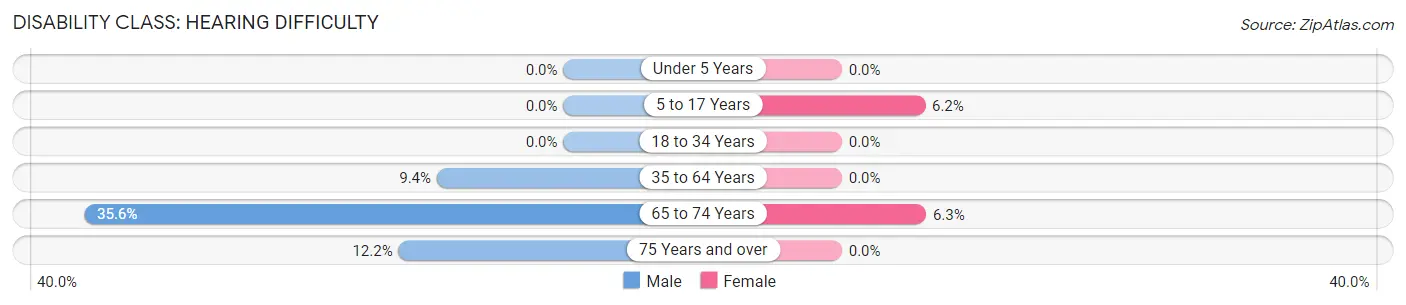
| Age Bracket | Male | Female |
| Under 5 Years | 0 (0.0%) | 0 (0.0%) |
| 5 to 17 Years | 0 (0.0%) | 16 (6.2%) |
| 18 to 34 Years | 0 (0.0%) | 0 (0.0%) |
| 35 to 64 Years | 43 (9.4%) | 0 (0.0%) |
| 65 to 74 Years | 37 (35.6%) | 12 (6.2%) |
| 75 Years and over | 18 (12.2%) | 0 (0.0%) |
Disability Class: Vision Difficulty
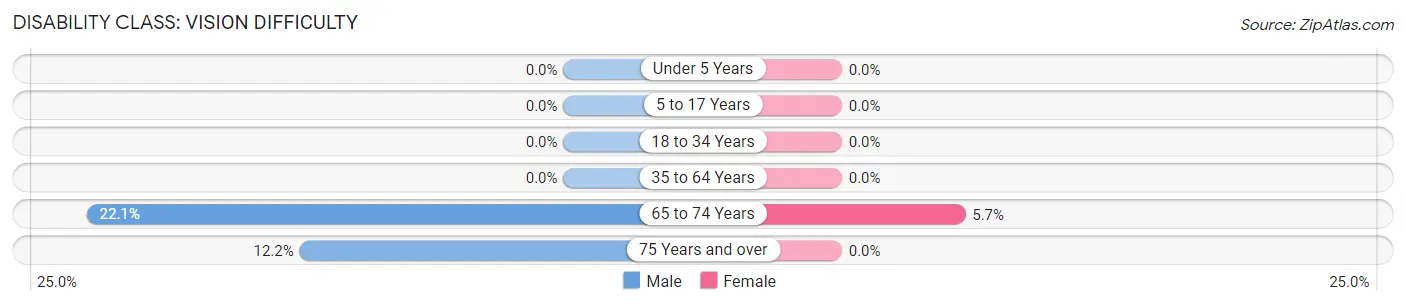
| Age Bracket | Male | Female |
| Under 5 Years | 0 (0.0%) | 0 (0.0%) |
| 5 to 17 Years | 0 (0.0%) | 0 (0.0%) |
| 18 to 34 Years | 0 (0.0%) | 0 (0.0%) |
| 35 to 64 Years | 0 (0.0%) | 0 (0.0%) |
| 65 to 74 Years | 23 (22.1%) | 11 (5.7%) |
| 75 Years and over | 18 (12.2%) | 0 (0.0%) |
Disability Class: Cognitive Difficulty
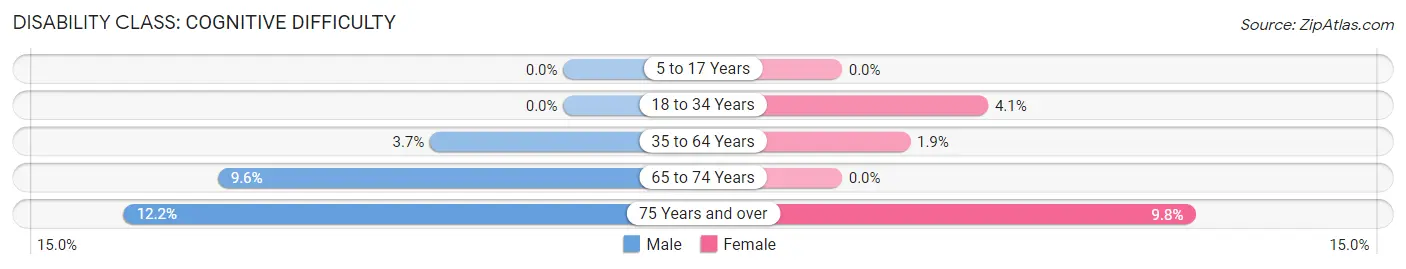
| Age Bracket | Male | Female |
| 5 to 17 Years | 0 (0.0%) | 0 (0.0%) |
| 18 to 34 Years | 0 (0.0%) | 20 (4.1%) |
| 35 to 64 Years | 17 (3.7%) | 14 (1.9%) |
| 65 to 74 Years | 10 (9.6%) | 0 (0.0%) |
| 75 Years and over | 18 (12.2%) | 12 (9.8%) |
Disability Class: Ambulatory Difficulty
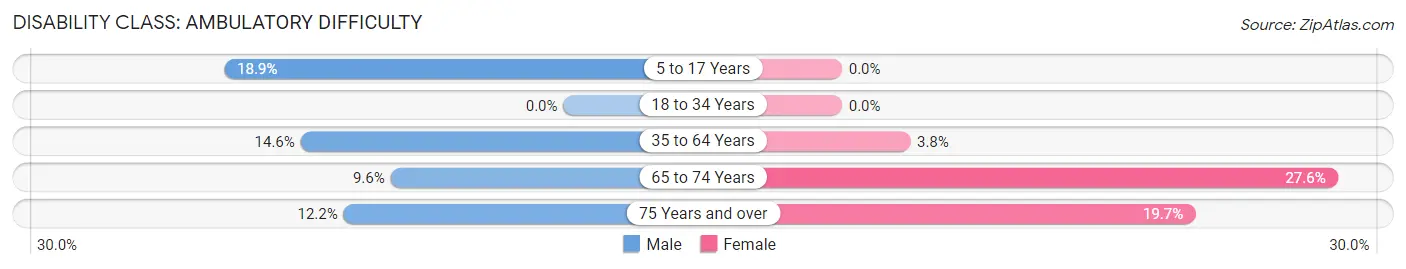
| Age Bracket | Male | Female |
| 5 to 17 Years | 17 (18.9%) | 0 (0.0%) |
| 18 to 34 Years | 0 (0.0%) | 0 (0.0%) |
| 35 to 64 Years | 67 (14.6%) | 28 (3.8%) |
| 65 to 74 Years | 10 (9.6%) | 53 (27.6%) |
| 75 Years and over | 18 (12.2%) | 24 (19.7%) |
Disability Class: Self-Care Difficulty
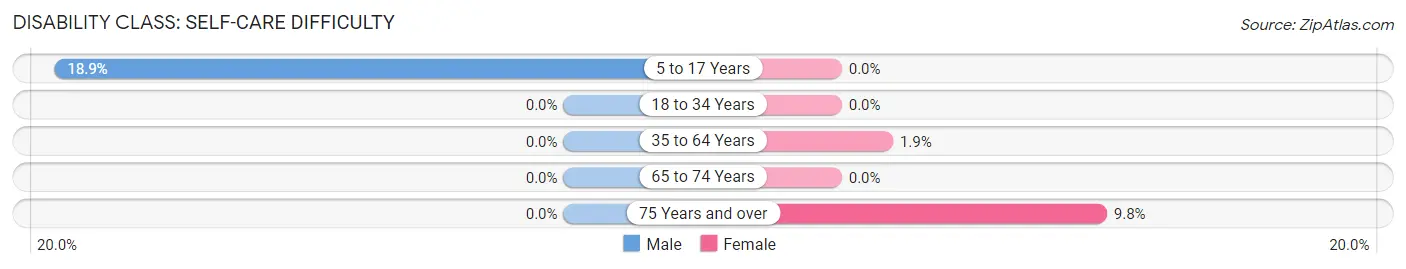
| Age Bracket | Male | Female |
| 5 to 17 Years | 17 (18.9%) | 0 (0.0%) |
| 18 to 34 Years | 0 (0.0%) | 0 (0.0%) |
| 35 to 64 Years | 0 (0.0%) | 14 (1.9%) |
| 65 to 74 Years | 0 (0.0%) | 0 (0.0%) |
| 75 Years and over | 0 (0.0%) | 12 (9.8%) |
Technology Access in Kingston
Computing Device Access in Kingston
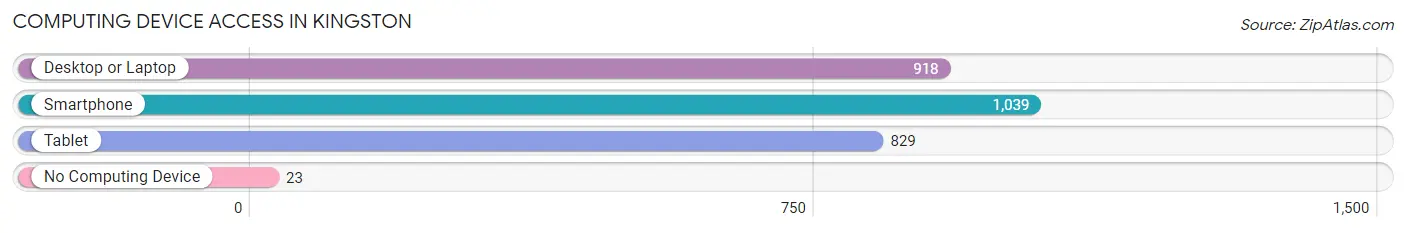
| Device Type | # Households | % Households |
| Desktop or Laptop | 918 | 83.4% |
| Smartphone | 1,039 | 94.4% |
| Tablet | 829 | 75.3% |
| No Computing Device | 23 | 2.1% |
| Total | 1,101 | 100.0% |
Internet Access in Kingston
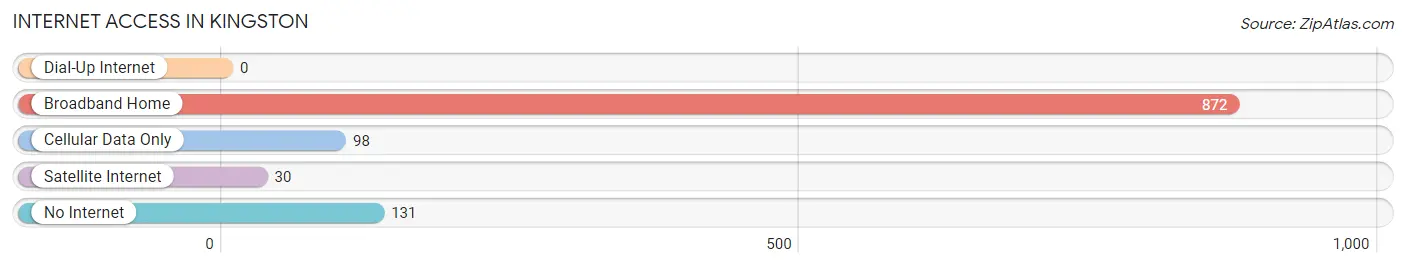
| Internet Type | # Households | % Households |
| Dial-Up Internet | 0 | 0.0% |
| Broadband Home | 872 | 79.2% |
| Cellular Data Only | 98 | 8.9% |
| Satellite Internet | 30 | 2.7% |
| No Internet | 131 | 11.9% |
| Total | 1,101 | 100.0% |
Kingston Summary
Kingston is a small town located in Kitsap County, Washington, United States. It is situated on the Kitsap Peninsula, approximately 25 miles northwest of Seattle. The population of Kingston was 2,099 at the 2010 census.
History
The area that is now Kingston was first settled in the late 1800s by a group of Scandinavian immigrants. The town was originally called Appletree Cove, but was later renamed Kingston in honor of the first postmaster, William Kingston. The town was officially incorporated in 1951.
Geography
Kingston is located at 47°45'N 122°37'W (47.75, -122.62). It is situated on the Kitsap Peninsula, approximately 25 miles northwest of Seattle. The town is bordered by the Hood Canal to the west and the Puget Sound to the east. The town is located in a temperate rainforest climate, with mild temperatures and abundant rainfall.
Economy
The economy of Kingston is largely based on tourism and recreation. The town is home to several marinas, which attract visitors from around the region. The town is also home to a number of small businesses, including restaurants, shops, and galleries.
Demographics
As of the 2010 census, the population of Kingston was 2,099. The racial makeup of the town was 94.2% White, 0.7% African American, 0.7% Native American, 0.7% Asian, 0.2% Pacific Islander, 0.7% from other races, and 2.4% from two or more races. Hispanic or Latino of any race were 3.3% of the population.
The median income for a household in Kingston was $50,938, and the median income for a family was $60,000. The per capita income for the town was $25,938. About 8.2% of families and 10.2% of the population were below the poverty line, including 14.3% of those under age 18 and 4.2% of those age 65 or over.
Common Questions
What is the Total Population of Kingston?
Total Population of Kingston is 2,999.
What is the Total Male Population of Kingston?
Total Male Population of Kingston is 1,171.
What is the Total Female Population of Kingston?
Total Female Population of Kingston is 1,828.
What is the Ratio of Males per 100 Females in Kingston?
There are 64.06 Males per 100 Females in Kingston.
What is the Ratio of Females per 100 Males in Kingston?
There are 156.11 Females per 100 Males in Kingston.
What is the Median Population Age in Kingston?
Median Population Age in Kingston is 43.3 Years.
What is the Average Family Size in Kingston
Average Family Size in Kingston is 3.1 People.
What is the Average Household Size in Kingston
Average Household Size in Kingston is 2.7 People.
What is Per Capita Income in Kingston?
Per Capita income in Kingston is $42,308.
What is the Median Family Income in Kingston?
Median Family Income in Kingston is $98,077.
What is the Median Household income in Kingston?
Median Household Income in Kingston is $96,645.
What is Income or Wage Gap in Kingston?
Income or Wage Gap in Kingston is 55.9%.
Women in Kingston earn 44.1 cents for every dollar earned by a man.
What is Inequality or Gini Index in Kingston?
Inequality or Gini Index in Kingston is 0.38.
How Large is the Labor Force in Kingston?
There are 1,647 People in the Labor Forcein in Kingston.
What is the Percentage of People in the Labor Force in Kingston?
64.2% of People are in the Labor Force in Kingston.
What is the Unemployment Rate in Kingston?
Unemployment Rate in Kingston is 4.6%.