Zip Codes with the Highest Percentage of Population Employed in Life, Physical & Social Science in Richland, WA
RELATED REPORTS & OPTIONS
Life, Physical & Social Science
Richland
Compare Zip Codes
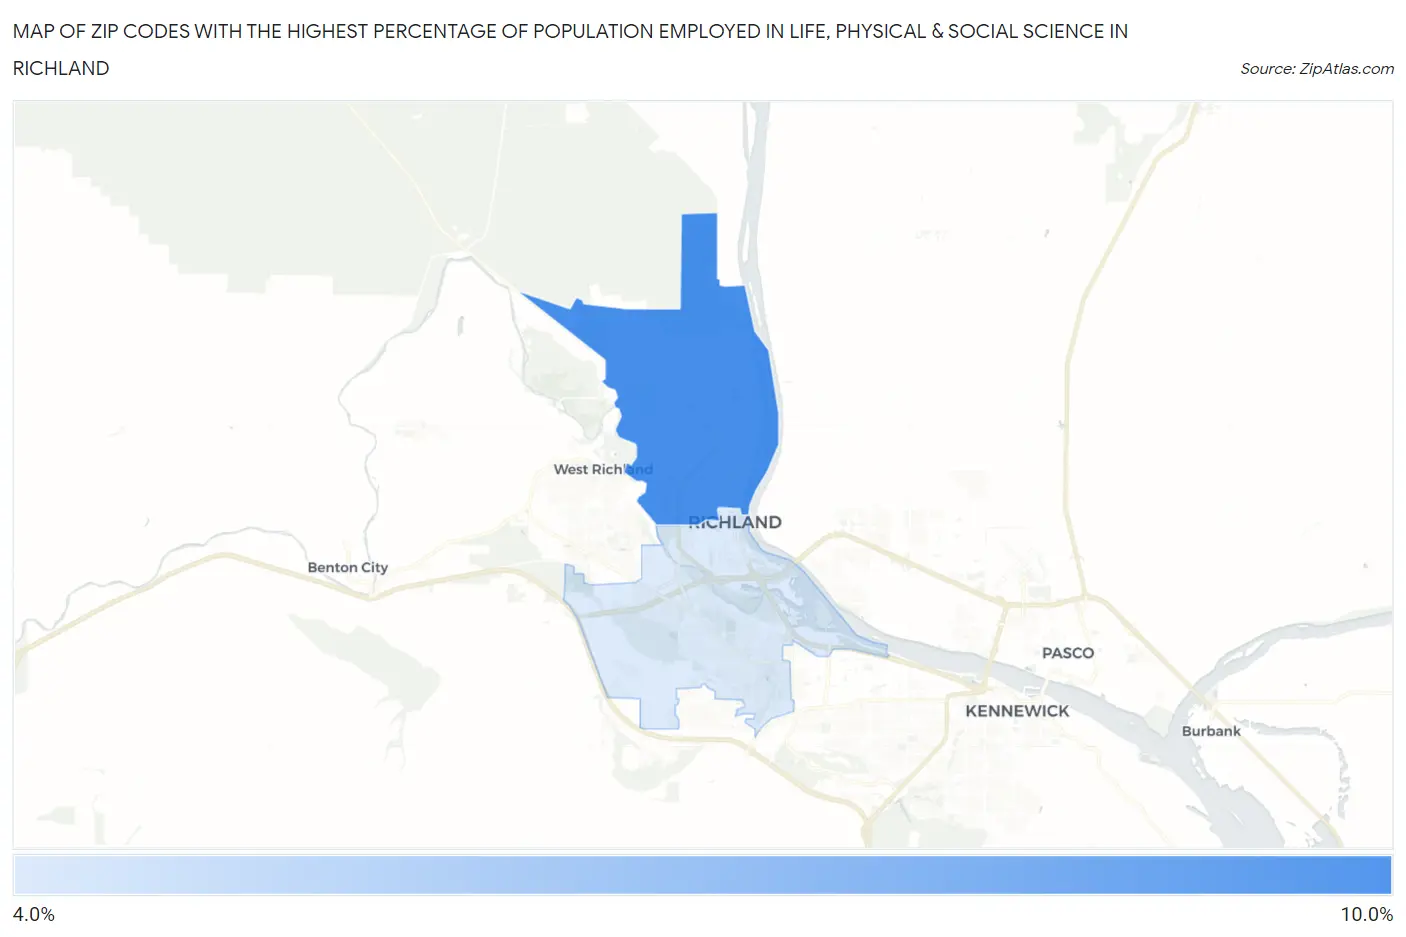
Map of Zip Codes with the Highest Percentage of Population Employed in Life, Physical & Social Science in Richland
0.0%
10.0%
Zip Codes with the Highest Percentage of Population Employed in Life, Physical & Social Science in Richland, WA
| Zip Code | % Employed | vs State | vs National | |
| 1. | 99354 | 8.1% | 1.3%(+6.78)#16 | 1.1%(+7.00)#316 |
| 2. | 99352 | 4.9% | 1.3%(+3.64)#30 | 1.1%(+3.86)#775 |
1
Common Questions
What are the Top Zip Codes with the Highest Percentage of Population Employed in Life, Physical & Social Science in Richland, WA?
Top Zip Codes with the Highest Percentage of Population Employed in Life, Physical & Social Science in Richland, WA are:
What zip code has the Highest Percentage of Population Employed in Life, Physical & Social Science in Richland, WA?
99354 has the Highest Percentage of Population Employed in Life, Physical & Social Science in Richland, WA with 8.1%.
What is the Percentage of Population Employed in Life, Physical & Social Science in Richland, WA?
Percentage of Population Employed in Life, Physical & Social Science in Richland is 6.2%.
What is the Percentage of Population Employed in Life, Physical & Social Science in Washington?
Percentage of Population Employed in Life, Physical & Social Science in Washington is 1.3%.
What is the Percentage of Population Employed in Life, Physical & Social Science in the United States?
Percentage of Population Employed in Life, Physical & Social Science in the United States is 1.1%.