Bangor Base, WA
Bangor Base Map
Bangor Base Overview
6,045
TOTAL POPULATION
3,972
MALE POPULATION
2,073
FEMALE POPULATION
191.61
MALES / 100 FEMALES
52.19
FEMALES / 100 MALES
22.8
MEDIAN AGE
3.5
AVG FAMILY SIZE
3.4
AVG HOUSEHOLD SIZE
$27,091
PER CAPITA INCOME
$82,500
AVG FAMILY INCOME
$76,806
AVG HOUSEHOLD INCOME
18.2%
WAGE / INCOME GAP [ % ]
81.8¢/ $1
WAGE / INCOME GAP [ $ ]
0.26
INEQUALITY / GINI INDEX
3,937
LABOR FORCE [ PEOPLE ]
86.6%
PERCENT IN LABOR FORCE
3.4%
UNEMPLOYMENT RATE
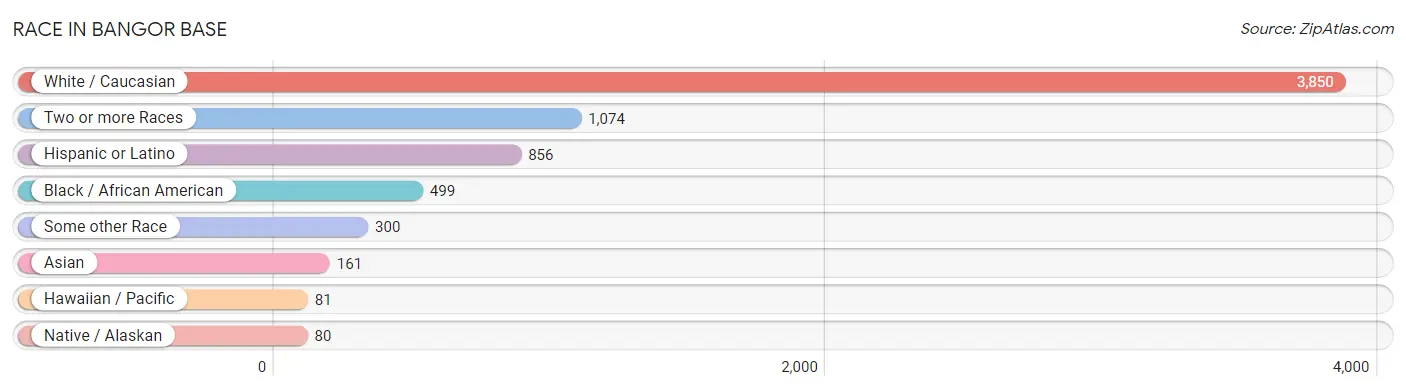
Race in Bangor Base
The most populous races in Bangor Base are White / Caucasian (3,850 | 63.7%), Two or more Races (1,074 | 17.8%), and Hispanic or Latino (856 | 14.2%).
| Race | # Population | % Population |
| Asian | 161 | 2.7% |
| Black / African American | 499 | 8.3% |
| Hawaiian / Pacific | 81 | 1.3% |
| Hispanic or Latino | 856 | 14.2% |
| Native / Alaskan | 80 | 1.3% |
| White / Caucasian | 3,850 | 63.7% |
| Two or more Races | 1,074 | 17.8% |
| Some other Race | 300 | 5.0% |
| Total | 6,045 | 100.0% |
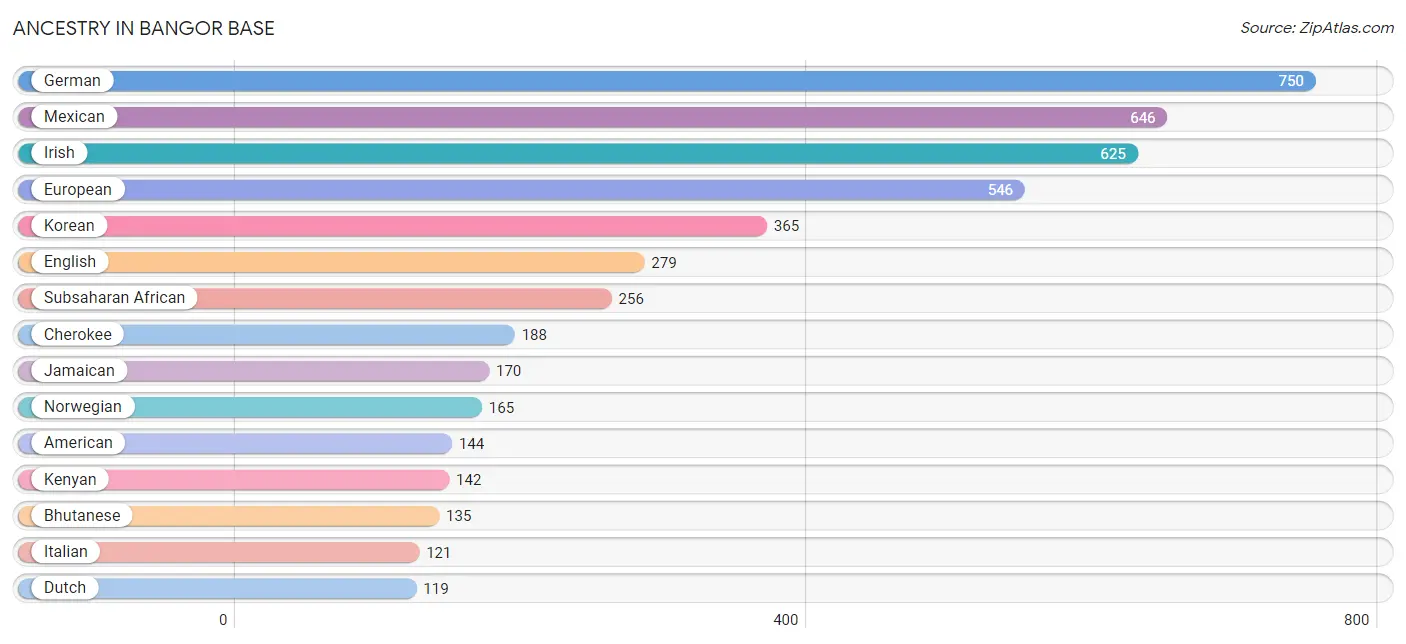
Ancestry in Bangor Base
The most populous ancestries reported in Bangor Base are German (750 | 12.4%), Mexican (646 | 10.7%), Irish (625 | 10.3%), European (546 | 9.0%), and Korean (365 | 6.0%), together accounting for 48.5% of all Bangor Base residents.
| Ancestry | # Population | % Population |
| African | 88 | 1.5% |
| American | 144 | 2.4% |
| Belgian | 11 | 0.2% |
| Bhutanese | 135 | 2.2% |
| Burmese | 100 | 1.7% |
| Canadian | 7 | 0.1% |
| Central American | 15 | 0.3% |
| Cherokee | 188 | 3.1% |
| Colombian | 7 | 0.1% |
| Cuban | 52 | 0.9% |
| Czech | 6 | 0.1% |
| Danish | 19 | 0.3% |
| Dutch | 119 | 2.0% |
| English | 279 | 4.6% |
| European | 546 | 9.0% |
| Finnish | 5 | 0.1% |
| French | 53 | 0.9% |
| German | 750 | 12.4% |
| Greek | 24 | 0.4% |
| Guamanian / Chamorro | 37 | 0.6% |
| Guatemalan | 15 | 0.3% |
| Hungarian | 32 | 0.5% |
| Indian (Asian) | 14 | 0.2% |
| Iranian | 32 | 0.5% |
| Irish | 625 | 10.3% |
| Italian | 121 | 2.0% |
| Jamaican | 170 | 2.8% |
| Kenyan | 142 | 2.4% |
| Korean | 365 | 6.0% |
| Mexican | 646 | 10.7% |
| Native Hawaiian | 9 | 0.2% |
| Navajo | 12 | 0.2% |
| Northern European | 5 | 0.1% |
| Norwegian | 165 | 2.7% |
| Pakistani | 5 | 0.1% |
| Polish | 51 | 0.8% |
| Puerto Rican | 87 | 1.4% |
| Russian | 48 | 0.8% |
| Samoan | 74 | 1.2% |
| Scandinavian | 15 | 0.3% |
| Scotch-Irish | 8 | 0.1% |
| Scottish | 30 | 0.5% |
| Somali | 26 | 0.4% |
| South American | 7 | 0.1% |
| Spaniard | 29 | 0.5% |
| Spanish | 5 | 0.1% |
| Sri Lankan | 57 | 0.9% |
| Subsaharan African | 256 | 4.2% |
| Swedish | 81 | 1.3% |
| Swiss | 1 | 0.0% |
| Ukrainian | 61 | 1.0% |
| Welsh | 7 | 0.1% | View All 52 Rows |
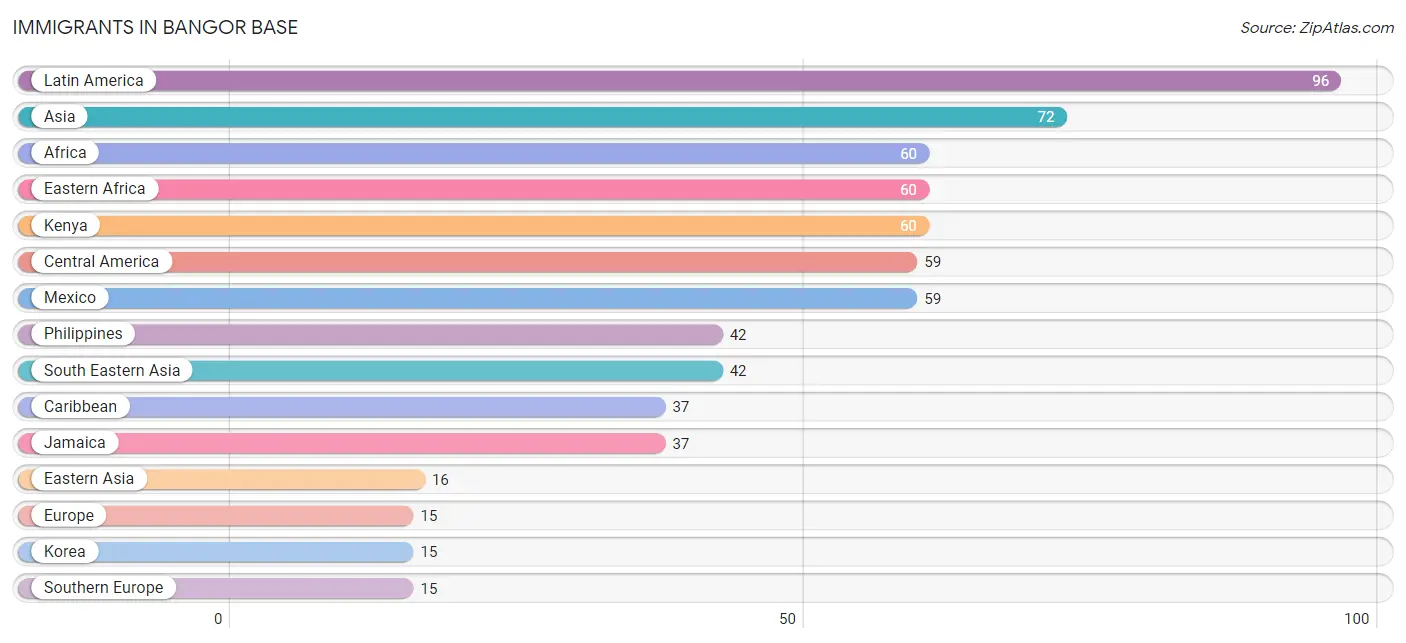
Immigrants in Bangor Base
The most numerous immigrant groups reported in Bangor Base came from Latin America (96 | 1.6%), Asia (72 | 1.2%), Africa (60 | 1.0%), Eastern Africa (60 | 1.0%), and Kenya (60 | 1.0%), together accounting for 5.8% of all Bangor Base residents.
| Immigration Origin | # Population | % Population |
| Africa | 60 | 1.0% |
| Asia | 72 | 1.2% |
| Canada | 10 | 0.2% |
| Caribbean | 37 | 0.6% |
| Central America | 59 | 1.0% |
| Eastern Africa | 60 | 1.0% |
| Eastern Asia | 16 | 0.3% |
| Europe | 15 | 0.3% |
| Jamaica | 37 | 0.6% |
| Japan | 1 | 0.0% |
| Kenya | 60 | 1.0% |
| Korea | 15 | 0.3% |
| Latin America | 96 | 1.6% |
| Mexico | 59 | 1.0% |
| Nepal | 14 | 0.2% |
| Philippines | 42 | 0.7% |
| South Central Asia | 14 | 0.2% |
| South Eastern Asia | 42 | 0.7% |
| Southern Europe | 15 | 0.3% |
| Spain | 15 | 0.3% | View All 20 Rows |
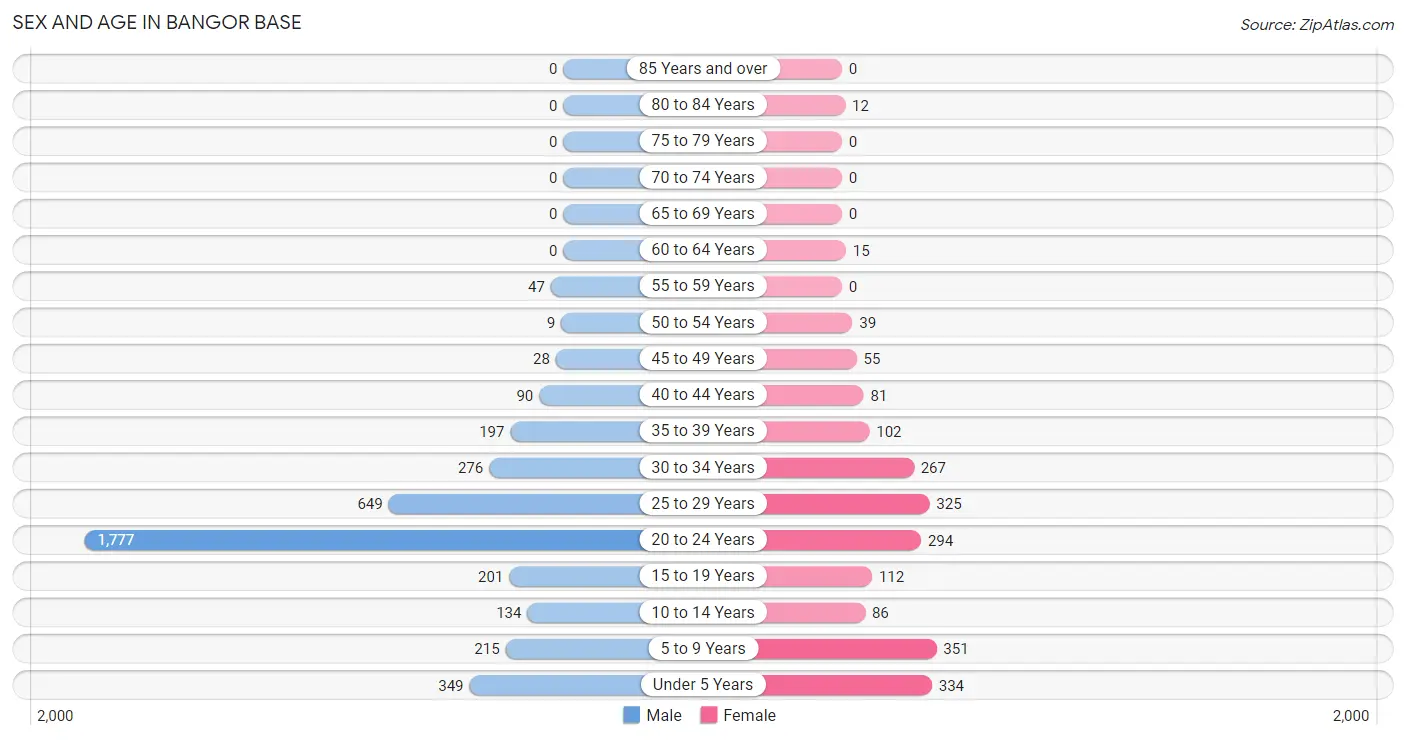
Sex and Age in Bangor Base
Sex and Age in Bangor Base
The most populous age groups in Bangor Base are 20 to 24 Years (1,777 | 44.7%) for men and 5 to 9 Years (351 | 16.9%) for women.
| Age Bracket | Male | Female |
| Under 5 Years | 349 (8.8%) | 334 (16.1%) |
| 5 to 9 Years | 215 (5.4%) | 351 (16.9%) |
| 10 to 14 Years | 134 (3.4%) | 86 (4.2%) |
| 15 to 19 Years | 201 (5.1%) | 112 (5.4%) |
| 20 to 24 Years | 1,777 (44.7%) | 294 (14.2%) |
| 25 to 29 Years | 649 (16.3%) | 325 (15.7%) |
| 30 to 34 Years | 276 (7.0%) | 267 (12.9%) |
| 35 to 39 Years | 197 (5.0%) | 102 (4.9%) |
| 40 to 44 Years | 90 (2.3%) | 81 (3.9%) |
| 45 to 49 Years | 28 (0.7%) | 55 (2.6%) |
| 50 to 54 Years | 9 (0.2%) | 39 (1.9%) |
| 55 to 59 Years | 47 (1.2%) | 0 (0.0%) |
| 60 to 64 Years | 0 (0.0%) | 15 (0.7%) |
| 65 to 69 Years | 0 (0.0%) | 0 (0.0%) |
| 70 to 74 Years | 0 (0.0%) | 0 (0.0%) |
| 75 to 79 Years | 0 (0.0%) | 0 (0.0%) |
| 80 to 84 Years | 0 (0.0%) | 12 (0.6%) |
| 85 Years and over | 0 (0.0%) | 0 (0.0%) |
| Total | 3,972 (100.0%) | 2,073 (100.0%) |
Families and Households in Bangor Base
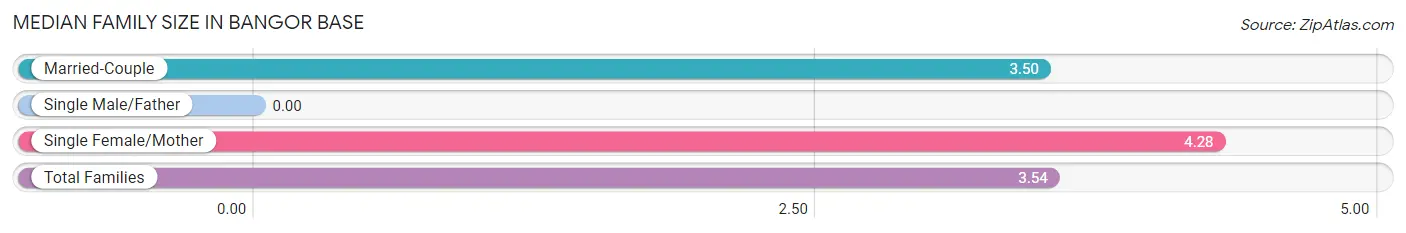
Median Family Size in Bangor Base
| Family Type | # Families | Family Size |
| Married-Couple | 951 (95.7%) | 3.50 |
| Single Male/Father | 0 (0.0%) | - |
| Single Female/Mother | 43 (4.3%) | 4.28 |
| Total Families | 994 (100.0%) | 3.54 |
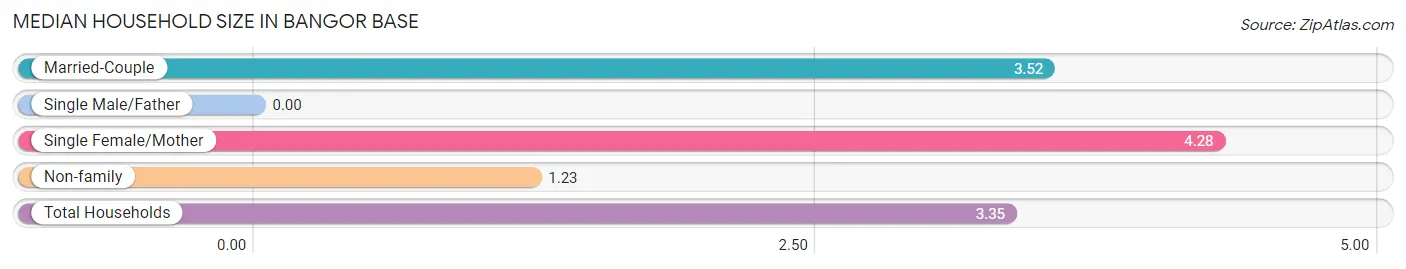
Median Household Size in Bangor Base
| Household Type | # Households | Household Size |
| Married-Couple | 951 (87.6%) | 3.52 |
| Single Male/Father | 0 (0.0%) | - |
| Single Female/Mother | 43 (4.0%) | 4.28 |
| Non-family | 92 (8.5%) | 1.23 |
| Total Households | 1,086 (100.0%) | 3.35 |
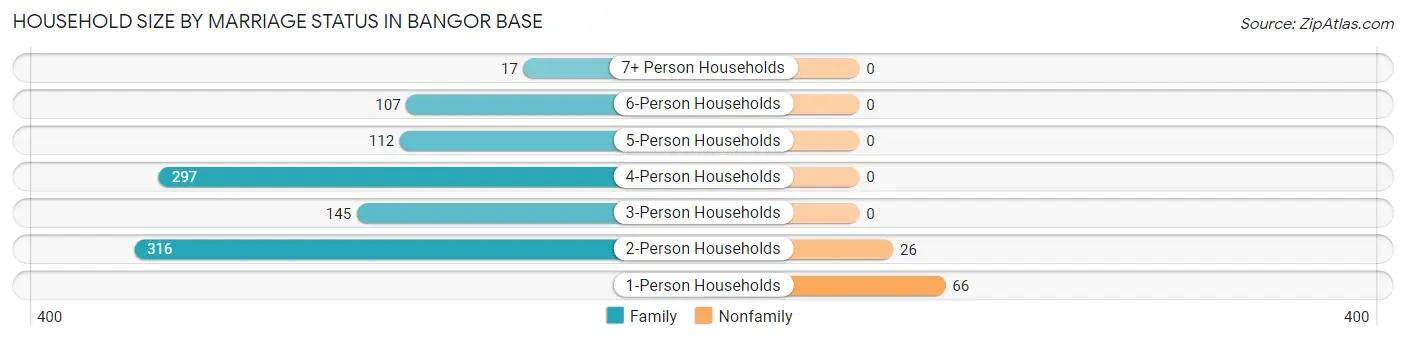
Household Size by Marriage Status in Bangor Base
Out of a total of 1,086 households in Bangor Base, 994 (91.5%) are family households, while 92 (8.5%) are nonfamily households. The most numerous type of family households are 2-person households, comprising 316, and the most common type of nonfamily households are 1-person households, comprising 66.
| Household Size | Family Households | Nonfamily Households |
| 1-Person Households | - | 66 (6.1%) |
| 2-Person Households | 316 (29.1%) | 26 (2.4%) |
| 3-Person Households | 145 (13.4%) | 0 (0.0%) |
| 4-Person Households | 297 (27.4%) | 0 (0.0%) |
| 5-Person Households | 112 (10.3%) | 0 (0.0%) |
| 6-Person Households | 107 (9.9%) | 0 (0.0%) |
| 7+ Person Households | 17 (1.6%) | 0 (0.0%) |
| Total | 994 (91.5%) | 92 (8.5%) |
Female Fertility in Bangor Base
Fertility by Age in Bangor Base
Average fertility rate in Bangor Base is 114.0 births per 1,000 women. Women in the age bracket of 20 to 34 years have the highest fertility rate with 160.0 births per 1,000 women. Women in the age bracket of 20 to 34 years acount for 100.0% of all women with births.
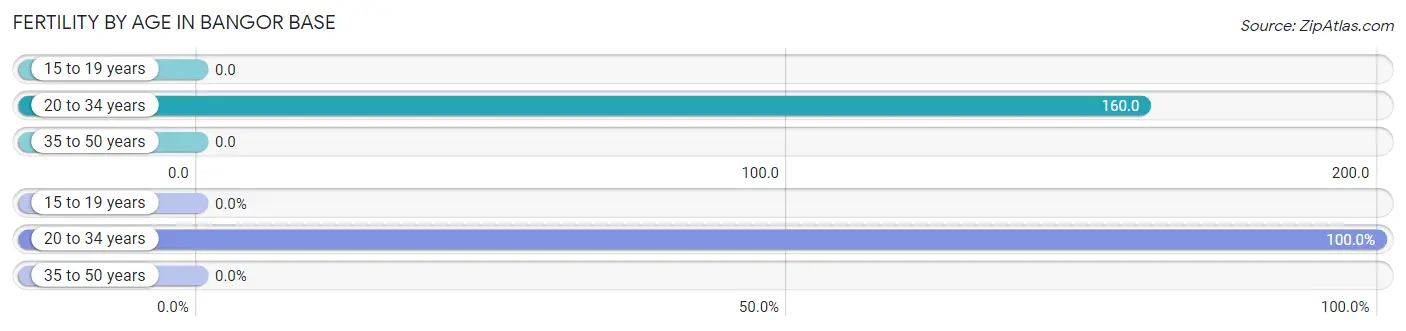
| Age Bracket | Women with Births | Births / 1,000 Women |
| 15 to 19 years | 0 (0.0%) | 0.0 |
| 20 to 34 years | 142 (100.0%) | 160.0 |
| 35 to 50 years | 0 (0.0%) | 0.0 |
| Total | 142 (100.0%) | 114.0 |
Fertility by Age by Marriage Status in Bangor Base
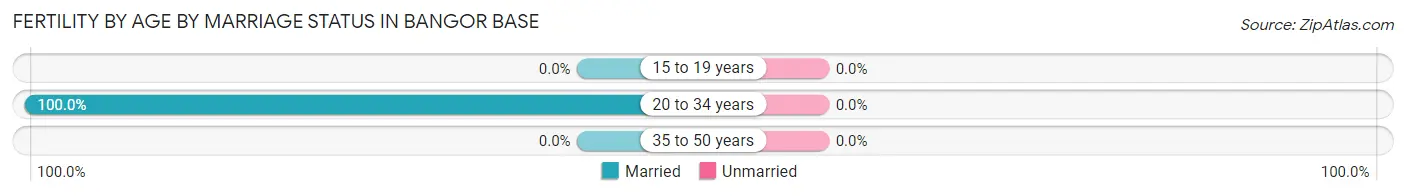
| Age Bracket | Married | Unmarried |
| 15 to 19 years | 0 (0.0%) | 0 (0.0%) |
| 20 to 34 years | 142 (100.0%) | 0 (0.0%) |
| 35 to 50 years | 0 (0.0%) | 0 (0.0%) |
| Total | 142 (100.0%) | 0 (0.0%) |
Fertility by Education in Bangor Base
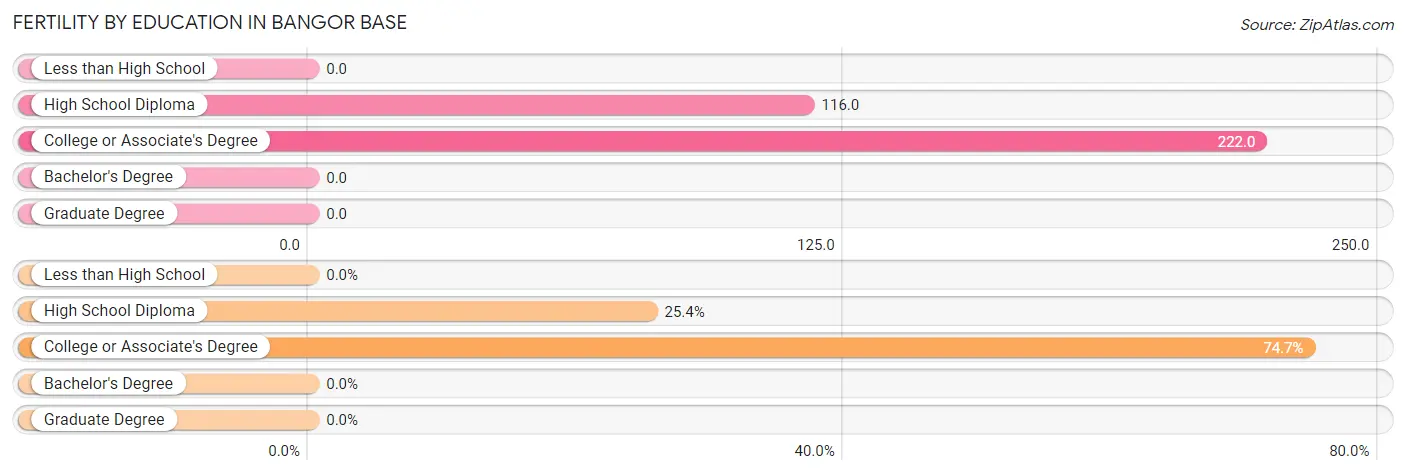
| Educational Attainment | Women with Births | Births / 1,000 Women |
| Less than High School | 0 (0.0%) | 0.0 |
| High School Diploma | 36 (25.4%) | 116.0 |
| College or Associate's Degree | 106 (74.7%) | 222.0 |
| Bachelor's Degree | 0 (0.0%) | 0.0 |
| Graduate Degree | 0 (0.0%) | 0.0 |
| Total | 142 (100.0%) | 114.0 |
Fertility by Education by Marriage Status in Bangor Base
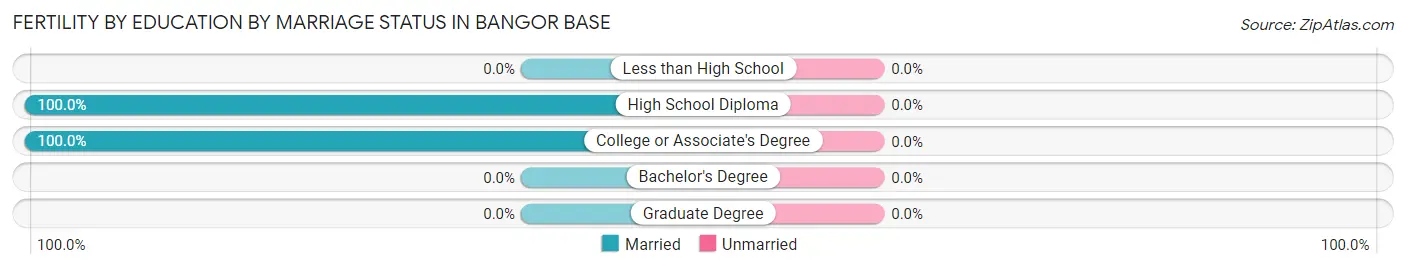
| Educational Attainment | Married | Unmarried |
| Less than High School | 0 (0.0%) | 0 (0.0%) |
| High School Diploma | 36 (100.0%) | 0 (0.0%) |
| College or Associate's Degree | 106 (100.0%) | 0 (0.0%) |
| Bachelor's Degree | 0 (0.0%) | 0 (0.0%) |
| Graduate Degree | 0 (0.0%) | 0 (0.0%) |
| Total | 142 (100.0%) | 0 (0.0%) |
Income in Bangor Base
Income Overview in Bangor Base
Per Capita Income in Bangor Base is $27,091, while median incomes of families and households are $82,500 and $76,806 respectively.
| Characteristic | Number | Measure |
| Per Capita Income | 6,045 | $27,091 |
| Median Family Income | 994 | $82,500 |
| Mean Family Income | 994 | $86,527 |
| Median Household Income | 1,086 | $76,806 |
| Mean Household Income | 1,086 | $86,046 |
| Income Deficit | 994 | $0 |
| Wage / Income Gap (%) | 6,045 | 18.17% |
| Wage / Income Gap ($) | 6,045 | 81.83¢ per $1 |
| Gini / Inequality Index | 6,045 | 0.26 |
Earnings by Sex in Bangor Base
Average Earnings in Bangor Base are $29,301, $30,466 for men and $24,931 for women, a difference of 18.2%.
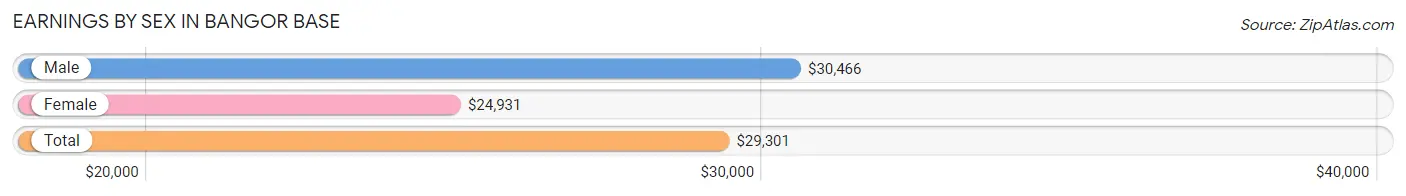
| Sex | Number | Average Earnings |
| Male | 3,220 (80.3%) | $30,466 |
| Female | 790 (19.7%) | $24,931 |
| Total | 4,010 (100.0%) | $29,301 |
Earnings by Sex by Income Bracket in Bangor Base
The most common earnings brackets in Bangor Base are $25,000 to $29,999 for men (860 | 26.7%) and $25,000 to $29,999 for women (145 | 18.3%).
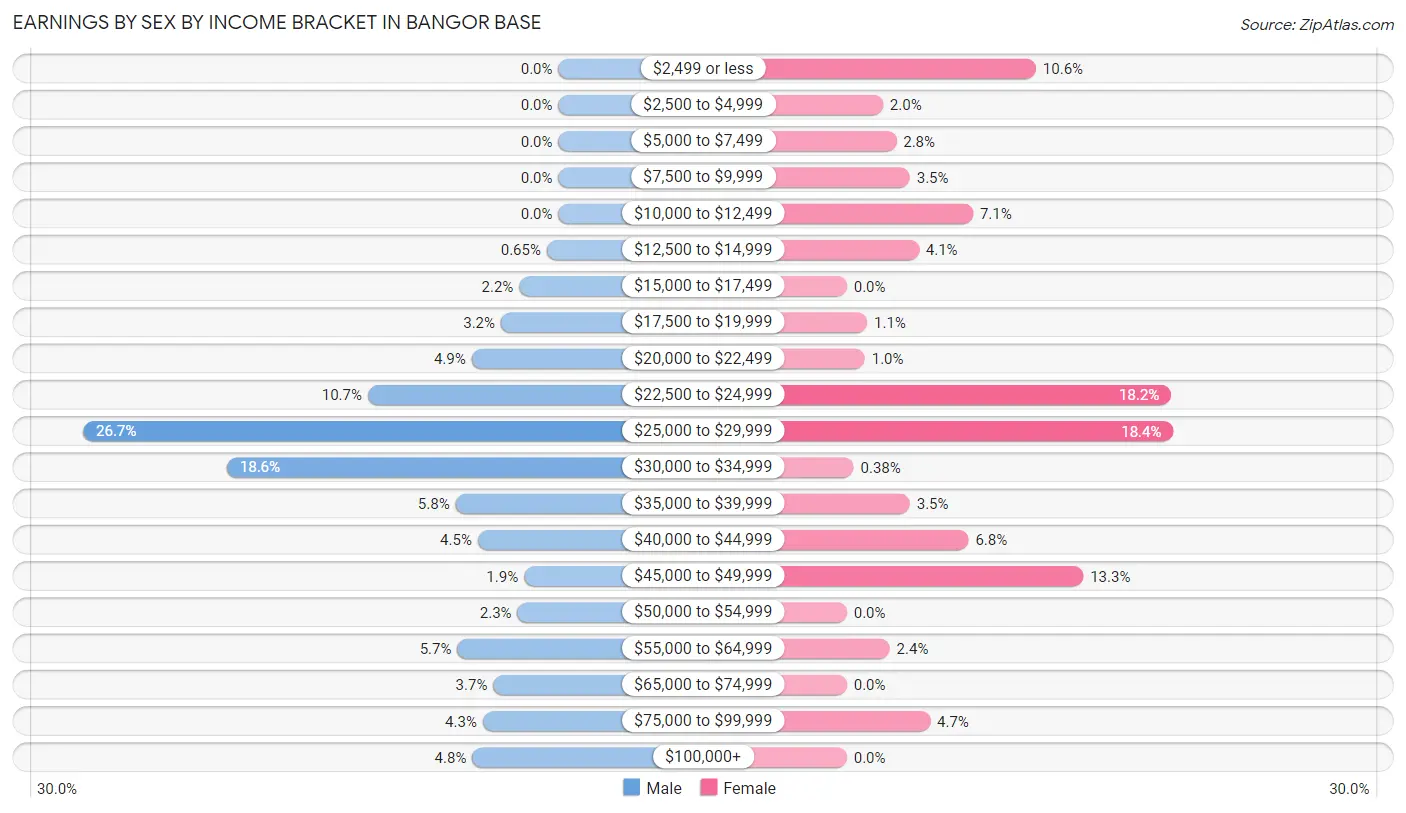
| Income | Male | Female |
| $2,499 or less | 0 (0.0%) | 84 (10.6%) |
| $2,500 to $4,999 | 0 (0.0%) | 16 (2.0%) |
| $5,000 to $7,499 | 0 (0.0%) | 22 (2.8%) |
| $7,500 to $9,999 | 0 (0.0%) | 28 (3.5%) |
| $10,000 to $12,499 | 0 (0.0%) | 56 (7.1%) |
| $12,500 to $14,999 | 21 (0.6%) | 32 (4.1%) |
| $15,000 to $17,499 | 71 (2.2%) | 0 (0.0%) |
| $17,500 to $19,999 | 104 (3.2%) | 9 (1.1%) |
| $20,000 to $22,499 | 157 (4.9%) | 8 (1.0%) |
| $22,500 to $24,999 | 345 (10.7%) | 144 (18.2%) |
| $25,000 to $29,999 | 860 (26.7%) | 145 (18.3%) |
| $30,000 to $34,999 | 600 (18.6%) | 3 (0.4%) |
| $35,000 to $39,999 | 186 (5.8%) | 28 (3.5%) |
| $40,000 to $44,999 | 146 (4.5%) | 54 (6.8%) |
| $45,000 to $49,999 | 62 (1.9%) | 105 (13.3%) |
| $50,000 to $54,999 | 74 (2.3%) | 0 (0.0%) |
| $55,000 to $64,999 | 183 (5.7%) | 19 (2.4%) |
| $65,000 to $74,999 | 118 (3.7%) | 0 (0.0%) |
| $75,000 to $99,999 | 137 (4.3%) | 37 (4.7%) |
| $100,000+ | 156 (4.8%) | 0 (0.0%) |
| Total | 3,220 (100.0%) | 790 (100.0%) |
Earnings by Sex by Educational Attainment in Bangor Base
Average earnings in Bangor Base are $46,354 for men and $35,385 for women, a difference of 23.7%. Men with an educational attainment of college or associate's degree enjoy the highest average annual earnings of $44,833, while those with bachelor's degree education earn the least with $41,250. Women with an educational attainment of college or associate's degree earn the most with the average annual earnings of $39,667, while those with bachelor's degree education have the smallest earnings of $29,602.
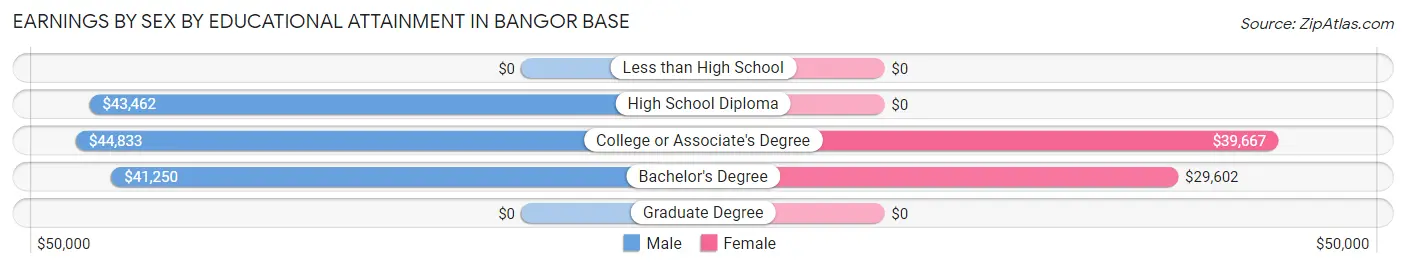
| Educational Attainment | Male Income | Female Income |
| Less than High School | - | - |
| High School Diploma | $43,462 | $0 |
| College or Associate's Degree | $44,833 | $39,667 |
| Bachelor's Degree | $41,250 | $29,602 |
| Graduate Degree | - | - |
| Total | $46,354 | $35,385 |
Family Income in Bangor Base
Family Income Brackets in Bangor Base
According to the Bangor Base family income data, there are 313 families falling into the $50,000 to $74,999 income range, which is the most common income bracket and makes up 31.5% of all families.
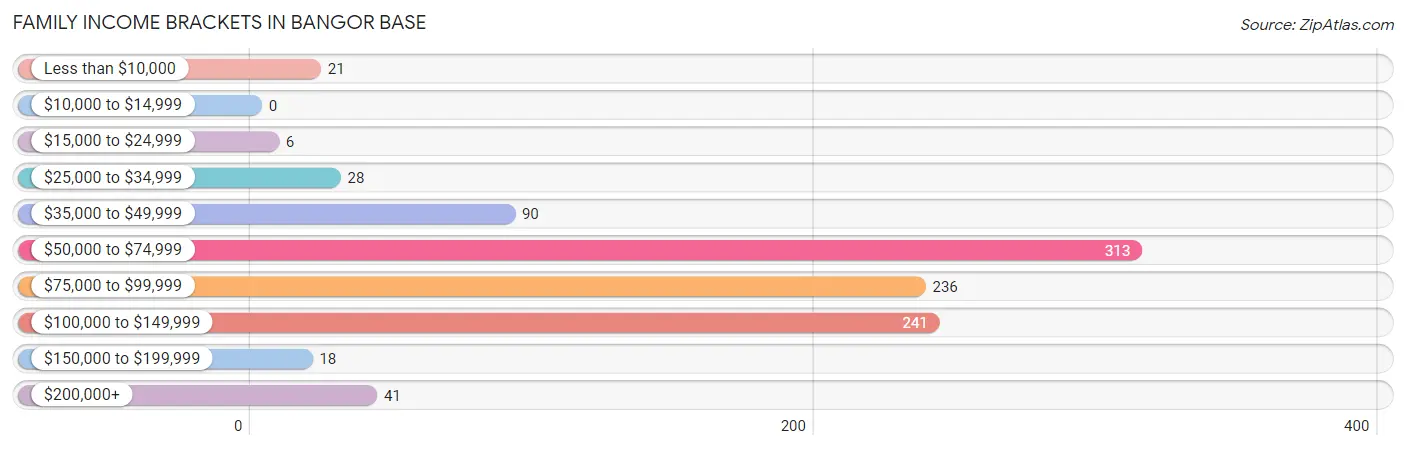
| Income Bracket | # Families | % Families |
| Less than $10,000 | 21 | 2.1% |
| $10,000 to $14,999 | 0 | 0.0% |
| $15,000 to $24,999 | 6 | 0.6% |
| $25,000 to $34,999 | 28 | 2.8% |
| $35,000 to $49,999 | 90 | 9.1% |
| $50,000 to $74,999 | 313 | 31.5% |
| $75,000 to $99,999 | 236 | 23.7% |
| $100,000 to $149,999 | 241 | 24.2% |
| $150,000 to $199,999 | 18 | 1.8% |
| $200,000+ | 41 | 4.1% |
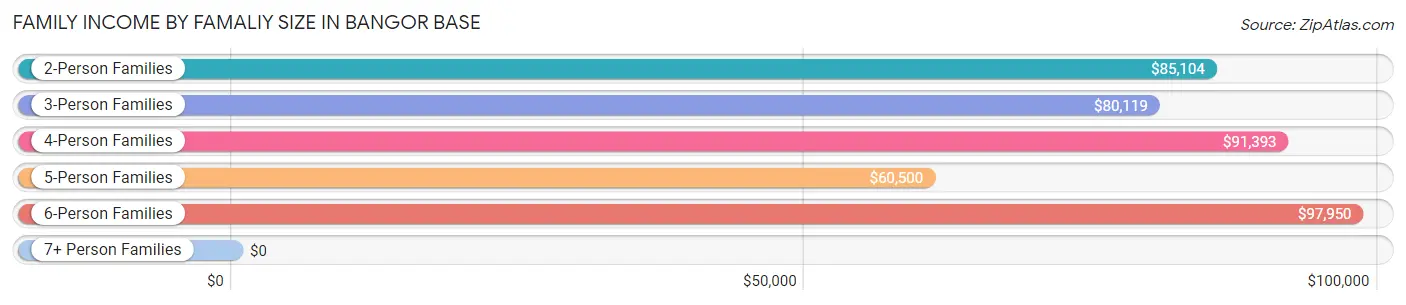
Family Income by Famaliy Size in Bangor Base
6-person families (107 | 10.8%) account for the highest median family income in Bangor Base with $97,950 per family, while 2-person families (327 | 32.9%) have the highest median income of $42,552 per family member.
| Income Bracket | # Families | Median Income |
| 2-Person Families | 327 (32.9%) | $85,104 |
| 3-Person Families | 134 (13.5%) | $80,119 |
| 4-Person Families | 297 (29.9%) | $91,393 |
| 5-Person Families | 112 (11.3%) | $60,500 |
| 6-Person Families | 107 (10.8%) | $97,950 |
| 7+ Person Families | 17 (1.7%) | $0 |
| Total | 994 (100.0%) | $82,500 |
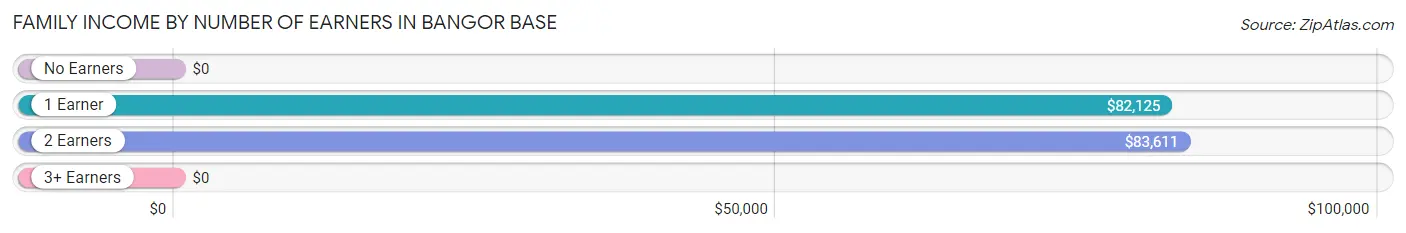
Family Income by Number of Earners in Bangor Base
| Number of Earners | # Families | Median Income |
| No Earners | 21 (2.1%) | $0 |
| 1 Earner | 487 (49.0%) | $82,125 |
| 2 Earners | 486 (48.9%) | $83,611 |
| 3+ Earners | 0 (0.0%) | $0 |
| Total | 994 (100.0%) | $82,500 |
Household Income in Bangor Base
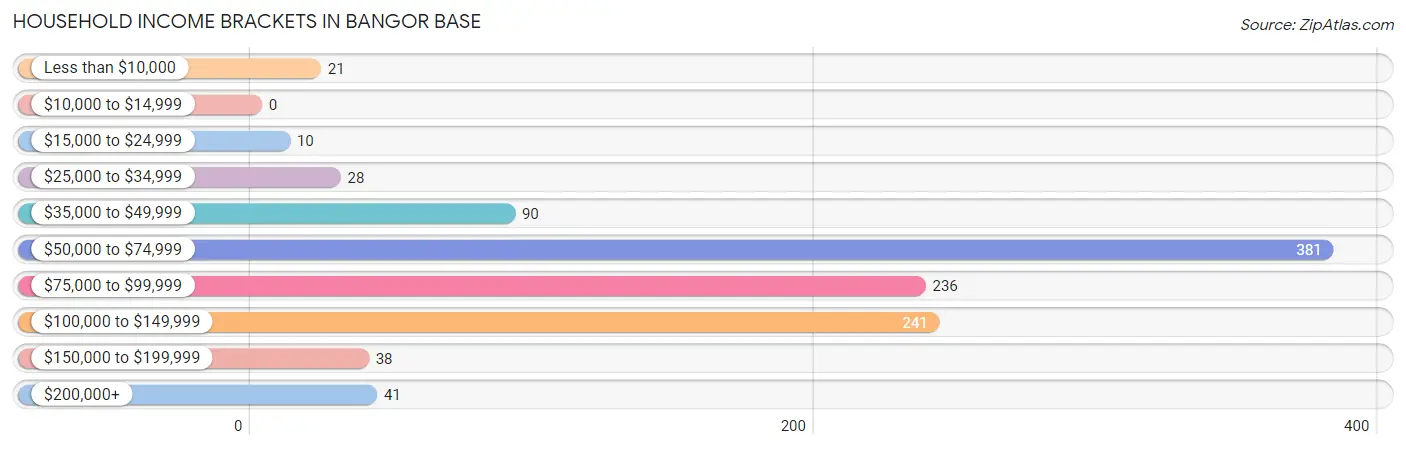
Household Income Brackets in Bangor Base
With 381 households falling in the category, the $50,000 to $74,999 income range is the most frequent in Bangor Base, accounting for 35.1% of all households.
| Income Bracket | # Households | % Households |
| Less than $10,000 | 21 | 1.9% |
| $10,000 to $14,999 | 0 | 0.0% |
| $15,000 to $24,999 | 10 | 0.9% |
| $25,000 to $34,999 | 28 | 2.6% |
| $35,000 to $49,999 | 90 | 8.3% |
| $50,000 to $74,999 | 381 | 35.1% |
| $75,000 to $99,999 | 236 | 21.7% |
| $100,000 to $149,999 | 241 | 22.2% |
| $150,000 to $199,999 | 38 | 3.5% |
| $200,000+ | 41 | 3.8% |
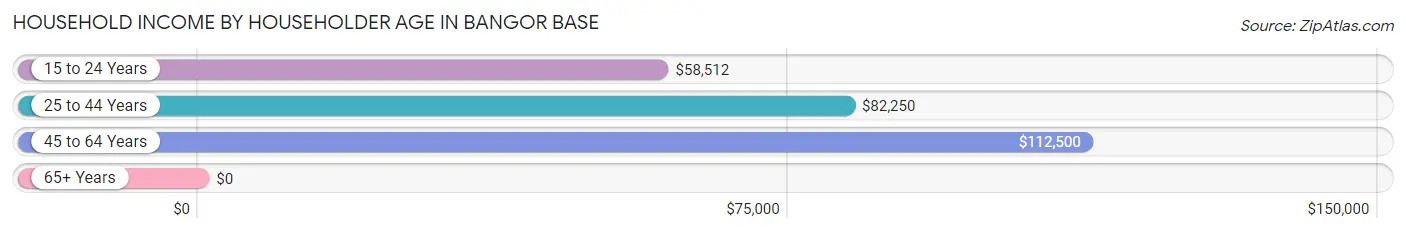
Household Income by Householder Age in Bangor Base
The median household income in Bangor Base is $76,806, with the highest median household income of $112,500 found in the 45 to 64 years age bracket for the primary householder. A total of 130 households (12.0%) fall into this category.
| Income Bracket | # Households | Median Income |
| 15 to 24 Years | 197 (18.1%) | $58,512 |
| 25 to 44 Years | 759 (69.9%) | $82,250 |
| 45 to 64 Years | 130 (12.0%) | $112,500 |
| 65+ Years | 0 (0.0%) | $0 |
| Total | 1,086 (100.0%) | $76,806 |
Poverty in Bangor Base
Income Below Poverty by Sex and Age in Bangor Base
With 2.4% poverty level for males and 3.9% for females among the residents of Bangor Base, under 5 year old males and 18 to 24 year old females are the most vulnerable to poverty, with 28 males (8.3%) and 19 females (14.3%) in their respective age groups living below the poverty level.
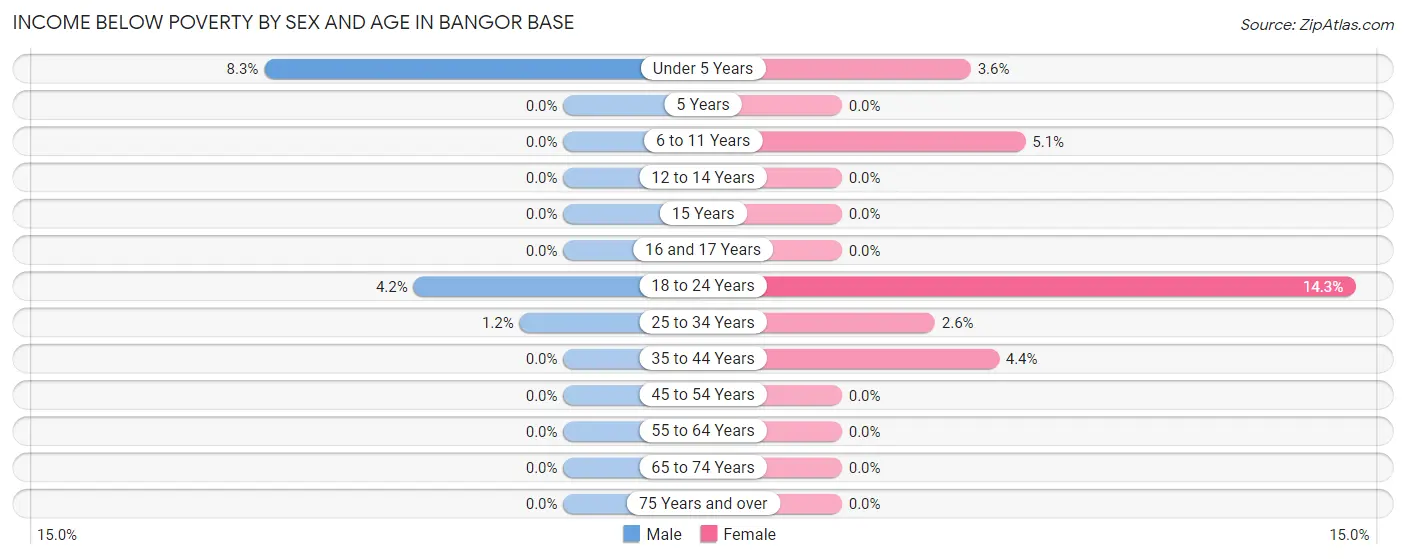
| Age Bracket | Male | Female |
| Under 5 Years | 28 (8.3%) | 12 (3.6%) |
| 5 Years | 0 (0.0%) | 0 (0.0%) |
| 6 to 11 Years | 0 (0.0%) | 18 (5.1%) |
| 12 to 14 Years | 0 (0.0%) | 0 (0.0%) |
| 15 Years | 0 (0.0%) | 0 (0.0%) |
| 16 and 17 Years | 0 (0.0%) | 0 (0.0%) |
| 18 to 24 Years | 8 (4.2%) | 19 (14.3%) |
| 25 to 34 Years | 7 (1.2%) | 14 (2.6%) |
| 35 to 44 Years | 0 (0.0%) | 8 (4.4%) |
| 45 to 54 Years | 0 (0.0%) | 0 (0.0%) |
| 55 to 64 Years | 0 (0.0%) | 0 (0.0%) |
| 65 to 74 Years | 0 (0.0%) | 0 (0.0%) |
| 75 Years and over | 0 (0.0%) | 0 (0.0%) |
| Total | 43 (2.4%) | 71 (3.9%) |
Income Above Poverty by Sex and Age in Bangor Base
According to the poverty statistics in Bangor Base, males aged 5 years and females aged 5 years are the age groups that are most secure financially, with 100.0% of males and 100.0% of females in these age groups living above the poverty line.
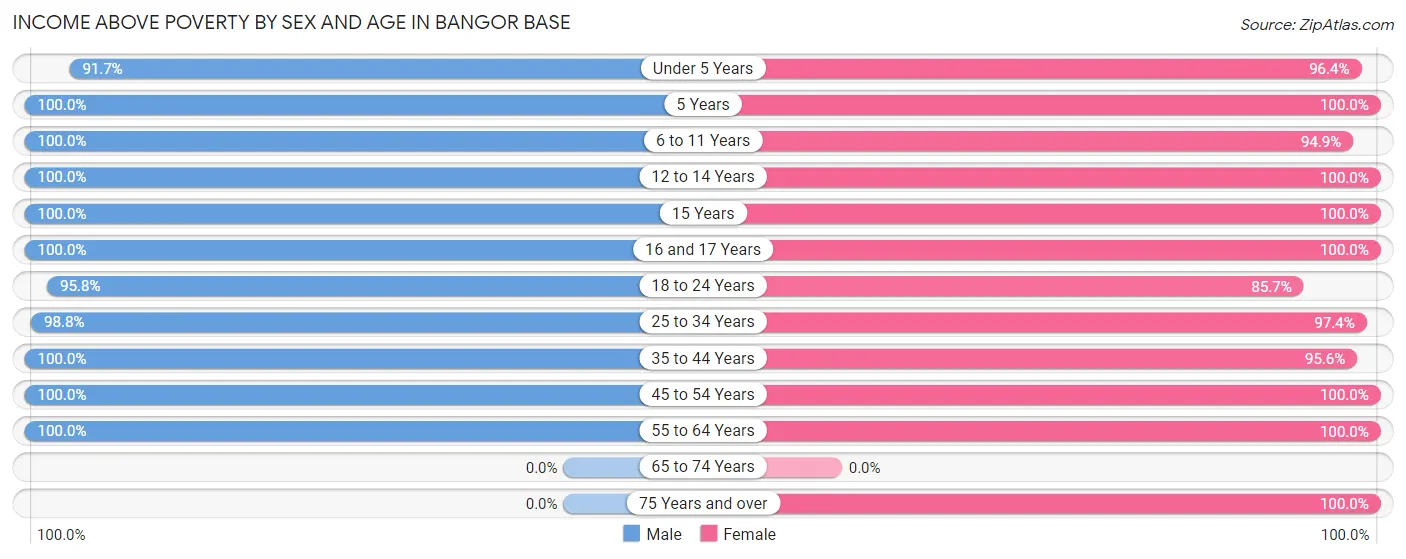
| Age Bracket | Male | Female |
| Under 5 Years | 308 (91.7%) | 322 (96.4%) |
| 5 Years | 12 (100.0%) | 32 (100.0%) |
| 6 to 11 Years | 308 (100.0%) | 334 (94.9%) |
| 12 to 14 Years | 29 (100.0%) | 53 (100.0%) |
| 15 Years | 23 (100.0%) | 7 (100.0%) |
| 16 and 17 Years | 6 (100.0%) | 57 (100.0%) |
| 18 to 24 Years | 184 (95.8%) | 114 (85.7%) |
| 25 to 34 Years | 567 (98.8%) | 527 (97.4%) |
| 35 to 44 Years | 255 (100.0%) | 175 (95.6%) |
| 45 to 54 Years | 32 (100.0%) | 94 (100.0%) |
| 55 to 64 Years | 47 (100.0%) | 15 (100.0%) |
| 65 to 74 Years | 0 (0.0%) | 0 (0.0%) |
| 75 Years and over | 0 (0.0%) | 12 (100.0%) |
| Total | 1,771 (97.6%) | 1,742 (96.1%) |
Income Below Poverty Among Married-Couple Families in Bangor Base
The poverty statistics for married-couple families in Bangor Base show that 1.4% or 13 of the total 951 families live below the poverty line. Families with 3 or 4 children have the highest poverty rate of 3.9%, comprising of 7 families. On the other hand, families with no children have the lowest poverty rate of 0.0%, which includes 0 families.
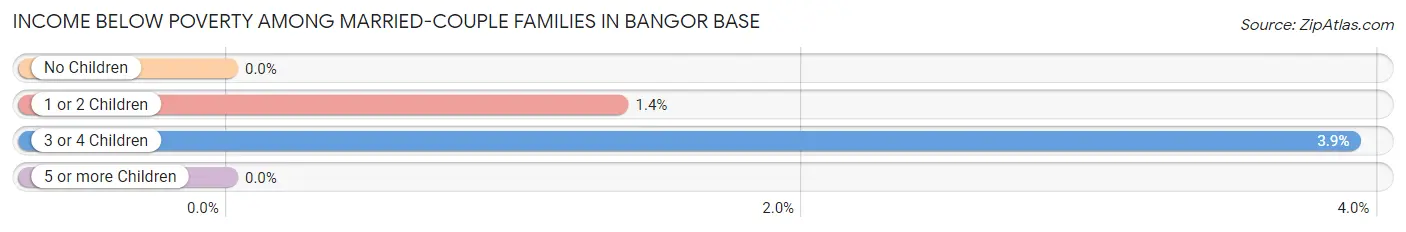
| Children | Above Poverty | Below Poverty |
| No Children | 314 (100.0%) | 0 (0.0%) |
| 1 or 2 Children | 435 (98.6%) | 6 (1.4%) |
| 3 or 4 Children | 172 (96.1%) | 7 (3.9%) |
| 5 or more Children | 17 (100.0%) | 0 (0.0%) |
| Total | 938 (98.6%) | 13 (1.4%) |
Income Below Poverty Among Single-Parent Households in Bangor Base
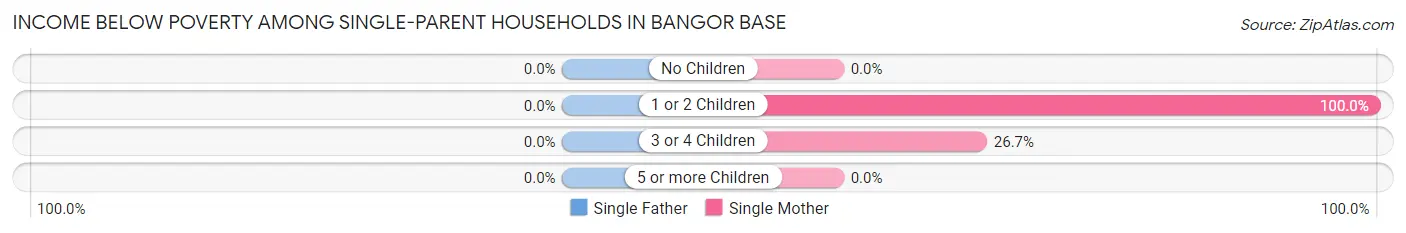
| Children | Single Father | Single Mother |
| No Children | 0 (0.0%) | 0 (0.0%) |
| 1 or 2 Children | 0 (0.0%) | 13 (100.0%) |
| 3 or 4 Children | 0 (0.0%) | 8 (26.7%) |
| 5 or more Children | 0 (0.0%) | 0 (0.0%) |
| Total | 0 (0.0%) | 21 (48.8%) |
Income Below Poverty Among Married-Couple vs Single-Parent Households in Bangor Base
The poverty data for Bangor Base shows that 13 of the married-couple family households (1.4%) and 21 of the single-parent households (48.8%) are living below the poverty level. Within the married-couple family households, those with 3 or 4 children have the highest poverty rate, with 7 households (3.9%) falling below the poverty line. Among the single-parent households, those with 1 or 2 children have the highest poverty rate, with 13 household (100.0%) living below poverty.
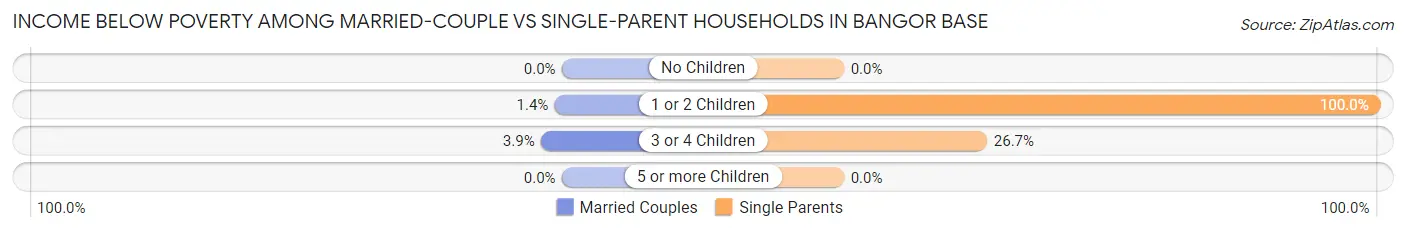
| Children | Married-Couple Families | Single-Parent Households |
| No Children | 0 (0.0%) | 0 (0.0%) |
| 1 or 2 Children | 6 (1.4%) | 13 (100.0%) |
| 3 or 4 Children | 7 (3.9%) | 8 (26.7%) |
| 5 or more Children | 0 (0.0%) | 0 (0.0%) |
| Total | 13 (1.4%) | 21 (48.8%) |
Employment Characteristics in Bangor Base
Employment by Class of Employer in Bangor Base
Among the 3,858 employed individuals in Bangor Base, federal government employees (3,505 | 90.8%), private company employees (271 | 7.0%), and not-for-profit organizations (57 | 1.5%) make up the most common classes of employment.
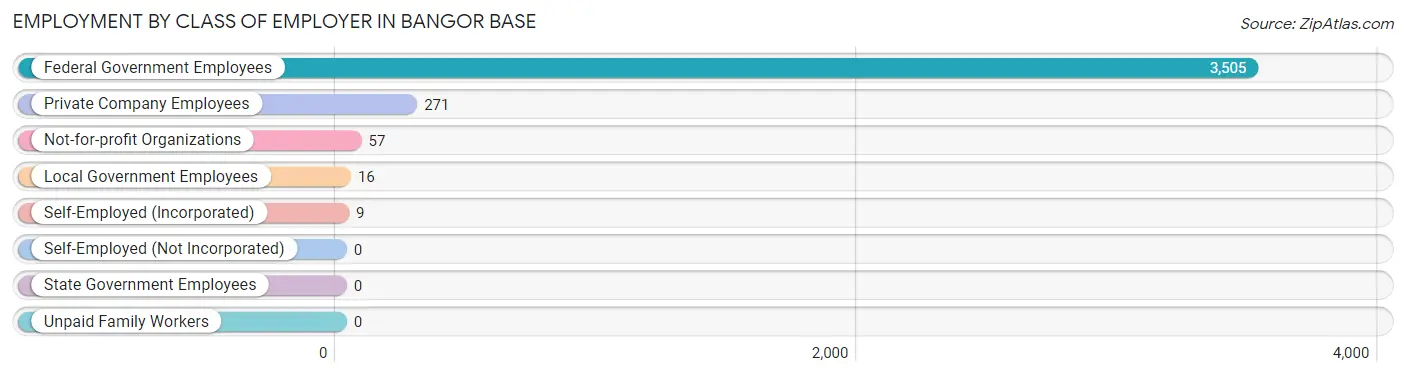
| Employer Class | # Employees | % Employees |
| Private Company Employees | 271 | 7.0% |
| Self-Employed (Incorporated) | 9 | 0.2% |
| Self-Employed (Not Incorporated) | 0 | 0.0% |
| Not-for-profit Organizations | 57 | 1.5% |
| Local Government Employees | 16 | 0.4% |
| State Government Employees | 0 | 0.0% |
| Federal Government Employees | 3,505 | 90.8% |
| Unpaid Family Workers | 0 | 0.0% |
| Total | 3,858 | 100.0% |
Employment Status by Age in Bangor Base
According to the labor force statistics for Bangor Base, out of the total population over 16 years of age (4,546), 86.6% or 3,937 individuals are in the labor force, with 3.4% or 134 of them unemployed. The age group with the highest labor force participation rate is 20 to 24 years, with 97.5% or 2,019 individuals in the labor force. Within the labor force, the 20 to 24 years age range has the highest percentage of unemployed individuals, with 9.7% or 196 of them being unemployed.
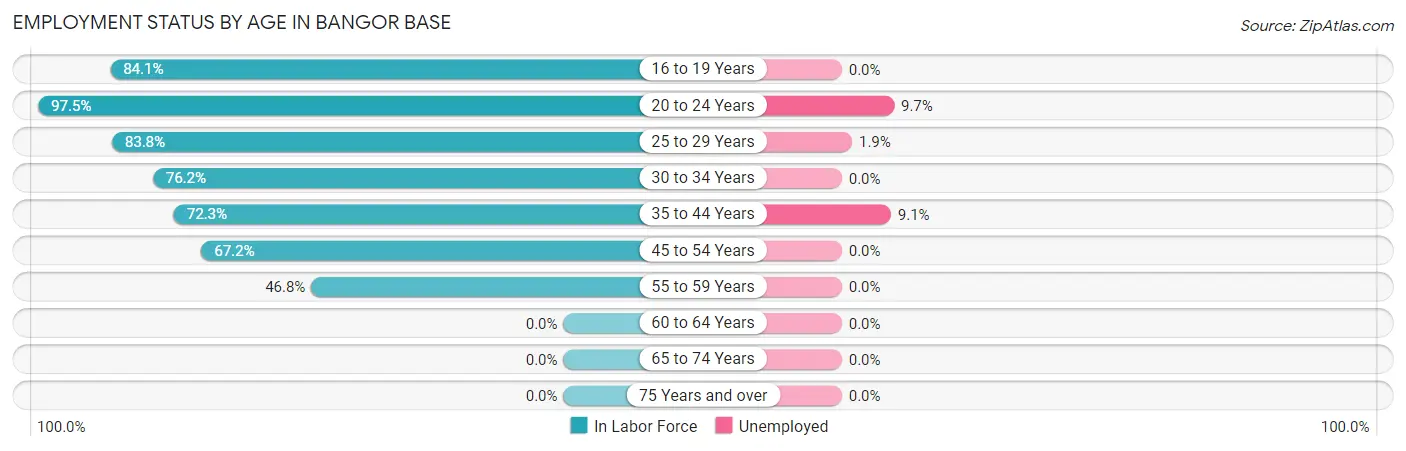
| Age Bracket | In Labor Force | Unemployed |
| 16 to 19 Years | 238 (84.1%) | 0 (0.0%) |
| 20 to 24 Years | 2,019 (97.5%) | 196 (9.7%) |
| 25 to 29 Years | 816 (83.8%) | 16 (1.9%) |
| 30 to 34 Years | 414 (76.2%) | 0 (0.0%) |
| 35 to 44 Years | 340 (72.3%) | 31 (9.1%) |
| 45 to 54 Years | 88 (67.2%) | 0 (0.0%) |
| 55 to 59 Years | 22 (46.8%) | 0 (0.0%) |
| 60 to 64 Years | 0 (0.0%) | 0 (0.0%) |
| 65 to 74 Years | 0 (0.0%) | 0 (0.0%) |
| 75 Years and over | 0 (0.0%) | 0 (0.0%) |
| Total | 3,937 (86.6%) | 134 (3.4%) |
Employment Status by Educational Attainment in Bangor Base
According to labor force statistics for Bangor Base, 77.1% of individuals (1,681) out of the total population between 25 and 64 years of age (2,180) are in the labor force, with 2.6% or 44 of them being unemployed. The group with the highest labor force participation rate are those with the educational attainment of less than high school, with 89.1% or 41 individuals in the labor force. Within the labor force, individuals with high school diploma education have the highest percentage of unemployment, with 14.5% or 45 of them being unemployed.
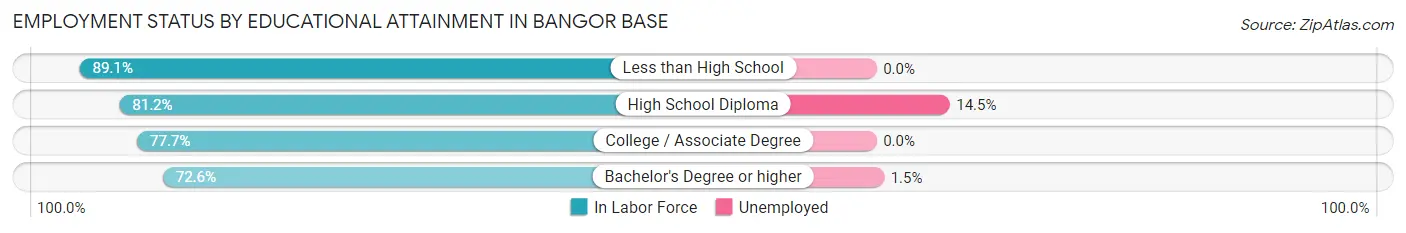
| Educational Attainment | In Labor Force | Unemployed |
| Less than High School | 41 (89.1%) | 0 (0.0%) |
| High School Diploma | 307 (81.2%) | 55 (14.5%) |
| College / Associate Degree | 880 (77.7%) | 0 (0.0%) |
| Bachelor's Degree or higher | 453 (72.6%) | 9 (1.5%) |
| Total | 1,681 (77.1%) | 57 (2.6%) |
Employment Occupations by Sex in Bangor Base
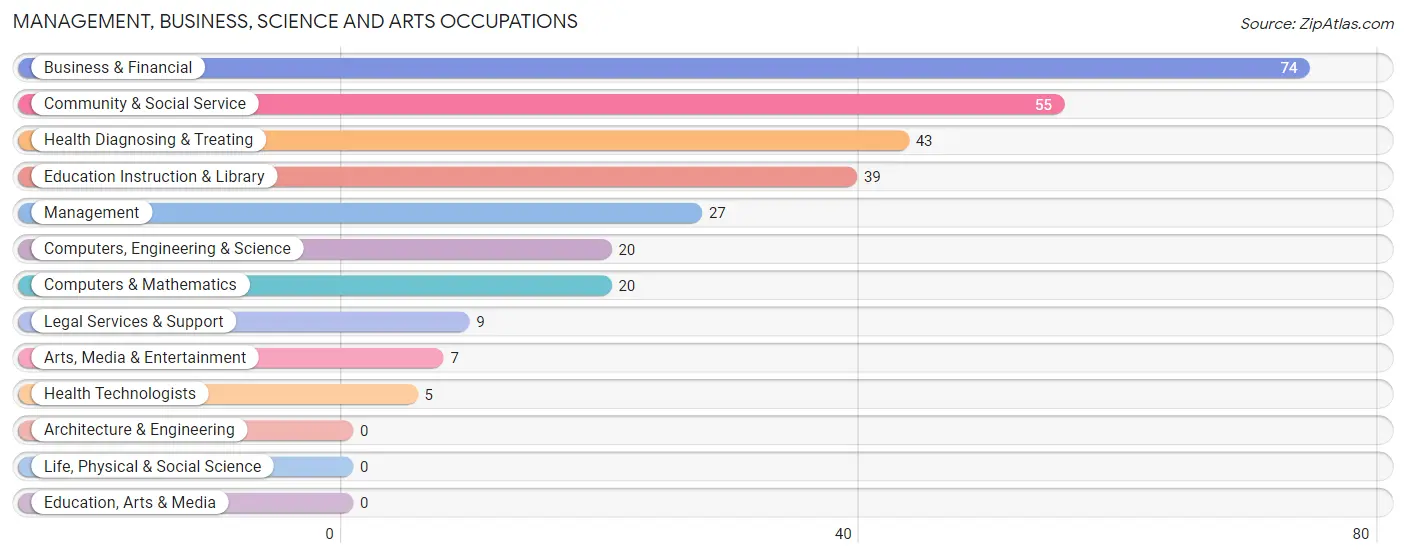
Management, Business, Science and Arts Occupations
The most common Management, Business, Science and Arts occupations in Bangor Base are Business & Financial (74 | 14.3%), Community & Social Service (55 | 10.6%), Health Diagnosing & Treating (43 | 8.3%), Education Instruction & Library (39 | 7.5%), and Management (27 | 5.2%).
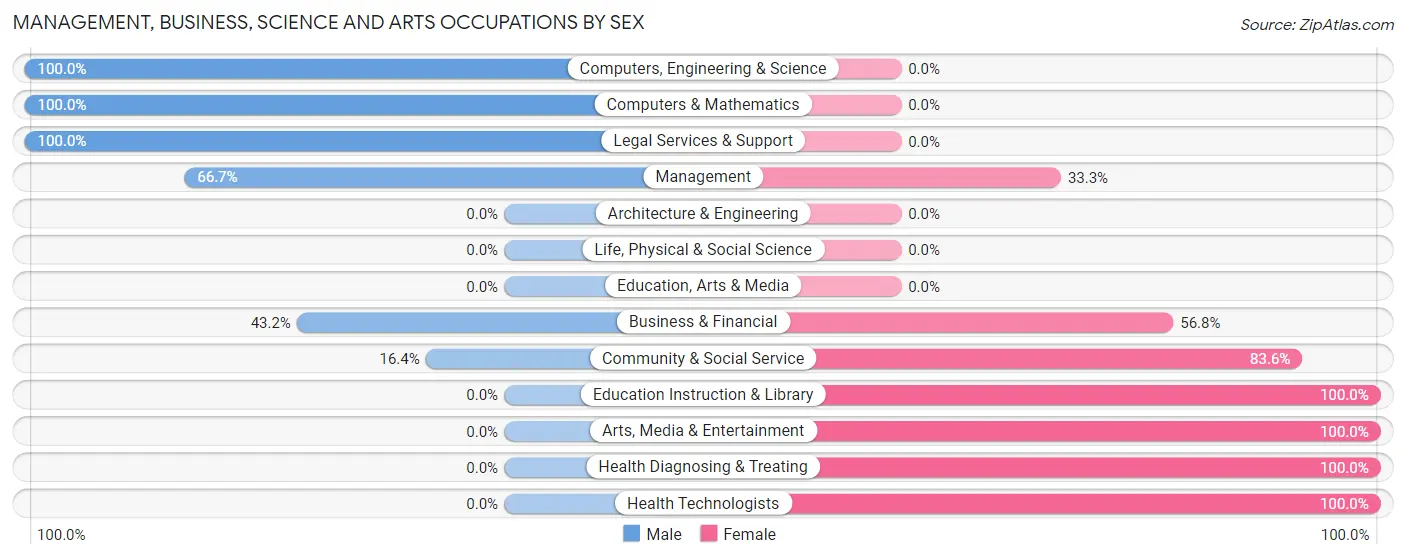
Management, Business, Science and Arts Occupations by Sex
Within the Management, Business, Science and Arts occupations in Bangor Base, the most male-oriented occupations are Computers, Engineering & Science (100.0%), Computers & Mathematics (100.0%), and Legal Services & Support (100.0%), while the most female-oriented occupations are Education Instruction & Library (100.0%), Arts, Media & Entertainment (100.0%), and Health Diagnosing & Treating (100.0%).
| Occupation | Male | Female |
| Management | 18 (66.7%) | 9 (33.3%) |
| Business & Financial | 32 (43.2%) | 42 (56.8%) |
| Computers, Engineering & Science | 20 (100.0%) | 0 (0.0%) |
| Computers & Mathematics | 20 (100.0%) | 0 (0.0%) |
| Architecture & Engineering | 0 (0.0%) | 0 (0.0%) |
| Life, Physical & Social Science | 0 (0.0%) | 0 (0.0%) |
| Community & Social Service | 9 (16.4%) | 46 (83.6%) |
| Education, Arts & Media | 0 (0.0%) | 0 (0.0%) |
| Legal Services & Support | 9 (100.0%) | 0 (0.0%) |
| Education Instruction & Library | 0 (0.0%) | 39 (100.0%) |
| Arts, Media & Entertainment | 0 (0.0%) | 7 (100.0%) |
| Health Diagnosing & Treating | 0 (0.0%) | 43 (100.0%) |
| Health Technologists | 0 (0.0%) | 5 (100.0%) |
| Total (Category) | 79 (36.1%) | 140 (63.9%) |
| Total (Overall) | 111 (21.5%) | 406 (78.5%) |
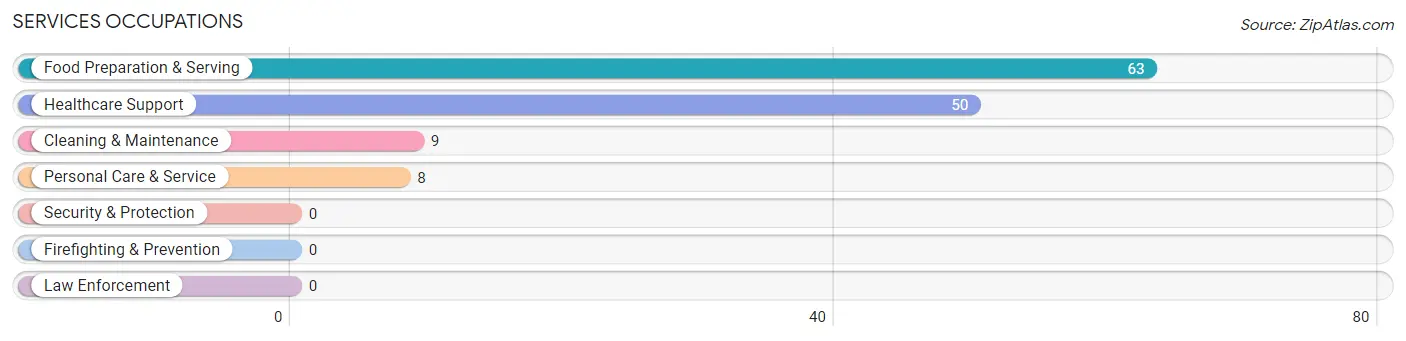
Services Occupations
The most common Services occupations in Bangor Base are Food Preparation & Serving (63 | 12.2%), Healthcare Support (50 | 9.7%), Cleaning & Maintenance (9 | 1.7%), and Personal Care & Service (8 | 1.5%).
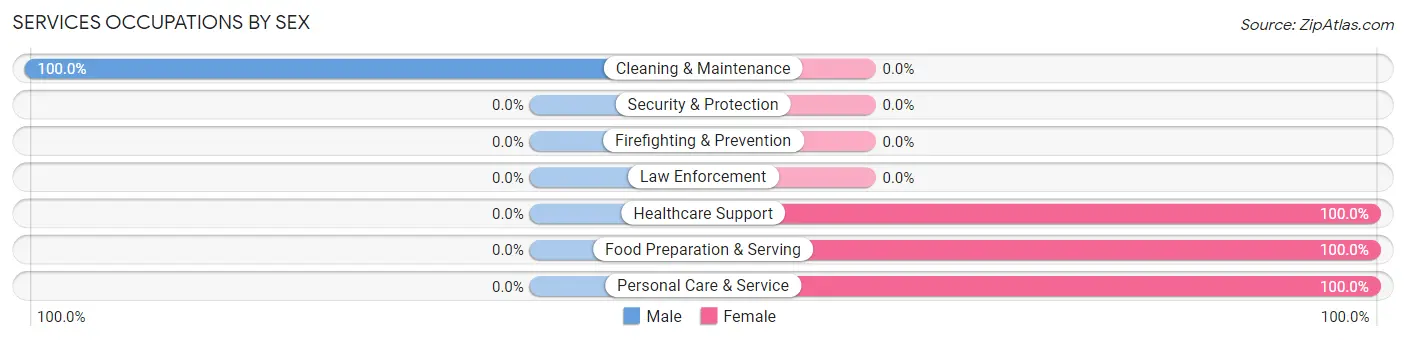
Services Occupations by Sex
| Occupation | Male | Female |
| Healthcare Support | 0 (0.0%) | 50 (100.0%) |
| Security & Protection | 0 (0.0%) | 0 (0.0%) |
| Firefighting & Prevention | 0 (0.0%) | 0 (0.0%) |
| Law Enforcement | 0 (0.0%) | 0 (0.0%) |
| Food Preparation & Serving | 0 (0.0%) | 63 (100.0%) |
| Cleaning & Maintenance | 9 (100.0%) | 0 (0.0%) |
| Personal Care & Service | 0 (0.0%) | 8 (100.0%) |
| Total (Category) | 9 (6.9%) | 121 (93.1%) |
| Total (Overall) | 111 (21.5%) | 406 (78.5%) |
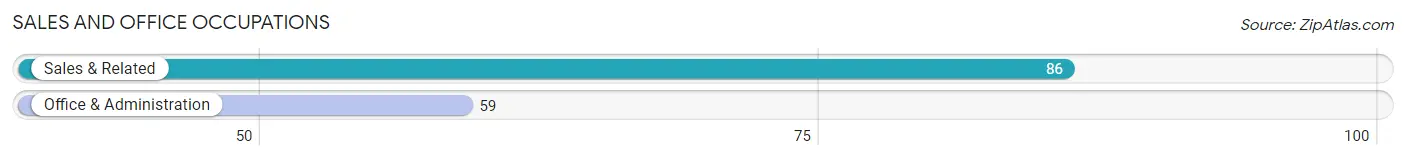
Sales and Office Occupations
The most common Sales and Office occupations in Bangor Base are Sales & Related (86 | 16.6%), and Office & Administration (59 | 11.4%).
Sales and Office Occupations by Sex
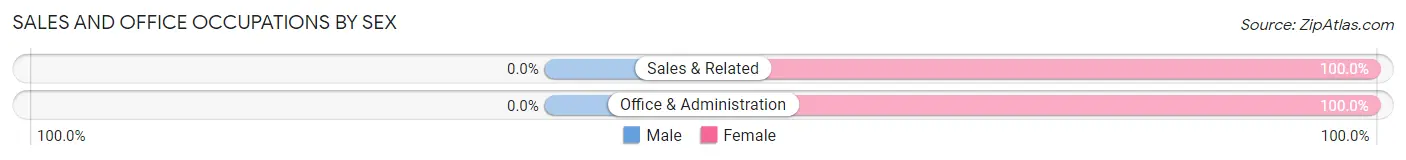
| Occupation | Male | Female |
| Sales & Related | 0 (0.0%) | 86 (100.0%) |
| Office & Administration | 0 (0.0%) | 59 (100.0%) |
| Total (Category) | 0 (0.0%) | 145 (100.0%) |
| Total (Overall) | 111 (21.5%) | 406 (78.5%) |
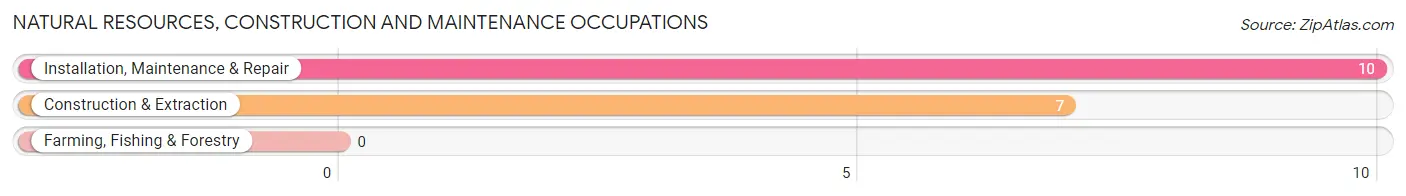
Natural Resources, Construction and Maintenance Occupations
The most common Natural Resources, Construction and Maintenance occupations in Bangor Base are Installation, Maintenance & Repair (10 | 1.9%), and Construction & Extraction (7 | 1.3%).
Natural Resources, Construction and Maintenance Occupations by Sex
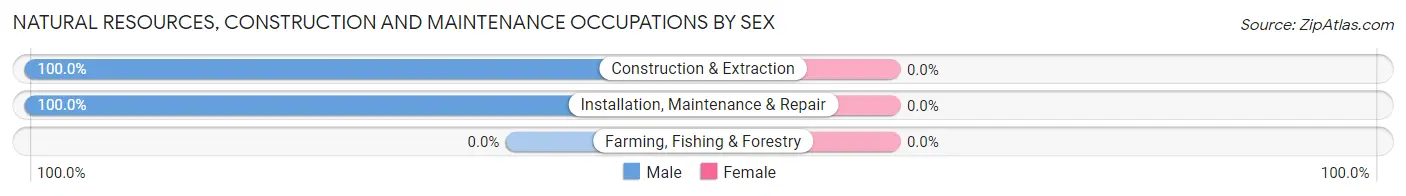
| Occupation | Male | Female |
| Farming, Fishing & Forestry | 0 (0.0%) | 0 (0.0%) |
| Construction & Extraction | 7 (100.0%) | 0 (0.0%) |
| Installation, Maintenance & Repair | 10 (100.0%) | 0 (0.0%) |
| Total (Category) | 17 (100.0%) | 0 (0.0%) |
| Total (Overall) | 111 (21.5%) | 406 (78.5%) |
Production, Transportation and Moving Occupations
The most common Production, Transportation and Moving occupations in Bangor Base are , and Production (6 | 1.2%).
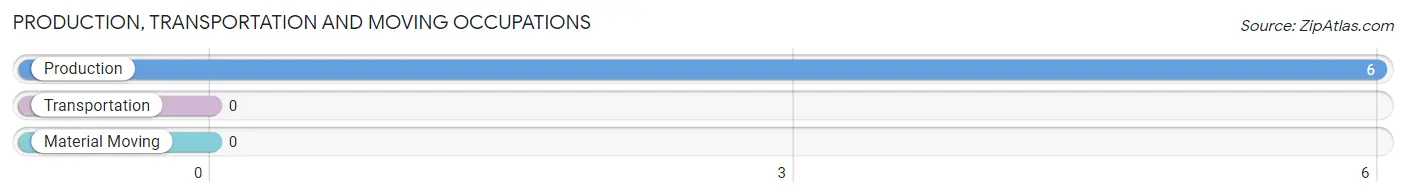
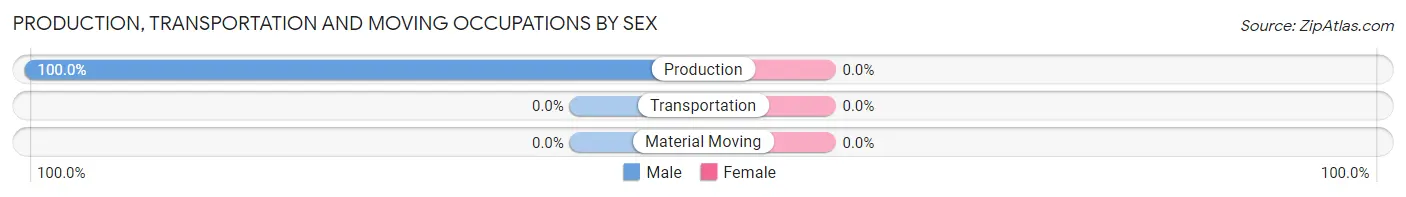
Production, Transportation and Moving Occupations by Sex
| Occupation | Male | Female |
| Production | 6 (100.0%) | 0 (0.0%) |
| Transportation | 0 (0.0%) | 0 (0.0%) |
| Material Moving | 0 (0.0%) | 0 (0.0%) |
| Total (Category) | 6 (100.0%) | 0 (0.0%) |
| Total (Overall) | 111 (21.5%) | 406 (78.5%) |
Employment Industries by Sex in Bangor Base
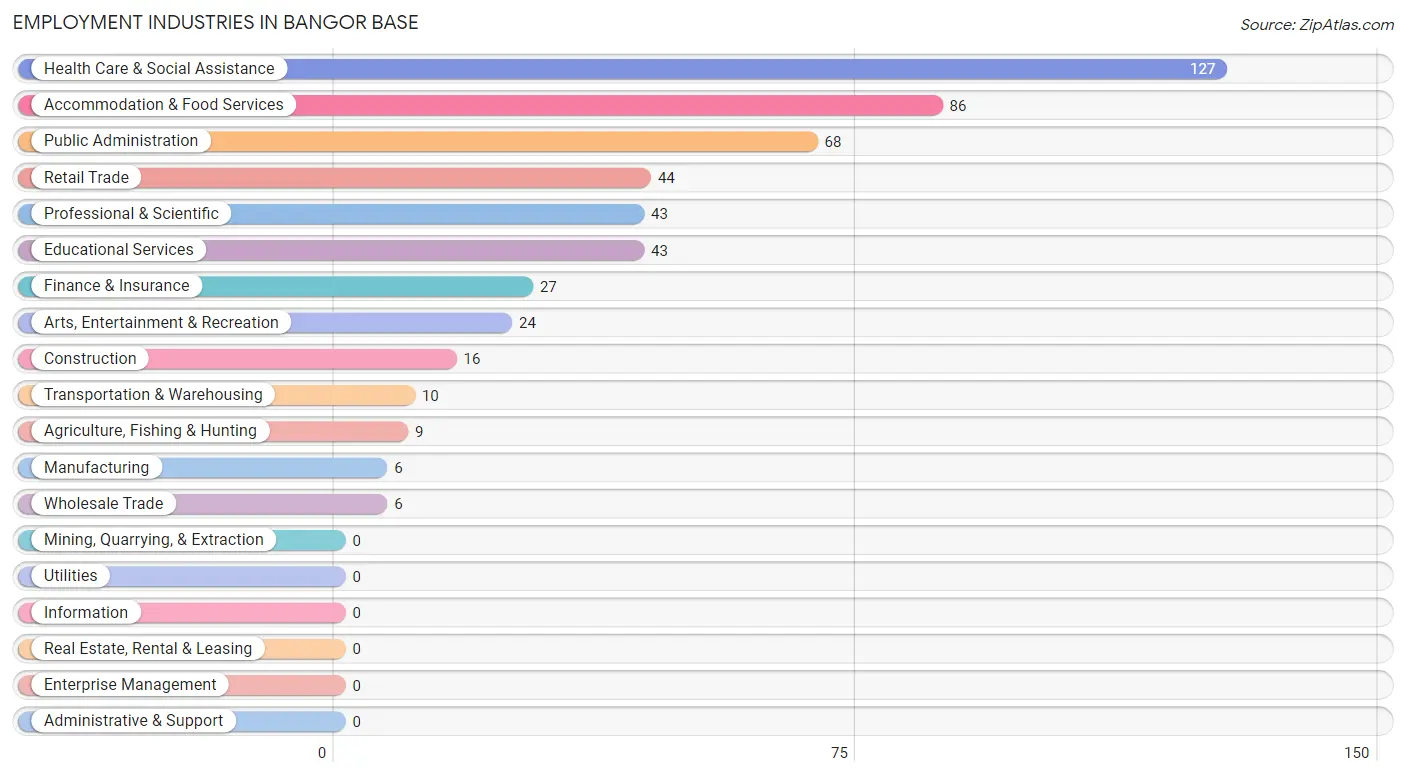
Employment Industries in Bangor Base
The major employment industries in Bangor Base include Health Care & Social Assistance (127 | 24.6%), Accommodation & Food Services (86 | 16.6%), Public Administration (68 | 13.2%), Retail Trade (44 | 8.5%), and Professional & Scientific (43 | 8.3%).
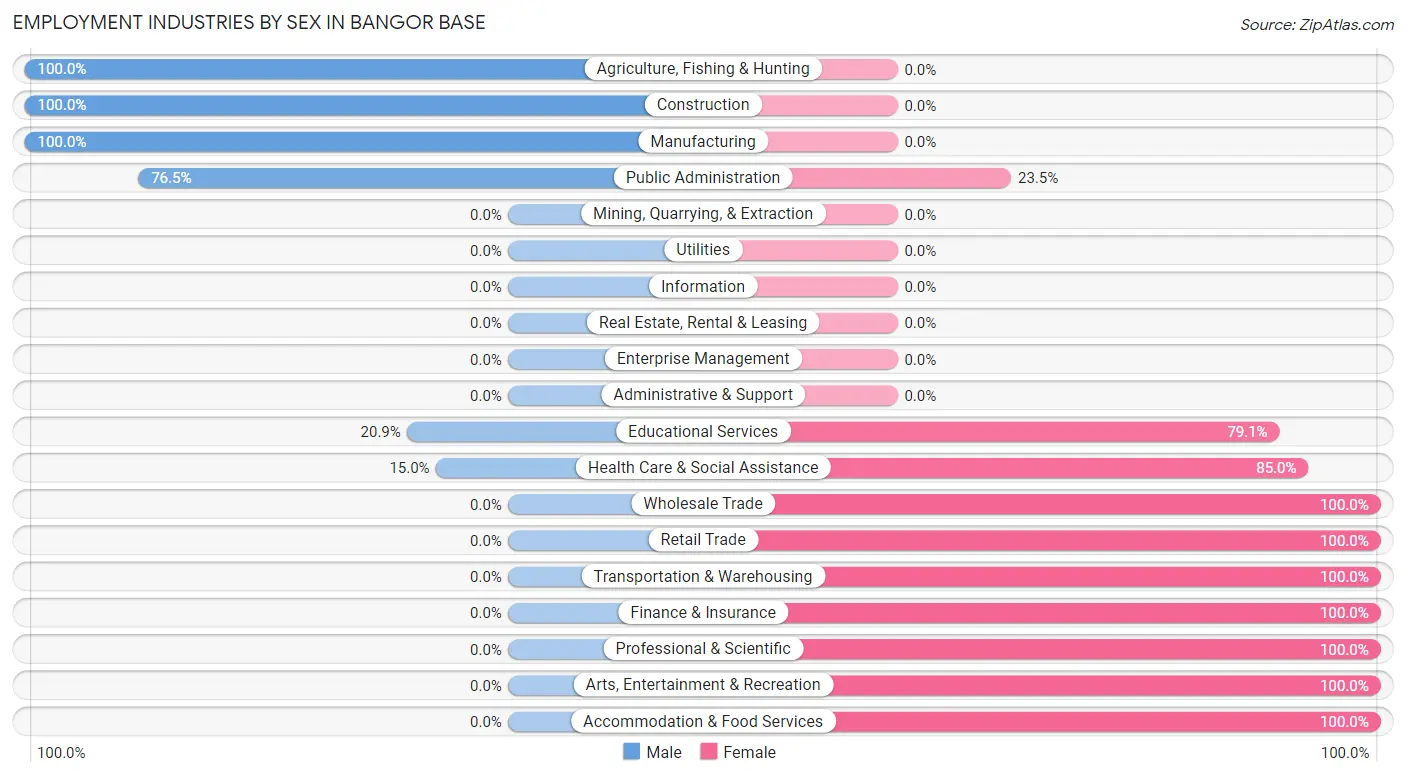
Employment Industries by Sex in Bangor Base
The Bangor Base industries that see more men than women are Agriculture, Fishing & Hunting (100.0%), Construction (100.0%), and Manufacturing (100.0%), whereas the industries that tend to have a higher number of women are Wholesale Trade (100.0%), Retail Trade (100.0%), and Transportation & Warehousing (100.0%).
| Industry | Male | Female |
| Agriculture, Fishing & Hunting | 9 (100.0%) | 0 (0.0%) |
| Mining, Quarrying, & Extraction | 0 (0.0%) | 0 (0.0%) |
| Construction | 16 (100.0%) | 0 (0.0%) |
| Manufacturing | 6 (100.0%) | 0 (0.0%) |
| Wholesale Trade | 0 (0.0%) | 6 (100.0%) |
| Retail Trade | 0 (0.0%) | 44 (100.0%) |
| Transportation & Warehousing | 0 (0.0%) | 10 (100.0%) |
| Utilities | 0 (0.0%) | 0 (0.0%) |
| Information | 0 (0.0%) | 0 (0.0%) |
| Finance & Insurance | 0 (0.0%) | 27 (100.0%) |
| Real Estate, Rental & Leasing | 0 (0.0%) | 0 (0.0%) |
| Professional & Scientific | 0 (0.0%) | 43 (100.0%) |
| Enterprise Management | 0 (0.0%) | 0 (0.0%) |
| Administrative & Support | 0 (0.0%) | 0 (0.0%) |
| Educational Services | 9 (20.9%) | 34 (79.1%) |
| Health Care & Social Assistance | 19 (15.0%) | 108 (85.0%) |
| Arts, Entertainment & Recreation | 0 (0.0%) | 24 (100.0%) |
| Accommodation & Food Services | 0 (0.0%) | 86 (100.0%) |
| Public Administration | 52 (76.5%) | 16 (23.5%) |
| Total | 111 (21.5%) | 406 (78.5%) |
Education in Bangor Base
School Enrollment in Bangor Base
The most common levels of schooling among the 1,135 students in Bangor Base are elementary school (394 | 34.7%), college / undergraduate (204 | 18.0%), and high school (144 | 12.7%).
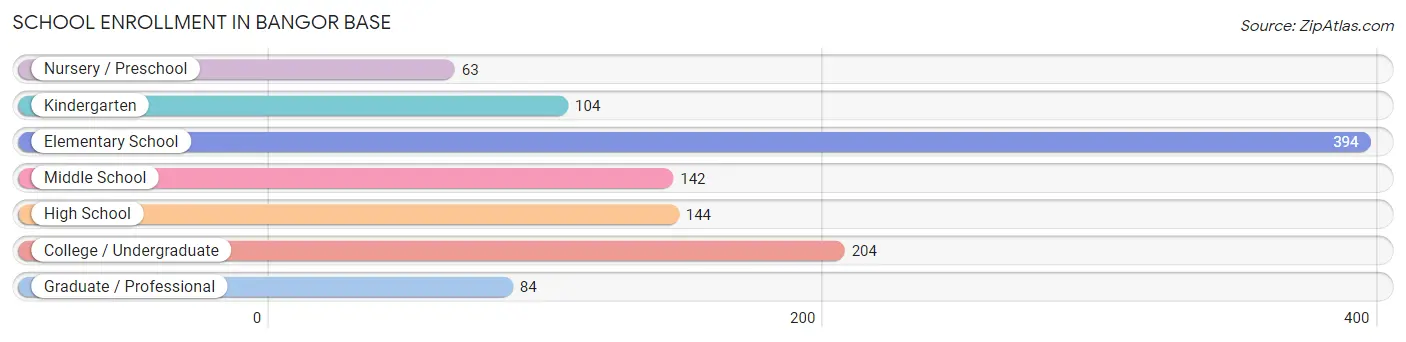
| School Level | # Students | % Students |
| Nursery / Preschool | 63 | 5.6% |
| Kindergarten | 104 | 9.2% |
| Elementary School | 394 | 34.7% |
| Middle School | 142 | 12.5% |
| High School | 144 | 12.7% |
| College / Undergraduate | 204 | 18.0% |
| Graduate / Professional | 84 | 7.4% |
| Total | 1,135 | 100.0% |
School Enrollment by Age by Funding Source in Bangor Base
Out of a total of 1,135 students who are enrolled in schools in Bangor Base, 261 (23.0%) attend a private institution, while the remaining 874 (77.0%) are enrolled in public schools. The age group of 35 years and over has the highest likelihood of being enrolled in private schools, with 35 (41.2% in the age bracket) enrolled. Conversely, the age group of 20 to 24 year olds has the lowest likelihood of being enrolled in a private school, with 30 (100.0% in the age bracket) attending a public institution.
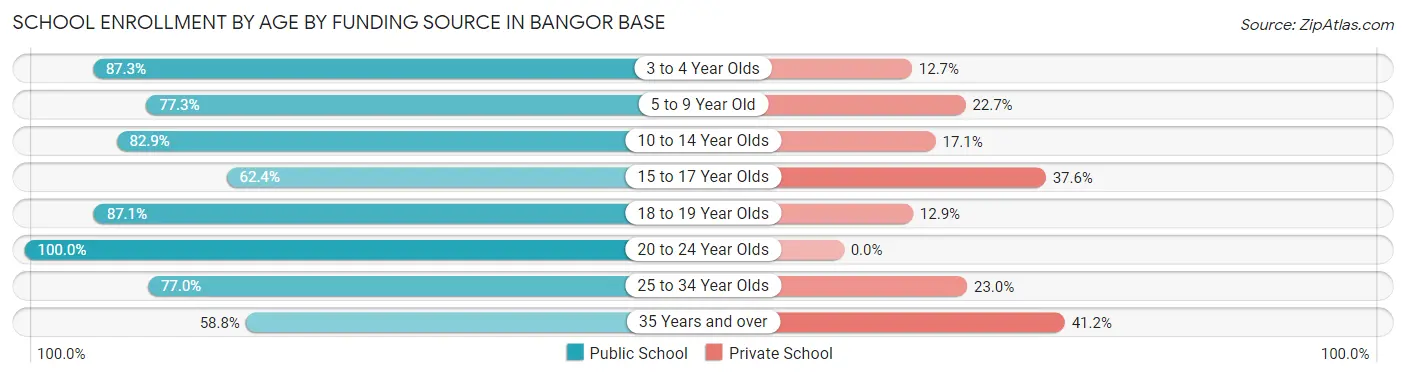
| Age Bracket | Public School | Private School |
| 3 to 4 Year Olds | 55 (87.3%) | 8 (12.7%) |
| 5 to 9 Year Old | 375 (77.3%) | 110 (22.7%) |
| 10 to 14 Year Olds | 155 (82.9%) | 32 (17.1%) |
| 15 to 17 Year Olds | 58 (62.4%) | 35 (37.6%) |
| 18 to 19 Year Olds | 27 (87.1%) | 4 (12.9%) |
| 20 to 24 Year Olds | 30 (100.0%) | 0 (0.0%) |
| 25 to 34 Year Olds | 124 (77.0%) | 37 (23.0%) |
| 35 Years and over | 50 (58.8%) | 35 (41.2%) |
| Total | 874 (77.0%) | 261 (23.0%) |
Educational Attainment by Field of Study in Bangor Base
Business (121 | 19.0%), education (101 | 15.9%), bio, nature & agricultural (88 | 13.8%), arts & humanities (76 | 11.9%), and psychology (50 | 7.9%) are the most common fields of study among 636 individuals in Bangor Base who have obtained a bachelor's degree or higher.
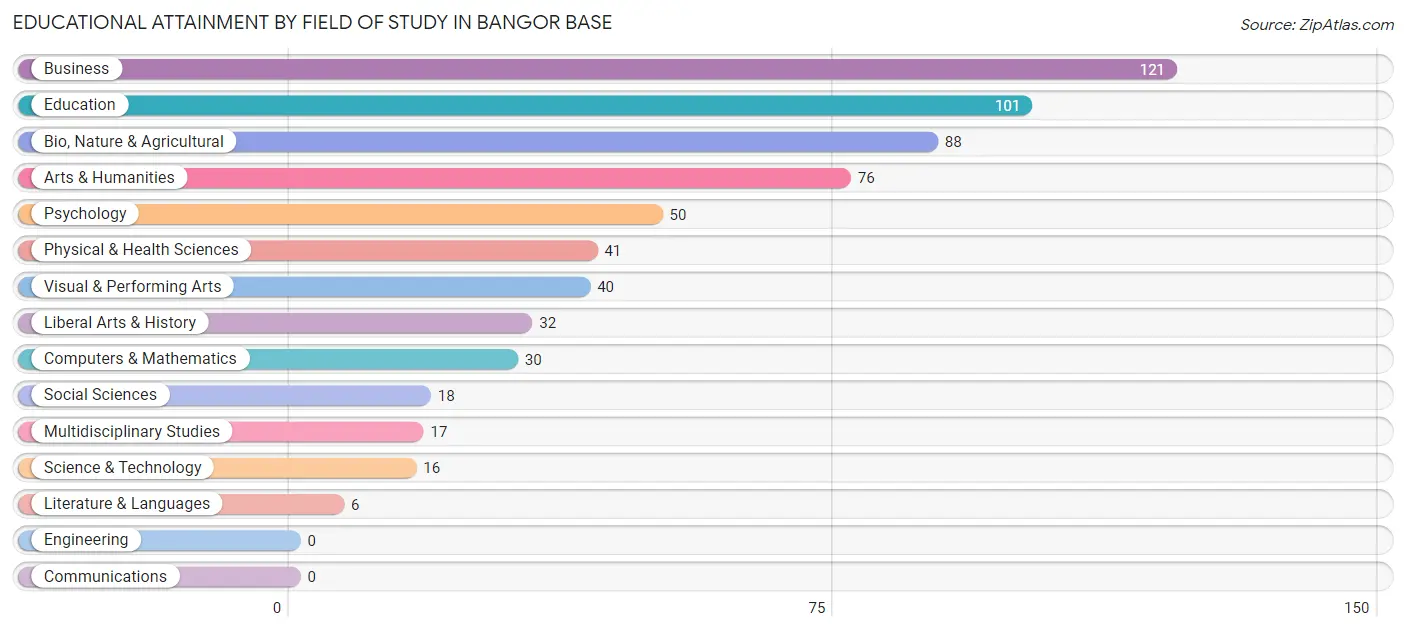
| Field of Study | # Graduates | % Graduates |
| Computers & Mathematics | 30 | 4.7% |
| Bio, Nature & Agricultural | 88 | 13.8% |
| Physical & Health Sciences | 41 | 6.5% |
| Psychology | 50 | 7.9% |
| Social Sciences | 18 | 2.8% |
| Engineering | 0 | 0.0% |
| Multidisciplinary Studies | 17 | 2.7% |
| Science & Technology | 16 | 2.5% |
| Business | 121 | 19.0% |
| Education | 101 | 15.9% |
| Literature & Languages | 6 | 0.9% |
| Liberal Arts & History | 32 | 5.0% |
| Visual & Performing Arts | 40 | 6.3% |
| Communications | 0 | 0.0% |
| Arts & Humanities | 76 | 11.9% |
| Total | 636 | 100.0% |
Transportation & Commute in Bangor Base
Vehicle Availability by Sex in Bangor Base
The most prevalent vehicle ownership categories in Bangor Base are males with 2 vehicles (622, accounting for 57.9%) and females with 2 vehicles (269, making up 147.4%).
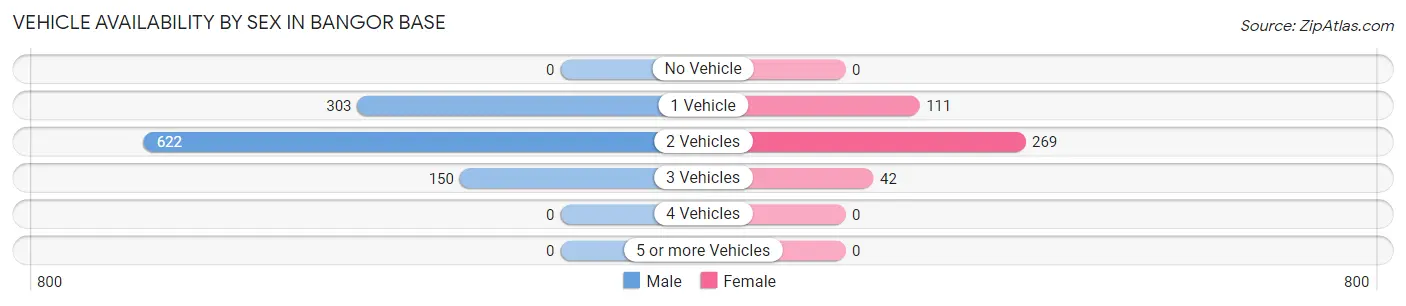
| Vehicles Available | Male | Female |
| No Vehicle | 0 (0.0%) | 0 (0.0%) |
| 1 Vehicle | 303 (28.2%) | 111 (26.3%) |
| 2 Vehicles | 622 (57.9%) | 269 (63.7%) |
| 3 Vehicles | 150 (14.0%) | 42 (10.0%) |
| 4 Vehicles | 0 (0.0%) | 0 (0.0%) |
| 5 or more Vehicles | 0 (0.0%) | 0 (0.0%) |
| Total | 1,075 (100.0%) | 422 (100.0%) |
Commute Time in Bangor Base
The most frequently occuring commute durations in Bangor Base are 15 to 19 minutes (875 commuters, 23.3%), 10 to 14 minutes (761 commuters, 20.3%), and 5 to 9 minutes (682 commuters, 18.2%).
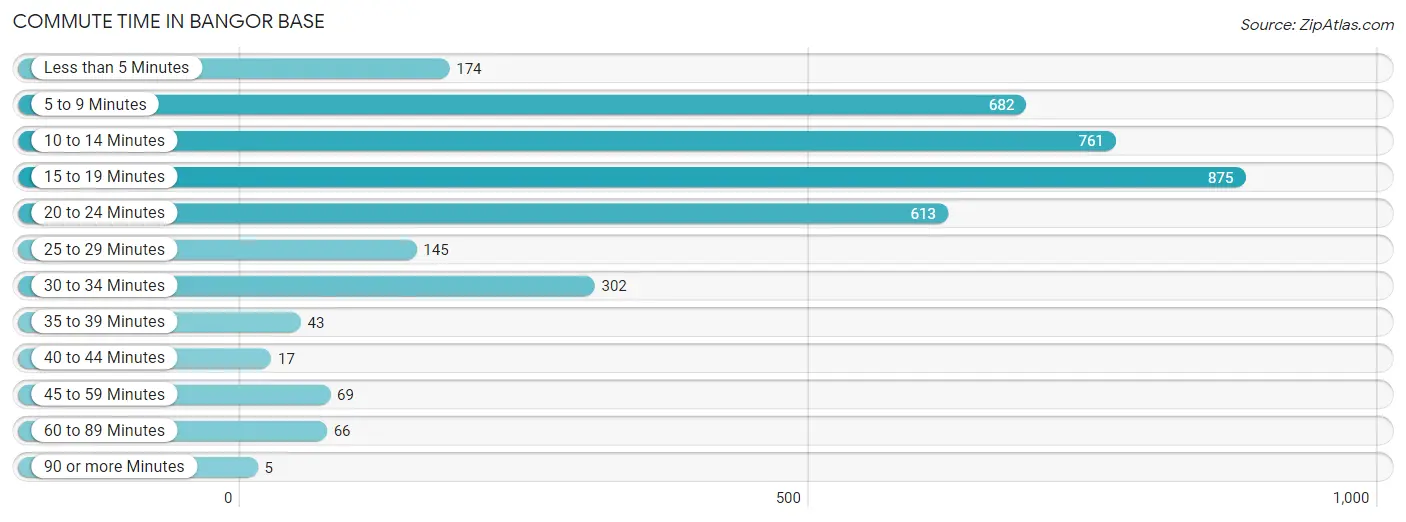
| Commute Time | # Commuters | % Commuters |
| Less than 5 Minutes | 174 | 4.6% |
| 5 to 9 Minutes | 682 | 18.2% |
| 10 to 14 Minutes | 761 | 20.3% |
| 15 to 19 Minutes | 875 | 23.3% |
| 20 to 24 Minutes | 613 | 16.3% |
| 25 to 29 Minutes | 145 | 3.9% |
| 30 to 34 Minutes | 302 | 8.1% |
| 35 to 39 Minutes | 43 | 1.1% |
| 40 to 44 Minutes | 17 | 0.4% |
| 45 to 59 Minutes | 69 | 1.8% |
| 60 to 89 Minutes | 66 | 1.8% |
| 90 or more Minutes | 5 | 0.1% |
Commute Time by Sex in Bangor Base
The most common commute times in Bangor Base are 10 to 14 minutes (691 commuters, 22.3%) for males and 15 to 19 minutes (227 commuters, 34.5%) for females.
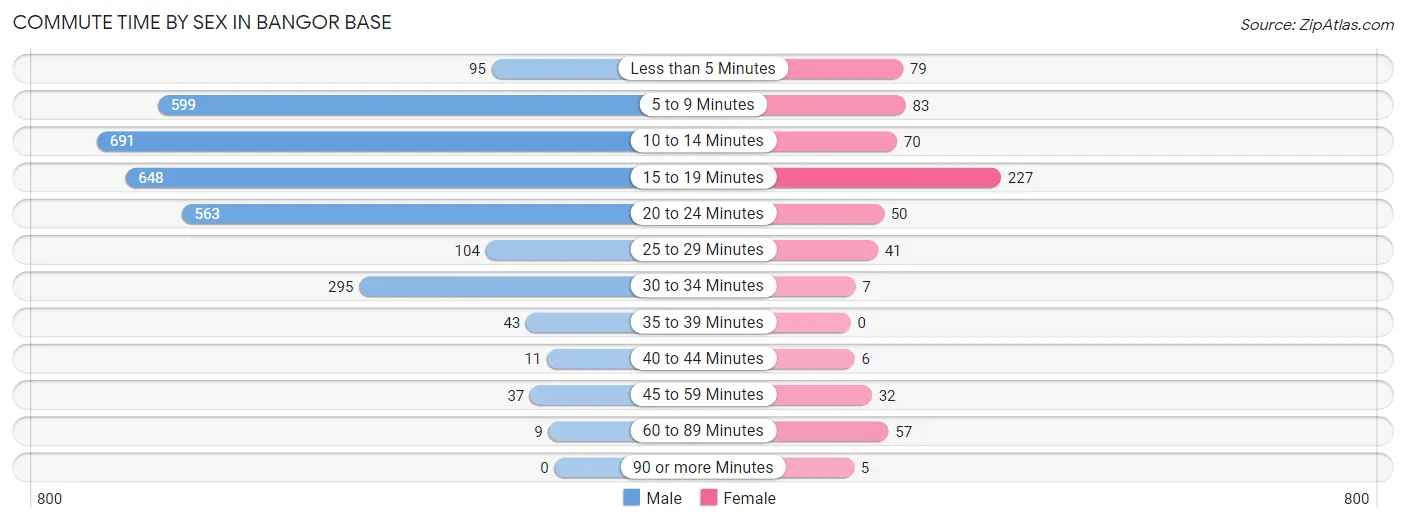
| Commute Time | Male | Female |
| Less than 5 Minutes | 95 (3.1%) | 79 (12.0%) |
| 5 to 9 Minutes | 599 (19.4%) | 83 (12.6%) |
| 10 to 14 Minutes | 691 (22.3%) | 70 (10.6%) |
| 15 to 19 Minutes | 648 (20.9%) | 227 (34.5%) |
| 20 to 24 Minutes | 563 (18.2%) | 50 (7.6%) |
| 25 to 29 Minutes | 104 (3.4%) | 41 (6.2%) |
| 30 to 34 Minutes | 295 (9.5%) | 7 (1.1%) |
| 35 to 39 Minutes | 43 (1.4%) | 0 (0.0%) |
| 40 to 44 Minutes | 11 (0.4%) | 6 (0.9%) |
| 45 to 59 Minutes | 37 (1.2%) | 32 (4.9%) |
| 60 to 89 Minutes | 9 (0.3%) | 57 (8.7%) |
| 90 or more Minutes | 0 (0.0%) | 5 (0.8%) |
Time of Departure to Work by Sex in Bangor Base
The most frequent times of departure to work in Bangor Base are 6:00 AM to 6:29 AM (610, 19.7%) for males and 4:00 PM to 11:59 PM (118, 18.0%) for females.
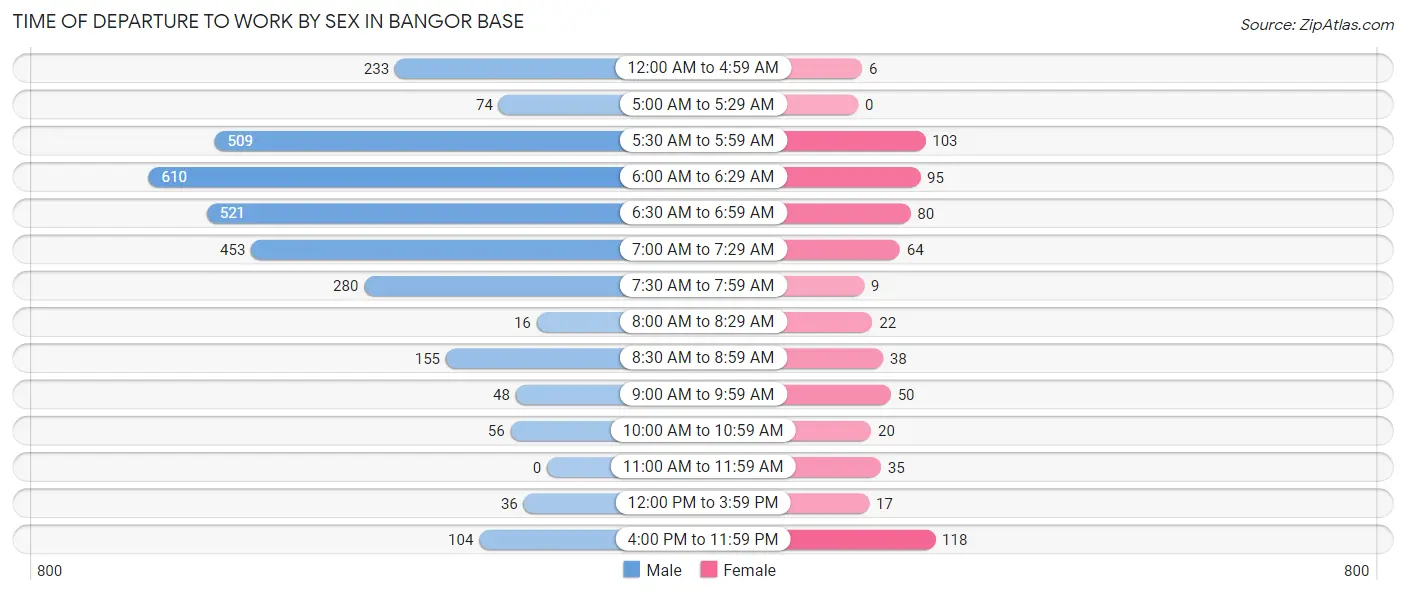
| Time of Departure | Male | Female |
| 12:00 AM to 4:59 AM | 233 (7.5%) | 6 (0.9%) |
| 5:00 AM to 5:29 AM | 74 (2.4%) | 0 (0.0%) |
| 5:30 AM to 5:59 AM | 509 (16.5%) | 103 (15.7%) |
| 6:00 AM to 6:29 AM | 610 (19.7%) | 95 (14.5%) |
| 6:30 AM to 6:59 AM | 521 (16.8%) | 80 (12.2%) |
| 7:00 AM to 7:29 AM | 453 (14.6%) | 64 (9.7%) |
| 7:30 AM to 7:59 AM | 280 (9.0%) | 9 (1.4%) |
| 8:00 AM to 8:29 AM | 16 (0.5%) | 22 (3.4%) |
| 8:30 AM to 8:59 AM | 155 (5.0%) | 38 (5.8%) |
| 9:00 AM to 9:59 AM | 48 (1.5%) | 50 (7.6%) |
| 10:00 AM to 10:59 AM | 56 (1.8%) | 20 (3.0%) |
| 11:00 AM to 11:59 AM | 0 (0.0%) | 35 (5.3%) |
| 12:00 PM to 3:59 PM | 36 (1.2%) | 17 (2.6%) |
| 4:00 PM to 11:59 PM | 104 (3.4%) | 118 (18.0%) |
| Total | 3,095 (100.0%) | 657 (100.0%) |
Housing Occupancy in Bangor Base
Occupancy by Ownership in Bangor Base
Of the total 1,086 dwellings in Bangor Base, owner-occupied units account for 11 (1.0%), while renter-occupied units make up 1,075 (99.0%).
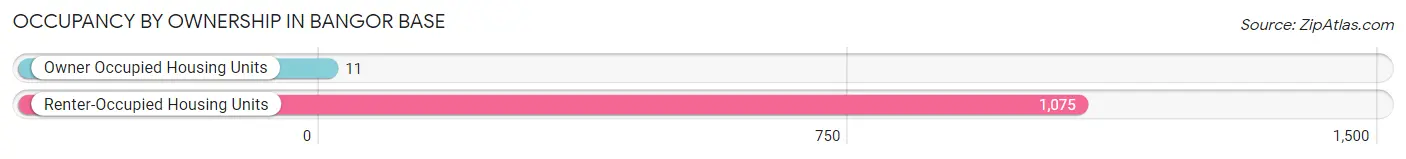
| Occupancy | # Housing Units | % Housing Units |
| Owner Occupied Housing Units | 11 | 1.0% |
| Renter-Occupied Housing Units | 1,075 | 99.0% |
| Total Occupied Housing Units | 1,086 | 100.0% |
Occupancy by Household Size in Bangor Base
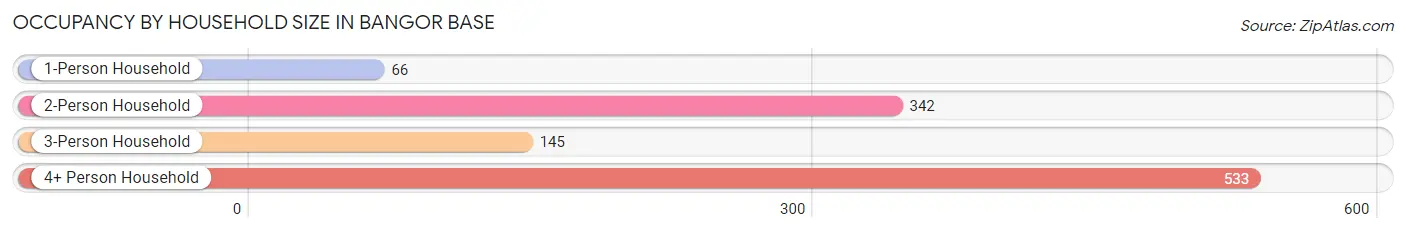
| Household Size | # Housing Units | % Housing Units |
| 1-Person Household | 66 | 6.1% |
| 2-Person Household | 342 | 31.5% |
| 3-Person Household | 145 | 13.4% |
| 4+ Person Household | 533 | 49.1% |
| Total Housing Units | 1,086 | 100.0% |
Occupancy by Ownership by Household Size in Bangor Base
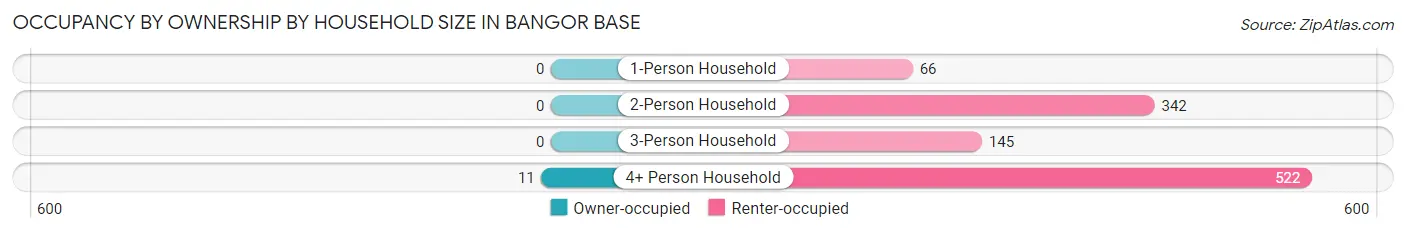
| Household Size | Owner-occupied | Renter-occupied |
| 1-Person Household | 0 (0.0%) | 66 (100.0%) |
| 2-Person Household | 0 (0.0%) | 342 (100.0%) |
| 3-Person Household | 0 (0.0%) | 145 (100.0%) |
| 4+ Person Household | 11 (2.1%) | 522 (97.9%) |
| Total Housing Units | 11 (1.0%) | 1,075 (99.0%) |
Occupancy by Educational Attainment in Bangor Base
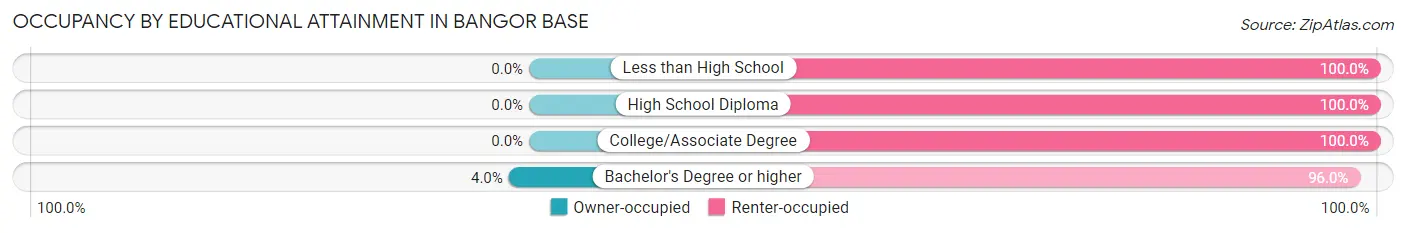
| Household Size | Owner-occupied | Renter-occupied |
| Less than High School | 0 (0.0%) | 5 (100.0%) |
| High School Diploma | 0 (0.0%) | 262 (100.0%) |
| College/Associate Degree | 0 (0.0%) | 547 (100.0%) |
| Bachelor's Degree or higher | 11 (4.0%) | 261 (96.0%) |
Occupancy by Age of Householder in Bangor Base
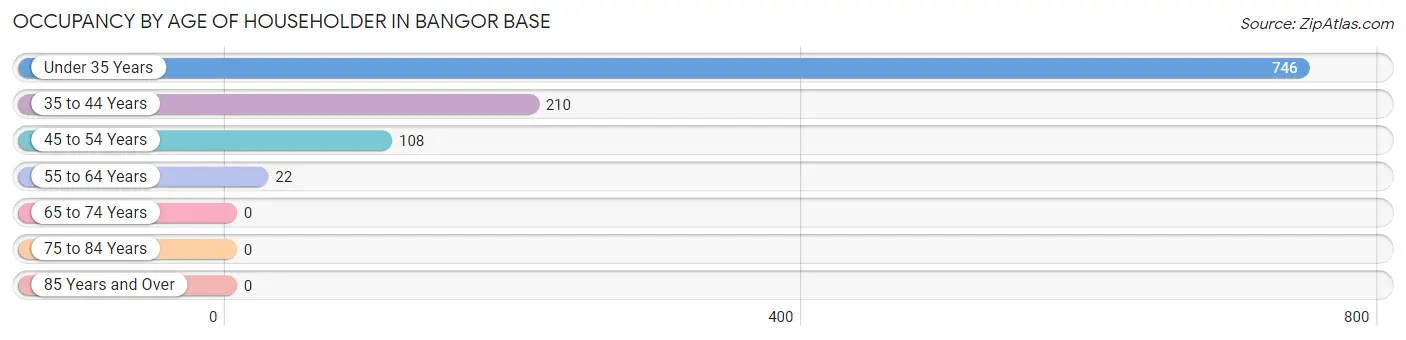
| Age Bracket | # Households | % Households |
| Under 35 Years | 746 | 68.7% |
| 35 to 44 Years | 210 | 19.3% |
| 45 to 54 Years | 108 | 9.9% |
| 55 to 64 Years | 22 | 2.0% |
| 65 to 74 Years | 0 | 0.0% |
| 75 to 84 Years | 0 | 0.0% |
| 85 Years and Over | 0 | 0.0% |
| Total | 1,086 | 100.0% |
Housing Finances in Bangor Base
Median Income by Occupancy in Bangor Base
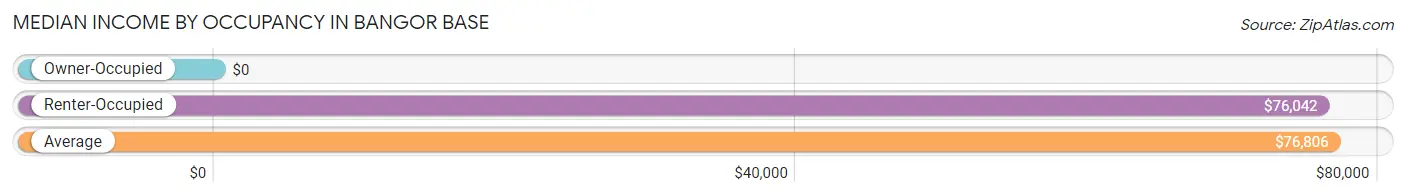
| Occupancy Type | # Households | Median Income |
| Owner-Occupied | 11 (1.0%) | $0 |
| Renter-Occupied | 1,075 (99.0%) | $76,042 |
| Average | 1,086 (100.0%) | $76,806 |
Occupancy by Householder Income Bracket in Bangor Base
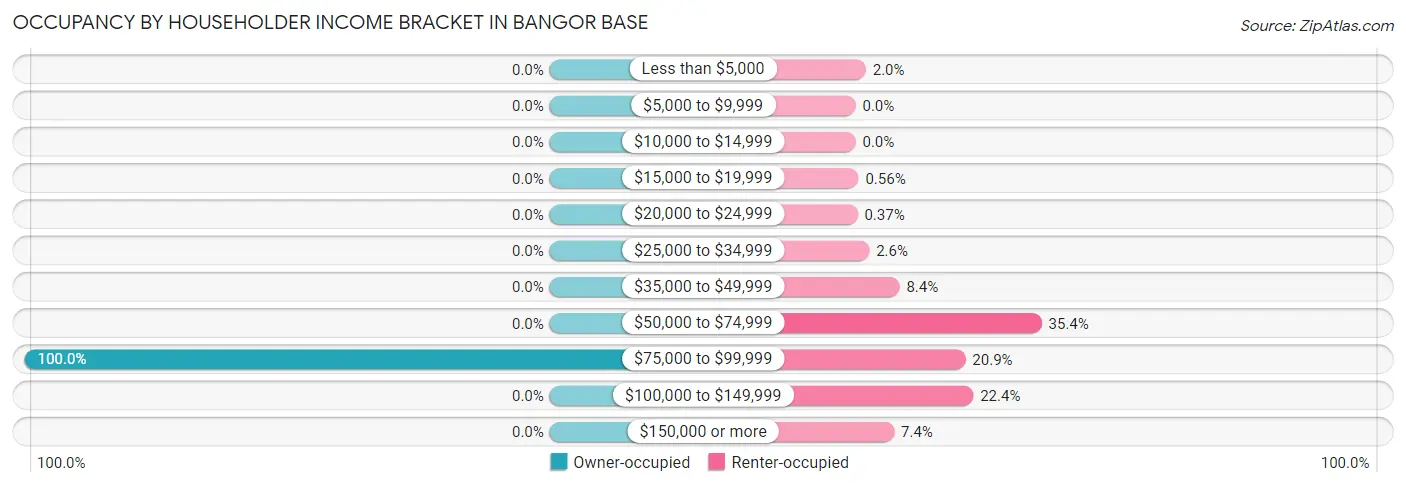
| Income Bracket | Owner-occupied | Renter-occupied |
| Less than $5,000 | 0 (0.0%) | 21 (1.9%) |
| $5,000 to $9,999 | 0 (0.0%) | 0 (0.0%) |
| $10,000 to $14,999 | 0 (0.0%) | 0 (0.0%) |
| $15,000 to $19,999 | 0 (0.0%) | 6 (0.6%) |
| $20,000 to $24,999 | 0 (0.0%) | 4 (0.4%) |
| $25,000 to $34,999 | 0 (0.0%) | 28 (2.6%) |
| $35,000 to $49,999 | 0 (0.0%) | 90 (8.4%) |
| $50,000 to $74,999 | 0 (0.0%) | 381 (35.4%) |
| $75,000 to $99,999 | 11 (100.0%) | 225 (20.9%) |
| $100,000 to $149,999 | 0 (0.0%) | 241 (22.4%) |
| $150,000 or more | 0 (0.0%) | 79 (7.3%) |
| Total | 11 (100.0%) | 1,075 (100.0%) |
Monthly Housing Cost Tiers in Bangor Base
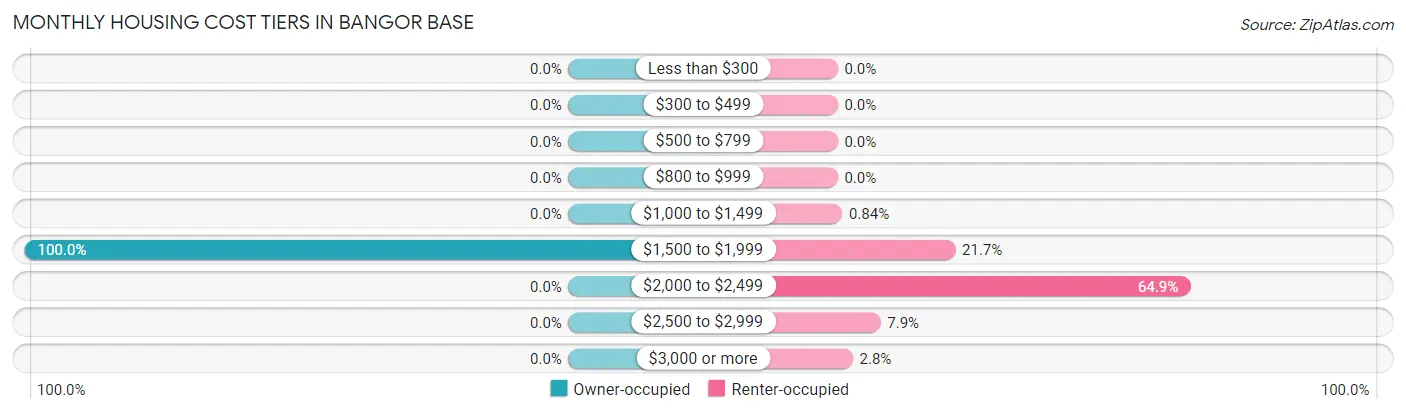
| Monthly Cost | Owner-occupied | Renter-occupied |
| Less than $300 | 0 (0.0%) | 0 (0.0%) |
| $300 to $499 | 0 (0.0%) | 0 (0.0%) |
| $500 to $799 | 0 (0.0%) | 0 (0.0%) |
| $800 to $999 | 0 (0.0%) | 0 (0.0%) |
| $1,000 to $1,499 | 0 (0.0%) | 9 (0.8%) |
| $1,500 to $1,999 | 11 (100.0%) | 233 (21.7%) |
| $2,000 to $2,499 | 0 (0.0%) | 698 (64.9%) |
| $2,500 to $2,999 | 0 (0.0%) | 85 (7.9%) |
| $3,000 or more | 0 (0.0%) | 30 (2.8%) |
| Total | 11 (100.0%) | 1,075 (100.0%) |
Physical Housing Characteristics in Bangor Base
Housing Structures in Bangor Base
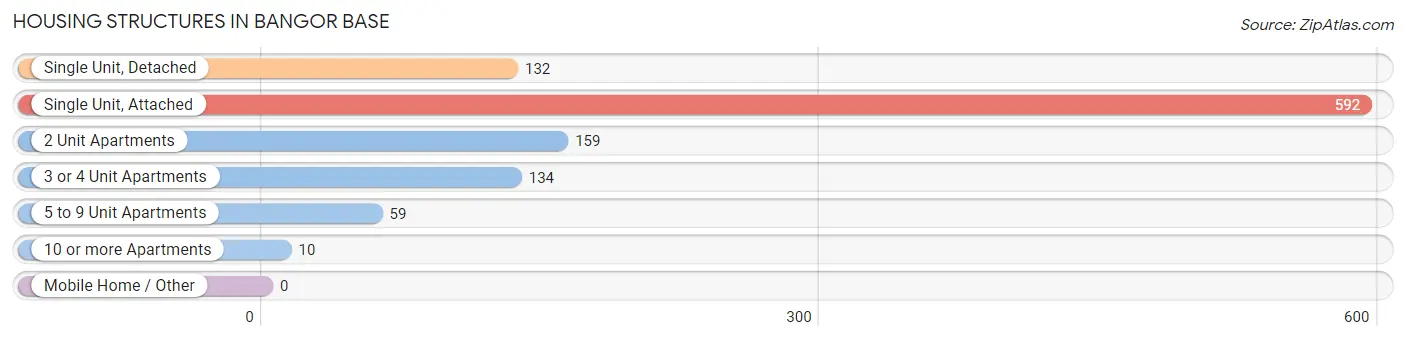
| Structure Type | # Housing Units | % Housing Units |
| Single Unit, Detached | 132 | 12.1% |
| Single Unit, Attached | 592 | 54.5% |
| 2 Unit Apartments | 159 | 14.6% |
| 3 or 4 Unit Apartments | 134 | 12.3% |
| 5 to 9 Unit Apartments | 59 | 5.4% |
| 10 or more Apartments | 10 | 0.9% |
| Mobile Home / Other | 0 | 0.0% |
| Total | 1,086 | 100.0% |
Housing Structures by Occupancy in Bangor Base
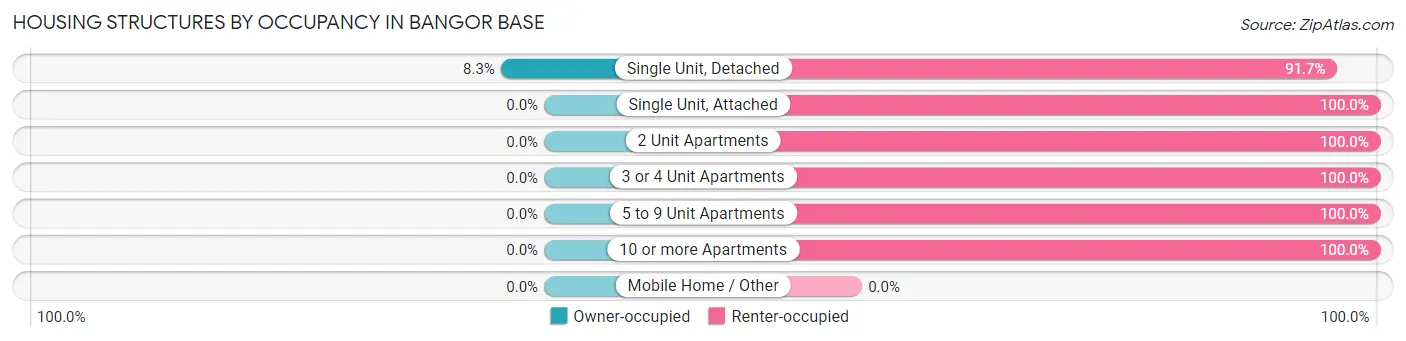
| Structure Type | Owner-occupied | Renter-occupied |
| Single Unit, Detached | 11 (8.3%) | 121 (91.7%) |
| Single Unit, Attached | 0 (0.0%) | 592 (100.0%) |
| 2 Unit Apartments | 0 (0.0%) | 159 (100.0%) |
| 3 or 4 Unit Apartments | 0 (0.0%) | 134 (100.0%) |
| 5 to 9 Unit Apartments | 0 (0.0%) | 59 (100.0%) |
| 10 or more Apartments | 0 (0.0%) | 10 (100.0%) |
| Mobile Home / Other | 0 (0.0%) | 0 (0.0%) |
| Total | 11 (1.0%) | 1,075 (99.0%) |
Housing Structures by Number of Rooms in Bangor Base
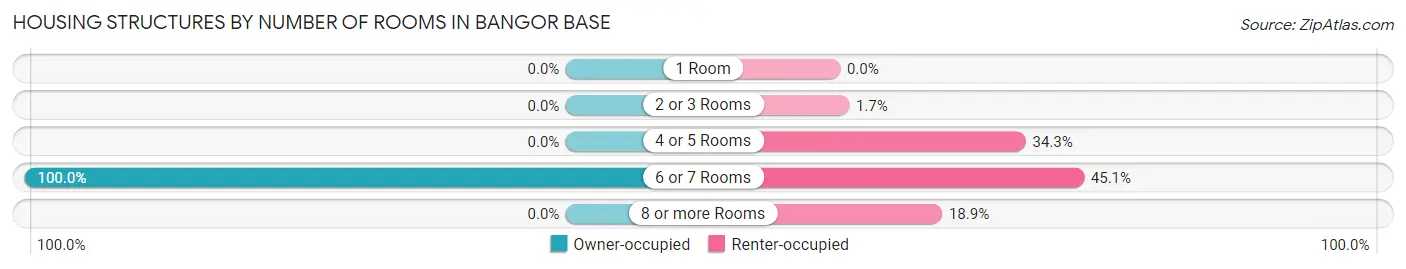
| Number of Rooms | Owner-occupied | Renter-occupied |
| 1 Room | 0 (0.0%) | 0 (0.0%) |
| 2 or 3 Rooms | 0 (0.0%) | 18 (1.7%) |
| 4 or 5 Rooms | 0 (0.0%) | 369 (34.3%) |
| 6 or 7 Rooms | 11 (100.0%) | 485 (45.1%) |
| 8 or more Rooms | 0 (0.0%) | 203 (18.9%) |
| Total | 11 (100.0%) | 1,075 (100.0%) |
Housing Structure by Heating Type in Bangor Base
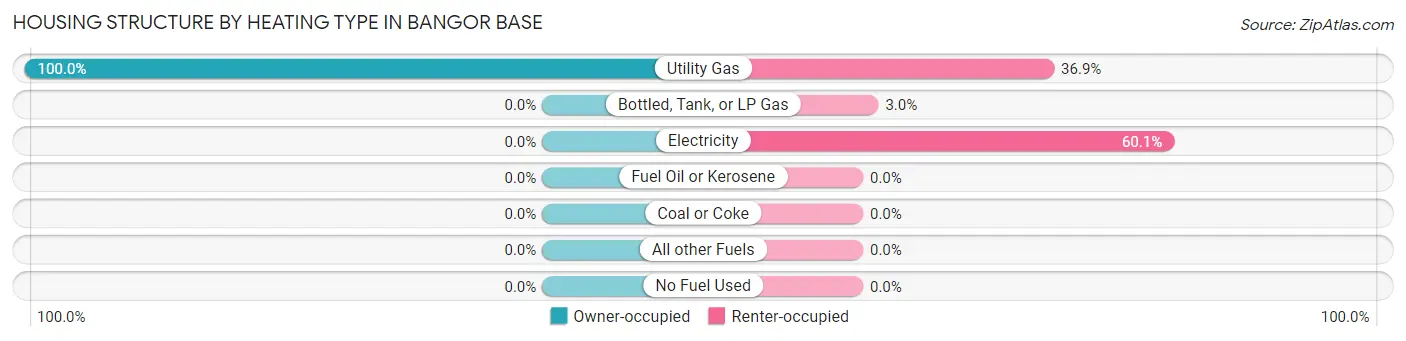
| Heating Type | Owner-occupied | Renter-occupied |
| Utility Gas | 11 (100.0%) | 397 (36.9%) |
| Bottled, Tank, or LP Gas | 0 (0.0%) | 32 (3.0%) |
| Electricity | 0 (0.0%) | 646 (60.1%) |
| Fuel Oil or Kerosene | 0 (0.0%) | 0 (0.0%) |
| Coal or Coke | 0 (0.0%) | 0 (0.0%) |
| All other Fuels | 0 (0.0%) | 0 (0.0%) |
| No Fuel Used | 0 (0.0%) | 0 (0.0%) |
| Total | 11 (100.0%) | 1,075 (100.0%) |
Household Vehicle Usage in Bangor Base
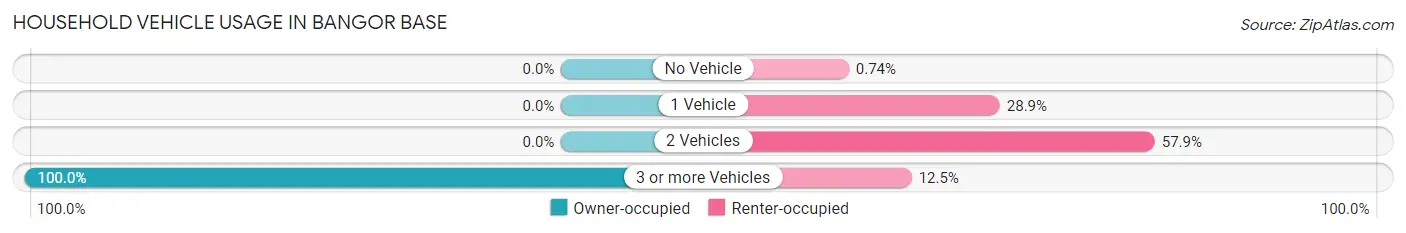
| Vehicles per Household | Owner-occupied | Renter-occupied |
| No Vehicle | 0 (0.0%) | 8 (0.7%) |
| 1 Vehicle | 0 (0.0%) | 311 (28.9%) |
| 2 Vehicles | 0 (0.0%) | 622 (57.9%) |
| 3 or more Vehicles | 11 (100.0%) | 134 (12.5%) |
| Total | 11 (100.0%) | 1,075 (100.0%) |
Real Estate & Mortgages in Bangor Base
Real Estate and Mortgage Overview in Bangor Base
| Characteristic | Without Mortgage | With Mortgage |
| Housing Units | 0 | 11 |
| Median Property Value | - | - |
| Median Household Income | - | - |
| Monthly Housing Costs | - | - |
| Real Estate Taxes | - | - |
Property Value by Mortgage Status in Bangor Base
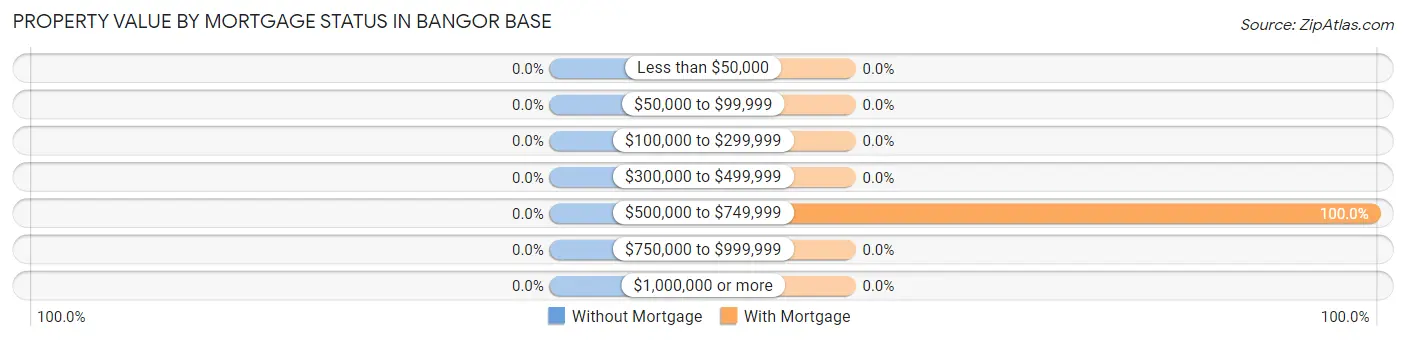
| Property Value | Without Mortgage | With Mortgage |
| Less than $50,000 | 0 (0.0%) | 0 (0.0%) |
| $50,000 to $99,999 | 0 (0.0%) | 0 (0.0%) |
| $100,000 to $299,999 | 0 (0.0%) | 0 (0.0%) |
| $300,000 to $499,999 | 0 (0.0%) | 0 (0.0%) |
| $500,000 to $749,999 | 0 (0.0%) | 11 (100.0%) |
| $750,000 to $999,999 | 0 (0.0%) | 0 (0.0%) |
| $1,000,000 or more | 0 (0.0%) | 0 (0.0%) |
| Total | 0 (0.0%) | 11 (100.0%) |
Household Income by Mortgage Status in Bangor Base
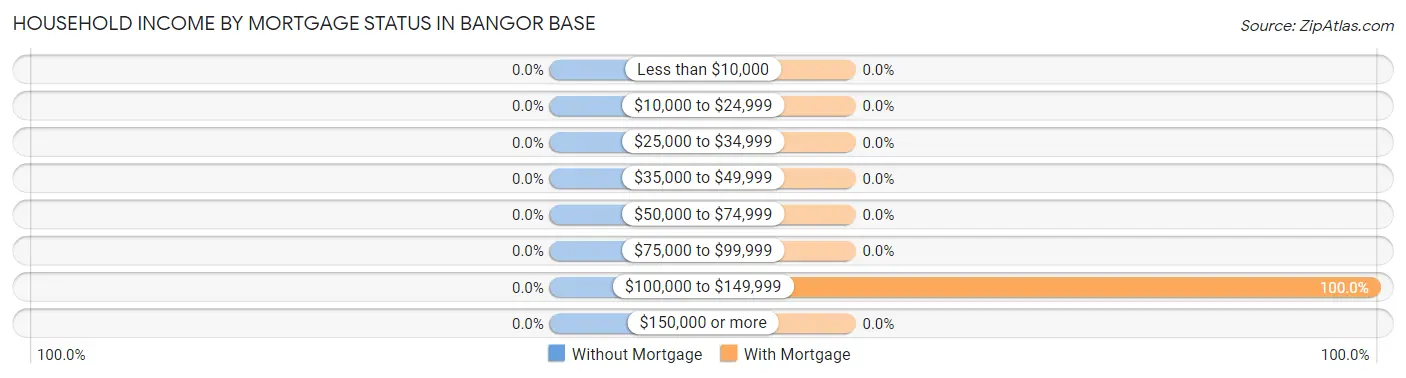
| Household Income | Without Mortgage | With Mortgage |
| Less than $10,000 | 0 (0.0%) | 0 (0.0%) |
| $10,000 to $24,999 | 0 (0.0%) | 0 (0.0%) |
| $25,000 to $34,999 | 0 (0.0%) | 0 (0.0%) |
| $35,000 to $49,999 | 0 (0.0%) | 0 (0.0%) |
| $50,000 to $74,999 | 0 (0.0%) | 0 (0.0%) |
| $75,000 to $99,999 | 0 (0.0%) | 0 (0.0%) |
| $100,000 to $149,999 | 0 (0.0%) | 11 (100.0%) |
| $150,000 or more | 0 (0.0%) | 0 (0.0%) |
| Total | 0 (0.0%) | 11 (100.0%) |
Property Value to Household Income Ratio in Bangor Base
| Value-to-Income Ratio | Without Mortgage | With Mortgage |
| Less than 2.0x | 0 (0.0%) | 0 (0.0%) |
| 2.0x to 2.9x | 0 (0.0%) | 0 (0.0%) |
| 3.0x to 3.9x | 0 (0.0%) | 0 (0.0%) |
| 4.0x or more | 0 (0.0%) | 0 (0.0%) |
| Total | 0 (0.0%) | 11 (100.0%) |
Real Estate Taxes by Mortgage Status in Bangor Base
| Property Taxes | Without Mortgage | With Mortgage |
| Less than $800 | 0 (0.0%) | 0 (0.0%) |
| $800 to $1,499 | 0 (0.0%) | 0 (0.0%) |
| $800 to $1,499 | 0 (0.0%) | 0 (0.0%) |
| Total | 0 (0.0%) | 11 (100.0%) |
Health & Disability in Bangor Base
Health Insurance Coverage by Age in Bangor Base
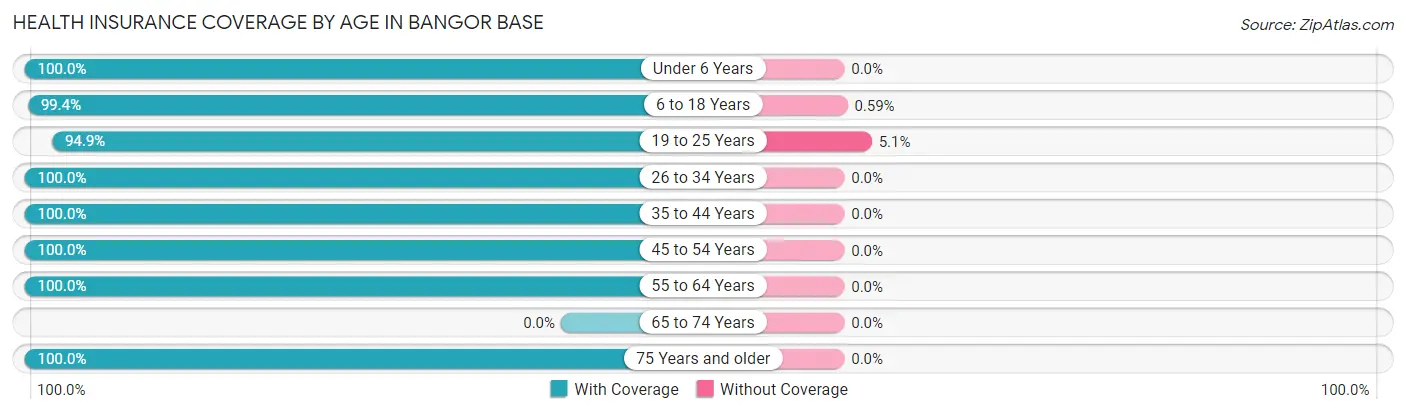
| Age Bracket | With Coverage | Without Coverage |
| Under 6 Years | 727 (100.0%) | 0 (0.0%) |
| 6 to 18 Years | 840 (99.4%) | 5 (0.6%) |
| 19 to 25 Years | 167 (94.9%) | 9 (5.1%) |
| 26 to 34 Years | 498 (100.0%) | 0 (0.0%) |
| 35 to 44 Years | 218 (100.0%) | 0 (0.0%) |
| 45 to 54 Years | 104 (100.0%) | 0 (0.0%) |
| 55 to 64 Years | 62 (100.0%) | 0 (0.0%) |
| 65 to 74 Years | 0 (0.0%) | 0 (0.0%) |
| 75 Years and older | 12 (100.0%) | 0 (0.0%) |
| Total | 2,628 (99.5%) | 14 (0.5%) |
Health Insurance Coverage by Citizenship Status in Bangor Base
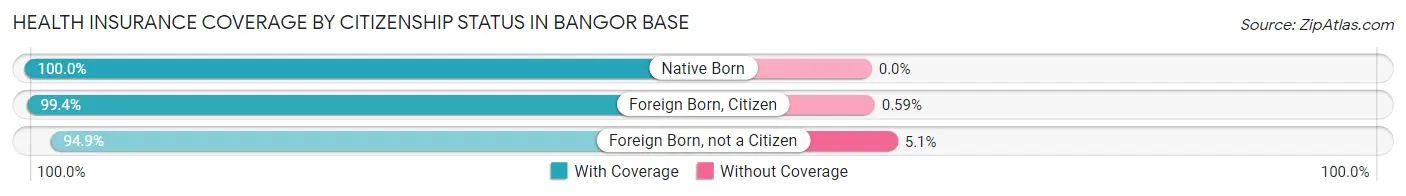
| Citizenship Status | With Coverage | Without Coverage |
| Native Born | 727 (100.0%) | 0 (0.0%) |
| Foreign Born, Citizen | 840 (99.4%) | 5 (0.6%) |
| Foreign Born, not a Citizen | 167 (94.9%) | 9 (5.1%) |
Health Insurance Coverage by Household Income in Bangor Base
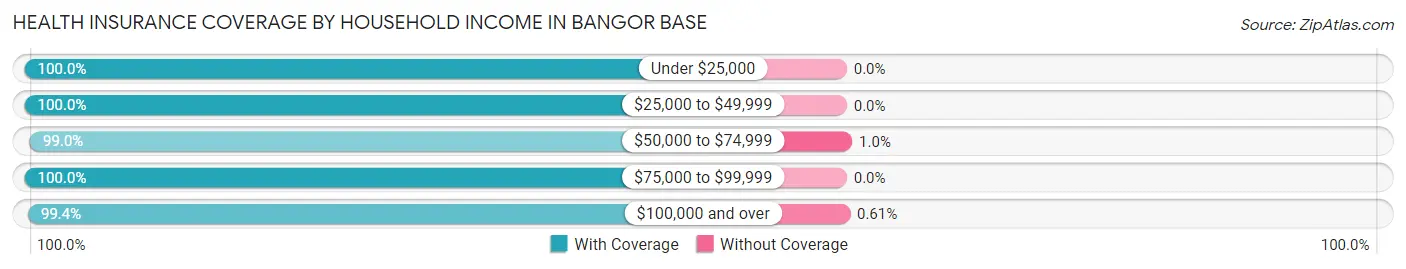
| Household Income | With Coverage | Without Coverage |
| Under $25,000 | 73 (100.0%) | 0 (0.0%) |
| $25,000 to $49,999 | 325 (100.0%) | 0 (0.0%) |
| $50,000 to $74,999 | 891 (99.0%) | 9 (1.0%) |
| $75,000 to $99,999 | 519 (100.0%) | 0 (0.0%) |
| $100,000 and over | 820 (99.4%) | 5 (0.6%) |
Public vs Private Health Insurance Coverage by Age in Bangor Base
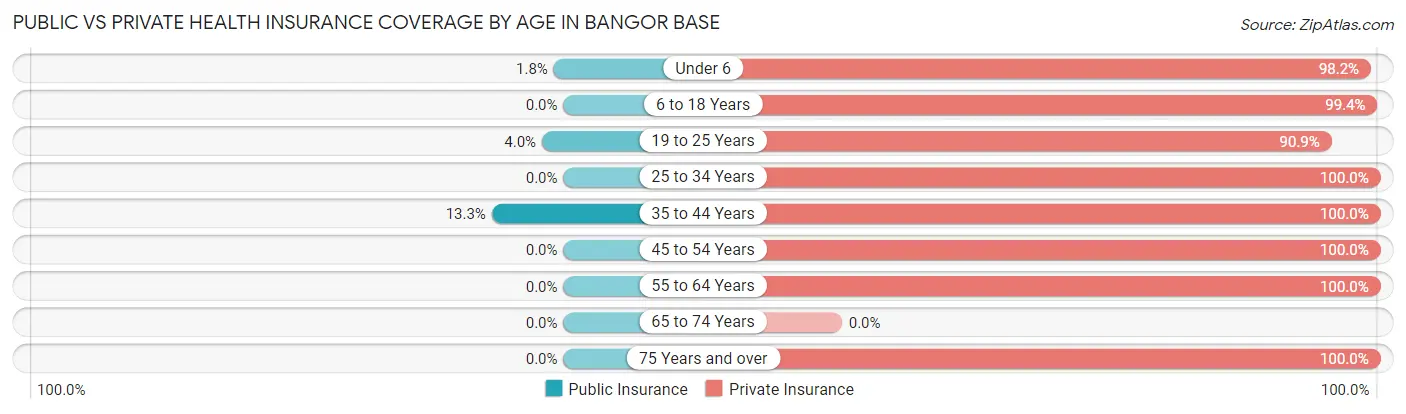
| Age Bracket | Public Insurance | Private Insurance |
| Under 6 | 13 (1.8%) | 714 (98.2%) |
| 6 to 18 Years | 0 (0.0%) | 840 (99.4%) |
| 19 to 25 Years | 7 (4.0%) | 160 (90.9%) |
| 25 to 34 Years | 0 (0.0%) | 498 (100.0%) |
| 35 to 44 Years | 29 (13.3%) | 218 (100.0%) |
| 45 to 54 Years | 0 (0.0%) | 104 (100.0%) |
| 55 to 64 Years | 0 (0.0%) | 62 (100.0%) |
| 65 to 74 Years | 0 (0.0%) | 0 (0.0%) |
| 75 Years and over | 0 (0.0%) | 12 (100.0%) |
| Total | 49 (1.8%) | 2,608 (98.7%) |
Disability Status by Sex by Age in Bangor Base
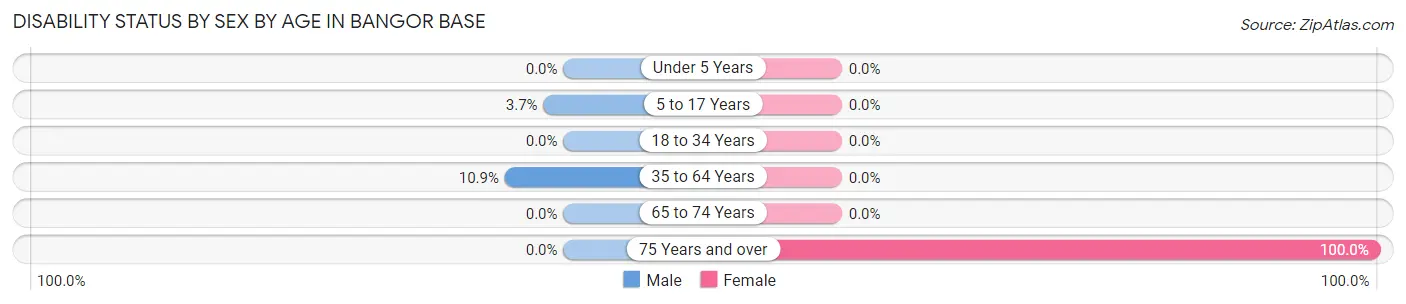
| Age Bracket | Male | Female |
| Under 5 Years | 0 (0.0%) | 0 (0.0%) |
| 5 to 17 Years | 14 (3.7%) | 0 (0.0%) |
| 18 to 34 Years | 0 (0.0%) | 0 (0.0%) |
| 35 to 64 Years | 10 (10.9%) | 0 (0.0%) |
| 65 to 74 Years | 0 (0.0%) | 0 (0.0%) |
| 75 Years and over | 0 (0.0%) | 12 (100.0%) |
Disability Class by Sex by Age in Bangor Base
Disability Class: Hearing Difficulty
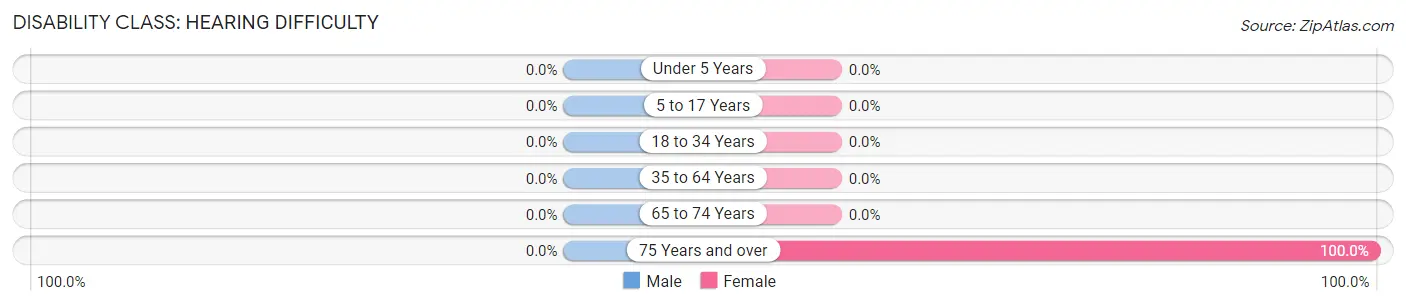
| Age Bracket | Male | Female |
| Under 5 Years | 0 (0.0%) | 0 (0.0%) |
| 5 to 17 Years | 0 (0.0%) | 0 (0.0%) |
| 18 to 34 Years | 0 (0.0%) | 0 (0.0%) |
| 35 to 64 Years | 0 (0.0%) | 0 (0.0%) |
| 65 to 74 Years | 0 (0.0%) | 0 (0.0%) |
| 75 Years and over | 0 (0.0%) | 12 (100.0%) |
Disability Class: Vision Difficulty
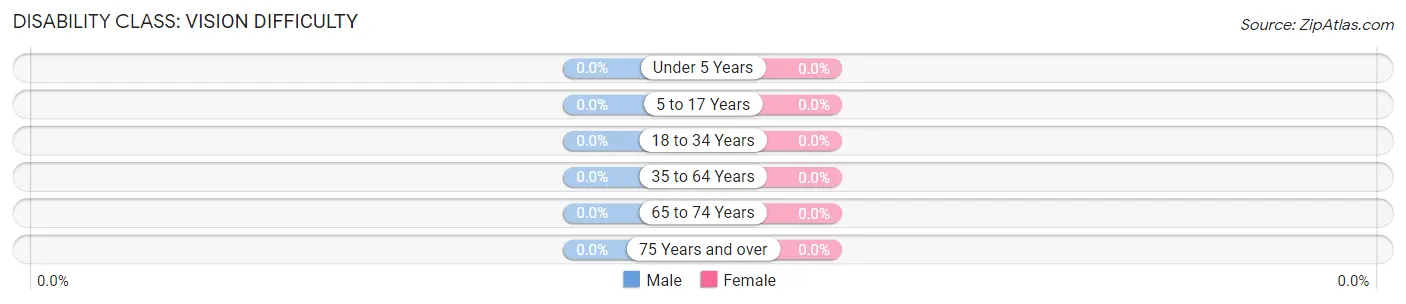
| Age Bracket | Male | Female |
| Under 5 Years | 0 (0.0%) | 0 (0.0%) |
| 5 to 17 Years | 0 (0.0%) | 0 (0.0%) |
| 18 to 34 Years | 0 (0.0%) | 0 (0.0%) |
| 35 to 64 Years | 0 (0.0%) | 0 (0.0%) |
| 65 to 74 Years | 0 (0.0%) | 0 (0.0%) |
| 75 Years and over | 0 (0.0%) | 0 (0.0%) |
Disability Class: Cognitive Difficulty
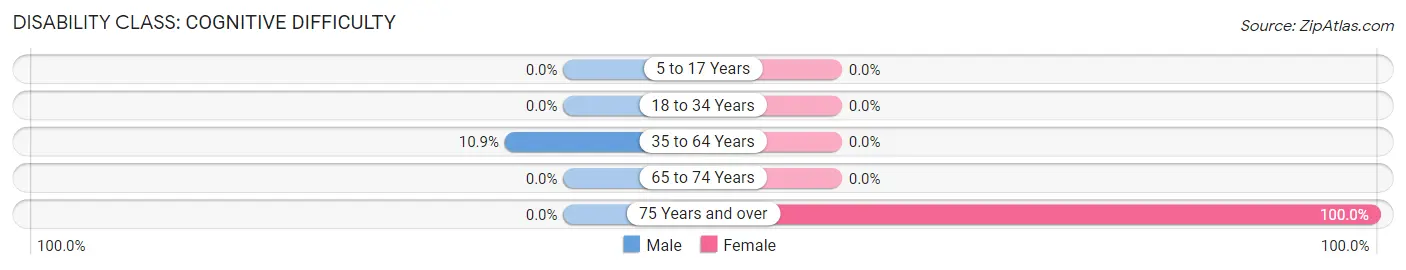
| Age Bracket | Male | Female |
| 5 to 17 Years | 0 (0.0%) | 0 (0.0%) |
| 18 to 34 Years | 0 (0.0%) | 0 (0.0%) |
| 35 to 64 Years | 10 (10.9%) | 0 (0.0%) |
| 65 to 74 Years | 0 (0.0%) | 0 (0.0%) |
| 75 Years and over | 0 (0.0%) | 12 (100.0%) |
Disability Class: Ambulatory Difficulty
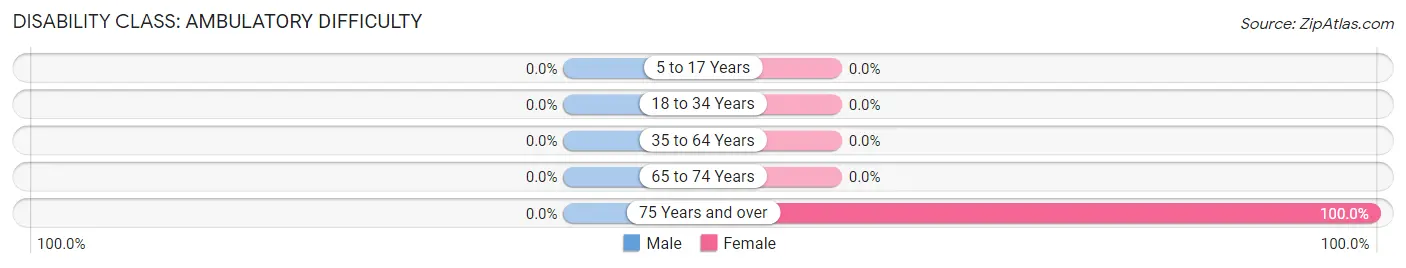
| Age Bracket | Male | Female |
| 5 to 17 Years | 0 (0.0%) | 0 (0.0%) |
| 18 to 34 Years | 0 (0.0%) | 0 (0.0%) |
| 35 to 64 Years | 0 (0.0%) | 0 (0.0%) |
| 65 to 74 Years | 0 (0.0%) | 0 (0.0%) |
| 75 Years and over | 0 (0.0%) | 12 (100.0%) |
Disability Class: Self-Care Difficulty
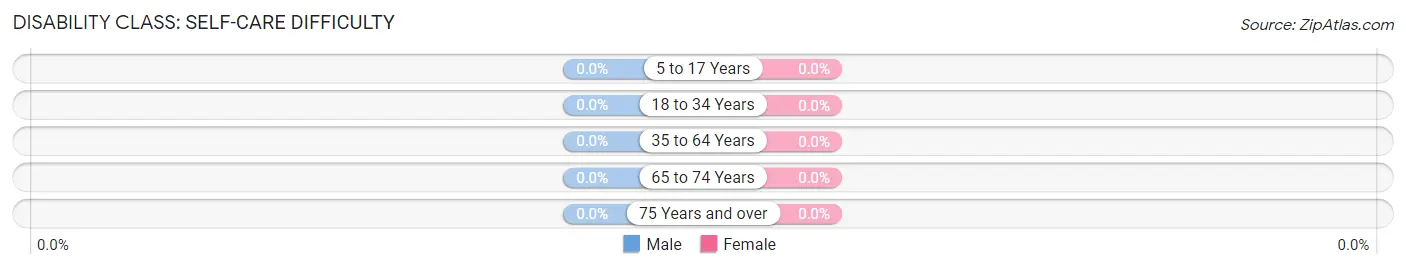
| Age Bracket | Male | Female |
| 5 to 17 Years | 0 (0.0%) | 0 (0.0%) |
| 18 to 34 Years | 0 (0.0%) | 0 (0.0%) |
| 35 to 64 Years | 0 (0.0%) | 0 (0.0%) |
| 65 to 74 Years | 0 (0.0%) | 0 (0.0%) |
| 75 Years and over | 0 (0.0%) | 0 (0.0%) |
Technology Access in Bangor Base
Computing Device Access in Bangor Base
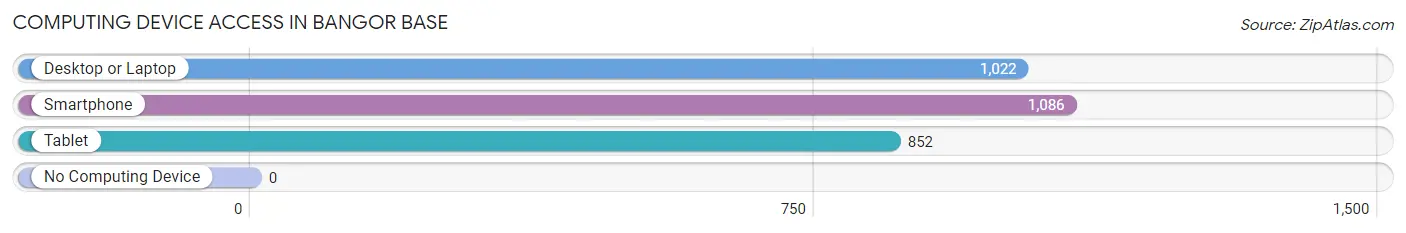
| Device Type | # Households | % Households |
| Desktop or Laptop | 1,022 | 94.1% |
| Smartphone | 1,086 | 100.0% |
| Tablet | 852 | 78.4% |
| No Computing Device | 0 | 0.0% |
| Total | 1,086 | 100.0% |
Internet Access in Bangor Base
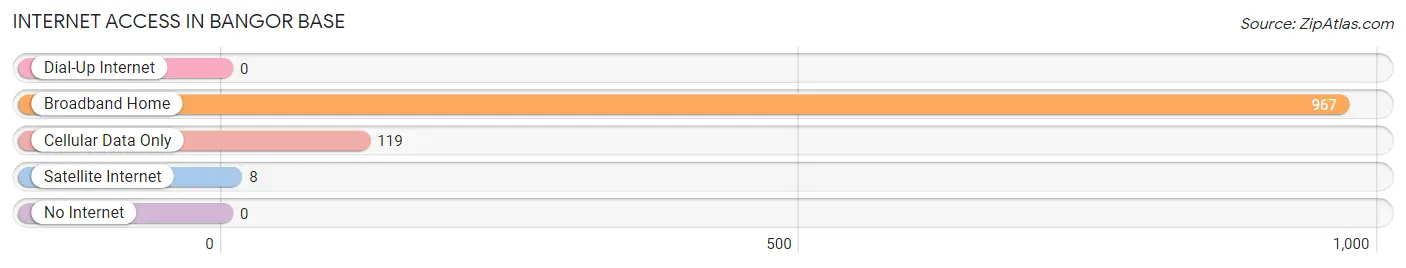
| Internet Type | # Households | % Households |
| Dial-Up Internet | 0 | 0.0% |
| Broadband Home | 967 | 89.0% |
| Cellular Data Only | 119 | 11.0% |
| Satellite Internet | 8 | 0.7% |
| No Internet | 0 | 0.0% |
| Total | 1,086 | 100.0% |
Bangor Base Summary
Bangor Base is a United States Navy submarine base located in Kitsap County, Washington, on the Kitsap Peninsula. It is the largest submarine base in the world, and is home to the Navy's Pacific Fleet of nuclear-powered submarines. The base is located on the Hood Canal, a long, narrow inlet of the Puget Sound, and is approximately 25 miles (40 km) west of Seattle.
History
Bangor Base was established in 1942 as a Naval Ammunition Depot. During World War II, the base was used to store and supply ammunition for the Pacific Fleet. In the 1950s, the base was converted to a submarine base, and the first nuclear-powered submarine, the USS Nautilus, was based there in 1961. Since then, the base has grown to become the largest submarine base in the world, with over 20 submarines and over 10,000 personnel.
Geography
Bangor Base is located on the Kitsap Peninsula, a long, narrow peninsula in western Washington that separates Puget Sound from the Strait of Juan de Fuca. The base is situated on the Hood Canal, a long, narrow inlet of the Puget Sound. The base is approximately 25 miles (40 km) west of Seattle, and is surrounded by the Olympic Mountains to the west and the Cascade Mountains to the east.
Economy
Bangor Base is a major economic driver for the region, providing jobs and economic activity to the surrounding communities. The base is home to over 10,000 personnel, and is the largest employer in Kitsap County. The base also supports a large number of businesses in the area, including hotels, restaurants, and retail stores. In addition, the base is home to a number of research and development facilities, as well as a naval hospital.
Demographics
As of the 2010 census, the population of Bangor Base was 8,845. The racial makeup of the base was 79.3% White, 8.2% African American, 4.2% Asian, 0.7% Native American, and 6.6% from other races. The median household income was $50,945, and the median age was 33.7 years.
Conclusion
Bangor Base is a major economic driver for the region, providing jobs and economic activity to the surrounding communities. The base is home to over 10,000 personnel, and is the largest employer in Kitsap County. The base also supports a large number of businesses in the area, including hotels, restaurants, and retail stores. In addition, the base is home to a number of research and development facilities, as well as a naval hospital. The population of Bangor Base is diverse, with a median household income of $50,945 and a median age of 33.7 years.
Common Questions
What is the Total Population of Bangor Base?
Total Population of Bangor Base is 6,045.
What is the Total Male Population of Bangor Base?
Total Male Population of Bangor Base is 3,972.
What is the Total Female Population of Bangor Base?
Total Female Population of Bangor Base is 2,073.
What is the Ratio of Males per 100 Females in Bangor Base?
There are 191.61 Males per 100 Females in Bangor Base.
What is the Ratio of Females per 100 Males in Bangor Base?
There are 52.19 Females per 100 Males in Bangor Base.
What is the Median Population Age in Bangor Base?
Median Population Age in Bangor Base is 22.8 Years.
What is the Average Family Size in Bangor Base
Average Family Size in Bangor Base is 3.5 People.
What is the Average Household Size in Bangor Base
Average Household Size in Bangor Base is 3.4 People.
What is Per Capita Income in Bangor Base?
Per Capita income in Bangor Base is $27,091.
What is the Median Family Income in Bangor Base?
Median Family Income in Bangor Base is $82,500.
What is the Median Household income in Bangor Base?
Median Household Income in Bangor Base is $76,806.
What is Income or Wage Gap in Bangor Base?
Income or Wage Gap in Bangor Base is 18.2%.
Women in Bangor Base earn 81.8 cents for every dollar earned by a man.
What is Inequality or Gini Index in Bangor Base?
Inequality or Gini Index in Bangor Base is 0.26.
How Large is the Labor Force in Bangor Base?
There are 3,937 People in the Labor Forcein in Bangor Base.
What is the Percentage of People in the Labor Force in Bangor Base?
86.6% of People are in the Labor Force in Bangor Base.
What is the Unemployment Rate in Bangor Base?
Unemployment Rate in Bangor Base is 3.4%.