Green River, UT Map & Demographics
Green River Map
Green River Overview
$26,718
PER CAPITA INCOME
$88,155
AVG FAMILY INCOME
$43,190
AVG HOUSEHOLD INCOME
39.7%
WAGE / INCOME GAP [ % ]
60.3¢/ $1
WAGE / INCOME GAP [ $ ]
0.40
INEQUALITY / GINI INDEX
788
TOTAL POPULATION
362
MALE POPULATION
426
FEMALE POPULATION
84.98
MALES / 100 FEMALES
117.68
FEMALES / 100 MALES
40.7
MEDIAN AGE
3.4
AVG FAMILY SIZE
2.5
AVG HOUSEHOLD SIZE
393
LABOR FORCE [ PEOPLE ]
65.1%
PERCENT IN LABOR FORCE
Green River Zip Codes
Green River Area Codes
Income in Green River
Income Overview in Green River
Per Capita Income in Green River is $26,718, while median incomes of families and households are $88,155 and $43,190 respectively.
| Characteristic | Number | Measure |
| Per Capita Income | 788 | $26,718 |
| Median Family Income | 197 | $88,155 |
| Mean Family Income | 197 | $84,477 |
| Median Household Income | 312 | $43,190 |
| Mean Household Income | 312 | $65,641 |
| Income Deficit | 197 | $0 |
| Wage / Income Gap (%) | 788 | 39.72% |
| Wage / Income Gap ($) | 788 | 60.28¢ per $1 |
| Gini / Inequality Index | 788 | 0.40 |
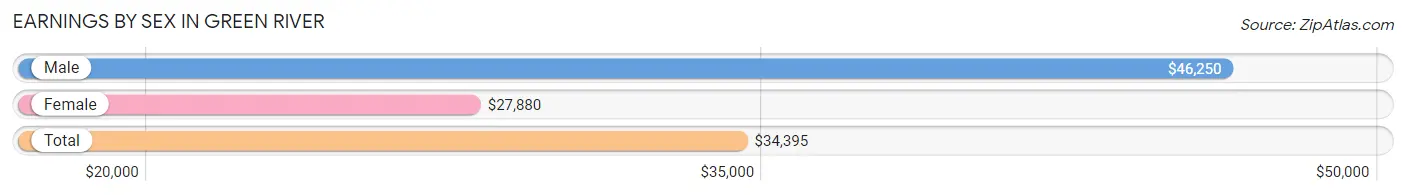
Earnings by Sex in Green River
Average Earnings in Green River are $34,395, $46,250 for men and $27,880 for women, a difference of 39.7%.
| Sex | Number | Average Earnings |
| Male | 210 (48.5%) | $46,250 |
| Female | 223 (51.5%) | $27,880 |
| Total | 433 (100.0%) | $34,395 |
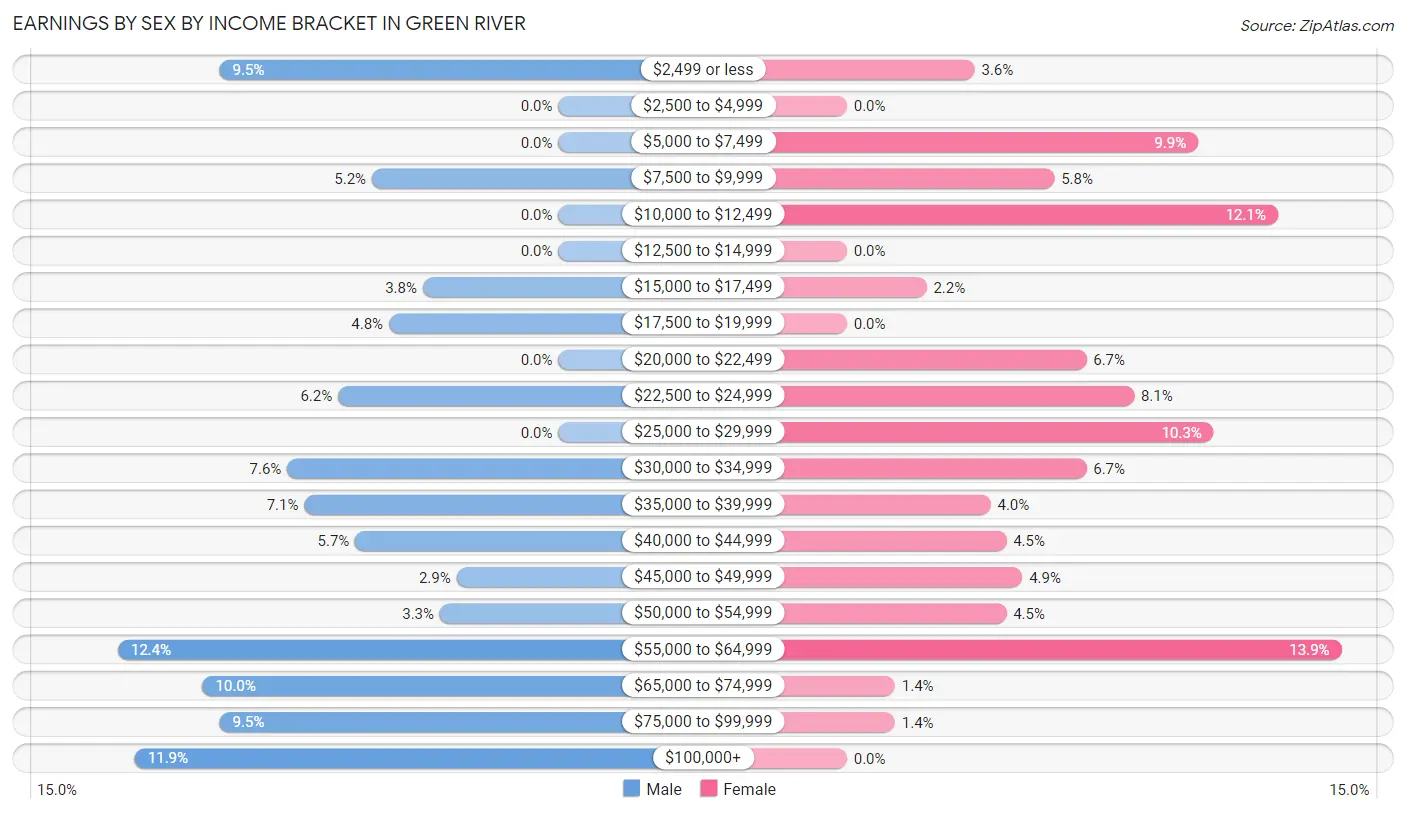
Earnings by Sex by Income Bracket in Green River
The most common earnings brackets in Green River are $55,000 to $64,999 for men (26 | 12.4%) and $55,000 to $64,999 for women (31 | 13.9%).
| Income | Male | Female |
| $2,499 or less | 20 (9.5%) | 8 (3.6%) |
| $2,500 to $4,999 | 0 (0.0%) | 0 (0.0%) |
| $5,000 to $7,499 | 0 (0.0%) | 22 (9.9%) |
| $7,500 to $9,999 | 11 (5.2%) | 13 (5.8%) |
| $10,000 to $12,499 | 0 (0.0%) | 27 (12.1%) |
| $12,500 to $14,999 | 0 (0.0%) | 0 (0.0%) |
| $15,000 to $17,499 | 8 (3.8%) | 5 (2.2%) |
| $17,500 to $19,999 | 10 (4.8%) | 0 (0.0%) |
| $20,000 to $22,499 | 0 (0.0%) | 15 (6.7%) |
| $22,500 to $24,999 | 13 (6.2%) | 18 (8.1%) |
| $25,000 to $29,999 | 0 (0.0%) | 23 (10.3%) |
| $30,000 to $34,999 | 16 (7.6%) | 15 (6.7%) |
| $35,000 to $39,999 | 15 (7.1%) | 9 (4.0%) |
| $40,000 to $44,999 | 12 (5.7%) | 10 (4.5%) |
| $45,000 to $49,999 | 6 (2.9%) | 11 (4.9%) |
| $50,000 to $54,999 | 7 (3.3%) | 10 (4.5%) |
| $55,000 to $64,999 | 26 (12.4%) | 31 (13.9%) |
| $65,000 to $74,999 | 21 (10.0%) | 3 (1.3%) |
| $75,000 to $99,999 | 20 (9.5%) | 3 (1.3%) |
| $100,000+ | 25 (11.9%) | 0 (0.0%) |
| Total | 210 (100.0%) | 223 (100.0%) |
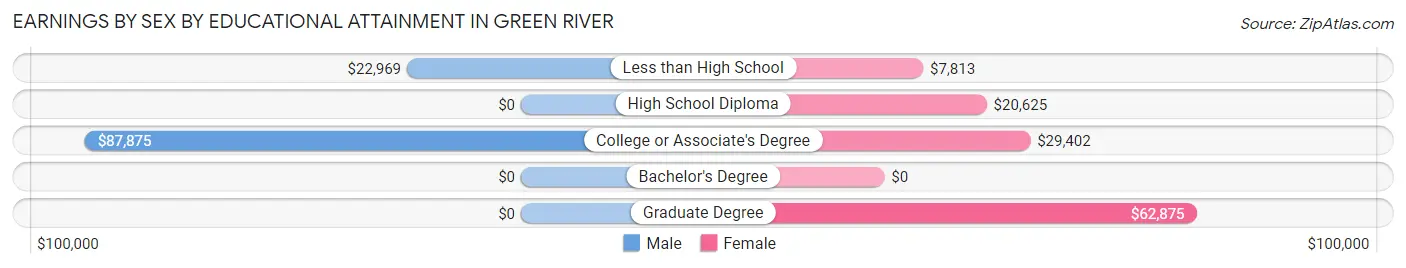
Earnings by Sex by Educational Attainment in Green River
Average earnings in Green River are $49,167 for men and $27,663 for women, a difference of 43.7%. Men with an educational attainment of college or associate's degree enjoy the highest average annual earnings of $87,875, while those with less than high school education earn the least with $22,969. Women with an educational attainment of graduate degree earn the most with the average annual earnings of $62,875, while those with less than high school education have the smallest earnings of $7,813.
| Educational Attainment | Male Income | Female Income |
| Less than High School | $22,969 | $7,813 |
| High School Diploma | - | - |
| College or Associate's Degree | $87,875 | $29,402 |
| Bachelor's Degree | - | - |
| Graduate Degree | - | - |
| Total | $49,167 | $27,663 |
Family Income in Green River
Family Income Brackets in Green River
According to the Green River family income data, there are 40 families falling into the $75,000 to $99,999 income range, which is the most common income bracket and makes up 20.3% of all families.
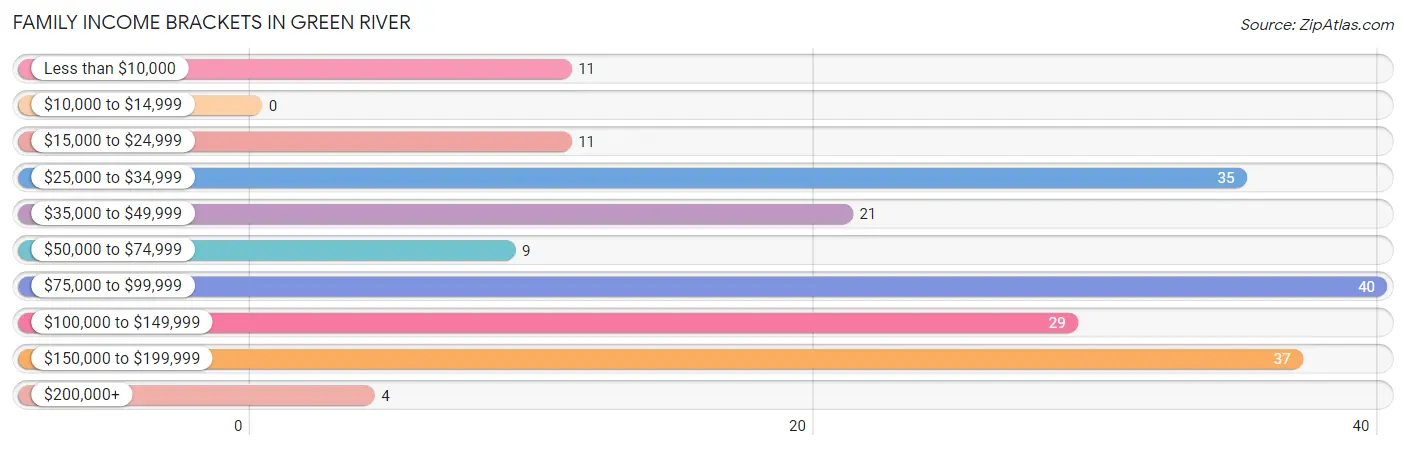
| Income Bracket | # Families | % Families |
| Less than $10,000 | 11 | 5.6% |
| $10,000 to $14,999 | 0 | 0.0% |
| $15,000 to $24,999 | 11 | 5.6% |
| $25,000 to $34,999 | 35 | 17.8% |
| $35,000 to $49,999 | 21 | 10.7% |
| $50,000 to $74,999 | 9 | 4.6% |
| $75,000 to $99,999 | 40 | 20.3% |
| $100,000 to $149,999 | 29 | 14.7% |
| $150,000 to $199,999 | 37 | 18.8% |
| $200,000+ | 4 | 2.0% |
Family Income by Famaliy Size in Green River
4-person families (54 | 27.4%) account for the highest median family income in Green River with $91,111 per family, while 2-person families (68 | 34.5%) have the highest median income of $44,643 per family member.
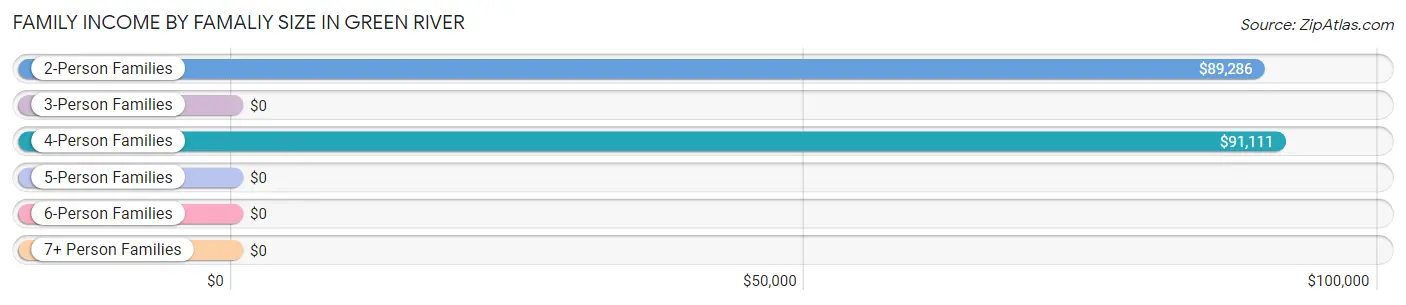
| Income Bracket | # Families | Median Income |
| 2-Person Families | 68 (34.5%) | $89,286 |
| 3-Person Families | 33 (16.8%) | $0 |
| 4-Person Families | 54 (27.4%) | $91,111 |
| 5-Person Families | 28 (14.2%) | $0 |
| 6-Person Families | 14 (7.1%) | $0 |
| 7+ Person Families | 0 (0.0%) | $0 |
| Total | 197 (100.0%) | $88,155 |
Family Income by Number of Earners in Green River
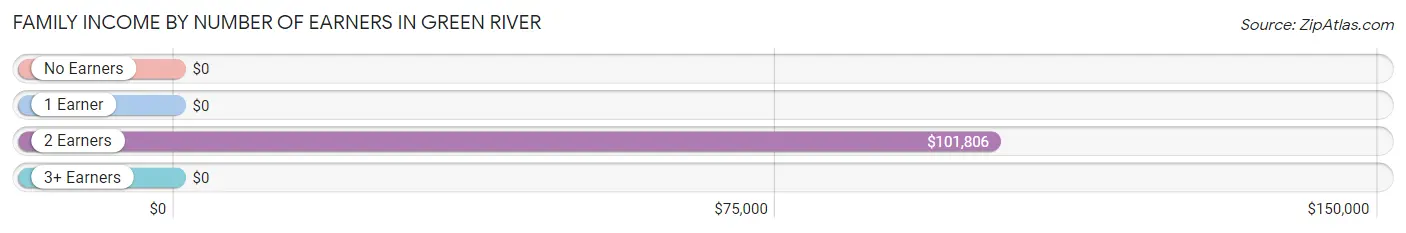
| Number of Earners | # Families | Median Income |
| No Earners | 13 (6.6%) | $0 |
| 1 Earner | 52 (26.4%) | $0 |
| 2 Earners | 111 (56.4%) | $101,806 |
| 3+ Earners | 21 (10.7%) | $0 |
| Total | 197 (100.0%) | $88,155 |
Household Income in Green River
Household Income Brackets in Green River
With 74 households falling in the category, the $25,000 to $34,999 income range is the most frequent in Green River, accounting for 23.7% of all households. In contrast, only 4 households (1.3%) fall into the $10,000 to $14,999 income bracket, making it the least populous group.
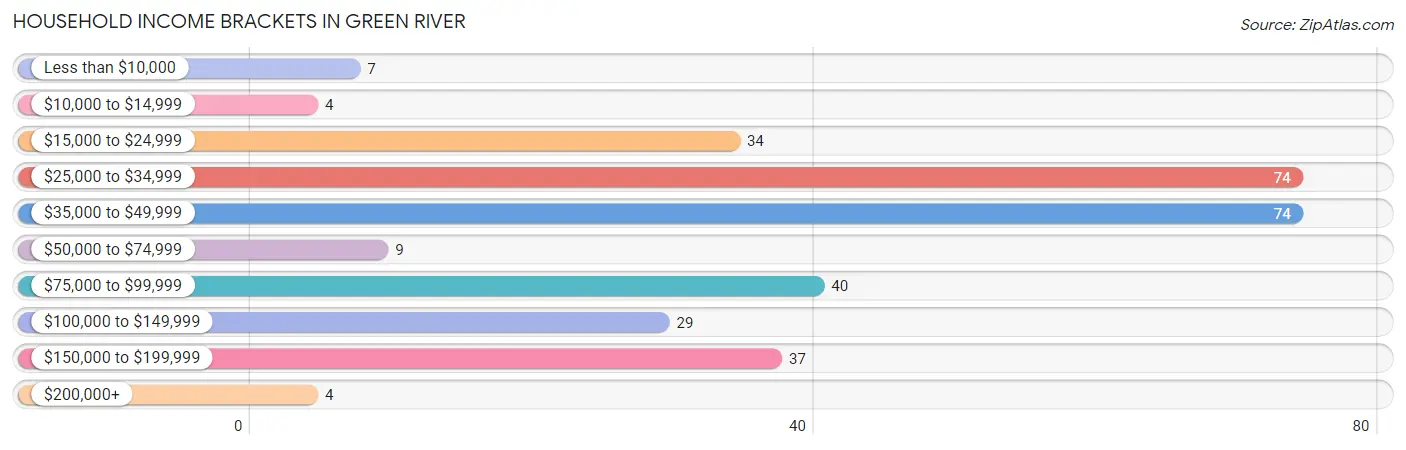
| Income Bracket | # Households | % Households |
| Less than $10,000 | 7 | 2.2% |
| $10,000 to $14,999 | 4 | 1.3% |
| $15,000 to $24,999 | 34 | 10.9% |
| $25,000 to $34,999 | 74 | 23.7% |
| $35,000 to $49,999 | 74 | 23.7% |
| $50,000 to $74,999 | 9 | 2.9% |
| $75,000 to $99,999 | 40 | 12.8% |
| $100,000 to $149,999 | 29 | 9.3% |
| $150,000 to $199,999 | 37 | 11.9% |
| $200,000+ | 4 | 1.3% |
Household Income by Householder Age in Green River
The median household income in Green River is $43,190, with the highest median household income of $73,333 found in the 25 to 44 years age bracket for the primary householder. A total of 90 households (28.8%) fall into this category.
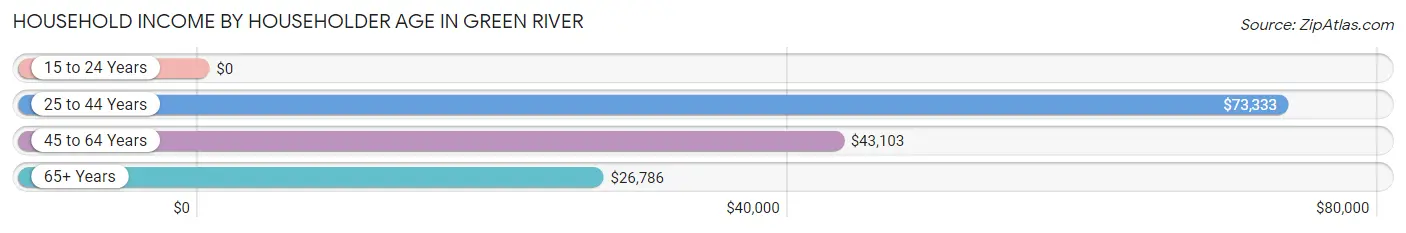
| Income Bracket | # Households | Median Income |
| 15 to 24 Years | 0 (0.0%) | $0 |
| 25 to 44 Years | 90 (28.8%) | $73,333 |
| 45 to 64 Years | 154 (49.4%) | $43,103 |
| 65+ Years | 68 (21.8%) | $26,786 |
| Total | 312 (100.0%) | $43,190 |
Poverty in Green River
Income Below Poverty by Sex and Age in Green River
With 14.9% poverty level for males and 16.9% for females among the residents of Green River, 5 year old males and 15 year old females are the most vulnerable to poverty, with 5 males (100.0%) and 7 females (50.0%) in their respective age groups living below the poverty level.
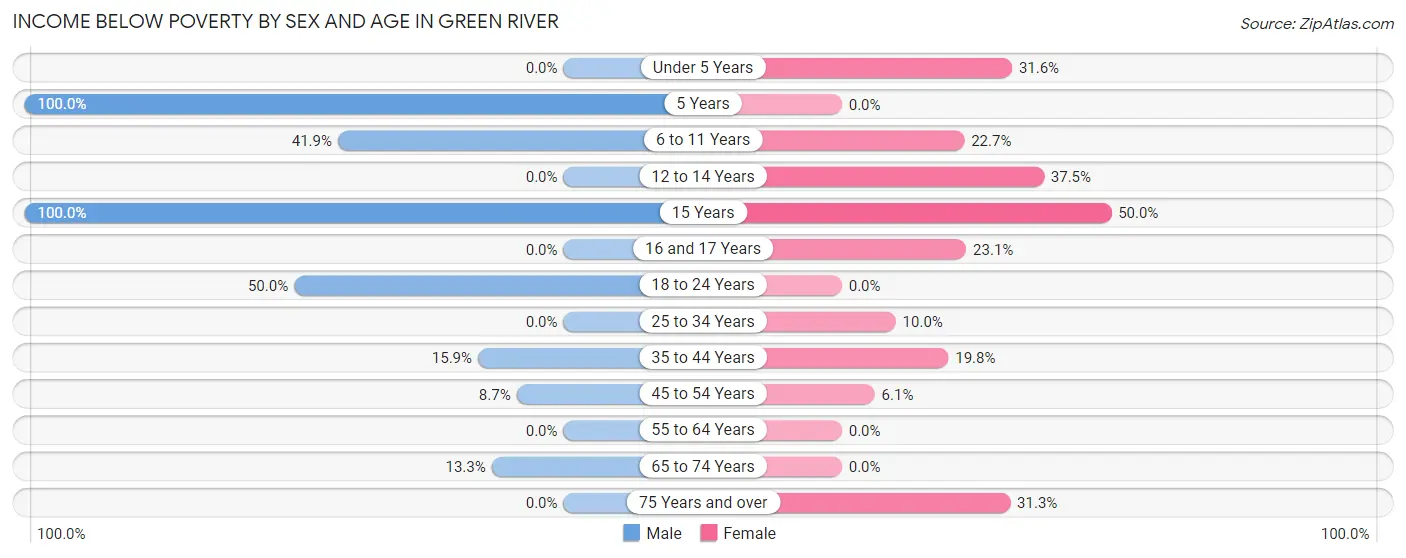
| Age Bracket | Male | Female |
| Under 5 Years | 0 (0.0%) | 18 (31.6%) |
| 5 Years | 5 (100.0%) | 0 (0.0%) |
| 6 to 11 Years | 18 (41.9%) | 5 (22.7%) |
| 12 to 14 Years | 0 (0.0%) | 3 (37.5%) |
| 15 Years | 4 (100.0%) | 7 (50.0%) |
| 16 and 17 Years | 0 (0.0%) | 3 (23.1%) |
| 18 to 24 Years | 5 (50.0%) | 0 (0.0%) |
| 25 to 34 Years | 0 (0.0%) | 4 (10.0%) |
| 35 to 44 Years | 10 (15.9%) | 17 (19.8%) |
| 45 to 54 Years | 6 (8.7%) | 5 (6.1%) |
| 55 to 64 Years | 0 (0.0%) | 0 (0.0%) |
| 65 to 74 Years | 6 (13.3%) | 0 (0.0%) |
| 75 Years and over | 0 (0.0%) | 10 (31.2%) |
| Total | 54 (14.9%) | 72 (16.9%) |
Income Above Poverty by Sex and Age in Green River
According to the poverty statistics in Green River, males aged under 5 years and females aged 18 to 24 years are the age groups that are most secure financially, with 100.0% of males and 100.0% of females in these age groups living above the poverty line.
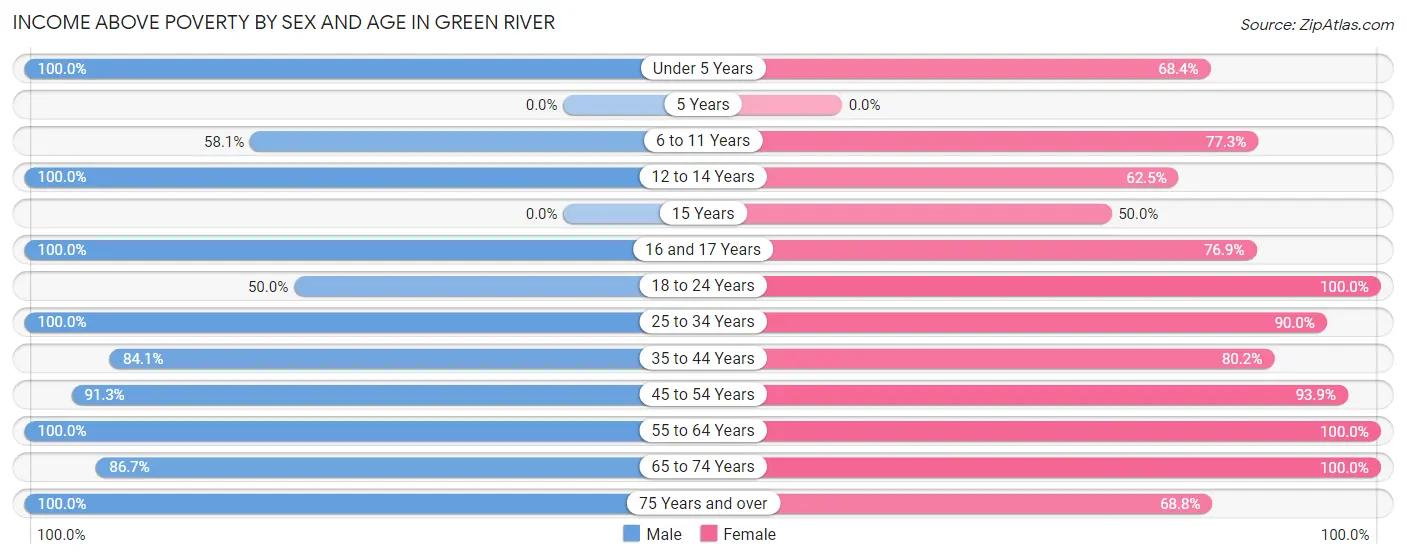
| Age Bracket | Male | Female |
| Under 5 Years | 23 (100.0%) | 39 (68.4%) |
| 5 Years | 0 (0.0%) | 0 (0.0%) |
| 6 to 11 Years | 25 (58.1%) | 17 (77.3%) |
| 12 to 14 Years | 8 (100.0%) | 5 (62.5%) |
| 15 Years | 0 (0.0%) | 7 (50.0%) |
| 16 and 17 Years | 9 (100.0%) | 10 (76.9%) |
| 18 to 24 Years | 5 (50.0%) | 12 (100.0%) |
| 25 to 34 Years | 47 (100.0%) | 36 (90.0%) |
| 35 to 44 Years | 53 (84.1%) | 69 (80.2%) |
| 45 to 54 Years | 63 (91.3%) | 77 (93.9%) |
| 55 to 64 Years | 32 (100.0%) | 43 (100.0%) |
| 65 to 74 Years | 39 (86.7%) | 17 (100.0%) |
| 75 Years and over | 4 (100.0%) | 22 (68.8%) |
| Total | 308 (85.1%) | 354 (83.1%) |
Income Below Poverty Among Married-Couple Families in Green River
The poverty statistics for married-couple families in Green River show that 11.9% or 21 of the total 177 families live below the poverty line. Families with 3 or 4 children have the highest poverty rate of 33.3%, comprising of 10 families. On the other hand, families with no children have the lowest poverty rate of 6.7%, which includes 6 families.
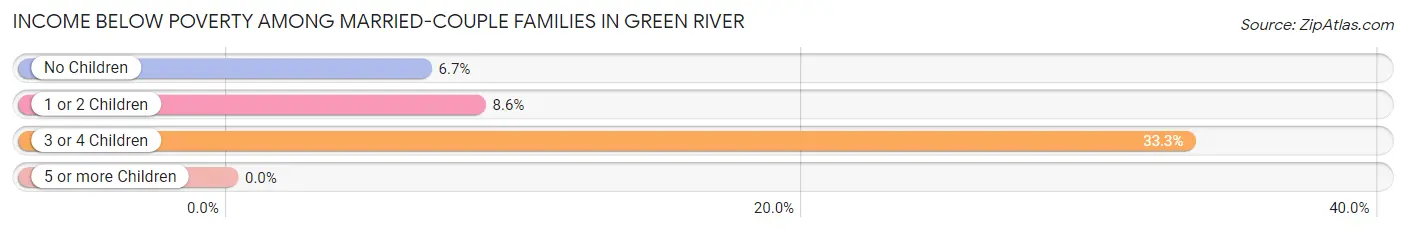
| Children | Above Poverty | Below Poverty |
| No Children | 83 (93.3%) | 6 (6.7%) |
| 1 or 2 Children | 53 (91.4%) | 5 (8.6%) |
| 3 or 4 Children | 20 (66.7%) | 10 (33.3%) |
| 5 or more Children | 0 (0.0%) | 0 (0.0%) |
| Total | 156 (88.1%) | 21 (11.9%) |
Income Below Poverty Among Single-Parent Households in Green River
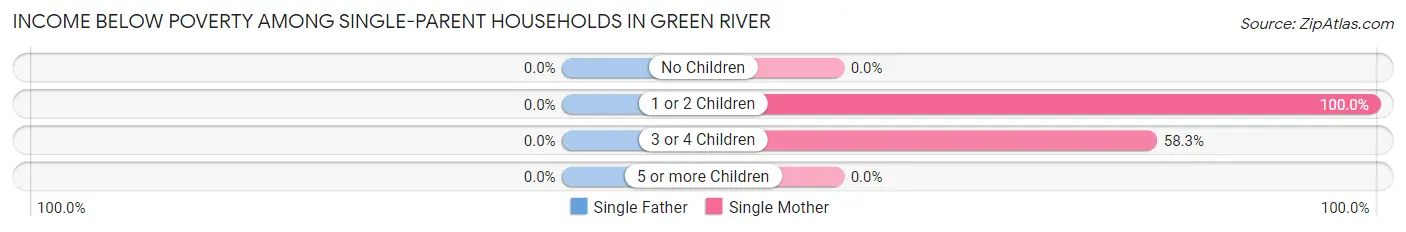
| Children | Single Father | Single Mother |
| No Children | 0 (0.0%) | 0 (0.0%) |
| 1 or 2 Children | 0 (0.0%) | 4 (100.0%) |
| 3 or 4 Children | 0 (0.0%) | 7 (58.3%) |
| 5 or more Children | 0 (0.0%) | 0 (0.0%) |
| Total | 0 (0.0%) | 11 (68.8%) |
Income Below Poverty Among Married-Couple vs Single-Parent Households in Green River
The poverty data for Green River shows that 21 of the married-couple family households (11.9%) and 11 of the single-parent households (55.0%) are living below the poverty level. Within the married-couple family households, those with 3 or 4 children have the highest poverty rate, with 10 households (33.3%) falling below the poverty line. Among the single-parent households, those with 1 or 2 children have the highest poverty rate, with 4 household (100.0%) living below poverty.
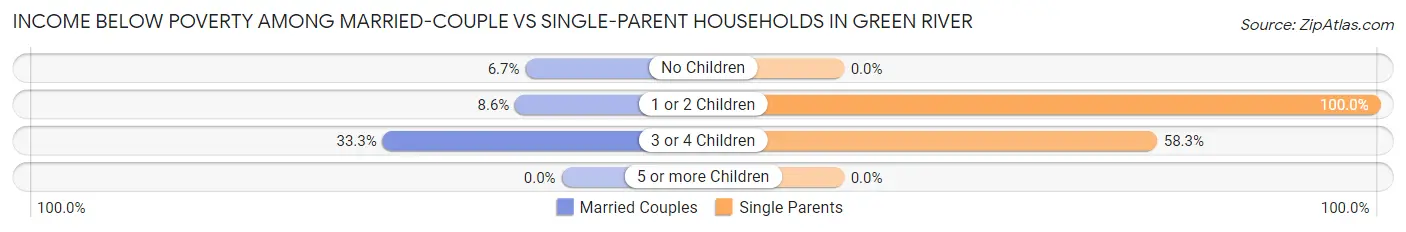
| Children | Married-Couple Families | Single-Parent Households |
| No Children | 6 (6.7%) | 0 (0.0%) |
| 1 or 2 Children | 5 (8.6%) | 4 (100.0%) |
| 3 or 4 Children | 10 (33.3%) | 7 (58.3%) |
| 5 or more Children | 0 (0.0%) | 0 (0.0%) |
| Total | 21 (11.9%) | 11 (55.0%) |
Race in Green River
The most populous races in Green River are White / Caucasian (730 | 92.6%), Hispanic or Latino (288 | 36.5%), and Two or more Races (25 | 3.2%).
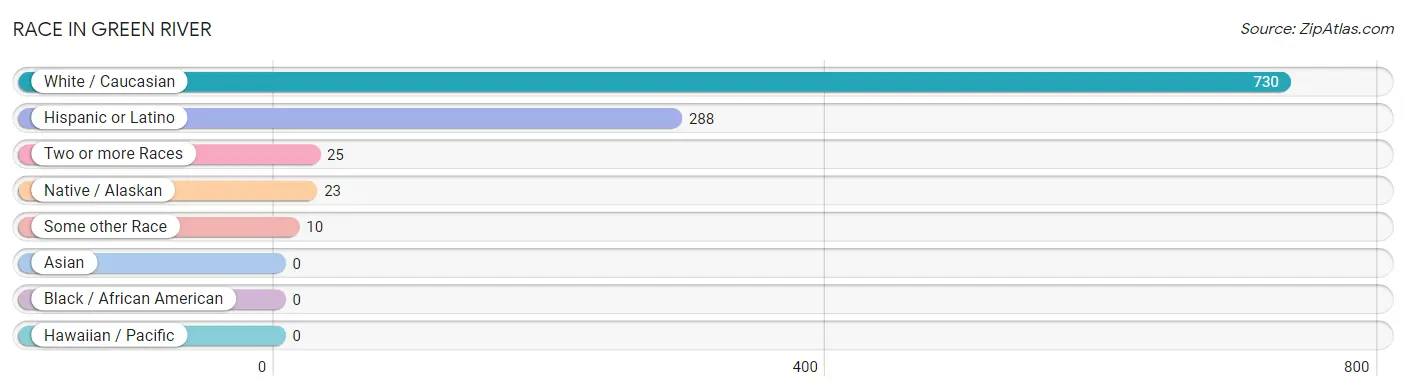
| Race | # Population | % Population |
| Asian | 0 | 0.0% |
| Black / African American | 0 | 0.0% |
| Hawaiian / Pacific | 0 | 0.0% |
| Hispanic or Latino | 288 | 36.5% |
| Native / Alaskan | 23 | 2.9% |
| White / Caucasian | 730 | 92.6% |
| Two or more Races | 25 | 3.2% |
| Some other Race | 10 | 1.3% |
| Total | 788 | 100.0% |
Ancestry in Green River
The most populous ancestries reported in Green River are Mexican (254 | 32.2%), English (141 | 17.9%), Italian (70 | 8.9%), Irish (62 | 7.9%), and German (55 | 7.0%), together accounting for 73.8% of all Green River residents.
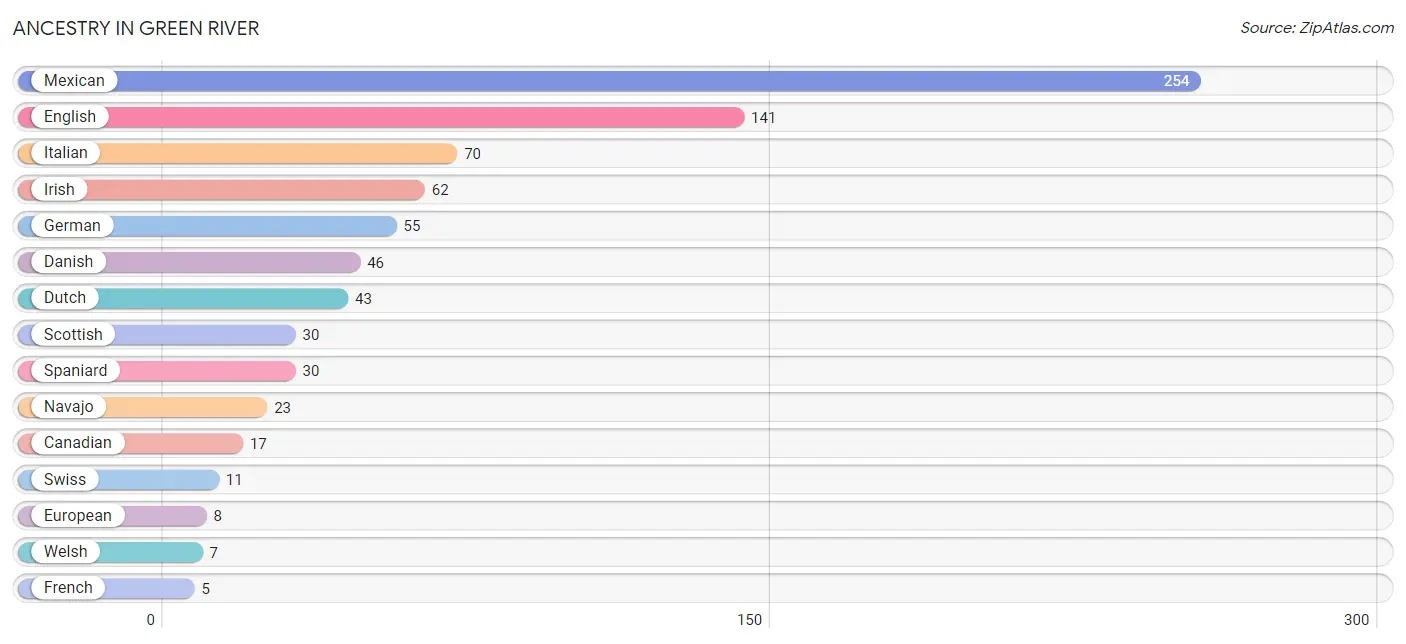
| Ancestry | # Population | % Population |
| American | 4 | 0.5% |
| Canadian | 17 | 2.2% |
| Danish | 46 | 5.8% |
| Dutch | 43 | 5.5% |
| English | 141 | 17.9% |
| European | 8 | 1.0% |
| French | 5 | 0.6% |
| German | 55 | 7.0% |
| Irish | 62 | 7.9% |
| Italian | 70 | 8.9% |
| Mexican | 254 | 32.2% |
| Navajo | 23 | 2.9% |
| Portuguese | 4 | 0.5% |
| Scotch-Irish | 4 | 0.5% |
| Scottish | 30 | 3.8% |
| Spaniard | 30 | 3.8% |
| Spanish | 4 | 0.5% |
| Swiss | 11 | 1.4% |
| Welsh | 7 | 0.9% | View All 19 Rows |
Immigrants in Green River
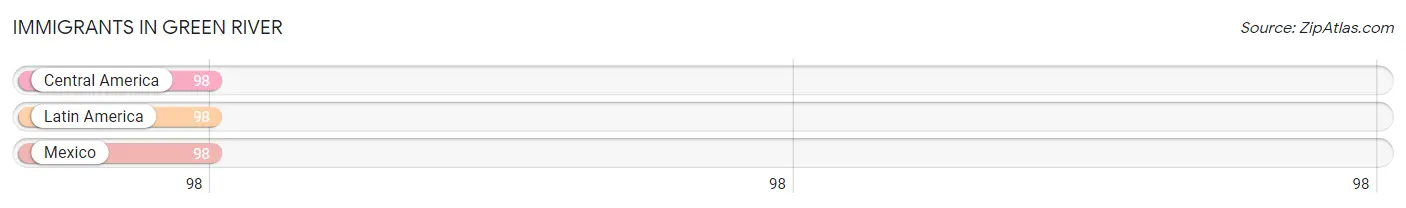
The most numerous immigrant groups reported in Green River came from Central America (98 | 12.4%), Latin America (98 | 12.4%), and Mexico (98 | 12.4%), together accounting for 37.3% of all Green River residents.
| Immigration Origin | # Population | % Population |
| Central America | 98 | 12.4% |
| Latin America | 98 | 12.4% |
| Mexico | 98 | 12.4% | View All 3 Rows |
Sex and Age in Green River
Sex and Age in Green River
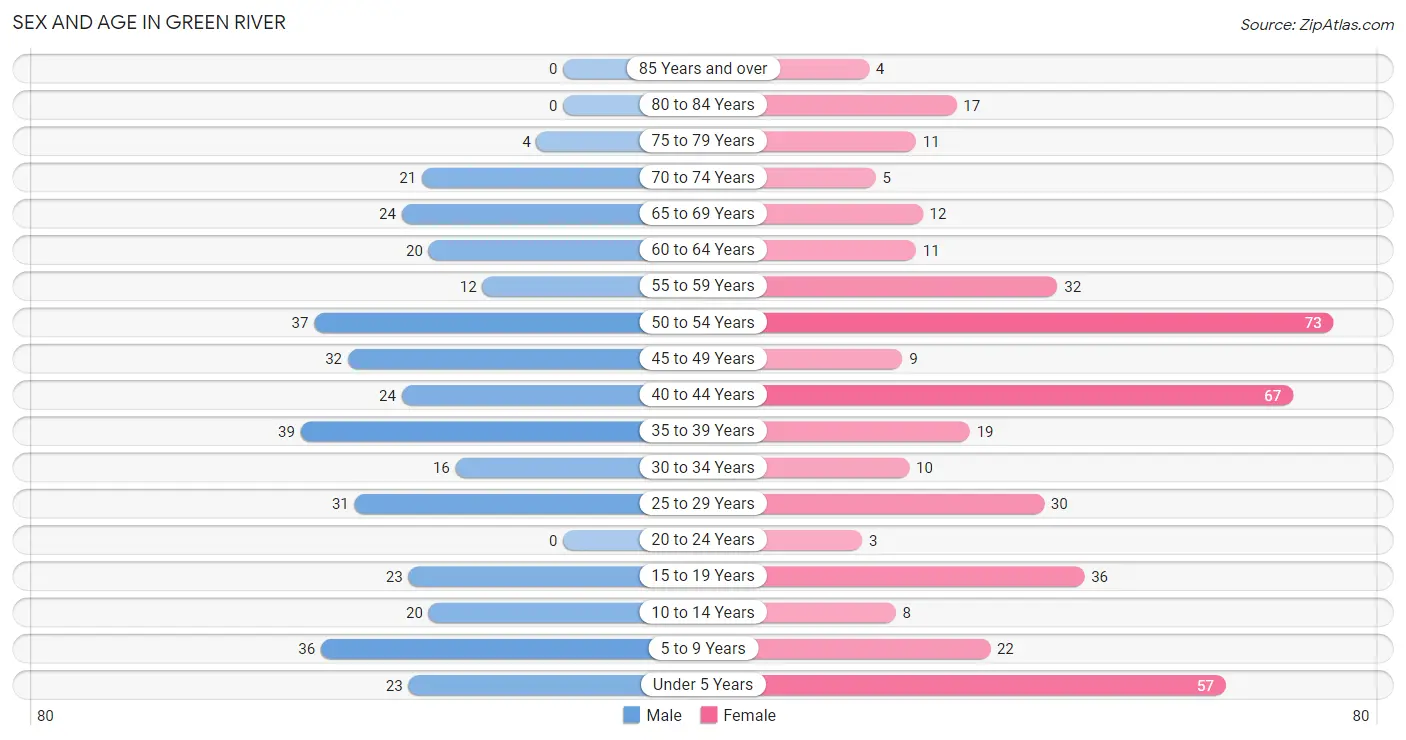
The most populous age groups in Green River are 35 to 39 Years (39 | 10.8%) for men and 50 to 54 Years (73 | 17.1%) for women.
| Age Bracket | Male | Female |
| Under 5 Years | 23 (6.4%) | 57 (13.4%) |
| 5 to 9 Years | 36 (9.9%) | 22 (5.2%) |
| 10 to 14 Years | 20 (5.5%) | 8 (1.9%) |
| 15 to 19 Years | 23 (6.4%) | 36 (8.5%) |
| 20 to 24 Years | 0 (0.0%) | 3 (0.7%) |
| 25 to 29 Years | 31 (8.6%) | 30 (7.0%) |
| 30 to 34 Years | 16 (4.4%) | 10 (2.4%) |
| 35 to 39 Years | 39 (10.8%) | 19 (4.5%) |
| 40 to 44 Years | 24 (6.6%) | 67 (15.7%) |
| 45 to 49 Years | 32 (8.8%) | 9 (2.1%) |
| 50 to 54 Years | 37 (10.2%) | 73 (17.1%) |
| 55 to 59 Years | 12 (3.3%) | 32 (7.5%) |
| 60 to 64 Years | 20 (5.5%) | 11 (2.6%) |
| 65 to 69 Years | 24 (6.6%) | 12 (2.8%) |
| 70 to 74 Years | 21 (5.8%) | 5 (1.2%) |
| 75 to 79 Years | 4 (1.1%) | 11 (2.6%) |
| 80 to 84 Years | 0 (0.0%) | 17 (4.0%) |
| 85 Years and over | 0 (0.0%) | 4 (0.9%) |
| Total | 362 (100.0%) | 426 (100.0%) |
Families and Households in Green River
Median Family Size in Green River
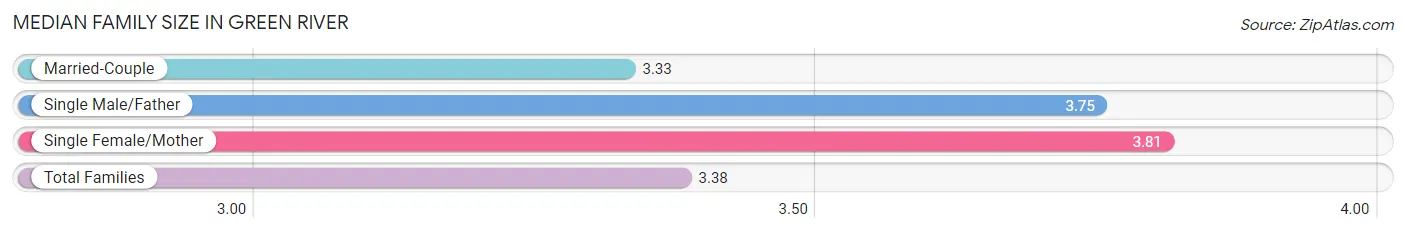
The median family size in Green River is 3.38 persons per family, with single female/mother families (16 | 8.1%) accounting for the largest median family size of 3.81 persons per family. On the other hand, married-couple families (177 | 89.8%) represent the smallest median family size with 3.33 persons per family.
| Family Type | # Families | Family Size |
| Married-Couple | 177 (89.8%) | 3.33 |
| Single Male/Father | 4 (2.0%) | 3.75 |
| Single Female/Mother | 16 (8.1%) | 3.81 |
| Total Families | 197 (100.0%) | 3.38 |
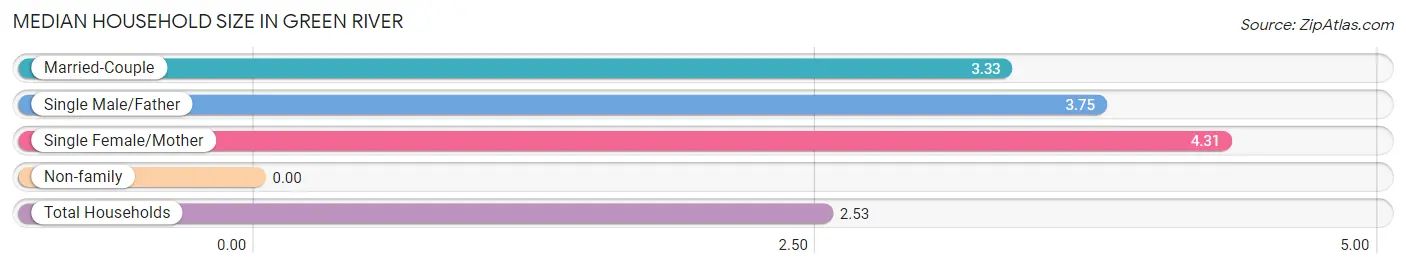
Median Household Size in Green River
| Household Type | # Households | Household Size |
| Married-Couple | 177 (56.7%) | 3.33 |
| Single Male/Father | 4 (1.3%) | 3.75 |
| Single Female/Mother | 16 (5.1%) | 4.31 |
| Non-family | 115 (36.9%) | - |
| Total Households | 312 (100.0%) | 2.53 |
Household Size by Marriage Status in Green River
Out of a total of 312 households in Green River, 197 (63.1%) are family households, while 115 (36.9%) are nonfamily households. The most numerous type of family households are 2-person households, comprising 68, and the most common type of nonfamily households are 1-person households, comprising 115.
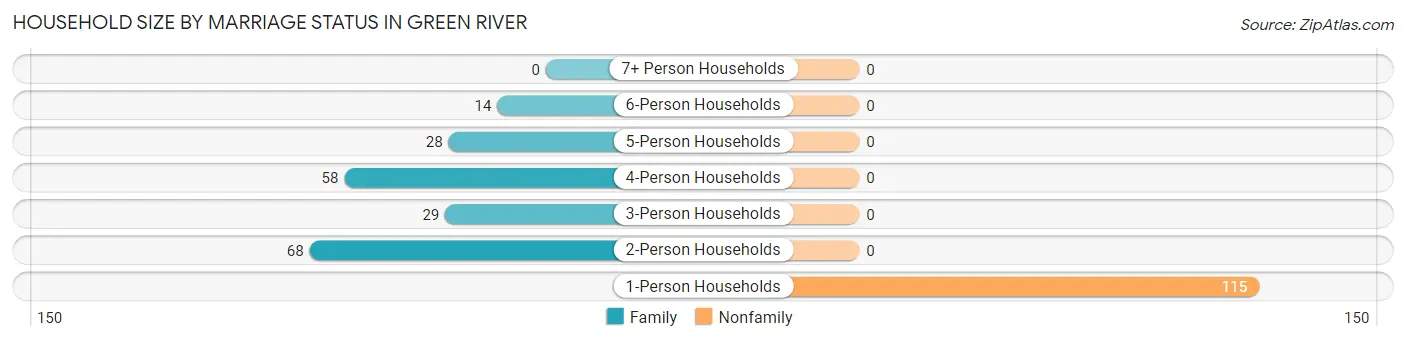
| Household Size | Family Households | Nonfamily Households |
| 1-Person Households | - | 115 (36.9%) |
| 2-Person Households | 68 (21.8%) | 0 (0.0%) |
| 3-Person Households | 29 (9.3%) | 0 (0.0%) |
| 4-Person Households | 58 (18.6%) | 0 (0.0%) |
| 5-Person Households | 28 (9.0%) | 0 (0.0%) |
| 6-Person Households | 14 (4.5%) | 0 (0.0%) |
| 7+ Person Households | 0 (0.0%) | 0 (0.0%) |
| Total | 197 (63.1%) | 115 (36.9%) |
Female Fertility in Green River
Fertility by Age in Green River
Average fertility rate in Green River is 117.0 births per 1,000 women. Women in the age bracket of 20 to 34 years have the highest fertility rate with 535.0 births per 1,000 women. Women in the age bracket of 20 to 34 years acount for 100.0% of all women with births.
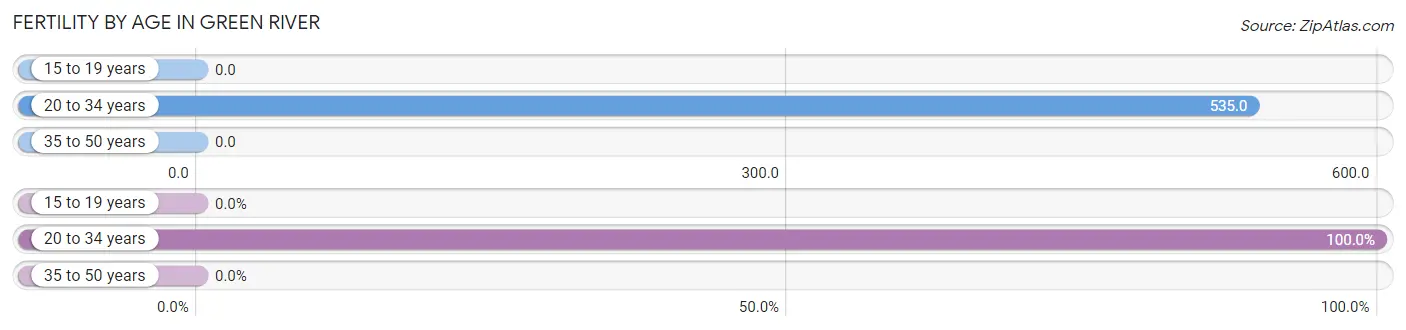
| Age Bracket | Women with Births | Births / 1,000 Women |
| 15 to 19 years | 0 (0.0%) | 0.0 |
| 20 to 34 years | 23 (100.0%) | 535.0 |
| 35 to 50 years | 0 (0.0%) | 0.0 |
| Total | 23 (100.0%) | 117.0 |
Fertility by Age by Marriage Status in Green River
82.6% of women with births (23) in Green River are married. The highest percentage of unmarried women with births falls into 20 to 34 years age bracket with 17.4% of them unmarried at the time of birth, while the lowest percentage of unmarried women with births belong to 20 to 34 years age bracket with 17.4% of them unmarried.
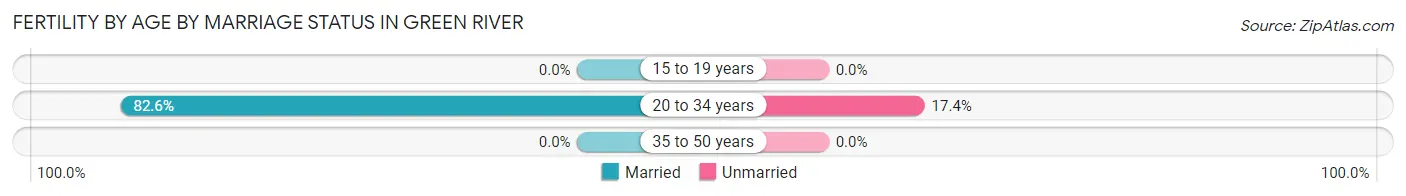
| Age Bracket | Married | Unmarried |
| 15 to 19 years | 0 (0.0%) | 0 (0.0%) |
| 20 to 34 years | 19 (82.6%) | 4 (17.4%) |
| 35 to 50 years | 0 (0.0%) | 0 (0.0%) |
| Total | 19 (82.6%) | 4 (17.4%) |
Fertility by Education in Green River
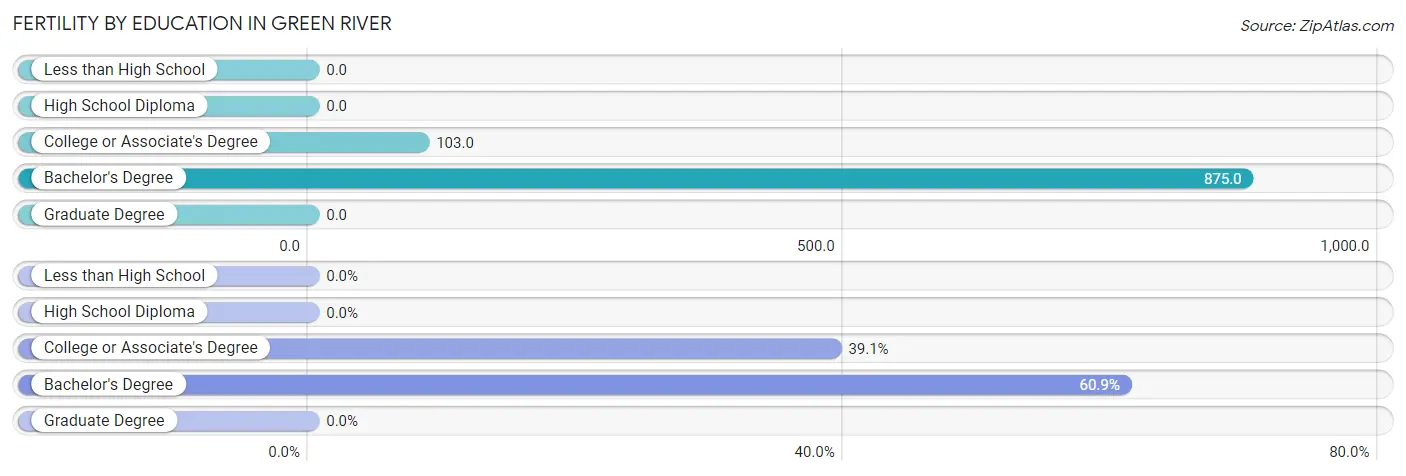
| Educational Attainment | Women with Births | Births / 1,000 Women |
| Less than High School | 0 (0.0%) | 0.0 |
| High School Diploma | 0 (0.0%) | 0.0 |
| College or Associate's Degree | 9 (39.1%) | 103.0 |
| Bachelor's Degree | 14 (60.9%) | 875.0 |
| Graduate Degree | 0 (0.0%) | 0.0 |
| Total | 23 (100.0%) | 117.0 |
Fertility by Education by Marriage Status in Green River
17.4% of women with births in Green River are unmarried. Women with the educational attainment of college or associate's degree are most likely to be married with 100.0% of them married at childbirth, while women with the educational attainment of bachelor's degree are least likely to be married with 28.6% of them unmarried at childbirth.
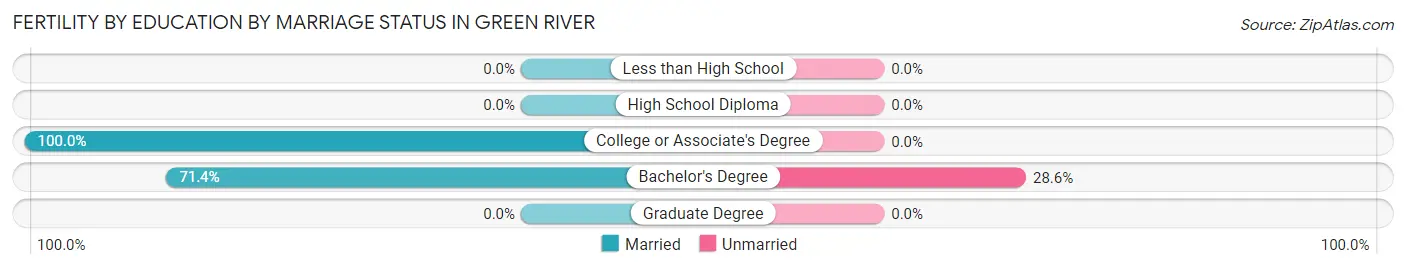
| Educational Attainment | Married | Unmarried |
| Less than High School | 0 (0.0%) | 0 (0.0%) |
| High School Diploma | 0 (0.0%) | 0 (0.0%) |
| College or Associate's Degree | 9 (100.0%) | 0 (0.0%) |
| Bachelor's Degree | 10 (71.4%) | 4 (28.6%) |
| Graduate Degree | 0 (0.0%) | 0 (0.0%) |
| Total | 19 (82.6%) | 4 (17.4%) |
Employment Characteristics in Green River
Employment by Class of Employer in Green River
Among the 368 employed individuals in Green River, private company employees (268 | 72.8%), local government employees (52 | 14.1%), and state government employees (35 | 9.5%) make up the most common classes of employment.
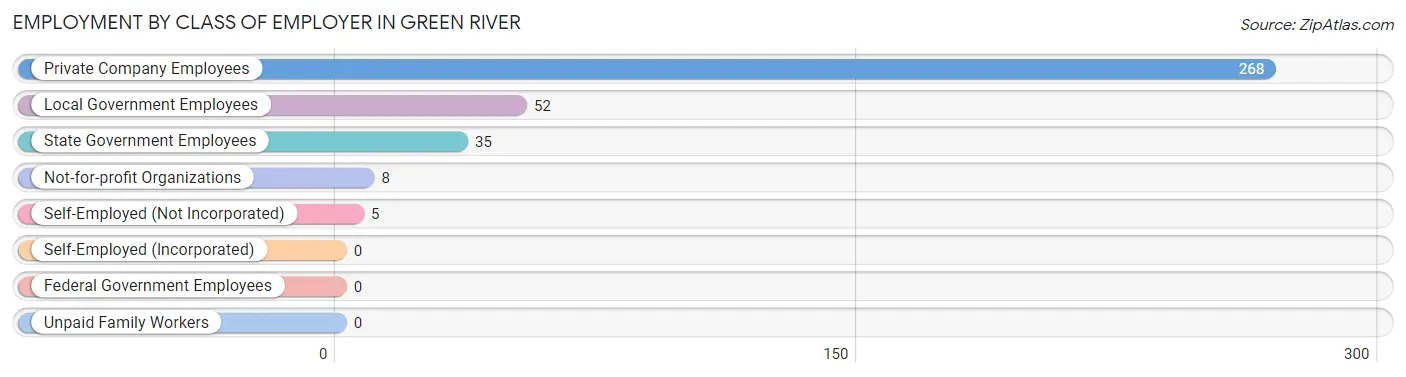
| Employer Class | # Employees | % Employees |
| Private Company Employees | 268 | 72.8% |
| Self-Employed (Incorporated) | 0 | 0.0% |
| Self-Employed (Not Incorporated) | 5 | 1.4% |
| Not-for-profit Organizations | 8 | 2.2% |
| Local Government Employees | 52 | 14.1% |
| State Government Employees | 35 | 9.5% |
| Federal Government Employees | 0 | 0.0% |
| Unpaid Family Workers | 0 | 0.0% |
| Total | 368 | 100.0% |
Employment Status by Age in Green River
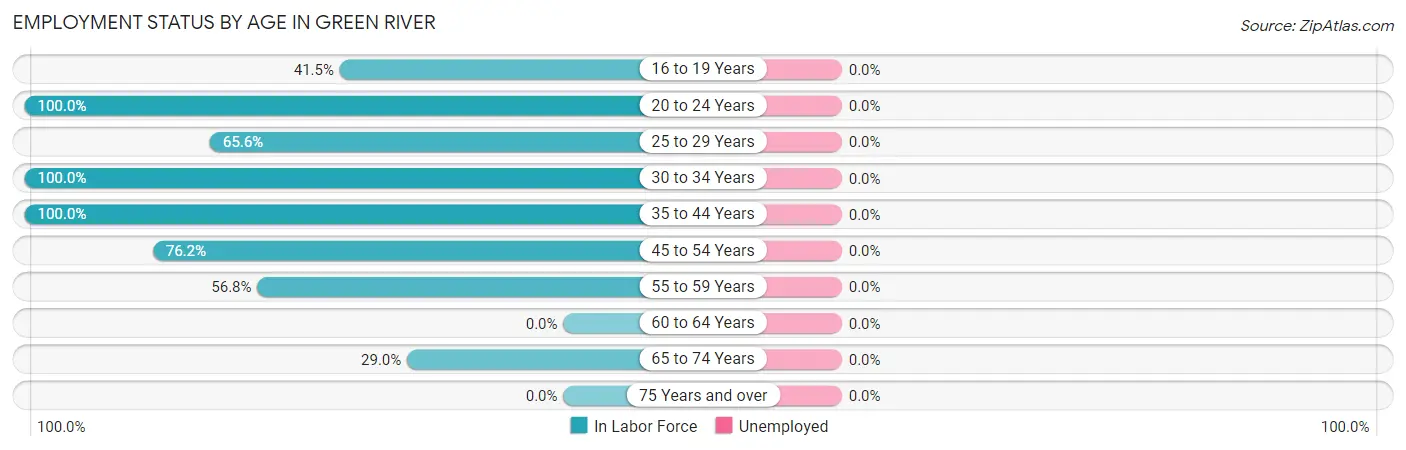
| Age Bracket | In Labor Force | Unemployed |
| 16 to 19 Years | 17 (41.5%) | 0 (0.0%) |
| 20 to 24 Years | 3 (100.0%) | 0 (0.0%) |
| 25 to 29 Years | 40 (65.6%) | 0 (0.0%) |
| 30 to 34 Years | 26 (100.0%) | 0 (0.0%) |
| 35 to 44 Years | 149 (100.0%) | 0 (0.0%) |
| 45 to 54 Years | 115 (76.2%) | 0 (0.0%) |
| 55 to 59 Years | 25 (56.8%) | 0 (0.0%) |
| 60 to 64 Years | 0 (0.0%) | 0 (0.0%) |
| 65 to 74 Years | 18 (29.0%) | 0 (0.0%) |
| 75 Years and over | 0 (0.0%) | 0 (0.0%) |
| Total | 393 (65.1%) | 0 (0.0%) |
Employment Status by Educational Attainment in Green River
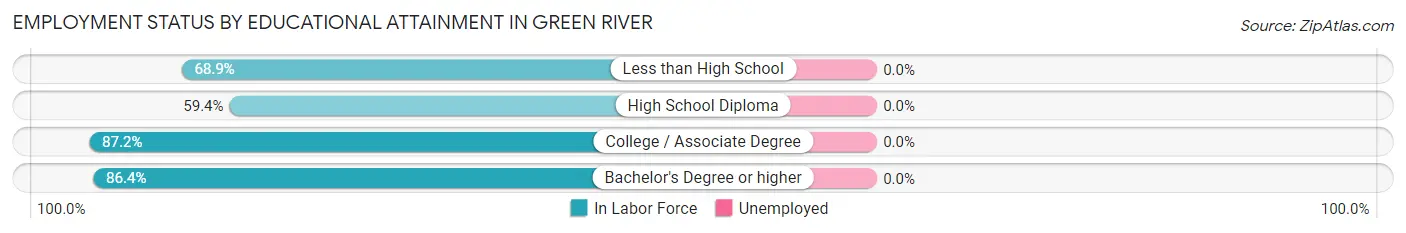
| Educational Attainment | In Labor Force | Unemployed |
| Less than High School | 73 (68.9%) | 0 (0.0%) |
| High School Diploma | 60 (59.4%) | 0 (0.0%) |
| College / Associate Degree | 184 (87.2%) | 0 (0.0%) |
| Bachelor's Degree or higher | 38 (86.4%) | 0 (0.0%) |
| Total | 355 (76.8%) | 0 (0.0%) |
Employment Occupations by Sex in Green River
Management, Business, Science and Arts Occupations
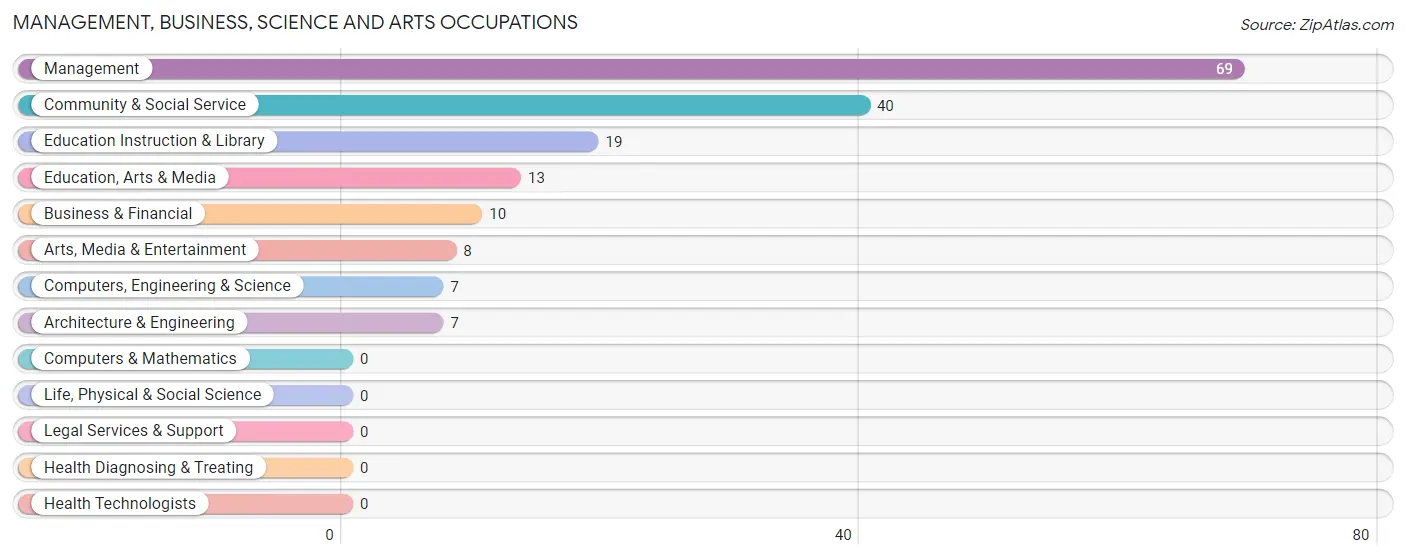
The most common Management, Business, Science and Arts occupations in Green River are Management (69 | 17.6%), Community & Social Service (40 | 10.2%), Education Instruction & Library (19 | 4.8%), Education, Arts & Media (13 | 3.3%), and Business & Financial (10 | 2.5%).
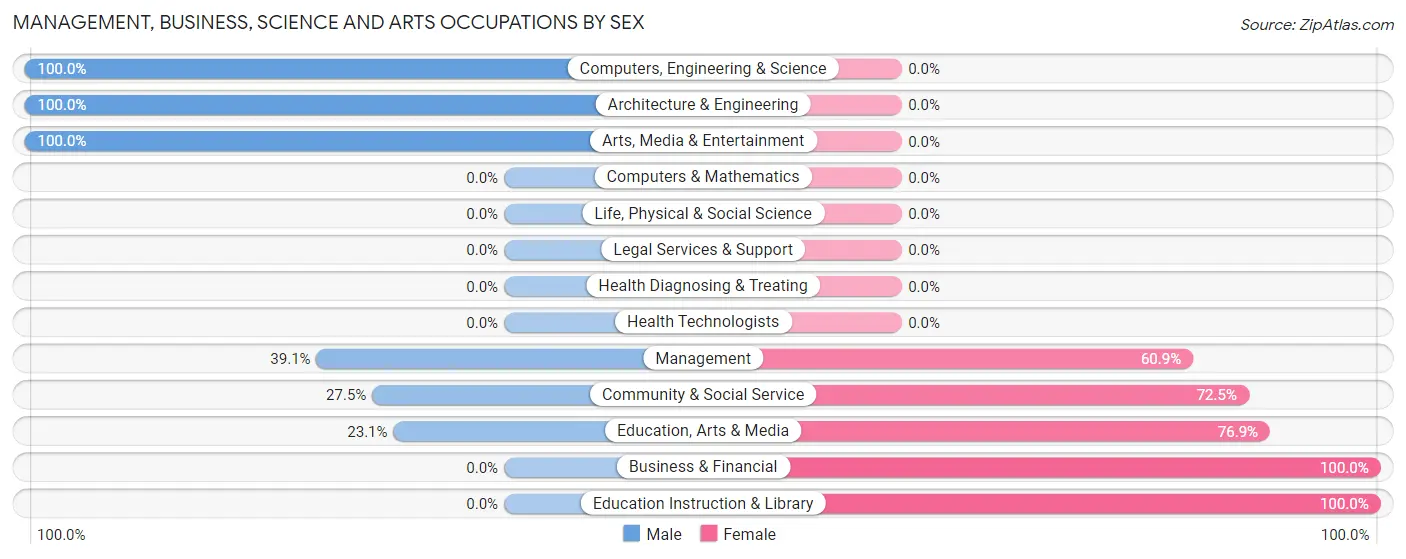
Management, Business, Science and Arts Occupations by Sex
Within the Management, Business, Science and Arts occupations in Green River, the most male-oriented occupations are Computers, Engineering & Science (100.0%), Architecture & Engineering (100.0%), and Arts, Media & Entertainment (100.0%), while the most female-oriented occupations are Business & Financial (100.0%), Education Instruction & Library (100.0%), and Education, Arts & Media (76.9%).
| Occupation | Male | Female |
| Management | 27 (39.1%) | 42 (60.9%) |
| Business & Financial | 0 (0.0%) | 10 (100.0%) |
| Computers, Engineering & Science | 7 (100.0%) | 0 (0.0%) |
| Computers & Mathematics | 0 (0.0%) | 0 (0.0%) |
| Architecture & Engineering | 7 (100.0%) | 0 (0.0%) |
| Life, Physical & Social Science | 0 (0.0%) | 0 (0.0%) |
| Community & Social Service | 11 (27.5%) | 29 (72.5%) |
| Education, Arts & Media | 3 (23.1%) | 10 (76.9%) |
| Legal Services & Support | 0 (0.0%) | 0 (0.0%) |
| Education Instruction & Library | 0 (0.0%) | 19 (100.0%) |
| Arts, Media & Entertainment | 8 (100.0%) | 0 (0.0%) |
| Health Diagnosing & Treating | 0 (0.0%) | 0 (0.0%) |
| Health Technologists | 0 (0.0%) | 0 (0.0%) |
| Total (Category) | 45 (35.7%) | 81 (64.3%) |
| Total (Overall) | 179 (45.6%) | 214 (54.4%) |
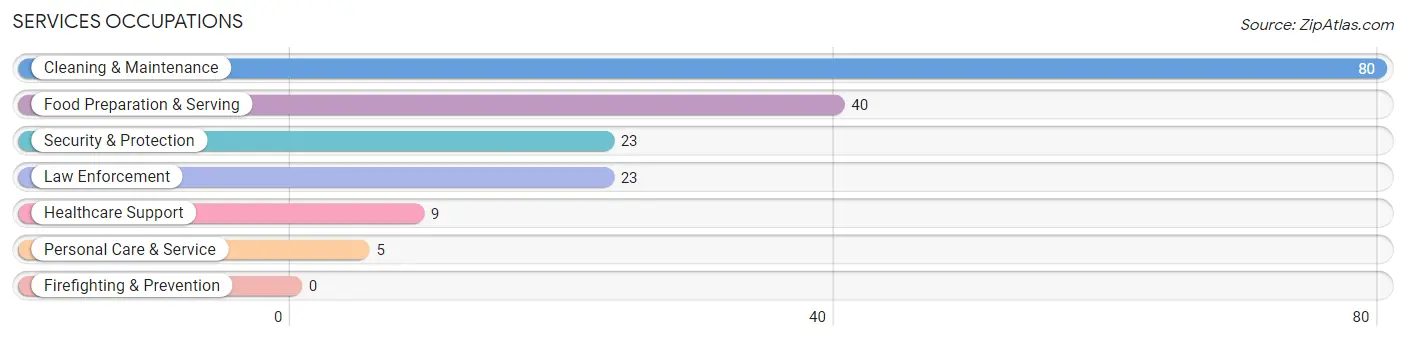
Services Occupations
The most common Services occupations in Green River are Cleaning & Maintenance (80 | 20.4%), Food Preparation & Serving (40 | 10.2%), Security & Protection (23 | 5.9%), Law Enforcement (23 | 5.9%), and Healthcare Support (9 | 2.3%).
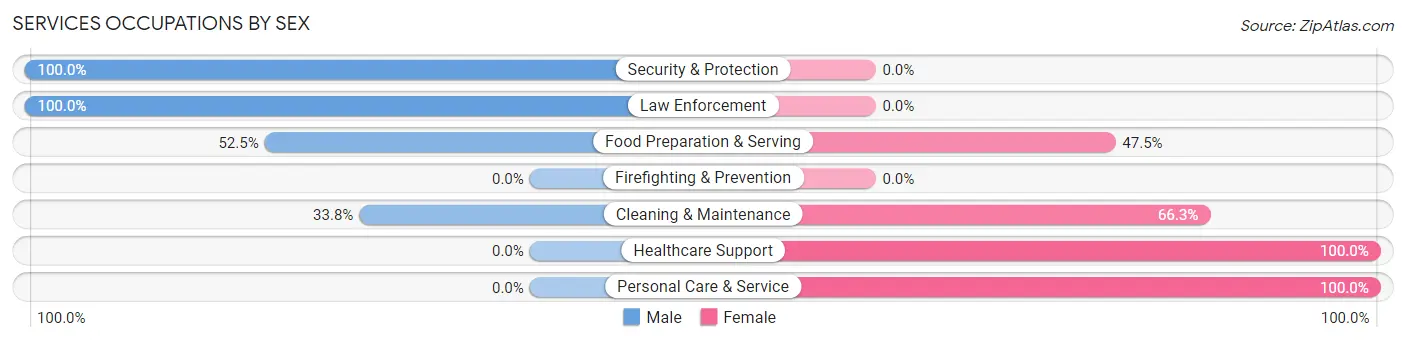
Services Occupations by Sex
Within the Services occupations in Green River, the most male-oriented occupations are Security & Protection (100.0%), Law Enforcement (100.0%), and Food Preparation & Serving (52.5%), while the most female-oriented occupations are Healthcare Support (100.0%), Personal Care & Service (100.0%), and Cleaning & Maintenance (66.2%).
| Occupation | Male | Female |
| Healthcare Support | 0 (0.0%) | 9 (100.0%) |
| Security & Protection | 23 (100.0%) | 0 (0.0%) |
| Firefighting & Prevention | 0 (0.0%) | 0 (0.0%) |
| Law Enforcement | 23 (100.0%) | 0 (0.0%) |
| Food Preparation & Serving | 21 (52.5%) | 19 (47.5%) |
| Cleaning & Maintenance | 27 (33.8%) | 53 (66.2%) |
| Personal Care & Service | 0 (0.0%) | 5 (100.0%) |
| Total (Category) | 71 (45.2%) | 86 (54.8%) |
| Total (Overall) | 179 (45.6%) | 214 (54.4%) |
Sales and Office Occupations
The most common Sales and Office occupations in Green River are Office & Administration (40 | 10.2%), and Sales & Related (14 | 3.6%).

Sales and Office Occupations by Sex
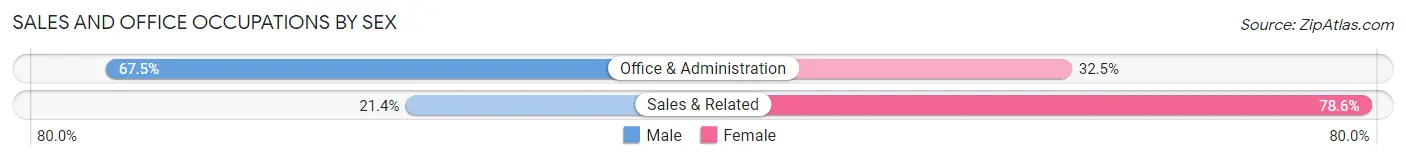
| Occupation | Male | Female |
| Sales & Related | 3 (21.4%) | 11 (78.6%) |
| Office & Administration | 27 (67.5%) | 13 (32.5%) |
| Total (Category) | 30 (55.6%) | 24 (44.4%) |
| Total (Overall) | 179 (45.6%) | 214 (54.4%) |
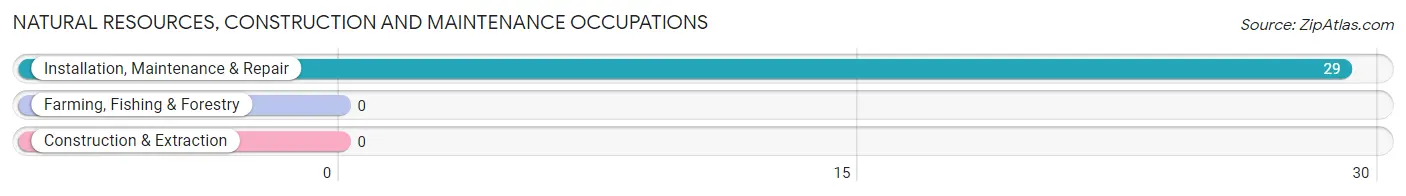
Natural Resources, Construction and Maintenance Occupations
The most common Natural Resources, Construction and Maintenance occupations in Green River are , and Installation, Maintenance & Repair (29 | 7.4%).
Natural Resources, Construction and Maintenance Occupations by Sex
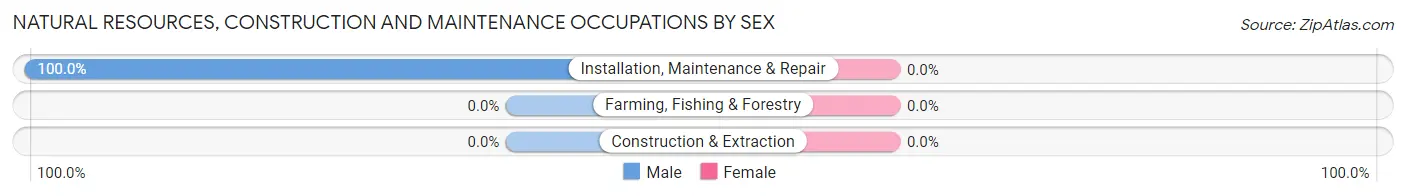
| Occupation | Male | Female |
| Farming, Fishing & Forestry | 0 (0.0%) | 0 (0.0%) |
| Construction & Extraction | 0 (0.0%) | 0 (0.0%) |
| Installation, Maintenance & Repair | 29 (100.0%) | 0 (0.0%) |
| Total (Category) | 29 (100.0%) | 0 (0.0%) |
| Total (Overall) | 179 (45.6%) | 214 (54.4%) |
Production, Transportation and Moving Occupations
The most common Production, Transportation and Moving occupations in Green River are Production (23 | 5.9%), and Transportation (4 | 1.0%).
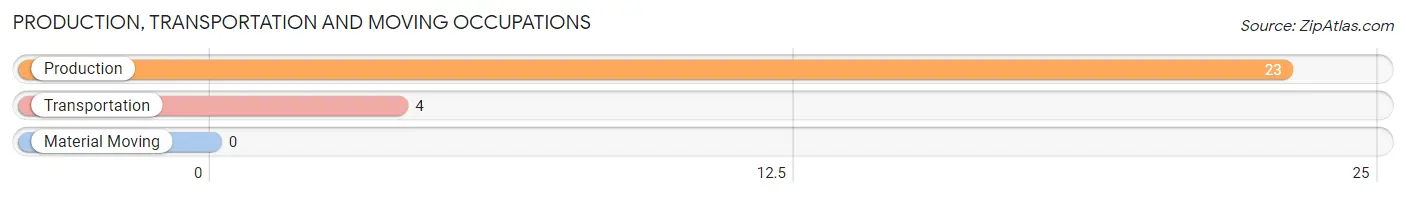
Production, Transportation and Moving Occupations by Sex
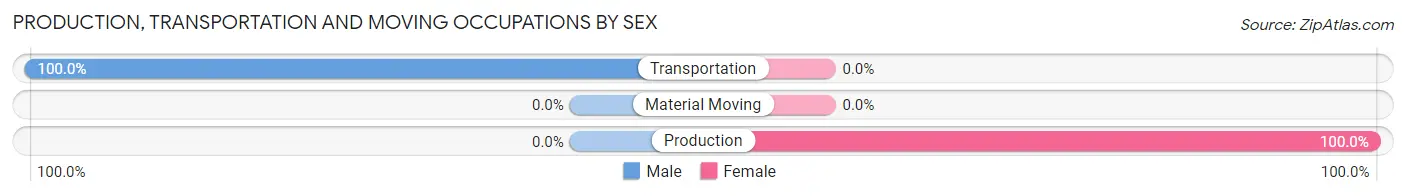
| Occupation | Male | Female |
| Production | 0 (0.0%) | 23 (100.0%) |
| Transportation | 4 (100.0%) | 0 (0.0%) |
| Material Moving | 0 (0.0%) | 0 (0.0%) |
| Total (Category) | 4 (14.8%) | 23 (85.2%) |
| Total (Overall) | 179 (45.6%) | 214 (54.4%) |
Employment Industries by Sex in Green River
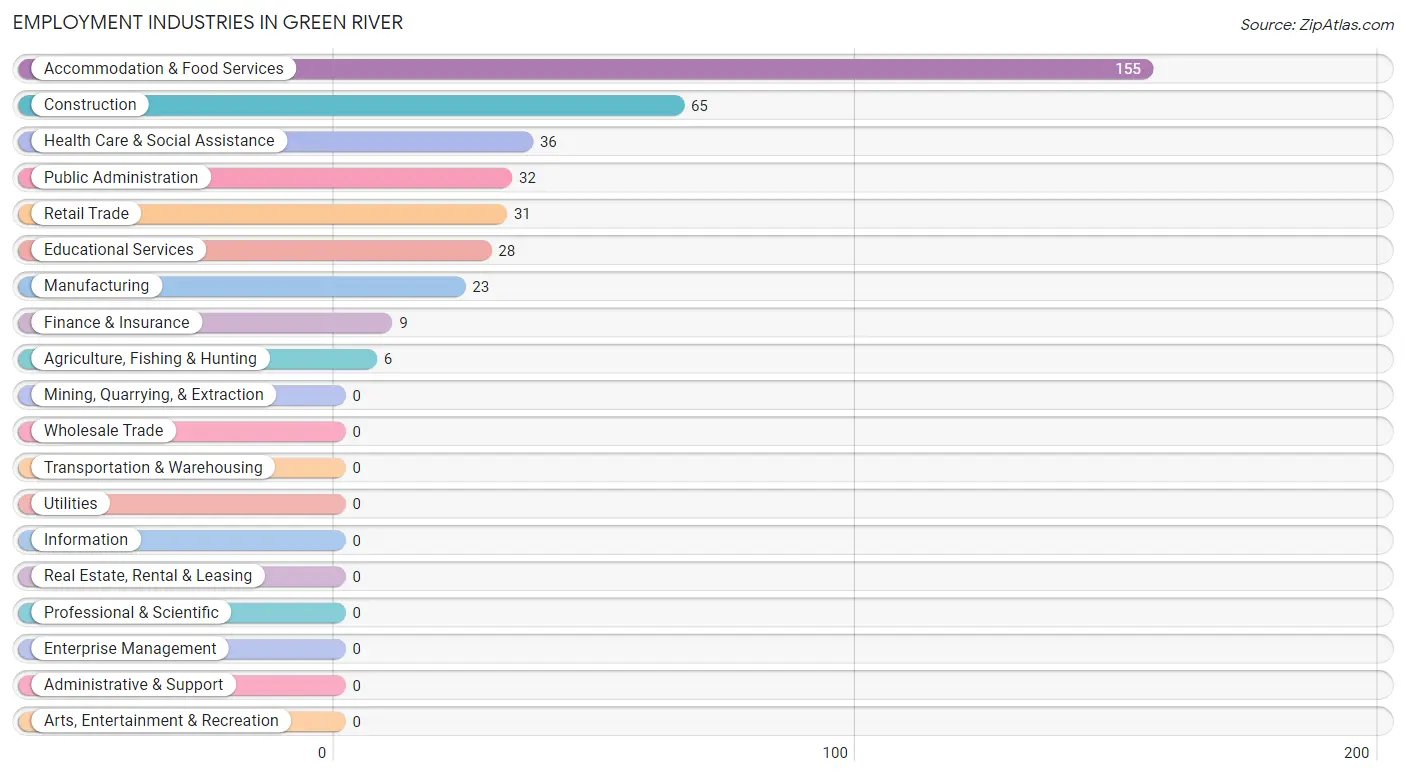
Employment Industries in Green River
The major employment industries in Green River include Accommodation & Food Services (155 | 39.4%), Construction (65 | 16.5%), Health Care & Social Assistance (36 | 9.2%), Public Administration (32 | 8.1%), and Retail Trade (31 | 7.9%).
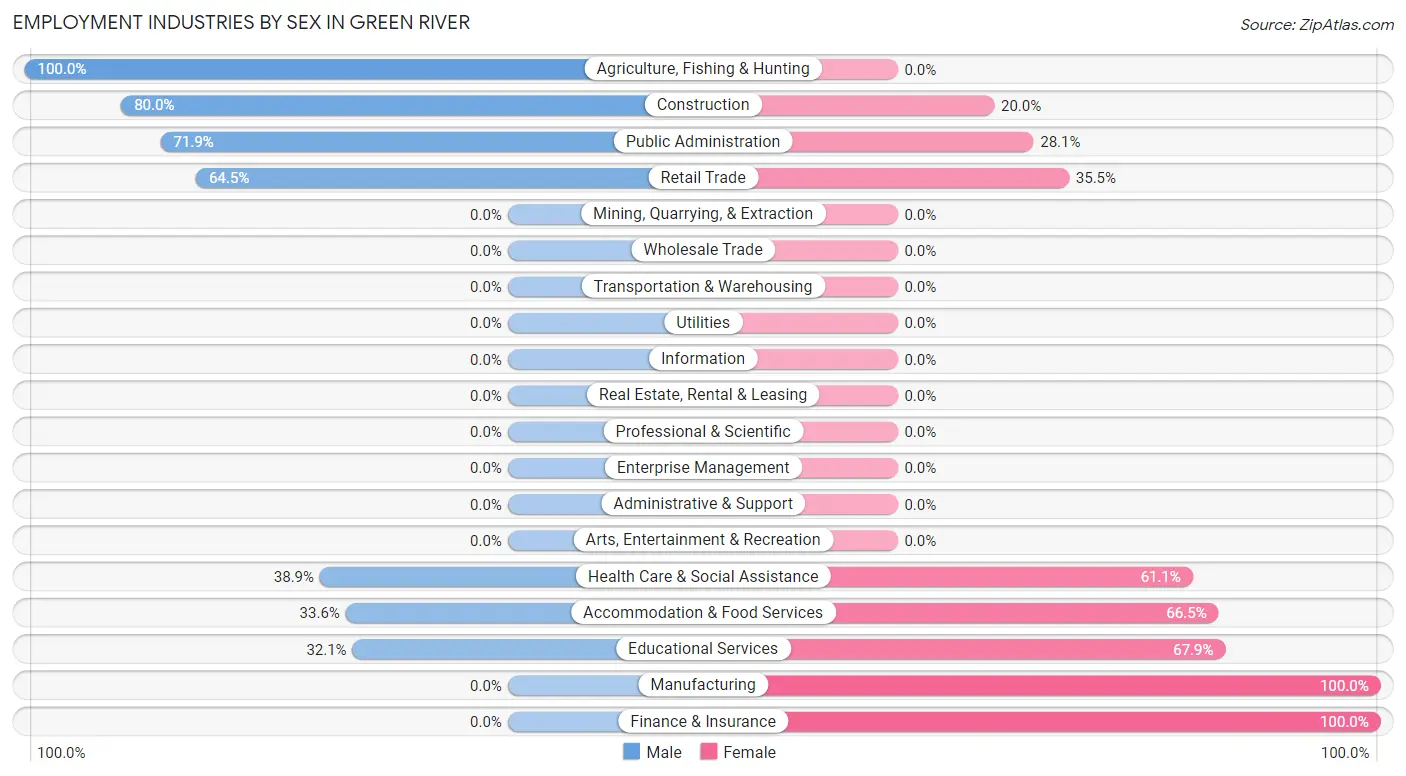
Employment Industries by Sex in Green River
The Green River industries that see more men than women are Agriculture, Fishing & Hunting (100.0%), Construction (80.0%), and Public Administration (71.9%), whereas the industries that tend to have a higher number of women are Manufacturing (100.0%), Finance & Insurance (100.0%), and Educational Services (67.9%).
| Industry | Male | Female |
| Agriculture, Fishing & Hunting | 6 (100.0%) | 0 (0.0%) |
| Mining, Quarrying, & Extraction | 0 (0.0%) | 0 (0.0%) |
| Construction | 52 (80.0%) | 13 (20.0%) |
| Manufacturing | 0 (0.0%) | 23 (100.0%) |
| Wholesale Trade | 0 (0.0%) | 0 (0.0%) |
| Retail Trade | 20 (64.5%) | 11 (35.5%) |
| Transportation & Warehousing | 0 (0.0%) | 0 (0.0%) |
| Utilities | 0 (0.0%) | 0 (0.0%) |
| Information | 0 (0.0%) | 0 (0.0%) |
| Finance & Insurance | 0 (0.0%) | 9 (100.0%) |
| Real Estate, Rental & Leasing | 0 (0.0%) | 0 (0.0%) |
| Professional & Scientific | 0 (0.0%) | 0 (0.0%) |
| Enterprise Management | 0 (0.0%) | 0 (0.0%) |
| Administrative & Support | 0 (0.0%) | 0 (0.0%) |
| Educational Services | 9 (32.1%) | 19 (67.9%) |
| Health Care & Social Assistance | 14 (38.9%) | 22 (61.1%) |
| Arts, Entertainment & Recreation | 0 (0.0%) | 0 (0.0%) |
| Accommodation & Food Services | 52 (33.6%) | 103 (66.4%) |
| Public Administration | 23 (71.9%) | 9 (28.1%) |
| Total | 179 (45.6%) | 214 (54.4%) |
Education in Green River
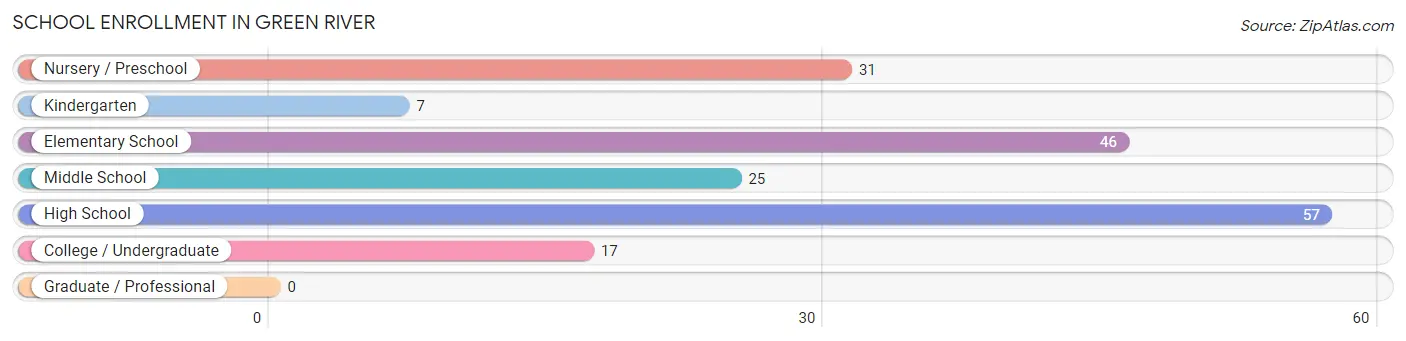
School Enrollment in Green River
The most common levels of schooling among the 183 students in Green River are high school (57 | 31.1%), elementary school (46 | 25.1%), and nursery / preschool (31 | 16.9%).
| School Level | # Students | % Students |
| Nursery / Preschool | 31 | 16.9% |
| Kindergarten | 7 | 3.8% |
| Elementary School | 46 | 25.1% |
| Middle School | 25 | 13.7% |
| High School | 57 | 31.1% |
| College / Undergraduate | 17 | 9.3% |
| Graduate / Professional | 0 | 0.0% |
| Total | 183 | 100.0% |
School Enrollment by Age by Funding Source in Green River
Out of a total of 183 students who are enrolled in schools in Green River, 4 (2.2%) attend a private institution, while the remaining 179 (97.8%) are enrolled in public schools. The age group of 25 to 34 year olds has the highest likelihood of being enrolled in private schools, with 4 (66.7% in the age bracket) enrolled. Conversely, the age group of 3 to 4 year olds has the lowest likelihood of being enrolled in a private school, with 26 (100.0% in the age bracket) attending a public institution.
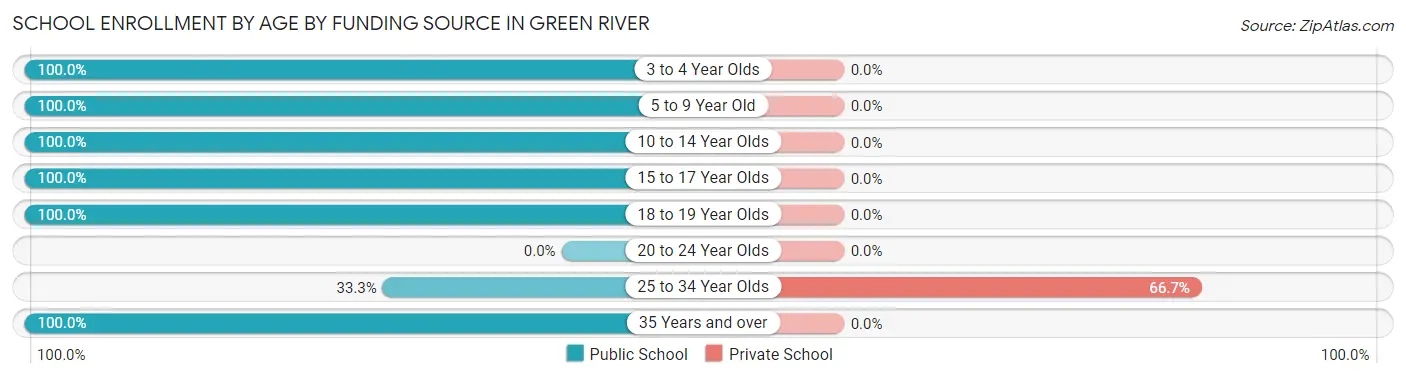
| Age Bracket | Public School | Private School |
| 3 to 4 Year Olds | 26 (100.0%) | 0 (0.0%) |
| 5 to 9 Year Old | 58 (100.0%) | 0 (0.0%) |
| 10 to 14 Year Olds | 28 (100.0%) | 0 (0.0%) |
| 15 to 17 Year Olds | 40 (100.0%) | 0 (0.0%) |
| 18 to 19 Year Olds | 14 (100.0%) | 0 (0.0%) |
| 20 to 24 Year Olds | 0 (0.0%) | 0 (0.0%) |
| 25 to 34 Year Olds | 2 (33.3%) | 4 (66.7%) |
| 35 Years and over | 11 (100.0%) | 0 (0.0%) |
| Total | 179 (97.8%) | 4 (2.2%) |
Educational Attainment by Field of Study in Green River
Science & technology (14 | 26.9%), education (13 | 25.0%), literature & languages (10 | 19.2%), liberal arts & history (8 | 15.4%), and bio, nature & agricultural (5 | 9.6%) are the most common fields of study among 52 individuals in Green River who have obtained a bachelor's degree or higher.
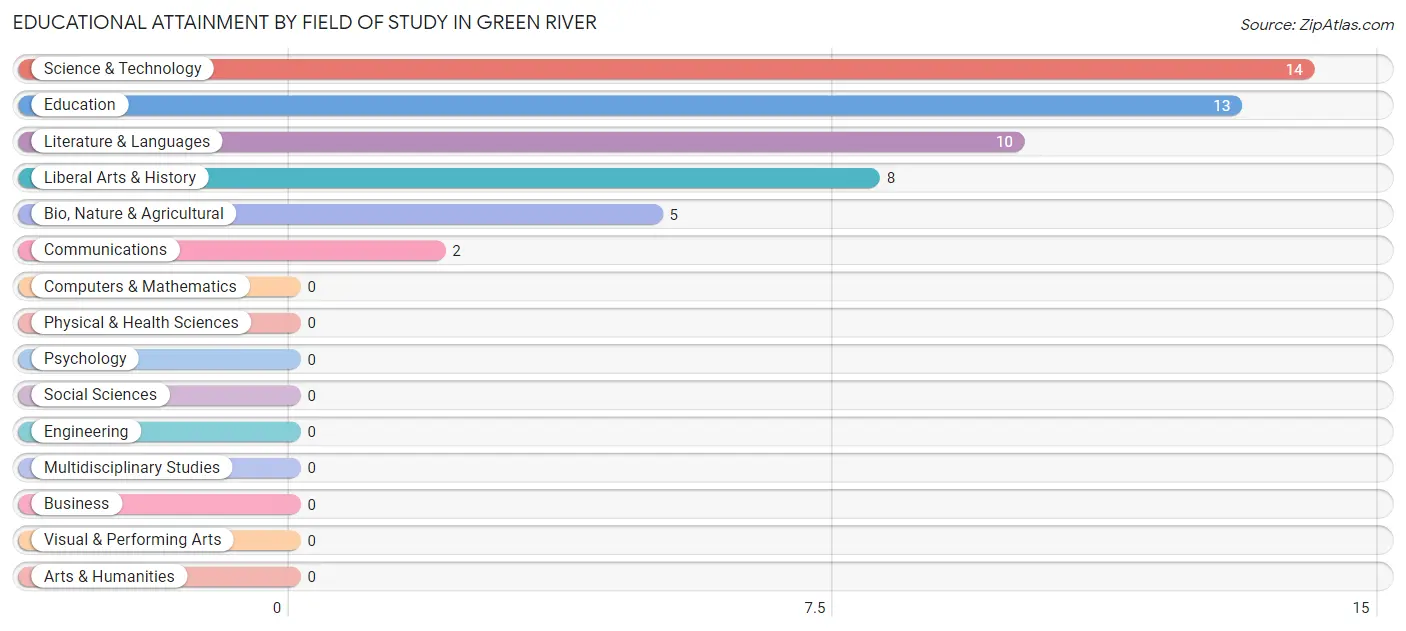
| Field of Study | # Graduates | % Graduates |
| Computers & Mathematics | 0 | 0.0% |
| Bio, Nature & Agricultural | 5 | 9.6% |
| Physical & Health Sciences | 0 | 0.0% |
| Psychology | 0 | 0.0% |
| Social Sciences | 0 | 0.0% |
| Engineering | 0 | 0.0% |
| Multidisciplinary Studies | 0 | 0.0% |
| Science & Technology | 14 | 26.9% |
| Business | 0 | 0.0% |
| Education | 13 | 25.0% |
| Literature & Languages | 10 | 19.2% |
| Liberal Arts & History | 8 | 15.4% |
| Visual & Performing Arts | 0 | 0.0% |
| Communications | 2 | 3.8% |
| Arts & Humanities | 0 | 0.0% |
| Total | 52 | 100.0% |
Transportation & Commute in Green River
Vehicle Availability by Sex in Green River
The most prevalent vehicle ownership categories in Green River are males with 3 vehicles (67, accounting for 38.3%) and females with 3 vehicles (72, making up 34.7%).
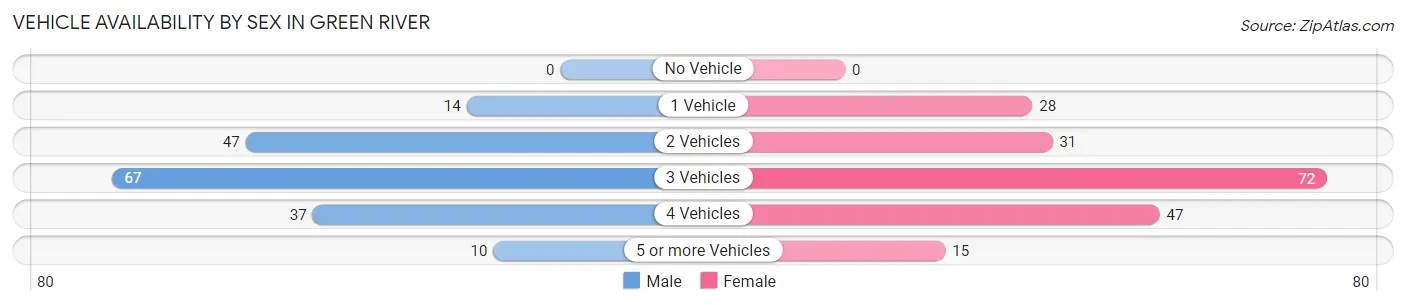
| Vehicles Available | Male | Female |
| No Vehicle | 0 (0.0%) | 0 (0.0%) |
| 1 Vehicle | 14 (8.0%) | 28 (14.5%) |
| 2 Vehicles | 47 (26.9%) | 31 (16.1%) |
| 3 Vehicles | 67 (38.3%) | 72 (37.3%) |
| 4 Vehicles | 37 (21.1%) | 47 (24.3%) |
| 5 or more Vehicles | 10 (5.7%) | 15 (7.8%) |
| Total | 175 (100.0%) | 193 (100.0%) |
Commute Time in Green River
The most frequently occuring commute durations in Green River are 5 to 9 minutes (177 commuters, 50.1%), less than 5 minutes (108 commuters, 30.6%), and 10 to 14 minutes (17 commuters, 4.8%).
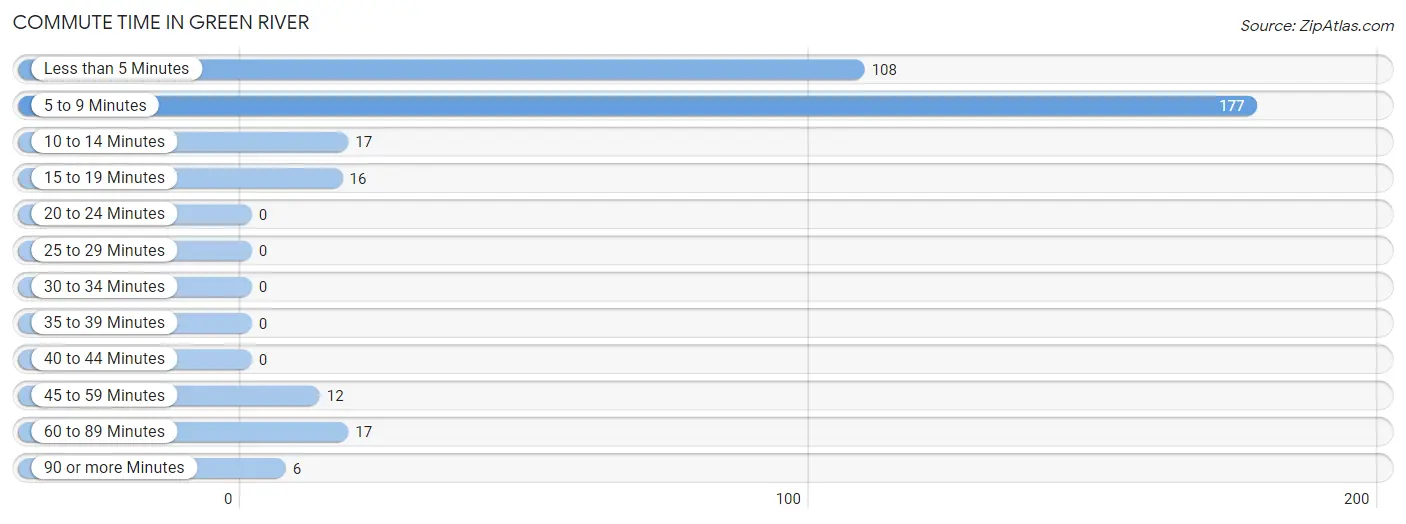
| Commute Time | # Commuters | % Commuters |
| Less than 5 Minutes | 108 | 30.6% |
| 5 to 9 Minutes | 177 | 50.1% |
| 10 to 14 Minutes | 17 | 4.8% |
| 15 to 19 Minutes | 16 | 4.5% |
| 20 to 24 Minutes | 0 | 0.0% |
| 25 to 29 Minutes | 0 | 0.0% |
| 30 to 34 Minutes | 0 | 0.0% |
| 35 to 39 Minutes | 0 | 0.0% |
| 40 to 44 Minutes | 0 | 0.0% |
| 45 to 59 Minutes | 12 | 3.4% |
| 60 to 89 Minutes | 17 | 4.8% |
| 90 or more Minutes | 6 | 1.7% |
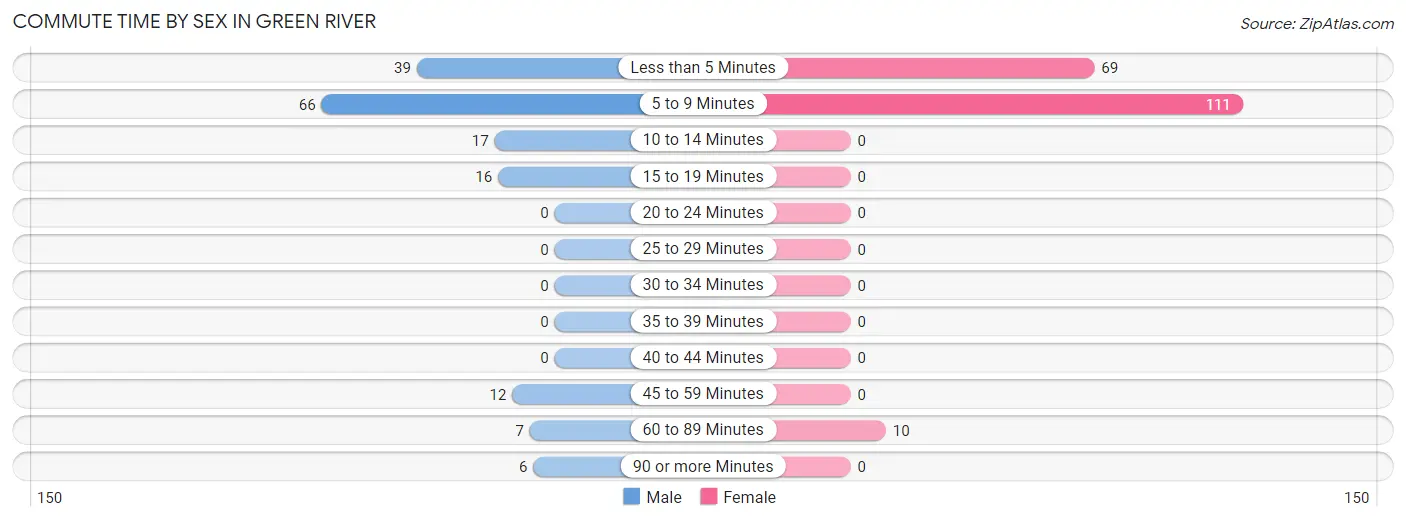
Commute Time by Sex in Green River
The most common commute times in Green River are 5 to 9 minutes (66 commuters, 40.5%) for males and 5 to 9 minutes (111 commuters, 58.4%) for females.
| Commute Time | Male | Female |
| Less than 5 Minutes | 39 (23.9%) | 69 (36.3%) |
| 5 to 9 Minutes | 66 (40.5%) | 111 (58.4%) |
| 10 to 14 Minutes | 17 (10.4%) | 0 (0.0%) |
| 15 to 19 Minutes | 16 (9.8%) | 0 (0.0%) |
| 20 to 24 Minutes | 0 (0.0%) | 0 (0.0%) |
| 25 to 29 Minutes | 0 (0.0%) | 0 (0.0%) |
| 30 to 34 Minutes | 0 (0.0%) | 0 (0.0%) |
| 35 to 39 Minutes | 0 (0.0%) | 0 (0.0%) |
| 40 to 44 Minutes | 0 (0.0%) | 0 (0.0%) |
| 45 to 59 Minutes | 12 (7.4%) | 0 (0.0%) |
| 60 to 89 Minutes | 7 (4.3%) | 10 (5.3%) |
| 90 or more Minutes | 6 (3.7%) | 0 (0.0%) |
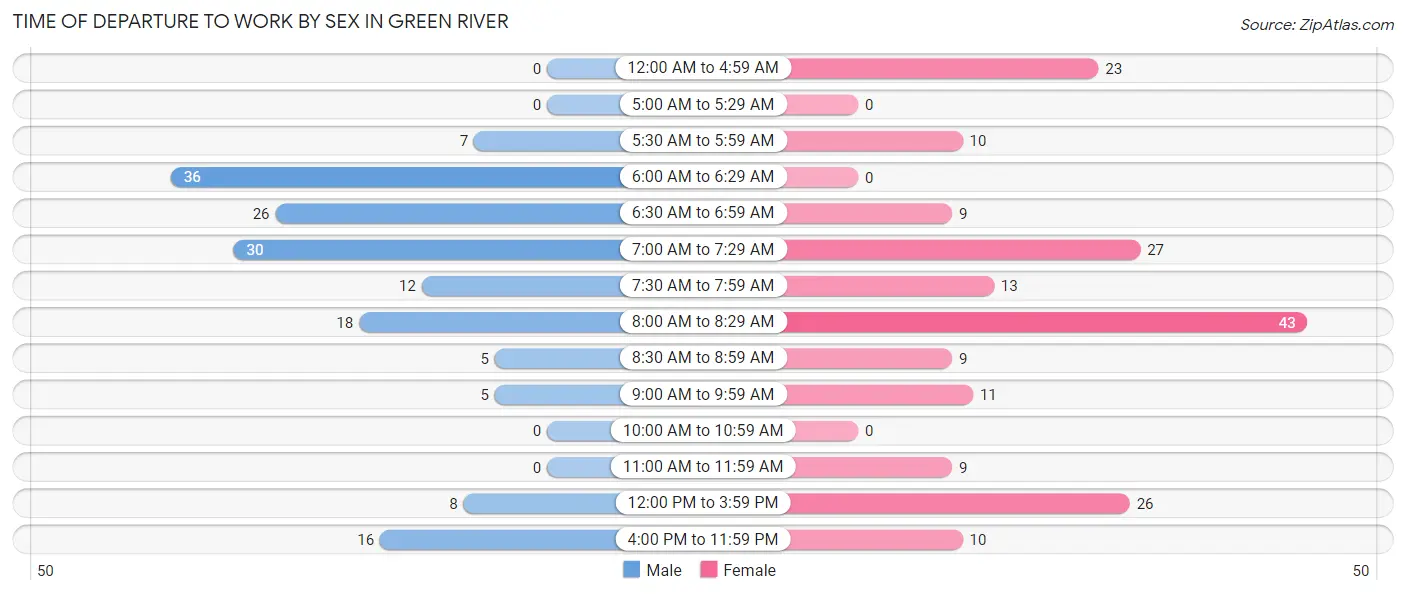
Time of Departure to Work by Sex in Green River
The most frequent times of departure to work in Green River are 6:00 AM to 6:29 AM (36, 22.1%) for males and 8:00 AM to 8:29 AM (43, 22.6%) for females.
| Time of Departure | Male | Female |
| 12:00 AM to 4:59 AM | 0 (0.0%) | 23 (12.1%) |
| 5:00 AM to 5:29 AM | 0 (0.0%) | 0 (0.0%) |
| 5:30 AM to 5:59 AM | 7 (4.3%) | 10 (5.3%) |
| 6:00 AM to 6:29 AM | 36 (22.1%) | 0 (0.0%) |
| 6:30 AM to 6:59 AM | 26 (16.0%) | 9 (4.7%) |
| 7:00 AM to 7:29 AM | 30 (18.4%) | 27 (14.2%) |
| 7:30 AM to 7:59 AM | 12 (7.4%) | 13 (6.8%) |
| 8:00 AM to 8:29 AM | 18 (11.0%) | 43 (22.6%) |
| 8:30 AM to 8:59 AM | 5 (3.1%) | 9 (4.7%) |
| 9:00 AM to 9:59 AM | 5 (3.1%) | 11 (5.8%) |
| 10:00 AM to 10:59 AM | 0 (0.0%) | 0 (0.0%) |
| 11:00 AM to 11:59 AM | 0 (0.0%) | 9 (4.7%) |
| 12:00 PM to 3:59 PM | 8 (4.9%) | 26 (13.7%) |
| 4:00 PM to 11:59 PM | 16 (9.8%) | 10 (5.3%) |
| Total | 163 (100.0%) | 190 (100.0%) |
Housing Occupancy in Green River
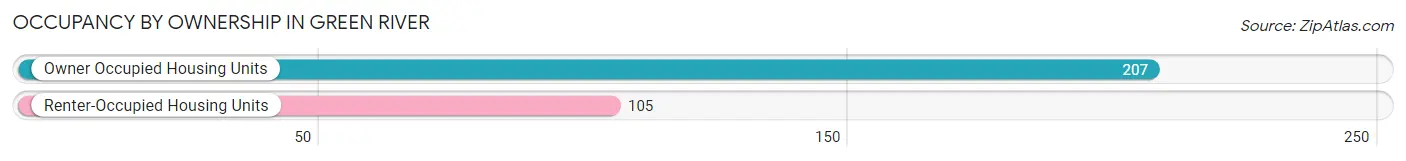
Occupancy by Ownership in Green River
Of the total 312 dwellings in Green River, owner-occupied units account for 207 (66.3%), while renter-occupied units make up 105 (33.7%).
| Occupancy | # Housing Units | % Housing Units |
| Owner Occupied Housing Units | 207 | 66.3% |
| Renter-Occupied Housing Units | 105 | 33.7% |
| Total Occupied Housing Units | 312 | 100.0% |
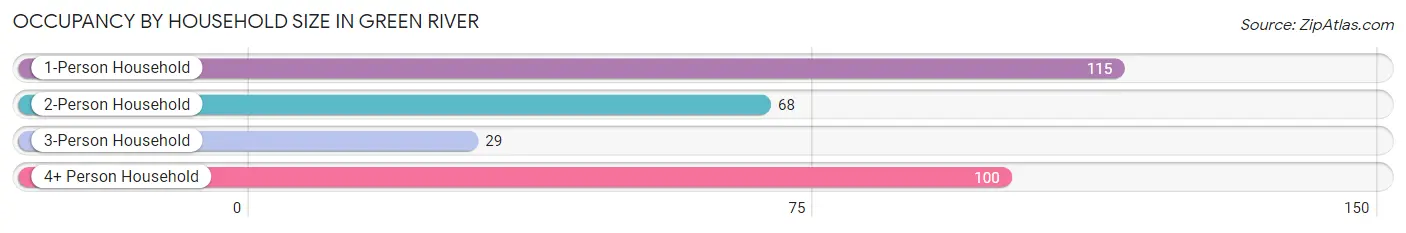
Occupancy by Household Size in Green River
| Household Size | # Housing Units | % Housing Units |
| 1-Person Household | 115 | 36.9% |
| 2-Person Household | 68 | 21.8% |
| 3-Person Household | 29 | 9.3% |
| 4+ Person Household | 100 | 32.1% |
| Total Housing Units | 312 | 100.0% |
Occupancy by Ownership by Household Size in Green River
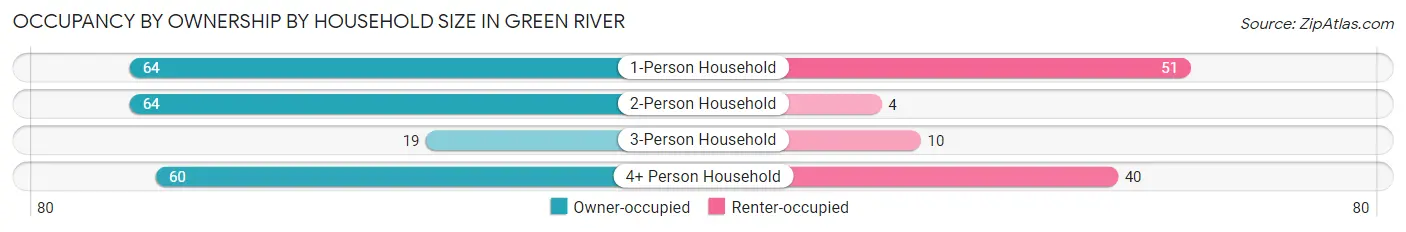
| Household Size | Owner-occupied | Renter-occupied |
| 1-Person Household | 64 (55.6%) | 51 (44.4%) |
| 2-Person Household | 64 (94.1%) | 4 (5.9%) |
| 3-Person Household | 19 (65.5%) | 10 (34.5%) |
| 4+ Person Household | 60 (60.0%) | 40 (40.0%) |
| Total Housing Units | 207 (66.3%) | 105 (33.7%) |
Occupancy by Educational Attainment in Green River
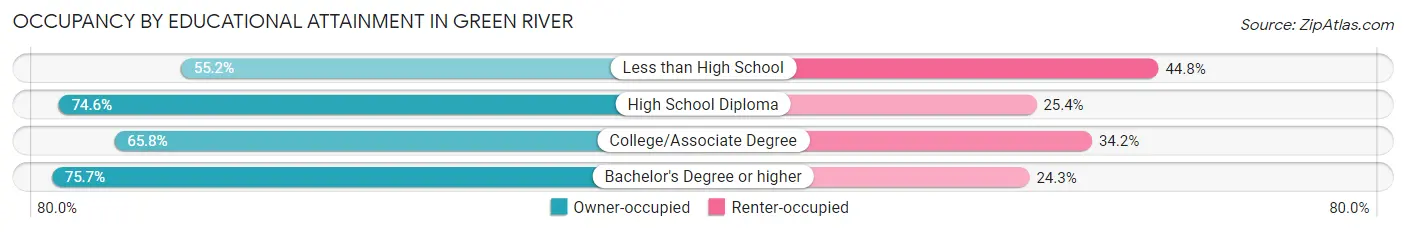
| Household Size | Owner-occupied | Renter-occupied |
| Less than High School | 37 (55.2%) | 30 (44.8%) |
| High School Diploma | 44 (74.6%) | 15 (25.4%) |
| College/Associate Degree | 98 (65.8%) | 51 (34.2%) |
| Bachelor's Degree or higher | 28 (75.7%) | 9 (24.3%) |
Occupancy by Age of Householder in Green River
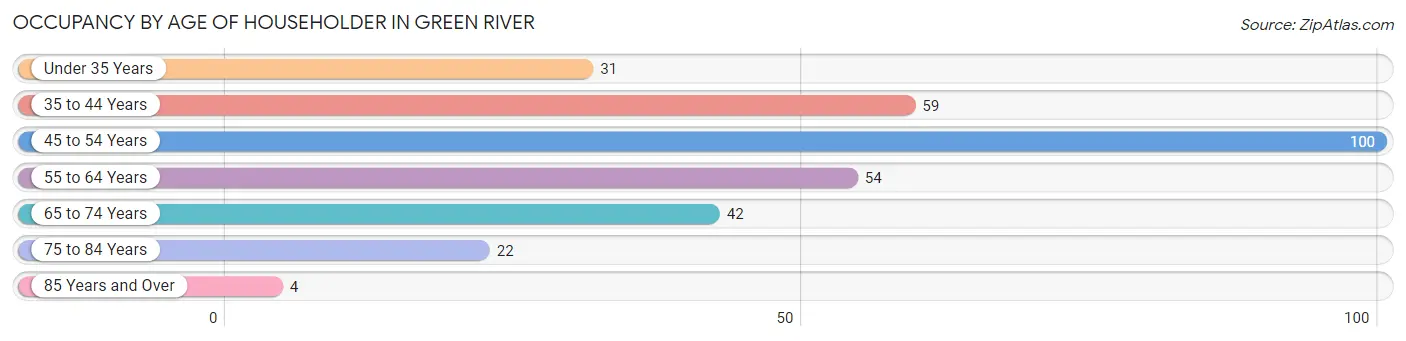
| Age Bracket | # Households | % Households |
| Under 35 Years | 31 | 9.9% |
| 35 to 44 Years | 59 | 18.9% |
| 45 to 54 Years | 100 | 32.1% |
| 55 to 64 Years | 54 | 17.3% |
| 65 to 74 Years | 42 | 13.5% |
| 75 to 84 Years | 22 | 7.0% |
| 85 Years and Over | 4 | 1.3% |
| Total | 312 | 100.0% |
Housing Finances in Green River
Median Income by Occupancy in Green River
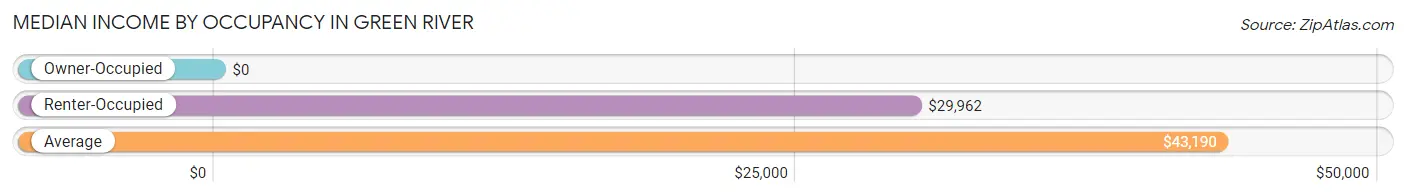
| Occupancy Type | # Households | Median Income |
| Owner-Occupied | 207 (66.3%) | $0 |
| Renter-Occupied | 105 (33.7%) | $29,962 |
| Average | 312 (100.0%) | $43,190 |
Occupancy by Householder Income Bracket in Green River
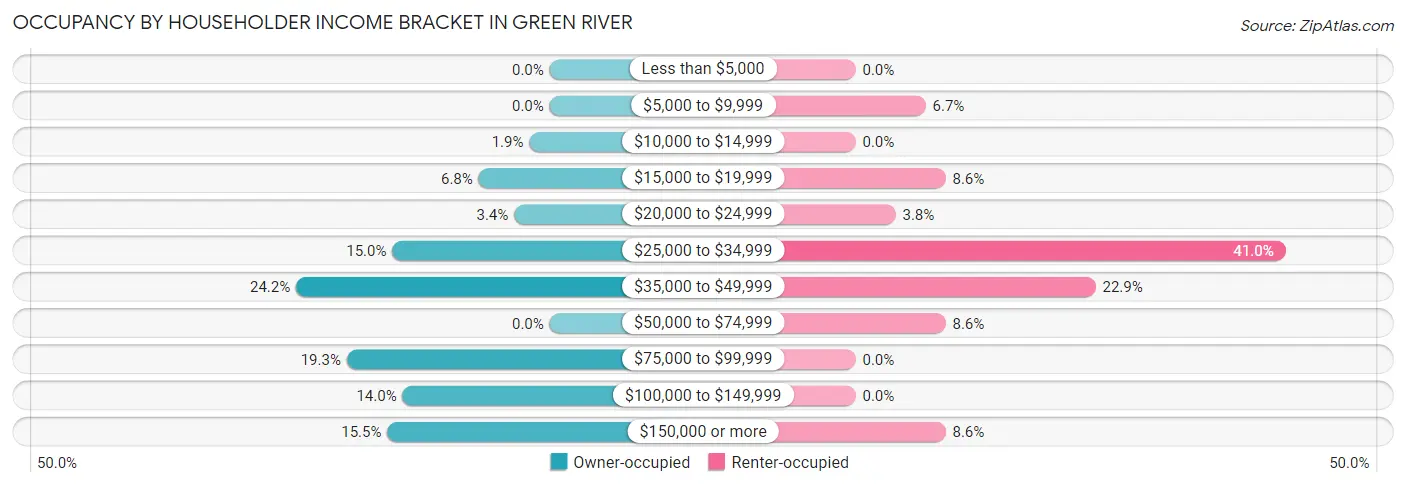
| Income Bracket | Owner-occupied | Renter-occupied |
| Less than $5,000 | 0 (0.0%) | 0 (0.0%) |
| $5,000 to $9,999 | 0 (0.0%) | 7 (6.7%) |
| $10,000 to $14,999 | 4 (1.9%) | 0 (0.0%) |
| $15,000 to $19,999 | 14 (6.8%) | 9 (8.6%) |
| $20,000 to $24,999 | 7 (3.4%) | 4 (3.8%) |
| $25,000 to $34,999 | 31 (15.0%) | 43 (40.9%) |
| $35,000 to $49,999 | 50 (24.1%) | 24 (22.9%) |
| $50,000 to $74,999 | 0 (0.0%) | 9 (8.6%) |
| $75,000 to $99,999 | 40 (19.3%) | 0 (0.0%) |
| $100,000 to $149,999 | 29 (14.0%) | 0 (0.0%) |
| $150,000 or more | 32 (15.5%) | 9 (8.6%) |
| Total | 207 (100.0%) | 105 (100.0%) |
Monthly Housing Cost Tiers in Green River
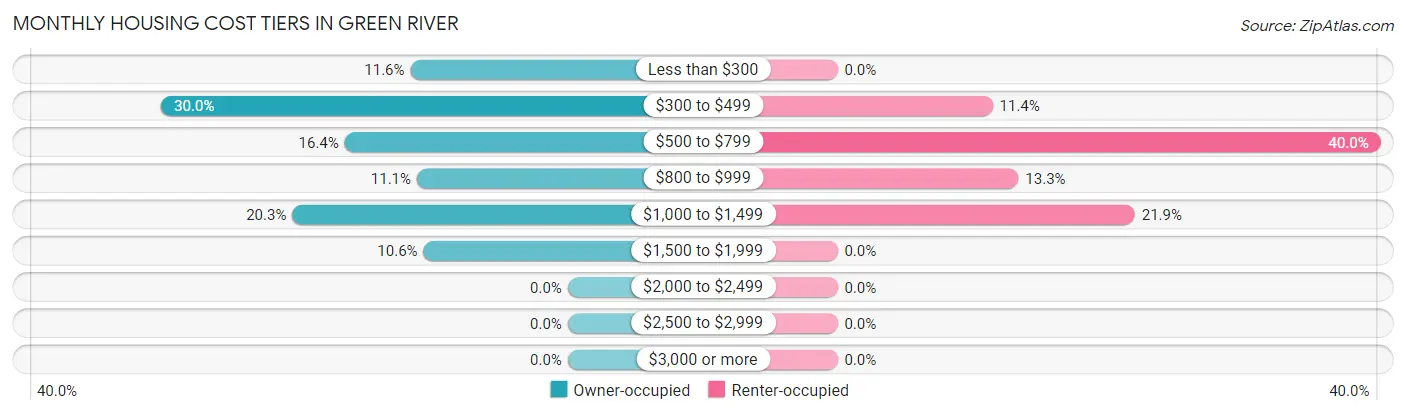
| Monthly Cost | Owner-occupied | Renter-occupied |
| Less than $300 | 24 (11.6%) | 0 (0.0%) |
| $300 to $499 | 62 (29.9%) | 12 (11.4%) |
| $500 to $799 | 34 (16.4%) | 42 (40.0%) |
| $800 to $999 | 23 (11.1%) | 14 (13.3%) |
| $1,000 to $1,499 | 42 (20.3%) | 23 (21.9%) |
| $1,500 to $1,999 | 22 (10.6%) | 0 (0.0%) |
| $2,000 to $2,499 | 0 (0.0%) | 0 (0.0%) |
| $2,500 to $2,999 | 0 (0.0%) | 0 (0.0%) |
| $3,000 or more | 0 (0.0%) | 0 (0.0%) |
| Total | 207 (100.0%) | 105 (100.0%) |
Physical Housing Characteristics in Green River
Housing Structures in Green River
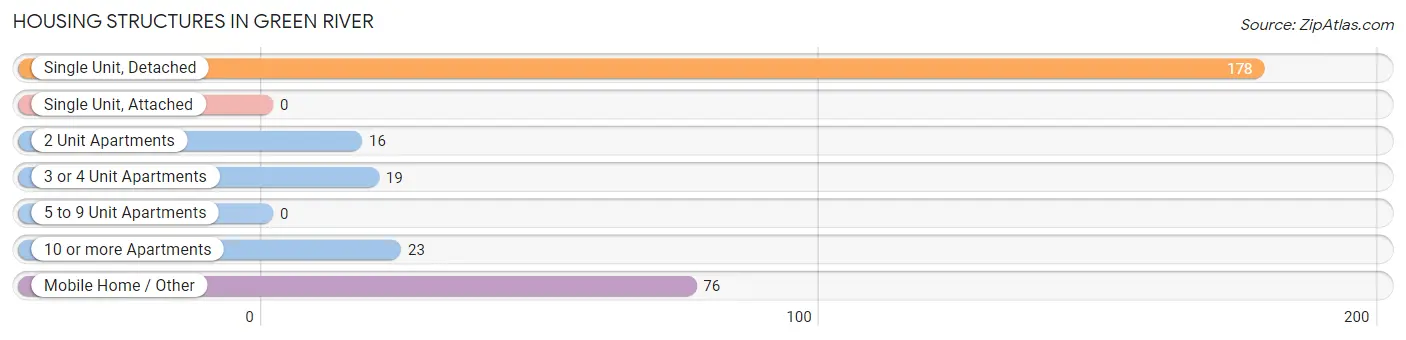
| Structure Type | # Housing Units | % Housing Units |
| Single Unit, Detached | 178 | 57.1% |
| Single Unit, Attached | 0 | 0.0% |
| 2 Unit Apartments | 16 | 5.1% |
| 3 or 4 Unit Apartments | 19 | 6.1% |
| 5 to 9 Unit Apartments | 0 | 0.0% |
| 10 or more Apartments | 23 | 7.4% |
| Mobile Home / Other | 76 | 24.4% |
| Total | 312 | 100.0% |
Housing Structures by Occupancy in Green River
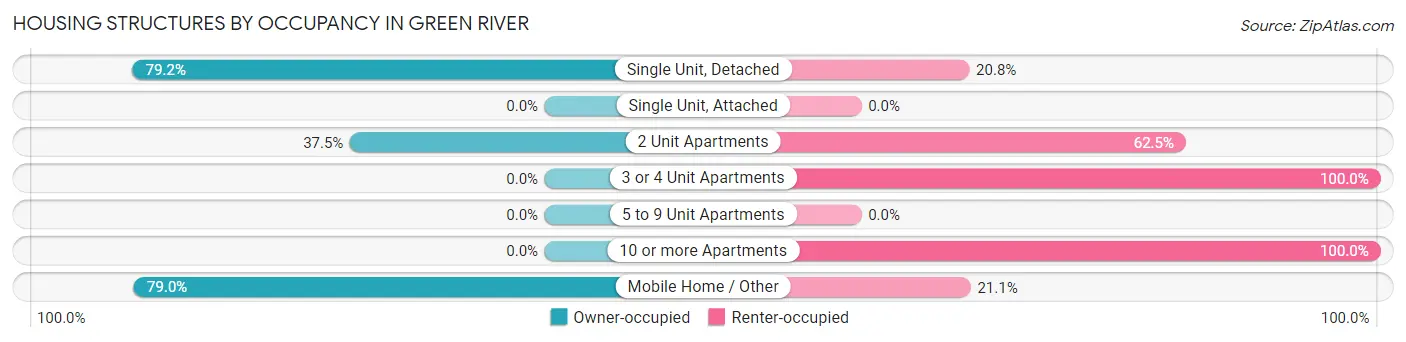
| Structure Type | Owner-occupied | Renter-occupied |
| Single Unit, Detached | 141 (79.2%) | 37 (20.8%) |
| Single Unit, Attached | 0 (0.0%) | 0 (0.0%) |
| 2 Unit Apartments | 6 (37.5%) | 10 (62.5%) |
| 3 or 4 Unit Apartments | 0 (0.0%) | 19 (100.0%) |
| 5 to 9 Unit Apartments | 0 (0.0%) | 0 (0.0%) |
| 10 or more Apartments | 0 (0.0%) | 23 (100.0%) |
| Mobile Home / Other | 60 (78.9%) | 16 (21.0%) |
| Total | 207 (66.3%) | 105 (33.7%) |
Housing Structures by Number of Rooms in Green River
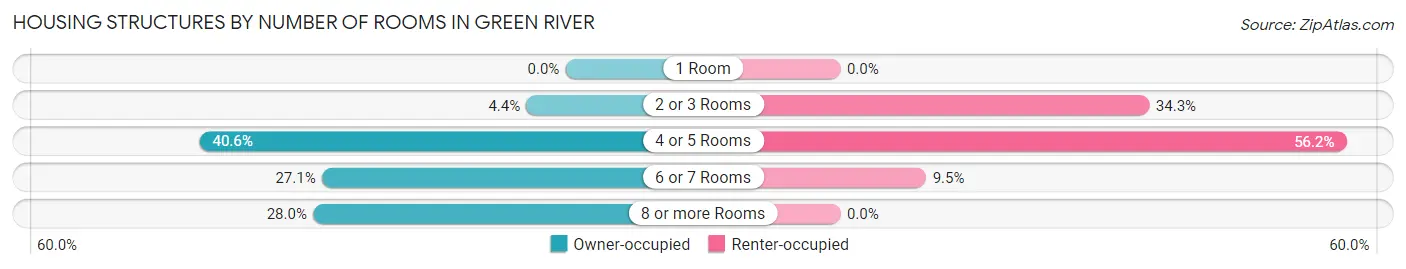
| Number of Rooms | Owner-occupied | Renter-occupied |
| 1 Room | 0 (0.0%) | 0 (0.0%) |
| 2 or 3 Rooms | 9 (4.3%) | 36 (34.3%) |
| 4 or 5 Rooms | 84 (40.6%) | 59 (56.2%) |
| 6 or 7 Rooms | 56 (27.1%) | 10 (9.5%) |
| 8 or more Rooms | 58 (28.0%) | 0 (0.0%) |
| Total | 207 (100.0%) | 105 (100.0%) |
Housing Structure by Heating Type in Green River
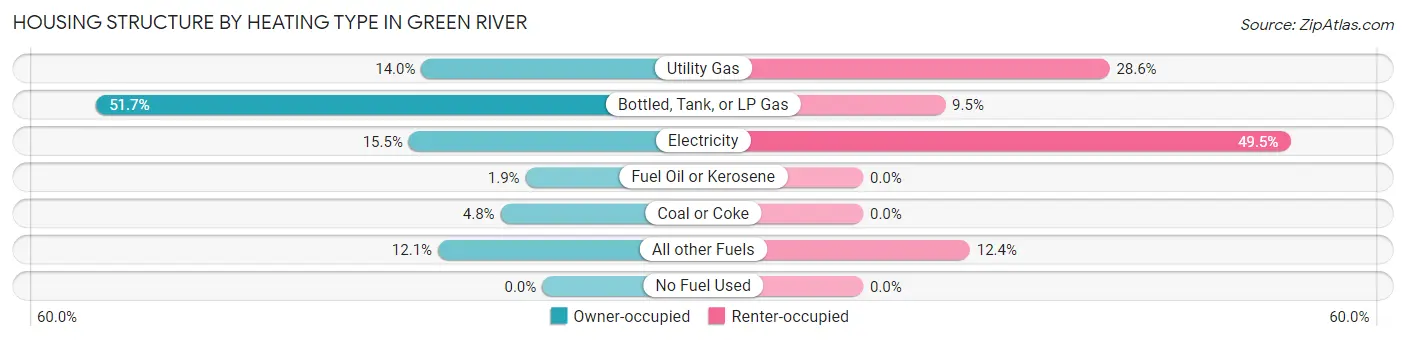
| Heating Type | Owner-occupied | Renter-occupied |
| Utility Gas | 29 (14.0%) | 30 (28.6%) |
| Bottled, Tank, or LP Gas | 107 (51.7%) | 10 (9.5%) |
| Electricity | 32 (15.5%) | 52 (49.5%) |
| Fuel Oil or Kerosene | 4 (1.9%) | 0 (0.0%) |
| Coal or Coke | 10 (4.8%) | 0 (0.0%) |
| All other Fuels | 25 (12.1%) | 13 (12.4%) |
| No Fuel Used | 0 (0.0%) | 0 (0.0%) |
| Total | 207 (100.0%) | 105 (100.0%) |
Household Vehicle Usage in Green River
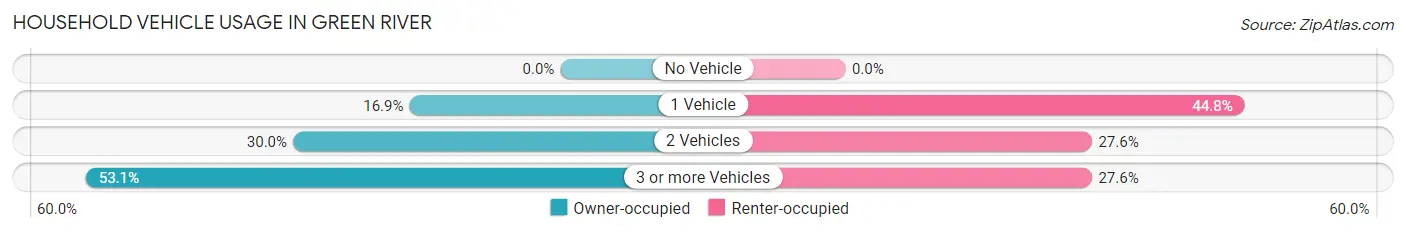
| Vehicles per Household | Owner-occupied | Renter-occupied |
| No Vehicle | 0 (0.0%) | 0 (0.0%) |
| 1 Vehicle | 35 (16.9%) | 47 (44.8%) |
| 2 Vehicles | 62 (29.9%) | 29 (27.6%) |
| 3 or more Vehicles | 110 (53.1%) | 29 (27.6%) |
| Total | 207 (100.0%) | 105 (100.0%) |
Real Estate & Mortgages in Green River
Real Estate and Mortgage Overview in Green River
| Characteristic | Without Mortgage | With Mortgage |
| Housing Units | 113 | 94 |
| Median Property Value | - | - |
| Median Household Income | $42,888 | $26 |
| Monthly Housing Costs | $392 | $0 |
| Real Estate Taxes | $414 | $0 |
Property Value by Mortgage Status in Green River
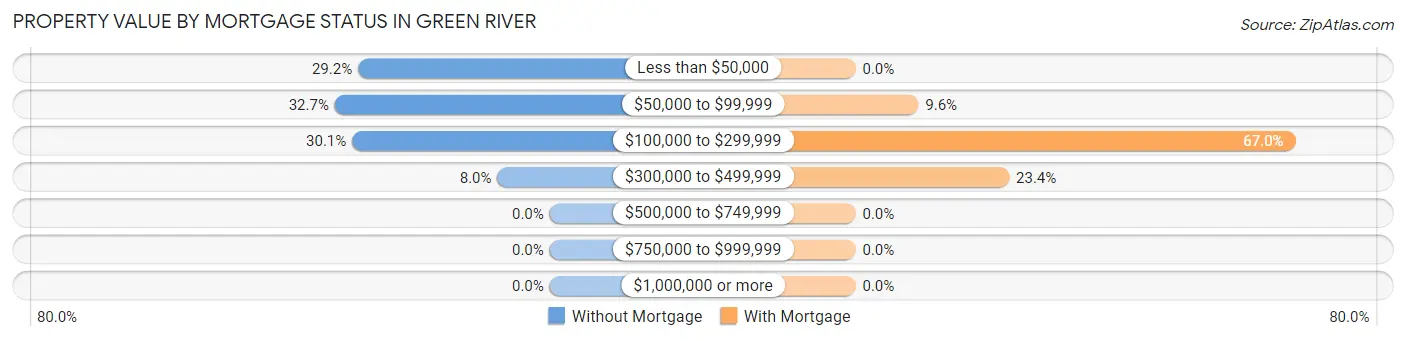
| Property Value | Without Mortgage | With Mortgage |
| Less than $50,000 | 33 (29.2%) | 0 (0.0%) |
| $50,000 to $99,999 | 37 (32.7%) | 9 (9.6%) |
| $100,000 to $299,999 | 34 (30.1%) | 63 (67.0%) |
| $300,000 to $499,999 | 9 (8.0%) | 22 (23.4%) |
| $500,000 to $749,999 | 0 (0.0%) | 0 (0.0%) |
| $750,000 to $999,999 | 0 (0.0%) | 0 (0.0%) |
| $1,000,000 or more | 0 (0.0%) | 0 (0.0%) |
| Total | 113 (100.0%) | 94 (100.0%) |
Household Income by Mortgage Status in Green River
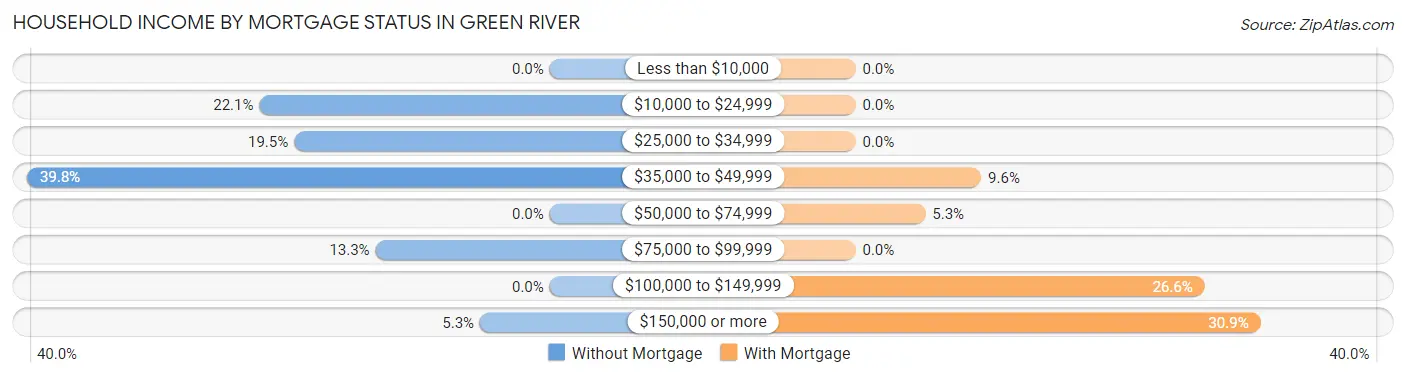
| Household Income | Without Mortgage | With Mortgage |
| Less than $10,000 | 0 (0.0%) | 0 (0.0%) |
| $10,000 to $24,999 | 25 (22.1%) | 0 (0.0%) |
| $25,000 to $34,999 | 22 (19.5%) | 0 (0.0%) |
| $35,000 to $49,999 | 45 (39.8%) | 9 (9.6%) |
| $50,000 to $74,999 | 0 (0.0%) | 5 (5.3%) |
| $75,000 to $99,999 | 15 (13.3%) | 0 (0.0%) |
| $100,000 to $149,999 | 0 (0.0%) | 25 (26.6%) |
| $150,000 or more | 6 (5.3%) | 29 (30.8%) |
| Total | 113 (100.0%) | 94 (100.0%) |
Property Value to Household Income Ratio in Green River
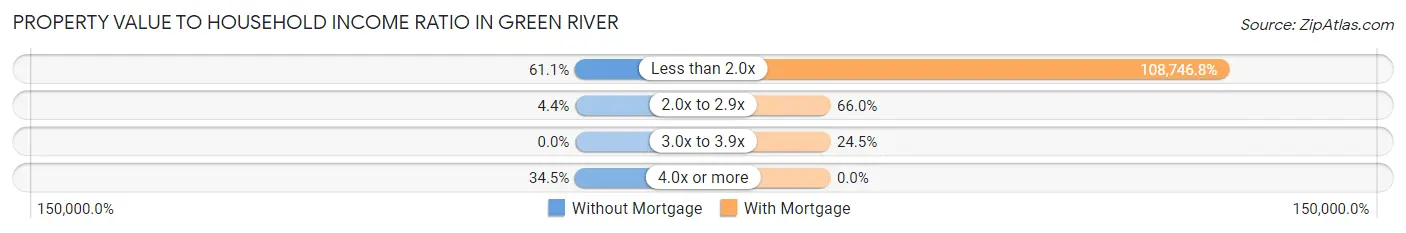
| Value-to-Income Ratio | Without Mortgage | With Mortgage |
| Less than 2.0x | 69 (61.1%) | 102,222 (108,746.8%) |
| 2.0x to 2.9x | 5 (4.4%) | 62 (66.0%) |
| 3.0x to 3.9x | 0 (0.0%) | 23 (24.5%) |
| 4.0x or more | 39 (34.5%) | 0 (0.0%) |
| Total | 113 (100.0%) | 94 (100.0%) |
Real Estate Taxes by Mortgage Status in Green River
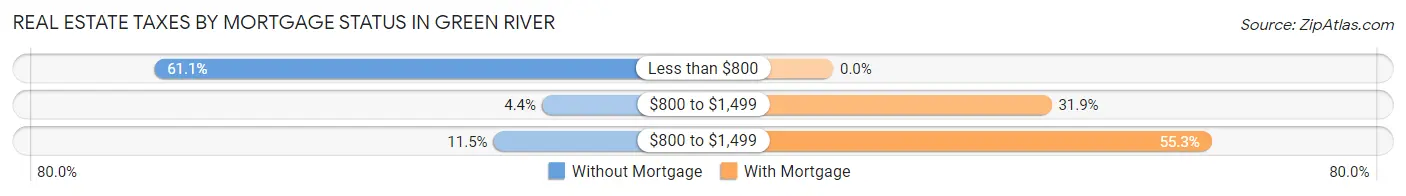
| Property Taxes | Without Mortgage | With Mortgage |
| Less than $800 | 69 (61.1%) | 0 (0.0%) |
| $800 to $1,499 | 5 (4.4%) | 30 (31.9%) |
| $800 to $1,499 | 13 (11.5%) | 52 (55.3%) |
| Total | 113 (100.0%) | 94 (100.0%) |
Health & Disability in Green River
Health Insurance Coverage by Age in Green River
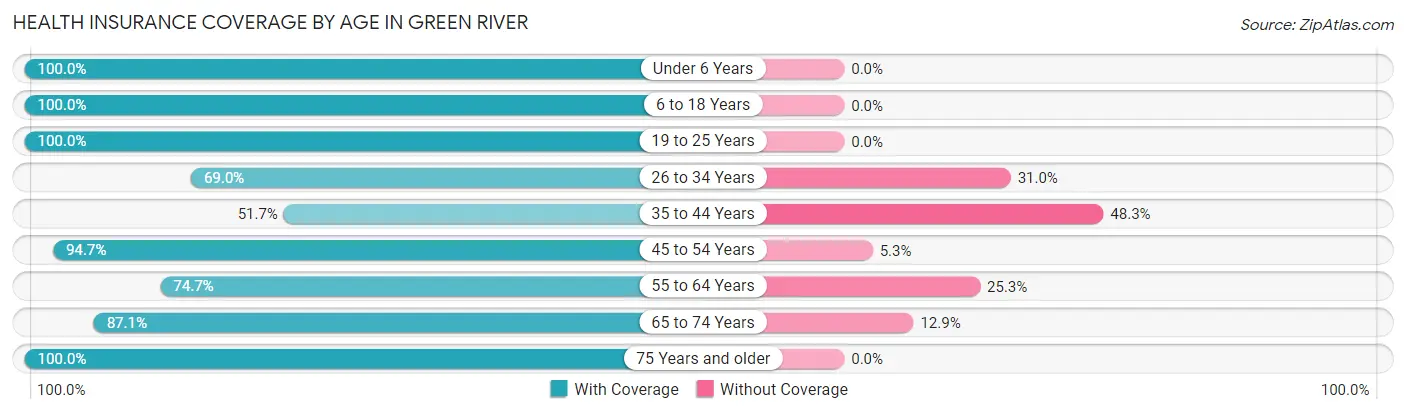
| Age Bracket | With Coverage | Without Coverage |
| Under 6 Years | 85 (100.0%) | 0 (0.0%) |
| 6 to 18 Years | 135 (100.0%) | 0 (0.0%) |
| 19 to 25 Years | 8 (100.0%) | 0 (0.0%) |
| 26 to 34 Years | 60 (69.0%) | 27 (31.0%) |
| 35 to 44 Years | 77 (51.7%) | 72 (48.3%) |
| 45 to 54 Years | 143 (94.7%) | 8 (5.3%) |
| 55 to 64 Years | 56 (74.7%) | 19 (25.3%) |
| 65 to 74 Years | 54 (87.1%) | 8 (12.9%) |
| 75 Years and older | 36 (100.0%) | 0 (0.0%) |
| Total | 654 (83.0%) | 134 (17.0%) |
Health Insurance Coverage by Citizenship Status in Green River
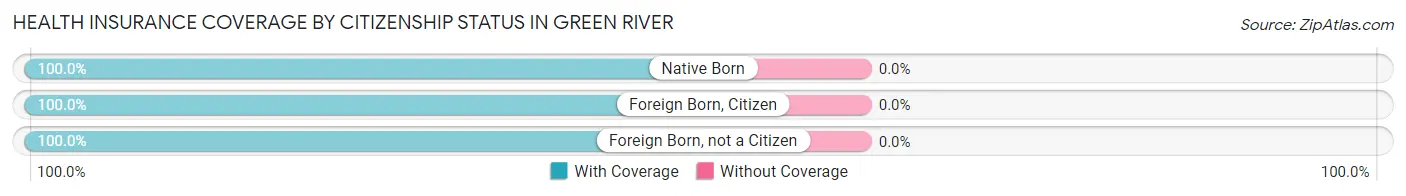
| Citizenship Status | With Coverage | Without Coverage |
| Native Born | 85 (100.0%) | 0 (0.0%) |
| Foreign Born, Citizen | 135 (100.0%) | 0 (0.0%) |
| Foreign Born, not a Citizen | 8 (100.0%) | 0 (0.0%) |
Health Insurance Coverage by Household Income in Green River
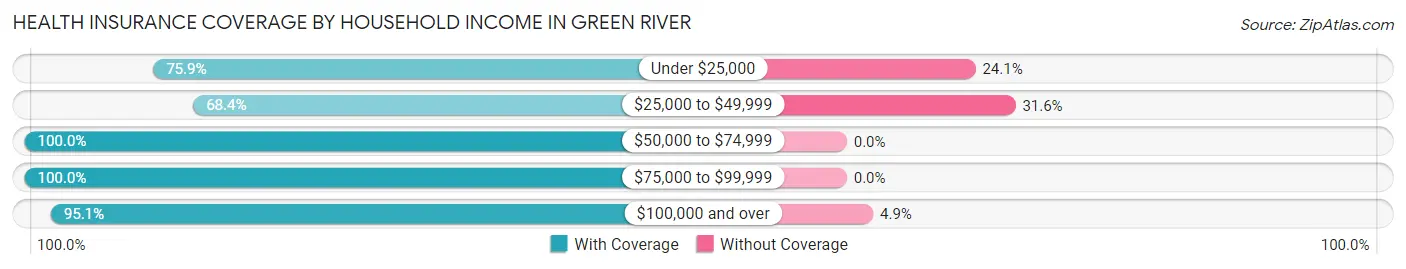
| Household Income | With Coverage | Without Coverage |
| Under $25,000 | 85 (75.9%) | 27 (24.1%) |
| $25,000 to $49,999 | 210 (68.4%) | 97 (31.6%) |
| $50,000 to $74,999 | 51 (100.0%) | 0 (0.0%) |
| $75,000 to $99,999 | 115 (100.0%) | 0 (0.0%) |
| $100,000 and over | 193 (95.1%) | 10 (4.9%) |
Public vs Private Health Insurance Coverage by Age in Green River
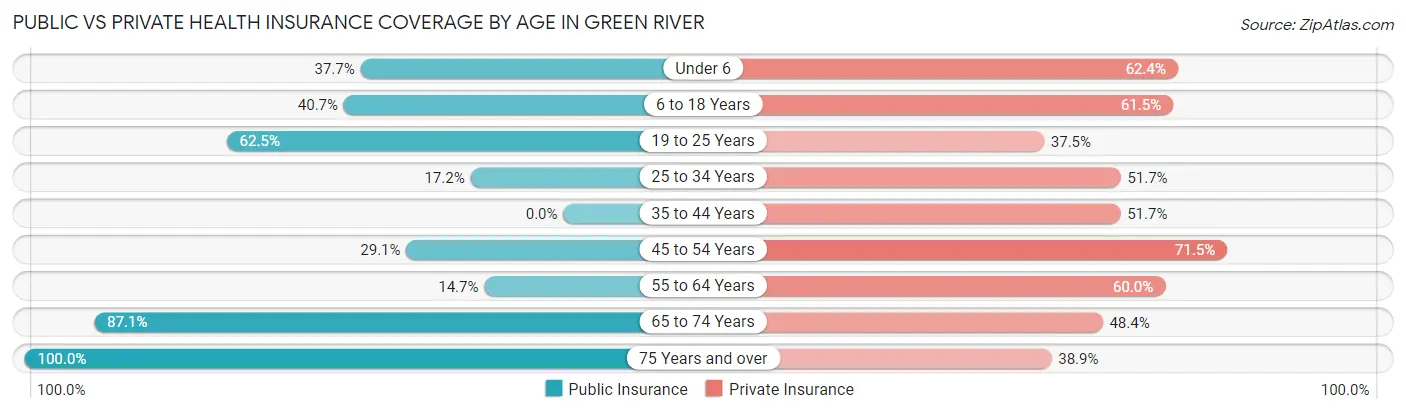
| Age Bracket | Public Insurance | Private Insurance |
| Under 6 | 32 (37.7%) | 53 (62.4%) |
| 6 to 18 Years | 55 (40.7%) | 83 (61.5%) |
| 19 to 25 Years | 5 (62.5%) | 3 (37.5%) |
| 25 to 34 Years | 15 (17.2%) | 45 (51.7%) |
| 35 to 44 Years | 0 (0.0%) | 77 (51.7%) |
| 45 to 54 Years | 44 (29.1%) | 108 (71.5%) |
| 55 to 64 Years | 11 (14.7%) | 45 (60.0%) |
| 65 to 74 Years | 54 (87.1%) | 30 (48.4%) |
| 75 Years and over | 36 (100.0%) | 14 (38.9%) |
| Total | 252 (32.0%) | 458 (58.1%) |
Disability Status by Sex by Age in Green River
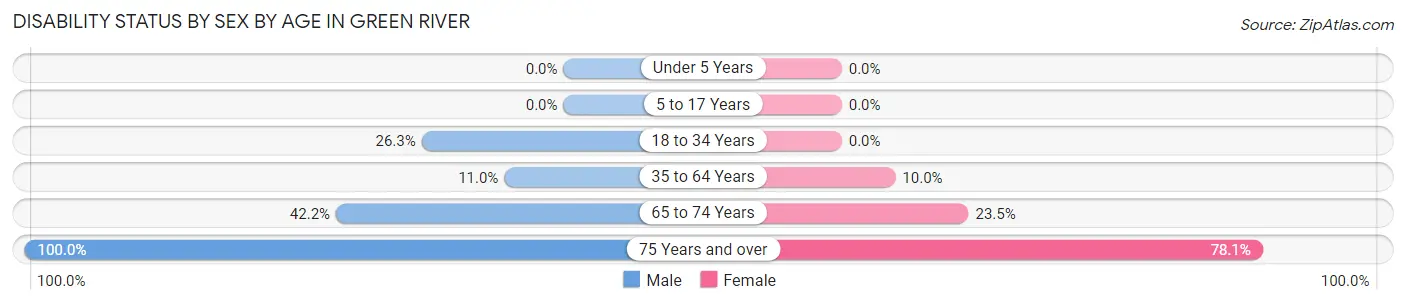
| Age Bracket | Male | Female |
| Under 5 Years | 0 (0.0%) | 0 (0.0%) |
| 5 to 17 Years | 0 (0.0%) | 0 (0.0%) |
| 18 to 34 Years | 15 (26.3%) | 0 (0.0%) |
| 35 to 64 Years | 18 (11.0%) | 21 (10.0%) |
| 65 to 74 Years | 19 (42.2%) | 4 (23.5%) |
| 75 Years and over | 4 (100.0%) | 25 (78.1%) |
Disability Class by Sex by Age in Green River
Disability Class: Hearing Difficulty
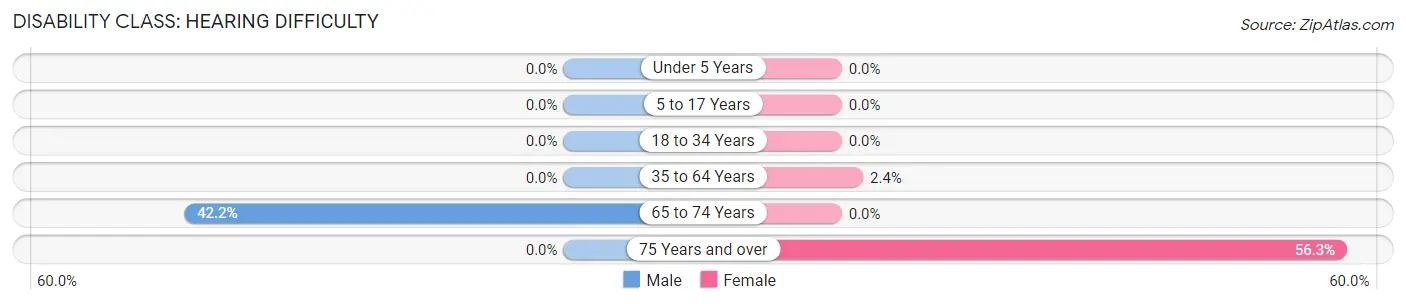
| Age Bracket | Male | Female |
| Under 5 Years | 0 (0.0%) | 0 (0.0%) |
| 5 to 17 Years | 0 (0.0%) | 0 (0.0%) |
| 18 to 34 Years | 0 (0.0%) | 0 (0.0%) |
| 35 to 64 Years | 0 (0.0%) | 5 (2.4%) |
| 65 to 74 Years | 19 (42.2%) | 0 (0.0%) |
| 75 Years and over | 0 (0.0%) | 18 (56.2%) |
Disability Class: Vision Difficulty
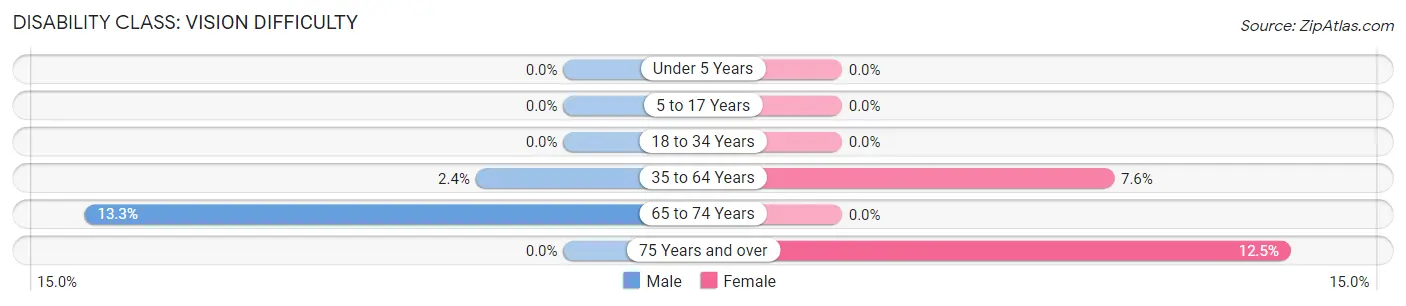
| Age Bracket | Male | Female |
| Under 5 Years | 0 (0.0%) | 0 (0.0%) |
| 5 to 17 Years | 0 (0.0%) | 0 (0.0%) |
| 18 to 34 Years | 0 (0.0%) | 0 (0.0%) |
| 35 to 64 Years | 4 (2.4%) | 16 (7.6%) |
| 65 to 74 Years | 6 (13.3%) | 0 (0.0%) |
| 75 Years and over | 0 (0.0%) | 4 (12.5%) |
Disability Class: Cognitive Difficulty
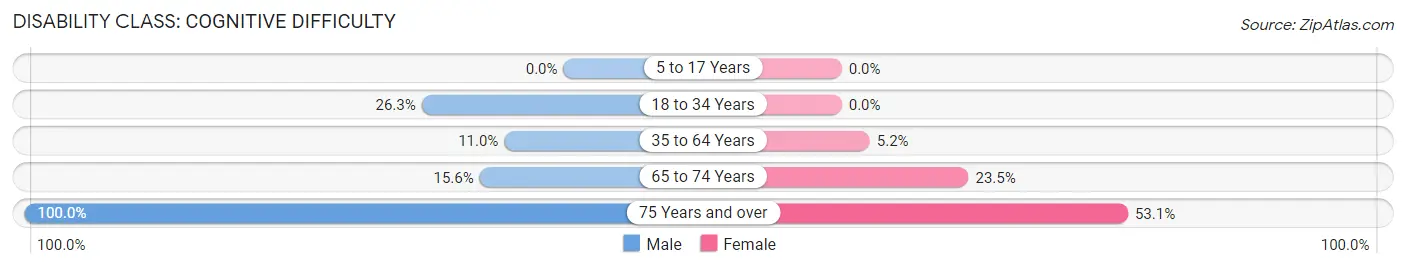
| Age Bracket | Male | Female |
| 5 to 17 Years | 0 (0.0%) | 0 (0.0%) |
| 18 to 34 Years | 15 (26.3%) | 0 (0.0%) |
| 35 to 64 Years | 18 (11.0%) | 11 (5.2%) |
| 65 to 74 Years | 7 (15.6%) | 4 (23.5%) |
| 75 Years and over | 4 (100.0%) | 17 (53.1%) |
Disability Class: Ambulatory Difficulty
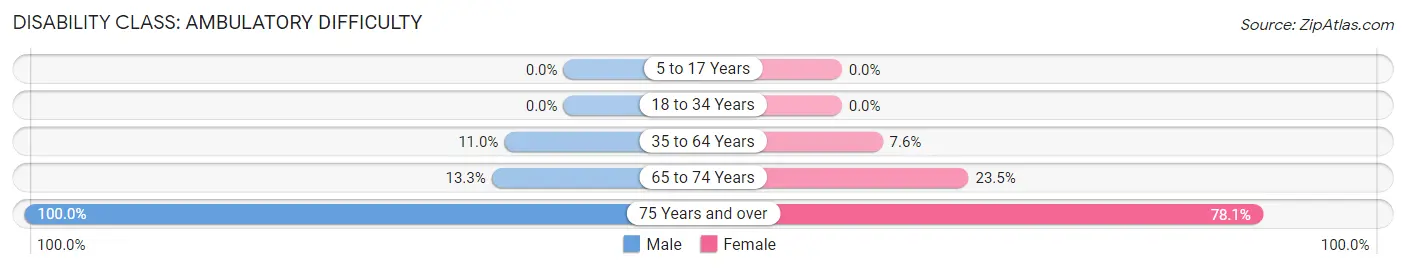
| Age Bracket | Male | Female |
| 5 to 17 Years | 0 (0.0%) | 0 (0.0%) |
| 18 to 34 Years | 0 (0.0%) | 0 (0.0%) |
| 35 to 64 Years | 18 (11.0%) | 16 (7.6%) |
| 65 to 74 Years | 6 (13.3%) | 4 (23.5%) |
| 75 Years and over | 4 (100.0%) | 25 (78.1%) |
Disability Class: Self-Care Difficulty
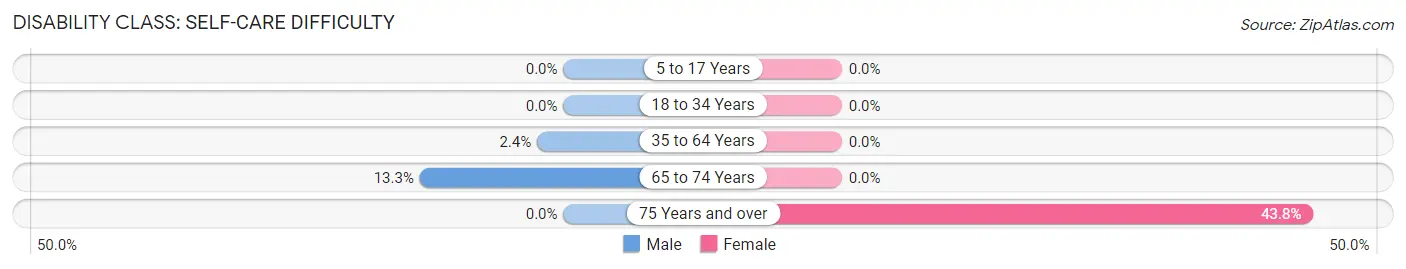
| Age Bracket | Male | Female |
| 5 to 17 Years | 0 (0.0%) | 0 (0.0%) |
| 18 to 34 Years | 0 (0.0%) | 0 (0.0%) |
| 35 to 64 Years | 4 (2.4%) | 0 (0.0%) |
| 65 to 74 Years | 6 (13.3%) | 0 (0.0%) |
| 75 Years and over | 0 (0.0%) | 14 (43.8%) |
Technology Access in Green River
Computing Device Access in Green River
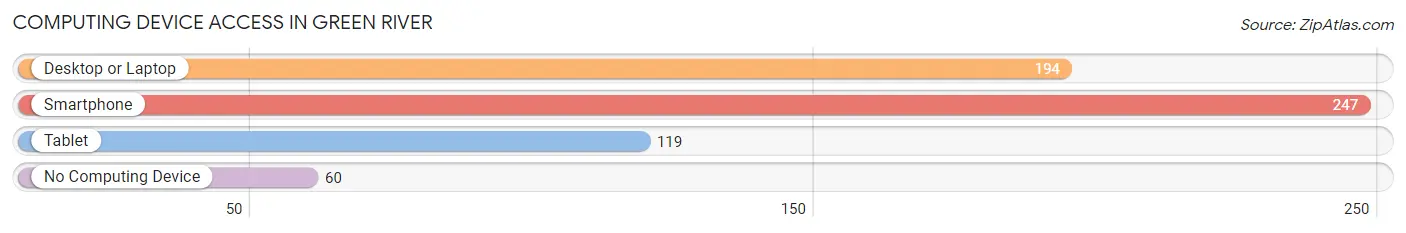
| Device Type | # Households | % Households |
| Desktop or Laptop | 194 | 62.2% |
| Smartphone | 247 | 79.2% |
| Tablet | 119 | 38.1% |
| No Computing Device | 60 | 19.2% |
| Total | 312 | 100.0% |
Internet Access in Green River
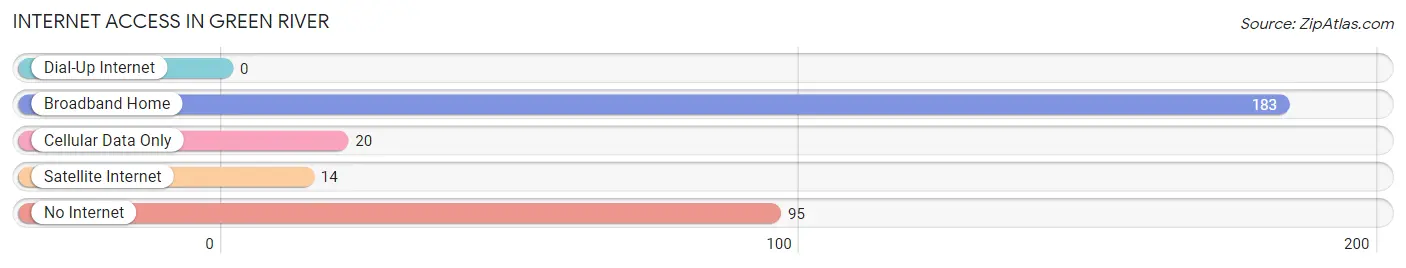
| Internet Type | # Households | % Households |
| Dial-Up Internet | 0 | 0.0% |
| Broadband Home | 183 | 58.7% |
| Cellular Data Only | 20 | 6.4% |
| Satellite Internet | 14 | 4.5% |
| No Internet | 95 | 30.4% |
| Total | 312 | 100.0% |
Green River Summary
Geography
The city of Green River, Utah is located in the southeastern corner of the state, in Emery County. It is situated along the banks of the Green River, which is a tributary of the Colorado River. The city is located at an elevation of 4,400 feet, and is surrounded by the San Rafael Swell, a large geological formation that is part of the Colorado Plateau. The city is located approximately 200 miles south of Salt Lake City, and is accessible via Interstate 70.
History
Green River was first settled in 1878 by a group of Mormon pioneers led by John Wesley Powell. The settlement was originally called “Green River Crossing”, and was established as a way station for travelers heading to California. The settlement was later renamed “Green River City”, and was incorporated in 1883.
The city grew rapidly in the late 19th century, and by the early 20th century, it had become a major hub for the mining and railroad industries. The city was also home to a large number of saloons and gambling halls, which attracted many visitors from nearby towns.
In the 1950s, the city began to decline as the mining and railroad industries began to decline. The city was also affected by the construction of the Glen Canyon Dam, which flooded much of the surrounding area. The city’s population began to decline, and by the 1970s, the city was in a state of economic decline.
In the 1980s, the city began to experience a resurgence, as the tourism industry began to grow. The city is now home to a number of tourist attractions, including the John Wesley Powell River History Museum, the Green River State Park, and the Green River Golf Course.
Economy
Green River’s economy is largely based on tourism and the service industry. The city is home to a number of tourist attractions, including the John Wesley Powell River History Museum, the Green River State Park, and the Green River Golf Course. The city is also home to a number of restaurants, hotels, and other businesses that cater to tourists.
The city is also home to a number of manufacturing and industrial businesses, including a cement plant, a power plant, and a number of oil and gas companies. The city is also home to a number of retail stores, including a Walmart Supercenter.
Demographics
As of the 2010 census, the city of Green River had a population of 945. The racial makeup of the city was 91.2% White, 0.2% African American, 0.7% Native American, 0.2% Asian, 0.1% Pacific Islander, 5.2% from other races, and 2.6% from two or more races. Hispanic or Latino of any race were 8.3% of the population.
The median income for a household in the city was $37,500, and the median income for a family was $41,250. The per capita income for the city was $17,845. About 11.2% of families and 14.2% of the population were below the poverty line, including 18.2% of those under age 18 and 8.3% of those age 65 or over.
Common Questions
What is Per Capita Income in Green River?
Per Capita income in Green River is $26,718.
What is the Median Family Income in Green River?
Median Family Income in Green River is $88,155.
What is the Median Household income in Green River?
Median Household Income in Green River is $43,190.
What is Income or Wage Gap in Green River?
Income or Wage Gap in Green River is 39.7%.
Women in Green River earn 60.3 cents for every dollar earned by a man.
What is Inequality or Gini Index in Green River?
Inequality or Gini Index in Green River is 0.40.
What is the Total Population of Green River?
Total Population of Green River is 788.
What is the Total Male Population of Green River?
Total Male Population of Green River is 362.
What is the Total Female Population of Green River?
Total Female Population of Green River is 426.
What is the Ratio of Males per 100 Females in Green River?
There are 84.98 Males per 100 Females in Green River.
What is the Ratio of Females per 100 Males in Green River?
There are 117.68 Females per 100 Males in Green River.
What is the Median Population Age in Green River?
Median Population Age in Green River is 40.7 Years.
What is the Average Family Size in Green River
Average Family Size in Green River is 3.4 People.
What is the Average Household Size in Green River
Average Household Size in Green River is 2.5 People.
How Large is the Labor Force in Green River?
There are 393 People in the Labor Forcein in Green River.
What is the Percentage of People in the Labor Force in Green River?
65.1% of People are in the Labor Force in Green River.