Riverdale, UT
Riverdale Map
Riverdale Overview
9,313
TOTAL POPULATION
4,582
MALE POPULATION
4,731
FEMALE POPULATION
96.85
MALES / 100 FEMALES
103.25
FEMALES / 100 MALES
30.8
MEDIAN AGE
3.3
AVG FAMILY SIZE
2.8
AVG HOUSEHOLD SIZE
$30,869
PER CAPITA INCOME
$81,548
AVG FAMILY INCOME
$73,642
AVG HOUSEHOLD INCOME
43.4%
WAGE / INCOME GAP [ % ]
56.6¢/ $1
WAGE / INCOME GAP [ $ ]
$11,989
FAMILY INCOME DEFICIT
0.37
INEQUALITY / GINI INDEX
4,686
LABOR FORCE [ PEOPLE ]
67.8%
PERCENT IN LABOR FORCE
4.4%
UNEMPLOYMENT RATE
Riverdale Area Codes
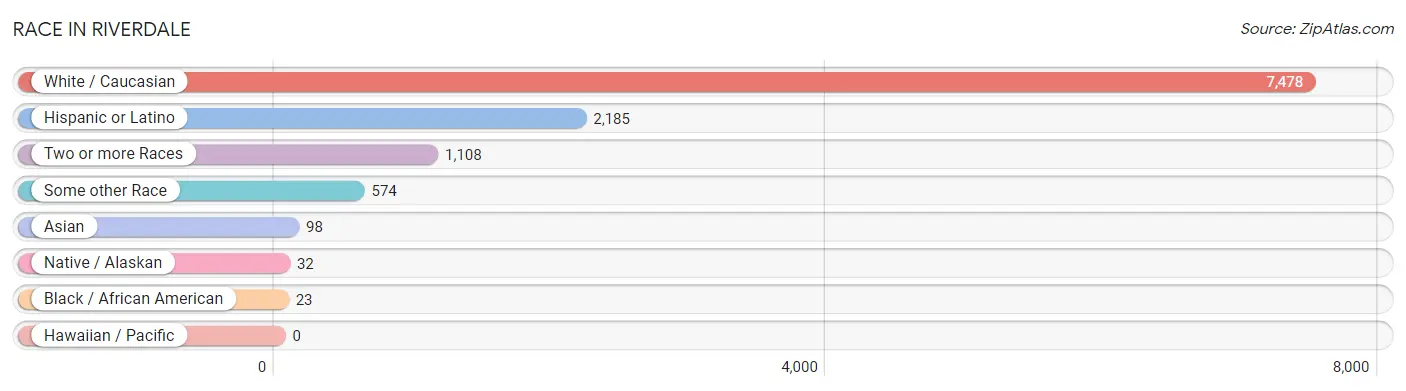
Race in Riverdale
The most populous races in Riverdale are White / Caucasian (7,478 | 80.3%), Hispanic or Latino (2,185 | 23.5%), and Two or more Races (1,108 | 11.9%).
| Race | # Population | % Population |
| Asian | 98 | 1.1% |
| Black / African American | 23 | 0.3% |
| Hawaiian / Pacific | 0 | 0.0% |
| Hispanic or Latino | 2,185 | 23.5% |
| Native / Alaskan | 32 | 0.3% |
| White / Caucasian | 7,478 | 80.3% |
| Two or more Races | 1,108 | 11.9% |
| Some other Race | 574 | 6.2% |
| Total | 9,313 | 100.0% |
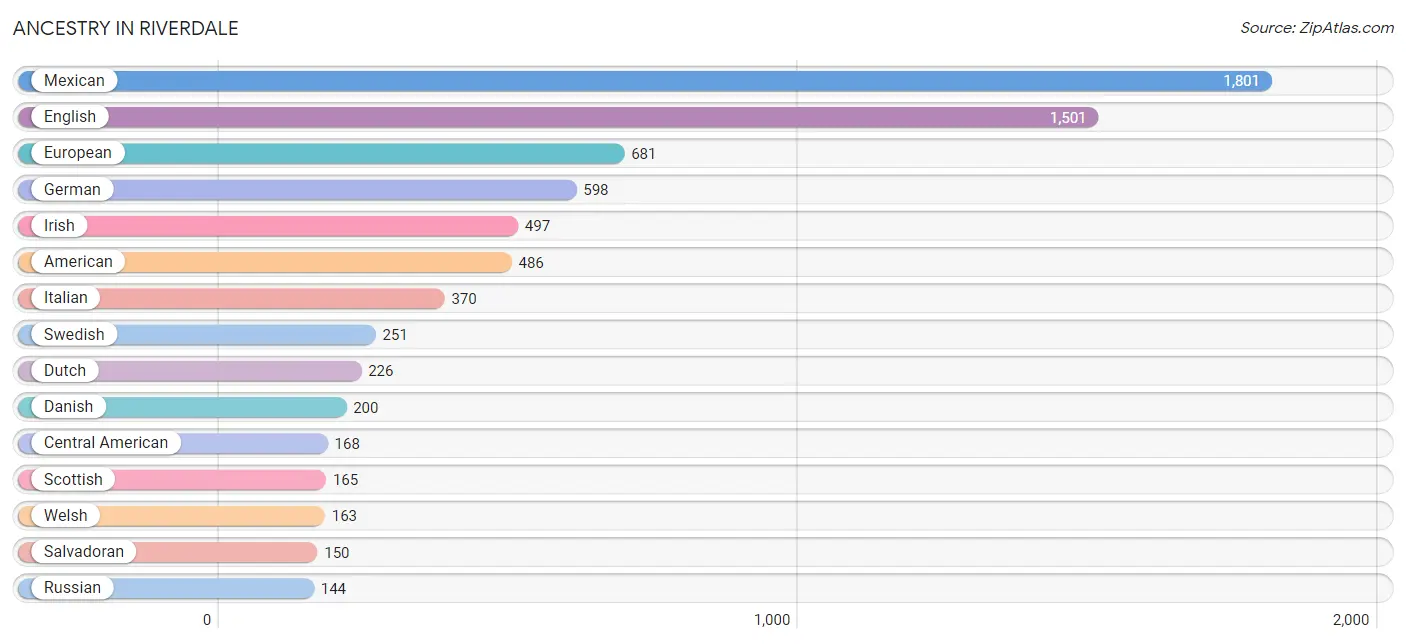
Ancestry in Riverdale
The most populous ancestries reported in Riverdale are Mexican (1,801 | 19.3%), English (1,501 | 16.1%), European (681 | 7.3%), German (598 | 6.4%), and Irish (497 | 5.3%), together accounting for 54.5% of all Riverdale residents.
| Ancestry | # Population | % Population |
| American | 486 | 5.2% |
| Australian | 10 | 0.1% |
| Austrian | 65 | 0.7% |
| Belgian | 47 | 0.5% |
| Bhutanese | 17 | 0.2% |
| Blackfeet | 14 | 0.2% |
| British | 90 | 1.0% |
| Burmese | 5 | 0.1% |
| Central American | 168 | 1.8% |
| Central American Indian | 39 | 0.4% |
| Chilean | 7 | 0.1% |
| Croatian | 14 | 0.2% |
| Danish | 200 | 2.1% |
| Dutch | 226 | 2.4% |
| English | 1,501 | 16.1% |
| European | 681 | 7.3% |
| Filipino | 48 | 0.5% |
| French | 121 | 1.3% |
| French Canadian | 36 | 0.4% |
| German | 598 | 6.4% |
| Greek | 21 | 0.2% |
| Guatemalan | 9 | 0.1% |
| Icelander | 27 | 0.3% |
| Irish | 497 | 5.3% |
| Italian | 370 | 4.0% |
| Lithuanian | 14 | 0.2% |
| Mexican | 1,801 | 19.3% |
| Northern European | 11 | 0.1% |
| Norwegian | 69 | 0.7% |
| Panamanian | 9 | 0.1% |
| Polish | 83 | 0.9% |
| Puerto Rican | 56 | 0.6% |
| Russian | 144 | 1.5% |
| Salvadoran | 150 | 1.6% |
| Samoan | 30 | 0.3% |
| Scandinavian | 36 | 0.4% |
| Scotch-Irish | 81 | 0.9% |
| Scottish | 165 | 1.8% |
| Slavic | 29 | 0.3% |
| South American | 7 | 0.1% |
| Spaniard | 2 | 0.0% |
| Swedish | 251 | 2.7% |
| Swiss | 10 | 0.1% |
| Thai | 47 | 0.5% |
| Tongan | 43 | 0.5% |
| Ukrainian | 2 | 0.0% |
| Ute | 3 | 0.0% |
| Welsh | 163 | 1.8% | View All 48 Rows |
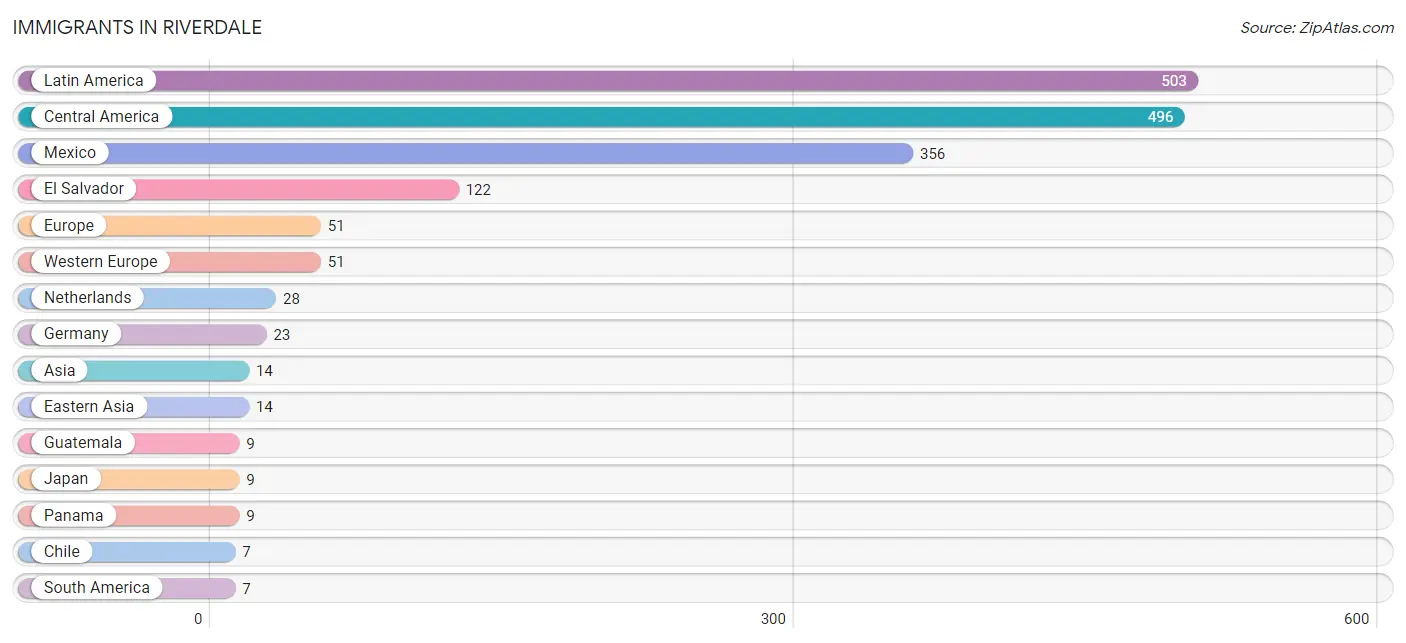
Immigrants in Riverdale
The most numerous immigrant groups reported in Riverdale came from Latin America (503 | 5.4%), Central America (496 | 5.3%), Mexico (356 | 3.8%), El Salvador (122 | 1.3%), and Europe (51 | 0.5%), together accounting for 16.4% of all Riverdale residents.
| Immigration Origin | # Population | % Population |
| Asia | 14 | 0.2% |
| Central America | 496 | 5.3% |
| Chile | 7 | 0.1% |
| Eastern Asia | 14 | 0.2% |
| El Salvador | 122 | 1.3% |
| Europe | 51 | 0.5% |
| Germany | 23 | 0.3% |
| Guatemala | 9 | 0.1% |
| Japan | 9 | 0.1% |
| Korea | 5 | 0.1% |
| Latin America | 503 | 5.4% |
| Mexico | 356 | 3.8% |
| Netherlands | 28 | 0.3% |
| Panama | 9 | 0.1% |
| South America | 7 | 0.1% |
| Western Europe | 51 | 0.5% | View All 16 Rows |
Sex and Age in Riverdale
Sex and Age in Riverdale
The most populous age groups in Riverdale are Under 5 Years (494 | 10.8%) for men and 25 to 29 Years (438 | 9.3%) for women.
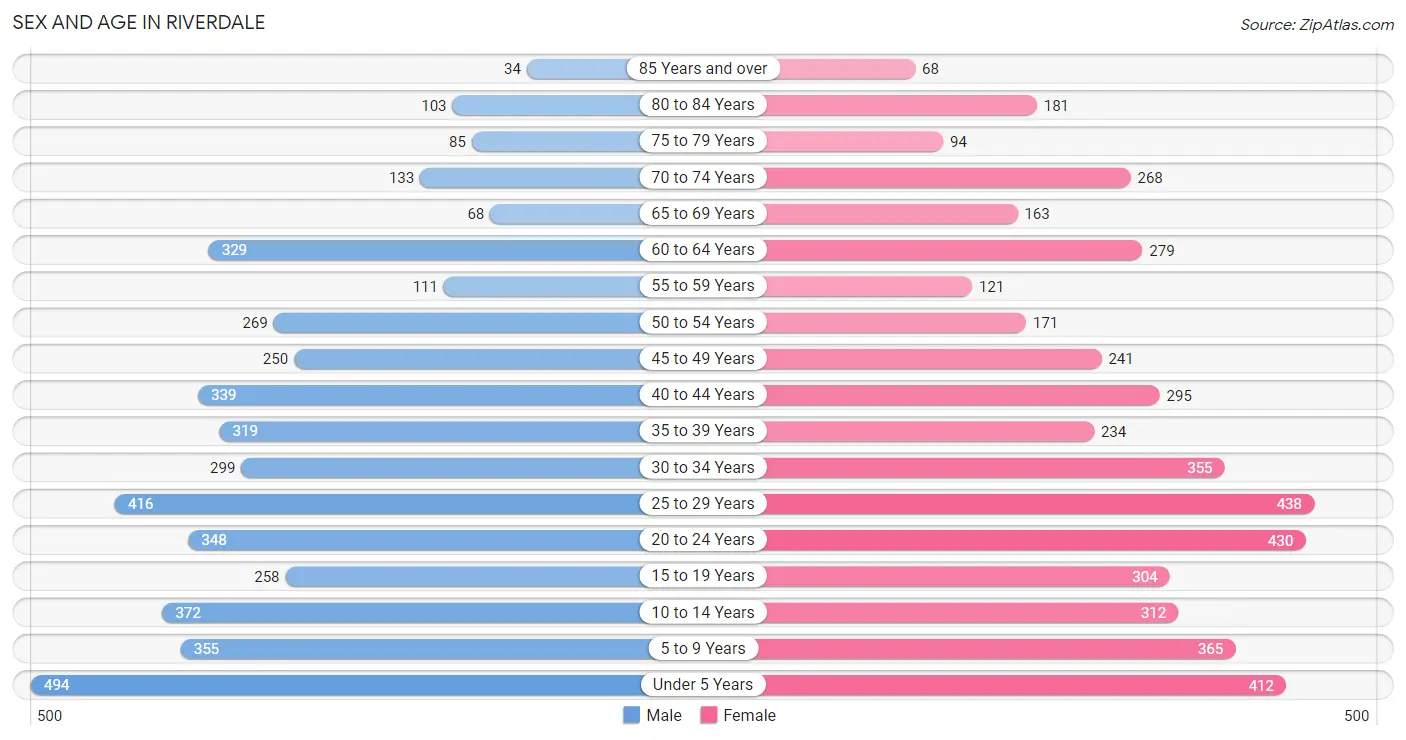
| Age Bracket | Male | Female |
| Under 5 Years | 494 (10.8%) | 412 (8.7%) |
| 5 to 9 Years | 355 (7.7%) | 365 (7.7%) |
| 10 to 14 Years | 372 (8.1%) | 312 (6.6%) |
| 15 to 19 Years | 258 (5.6%) | 304 (6.4%) |
| 20 to 24 Years | 348 (7.6%) | 430 (9.1%) |
| 25 to 29 Years | 416 (9.1%) | 438 (9.3%) |
| 30 to 34 Years | 299 (6.5%) | 355 (7.5%) |
| 35 to 39 Years | 319 (7.0%) | 234 (5.0%) |
| 40 to 44 Years | 339 (7.4%) | 295 (6.2%) |
| 45 to 49 Years | 250 (5.5%) | 241 (5.1%) |
| 50 to 54 Years | 269 (5.9%) | 171 (3.6%) |
| 55 to 59 Years | 111 (2.4%) | 121 (2.6%) |
| 60 to 64 Years | 329 (7.2%) | 279 (5.9%) |
| 65 to 69 Years | 68 (1.5%) | 163 (3.5%) |
| 70 to 74 Years | 133 (2.9%) | 268 (5.7%) |
| 75 to 79 Years | 85 (1.9%) | 94 (2.0%) |
| 80 to 84 Years | 103 (2.2%) | 181 (3.8%) |
| 85 Years and over | 34 (0.7%) | 68 (1.4%) |
| Total | 4,582 (100.0%) | 4,731 (100.0%) |
Families and Households in Riverdale
Median Family Size in Riverdale
The median family size in Riverdale is 3.33 persons per family, with married-couple families (1,877 | 78.3%) accounting for the largest median family size of 3.45 persons per family. On the other hand, single male/father families (155 | 6.5%) represent the smallest median family size with 2.36 persons per family.
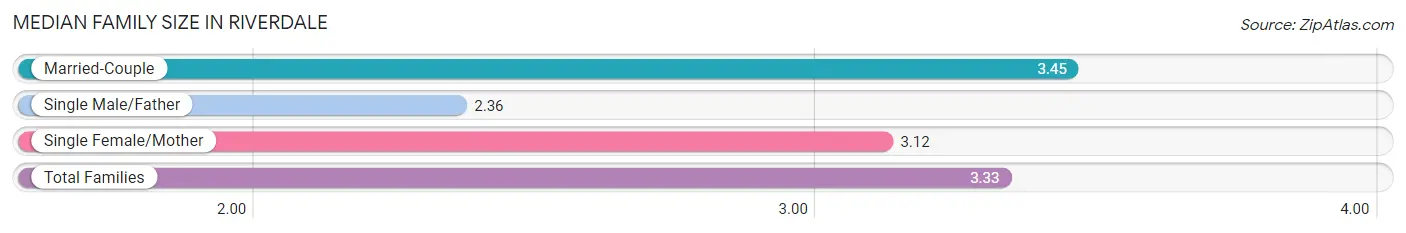
| Family Type | # Families | Family Size |
| Married-Couple | 1,877 (78.3%) | 3.45 |
| Single Male/Father | 155 (6.5%) | 2.36 |
| Single Female/Mother | 364 (15.2%) | 3.12 |
| Total Families | 2,396 (100.0%) | 3.33 |
Median Household Size in Riverdale
The median household size in Riverdale is 2.75 persons per household, with married-couple households (1,877 | 55.5%) accounting for the largest median household size of 3.5 persons per household. non-family households (987 | 29.2%) represent the smallest median household size with 1.16 persons per household.
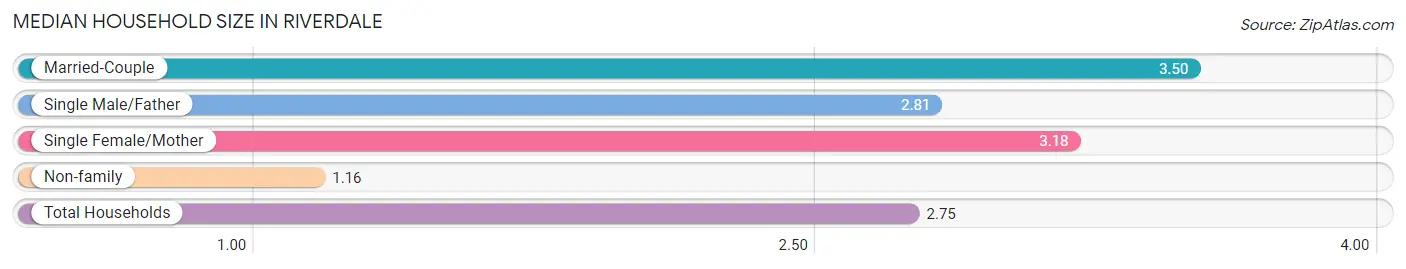
| Household Type | # Households | Household Size |
| Married-Couple | 1,877 (55.5%) | 3.50 |
| Single Male/Father | 155 (4.6%) | 2.81 |
| Single Female/Mother | 364 (10.8%) | 3.18 |
| Non-family | 987 (29.2%) | 1.16 |
| Total Households | 3,383 (100.0%) | 2.75 |
Household Size by Marriage Status in Riverdale
Out of a total of 3,383 households in Riverdale, 2,396 (70.8%) are family households, while 987 (29.2%) are nonfamily households. The most numerous type of family households are 2-person households, comprising 854, and the most common type of nonfamily households are 1-person households, comprising 836.
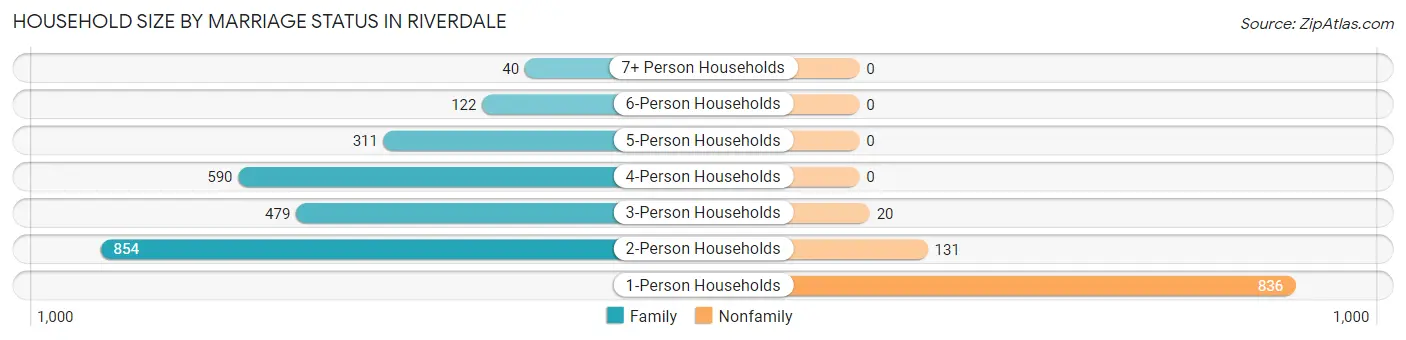
| Household Size | Family Households | Nonfamily Households |
| 1-Person Households | - | 836 (24.7%) |
| 2-Person Households | 854 (25.2%) | 131 (3.9%) |
| 3-Person Households | 479 (14.2%) | 20 (0.6%) |
| 4-Person Households | 590 (17.4%) | 0 (0.0%) |
| 5-Person Households | 311 (9.2%) | 0 (0.0%) |
| 6-Person Households | 122 (3.6%) | 0 (0.0%) |
| 7+ Person Households | 40 (1.2%) | 0 (0.0%) |
| Total | 2,396 (70.8%) | 987 (29.2%) |
Female Fertility in Riverdale
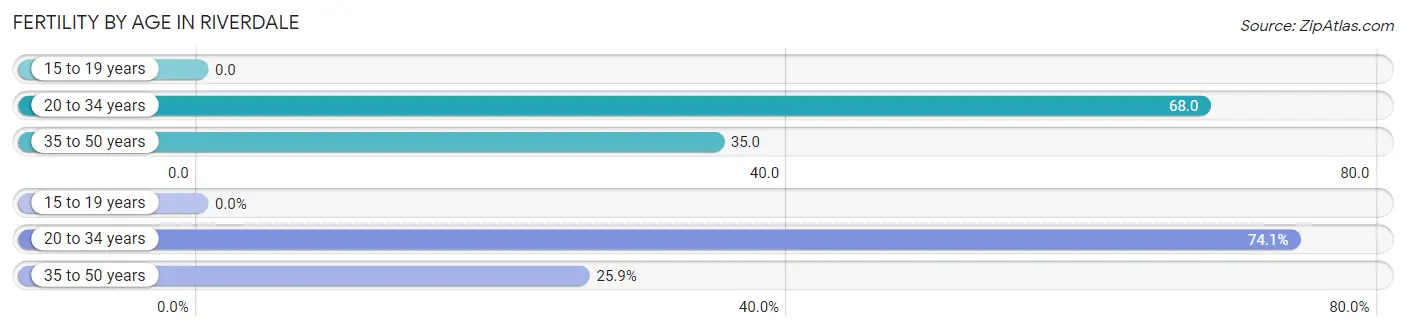
Fertility by Age in Riverdale
Average fertility rate in Riverdale is 47.0 births per 1,000 women. Women in the age bracket of 20 to 34 years have the highest fertility rate with 68.0 births per 1,000 women. Women in the age bracket of 20 to 34 years acount for 74.1% of all women with births.
| Age Bracket | Women with Births | Births / 1,000 Women |
| 15 to 19 years | 0 (0.0%) | 0.0 |
| 20 to 34 years | 83 (74.1%) | 68.0 |
| 35 to 50 years | 29 (25.9%) | 35.0 |
| Total | 112 (100.0%) | 47.0 |
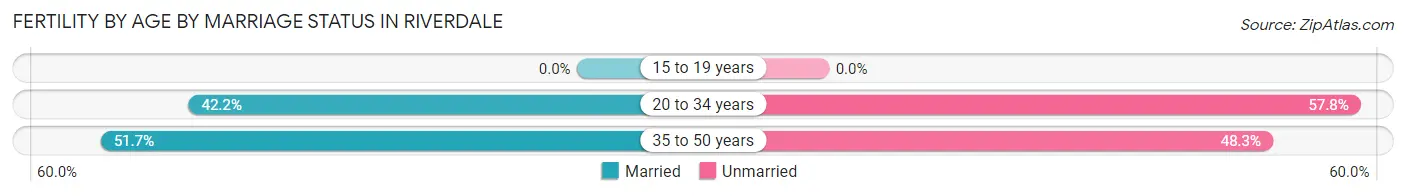
Fertility by Age by Marriage Status in Riverdale
44.6% of women with births (112) in Riverdale are married. The highest percentage of unmarried women with births falls into 20 to 34 years age bracket with 57.8% of them unmarried at the time of birth, while the lowest percentage of unmarried women with births belong to 35 to 50 years age bracket with 48.3% of them unmarried.
| Age Bracket | Married | Unmarried |
| 15 to 19 years | 0 (0.0%) | 0 (0.0%) |
| 20 to 34 years | 35 (42.2%) | 48 (57.8%) |
| 35 to 50 years | 15 (51.7%) | 14 (48.3%) |
| Total | 50 (44.6%) | 62 (55.4%) |
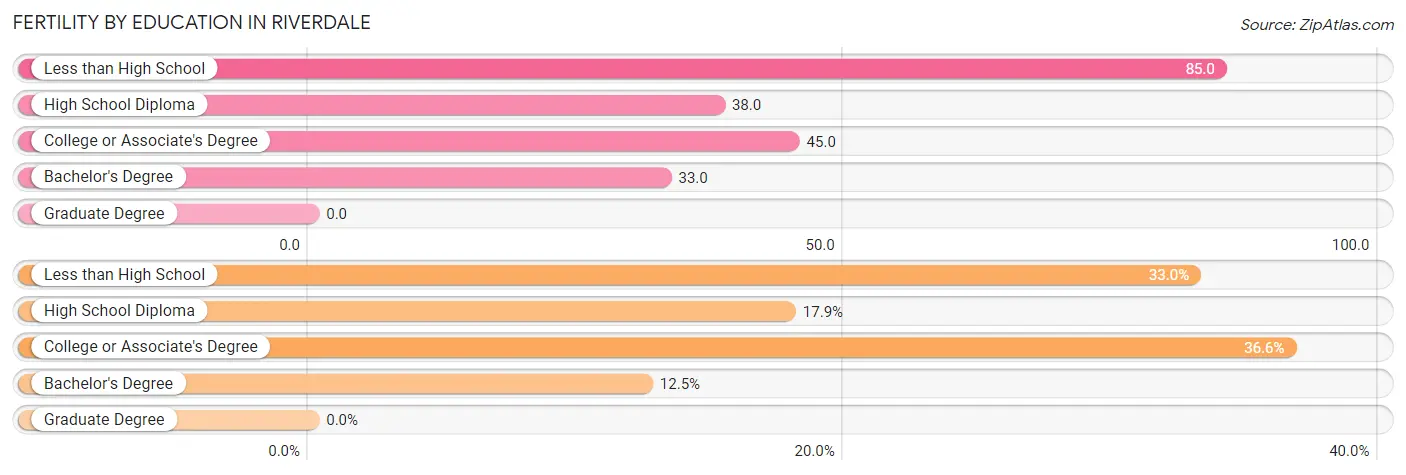
Fertility by Education in Riverdale
| Educational Attainment | Women with Births | Births / 1,000 Women |
| Less than High School | 37 (33.0%) | 85.0 |
| High School Diploma | 20 (17.9%) | 38.0 |
| College or Associate's Degree | 41 (36.6%) | 45.0 |
| Bachelor's Degree | 14 (12.5%) | 33.0 |
| Graduate Degree | 0 (0.0%) | 0.0 |
| Total | 112 (100.0%) | 47.0 |
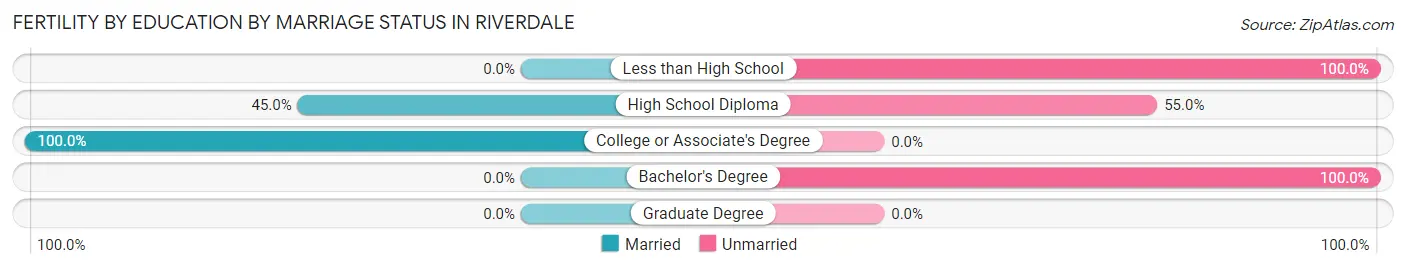
Fertility by Education by Marriage Status in Riverdale
55.4% of women with births in Riverdale are unmarried. Women with the educational attainment of college or associate's degree are most likely to be married with 100.0% of them married at childbirth, while women with the educational attainment of less than high school are least likely to be married with 100.0% of them unmarried at childbirth.
| Educational Attainment | Married | Unmarried |
| Less than High School | 0 (0.0%) | 37 (100.0%) |
| High School Diploma | 9 (45.0%) | 11 (55.0%) |
| College or Associate's Degree | 41 (100.0%) | 0 (0.0%) |
| Bachelor's Degree | 0 (0.0%) | 14 (100.0%) |
| Graduate Degree | 0 (0.0%) | 0 (0.0%) |
| Total | 50 (44.6%) | 62 (55.4%) |
Income in Riverdale
Income Overview in Riverdale
Per Capita Income in Riverdale is $30,869, while median incomes of families and households are $81,548 and $73,642 respectively.
| Characteristic | Number | Measure |
| Per Capita Income | 9,313 | $30,869 |
| Median Family Income | 2,396 | $81,548 |
| Mean Family Income | 2,396 | $91,885 |
| Median Household Income | 3,383 | $73,642 |
| Mean Household Income | 3,383 | $83,570 |
| Income Deficit | 2,396 | $11,989 |
| Wage / Income Gap (%) | 9,313 | 43.38% |
| Wage / Income Gap ($) | 9,313 | 56.62¢ per $1 |
| Gini / Inequality Index | 9,313 | 0.37 |
Earnings by Sex in Riverdale
Average Earnings in Riverdale are $36,503, $46,978 for men and $26,600 for women, a difference of 43.4%.
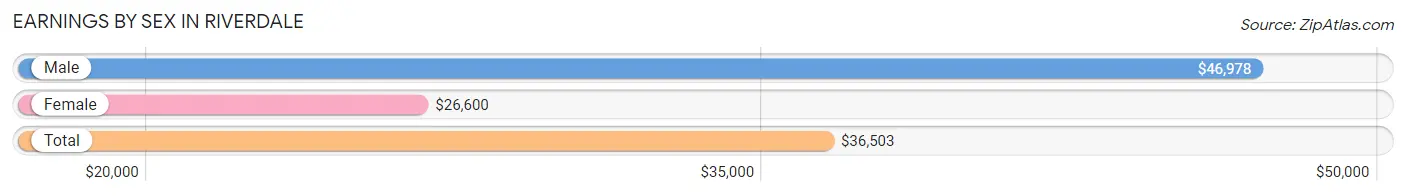
| Sex | Number | Average Earnings |
| Male | 2,545 (53.0%) | $46,978 |
| Female | 2,252 (46.9%) | $26,600 |
| Total | 4,797 (100.0%) | $36,503 |
Earnings by Sex by Income Bracket in Riverdale
The most common earnings brackets in Riverdale are $100,000+ for men (436 | 17.1%) and $30,000 to $34,999 for women (198 | 8.8%).
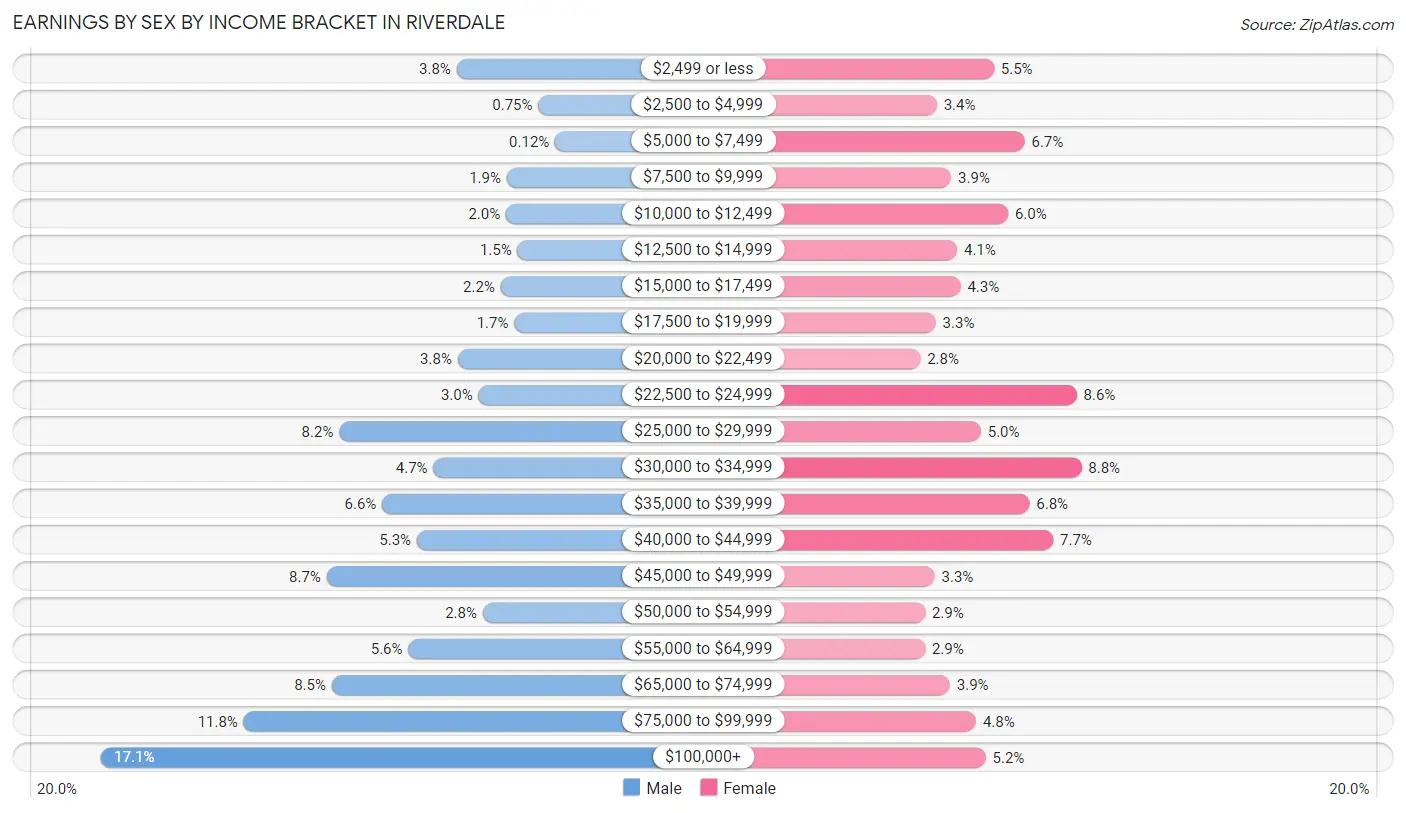
| Income | Male | Female |
| $2,499 or less | 97 (3.8%) | 124 (5.5%) |
| $2,500 to $4,999 | 19 (0.7%) | 76 (3.4%) |
| $5,000 to $7,499 | 3 (0.1%) | 150 (6.7%) |
| $7,500 to $9,999 | 49 (1.9%) | 88 (3.9%) |
| $10,000 to $12,499 | 50 (2.0%) | 136 (6.0%) |
| $12,500 to $14,999 | 39 (1.5%) | 93 (4.1%) |
| $15,000 to $17,499 | 55 (2.2%) | 96 (4.3%) |
| $17,500 to $19,999 | 42 (1.7%) | 75 (3.3%) |
| $20,000 to $22,499 | 96 (3.8%) | 62 (2.8%) |
| $22,500 to $24,999 | 76 (3.0%) | 194 (8.6%) |
| $25,000 to $29,999 | 209 (8.2%) | 113 (5.0%) |
| $30,000 to $34,999 | 119 (4.7%) | 198 (8.8%) |
| $35,000 to $39,999 | 168 (6.6%) | 154 (6.8%) |
| $40,000 to $44,999 | 135 (5.3%) | 174 (7.7%) |
| $45,000 to $49,999 | 221 (8.7%) | 74 (3.3%) |
| $50,000 to $54,999 | 72 (2.8%) | 66 (2.9%) |
| $55,000 to $64,999 | 143 (5.6%) | 66 (2.9%) |
| $65,000 to $74,999 | 216 (8.5%) | 87 (3.9%) |
| $75,000 to $99,999 | 300 (11.8%) | 109 (4.8%) |
| $100,000+ | 436 (17.1%) | 117 (5.2%) |
| Total | 2,545 (100.0%) | 2,252 (100.0%) |
Earnings by Sex by Educational Attainment in Riverdale
Average earnings in Riverdale are $54,295 for men and $33,478 for women, a difference of 38.3%. Men with an educational attainment of graduate degree enjoy the highest average annual earnings of $100,125, while those with less than high school education earn the least with $21,474. Women with an educational attainment of less than high school earn the most with the average annual earnings of $92,804, while those with college or associate's degree education have the smallest earnings of $28,167.
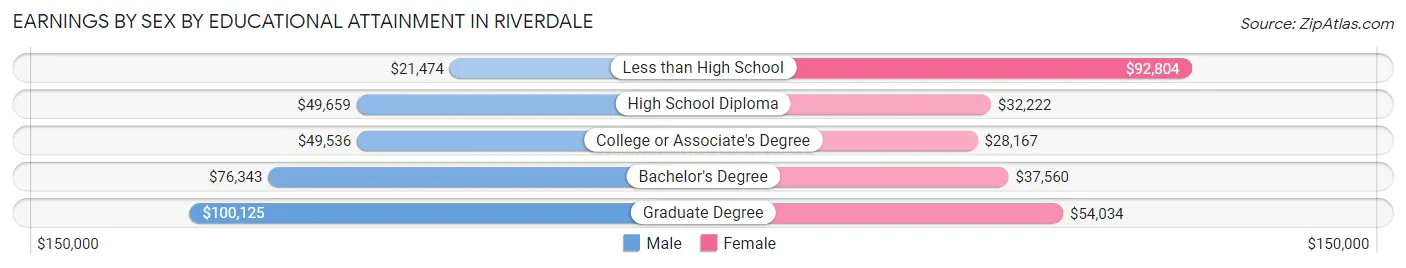
| Educational Attainment | Male Income | Female Income |
| Less than High School | $21,474 | $92,804 |
| High School Diploma | $49,659 | $32,222 |
| College or Associate's Degree | $49,536 | $28,167 |
| Bachelor's Degree | $76,343 | $37,560 |
| Graduate Degree | $100,125 | $54,034 |
| Total | $54,295 | $33,478 |
Family Income in Riverdale
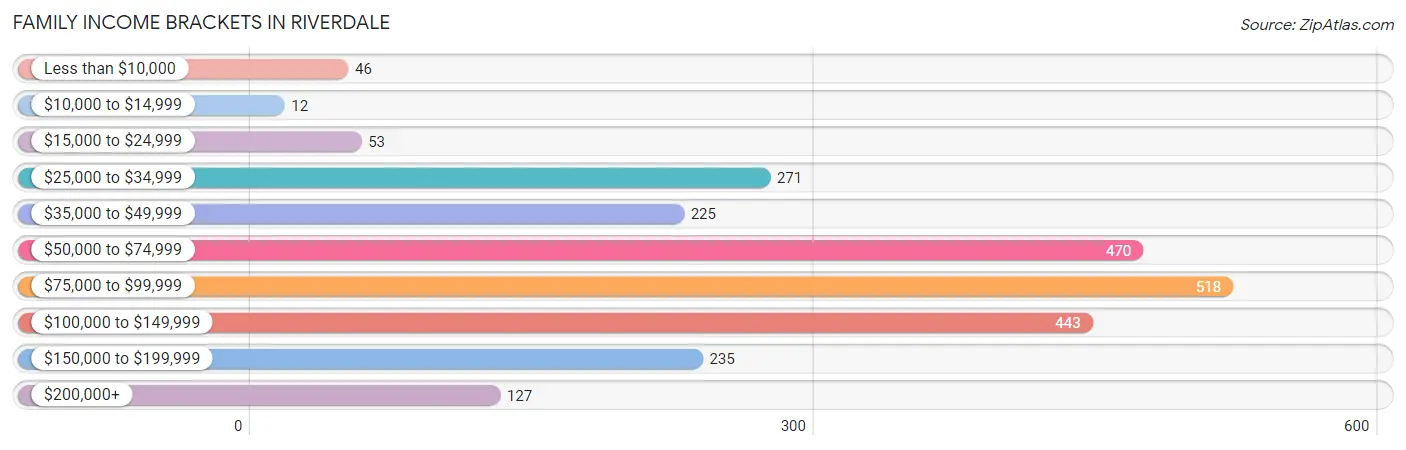
Family Income Brackets in Riverdale
According to the Riverdale family income data, there are 518 families falling into the $75,000 to $99,999 income range, which is the most common income bracket and makes up 21.6% of all families. Conversely, the $10,000 to $14,999 income bracket is the least frequent group with only 12 families (0.5%) belonging to this category.
| Income Bracket | # Families | % Families |
| Less than $10,000 | 46 | 1.9% |
| $10,000 to $14,999 | 12 | 0.5% |
| $15,000 to $24,999 | 53 | 2.2% |
| $25,000 to $34,999 | 271 | 11.3% |
| $35,000 to $49,999 | 225 | 9.4% |
| $50,000 to $74,999 | 470 | 19.6% |
| $75,000 to $99,999 | 518 | 21.6% |
| $100,000 to $149,999 | 443 | 18.5% |
| $150,000 to $199,999 | 235 | 9.8% |
| $200,000+ | 127 | 5.3% |
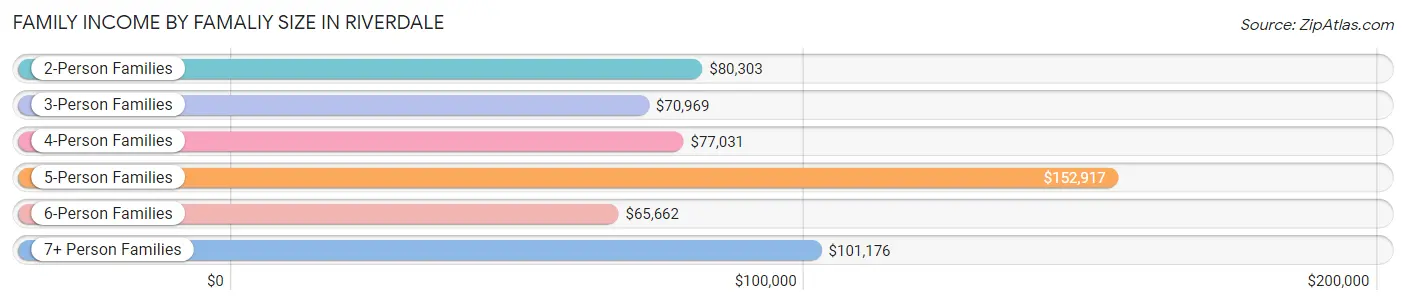
Family Income by Famaliy Size in Riverdale
5-person families (284 | 11.8%) account for the highest median family income in Riverdale with $152,917 per family, while 2-person families (906 | 37.8%) have the highest median income of $40,152 per family member.
| Income Bracket | # Families | Median Income |
| 2-Person Families | 906 (37.8%) | $80,303 |
| 3-Person Families | 499 (20.8%) | $70,969 |
| 4-Person Families | 552 (23.0%) | $77,031 |
| 5-Person Families | 284 (11.8%) | $152,917 |
| 6-Person Families | 115 (4.8%) | $65,662 |
| 7+ Person Families | 40 (1.7%) | $101,176 |
| Total | 2,396 (100.0%) | $81,548 |
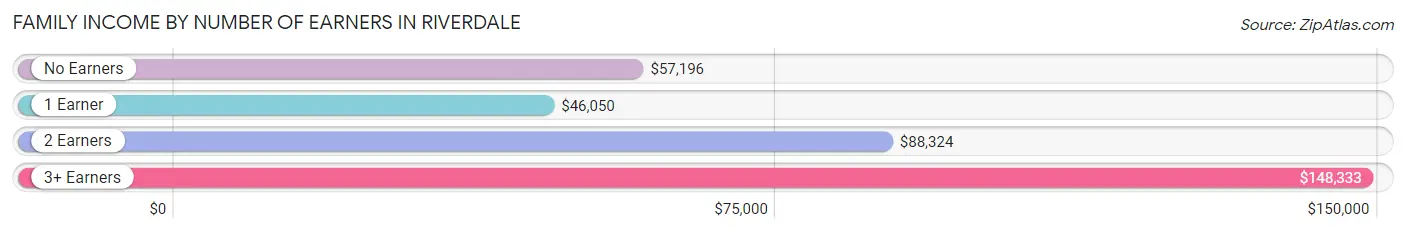
Family Income by Number of Earners in Riverdale
The median family income in Riverdale is $81,548, with families comprising 3+ earners (420) having the highest median family income of $148,333, while families with 1 earner (807) have the lowest median family income of $46,050, accounting for 17.5% and 33.7% of families, respectively.
| Number of Earners | # Families | Median Income |
| No Earners | 336 (14.0%) | $57,196 |
| 1 Earner | 807 (33.7%) | $46,050 |
| 2 Earners | 833 (34.8%) | $88,324 |
| 3+ Earners | 420 (17.5%) | $148,333 |
| Total | 2,396 (100.0%) | $81,548 |
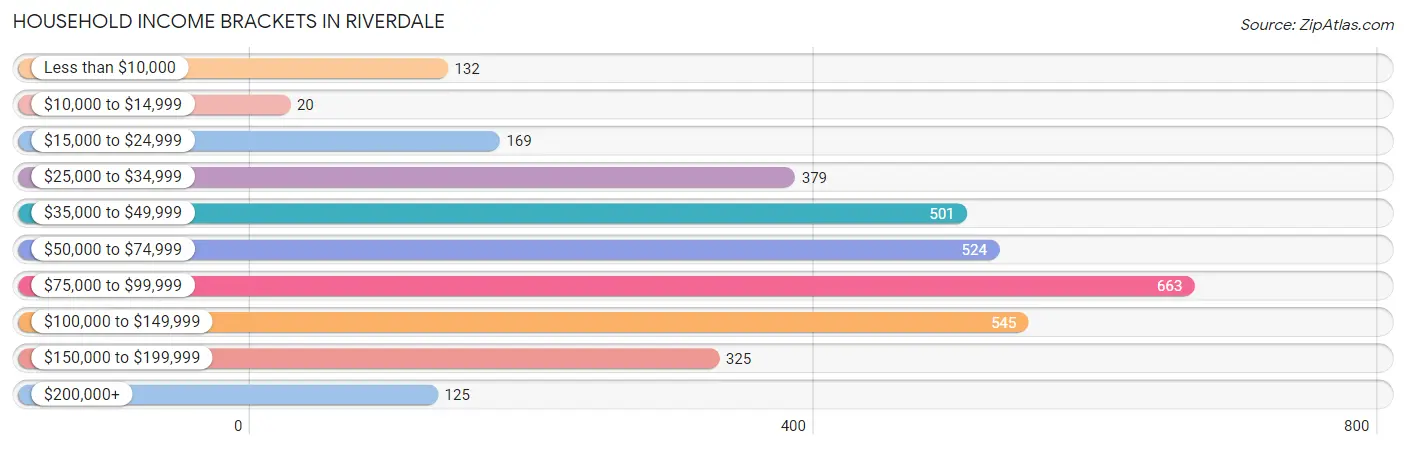
Household Income in Riverdale
Household Income Brackets in Riverdale
With 663 households falling in the category, the $75,000 to $99,999 income range is the most frequent in Riverdale, accounting for 19.6% of all households. In contrast, only 20 households (0.6%) fall into the $10,000 to $14,999 income bracket, making it the least populous group.
| Income Bracket | # Households | % Households |
| Less than $10,000 | 132 | 3.9% |
| $10,000 to $14,999 | 20 | 0.6% |
| $15,000 to $24,999 | 169 | 5.0% |
| $25,000 to $34,999 | 379 | 11.2% |
| $35,000 to $49,999 | 501 | 14.8% |
| $50,000 to $74,999 | 524 | 15.5% |
| $75,000 to $99,999 | 663 | 19.6% |
| $100,000 to $149,999 | 545 | 16.1% |
| $150,000 to $199,999 | 325 | 9.6% |
| $200,000+ | 125 | 3.7% |
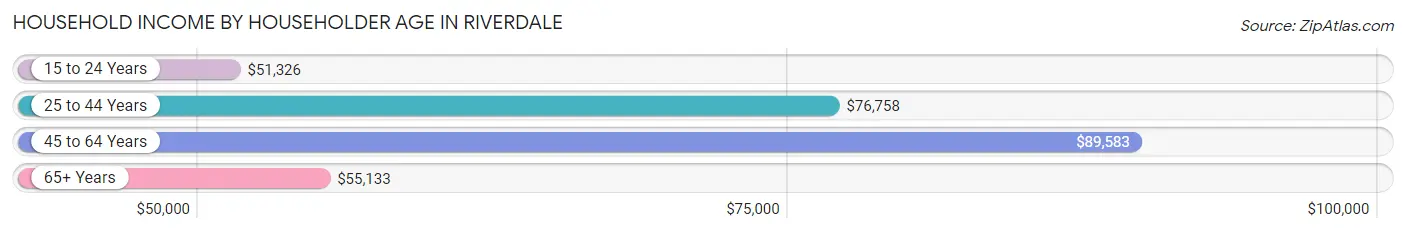
Household Income by Householder Age in Riverdale
The median household income in Riverdale is $73,642, with the highest median household income of $89,583 found in the 45 to 64 years age bracket for the primary householder. A total of 983 households (29.1%) fall into this category. Meanwhile, the 15 to 24 years age bracket for the primary householder has the lowest median household income of $51,326, with 199 households (5.9%) in this group.
| Income Bracket | # Households | Median Income |
| 15 to 24 Years | 199 (5.9%) | $51,326 |
| 25 to 44 Years | 1,367 (40.4%) | $76,758 |
| 45 to 64 Years | 983 (29.1%) | $89,583 |
| 65+ Years | 834 (24.6%) | $55,133 |
| Total | 3,383 (100.0%) | $73,642 |
Poverty in Riverdale
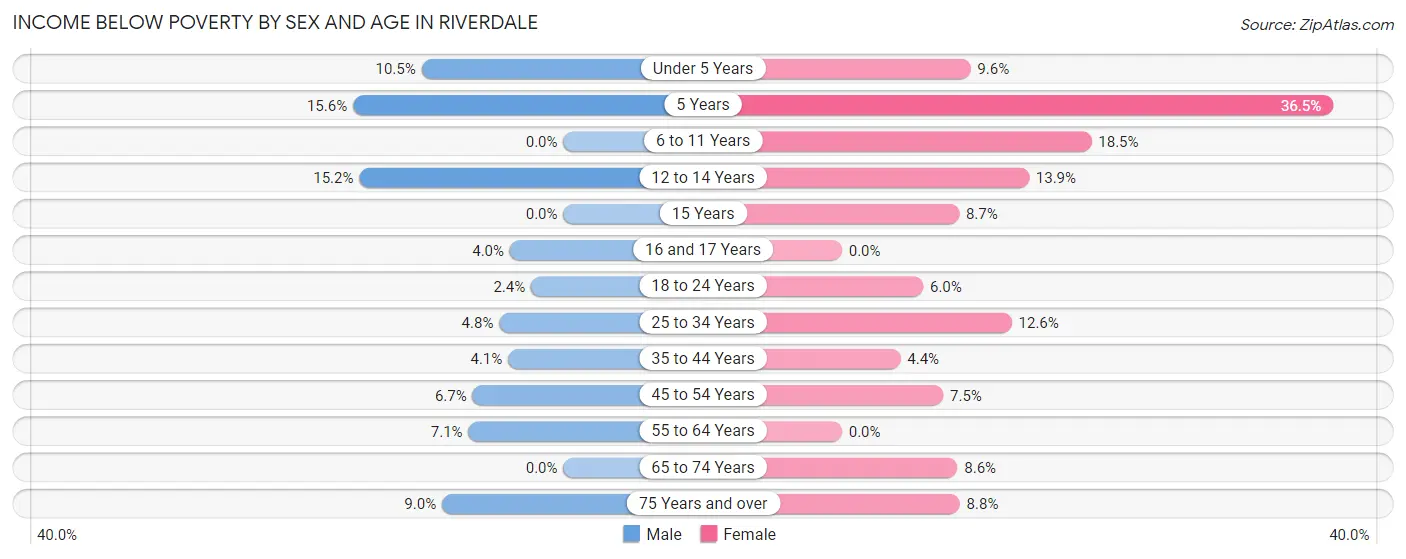
Income Below Poverty by Sex and Age in Riverdale
With 5.7% poverty level for males and 9.2% for females among the residents of Riverdale, 5 year old males and 5 year old females are the most vulnerable to poverty, with 10 males (15.6%) and 31 females (36.5%) in their respective age groups living below the poverty level.
| Age Bracket | Male | Female |
| Under 5 Years | 52 (10.5%) | 38 (9.6%) |
| 5 Years | 10 (15.6%) | 31 (36.5%) |
| 6 to 11 Years | 0 (0.0%) | 83 (18.5%) |
| 12 to 14 Years | 35 (15.1%) | 20 (13.9%) |
| 15 Years | 0 (0.0%) | 6 (8.7%) |
| 16 and 17 Years | 5 (4.0%) | 0 (0.0%) |
| 18 to 24 Years | 11 (2.4%) | 33 (6.0%) |
| 25 to 34 Years | 34 (4.8%) | 100 (12.6%) |
| 35 to 44 Years | 27 (4.1%) | 23 (4.3%) |
| 45 to 54 Years | 35 (6.7%) | 31 (7.5%) |
| 55 to 64 Years | 31 (7.0%) | 0 (0.0%) |
| 65 to 74 Years | 0 (0.0%) | 37 (8.6%) |
| 75 Years and over | 20 (9.0%) | 30 (8.7%) |
| Total | 260 (5.7%) | 432 (9.2%) |
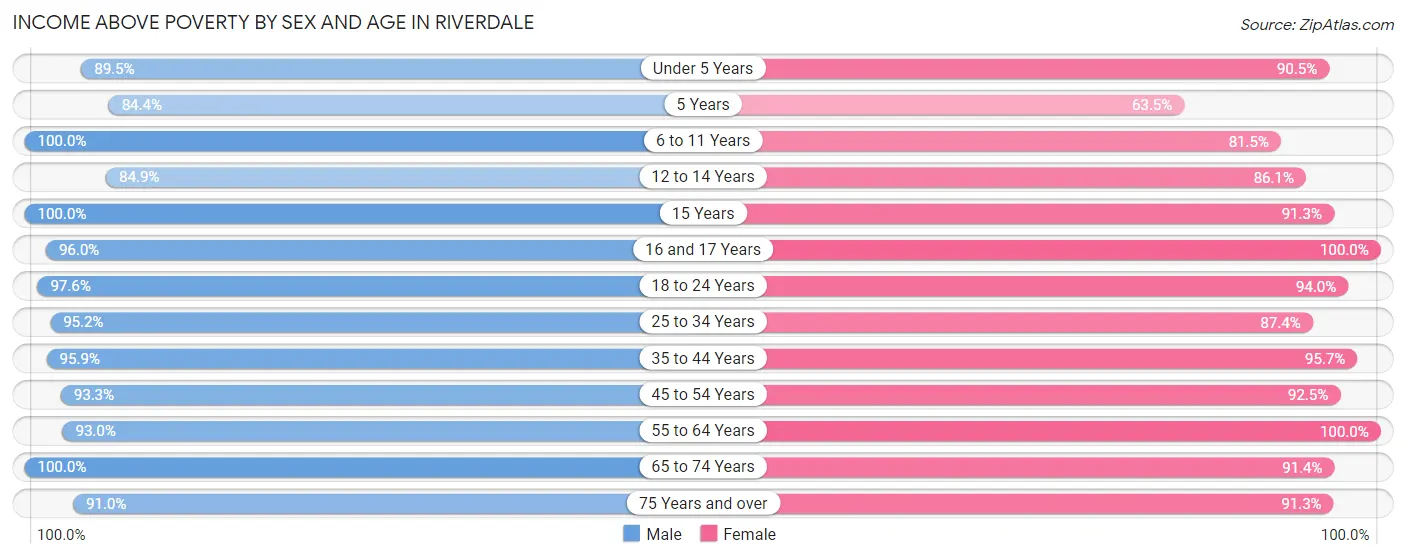
Income Above Poverty by Sex and Age in Riverdale
According to the poverty statistics in Riverdale, males aged 6 to 11 years and females aged 16 and 17 years are the age groups that are most secure financially, with 100.0% of males and 100.0% of females in these age groups living above the poverty line.
| Age Bracket | Male | Female |
| Under 5 Years | 442 (89.5%) | 360 (90.4%) |
| 5 Years | 54 (84.4%) | 54 (63.5%) |
| 6 to 11 Years | 432 (100.0%) | 365 (81.5%) |
| 12 to 14 Years | 196 (84.9%) | 124 (86.1%) |
| 15 Years | 22 (100.0%) | 63 (91.3%) |
| 16 and 17 Years | 121 (96.0%) | 118 (100.0%) |
| 18 to 24 Years | 447 (97.6%) | 514 (94.0%) |
| 25 to 34 Years | 681 (95.2%) | 693 (87.4%) |
| 35 to 44 Years | 631 (95.9%) | 506 (95.7%) |
| 45 to 54 Years | 484 (93.3%) | 381 (92.5%) |
| 55 to 64 Years | 409 (92.9%) | 399 (100.0%) |
| 65 to 74 Years | 200 (100.0%) | 394 (91.4%) |
| 75 Years and over | 202 (91.0%) | 313 (91.2%) |
| Total | 4,321 (94.3%) | 4,284 (90.8%) |
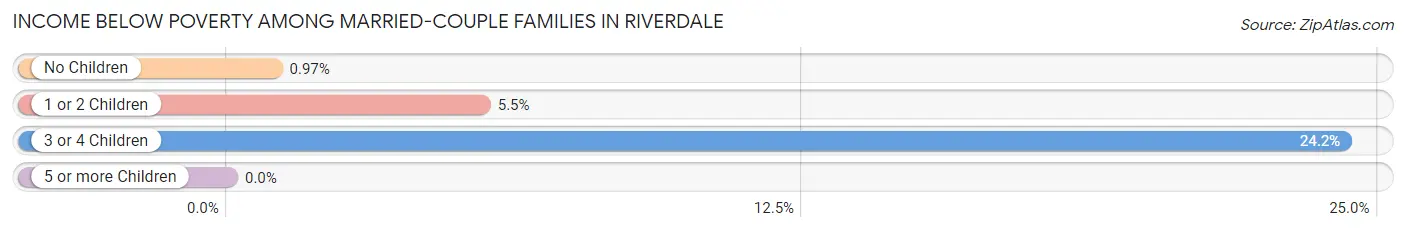
Income Below Poverty Among Married-Couple Families in Riverdale
The poverty statistics for married-couple families in Riverdale show that 5.5% or 103 of the total 1,877 families live below the poverty line. Families with 3 or 4 children have the highest poverty rate of 24.2%, comprising of 56 families. On the other hand, families with 5 or more children have the lowest poverty rate of 0.0%, which includes 0 families.
| Children | Above Poverty | Below Poverty |
| No Children | 917 (99.0%) | 9 (1.0%) |
| 1 or 2 Children | 653 (94.5%) | 38 (5.5%) |
| 3 or 4 Children | 175 (75.8%) | 56 (24.2%) |
| 5 or more Children | 29 (100.0%) | 0 (0.0%) |
| Total | 1,774 (94.5%) | 103 (5.5%) |
Income Below Poverty Among Single-Parent Households in Riverdale
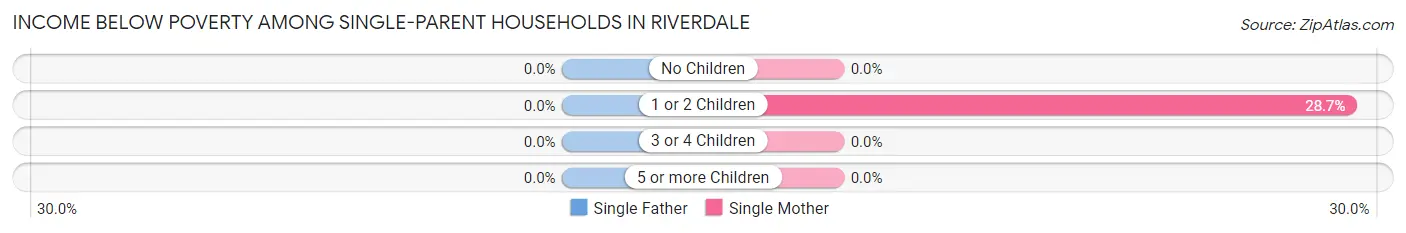
| Children | Single Father | Single Mother |
| No Children | 0 (0.0%) | 0 (0.0%) |
| 1 or 2 Children | 0 (0.0%) | 33 (28.7%) |
| 3 or 4 Children | 0 (0.0%) | 0 (0.0%) |
| 5 or more Children | 0 (0.0%) | 0 (0.0%) |
| Total | 0 (0.0%) | 33 (9.1%) |
Income Below Poverty Among Married-Couple vs Single-Parent Households in Riverdale
The poverty data for Riverdale shows that 103 of the married-couple family households (5.5%) and 33 of the single-parent households (6.4%) are living below the poverty level. Within the married-couple family households, those with 3 or 4 children have the highest poverty rate, with 56 households (24.2%) falling below the poverty line. Among the single-parent households, those with 1 or 2 children have the highest poverty rate, with 33 household (13.6%) living below poverty.
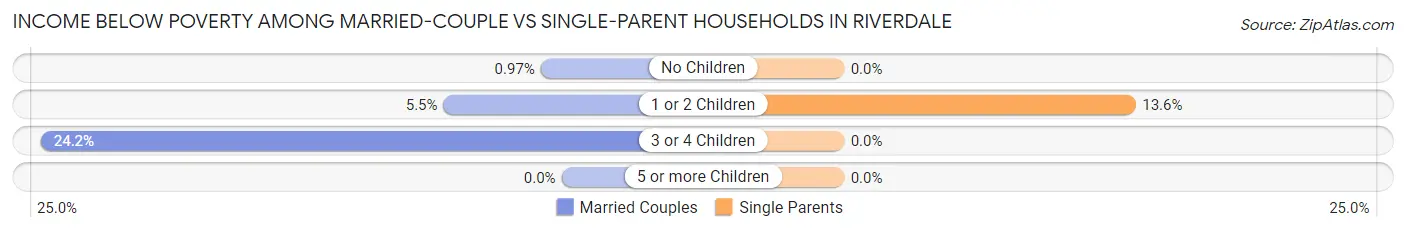
| Children | Married-Couple Families | Single-Parent Households |
| No Children | 9 (1.0%) | 0 (0.0%) |
| 1 or 2 Children | 38 (5.5%) | 33 (13.6%) |
| 3 or 4 Children | 56 (24.2%) | 0 (0.0%) |
| 5 or more Children | 0 (0.0%) | 0 (0.0%) |
| Total | 103 (5.5%) | 33 (6.4%) |
Employment Characteristics in Riverdale
Employment by Class of Employer in Riverdale
Among the 4,438 employed individuals in Riverdale, private company employees (2,980 | 67.1%), federal government employees (494 | 11.1%), and self-employed (incorporated) (253 | 5.7%) make up the most common classes of employment.
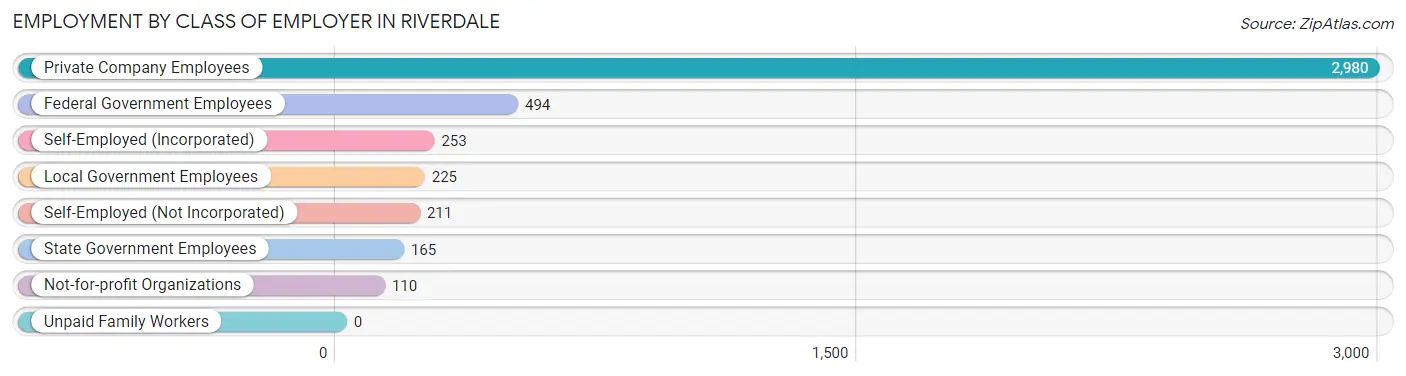
| Employer Class | # Employees | % Employees |
| Private Company Employees | 2,980 | 67.1% |
| Self-Employed (Incorporated) | 253 | 5.7% |
| Self-Employed (Not Incorporated) | 211 | 4.8% |
| Not-for-profit Organizations | 110 | 2.5% |
| Local Government Employees | 225 | 5.1% |
| State Government Employees | 165 | 3.7% |
| Federal Government Employees | 494 | 11.1% |
| Unpaid Family Workers | 0 | 0.0% |
| Total | 4,438 | 100.0% |
Employment Status by Age in Riverdale
According to the labor force statistics for Riverdale, out of the total population over 16 years of age (6,912), 67.8% or 4,686 individuals are in the labor force, with 4.4% or 206 of them unemployed. The age group with the highest labor force participation rate is 55 to 59 years, with 96.6% or 224 individuals in the labor force. Within the labor force, the 16 to 19 years age range has the highest percentage of unemployed individuals, with 12.8% or 30 of them being unemployed.
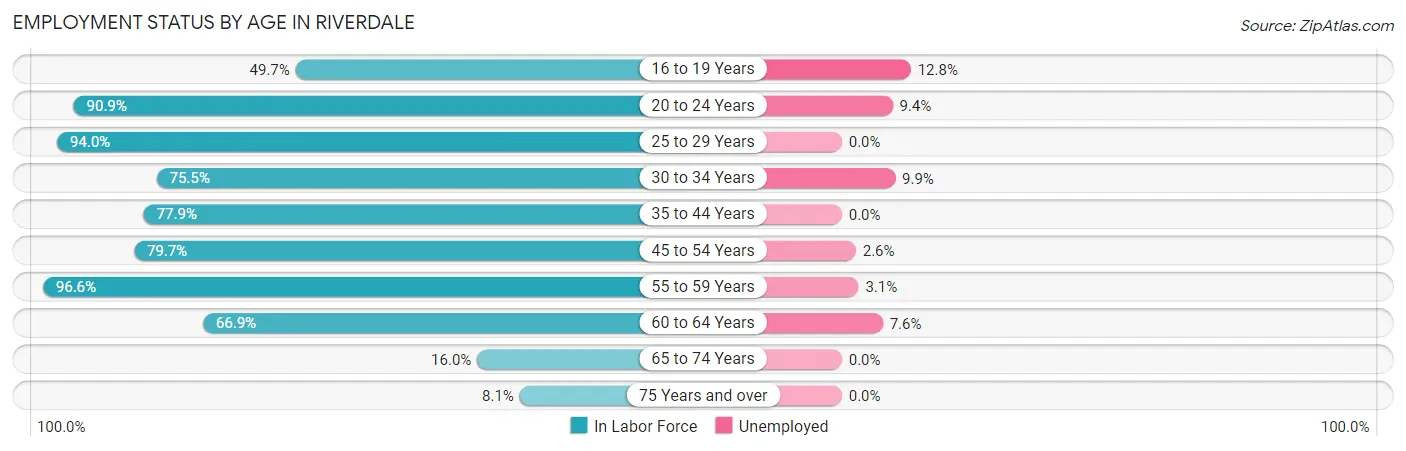
| Age Bracket | In Labor Force | Unemployed |
| 16 to 19 Years | 234 (49.7%) | 30 (12.8%) |
| 20 to 24 Years | 707 (90.9%) | 66 (9.4%) |
| 25 to 29 Years | 803 (94.0%) | 0 (0.0%) |
| 30 to 34 Years | 494 (75.5%) | 49 (9.9%) |
| 35 to 44 Years | 925 (77.9%) | 0 (0.0%) |
| 45 to 54 Years | 742 (79.7%) | 19 (2.6%) |
| 55 to 59 Years | 224 (96.6%) | 7 (3.1%) |
| 60 to 64 Years | 407 (66.9%) | 31 (7.6%) |
| 65 to 74 Years | 101 (16.0%) | 0 (0.0%) |
| 75 Years and over | 46 (8.1%) | 0 (0.0%) |
| Total | 4,686 (67.8%) | 206 (4.4%) |
Employment Status by Educational Attainment in Riverdale
According to labor force statistics for Riverdale, 80.5% of individuals (3,595) out of the total population between 25 and 64 years of age (4,466) are in the labor force, with 3.0% or 108 of them being unemployed. The group with the highest labor force participation rate are those with the educational attainment of high school diploma, with 82.8% or 1,169 individuals in the labor force. Within the labor force, individuals with less than high school education have the highest percentage of unemployment, with 22.8% or 49 of them being unemployed.
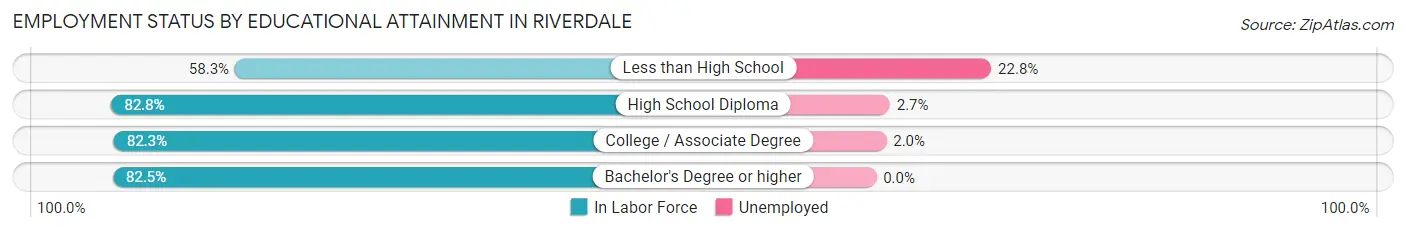
| Educational Attainment | In Labor Force | Unemployed |
| Less than High School | 215 (58.3%) | 84 (22.8%) |
| High School Diploma | 1,169 (82.8%) | 38 (2.7%) |
| College / Associate Degree | 1,369 (82.3%) | 33 (2.0%) |
| Bachelor's Degree or higher | 842 (82.5%) | 0 (0.0%) |
| Total | 3,595 (80.5%) | 134 (3.0%) |
Employment Occupations by Sex in Riverdale
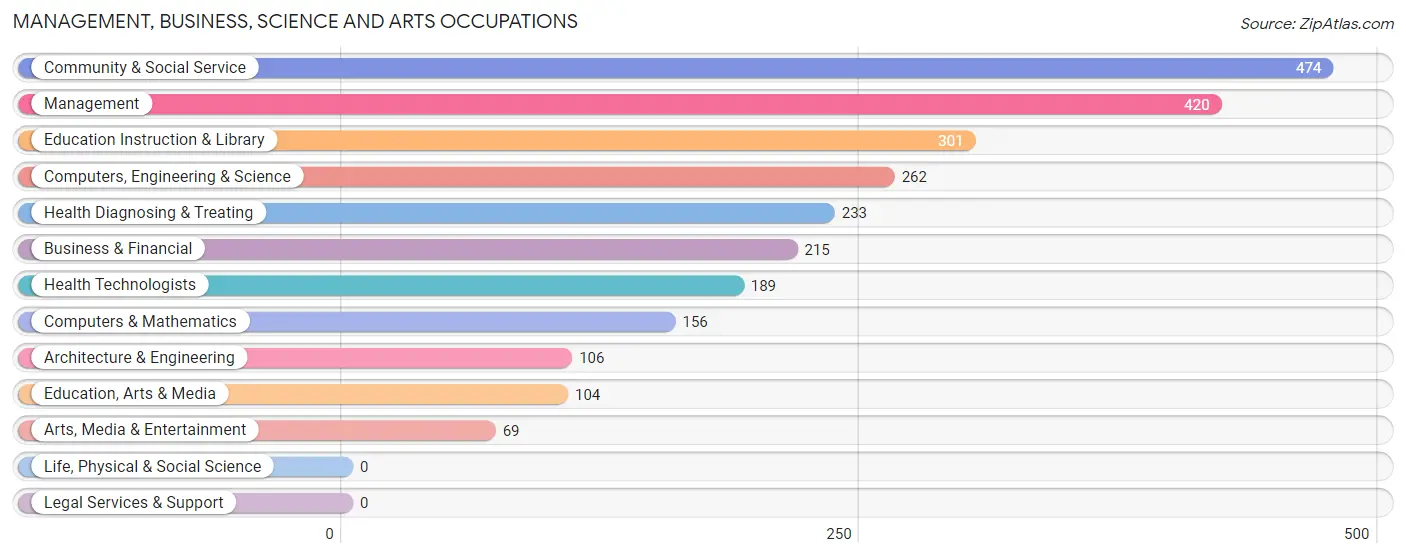
Management, Business, Science and Arts Occupations
The most common Management, Business, Science and Arts occupations in Riverdale are Community & Social Service (474 | 10.8%), Management (420 | 9.6%), Education Instruction & Library (301 | 6.8%), Computers, Engineering & Science (262 | 6.0%), and Health Diagnosing & Treating (233 | 5.3%).
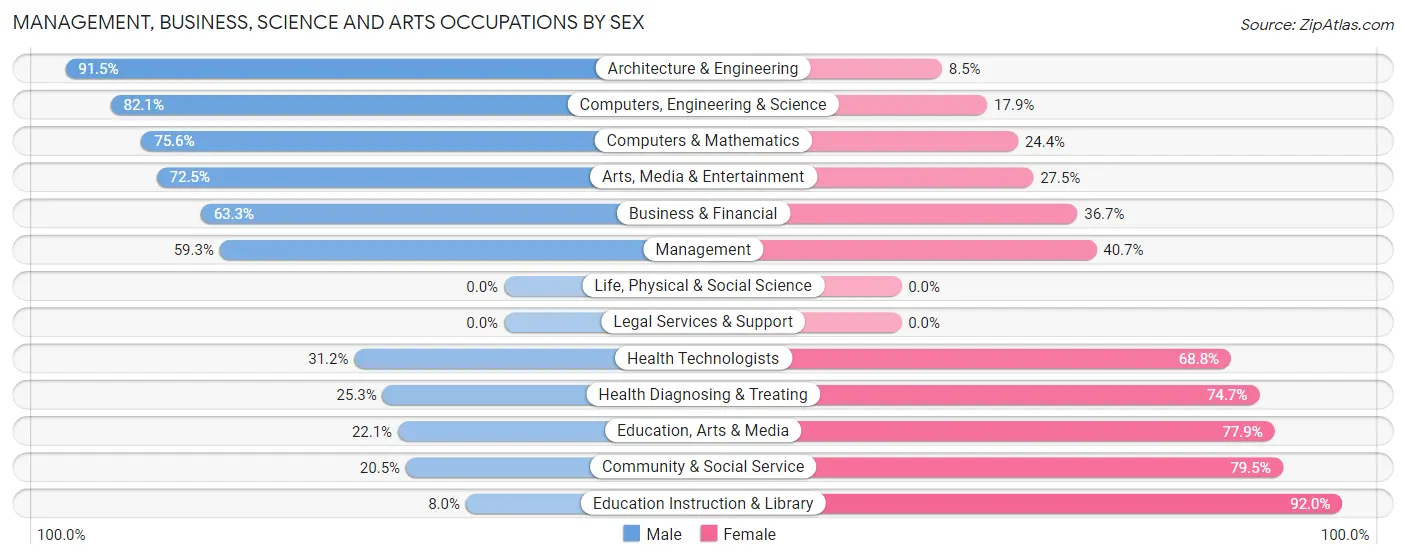
Management, Business, Science and Arts Occupations by Sex
Within the Management, Business, Science and Arts occupations in Riverdale, the most male-oriented occupations are Architecture & Engineering (91.5%), Computers, Engineering & Science (82.1%), and Computers & Mathematics (75.6%), while the most female-oriented occupations are Education Instruction & Library (92.0%), Community & Social Service (79.5%), and Education, Arts & Media (77.9%).
| Occupation | Male | Female |
| Management | 249 (59.3%) | 171 (40.7%) |
| Business & Financial | 136 (63.3%) | 79 (36.7%) |
| Computers, Engineering & Science | 215 (82.1%) | 47 (17.9%) |
| Computers & Mathematics | 118 (75.6%) | 38 (24.4%) |
| Architecture & Engineering | 97 (91.5%) | 9 (8.5%) |
| Life, Physical & Social Science | 0 (0.0%) | 0 (0.0%) |
| Community & Social Service | 97 (20.5%) | 377 (79.5%) |
| Education, Arts & Media | 23 (22.1%) | 81 (77.9%) |
| Legal Services & Support | 0 (0.0%) | 0 (0.0%) |
| Education Instruction & Library | 24 (8.0%) | 277 (92.0%) |
| Arts, Media & Entertainment | 50 (72.5%) | 19 (27.5%) |
| Health Diagnosing & Treating | 59 (25.3%) | 174 (74.7%) |
| Health Technologists | 59 (31.2%) | 130 (68.8%) |
| Total (Category) | 756 (47.1%) | 848 (52.9%) |
| Total (Overall) | 2,372 (53.9%) | 2,026 (46.1%) |
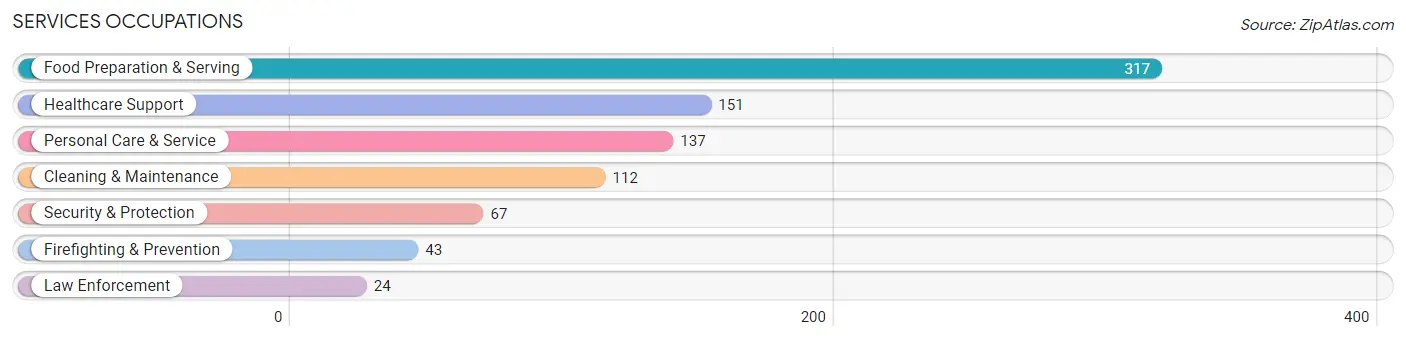
Services Occupations
The most common Services occupations in Riverdale are Food Preparation & Serving (317 | 7.2%), Healthcare Support (151 | 3.4%), Personal Care & Service (137 | 3.1%), Cleaning & Maintenance (112 | 2.5%), and Security & Protection (67 | 1.5%).
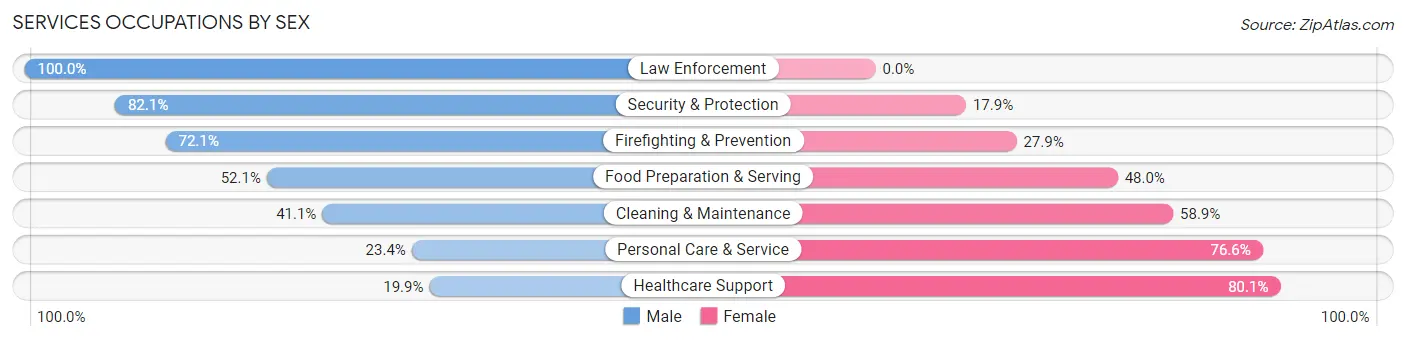
Services Occupations by Sex
Within the Services occupations in Riverdale, the most male-oriented occupations are Law Enforcement (100.0%), Security & Protection (82.1%), and Firefighting & Prevention (72.1%), while the most female-oriented occupations are Healthcare Support (80.1%), Personal Care & Service (76.6%), and Cleaning & Maintenance (58.9%).
| Occupation | Male | Female |
| Healthcare Support | 30 (19.9%) | 121 (80.1%) |
| Security & Protection | 55 (82.1%) | 12 (17.9%) |
| Firefighting & Prevention | 31 (72.1%) | 12 (27.9%) |
| Law Enforcement | 24 (100.0%) | 0 (0.0%) |
| Food Preparation & Serving | 165 (52.0%) | 152 (47.9%) |
| Cleaning & Maintenance | 46 (41.1%) | 66 (58.9%) |
| Personal Care & Service | 32 (23.4%) | 105 (76.6%) |
| Total (Category) | 328 (41.8%) | 456 (58.2%) |
| Total (Overall) | 2,372 (53.9%) | 2,026 (46.1%) |
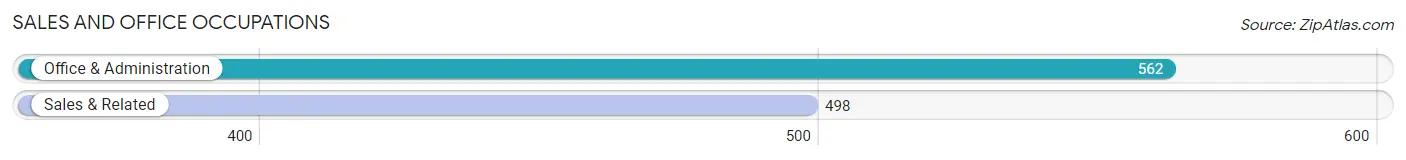
Sales and Office Occupations
The most common Sales and Office occupations in Riverdale are Office & Administration (562 | 12.8%), and Sales & Related (498 | 11.3%).
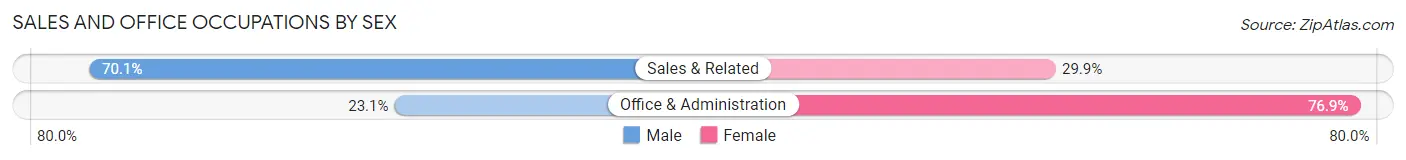
Sales and Office Occupations by Sex
| Occupation | Male | Female |
| Sales & Related | 349 (70.1%) | 149 (29.9%) |
| Office & Administration | 130 (23.1%) | 432 (76.9%) |
| Total (Category) | 479 (45.2%) | 581 (54.8%) |
| Total (Overall) | 2,372 (53.9%) | 2,026 (46.1%) |
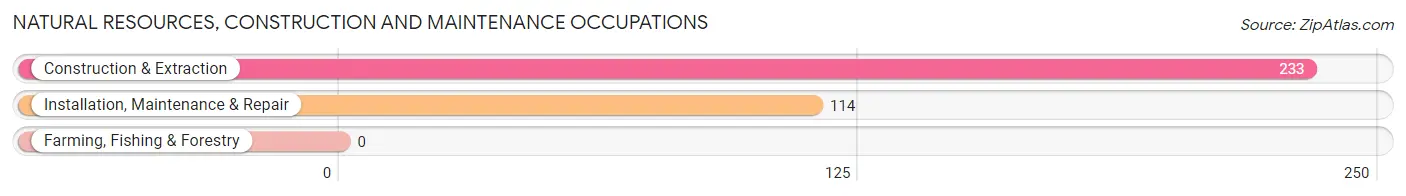
Natural Resources, Construction and Maintenance Occupations
The most common Natural Resources, Construction and Maintenance occupations in Riverdale are Construction & Extraction (233 | 5.3%), and Installation, Maintenance & Repair (114 | 2.6%).
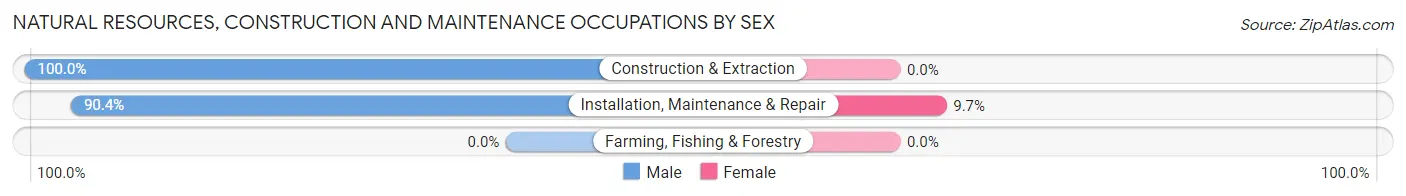
Natural Resources, Construction and Maintenance Occupations by Sex
| Occupation | Male | Female |
| Farming, Fishing & Forestry | 0 (0.0%) | 0 (0.0%) |
| Construction & Extraction | 233 (100.0%) | 0 (0.0%) |
| Installation, Maintenance & Repair | 103 (90.3%) | 11 (9.7%) |
| Total (Category) | 336 (96.8%) | 11 (3.2%) |
| Total (Overall) | 2,372 (53.9%) | 2,026 (46.1%) |
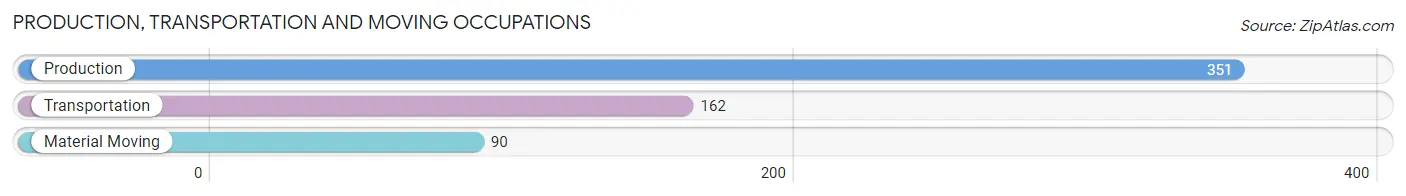
Production, Transportation and Moving Occupations
The most common Production, Transportation and Moving occupations in Riverdale are Production (351 | 8.0%), Transportation (162 | 3.7%), and Material Moving (90 | 2.1%).
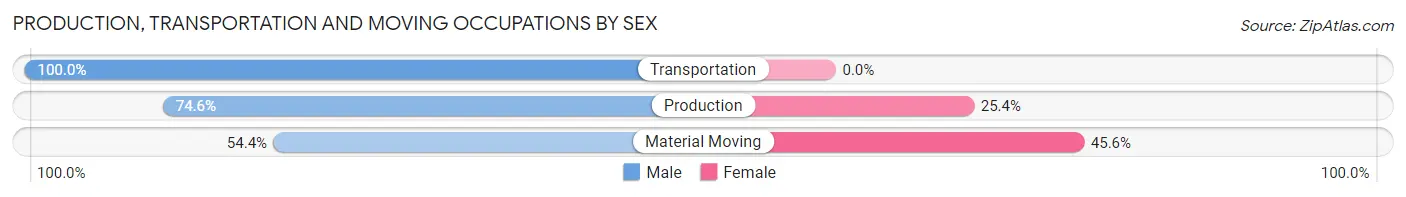
Production, Transportation and Moving Occupations by Sex
| Occupation | Male | Female |
| Production | 262 (74.6%) | 89 (25.4%) |
| Transportation | 162 (100.0%) | 0 (0.0%) |
| Material Moving | 49 (54.4%) | 41 (45.6%) |
| Total (Category) | 473 (78.4%) | 130 (21.6%) |
| Total (Overall) | 2,372 (53.9%) | 2,026 (46.1%) |
Employment Industries by Sex in Riverdale
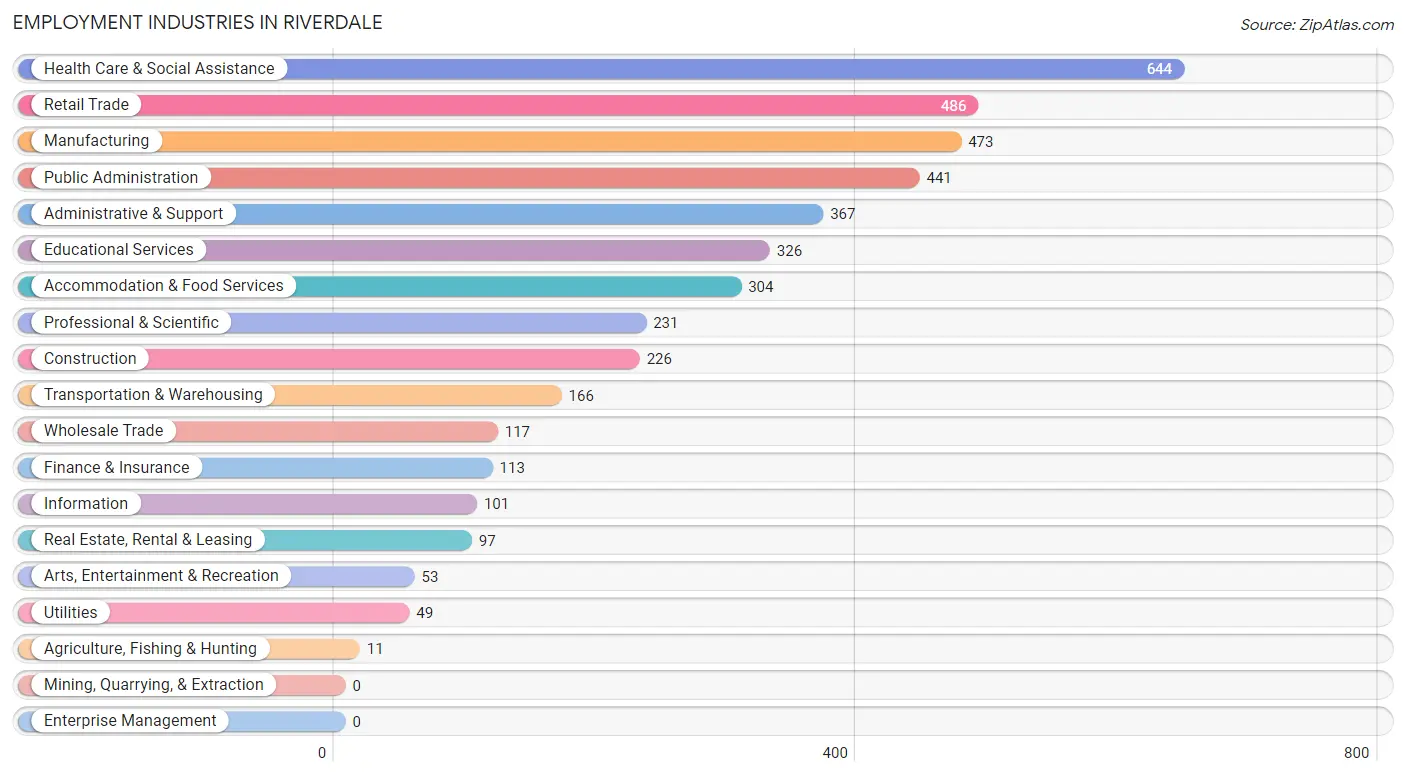
Employment Industries in Riverdale
The major employment industries in Riverdale include Health Care & Social Assistance (644 | 14.6%), Retail Trade (486 | 11.1%), Manufacturing (473 | 10.7%), Public Administration (441 | 10.0%), and Administrative & Support (367 | 8.3%).
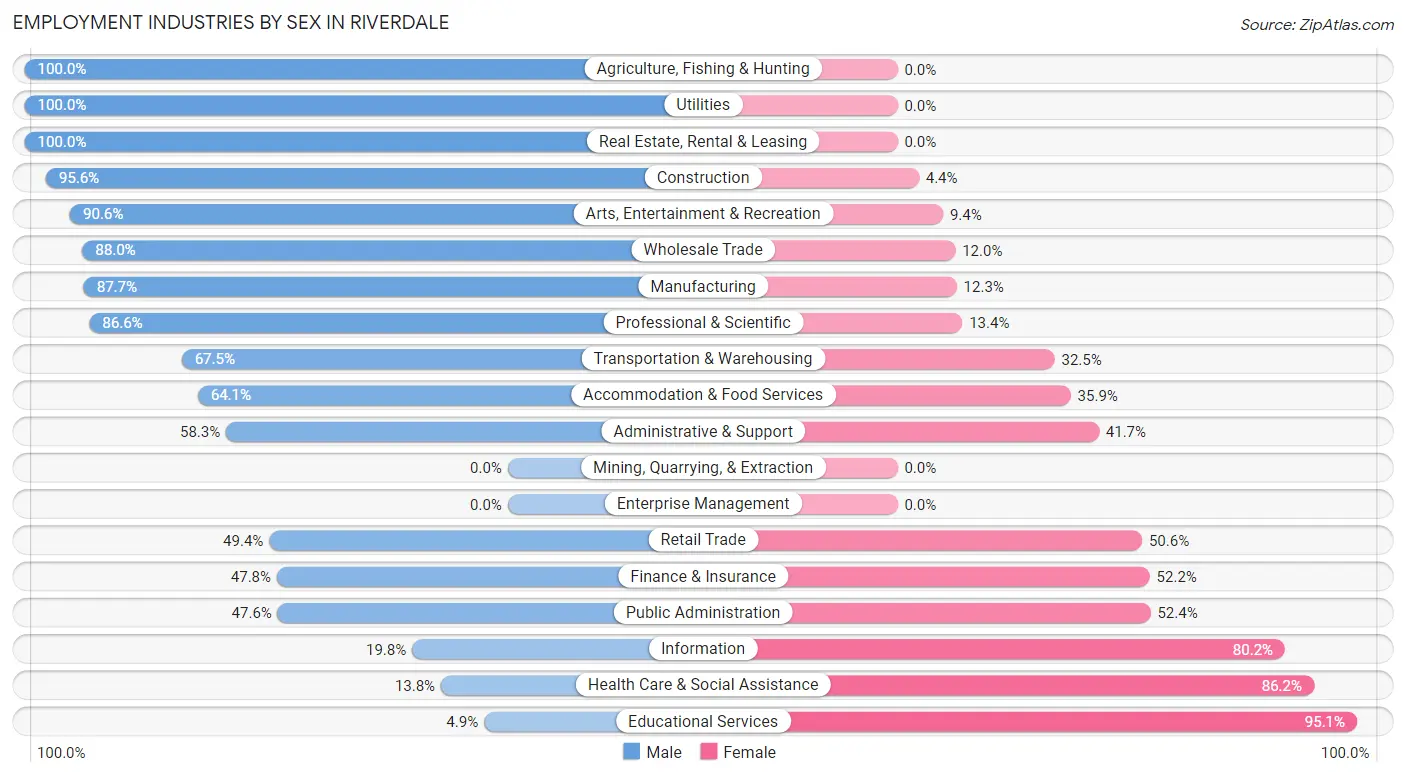
Employment Industries by Sex in Riverdale
The Riverdale industries that see more men than women are Agriculture, Fishing & Hunting (100.0%), Utilities (100.0%), and Real Estate, Rental & Leasing (100.0%), whereas the industries that tend to have a higher number of women are Educational Services (95.1%), Health Care & Social Assistance (86.2%), and Information (80.2%).
| Industry | Male | Female |
| Agriculture, Fishing & Hunting | 11 (100.0%) | 0 (0.0%) |
| Mining, Quarrying, & Extraction | 0 (0.0%) | 0 (0.0%) |
| Construction | 216 (95.6%) | 10 (4.4%) |
| Manufacturing | 415 (87.7%) | 58 (12.3%) |
| Wholesale Trade | 103 (88.0%) | 14 (12.0%) |
| Retail Trade | 240 (49.4%) | 246 (50.6%) |
| Transportation & Warehousing | 112 (67.5%) | 54 (32.5%) |
| Utilities | 49 (100.0%) | 0 (0.0%) |
| Information | 20 (19.8%) | 81 (80.2%) |
| Finance & Insurance | 54 (47.8%) | 59 (52.2%) |
| Real Estate, Rental & Leasing | 97 (100.0%) | 0 (0.0%) |
| Professional & Scientific | 200 (86.6%) | 31 (13.4%) |
| Enterprise Management | 0 (0.0%) | 0 (0.0%) |
| Administrative & Support | 214 (58.3%) | 153 (41.7%) |
| Educational Services | 16 (4.9%) | 310 (95.1%) |
| Health Care & Social Assistance | 89 (13.8%) | 555 (86.2%) |
| Arts, Entertainment & Recreation | 48 (90.6%) | 5 (9.4%) |
| Accommodation & Food Services | 195 (64.1%) | 109 (35.9%) |
| Public Administration | 210 (47.6%) | 231 (52.4%) |
| Total | 2,372 (53.9%) | 2,026 (46.1%) |
Education in Riverdale
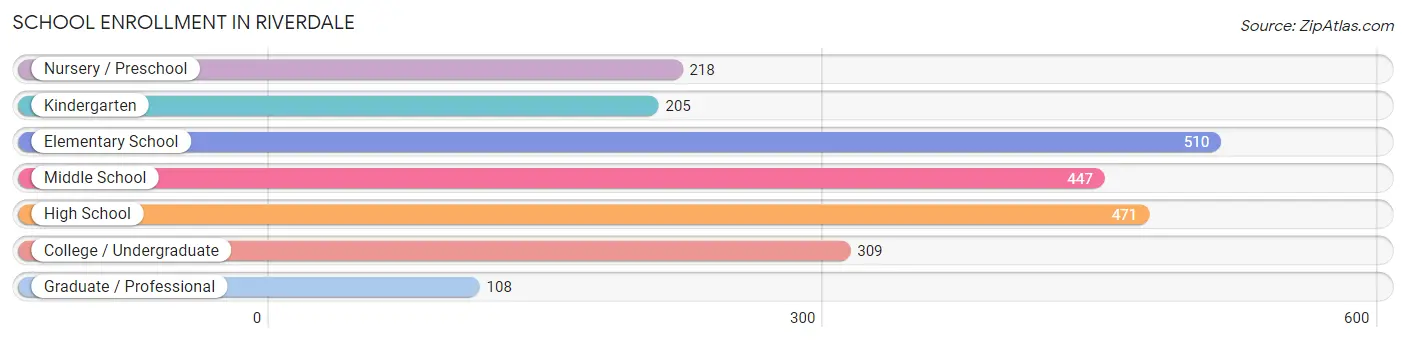
School Enrollment in Riverdale
The most common levels of schooling among the 2,268 students in Riverdale are elementary school (510 | 22.5%), high school (471 | 20.8%), and middle school (447 | 19.7%).
| School Level | # Students | % Students |
| Nursery / Preschool | 218 | 9.6% |
| Kindergarten | 205 | 9.0% |
| Elementary School | 510 | 22.5% |
| Middle School | 447 | 19.7% |
| High School | 471 | 20.8% |
| College / Undergraduate | 309 | 13.6% |
| Graduate / Professional | 108 | 4.8% |
| Total | 2,268 | 100.0% |
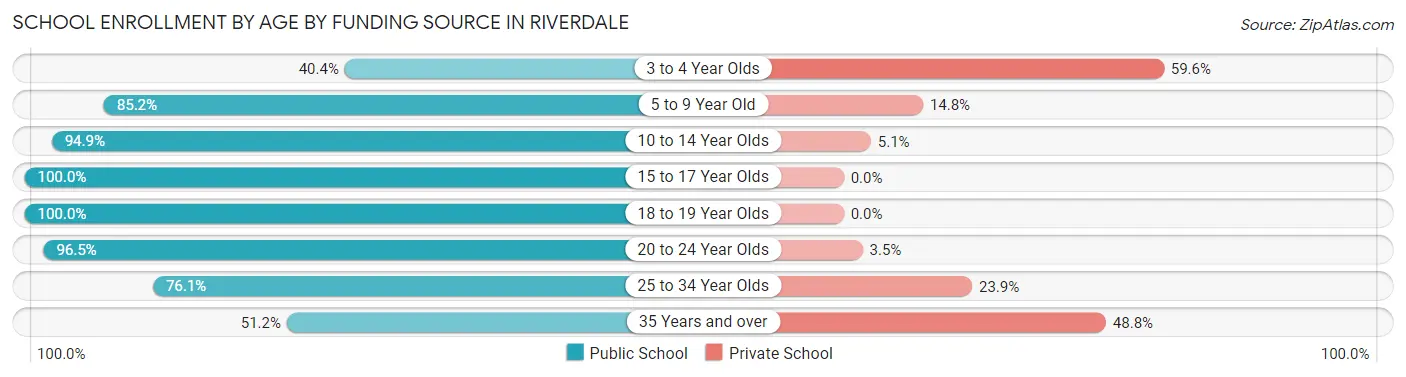
School Enrollment by Age by Funding Source in Riverdale
Out of a total of 2,268 students who are enrolled in schools in Riverdale, 313 (13.8%) attend a private institution, while the remaining 1,955 (86.2%) are enrolled in public schools. The age group of 3 to 4 year olds has the highest likelihood of being enrolled in private schools, with 96 (59.6% in the age bracket) enrolled. Conversely, the age group of 15 to 17 year olds has the lowest likelihood of being enrolled in a private school, with 303 (100.0% in the age bracket) attending a public institution.
| Age Bracket | Public School | Private School |
| 3 to 4 Year Olds | 65 (40.4%) | 96 (59.6%) |
| 5 to 9 Year Old | 531 (85.2%) | 92 (14.8%) |
| 10 to 14 Year Olds | 582 (94.9%) | 31 (5.1%) |
| 15 to 17 Year Olds | 303 (100.0%) | 0 (0.0%) |
| 18 to 19 Year Olds | 120 (100.0%) | 0 (0.0%) |
| 20 to 24 Year Olds | 219 (96.5%) | 8 (3.5%) |
| 25 to 34 Year Olds | 70 (76.1%) | 22 (23.9%) |
| 35 Years and over | 66 (51.2%) | 63 (48.8%) |
| Total | 1,955 (86.2%) | 313 (13.8%) |
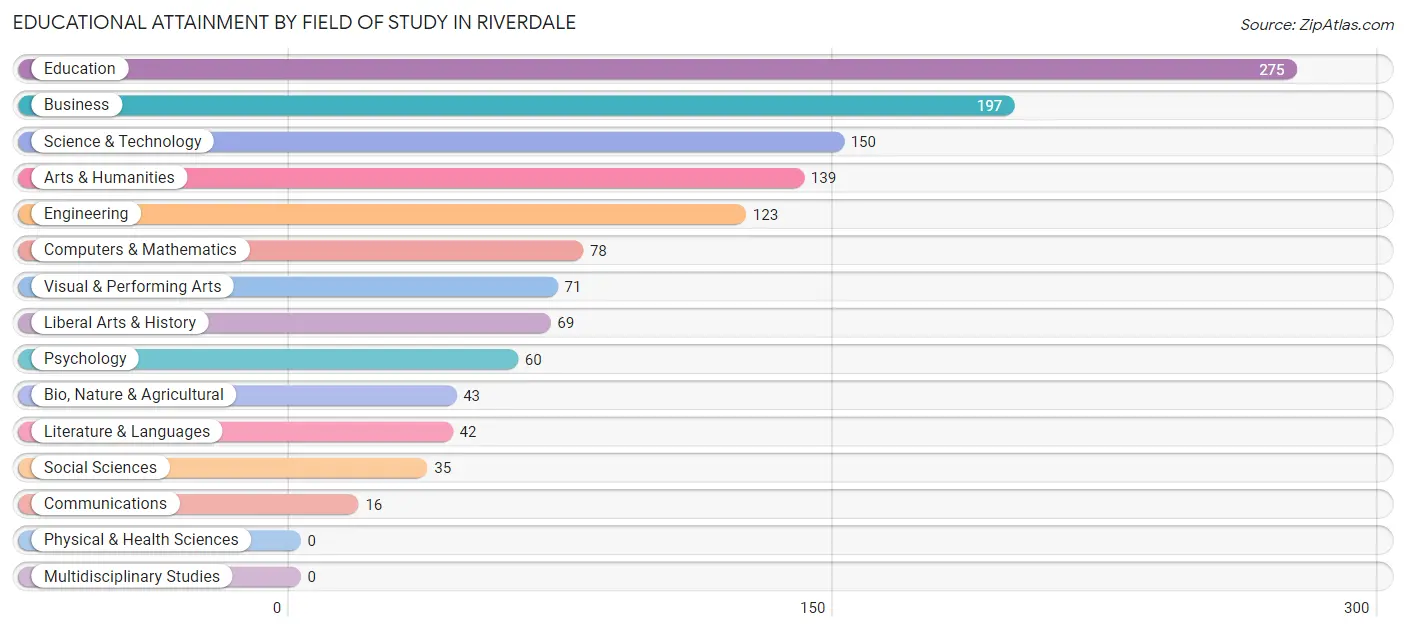
Educational Attainment by Field of Study in Riverdale
Education (275 | 21.2%), business (197 | 15.2%), science & technology (150 | 11.6%), arts & humanities (139 | 10.7%), and engineering (123 | 9.5%) are the most common fields of study among 1,298 individuals in Riverdale who have obtained a bachelor's degree or higher.
| Field of Study | # Graduates | % Graduates |
| Computers & Mathematics | 78 | 6.0% |
| Bio, Nature & Agricultural | 43 | 3.3% |
| Physical & Health Sciences | 0 | 0.0% |
| Psychology | 60 | 4.6% |
| Social Sciences | 35 | 2.7% |
| Engineering | 123 | 9.5% |
| Multidisciplinary Studies | 0 | 0.0% |
| Science & Technology | 150 | 11.6% |
| Business | 197 | 15.2% |
| Education | 275 | 21.2% |
| Literature & Languages | 42 | 3.2% |
| Liberal Arts & History | 69 | 5.3% |
| Visual & Performing Arts | 71 | 5.5% |
| Communications | 16 | 1.2% |
| Arts & Humanities | 139 | 10.7% |
| Total | 1,298 | 100.0% |
Transportation & Commute in Riverdale
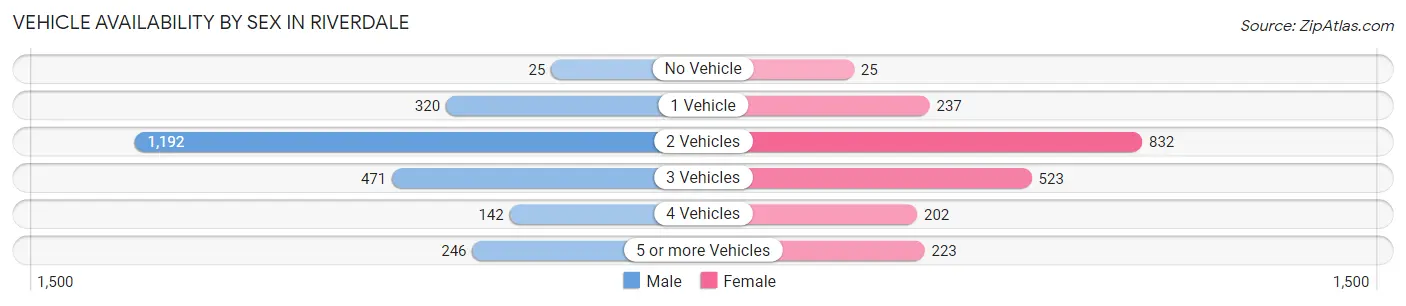
Vehicle Availability by Sex in Riverdale
The most prevalent vehicle ownership categories in Riverdale are males with 2 vehicles (1,192, accounting for 49.7%) and females with 2 vehicles (832, making up 58.4%).
| Vehicles Available | Male | Female |
| No Vehicle | 25 (1.0%) | 25 (1.2%) |
| 1 Vehicle | 320 (13.4%) | 237 (11.6%) |
| 2 Vehicles | 1,192 (49.7%) | 832 (40.7%) |
| 3 Vehicles | 471 (19.7%) | 523 (25.6%) |
| 4 Vehicles | 142 (5.9%) | 202 (9.9%) |
| 5 or more Vehicles | 246 (10.3%) | 223 (10.9%) |
| Total | 2,396 (100.0%) | 2,042 (100.0%) |
Commute Time in Riverdale
The most frequently occuring commute durations in Riverdale are 15 to 19 minutes (998 commuters, 26.2%), 10 to 14 minutes (707 commuters, 18.5%), and 5 to 9 minutes (702 commuters, 18.4%).
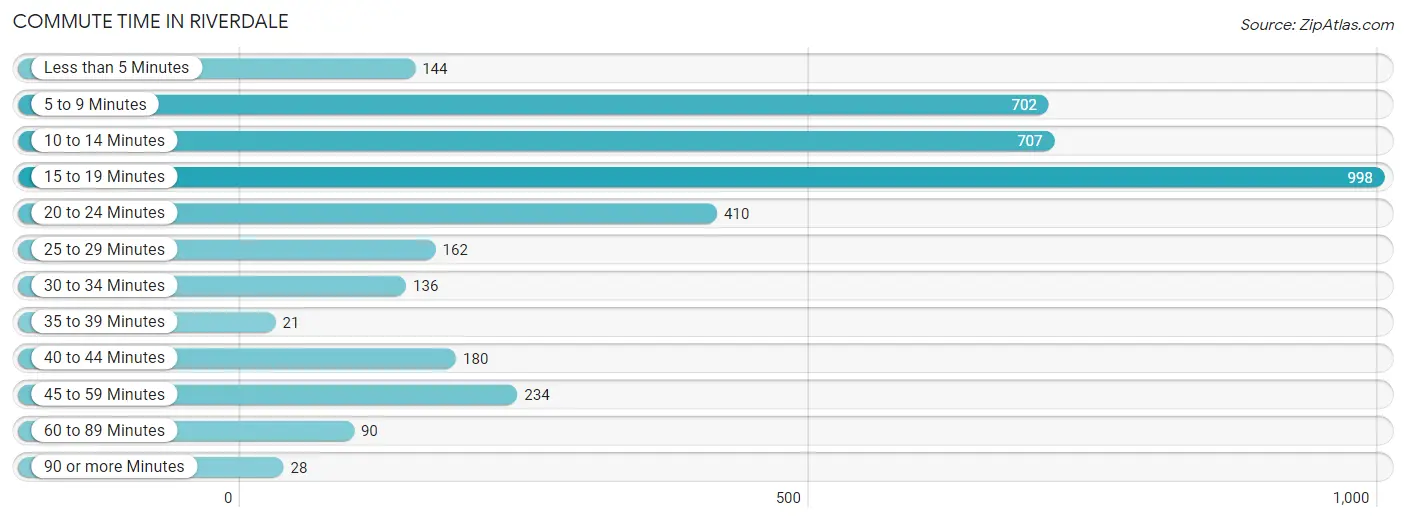
| Commute Time | # Commuters | % Commuters |
| Less than 5 Minutes | 144 | 3.8% |
| 5 to 9 Minutes | 702 | 18.4% |
| 10 to 14 Minutes | 707 | 18.5% |
| 15 to 19 Minutes | 998 | 26.2% |
| 20 to 24 Minutes | 410 | 10.8% |
| 25 to 29 Minutes | 162 | 4.3% |
| 30 to 34 Minutes | 136 | 3.6% |
| 35 to 39 Minutes | 21 | 0.5% |
| 40 to 44 Minutes | 180 | 4.7% |
| 45 to 59 Minutes | 234 | 6.1% |
| 60 to 89 Minutes | 90 | 2.4% |
| 90 or more Minutes | 28 | 0.7% |
Commute Time by Sex in Riverdale
The most common commute times in Riverdale are 15 to 19 minutes (521 commuters, 25.1%) for males and 15 to 19 minutes (477 commuters, 27.4%) for females.
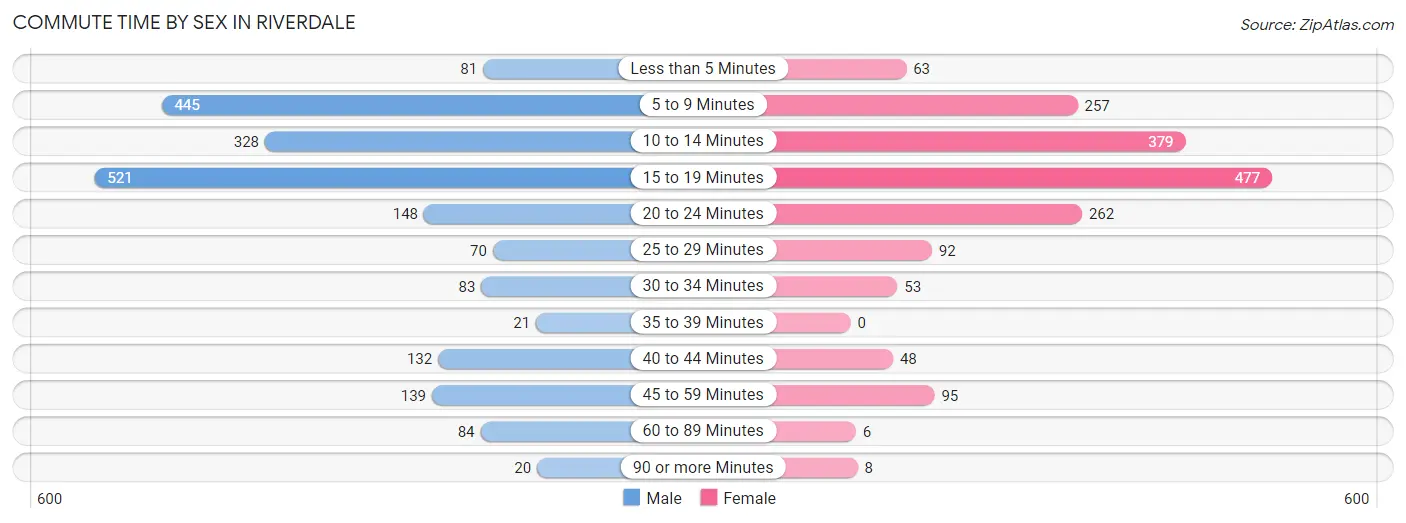
| Commute Time | Male | Female |
| Less than 5 Minutes | 81 (3.9%) | 63 (3.6%) |
| 5 to 9 Minutes | 445 (21.5%) | 257 (14.8%) |
| 10 to 14 Minutes | 328 (15.8%) | 379 (21.8%) |
| 15 to 19 Minutes | 521 (25.1%) | 477 (27.4%) |
| 20 to 24 Minutes | 148 (7.1%) | 262 (15.1%) |
| 25 to 29 Minutes | 70 (3.4%) | 92 (5.3%) |
| 30 to 34 Minutes | 83 (4.0%) | 53 (3.0%) |
| 35 to 39 Minutes | 21 (1.0%) | 0 (0.0%) |
| 40 to 44 Minutes | 132 (6.4%) | 48 (2.8%) |
| 45 to 59 Minutes | 139 (6.7%) | 95 (5.5%) |
| 60 to 89 Minutes | 84 (4.1%) | 6 (0.3%) |
| 90 or more Minutes | 20 (1.0%) | 8 (0.5%) |
Time of Departure to Work by Sex in Riverdale
The most frequent times of departure to work in Riverdale are 7:00 AM to 7:29 AM (263, 12.7%) for males and 7:30 AM to 7:59 AM (227, 13.1%) for females.
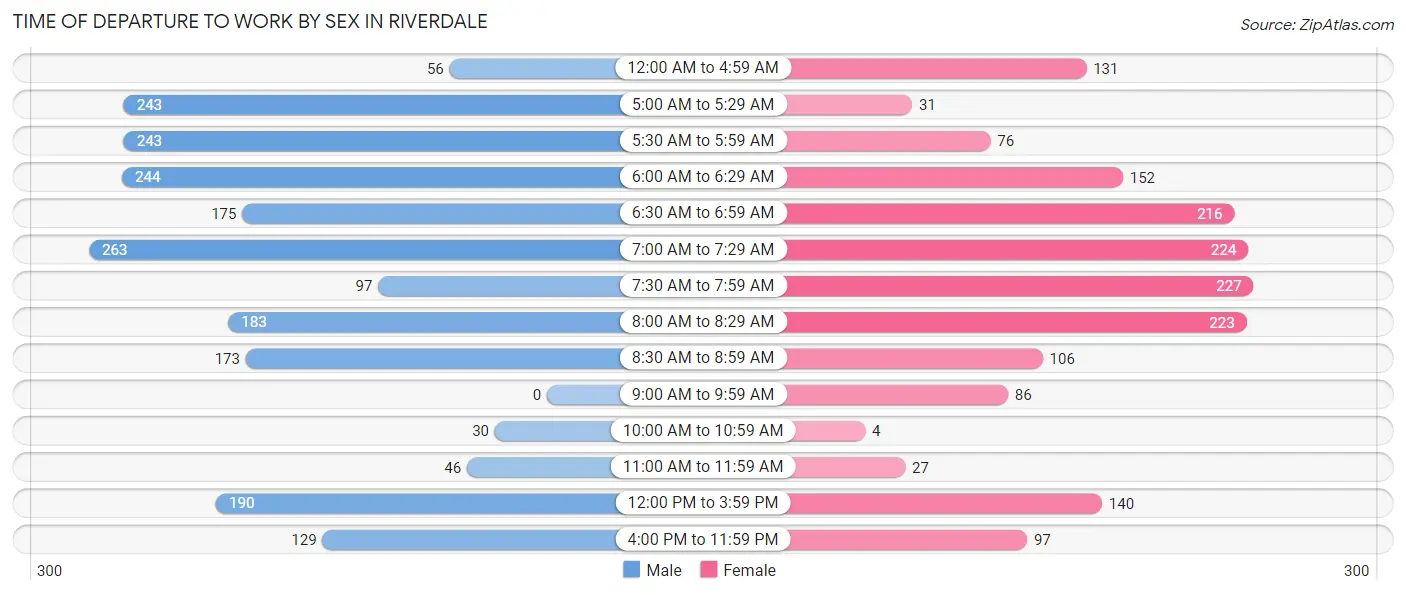
| Time of Departure | Male | Female |
| 12:00 AM to 4:59 AM | 56 (2.7%) | 131 (7.5%) |
| 5:00 AM to 5:29 AM | 243 (11.7%) | 31 (1.8%) |
| 5:30 AM to 5:59 AM | 243 (11.7%) | 76 (4.4%) |
| 6:00 AM to 6:29 AM | 244 (11.8%) | 152 (8.7%) |
| 6:30 AM to 6:59 AM | 175 (8.5%) | 216 (12.4%) |
| 7:00 AM to 7:29 AM | 263 (12.7%) | 224 (12.9%) |
| 7:30 AM to 7:59 AM | 97 (4.7%) | 227 (13.1%) |
| 8:00 AM to 8:29 AM | 183 (8.8%) | 223 (12.8%) |
| 8:30 AM to 8:59 AM | 173 (8.4%) | 106 (6.1%) |
| 9:00 AM to 9:59 AM | 0 (0.0%) | 86 (4.9%) |
| 10:00 AM to 10:59 AM | 30 (1.5%) | 4 (0.2%) |
| 11:00 AM to 11:59 AM | 46 (2.2%) | 27 (1.5%) |
| 12:00 PM to 3:59 PM | 190 (9.2%) | 140 (8.1%) |
| 4:00 PM to 11:59 PM | 129 (6.2%) | 97 (5.6%) |
| Total | 2,072 (100.0%) | 1,740 (100.0%) |
Housing Occupancy in Riverdale
Occupancy by Ownership in Riverdale
Of the total 3,383 dwellings in Riverdale, owner-occupied units account for 2,429 (71.8%), while renter-occupied units make up 954 (28.2%).
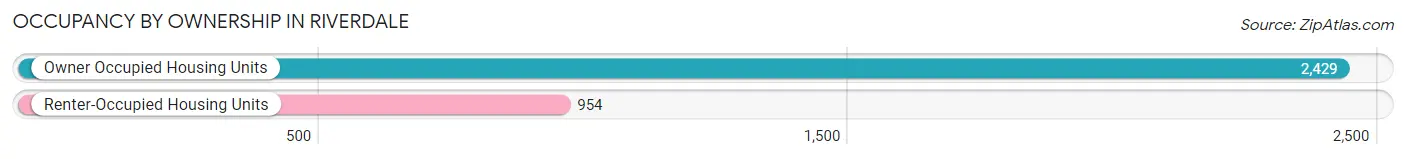
| Occupancy | # Housing Units | % Housing Units |
| Owner Occupied Housing Units | 2,429 | 71.8% |
| Renter-Occupied Housing Units | 954 | 28.2% |
| Total Occupied Housing Units | 3,383 | 100.0% |
Occupancy by Household Size in Riverdale
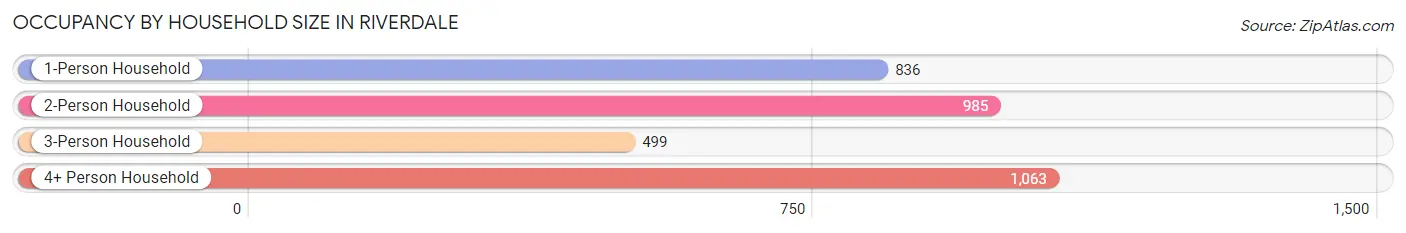
| Household Size | # Housing Units | % Housing Units |
| 1-Person Household | 836 | 24.7% |
| 2-Person Household | 985 | 29.1% |
| 3-Person Household | 499 | 14.7% |
| 4+ Person Household | 1,063 | 31.4% |
| Total Housing Units | 3,383 | 100.0% |
Occupancy by Ownership by Household Size in Riverdale
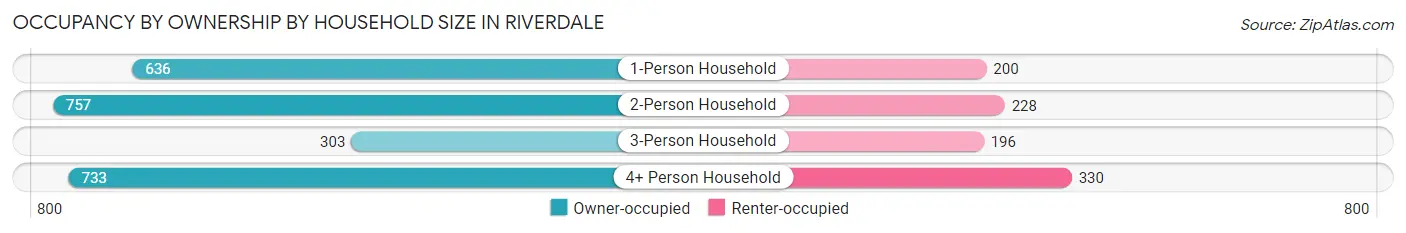
| Household Size | Owner-occupied | Renter-occupied |
| 1-Person Household | 636 (76.1%) | 200 (23.9%) |
| 2-Person Household | 757 (76.8%) | 228 (23.2%) |
| 3-Person Household | 303 (60.7%) | 196 (39.3%) |
| 4+ Person Household | 733 (69.0%) | 330 (31.0%) |
| Total Housing Units | 2,429 (71.8%) | 954 (28.2%) |
Occupancy by Educational Attainment in Riverdale
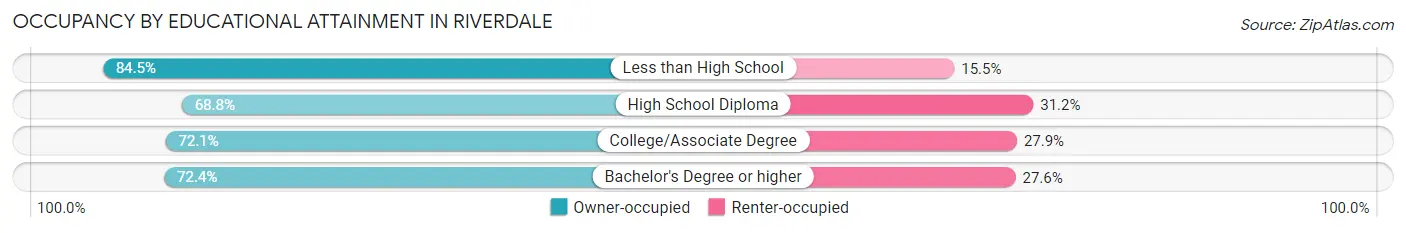
| Household Size | Owner-occupied | Renter-occupied |
| Less than High School | 191 (84.5%) | 35 (15.5%) |
| High School Diploma | 844 (68.8%) | 382 (31.2%) |
| College/Associate Degree | 886 (72.1%) | 343 (27.9%) |
| Bachelor's Degree or higher | 508 (72.4%) | 194 (27.6%) |
Occupancy by Age of Householder in Riverdale
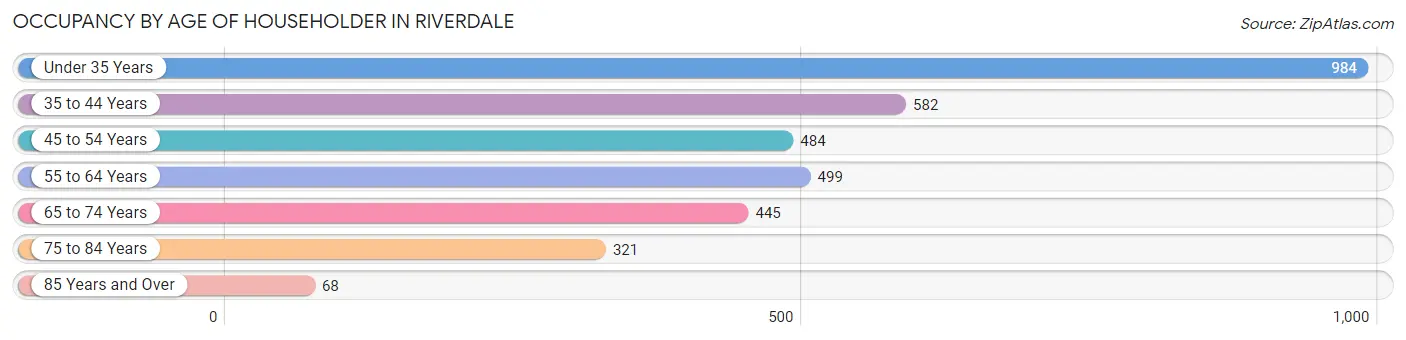
| Age Bracket | # Households | % Households |
| Under 35 Years | 984 | 29.1% |
| 35 to 44 Years | 582 | 17.2% |
| 45 to 54 Years | 484 | 14.3% |
| 55 to 64 Years | 499 | 14.7% |
| 65 to 74 Years | 445 | 13.2% |
| 75 to 84 Years | 321 | 9.5% |
| 85 Years and Over | 68 | 2.0% |
| Total | 3,383 | 100.0% |
Housing Finances in Riverdale
Median Income by Occupancy in Riverdale
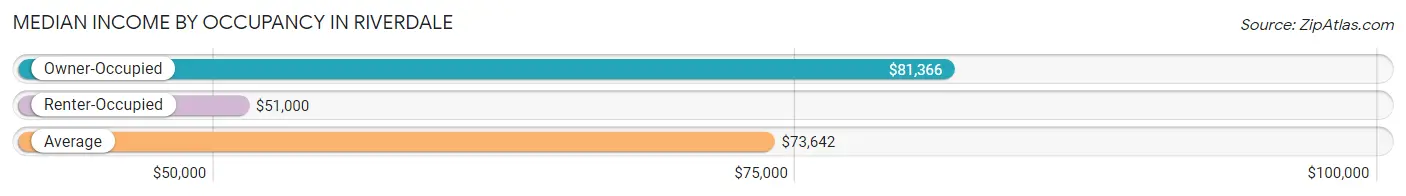
| Occupancy Type | # Households | Median Income |
| Owner-Occupied | 2,429 (71.8%) | $81,366 |
| Renter-Occupied | 954 (28.2%) | $51,000 |
| Average | 3,383 (100.0%) | $73,642 |
Occupancy by Householder Income Bracket in Riverdale
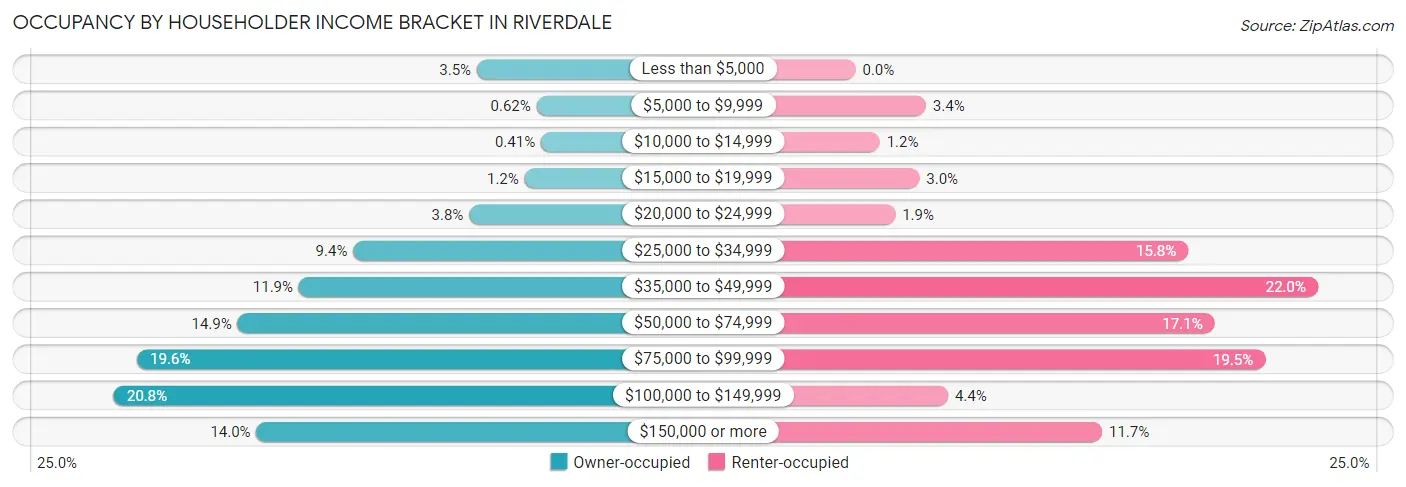
| Income Bracket | Owner-occupied | Renter-occupied |
| Less than $5,000 | 84 (3.5%) | 0 (0.0%) |
| $5,000 to $9,999 | 15 (0.6%) | 32 (3.4%) |
| $10,000 to $14,999 | 10 (0.4%) | 11 (1.1%) |
| $15,000 to $19,999 | 29 (1.2%) | 29 (3.0%) |
| $20,000 to $24,999 | 93 (3.8%) | 18 (1.9%) |
| $25,000 to $34,999 | 227 (9.3%) | 151 (15.8%) |
| $35,000 to $49,999 | 290 (11.9%) | 210 (22.0%) |
| $50,000 to $74,999 | 361 (14.9%) | 163 (17.1%) |
| $75,000 to $99,999 | 477 (19.6%) | 186 (19.5%) |
| $100,000 to $149,999 | 504 (20.7%) | 42 (4.4%) |
| $150,000 or more | 339 (14.0%) | 112 (11.7%) |
| Total | 2,429 (100.0%) | 954 (100.0%) |
Monthly Housing Cost Tiers in Riverdale
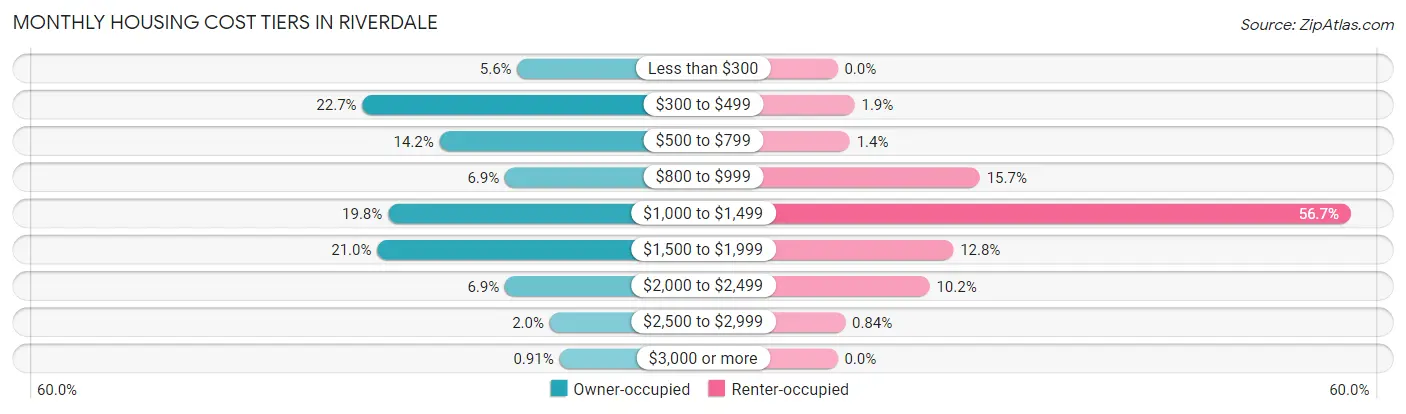
| Monthly Cost | Owner-occupied | Renter-occupied |
| Less than $300 | 135 (5.6%) | 0 (0.0%) |
| $300 to $499 | 551 (22.7%) | 18 (1.9%) |
| $500 to $799 | 344 (14.2%) | 13 (1.4%) |
| $800 to $999 | 168 (6.9%) | 150 (15.7%) |
| $1,000 to $1,499 | 482 (19.8%) | 541 (56.7%) |
| $1,500 to $1,999 | 511 (21.0%) | 122 (12.8%) |
| $2,000 to $2,499 | 168 (6.9%) | 97 (10.2%) |
| $2,500 to $2,999 | 48 (2.0%) | 8 (0.8%) |
| $3,000 or more | 22 (0.9%) | 0 (0.0%) |
| Total | 2,429 (100.0%) | 954 (100.0%) |
Physical Housing Characteristics in Riverdale
Housing Structures in Riverdale
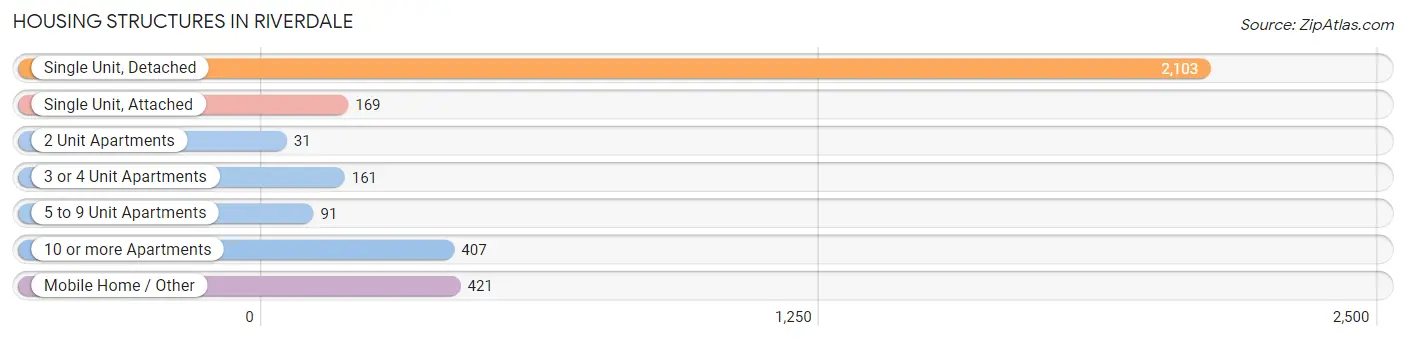
| Structure Type | # Housing Units | % Housing Units |
| Single Unit, Detached | 2,103 | 62.2% |
| Single Unit, Attached | 169 | 5.0% |
| 2 Unit Apartments | 31 | 0.9% |
| 3 or 4 Unit Apartments | 161 | 4.8% |
| 5 to 9 Unit Apartments | 91 | 2.7% |
| 10 or more Apartments | 407 | 12.0% |
| Mobile Home / Other | 421 | 12.4% |
| Total | 3,383 | 100.0% |
Housing Structures by Occupancy in Riverdale
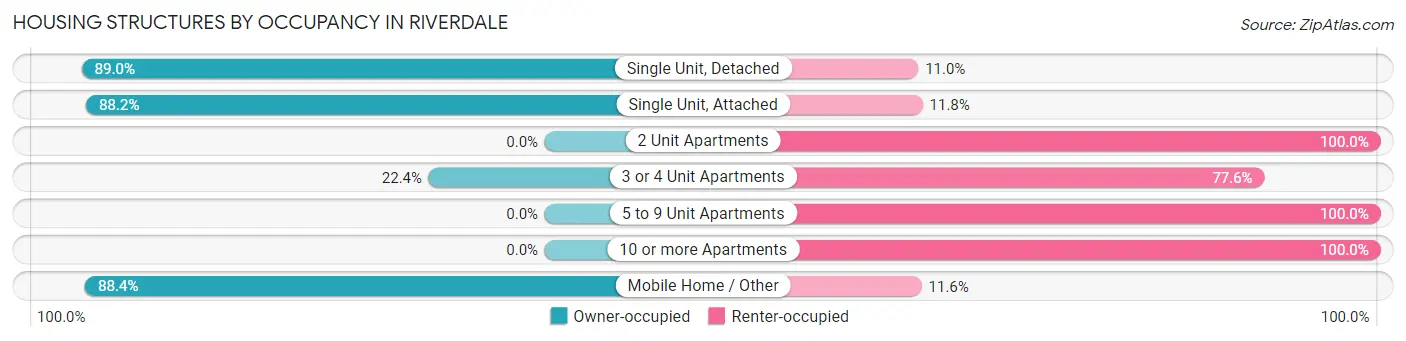
| Structure Type | Owner-occupied | Renter-occupied |
| Single Unit, Detached | 1,872 (89.0%) | 231 (11.0%) |
| Single Unit, Attached | 149 (88.2%) | 20 (11.8%) |
| 2 Unit Apartments | 0 (0.0%) | 31 (100.0%) |
| 3 or 4 Unit Apartments | 36 (22.4%) | 125 (77.6%) |
| 5 to 9 Unit Apartments | 0 (0.0%) | 91 (100.0%) |
| 10 or more Apartments | 0 (0.0%) | 407 (100.0%) |
| Mobile Home / Other | 372 (88.4%) | 49 (11.6%) |
| Total | 2,429 (71.8%) | 954 (28.2%) |
Housing Structures by Number of Rooms in Riverdale
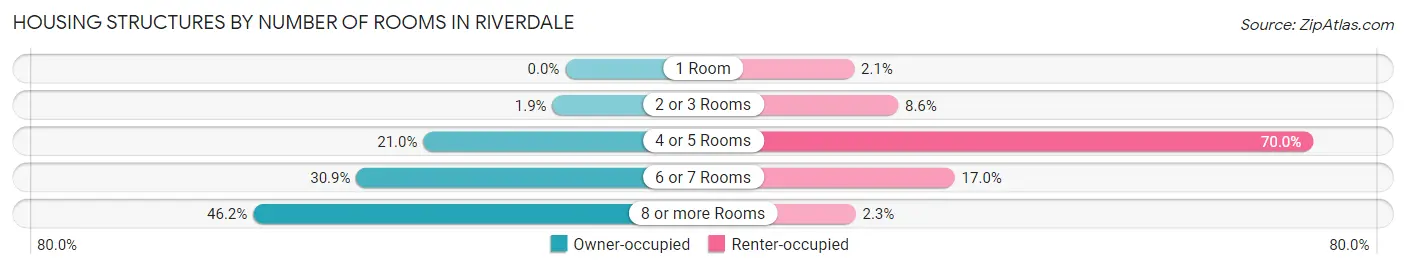
| Number of Rooms | Owner-occupied | Renter-occupied |
| 1 Room | 0 (0.0%) | 20 (2.1%) |
| 2 or 3 Rooms | 46 (1.9%) | 82 (8.6%) |
| 4 or 5 Rooms | 510 (21.0%) | 668 (70.0%) |
| 6 or 7 Rooms | 751 (30.9%) | 162 (17.0%) |
| 8 or more Rooms | 1,122 (46.2%) | 22 (2.3%) |
| Total | 2,429 (100.0%) | 954 (100.0%) |
Housing Structure by Heating Type in Riverdale
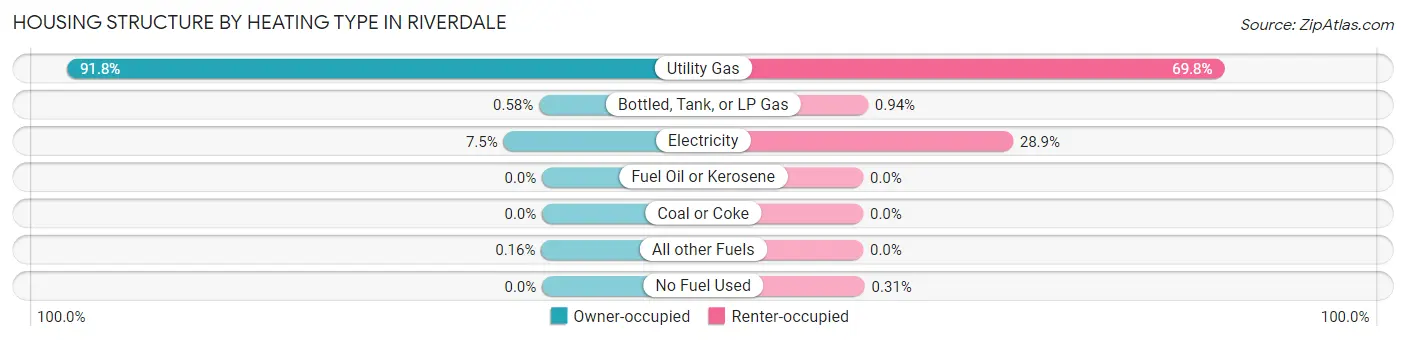
| Heating Type | Owner-occupied | Renter-occupied |
| Utility Gas | 2,230 (91.8%) | 666 (69.8%) |
| Bottled, Tank, or LP Gas | 14 (0.6%) | 9 (0.9%) |
| Electricity | 181 (7.4%) | 276 (28.9%) |
| Fuel Oil or Kerosene | 0 (0.0%) | 0 (0.0%) |
| Coal or Coke | 0 (0.0%) | 0 (0.0%) |
| All other Fuels | 4 (0.2%) | 0 (0.0%) |
| No Fuel Used | 0 (0.0%) | 3 (0.3%) |
| Total | 2,429 (100.0%) | 954 (100.0%) |
Household Vehicle Usage in Riverdale
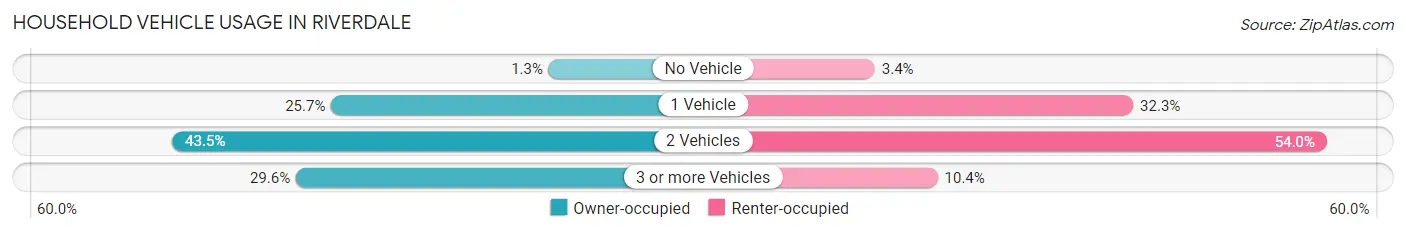
| Vehicles per Household | Owner-occupied | Renter-occupied |
| No Vehicle | 31 (1.3%) | 32 (3.4%) |
| 1 Vehicle | 623 (25.7%) | 308 (32.3%) |
| 2 Vehicles | 1,056 (43.5%) | 515 (54.0%) |
| 3 or more Vehicles | 719 (29.6%) | 99 (10.4%) |
| Total | 2,429 (100.0%) | 954 (100.0%) |
Real Estate & Mortgages in Riverdale
Real Estate and Mortgage Overview in Riverdale
| Characteristic | Without Mortgage | With Mortgage |
| Housing Units | 1,090 | 1,339 |
| Median Property Value | $299,400 | $335,100 |
| Median Household Income | $48,889 | $262 |
| Monthly Housing Costs | $453 | $13 |
| Real Estate Taxes | $1,749 | $53 |
Property Value by Mortgage Status in Riverdale
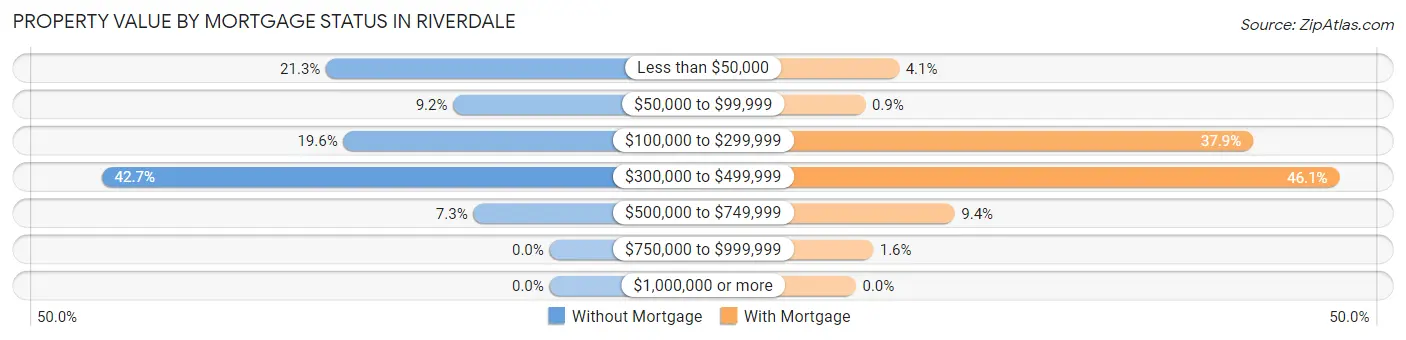
| Property Value | Without Mortgage | With Mortgage |
| Less than $50,000 | 232 (21.3%) | 55 (4.1%) |
| $50,000 to $99,999 | 100 (9.2%) | 12 (0.9%) |
| $100,000 to $299,999 | 214 (19.6%) | 507 (37.9%) |
| $300,000 to $499,999 | 465 (42.7%) | 617 (46.1%) |
| $500,000 to $749,999 | 79 (7.2%) | 126 (9.4%) |
| $750,000 to $999,999 | 0 (0.0%) | 22 (1.6%) |
| $1,000,000 or more | 0 (0.0%) | 0 (0.0%) |
| Total | 1,090 (100.0%) | 1,339 (100.0%) |
Household Income by Mortgage Status in Riverdale
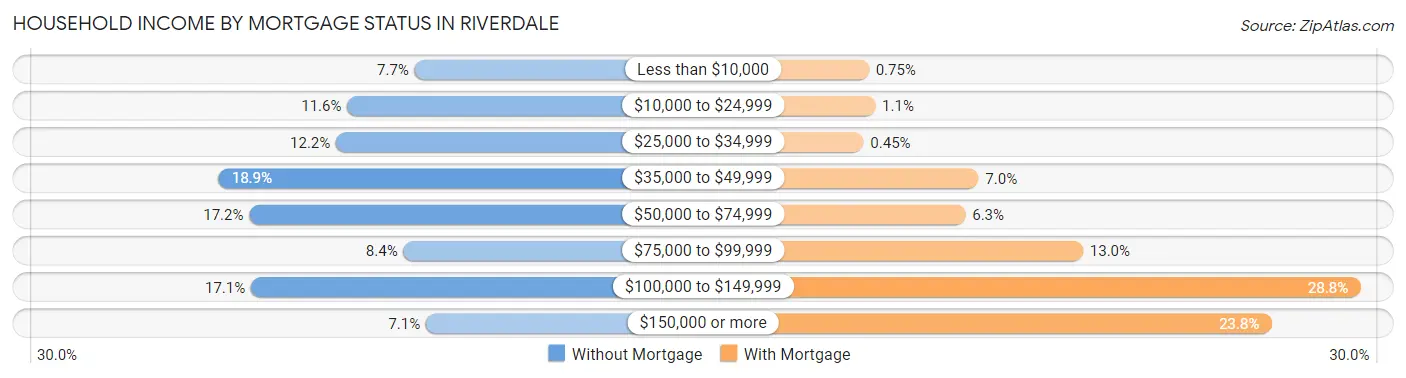
| Household Income | Without Mortgage | With Mortgage |
| Less than $10,000 | 84 (7.7%) | 10 (0.7%) |
| $10,000 to $24,999 | 126 (11.6%) | 15 (1.1%) |
| $25,000 to $34,999 | 133 (12.2%) | 6 (0.4%) |
| $35,000 to $49,999 | 206 (18.9%) | 94 (7.0%) |
| $50,000 to $74,999 | 187 (17.2%) | 84 (6.3%) |
| $75,000 to $99,999 | 91 (8.4%) | 174 (13.0%) |
| $100,000 to $149,999 | 186 (17.1%) | 386 (28.8%) |
| $150,000 or more | 77 (7.1%) | 318 (23.7%) |
| Total | 1,090 (100.0%) | 1,339 (100.0%) |
Property Value to Household Income Ratio in Riverdale
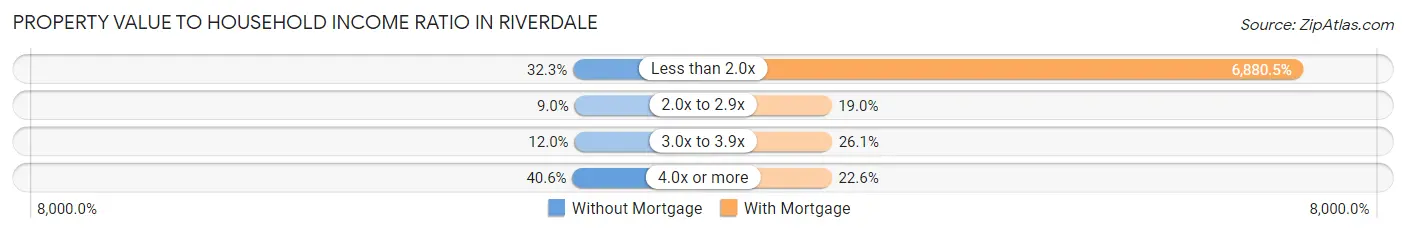
| Value-to-Income Ratio | Without Mortgage | With Mortgage |
| Less than 2.0x | 352 (32.3%) | 92,130 (6,880.5%) |
| 2.0x to 2.9x | 98 (9.0%) | 254 (19.0%) |
| 3.0x to 3.9x | 131 (12.0%) | 350 (26.1%) |
| 4.0x or more | 442 (40.6%) | 302 (22.6%) |
| Total | 1,090 (100.0%) | 1,339 (100.0%) |
Real Estate Taxes by Mortgage Status in Riverdale
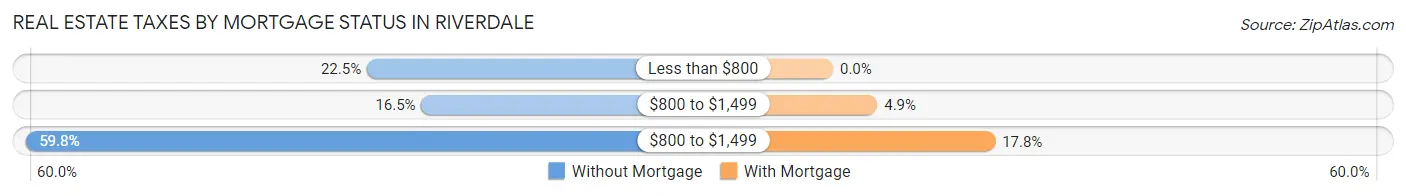
| Property Taxes | Without Mortgage | With Mortgage |
| Less than $800 | 245 (22.5%) | 0 (0.0%) |
| $800 to $1,499 | 180 (16.5%) | 65 (4.9%) |
| $800 to $1,499 | 652 (59.8%) | 238 (17.8%) |
| Total | 1,090 (100.0%) | 1,339 (100.0%) |
Health & Disability in Riverdale
Health Insurance Coverage by Age in Riverdale
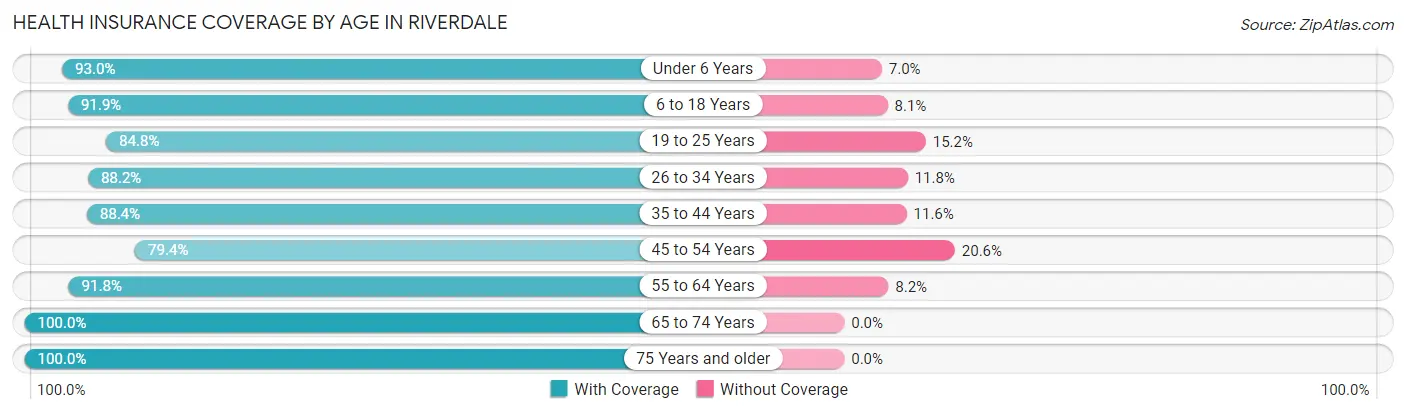
| Age Bracket | With Coverage | Without Coverage |
| Under 6 Years | 981 (93.0%) | 74 (7.0%) |
| 6 to 18 Years | 1,547 (91.9%) | 136 (8.1%) |
| 19 to 25 Years | 876 (84.8%) | 157 (15.2%) |
| 26 to 34 Years | 1,156 (88.2%) | 155 (11.8%) |
| 35 to 44 Years | 1,042 (88.4%) | 137 (11.6%) |
| 45 to 54 Years | 739 (79.4%) | 192 (20.6%) |
| 55 to 64 Years | 770 (91.8%) | 69 (8.2%) |
| 65 to 74 Years | 631 (100.0%) | 0 (0.0%) |
| 75 Years and older | 565 (100.0%) | 0 (0.0%) |
| Total | 8,307 (90.0%) | 920 (10.0%) |
Health Insurance Coverage by Citizenship Status in Riverdale
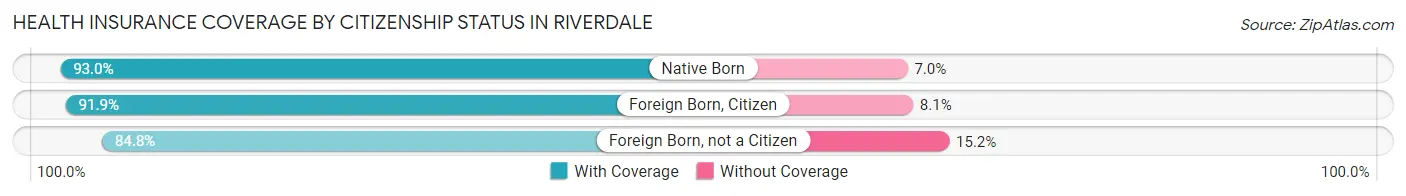
| Citizenship Status | With Coverage | Without Coverage |
| Native Born | 981 (93.0%) | 74 (7.0%) |
| Foreign Born, Citizen | 1,547 (91.9%) | 136 (8.1%) |
| Foreign Born, not a Citizen | 876 (84.8%) | 157 (15.2%) |
Health Insurance Coverage by Household Income in Riverdale
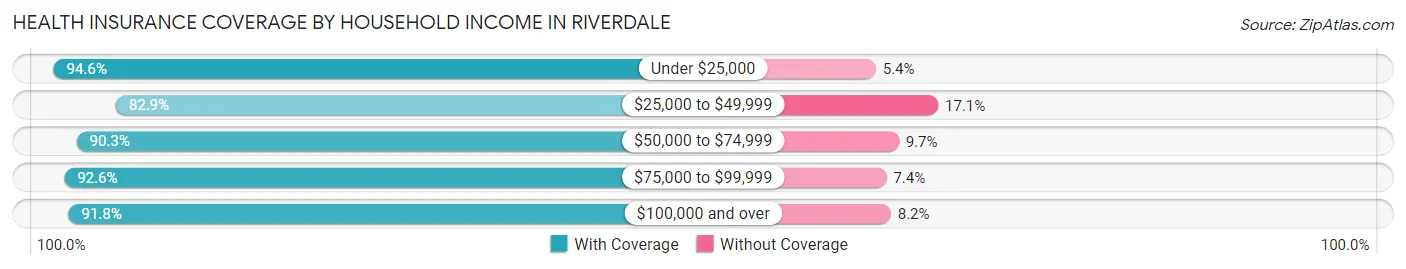
| Household Income | With Coverage | Without Coverage |
| Under $25,000 | 540 (94.6%) | 31 (5.4%) |
| $25,000 to $49,999 | 1,565 (82.9%) | 323 (17.1%) |
| $50,000 to $74,999 | 1,317 (90.3%) | 142 (9.7%) |
| $75,000 to $99,999 | 1,557 (92.6%) | 125 (7.4%) |
| $100,000 and over | 3,328 (91.8%) | 299 (8.2%) |
Public vs Private Health Insurance Coverage by Age in Riverdale
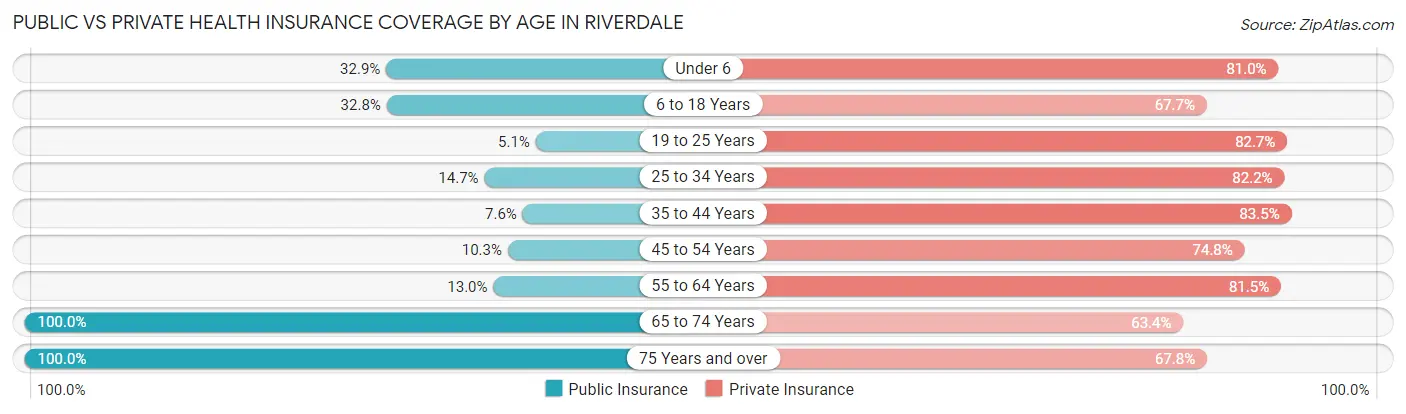
| Age Bracket | Public Insurance | Private Insurance |
| Under 6 | 347 (32.9%) | 855 (81.0%) |
| 6 to 18 Years | 552 (32.8%) | 1,140 (67.7%) |
| 19 to 25 Years | 53 (5.1%) | 854 (82.7%) |
| 25 to 34 Years | 192 (14.6%) | 1,077 (82.2%) |
| 35 to 44 Years | 89 (7.5%) | 984 (83.5%) |
| 45 to 54 Years | 96 (10.3%) | 696 (74.8%) |
| 55 to 64 Years | 109 (13.0%) | 684 (81.5%) |
| 65 to 74 Years | 631 (100.0%) | 400 (63.4%) |
| 75 Years and over | 565 (100.0%) | 383 (67.8%) |
| Total | 2,634 (28.5%) | 7,073 (76.7%) |
Disability Status by Sex by Age in Riverdale
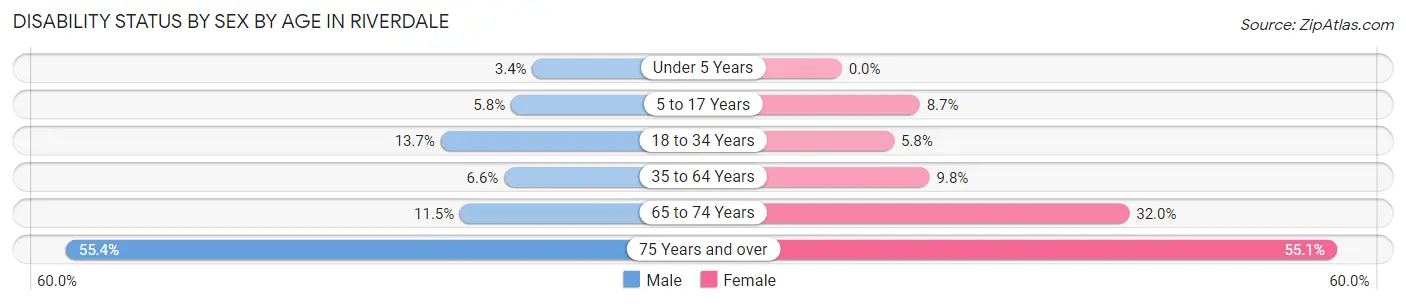
| Age Bracket | Male | Female |
| Under 5 Years | 17 (3.4%) | 0 (0.0%) |
| 5 to 17 Years | 51 (5.8%) | 75 (8.7%) |
| 18 to 34 Years | 152 (13.7%) | 77 (5.8%) |
| 35 to 64 Years | 106 (6.6%) | 131 (9.8%) |
| 65 to 74 Years | 23 (11.5%) | 138 (32.0%) |
| 75 Years and over | 123 (55.4%) | 189 (55.1%) |
Disability Class by Sex by Age in Riverdale
Disability Class: Hearing Difficulty
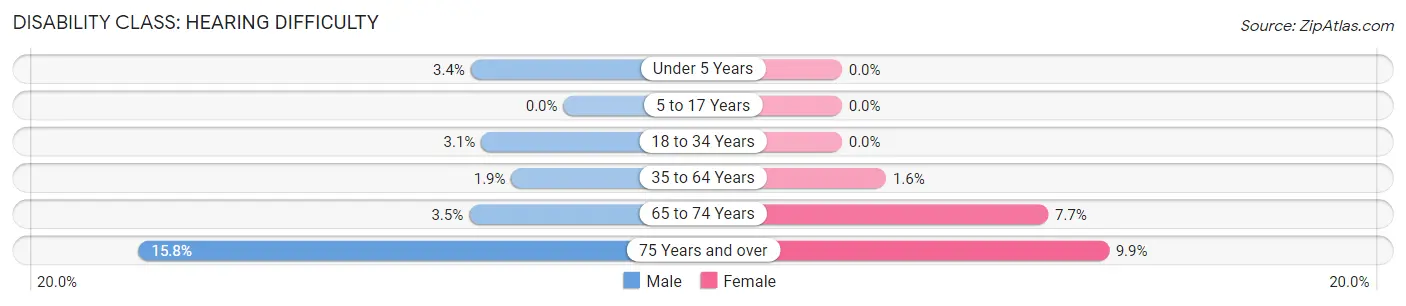
| Age Bracket | Male | Female |
| Under 5 Years | 17 (3.4%) | 0 (0.0%) |
| 5 to 17 Years | 0 (0.0%) | 0 (0.0%) |
| 18 to 34 Years | 34 (3.0%) | 0 (0.0%) |
| 35 to 64 Years | 31 (1.9%) | 22 (1.6%) |
| 65 to 74 Years | 7 (3.5%) | 33 (7.7%) |
| 75 Years and over | 35 (15.8%) | 34 (9.9%) |
Disability Class: Vision Difficulty
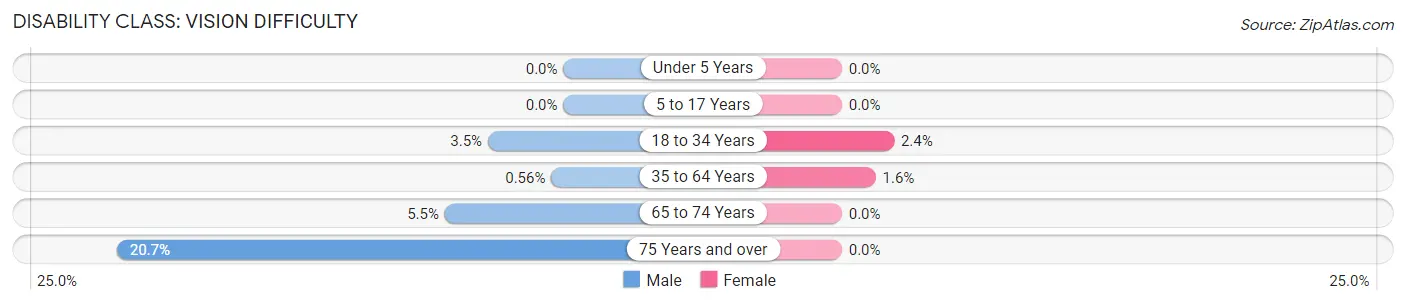
| Age Bracket | Male | Female |
| Under 5 Years | 0 (0.0%) | 0 (0.0%) |
| 5 to 17 Years | 0 (0.0%) | 0 (0.0%) |
| 18 to 34 Years | 39 (3.5%) | 32 (2.4%) |
| 35 to 64 Years | 9 (0.6%) | 21 (1.6%) |
| 65 to 74 Years | 11 (5.5%) | 0 (0.0%) |
| 75 Years and over | 46 (20.7%) | 0 (0.0%) |
Disability Class: Cognitive Difficulty
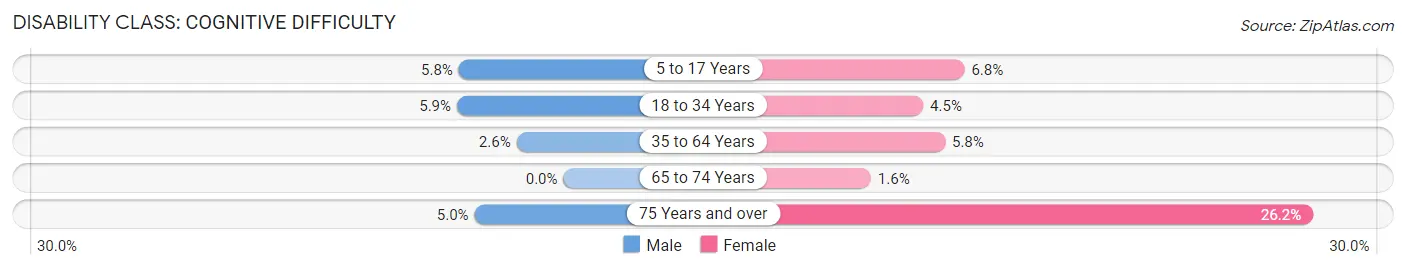
| Age Bracket | Male | Female |
| 5 to 17 Years | 51 (5.8%) | 59 (6.8%) |
| 18 to 34 Years | 66 (5.9%) | 60 (4.5%) |
| 35 to 64 Years | 42 (2.6%) | 77 (5.8%) |
| 65 to 74 Years | 0 (0.0%) | 7 (1.6%) |
| 75 Years and over | 11 (5.0%) | 90 (26.2%) |
Disability Class: Ambulatory Difficulty
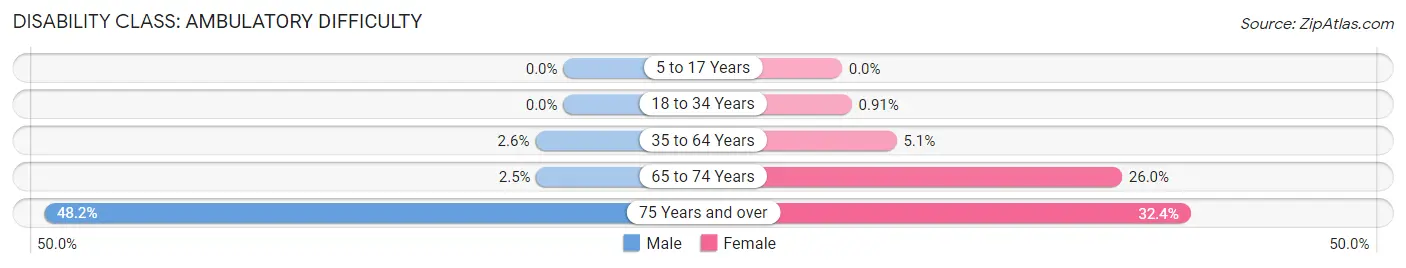
| Age Bracket | Male | Female |
| 5 to 17 Years | 0 (0.0%) | 0 (0.0%) |
| 18 to 34 Years | 0 (0.0%) | 12 (0.9%) |
| 35 to 64 Years | 42 (2.6%) | 68 (5.1%) |
| 65 to 74 Years | 5 (2.5%) | 112 (26.0%) |
| 75 Years and over | 107 (48.2%) | 111 (32.4%) |
Disability Class: Self-Care Difficulty
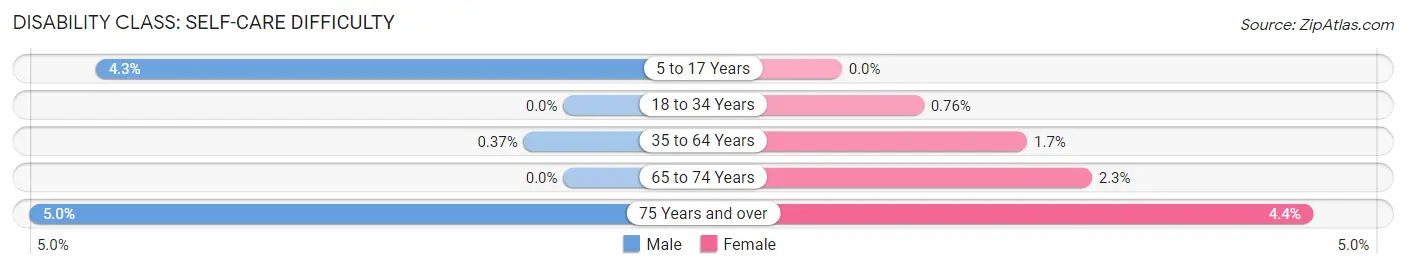
| Age Bracket | Male | Female |
| 5 to 17 Years | 38 (4.3%) | 0 (0.0%) |
| 18 to 34 Years | 0 (0.0%) | 10 (0.8%) |
| 35 to 64 Years | 6 (0.4%) | 23 (1.7%) |
| 65 to 74 Years | 0 (0.0%) | 10 (2.3%) |
| 75 Years and over | 11 (5.0%) | 15 (4.4%) |
Technology Access in Riverdale
Computing Device Access in Riverdale
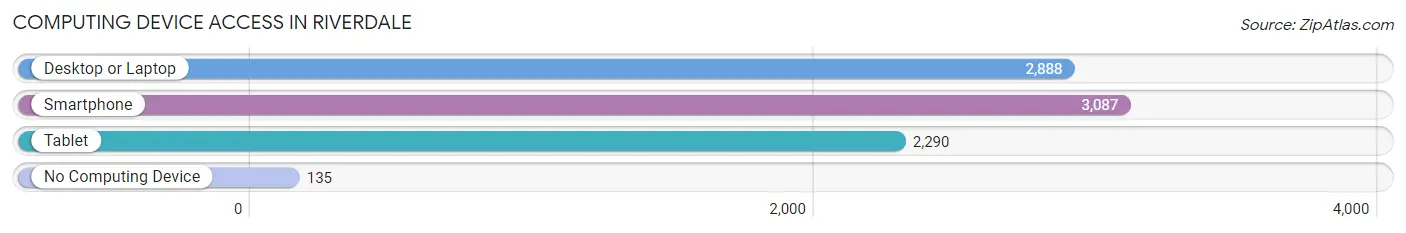
| Device Type | # Households | % Households |
| Desktop or Laptop | 2,888 | 85.4% |
| Smartphone | 3,087 | 91.2% |
| Tablet | 2,290 | 67.7% |
| No Computing Device | 135 | 4.0% |
| Total | 3,383 | 100.0% |
Internet Access in Riverdale
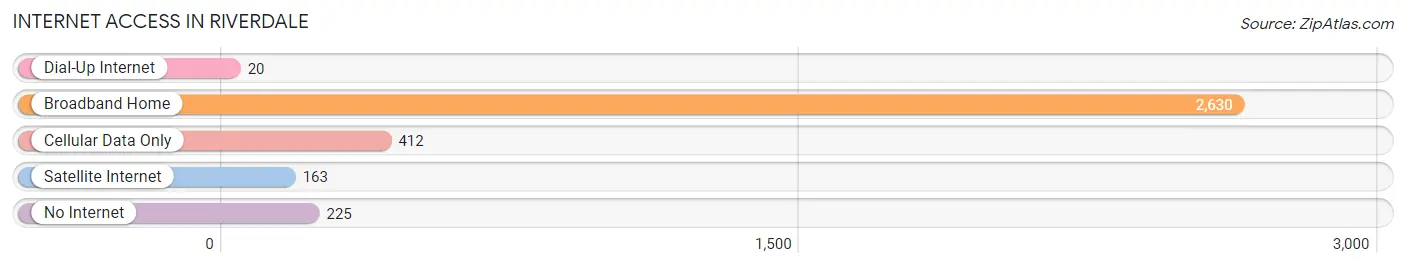
| Internet Type | # Households | % Households |
| Dial-Up Internet | 20 | 0.6% |
| Broadband Home | 2,630 | 77.7% |
| Cellular Data Only | 412 | 12.2% |
| Satellite Internet | 163 | 4.8% |
| No Internet | 225 | 6.7% |
| Total | 3,383 | 100.0% |
Riverdale Summary
Riverdale is a city located in Weber County, Utah, United States. It is part of the Ogden-Clearfield, Utah Metropolitan Statistical Area. The population was 8,427 at the 2010 census, making it the fourth-largest city in Weber County.
History
The area that is now Riverdale was first settled in 1848 by a group of Mormon pioneers led by John Taylor. The area was originally known as Taylor’s Fort, and was later renamed Riverdale in 1877. The name was chosen to reflect the nearby Ogden River.
Riverdale was officially incorporated as a city in 1938. The city was originally a farming community, but has since grown to become a bedroom community for the nearby cities of Ogden and Salt Lake City.
Geography
Riverdale is located in northern Weber County, at the intersection of Interstate 15 and Interstate 84. It is bordered to the north by the city of South Ogden, to the east by the city of Ogden, to the south by the city of Roy, and to the west by the city of Clearfield.
The city has a total area of 4.2 square miles, all of which is land. The city is located at an elevation of 4,400 feet above sea level.
Economy
The economy of Riverdale is largely based on retail and services. The city is home to several large shopping centers, including Riverdale Shopping Center, Riverdale Towne Center, and Riverdale Plaza.
The city is also home to several large employers, including the Ogden Regional Medical Center, the Ogden Clinic, and the Ogden-Weber Applied Technology College.
Demographics
As of the 2010 census, there were 8,427 people, 2,845 households, and 2,092 families residing in the city. The population density was 2,006.2 people per square mile. The racial makeup of the city was 87.2% White, 1.3% African American, 0.7% Native American, 2.2% Asian, 0.2% Pacific Islander, 5.3% from other races, and 3.2% from two or more races. Hispanic or Latino of any race were 11.3% of the population.
The median income for a household in the city was $50,945, and the median income for a family was $58,945. The per capita income for the city was $21,945. About 6.2% of families and 8.2% of the population were below the poverty line, including 10.2% of those under age 18 and 5.2% of those age 65 or over.
Common Questions
What is the Total Population of Riverdale?
Total Population of Riverdale is 9,313.
What is the Total Male Population of Riverdale?
Total Male Population of Riverdale is 4,582.
What is the Total Female Population of Riverdale?
Total Female Population of Riverdale is 4,731.
What is the Ratio of Males per 100 Females in Riverdale?
There are 96.85 Males per 100 Females in Riverdale.
What is the Ratio of Females per 100 Males in Riverdale?
There are 103.25 Females per 100 Males in Riverdale.
What is the Median Population Age in Riverdale?
Median Population Age in Riverdale is 30.8 Years.
What is the Average Family Size in Riverdale
Average Family Size in Riverdale is 3.3 People.
What is the Average Household Size in Riverdale
Average Household Size in Riverdale is 2.8 People.
What is Per Capita Income in Riverdale?
Per Capita income in Riverdale is $30,869.
What is the Median Family Income in Riverdale?
Median Family Income in Riverdale is $81,548.
What is the Median Household income in Riverdale?
Median Household Income in Riverdale is $73,642.
What is Income or Wage Gap in Riverdale?
Income or Wage Gap in Riverdale is 43.4%.
Women in Riverdale earn 56.6 cents for every dollar earned by a man.
What is Family Income Deficit in Riverdale?
Family Income Deficit in Riverdale is $11,989.
Families that are below poverty line in Riverdale earn $11,989 less on average than the poverty threshold level.
What is Inequality or Gini Index in Riverdale?
Inequality or Gini Index in Riverdale is 0.37.
How Large is the Labor Force in Riverdale?
There are 4,686 People in the Labor Forcein in Riverdale.
What is the Percentage of People in the Labor Force in Riverdale?
67.8% of People are in the Labor Force in Riverdale.
What is the Unemployment Rate in Riverdale?
Unemployment Rate in Riverdale is 4.4%.