Valley City, ND
Valley City Map
Valley City Overview
6,558
TOTAL POPULATION
3,299
MALE POPULATION
3,259
FEMALE POPULATION
101.23
MALES / 100 FEMALES
98.79
FEMALES / 100 MALES
39.1
MEDIAN AGE
3.0
AVG FAMILY SIZE
2.0
AVG HOUSEHOLD SIZE
$33,714
PER CAPITA INCOME
$87,931
AVG FAMILY INCOME
$52,224
AVG HOUSEHOLD INCOME
36.8%
WAGE / INCOME GAP [ % ]
63.2¢/ $1
WAGE / INCOME GAP [ $ ]
$7,227
FAMILY INCOME DEFICIT
0.46
INEQUALITY / GINI INDEX
3,408
LABOR FORCE [ PEOPLE ]
63.9%
PERCENT IN LABOR FORCE
4.0%
UNEMPLOYMENT RATE
Valley City Zip Codes
Valley City Area Codes
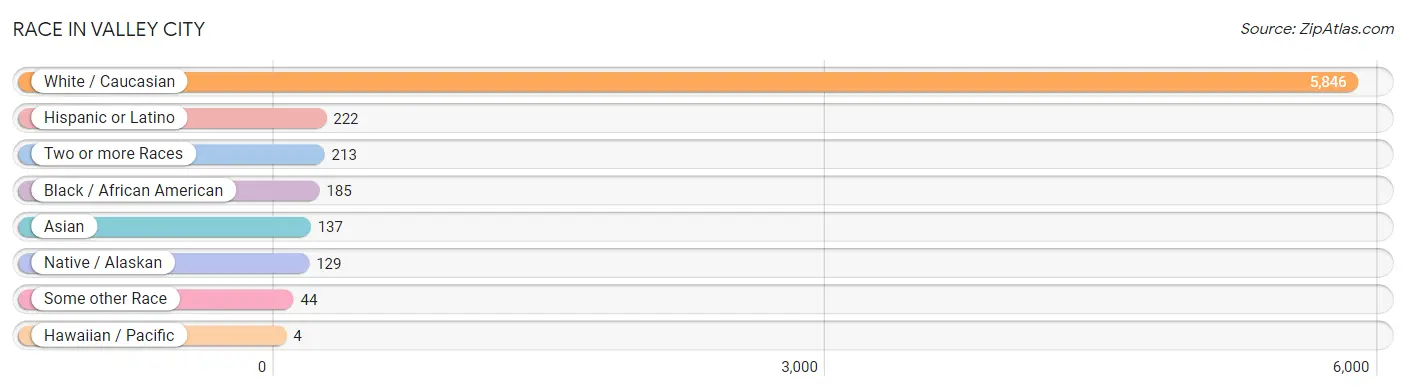
Race in Valley City
The most populous races in Valley City are White / Caucasian (5,846 | 89.1%), Hispanic or Latino (222 | 3.4%), and Two or more Races (213 | 3.3%).
| Race | # Population | % Population |
| Asian | 137 | 2.1% |
| Black / African American | 185 | 2.8% |
| Hawaiian / Pacific | 4 | 0.1% |
| Hispanic or Latino | 222 | 3.4% |
| Native / Alaskan | 129 | 2.0% |
| White / Caucasian | 5,846 | 89.1% |
| Two or more Races | 213 | 3.3% |
| Some other Race | 44 | 0.7% |
| Total | 6,558 | 100.0% |
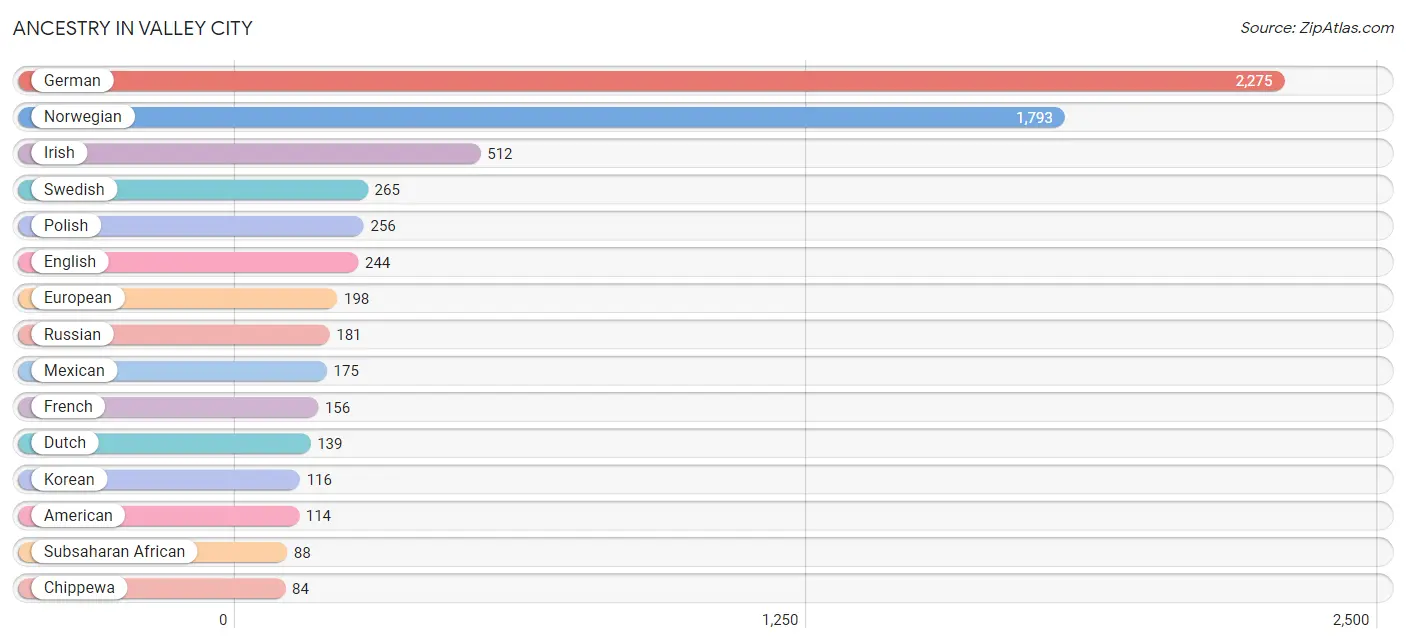
Ancestry in Valley City
The most populous ancestries reported in Valley City are German (2,275 | 34.7%), Norwegian (1,793 | 27.3%), Irish (512 | 7.8%), Swedish (265 | 4.0%), and Polish (256 | 3.9%), together accounting for 77.8% of all Valley City residents.
| Ancestry | # Population | % Population |
| African | 57 | 0.9% |
| American | 114 | 1.7% |
| Australian | 28 | 0.4% |
| Austrian | 3 | 0.1% |
| Belgian | 11 | 0.2% |
| Bermudan | 5 | 0.1% |
| Bhutanese | 11 | 0.2% |
| British | 7 | 0.1% |
| Bulgarian | 6 | 0.1% |
| Burmese | 8 | 0.1% |
| Cherokee | 18 | 0.3% |
| Chinese | 1 | 0.0% |
| Chippewa | 84 | 1.3% |
| Cuban | 16 | 0.2% |
| Czech | 55 | 0.8% |
| Czechoslovakian | 7 | 0.1% |
| Danish | 68 | 1.0% |
| Dominican | 3 | 0.1% |
| Dutch | 139 | 2.1% |
| Eastern European | 26 | 0.4% |
| English | 244 | 3.7% |
| European | 198 | 3.0% |
| Finnish | 7 | 0.1% |
| French | 156 | 2.4% |
| French Canadian | 70 | 1.1% |
| German | 2,275 | 34.7% |
| German Russian | 9 | 0.1% |
| Greek | 7 | 0.1% |
| Haitian | 18 | 0.3% |
| Hungarian | 11 | 0.2% |
| Irish | 512 | 7.8% |
| Italian | 78 | 1.2% |
| Jamaican | 5 | 0.1% |
| Korean | 116 | 1.8% |
| Luxembourger | 7 | 0.1% |
| Mexican | 175 | 2.7% |
| Norwegian | 1,793 | 27.3% |
| Polish | 256 | 3.9% |
| Puerto Rican | 25 | 0.4% |
| Russian | 181 | 2.8% |
| Samoan | 4 | 0.1% |
| Scandinavian | 46 | 0.7% |
| Scotch-Irish | 16 | 0.2% |
| Scottish | 20 | 0.3% |
| Sioux | 28 | 0.4% |
| Subsaharan African | 88 | 1.3% |
| Swedish | 265 | 4.0% |
| Swiss | 26 | 0.4% |
| Ukrainian | 51 | 0.8% |
| Welsh | 11 | 0.2% |
| Zimbabwean | 31 | 0.5% | View All 51 Rows |
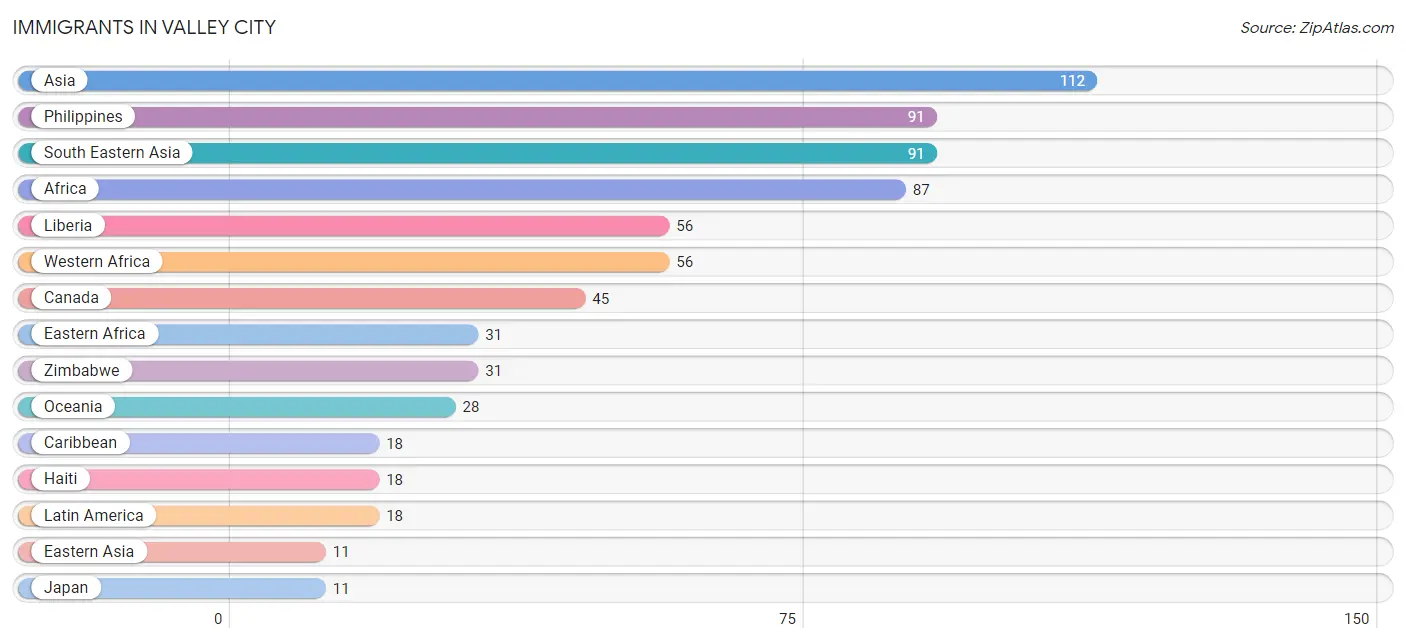
Immigrants in Valley City
The most numerous immigrant groups reported in Valley City came from Asia (112 | 1.7%), Philippines (91 | 1.4%), South Eastern Asia (91 | 1.4%), Africa (87 | 1.3%), and Liberia (56 | 0.9%), together accounting for 6.7% of all Valley City residents.
| Immigration Origin | # Population | % Population |
| Africa | 87 | 1.3% |
| Asia | 112 | 1.7% |
| Canada | 45 | 0.7% |
| Caribbean | 18 | 0.3% |
| Eastern Africa | 31 | 0.5% |
| Eastern Asia | 11 | 0.2% |
| Haiti | 18 | 0.3% |
| Japan | 11 | 0.2% |
| Latin America | 18 | 0.3% |
| Liberia | 56 | 0.9% |
| Oceania | 28 | 0.4% |
| Philippines | 91 | 1.4% |
| South Central Asia | 10 | 0.2% |
| South Eastern Asia | 91 | 1.4% |
| Sri Lanka | 10 | 0.2% |
| Western Africa | 56 | 0.9% |
| Zimbabwe | 31 | 0.5% | View All 17 Rows |
Sex and Age in Valley City
Sex and Age in Valley City
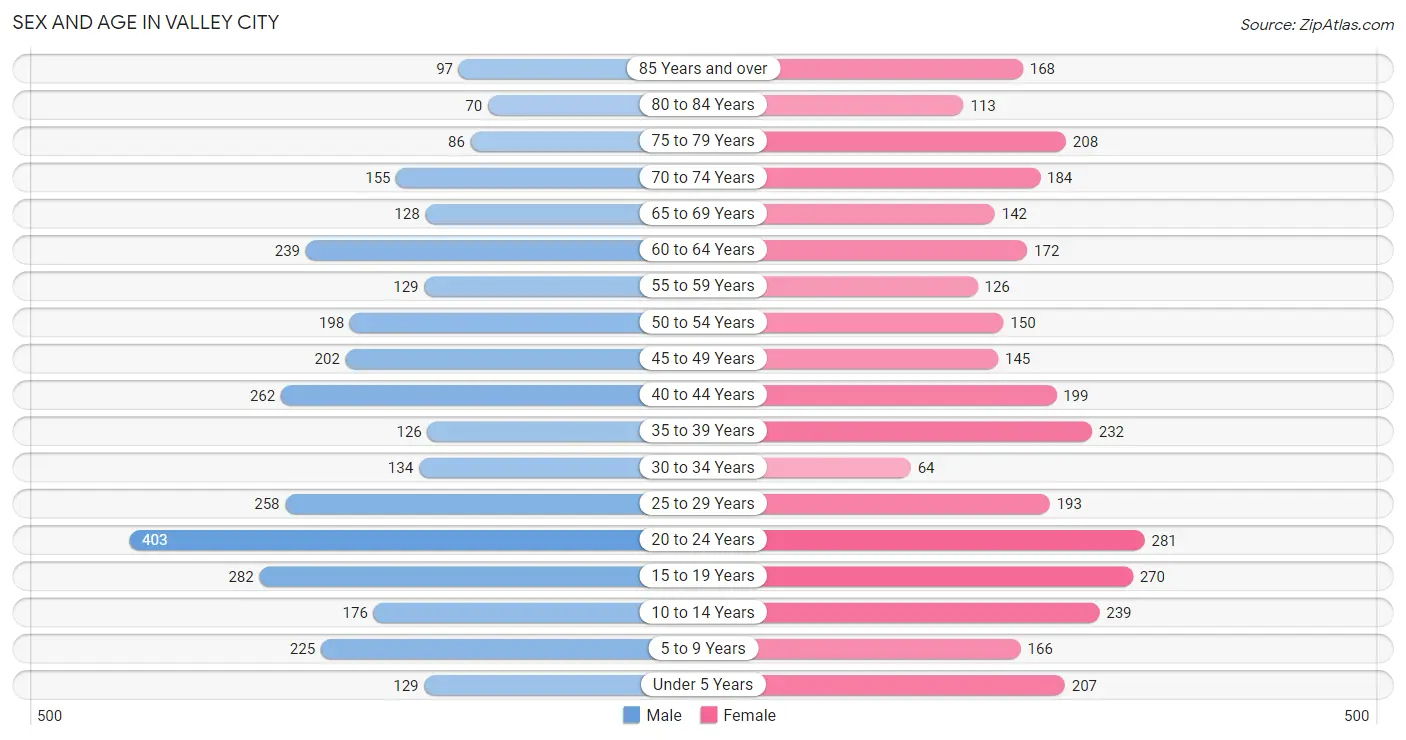
The most populous age groups in Valley City are 20 to 24 Years (403 | 12.2%) for men and 20 to 24 Years (281 | 8.6%) for women.
| Age Bracket | Male | Female |
| Under 5 Years | 129 (3.9%) | 207 (6.4%) |
| 5 to 9 Years | 225 (6.8%) | 166 (5.1%) |
| 10 to 14 Years | 176 (5.3%) | 239 (7.3%) |
| 15 to 19 Years | 282 (8.6%) | 270 (8.3%) |
| 20 to 24 Years | 403 (12.2%) | 281 (8.6%) |
| 25 to 29 Years | 258 (7.8%) | 193 (5.9%) |
| 30 to 34 Years | 134 (4.1%) | 64 (2.0%) |
| 35 to 39 Years | 126 (3.8%) | 232 (7.1%) |
| 40 to 44 Years | 262 (7.9%) | 199 (6.1%) |
| 45 to 49 Years | 202 (6.1%) | 145 (4.4%) |
| 50 to 54 Years | 198 (6.0%) | 150 (4.6%) |
| 55 to 59 Years | 129 (3.9%) | 126 (3.9%) |
| 60 to 64 Years | 239 (7.2%) | 172 (5.3%) |
| 65 to 69 Years | 128 (3.9%) | 142 (4.4%) |
| 70 to 74 Years | 155 (4.7%) | 184 (5.7%) |
| 75 to 79 Years | 86 (2.6%) | 208 (6.4%) |
| 80 to 84 Years | 70 (2.1%) | 113 (3.5%) |
| 85 Years and over | 97 (2.9%) | 168 (5.1%) |
| Total | 3,299 (100.0%) | 3,259 (100.0%) |
Families and Households in Valley City
Median Family Size in Valley City
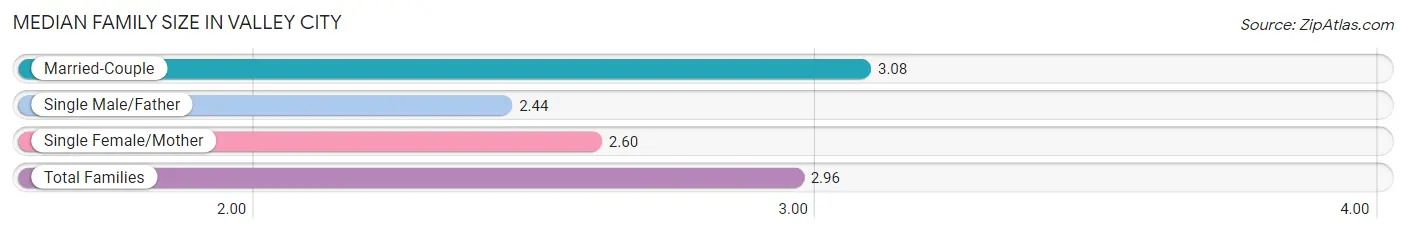
The median family size in Valley City is 2.96 persons per family, with married-couple families (1,036 | 76.5%) accounting for the largest median family size of 3.08 persons per family. On the other hand, single male/father families (73 | 5.4%) represent the smallest median family size with 2.44 persons per family.
| Family Type | # Families | Family Size |
| Married-Couple | 1,036 (76.5%) | 3.08 |
| Single Male/Father | 73 (5.4%) | 2.44 |
| Single Female/Mother | 245 (18.1%) | 2.60 |
| Total Families | 1,354 (100.0%) | 2.96 |
Median Household Size in Valley City
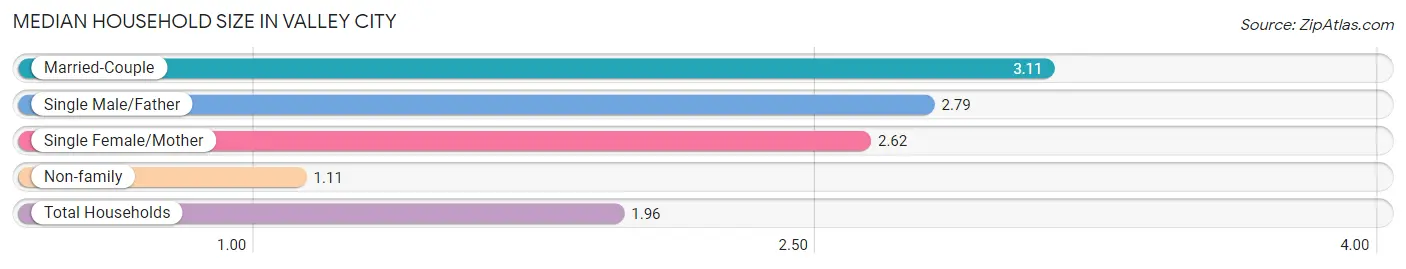
The median household size in Valley City is 1.96 persons per household, with married-couple households (1,036 | 34.1%) accounting for the largest median household size of 3.11 persons per household. non-family households (1,685 | 55.4%) represent the smallest median household size with 1.11 persons per household.
| Household Type | # Households | Household Size |
| Married-Couple | 1,036 (34.1%) | 3.11 |
| Single Male/Father | 73 (2.4%) | 2.79 |
| Single Female/Mother | 245 (8.1%) | 2.62 |
| Non-family | 1,685 (55.4%) | 1.11 |
| Total Households | 3,039 (100.0%) | 1.96 |
Household Size by Marriage Status in Valley City
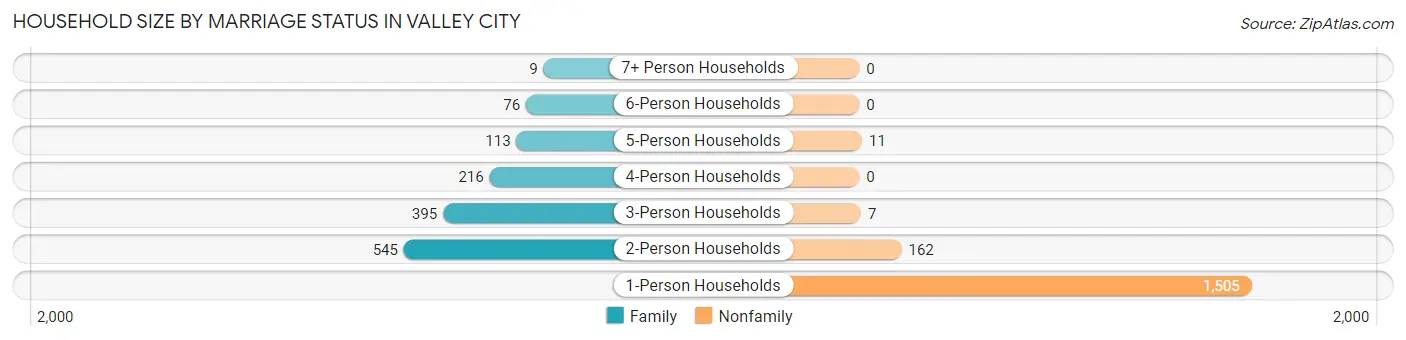
Out of a total of 3,039 households in Valley City, 1,354 (44.6%) are family households, while 1,685 (55.4%) are nonfamily households. The most numerous type of family households are 2-person households, comprising 545, and the most common type of nonfamily households are 1-person households, comprising 1,505.
| Household Size | Family Households | Nonfamily Households |
| 1-Person Households | - | 1,505 (49.5%) |
| 2-Person Households | 545 (17.9%) | 162 (5.3%) |
| 3-Person Households | 395 (13.0%) | 7 (0.2%) |
| 4-Person Households | 216 (7.1%) | 0 (0.0%) |
| 5-Person Households | 113 (3.7%) | 11 (0.4%) |
| 6-Person Households | 76 (2.5%) | 0 (0.0%) |
| 7+ Person Households | 9 (0.3%) | 0 (0.0%) |
| Total | 1,354 (44.6%) | 1,685 (55.4%) |
Female Fertility in Valley City
Fertility by Age in Valley City
Average fertility rate in Valley City is 12.0 births per 1,000 women. Women in the age bracket of 20 to 34 years have the highest fertility rate with 20.0 births per 1,000 women. Women in the age bracket of 20 to 34 years acount for 64.7% of all women with births.
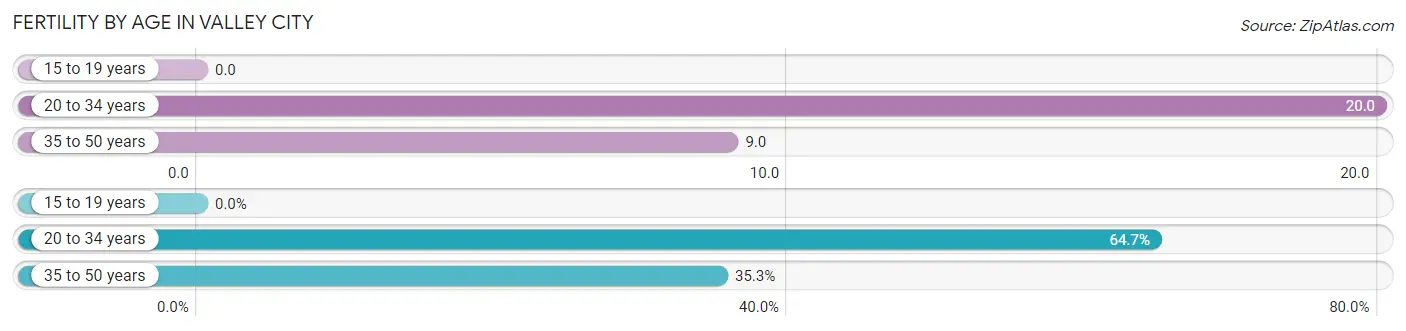
| Age Bracket | Women with Births | Births / 1,000 Women |
| 15 to 19 years | 0 (0.0%) | 0.0 |
| 20 to 34 years | 11 (64.7%) | 20.0 |
| 35 to 50 years | 6 (35.3%) | 9.0 |
| Total | 17 (100.0%) | 12.0 |
Fertility by Age by Marriage Status in Valley City
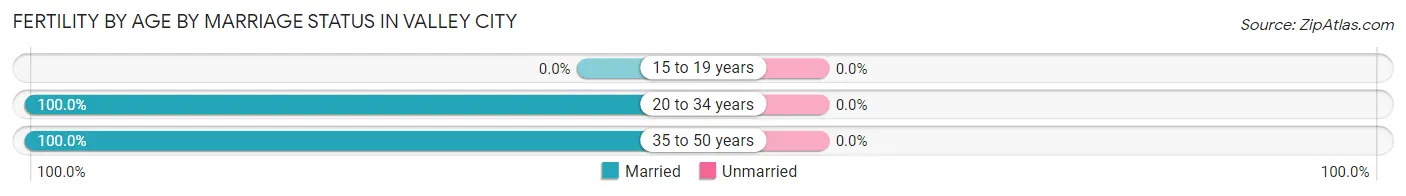
| Age Bracket | Married | Unmarried |
| 15 to 19 years | 0 (0.0%) | 0 (0.0%) |
| 20 to 34 years | 11 (100.0%) | 0 (0.0%) |
| 35 to 50 years | 6 (100.0%) | 0 (0.0%) |
| Total | 17 (100.0%) | 0 (0.0%) |
Fertility by Education in Valley City
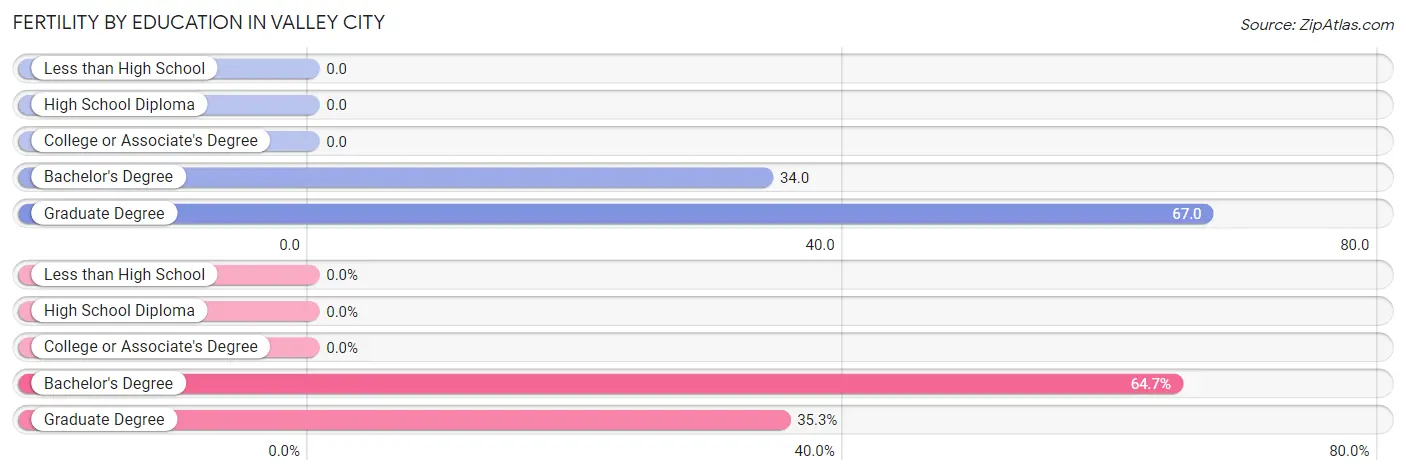
| Educational Attainment | Women with Births | Births / 1,000 Women |
| Less than High School | 0 (0.0%) | 0.0 |
| High School Diploma | 0 (0.0%) | 0.0 |
| College or Associate's Degree | 0 (0.0%) | 0.0 |
| Bachelor's Degree | 11 (64.7%) | 34.0 |
| Graduate Degree | 6 (35.3%) | 67.0 |
| Total | 17 (100.0%) | 12.0 |
Fertility by Education by Marriage Status in Valley City
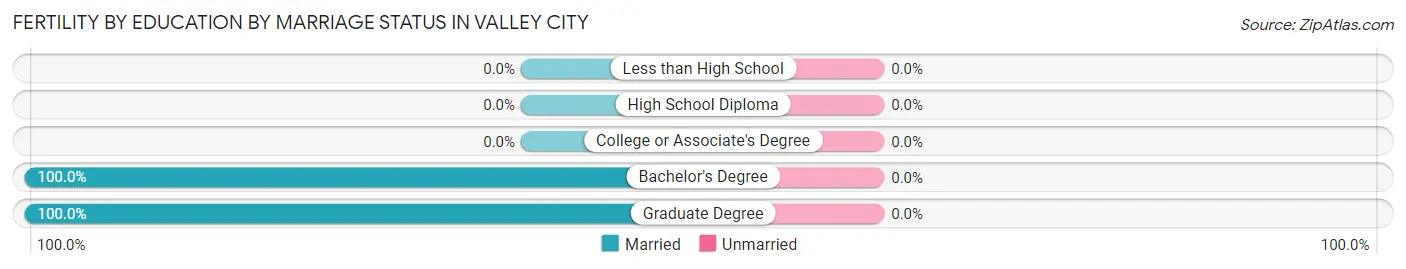
| Educational Attainment | Married | Unmarried |
| Less than High School | 0 (0.0%) | 0 (0.0%) |
| High School Diploma | 0 (0.0%) | 0 (0.0%) |
| College or Associate's Degree | 0 (0.0%) | 0 (0.0%) |
| Bachelor's Degree | 11 (100.0%) | 0 (0.0%) |
| Graduate Degree | 6 (100.0%) | 0 (0.0%) |
| Total | 17 (100.0%) | 0 (0.0%) |
Income in Valley City
Income Overview in Valley City
Per Capita Income in Valley City is $33,714, while median incomes of families and households are $87,931 and $52,224 respectively.
| Characteristic | Number | Measure |
| Per Capita Income | 6,558 | $33,714 |
| Median Family Income | 1,354 | $87,931 |
| Mean Family Income | 1,354 | $105,044 |
| Median Household Income | 3,039 | $52,224 |
| Mean Household Income | 3,039 | $72,238 |
| Income Deficit | 1,354 | $7,227 |
| Wage / Income Gap (%) | 6,558 | 36.80% |
| Wage / Income Gap ($) | 6,558 | 63.20¢ per $1 |
| Gini / Inequality Index | 6,558 | 0.46 |
Earnings by Sex in Valley City
Average Earnings in Valley City are $37,604, $41,699 for men and $26,354 for women, a difference of 36.8%.
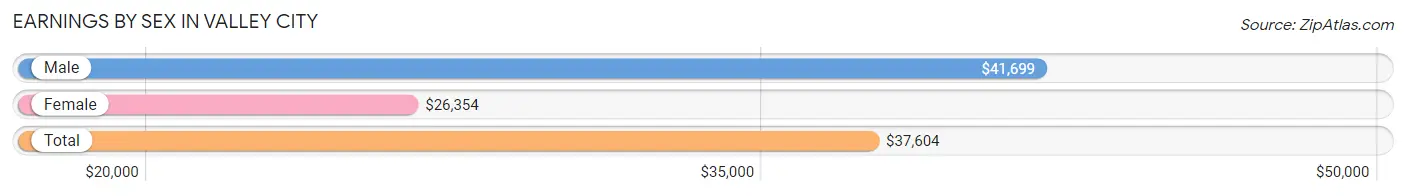
| Sex | Number | Average Earnings |
| Male | 2,043 (54.0%) | $41,699 |
| Female | 1,742 (46.0%) | $26,354 |
| Total | 3,785 (100.0%) | $37,604 |
Earnings by Sex by Income Bracket in Valley City
The most common earnings brackets in Valley City are $100,000+ for men (280 | 13.7%) and $2,499 or less for women (238 | 13.7%).
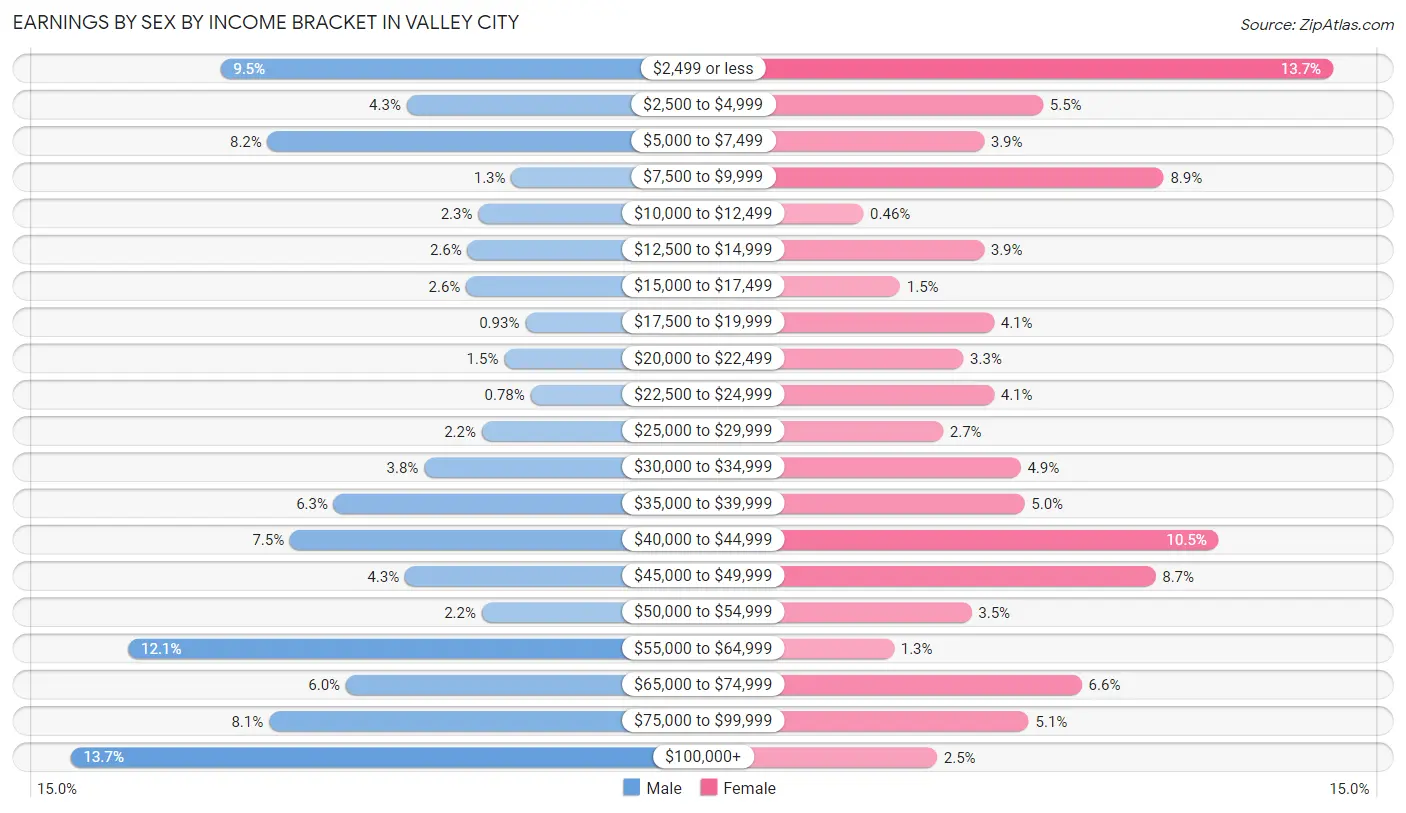
| Income | Male | Female |
| $2,499 or less | 194 (9.5%) | 238 (13.7%) |
| $2,500 to $4,999 | 87 (4.3%) | 96 (5.5%) |
| $5,000 to $7,499 | 167 (8.2%) | 67 (3.8%) |
| $7,500 to $9,999 | 27 (1.3%) | 155 (8.9%) |
| $10,000 to $12,499 | 46 (2.2%) | 8 (0.5%) |
| $12,500 to $14,999 | 52 (2.5%) | 67 (3.8%) |
| $15,000 to $17,499 | 53 (2.6%) | 26 (1.5%) |
| $17,500 to $19,999 | 19 (0.9%) | 72 (4.1%) |
| $20,000 to $22,499 | 31 (1.5%) | 57 (3.3%) |
| $22,500 to $24,999 | 16 (0.8%) | 72 (4.1%) |
| $25,000 to $29,999 | 44 (2.1%) | 47 (2.7%) |
| $30,000 to $34,999 | 77 (3.8%) | 85 (4.9%) |
| $35,000 to $39,999 | 129 (6.3%) | 87 (5.0%) |
| $40,000 to $44,999 | 154 (7.5%) | 182 (10.4%) |
| $45,000 to $49,999 | 88 (4.3%) | 151 (8.7%) |
| $50,000 to $54,999 | 44 (2.1%) | 61 (3.5%) |
| $55,000 to $64,999 | 247 (12.1%) | 23 (1.3%) |
| $65,000 to $74,999 | 122 (6.0%) | 115 (6.6%) |
| $75,000 to $99,999 | 166 (8.1%) | 89 (5.1%) |
| $100,000+ | 280 (13.7%) | 44 (2.5%) |
| Total | 2,043 (100.0%) | 1,742 (100.0%) |
Earnings by Sex by Educational Attainment in Valley City
Average earnings in Valley City are $56,727 for men and $40,301 for women, a difference of 29.0%. Men with an educational attainment of graduate degree enjoy the highest average annual earnings of $80,156, while those with high school diploma education earn the least with $40,354. Women with an educational attainment of graduate degree earn the most with the average annual earnings of $69,702, while those with high school diploma education have the smallest earnings of $31,071.
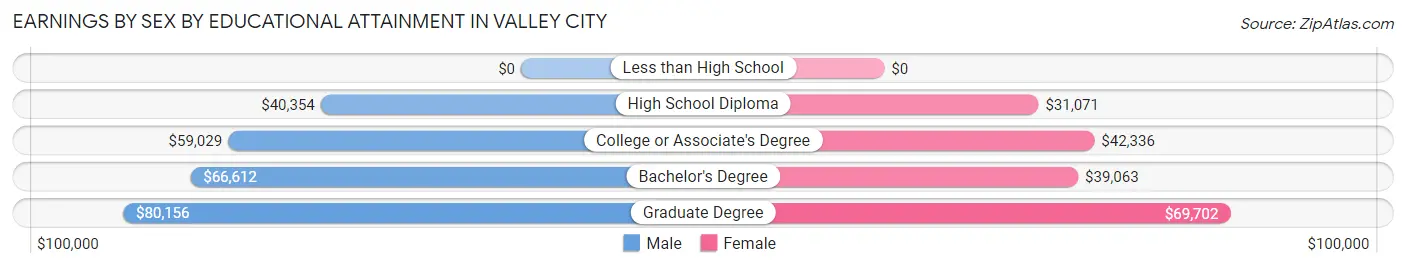
| Educational Attainment | Male Income | Female Income |
| Less than High School | - | - |
| High School Diploma | $40,354 | $31,071 |
| College or Associate's Degree | $59,029 | $42,336 |
| Bachelor's Degree | $66,612 | $39,063 |
| Graduate Degree | $80,156 | $69,702 |
| Total | $56,727 | $40,301 |
Family Income in Valley City
Family Income Brackets in Valley City
According to the Valley City family income data, there are 288 families falling into the $50,000 to $74,999 income range, which is the most common income bracket and makes up 21.3% of all families.
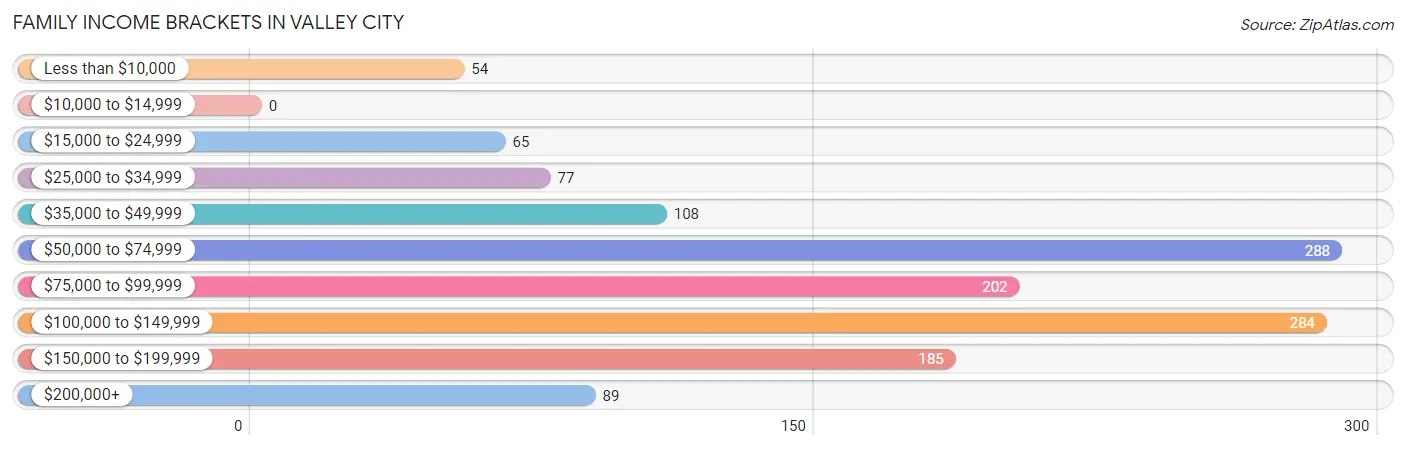
| Income Bracket | # Families | % Families |
| Less than $10,000 | 54 | 4.0% |
| $10,000 to $14,999 | 0 | 0.0% |
| $15,000 to $24,999 | 65 | 4.8% |
| $25,000 to $34,999 | 77 | 5.7% |
| $35,000 to $49,999 | 108 | 8.0% |
| $50,000 to $74,999 | 288 | 21.3% |
| $75,000 to $99,999 | 202 | 14.9% |
| $100,000 to $149,999 | 284 | 21.0% |
| $150,000 to $199,999 | 185 | 13.7% |
| $200,000+ | 89 | 6.6% |
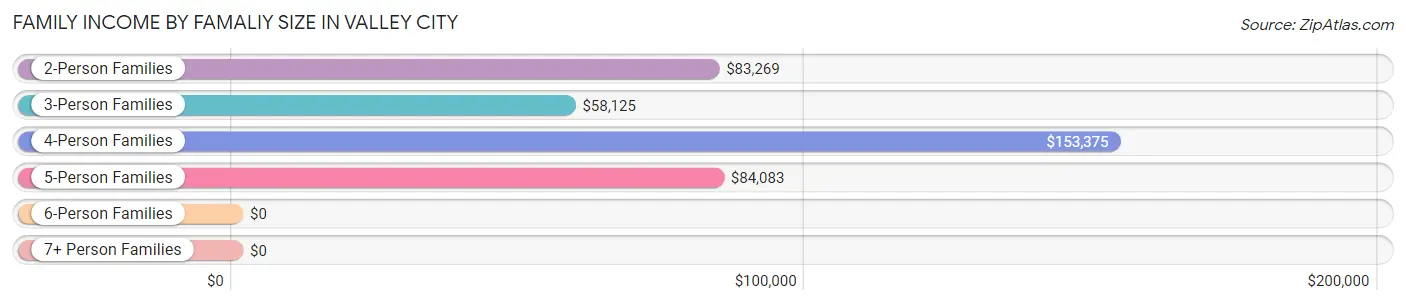
Family Income by Famaliy Size in Valley City
4-person families (216 | 16.0%) account for the highest median family income in Valley City with $153,375 per family, while 2-person families (584 | 43.1%) have the highest median income of $41,634 per family member.
| Income Bracket | # Families | Median Income |
| 2-Person Families | 584 (43.1%) | $83,269 |
| 3-Person Families | 362 (26.7%) | $58,125 |
| 4-Person Families | 216 (16.0%) | $153,375 |
| 5-Person Families | 107 (7.9%) | $84,083 |
| 6-Person Families | 76 (5.6%) | $0 |
| 7+ Person Families | 9 (0.7%) | $0 |
| Total | 1,354 (100.0%) | $87,931 |
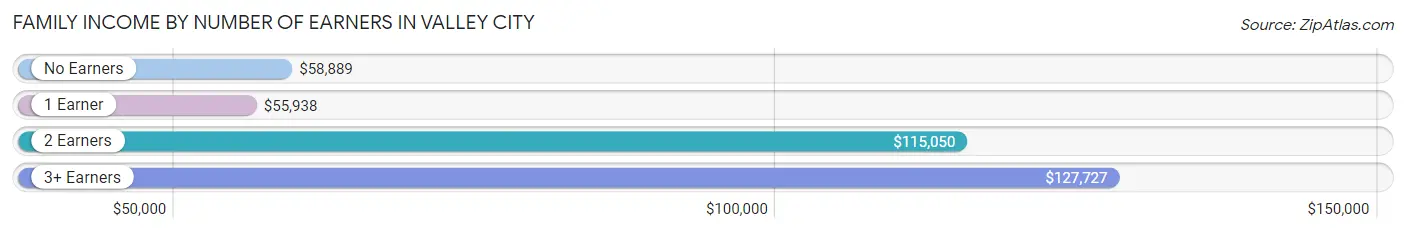
Family Income by Number of Earners in Valley City
The median family income in Valley City is $87,931, with families comprising 3+ earners (234) having the highest median family income of $127,727, while families with 1 earner (379) have the lowest median family income of $55,938, accounting for 17.3% and 28.0% of families, respectively.
| Number of Earners | # Families | Median Income |
| No Earners | 206 (15.2%) | $58,889 |
| 1 Earner | 379 (28.0%) | $55,938 |
| 2 Earners | 535 (39.5%) | $115,050 |
| 3+ Earners | 234 (17.3%) | $127,727 |
| Total | 1,354 (100.0%) | $87,931 |
Household Income in Valley City
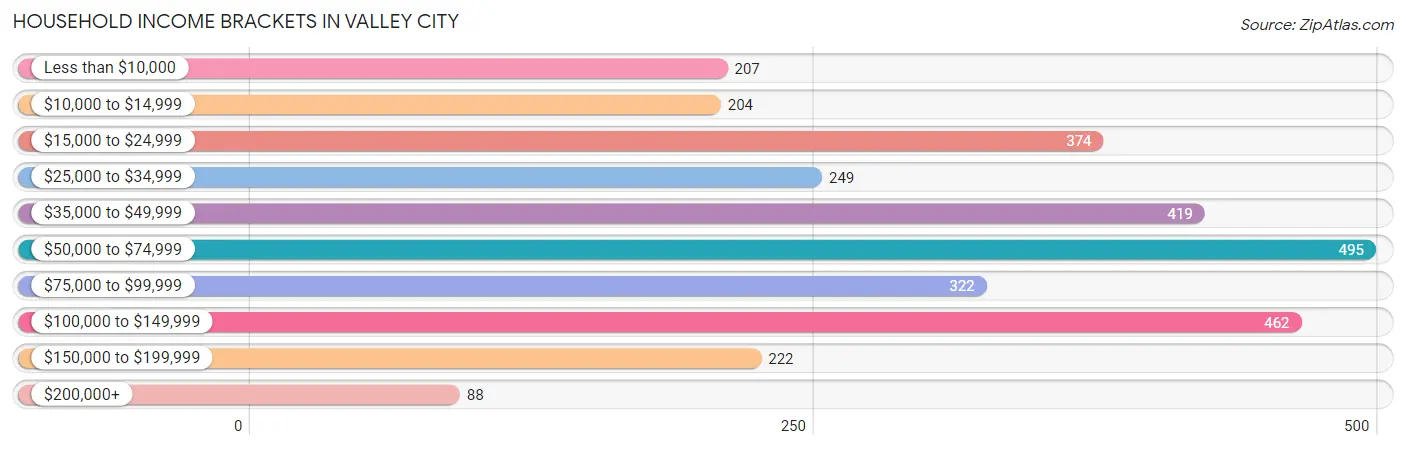
Household Income Brackets in Valley City
With 495 households falling in the category, the $50,000 to $74,999 income range is the most frequent in Valley City, accounting for 16.3% of all households. In contrast, only 88 households (2.9%) fall into the $200,000+ income bracket, making it the least populous group.
| Income Bracket | # Households | % Households |
| Less than $10,000 | 207 | 6.8% |
| $10,000 to $14,999 | 204 | 6.7% |
| $15,000 to $24,999 | 374 | 12.3% |
| $25,000 to $34,999 | 249 | 8.2% |
| $35,000 to $49,999 | 419 | 13.8% |
| $50,000 to $74,999 | 495 | 16.3% |
| $75,000 to $99,999 | 322 | 10.6% |
| $100,000 to $149,999 | 462 | 15.2% |
| $150,000 to $199,999 | 222 | 7.3% |
| $200,000+ | 88 | 2.9% |
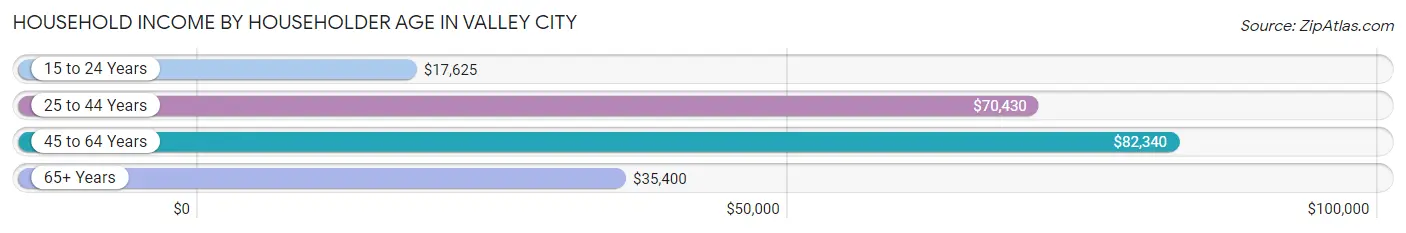
Household Income by Householder Age in Valley City
The median household income in Valley City is $52,224, with the highest median household income of $82,340 found in the 45 to 64 years age bracket for the primary householder. A total of 897 households (29.5%) fall into this category. Meanwhile, the 15 to 24 years age bracket for the primary householder has the lowest median household income of $17,625, with 299 households (9.8%) in this group.
| Income Bracket | # Households | Median Income |
| 15 to 24 Years | 299 (9.8%) | $17,625 |
| 25 to 44 Years | 997 (32.8%) | $70,430 |
| 45 to 64 Years | 897 (29.5%) | $82,340 |
| 65+ Years | 846 (27.8%) | $35,400 |
| Total | 3,039 (100.0%) | $52,224 |
Poverty in Valley City
Income Below Poverty by Sex and Age in Valley City
With 14.3% poverty level for males and 18.5% for females among the residents of Valley City, 15 year old males and 18 to 24 year old females are the most vulnerable to poverty, with 33 males (67.3%) and 155 females (52.2%) in their respective age groups living below the poverty level.
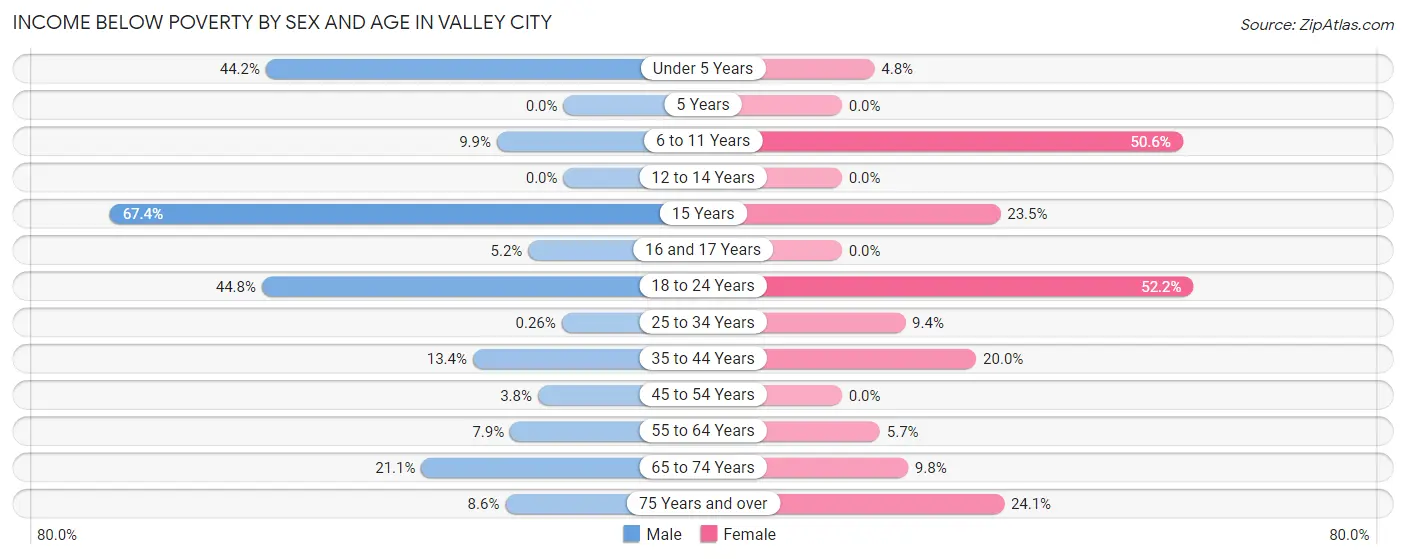
| Age Bracket | Male | Female |
| Under 5 Years | 57 (44.2%) | 10 (4.8%) |
| 5 Years | 0 (0.0%) | 0 (0.0%) |
| 6 to 11 Years | 16 (9.9%) | 125 (50.6%) |
| 12 to 14 Years | 0 (0.0%) | 0 (0.0%) |
| 15 Years | 33 (67.3%) | 8 (23.5%) |
| 16 and 17 Years | 6 (5.2%) | 0 (0.0%) |
| 18 to 24 Years | 150 (44.8%) | 155 (52.2%) |
| 25 to 34 Years | 1 (0.3%) | 24 (9.4%) |
| 35 to 44 Years | 52 (13.4%) | 86 (20.0%) |
| 45 to 54 Years | 15 (3.8%) | 0 (0.0%) |
| 55 to 64 Years | 28 (7.9%) | 16 (5.7%) |
| 65 to 74 Years | 58 (21.1%) | 32 (9.8%) |
| 75 Years and over | 17 (8.6%) | 92 (24.1%) |
| Total | 433 (14.3%) | 548 (18.5%) |
Income Above Poverty by Sex and Age in Valley City
According to the poverty statistics in Valley City, males aged 5 years and females aged 5 years are the age groups that are most secure financially, with 100.0% of males and 100.0% of females in these age groups living above the poverty line.
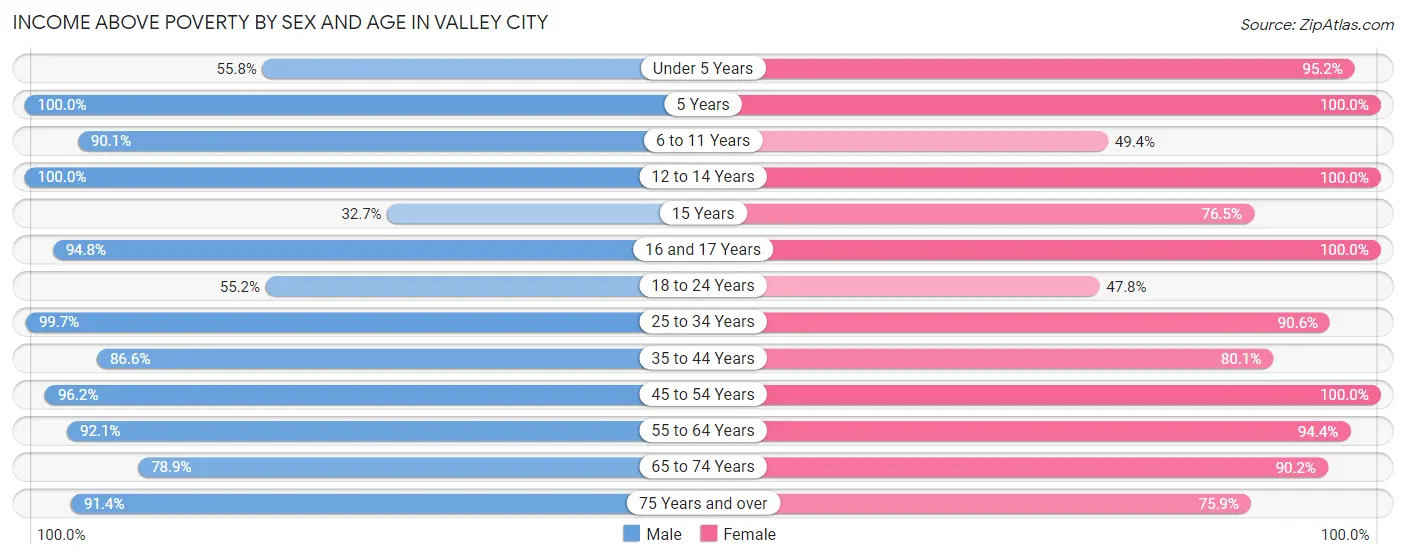
| Age Bracket | Male | Female |
| Under 5 Years | 72 (55.8%) | 197 (95.2%) |
| 5 Years | 110 (100.0%) | 15 (100.0%) |
| 6 to 11 Years | 146 (90.1%) | 122 (49.4%) |
| 12 to 14 Years | 129 (100.0%) | 143 (100.0%) |
| 15 Years | 16 (32.7%) | 26 (76.5%) |
| 16 and 17 Years | 109 (94.8%) | 53 (100.0%) |
| 18 to 24 Years | 185 (55.2%) | 142 (47.8%) |
| 25 to 34 Years | 382 (99.7%) | 231 (90.6%) |
| 35 to 44 Years | 335 (86.6%) | 345 (80.0%) |
| 45 to 54 Years | 381 (96.2%) | 294 (100.0%) |
| 55 to 64 Years | 326 (92.1%) | 267 (94.4%) |
| 65 to 74 Years | 217 (78.9%) | 294 (90.2%) |
| 75 Years and over | 180 (91.4%) | 290 (75.9%) |
| Total | 2,588 (85.7%) | 2,419 (81.5%) |
Income Below Poverty Among Married-Couple Families in Valley City
The poverty statistics for married-couple families in Valley City show that 7.0% or 72 of the total 1,036 families live below the poverty line. Families with 3 or 4 children have the highest poverty rate of 23.0%, comprising of 34 families. On the other hand, families with 5 or more children have the lowest poverty rate of 0.0%, which includes 0 families.
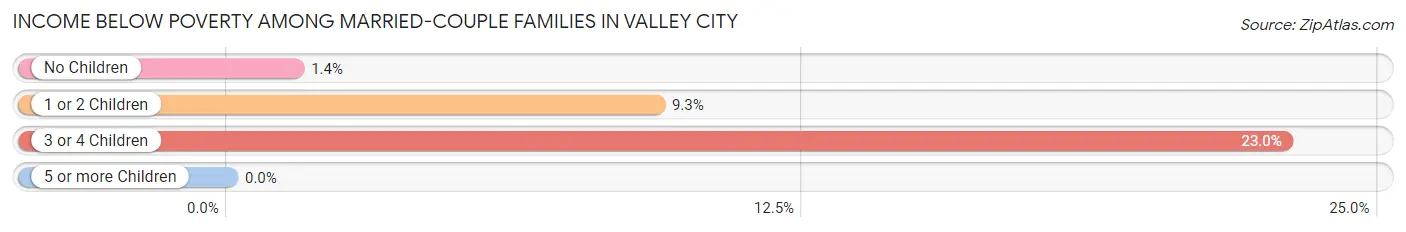
| Children | Above Poverty | Below Poverty |
| No Children | 548 (98.6%) | 8 (1.4%) |
| 1 or 2 Children | 293 (90.7%) | 30 (9.3%) |
| 3 or 4 Children | 114 (77.0%) | 34 (23.0%) |
| 5 or more Children | 9 (100.0%) | 0 (0.0%) |
| Total | 964 (93.0%) | 72 (7.0%) |
Income Below Poverty Among Single-Parent Households in Valley City
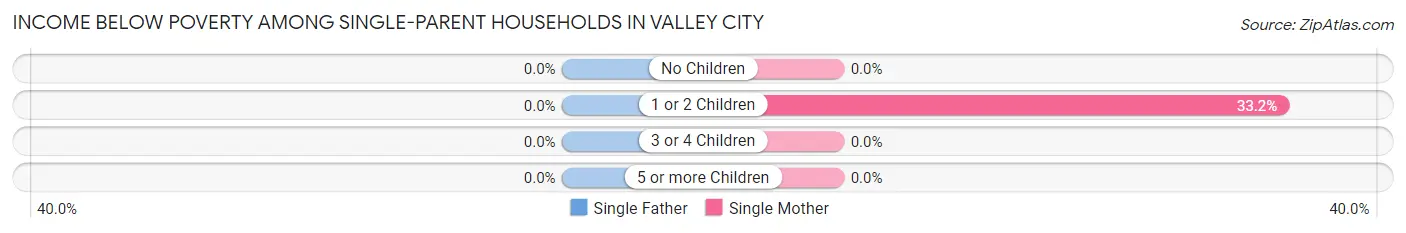
| Children | Single Father | Single Mother |
| No Children | 0 (0.0%) | 0 (0.0%) |
| 1 or 2 Children | 0 (0.0%) | 70 (33.2%) |
| 3 or 4 Children | 0 (0.0%) | 0 (0.0%) |
| 5 or more Children | 0 (0.0%) | 0 (0.0%) |
| Total | 0 (0.0%) | 70 (28.6%) |
Income Below Poverty Among Married-Couple vs Single-Parent Households in Valley City
The poverty data for Valley City shows that 72 of the married-couple family households (7.0%) and 70 of the single-parent households (22.0%) are living below the poverty level. Within the married-couple family households, those with 3 or 4 children have the highest poverty rate, with 34 households (23.0%) falling below the poverty line. Among the single-parent households, those with 1 or 2 children have the highest poverty rate, with 70 household (31.7%) living below poverty.
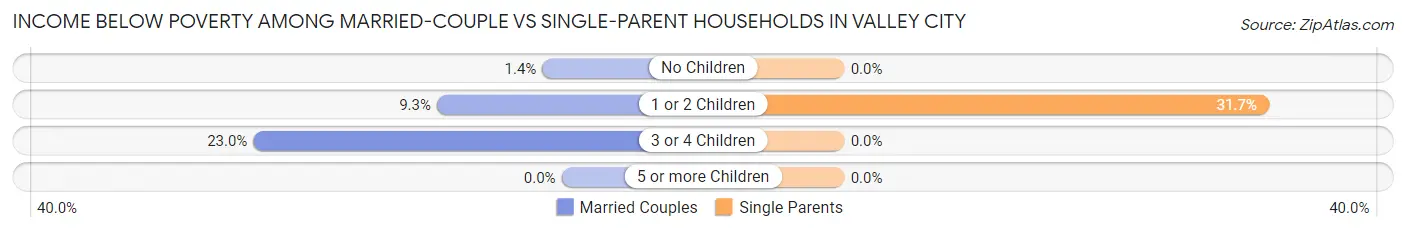
| Children | Married-Couple Families | Single-Parent Households |
| No Children | 8 (1.4%) | 0 (0.0%) |
| 1 or 2 Children | 30 (9.3%) | 70 (31.7%) |
| 3 or 4 Children | 34 (23.0%) | 0 (0.0%) |
| 5 or more Children | 0 (0.0%) | 0 (0.0%) |
| Total | 72 (7.0%) | 70 (22.0%) |
Employment Characteristics in Valley City
Employment by Class of Employer in Valley City
Among the 3,233 employed individuals in Valley City, private company employees (1,937 | 59.9%), local government employees (378 | 11.7%), and not-for-profit organizations (308 | 9.5%) make up the most common classes of employment.
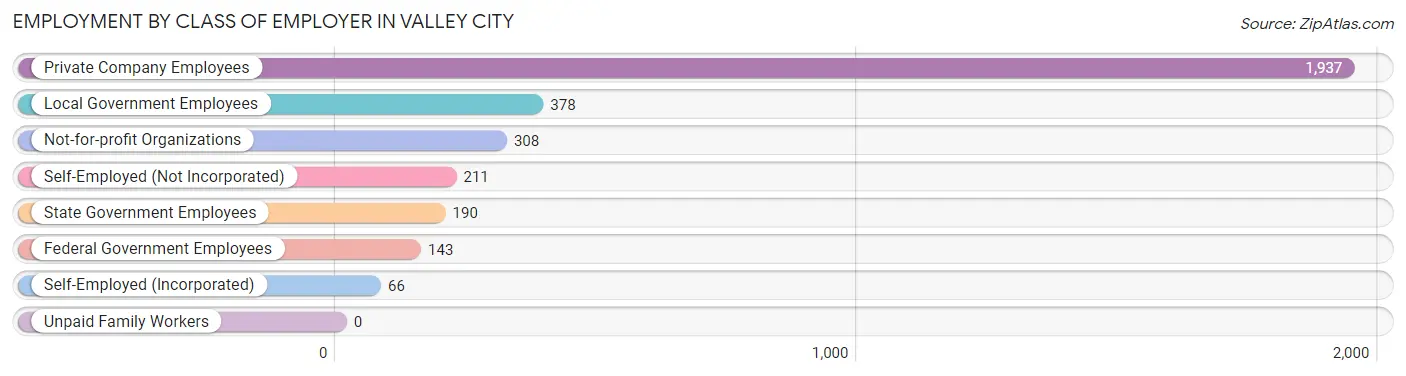
| Employer Class | # Employees | % Employees |
| Private Company Employees | 1,937 | 59.9% |
| Self-Employed (Incorporated) | 66 | 2.0% |
| Self-Employed (Not Incorporated) | 211 | 6.5% |
| Not-for-profit Organizations | 308 | 9.5% |
| Local Government Employees | 378 | 11.7% |
| State Government Employees | 190 | 5.9% |
| Federal Government Employees | 143 | 4.4% |
| Unpaid Family Workers | 0 | 0.0% |
| Total | 3,233 | 100.0% |
Employment Status by Age in Valley City
According to the labor force statistics for Valley City, out of the total population over 16 years of age (5,333), 63.9% or 3,408 individuals are in the labor force, with 4.0% or 136 of them unemployed. The age group with the highest labor force participation rate is 25 to 29 years, with 99.3% or 448 individuals in the labor force. Within the labor force, the 20 to 24 years age range has the highest percentage of unemployed individuals, with 15.3% or 90 of them being unemployed.
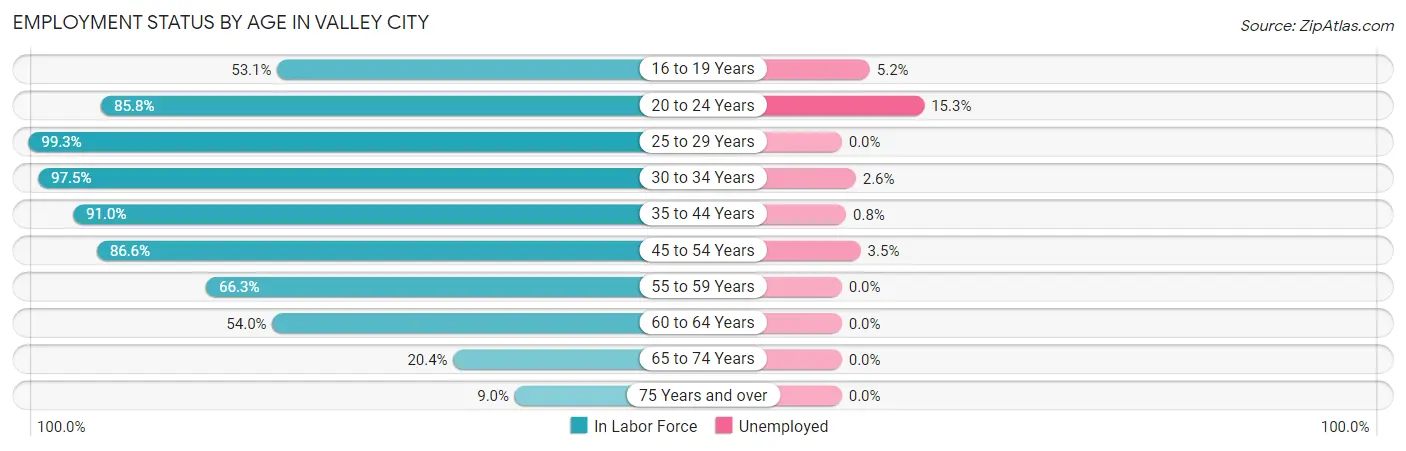
| Age Bracket | In Labor Force | Unemployed |
| 16 to 19 Years | 249 (53.1%) | 13 (5.2%) |
| 20 to 24 Years | 587 (85.8%) | 90 (15.3%) |
| 25 to 29 Years | 448 (99.3%) | 0 (0.0%) |
| 30 to 34 Years | 193 (97.5%) | 5 (2.6%) |
| 35 to 44 Years | 745 (91.0%) | 6 (0.8%) |
| 45 to 54 Years | 602 (86.6%) | 21 (3.5%) |
| 55 to 59 Years | 169 (66.3%) | 0 (0.0%) |
| 60 to 64 Years | 222 (54.0%) | 0 (0.0%) |
| 65 to 74 Years | 124 (20.4%) | 0 (0.0%) |
| 75 Years and over | 67 (9.0%) | 0 (0.0%) |
| Total | 3,408 (63.9%) | 136 (4.0%) |
Employment Status by Educational Attainment in Valley City
According to labor force statistics for Valley City, 84.1% of individuals (2,379) out of the total population between 25 and 64 years of age (2,829) are in the labor force, with 1.3% or 31 of them being unemployed. The group with the highest labor force participation rate are those with the educational attainment of bachelor's degree or higher, with 92.5% or 807 individuals in the labor force. Within the labor force, individuals with college / associate degree education have the highest percentage of unemployment, with 3.1% or 27 of them being unemployed.
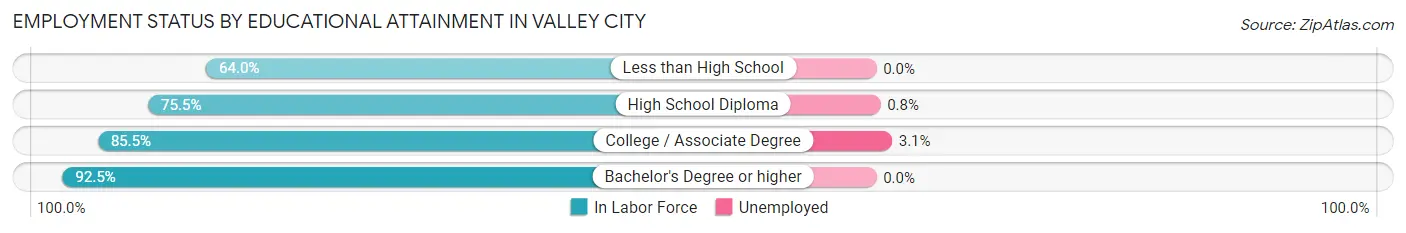
| Educational Attainment | In Labor Force | Unemployed |
| Less than High School | 48 (64.0%) | 0 (0.0%) |
| High School Diploma | 642 (75.5%) | 7 (0.8%) |
| College / Associate Degree | 882 (85.5%) | 32 (3.1%) |
| Bachelor's Degree or higher | 807 (92.5%) | 0 (0.0%) |
| Total | 2,379 (84.1%) | 37 (1.3%) |
Employment Occupations by Sex in Valley City
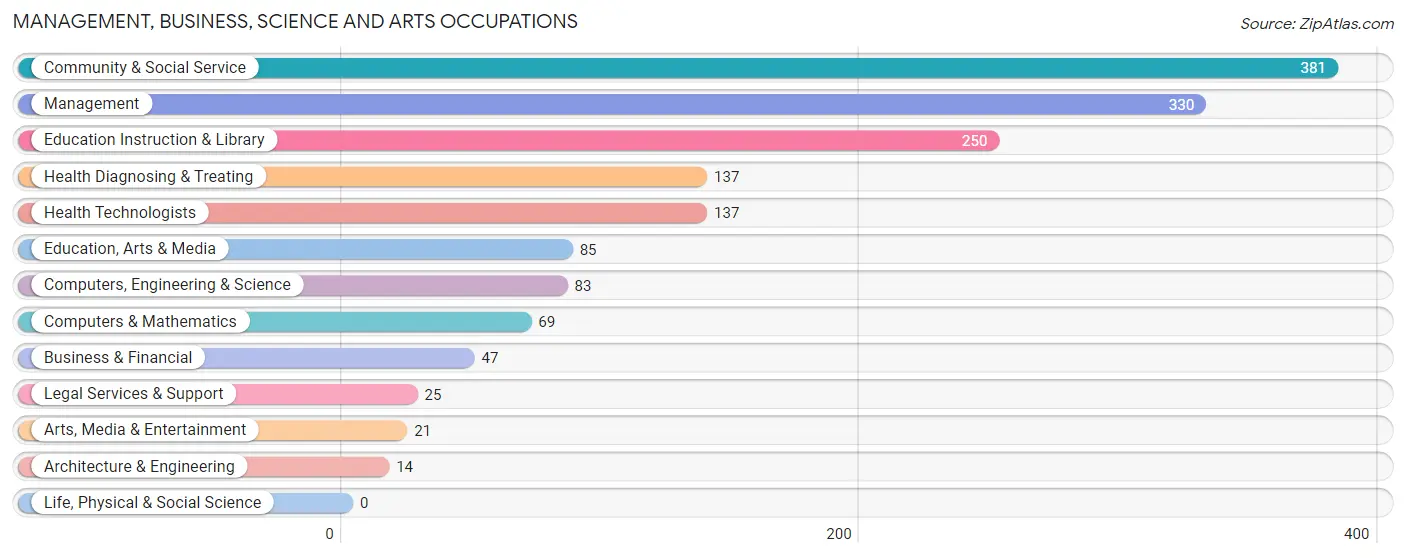
Management, Business, Science and Arts Occupations
The most common Management, Business, Science and Arts occupations in Valley City are Community & Social Service (381 | 11.7%), Management (330 | 10.1%), Education Instruction & Library (250 | 7.6%), Health Diagnosing & Treating (137 | 4.2%), and Health Technologists (137 | 4.2%).
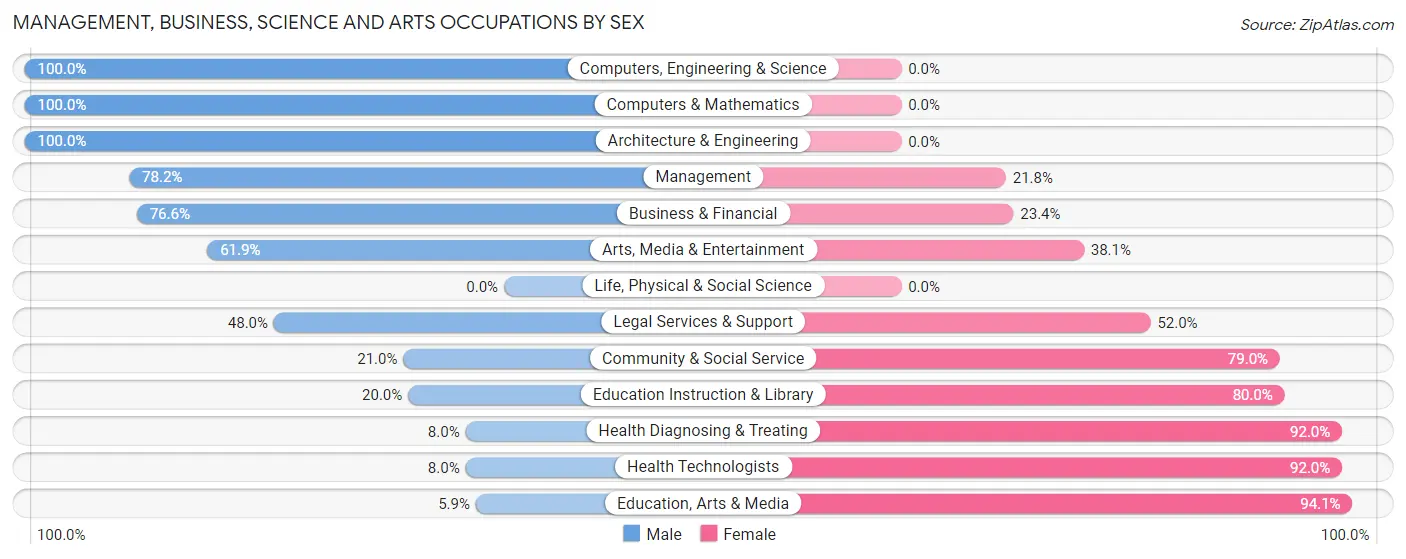
Management, Business, Science and Arts Occupations by Sex
Within the Management, Business, Science and Arts occupations in Valley City, the most male-oriented occupations are Computers, Engineering & Science (100.0%), Computers & Mathematics (100.0%), and Architecture & Engineering (100.0%), while the most female-oriented occupations are Education, Arts & Media (94.1%), Health Diagnosing & Treating (92.0%), and Health Technologists (92.0%).
| Occupation | Male | Female |
| Management | 258 (78.2%) | 72 (21.8%) |
| Business & Financial | 36 (76.6%) | 11 (23.4%) |
| Computers, Engineering & Science | 83 (100.0%) | 0 (0.0%) |
| Computers & Mathematics | 69 (100.0%) | 0 (0.0%) |
| Architecture & Engineering | 14 (100.0%) | 0 (0.0%) |
| Life, Physical & Social Science | 0 (0.0%) | 0 (0.0%) |
| Community & Social Service | 80 (21.0%) | 301 (79.0%) |
| Education, Arts & Media | 5 (5.9%) | 80 (94.1%) |
| Legal Services & Support | 12 (48.0%) | 13 (52.0%) |
| Education Instruction & Library | 50 (20.0%) | 200 (80.0%) |
| Arts, Media & Entertainment | 13 (61.9%) | 8 (38.1%) |
| Health Diagnosing & Treating | 11 (8.0%) | 126 (92.0%) |
| Health Technologists | 11 (8.0%) | 126 (92.0%) |
| Total (Category) | 468 (47.8%) | 510 (52.1%) |
| Total (Overall) | 1,755 (53.6%) | 1,516 (46.4%) |
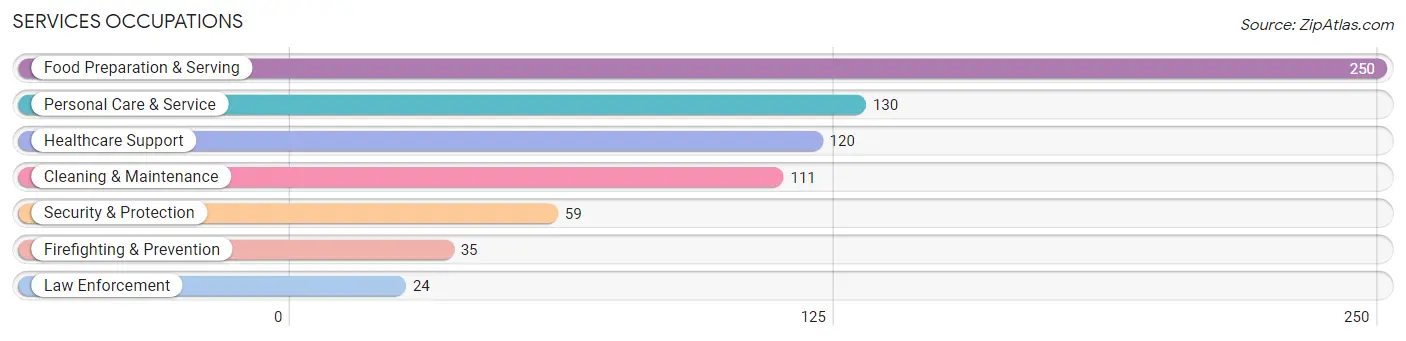
Services Occupations
The most common Services occupations in Valley City are Food Preparation & Serving (250 | 7.6%), Personal Care & Service (130 | 4.0%), Healthcare Support (120 | 3.7%), Cleaning & Maintenance (111 | 3.4%), and Security & Protection (59 | 1.8%).
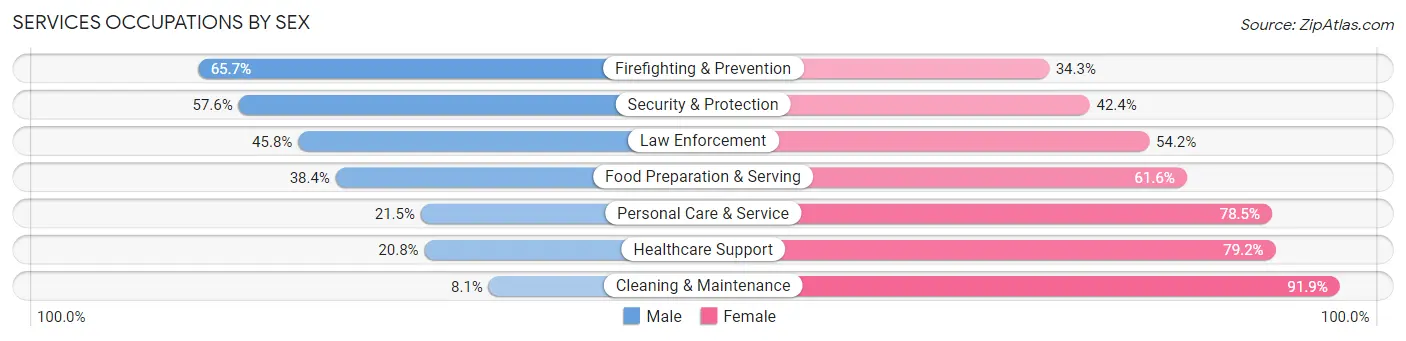
Services Occupations by Sex
Within the Services occupations in Valley City, the most male-oriented occupations are Firefighting & Prevention (65.7%), Security & Protection (57.6%), and Law Enforcement (45.8%), while the most female-oriented occupations are Cleaning & Maintenance (91.9%), Healthcare Support (79.2%), and Personal Care & Service (78.5%).
| Occupation | Male | Female |
| Healthcare Support | 25 (20.8%) | 95 (79.2%) |
| Security & Protection | 34 (57.6%) | 25 (42.4%) |
| Firefighting & Prevention | 23 (65.7%) | 12 (34.3%) |
| Law Enforcement | 11 (45.8%) | 13 (54.2%) |
| Food Preparation & Serving | 96 (38.4%) | 154 (61.6%) |
| Cleaning & Maintenance | 9 (8.1%) | 102 (91.9%) |
| Personal Care & Service | 28 (21.5%) | 102 (78.5%) |
| Total (Category) | 192 (28.7%) | 478 (71.3%) |
| Total (Overall) | 1,755 (53.6%) | 1,516 (46.4%) |
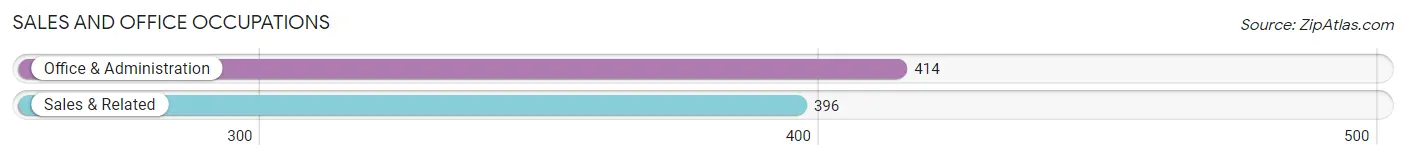
Sales and Office Occupations
The most common Sales and Office occupations in Valley City are Office & Administration (414 | 12.7%), and Sales & Related (396 | 12.1%).
Sales and Office Occupations by Sex
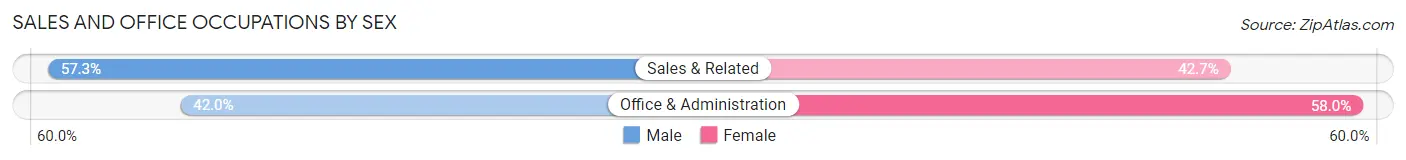
| Occupation | Male | Female |
| Sales & Related | 227 (57.3%) | 169 (42.7%) |
| Office & Administration | 174 (42.0%) | 240 (58.0%) |
| Total (Category) | 401 (49.5%) | 409 (50.5%) |
| Total (Overall) | 1,755 (53.6%) | 1,516 (46.4%) |
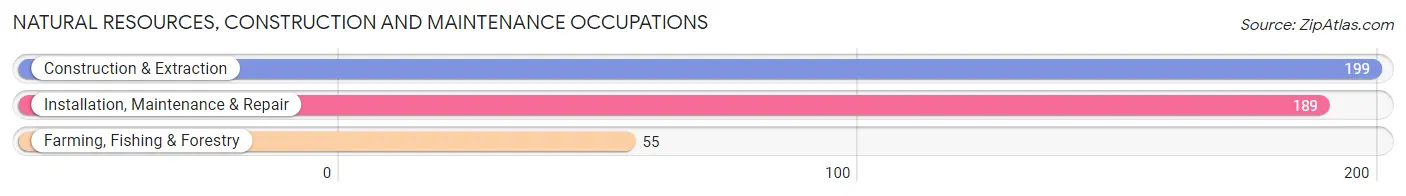
Natural Resources, Construction and Maintenance Occupations
The most common Natural Resources, Construction and Maintenance occupations in Valley City are Construction & Extraction (199 | 6.1%), Installation, Maintenance & Repair (189 | 5.8%), and Farming, Fishing & Forestry (55 | 1.7%).
Natural Resources, Construction and Maintenance Occupations by Sex
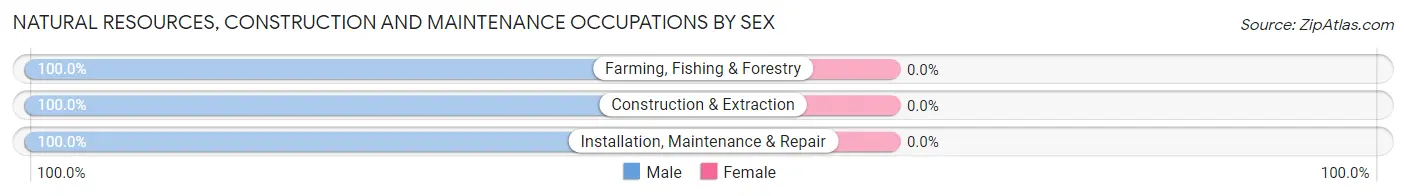
| Occupation | Male | Female |
| Farming, Fishing & Forestry | 55 (100.0%) | 0 (0.0%) |
| Construction & Extraction | 199 (100.0%) | 0 (0.0%) |
| Installation, Maintenance & Repair | 189 (100.0%) | 0 (0.0%) |
| Total (Category) | 443 (100.0%) | 0 (0.0%) |
| Total (Overall) | 1,755 (53.6%) | 1,516 (46.4%) |
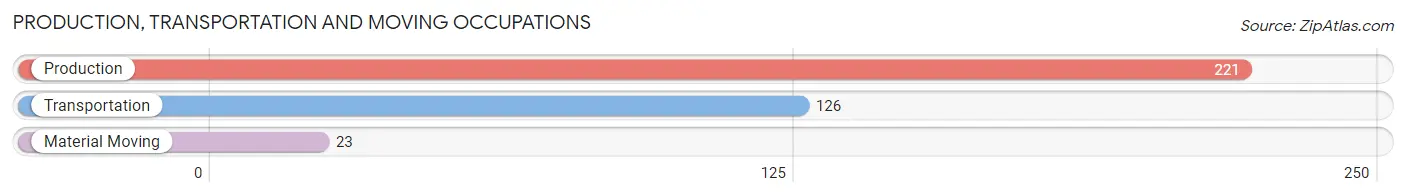
Production, Transportation and Moving Occupations
The most common Production, Transportation and Moving occupations in Valley City are Production (221 | 6.8%), Transportation (126 | 3.8%), and Material Moving (23 | 0.7%).
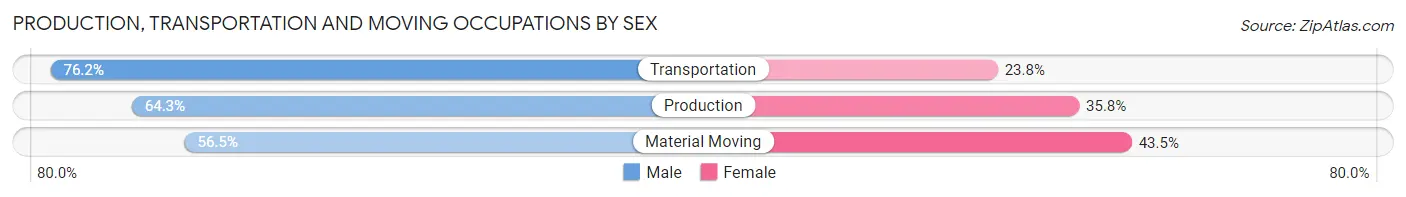
Production, Transportation and Moving Occupations by Sex
| Occupation | Male | Female |
| Production | 142 (64.2%) | 79 (35.7%) |
| Transportation | 96 (76.2%) | 30 (23.8%) |
| Material Moving | 13 (56.5%) | 10 (43.5%) |
| Total (Category) | 251 (67.8%) | 119 (32.2%) |
| Total (Overall) | 1,755 (53.6%) | 1,516 (46.4%) |
Employment Industries by Sex in Valley City
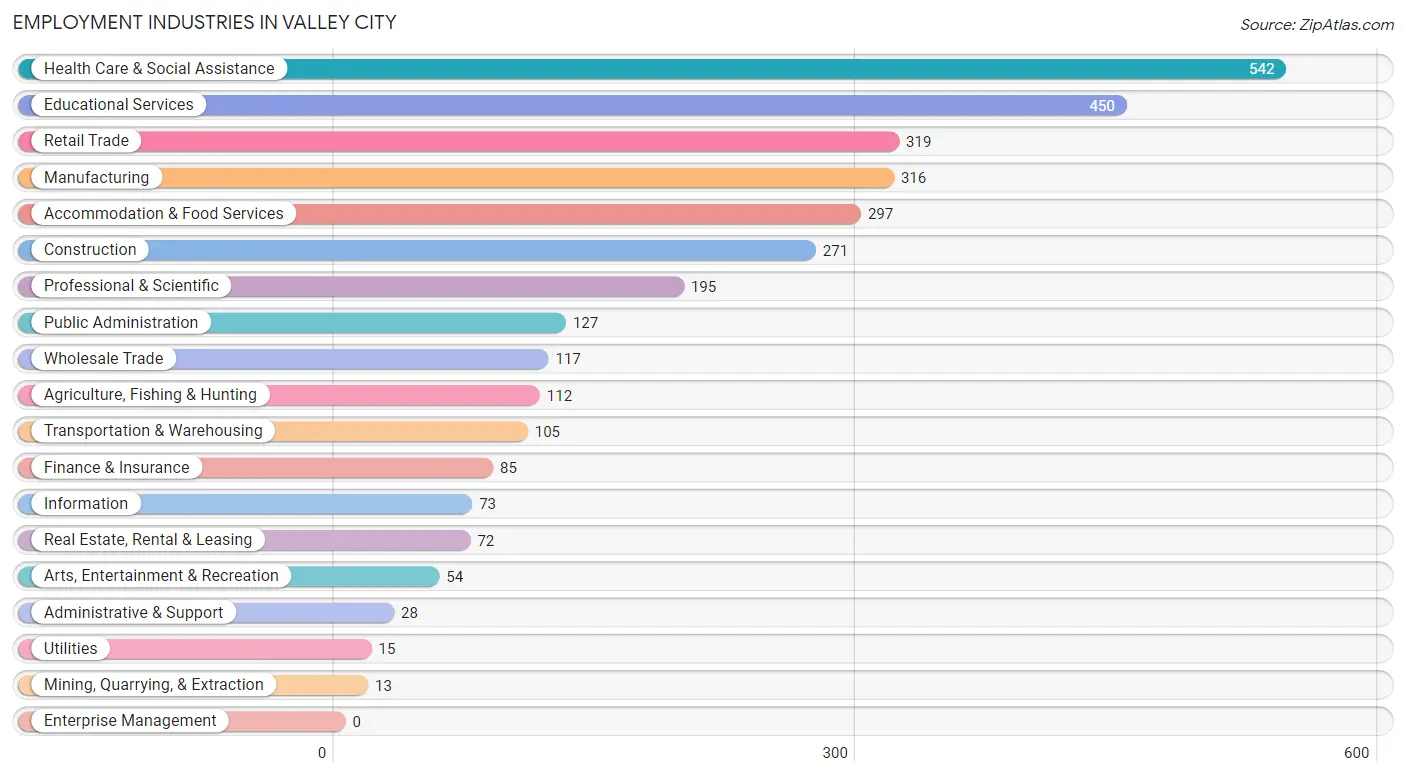
Employment Industries in Valley City
The major employment industries in Valley City include Health Care & Social Assistance (542 | 16.6%), Educational Services (450 | 13.8%), Retail Trade (319 | 9.8%), Manufacturing (316 | 9.7%), and Accommodation & Food Services (297 | 9.1%).
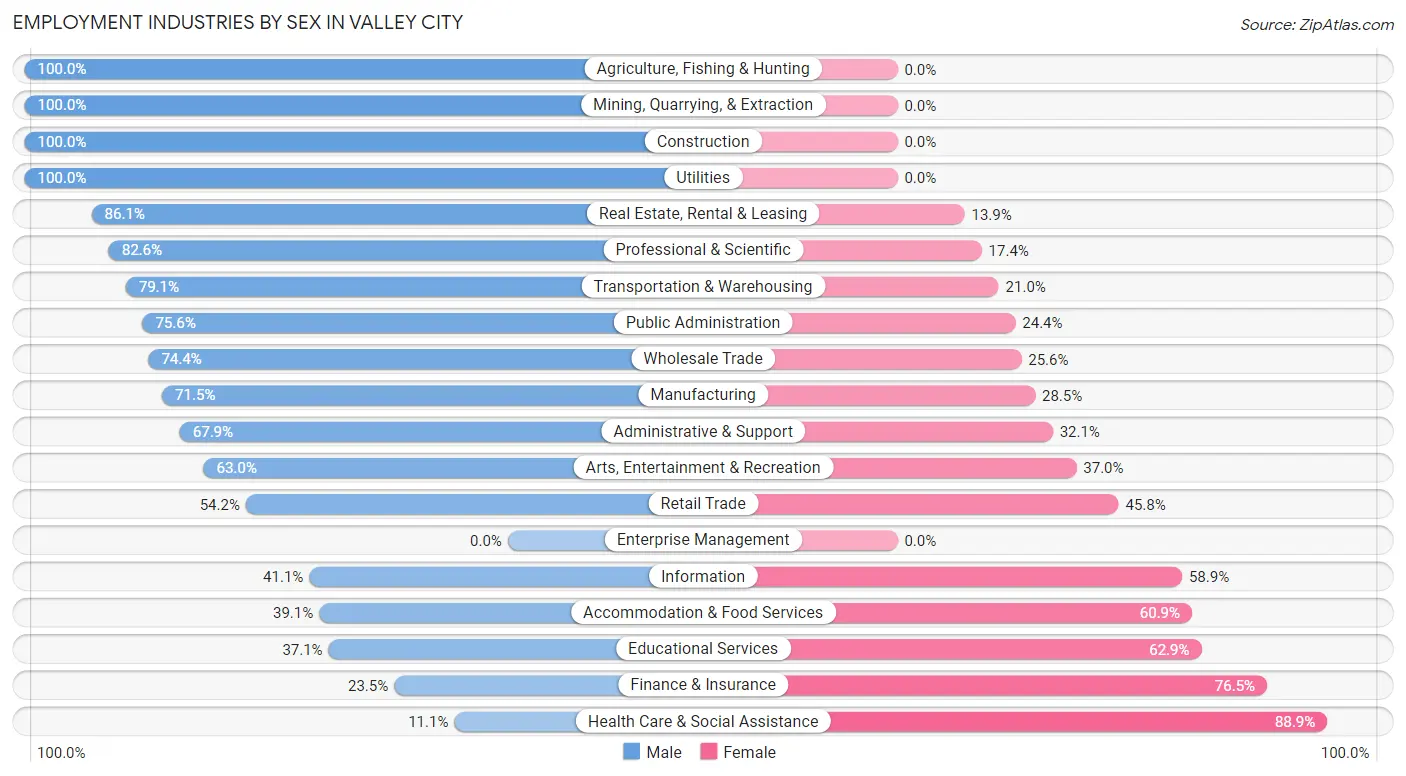
Employment Industries by Sex in Valley City
The Valley City industries that see more men than women are Agriculture, Fishing & Hunting (100.0%), Mining, Quarrying, & Extraction (100.0%), and Construction (100.0%), whereas the industries that tend to have a higher number of women are Health Care & Social Assistance (88.9%), Finance & Insurance (76.5%), and Educational Services (62.9%).
| Industry | Male | Female |
| Agriculture, Fishing & Hunting | 112 (100.0%) | 0 (0.0%) |
| Mining, Quarrying, & Extraction | 13 (100.0%) | 0 (0.0%) |
| Construction | 271 (100.0%) | 0 (0.0%) |
| Manufacturing | 226 (71.5%) | 90 (28.5%) |
| Wholesale Trade | 87 (74.4%) | 30 (25.6%) |
| Retail Trade | 173 (54.2%) | 146 (45.8%) |
| Transportation & Warehousing | 83 (79.0%) | 22 (20.9%) |
| Utilities | 15 (100.0%) | 0 (0.0%) |
| Information | 30 (41.1%) | 43 (58.9%) |
| Finance & Insurance | 20 (23.5%) | 65 (76.5%) |
| Real Estate, Rental & Leasing | 62 (86.1%) | 10 (13.9%) |
| Professional & Scientific | 161 (82.6%) | 34 (17.4%) |
| Enterprise Management | 0 (0.0%) | 0 (0.0%) |
| Administrative & Support | 19 (67.9%) | 9 (32.1%) |
| Educational Services | 167 (37.1%) | 283 (62.9%) |
| Health Care & Social Assistance | 60 (11.1%) | 482 (88.9%) |
| Arts, Entertainment & Recreation | 34 (63.0%) | 20 (37.0%) |
| Accommodation & Food Services | 116 (39.1%) | 181 (60.9%) |
| Public Administration | 96 (75.6%) | 31 (24.4%) |
| Total | 1,755 (53.6%) | 1,516 (46.4%) |
Education in Valley City
School Enrollment in Valley City
The most common levels of schooling among the 1,899 students in Valley City are college / undergraduate (665 | 35.0%), middle school (337 | 17.7%), and high school (290 | 15.3%).
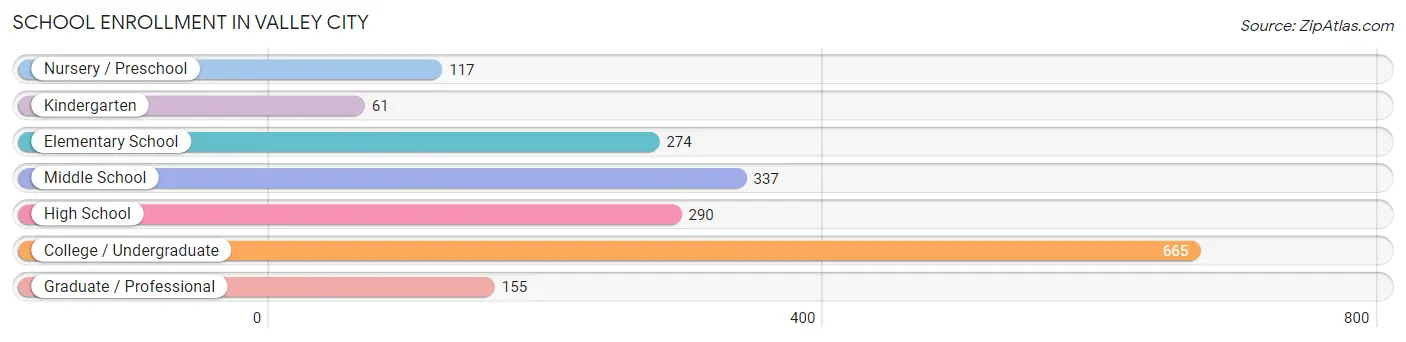
| School Level | # Students | % Students |
| Nursery / Preschool | 117 | 6.2% |
| Kindergarten | 61 | 3.2% |
| Elementary School | 274 | 14.4% |
| Middle School | 337 | 17.7% |
| High School | 290 | 15.3% |
| College / Undergraduate | 665 | 35.0% |
| Graduate / Professional | 155 | 8.2% |
| Total | 1,899 | 100.0% |
School Enrollment by Age by Funding Source in Valley City
Out of a total of 1,899 students who are enrolled in schools in Valley City, 70 (3.7%) attend a private institution, while the remaining 1,829 (96.3%) are enrolled in public schools. The age group of 35 years and over has the highest likelihood of being enrolled in private schools, with 47 (32.6% in the age bracket) enrolled. Conversely, the age group of 3 to 4 year olds has the lowest likelihood of being enrolled in a private school, with 34 (100.0% in the age bracket) attending a public institution.
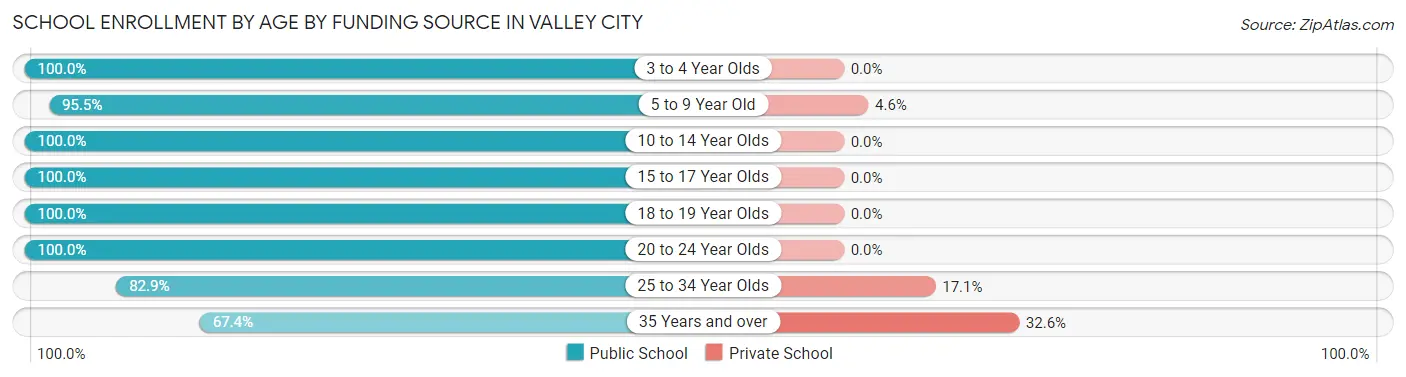
| Age Bracket | Public School | Private School |
| 3 to 4 Year Olds | 34 (100.0%) | 0 (0.0%) |
| 5 to 9 Year Old | 336 (95.5%) | 16 (4.5%) |
| 10 to 14 Year Olds | 415 (100.0%) | 0 (0.0%) |
| 15 to 17 Year Olds | 251 (100.0%) | 0 (0.0%) |
| 18 to 19 Year Olds | 268 (100.0%) | 0 (0.0%) |
| 20 to 24 Year Olds | 394 (100.0%) | 0 (0.0%) |
| 25 to 34 Year Olds | 34 (82.9%) | 7 (17.1%) |
| 35 Years and over | 97 (67.4%) | 47 (32.6%) |
| Total | 1,829 (96.3%) | 70 (3.7%) |
Educational Attainment by Field of Study in Valley City
Education (312 | 23.2%), business (298 | 22.2%), science & technology (252 | 18.8%), arts & humanities (118 | 8.8%), and social sciences (78 | 5.8%) are the most common fields of study among 1,344 individuals in Valley City who have obtained a bachelor's degree or higher.
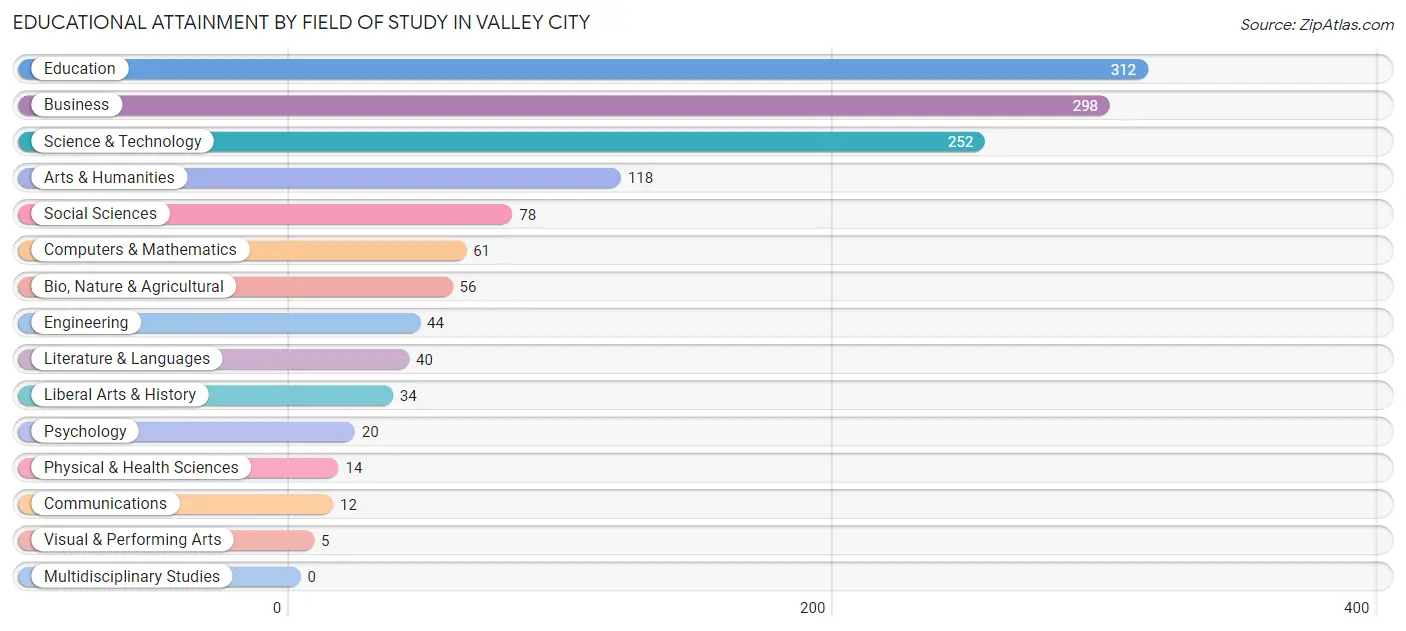
| Field of Study | # Graduates | % Graduates |
| Computers & Mathematics | 61 | 4.5% |
| Bio, Nature & Agricultural | 56 | 4.2% |
| Physical & Health Sciences | 14 | 1.0% |
| Psychology | 20 | 1.5% |
| Social Sciences | 78 | 5.8% |
| Engineering | 44 | 3.3% |
| Multidisciplinary Studies | 0 | 0.0% |
| Science & Technology | 252 | 18.8% |
| Business | 298 | 22.2% |
| Education | 312 | 23.2% |
| Literature & Languages | 40 | 3.0% |
| Liberal Arts & History | 34 | 2.5% |
| Visual & Performing Arts | 5 | 0.4% |
| Communications | 12 | 0.9% |
| Arts & Humanities | 118 | 8.8% |
| Total | 1,344 | 100.0% |
Transportation & Commute in Valley City
Vehicle Availability by Sex in Valley City
The most prevalent vehicle ownership categories in Valley City are males with 2 vehicles (676, accounting for 40.7%) and females with 2 vehicles (471, making up 49.5%).
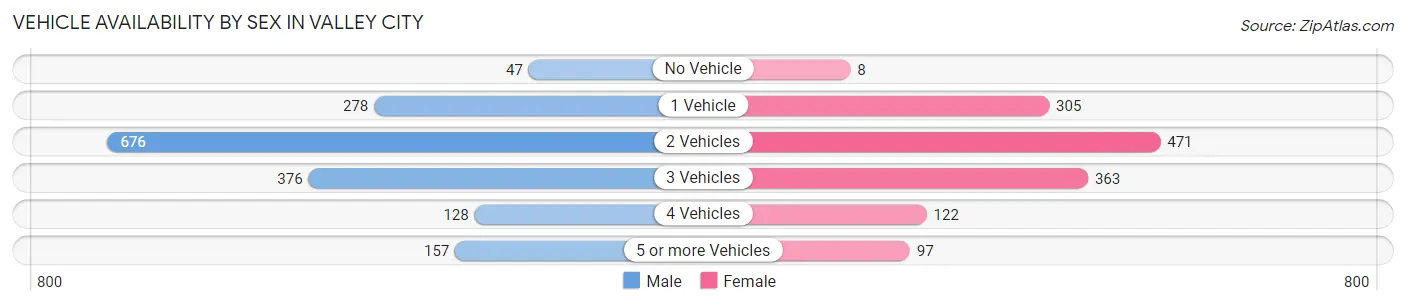
| Vehicles Available | Male | Female |
| No Vehicle | 47 (2.8%) | 8 (0.6%) |
| 1 Vehicle | 278 (16.7%) | 305 (22.3%) |
| 2 Vehicles | 676 (40.7%) | 471 (34.5%) |
| 3 Vehicles | 376 (22.6%) | 363 (26.6%) |
| 4 Vehicles | 128 (7.7%) | 122 (8.9%) |
| 5 or more Vehicles | 157 (9.5%) | 97 (7.1%) |
| Total | 1,662 (100.0%) | 1,366 (100.0%) |
Commute Time in Valley City
The most frequently occuring commute durations in Valley City are 5 to 9 minutes (1,350 commuters, 42.6%), less than 5 minutes (630 commuters, 19.9%), and 10 to 14 minutes (393 commuters, 12.4%).
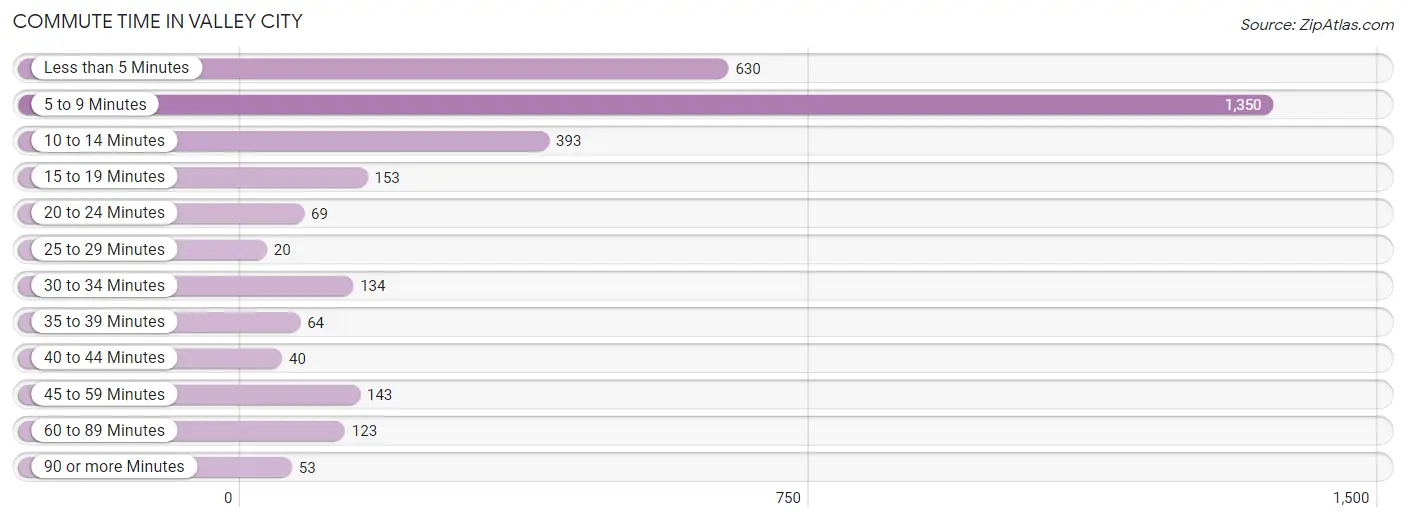
| Commute Time | # Commuters | % Commuters |
| Less than 5 Minutes | 630 | 19.9% |
| 5 to 9 Minutes | 1,350 | 42.6% |
| 10 to 14 Minutes | 393 | 12.4% |
| 15 to 19 Minutes | 153 | 4.8% |
| 20 to 24 Minutes | 69 | 2.2% |
| 25 to 29 Minutes | 20 | 0.6% |
| 30 to 34 Minutes | 134 | 4.2% |
| 35 to 39 Minutes | 64 | 2.0% |
| 40 to 44 Minutes | 40 | 1.3% |
| 45 to 59 Minutes | 143 | 4.5% |
| 60 to 89 Minutes | 123 | 3.9% |
| 90 or more Minutes | 53 | 1.7% |
Commute Time by Sex in Valley City
The most common commute times in Valley City are 5 to 9 minutes (690 commuters, 39.6%) for males and 5 to 9 minutes (660 commuters, 46.2%) for females.
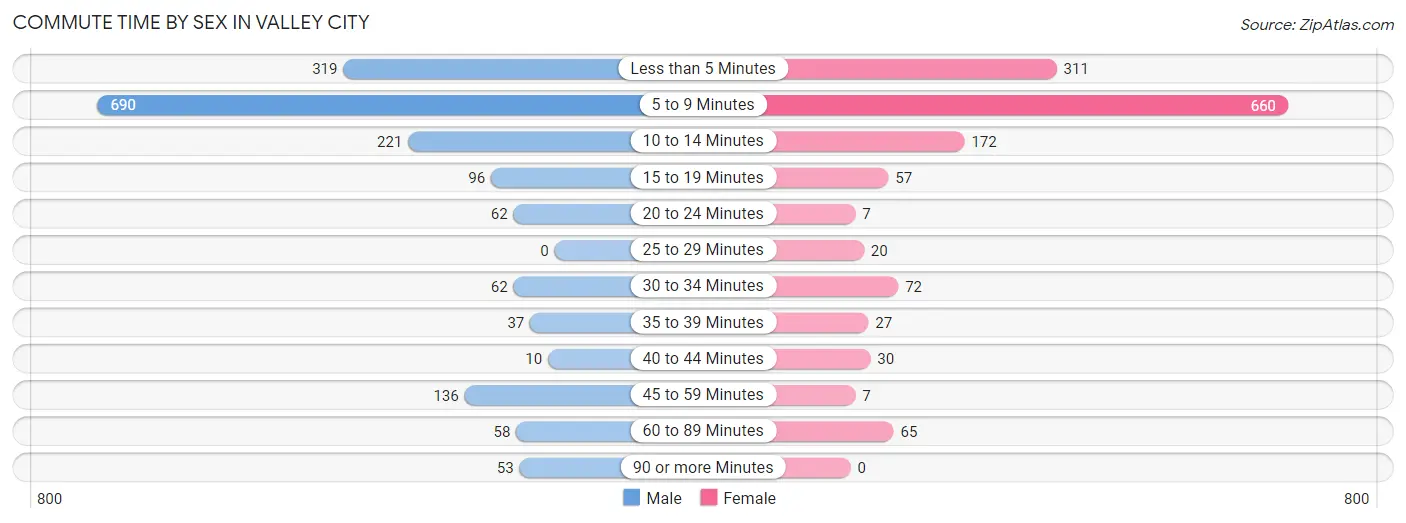
| Commute Time | Male | Female |
| Less than 5 Minutes | 319 (18.3%) | 311 (21.8%) |
| 5 to 9 Minutes | 690 (39.6%) | 660 (46.2%) |
| 10 to 14 Minutes | 221 (12.7%) | 172 (12.0%) |
| 15 to 19 Minutes | 96 (5.5%) | 57 (4.0%) |
| 20 to 24 Minutes | 62 (3.6%) | 7 (0.5%) |
| 25 to 29 Minutes | 0 (0.0%) | 20 (1.4%) |
| 30 to 34 Minutes | 62 (3.6%) | 72 (5.0%) |
| 35 to 39 Minutes | 37 (2.1%) | 27 (1.9%) |
| 40 to 44 Minutes | 10 (0.6%) | 30 (2.1%) |
| 45 to 59 Minutes | 136 (7.8%) | 7 (0.5%) |
| 60 to 89 Minutes | 58 (3.3%) | 65 (4.5%) |
| 90 or more Minutes | 53 (3.0%) | 0 (0.0%) |
Time of Departure to Work by Sex in Valley City
The most frequent times of departure to work in Valley City are 6:30 AM to 6:59 AM (371, 21.3%) for males and 7:30 AM to 7:59 AM (418, 29.3%) for females.
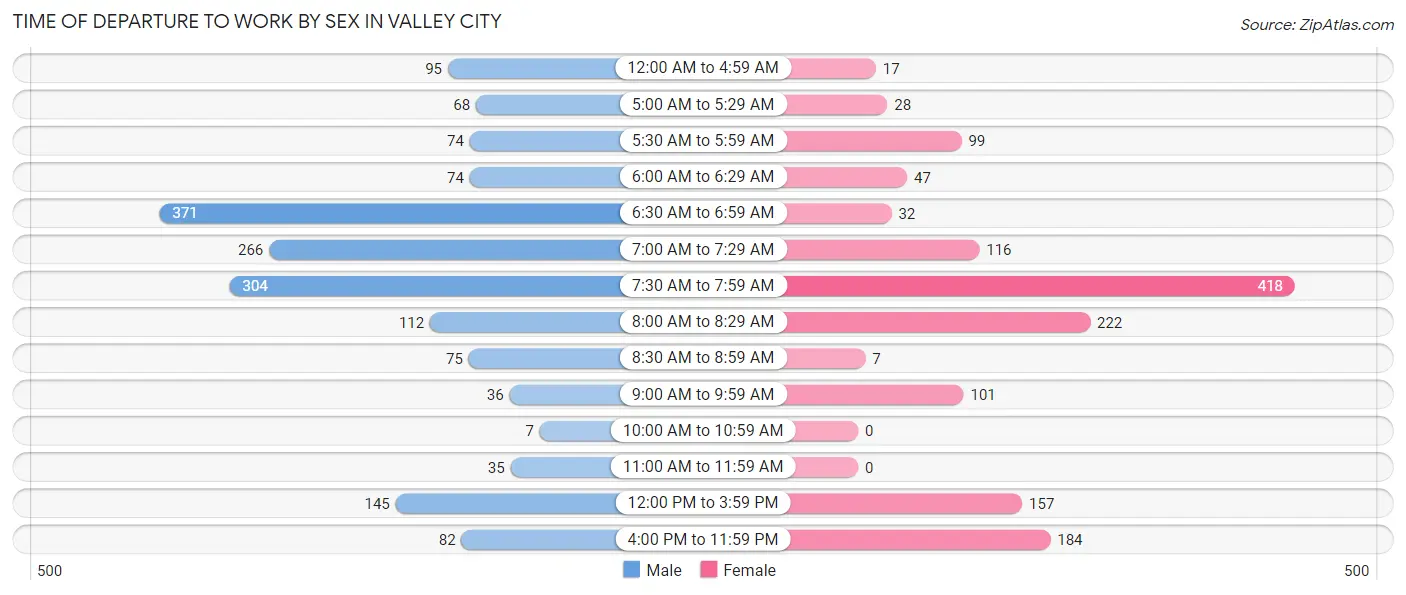
| Time of Departure | Male | Female |
| 12:00 AM to 4:59 AM | 95 (5.4%) | 17 (1.2%) |
| 5:00 AM to 5:29 AM | 68 (3.9%) | 28 (2.0%) |
| 5:30 AM to 5:59 AM | 74 (4.2%) | 99 (6.9%) |
| 6:00 AM to 6:29 AM | 74 (4.2%) | 47 (3.3%) |
| 6:30 AM to 6:59 AM | 371 (21.3%) | 32 (2.2%) |
| 7:00 AM to 7:29 AM | 266 (15.2%) | 116 (8.1%) |
| 7:30 AM to 7:59 AM | 304 (17.4%) | 418 (29.3%) |
| 8:00 AM to 8:29 AM | 112 (6.4%) | 222 (15.5%) |
| 8:30 AM to 8:59 AM | 75 (4.3%) | 7 (0.5%) |
| 9:00 AM to 9:59 AM | 36 (2.1%) | 101 (7.1%) |
| 10:00 AM to 10:59 AM | 7 (0.4%) | 0 (0.0%) |
| 11:00 AM to 11:59 AM | 35 (2.0%) | 0 (0.0%) |
| 12:00 PM to 3:59 PM | 145 (8.3%) | 157 (11.0%) |
| 4:00 PM to 11:59 PM | 82 (4.7%) | 184 (12.9%) |
| Total | 1,744 (100.0%) | 1,428 (100.0%) |
Housing Occupancy in Valley City
Occupancy by Ownership in Valley City
Of the total 3,039 dwellings in Valley City, owner-occupied units account for 1,942 (63.9%), while renter-occupied units make up 1,097 (36.1%).
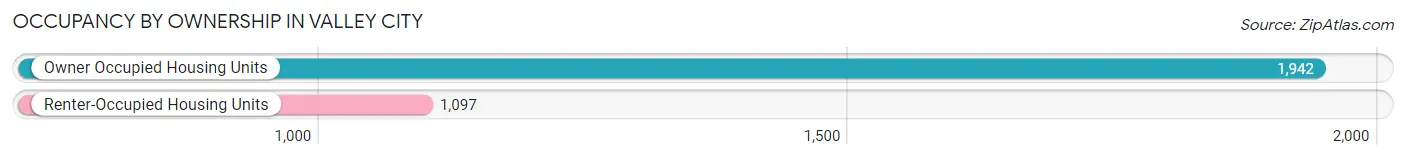
| Occupancy | # Housing Units | % Housing Units |
| Owner Occupied Housing Units | 1,942 | 63.9% |
| Renter-Occupied Housing Units | 1,097 | 36.1% |
| Total Occupied Housing Units | 3,039 | 100.0% |
Occupancy by Household Size in Valley City
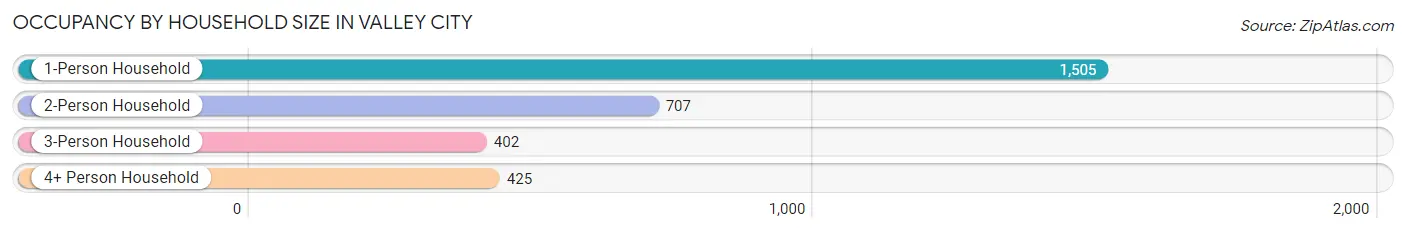
| Household Size | # Housing Units | % Housing Units |
| 1-Person Household | 1,505 | 49.5% |
| 2-Person Household | 707 | 23.3% |
| 3-Person Household | 402 | 13.2% |
| 4+ Person Household | 425 | 14.0% |
| Total Housing Units | 3,039 | 100.0% |
Occupancy by Ownership by Household Size in Valley City
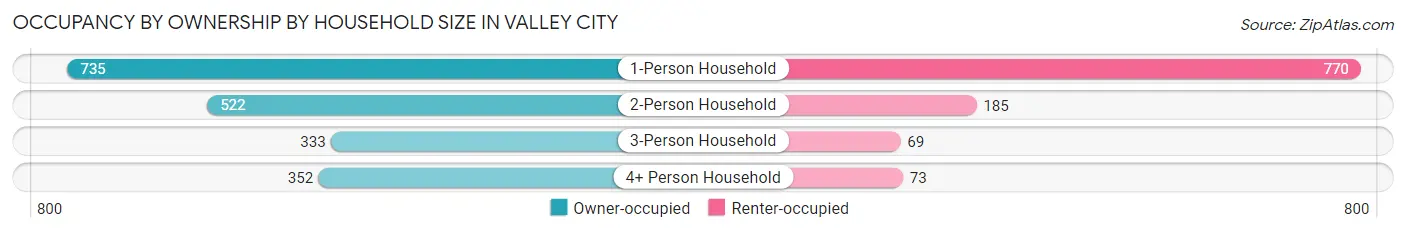
| Household Size | Owner-occupied | Renter-occupied |
| 1-Person Household | 735 (48.8%) | 770 (51.2%) |
| 2-Person Household | 522 (73.8%) | 185 (26.2%) |
| 3-Person Household | 333 (82.8%) | 69 (17.2%) |
| 4+ Person Household | 352 (82.8%) | 73 (17.2%) |
| Total Housing Units | 1,942 (63.9%) | 1,097 (36.1%) |
Occupancy by Educational Attainment in Valley City
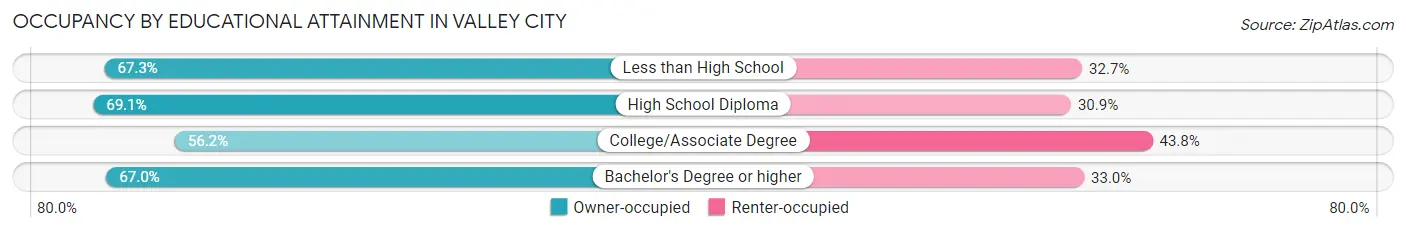
| Household Size | Owner-occupied | Renter-occupied |
| Less than High School | 68 (67.3%) | 33 (32.7%) |
| High School Diploma | 653 (69.1%) | 292 (30.9%) |
| College/Associate Degree | 593 (56.2%) | 463 (43.8%) |
| Bachelor's Degree or higher | 628 (67.0%) | 309 (33.0%) |
Occupancy by Age of Householder in Valley City
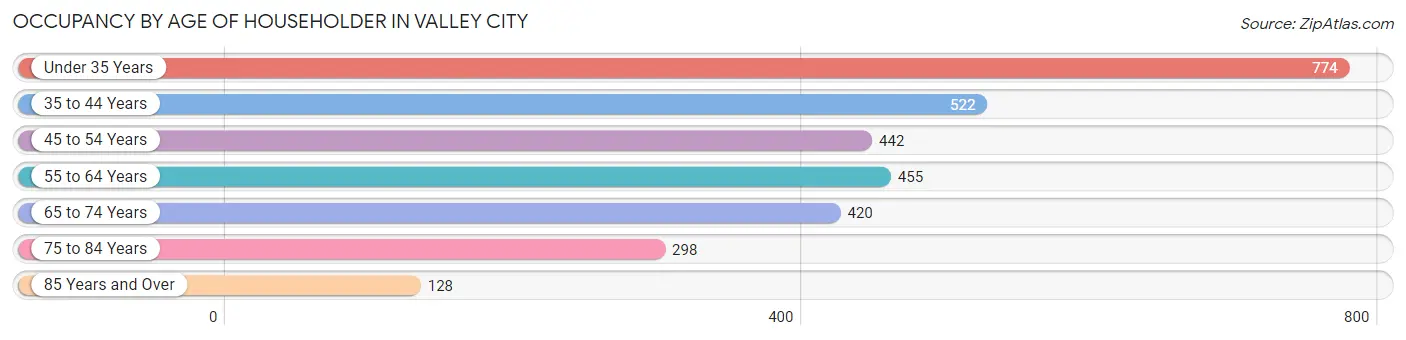
| Age Bracket | # Households | % Households |
| Under 35 Years | 774 | 25.5% |
| 35 to 44 Years | 522 | 17.2% |
| 45 to 54 Years | 442 | 14.5% |
| 55 to 64 Years | 455 | 15.0% |
| 65 to 74 Years | 420 | 13.8% |
| 75 to 84 Years | 298 | 9.8% |
| 85 Years and Over | 128 | 4.2% |
| Total | 3,039 | 100.0% |
Housing Finances in Valley City
Median Income by Occupancy in Valley City
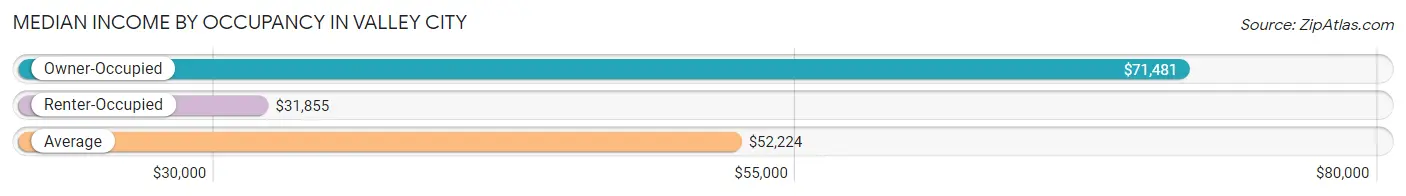
| Occupancy Type | # Households | Median Income |
| Owner-Occupied | 1,942 (63.9%) | $71,481 |
| Renter-Occupied | 1,097 (36.1%) | $31,855 |
| Average | 3,039 (100.0%) | $52,224 |
Occupancy by Householder Income Bracket in Valley City
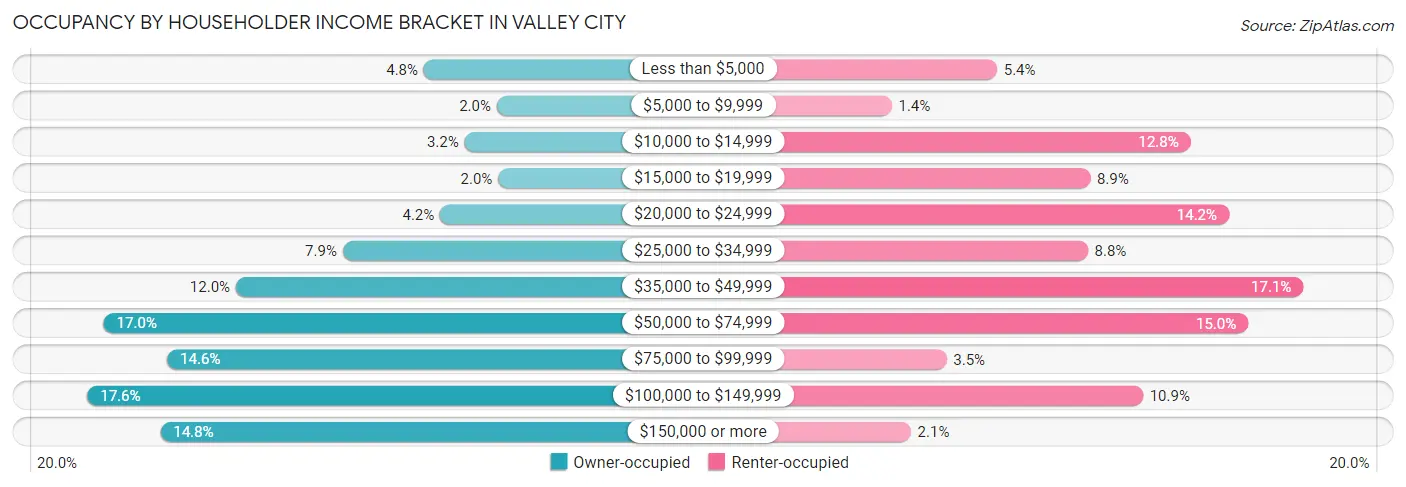
| Income Bracket | Owner-occupied | Renter-occupied |
| Less than $5,000 | 93 (4.8%) | 59 (5.4%) |
| $5,000 to $9,999 | 39 (2.0%) | 15 (1.4%) |
| $10,000 to $14,999 | 63 (3.2%) | 140 (12.8%) |
| $15,000 to $19,999 | 38 (2.0%) | 98 (8.9%) |
| $20,000 to $24,999 | 81 (4.2%) | 156 (14.2%) |
| $25,000 to $34,999 | 153 (7.9%) | 97 (8.8%) |
| $35,000 to $49,999 | 232 (11.9%) | 187 (17.1%) |
| $50,000 to $74,999 | 330 (17.0%) | 164 (14.9%) |
| $75,000 to $99,999 | 283 (14.6%) | 38 (3.5%) |
| $100,000 to $149,999 | 342 (17.6%) | 120 (10.9%) |
| $150,000 or more | 288 (14.8%) | 23 (2.1%) |
| Total | 1,942 (100.0%) | 1,097 (100.0%) |
Monthly Housing Cost Tiers in Valley City
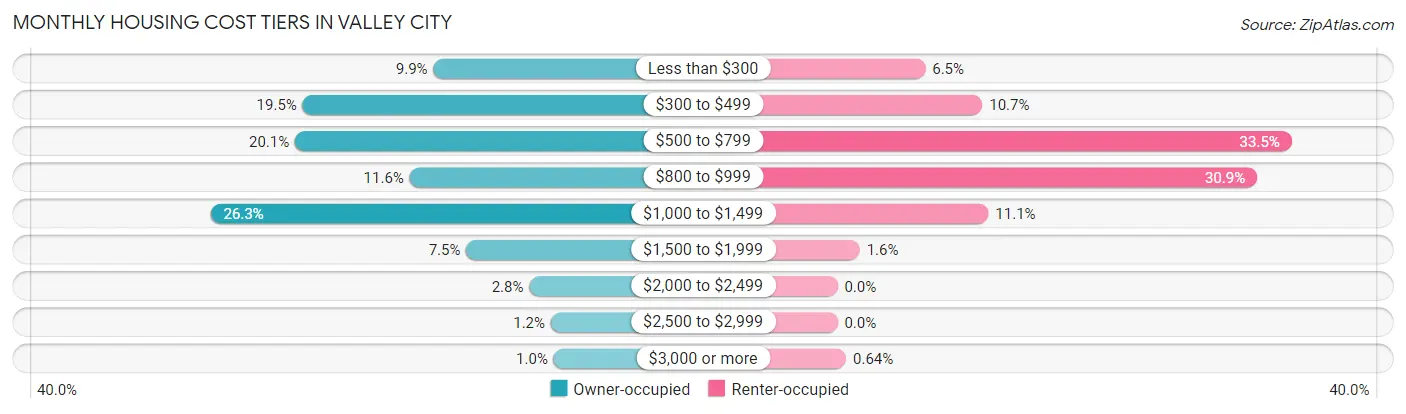
| Monthly Cost | Owner-occupied | Renter-occupied |
| Less than $300 | 192 (9.9%) | 71 (6.5%) |
| $300 to $499 | 379 (19.5%) | 117 (10.7%) |
| $500 to $799 | 390 (20.1%) | 367 (33.5%) |
| $800 to $999 | 226 (11.6%) | 339 (30.9%) |
| $1,000 to $1,499 | 511 (26.3%) | 122 (11.1%) |
| $1,500 to $1,999 | 145 (7.5%) | 18 (1.6%) |
| $2,000 to $2,499 | 55 (2.8%) | 0 (0.0%) |
| $2,500 to $2,999 | 24 (1.2%) | 0 (0.0%) |
| $3,000 or more | 20 (1.0%) | 7 (0.6%) |
| Total | 1,942 (100.0%) | 1,097 (100.0%) |
Physical Housing Characteristics in Valley City
Housing Structures in Valley City
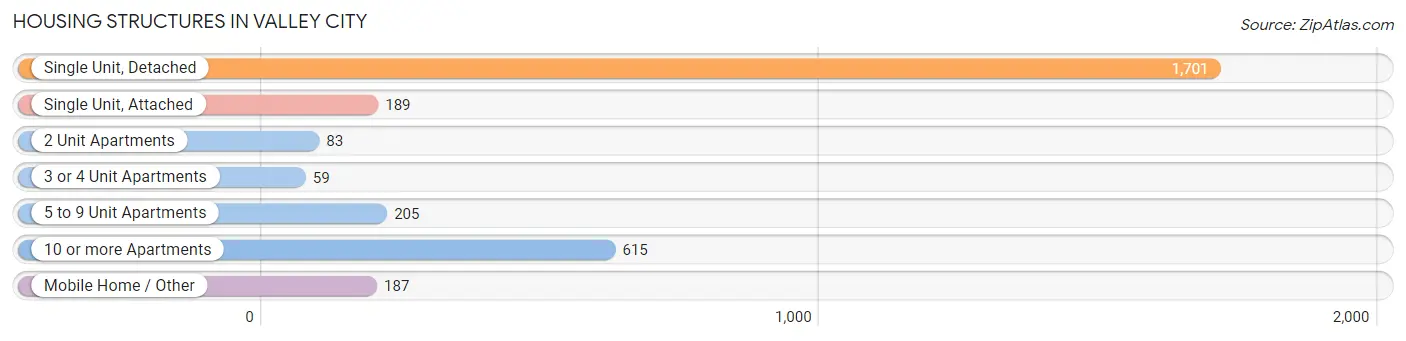
| Structure Type | # Housing Units | % Housing Units |
| Single Unit, Detached | 1,701 | 56.0% |
| Single Unit, Attached | 189 | 6.2% |
| 2 Unit Apartments | 83 | 2.7% |
| 3 or 4 Unit Apartments | 59 | 1.9% |
| 5 to 9 Unit Apartments | 205 | 6.8% |
| 10 or more Apartments | 615 | 20.2% |
| Mobile Home / Other | 187 | 6.1% |
| Total | 3,039 | 100.0% |
Housing Structures by Occupancy in Valley City
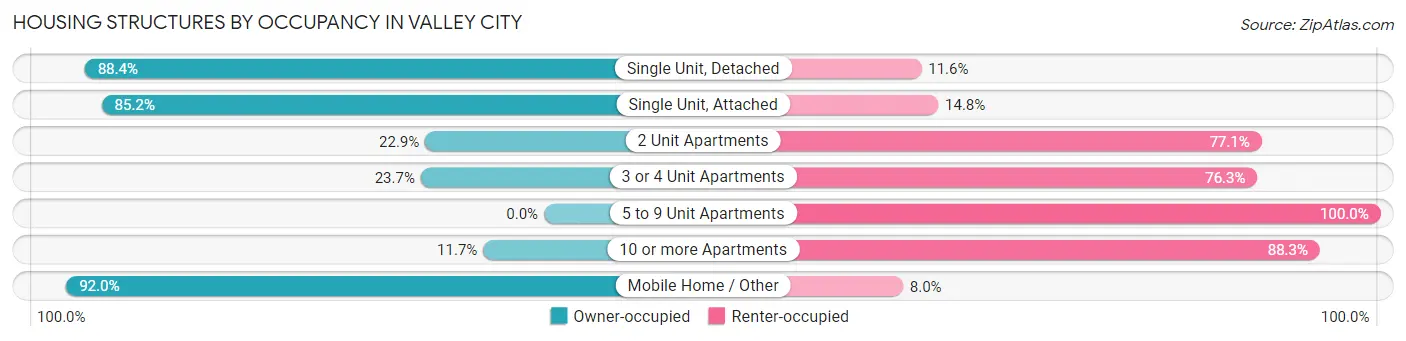
| Structure Type | Owner-occupied | Renter-occupied |
| Single Unit, Detached | 1,504 (88.4%) | 197 (11.6%) |
| Single Unit, Attached | 161 (85.2%) | 28 (14.8%) |
| 2 Unit Apartments | 19 (22.9%) | 64 (77.1%) |
| 3 or 4 Unit Apartments | 14 (23.7%) | 45 (76.3%) |
| 5 to 9 Unit Apartments | 0 (0.0%) | 205 (100.0%) |
| 10 or more Apartments | 72 (11.7%) | 543 (88.3%) |
| Mobile Home / Other | 172 (92.0%) | 15 (8.0%) |
| Total | 1,942 (63.9%) | 1,097 (36.1%) |
Housing Structures by Number of Rooms in Valley City
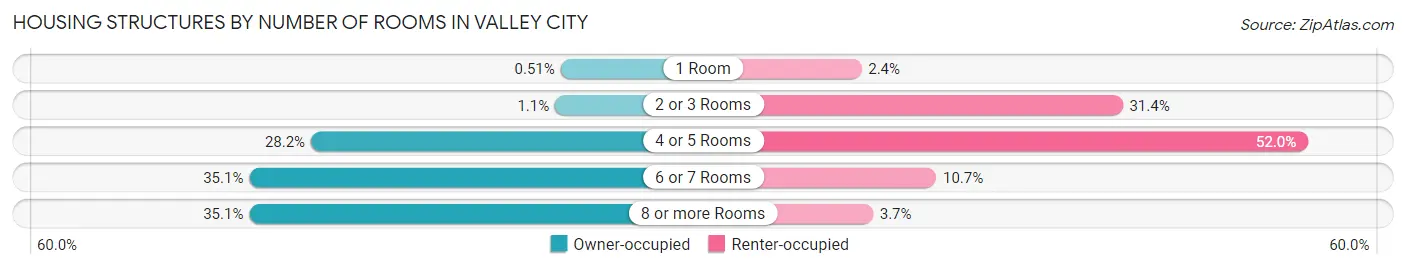
| Number of Rooms | Owner-occupied | Renter-occupied |
| 1 Room | 10 (0.5%) | 26 (2.4%) |
| 2 or 3 Rooms | 22 (1.1%) | 344 (31.4%) |
| 4 or 5 Rooms | 548 (28.2%) | 570 (52.0%) |
| 6 or 7 Rooms | 681 (35.1%) | 117 (10.7%) |
| 8 or more Rooms | 681 (35.1%) | 40 (3.6%) |
| Total | 1,942 (100.0%) | 1,097 (100.0%) |
Housing Structure by Heating Type in Valley City
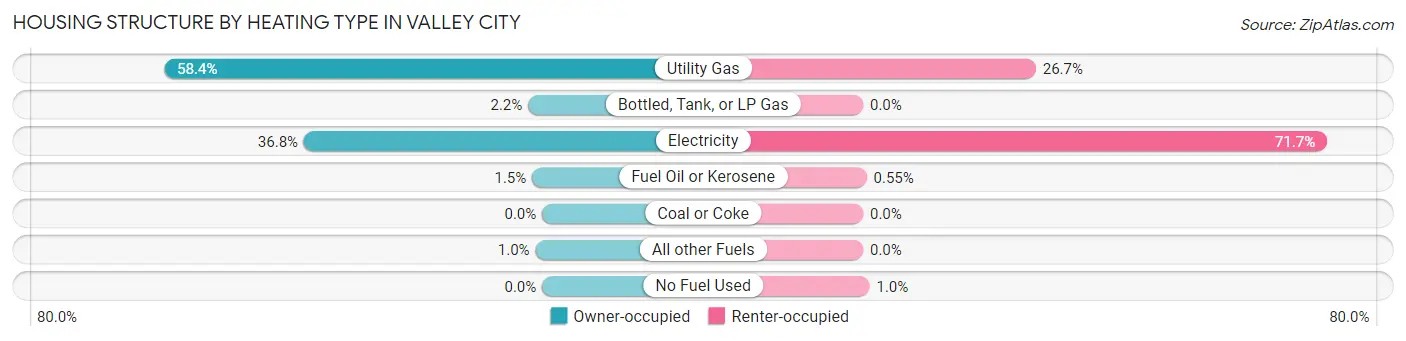
| Heating Type | Owner-occupied | Renter-occupied |
| Utility Gas | 1,135 (58.4%) | 293 (26.7%) |
| Bottled, Tank, or LP Gas | 42 (2.2%) | 0 (0.0%) |
| Electricity | 715 (36.8%) | 787 (71.7%) |
| Fuel Oil or Kerosene | 30 (1.5%) | 6 (0.5%) |
| Coal or Coke | 0 (0.0%) | 0 (0.0%) |
| All other Fuels | 20 (1.0%) | 0 (0.0%) |
| No Fuel Used | 0 (0.0%) | 11 (1.0%) |
| Total | 1,942 (100.0%) | 1,097 (100.0%) |
Household Vehicle Usage in Valley City
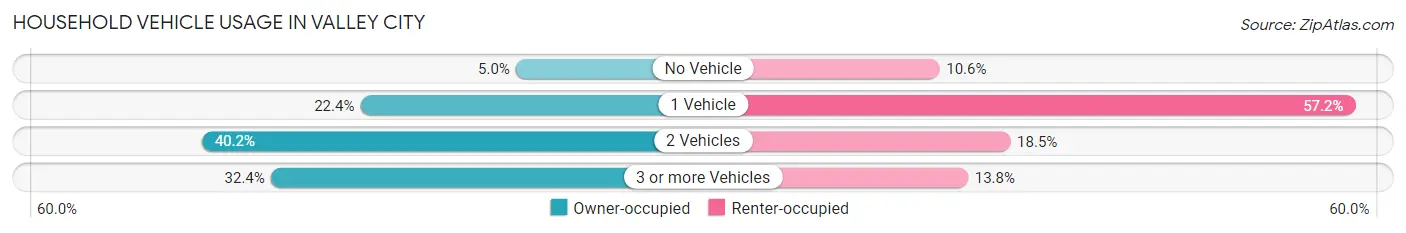
| Vehicles per Household | Owner-occupied | Renter-occupied |
| No Vehicle | 97 (5.0%) | 116 (10.6%) |
| 1 Vehicle | 435 (22.4%) | 627 (57.2%) |
| 2 Vehicles | 780 (40.2%) | 203 (18.5%) |
| 3 or more Vehicles | 630 (32.4%) | 151 (13.8%) |
| Total | 1,942 (100.0%) | 1,097 (100.0%) |
Real Estate & Mortgages in Valley City
Real Estate and Mortgage Overview in Valley City
| Characteristic | Without Mortgage | With Mortgage |
| Housing Units | 1,007 | 935 |
| Median Property Value | $112,200 | $158,800 |
| Median Household Income | $46,367 | $177 |
| Monthly Housing Costs | $473 | $20 |
| Real Estate Taxes | $1,645 | $0 |
Property Value by Mortgage Status in Valley City
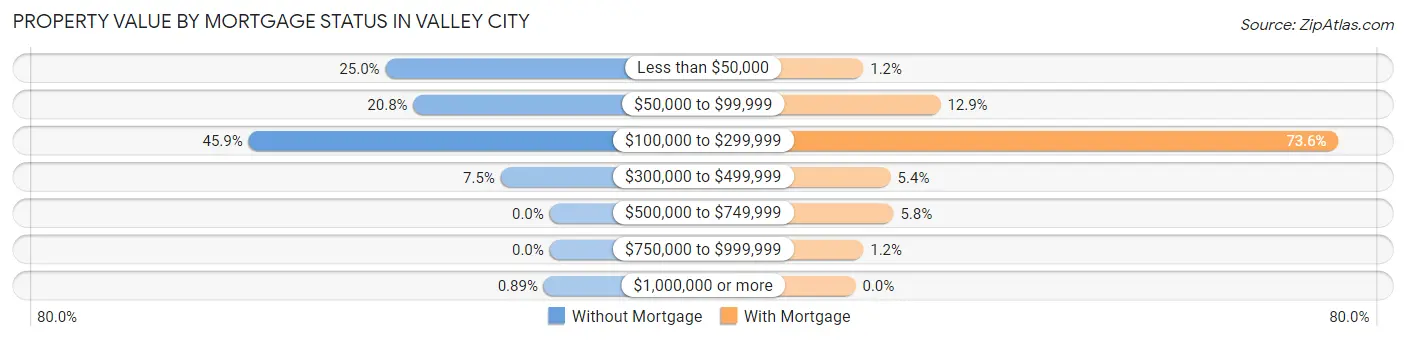
| Property Value | Without Mortgage | With Mortgage |
| Less than $50,000 | 252 (25.0%) | 11 (1.2%) |
| $50,000 to $99,999 | 209 (20.7%) | 121 (12.9%) |
| $100,000 to $299,999 | 462 (45.9%) | 688 (73.6%) |
| $300,000 to $499,999 | 75 (7.4%) | 50 (5.3%) |
| $500,000 to $749,999 | 0 (0.0%) | 54 (5.8%) |
| $750,000 to $999,999 | 0 (0.0%) | 11 (1.2%) |
| $1,000,000 or more | 9 (0.9%) | 0 (0.0%) |
| Total | 1,007 (100.0%) | 935 (100.0%) |
Household Income by Mortgage Status in Valley City
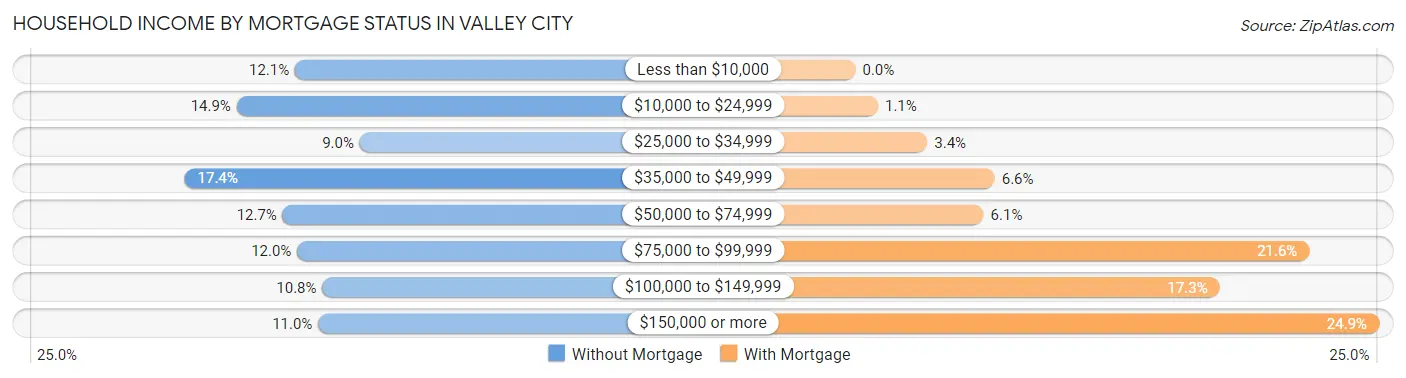
| Household Income | Without Mortgage | With Mortgage |
| Less than $10,000 | 122 (12.1%) | 0 (0.0%) |
| $10,000 to $24,999 | 150 (14.9%) | 10 (1.1%) |
| $25,000 to $34,999 | 91 (9.0%) | 32 (3.4%) |
| $35,000 to $49,999 | 175 (17.4%) | 62 (6.6%) |
| $50,000 to $74,999 | 128 (12.7%) | 57 (6.1%) |
| $75,000 to $99,999 | 121 (12.0%) | 202 (21.6%) |
| $100,000 to $149,999 | 109 (10.8%) | 162 (17.3%) |
| $150,000 or more | 111 (11.0%) | 233 (24.9%) |
| Total | 1,007 (100.0%) | 935 (100.0%) |
Property Value to Household Income Ratio in Valley City
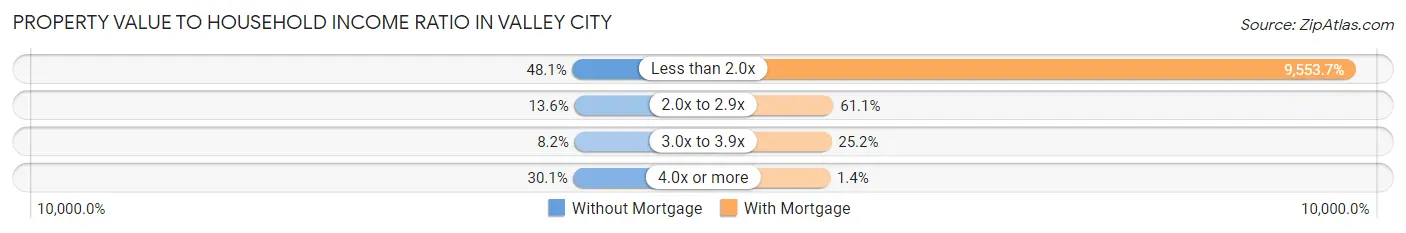
| Value-to-Income Ratio | Without Mortgage | With Mortgage |
| Less than 2.0x | 484 (48.1%) | 89,327 (9,553.7%) |
| 2.0x to 2.9x | 137 (13.6%) | 571 (61.1%) |
| 3.0x to 3.9x | 83 (8.2%) | 236 (25.2%) |
| 4.0x or more | 303 (30.1%) | 13 (1.4%) |
| Total | 1,007 (100.0%) | 935 (100.0%) |
Real Estate Taxes by Mortgage Status in Valley City
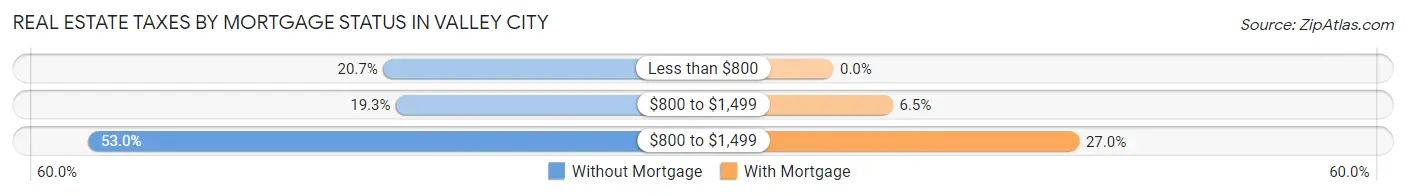
| Property Taxes | Without Mortgage | With Mortgage |
| Less than $800 | 208 (20.7%) | 0 (0.0%) |
| $800 to $1,499 | 194 (19.3%) | 61 (6.5%) |
| $800 to $1,499 | 534 (53.0%) | 252 (27.0%) |
| Total | 1,007 (100.0%) | 935 (100.0%) |
Health & Disability in Valley City
Health Insurance Coverage by Age in Valley City
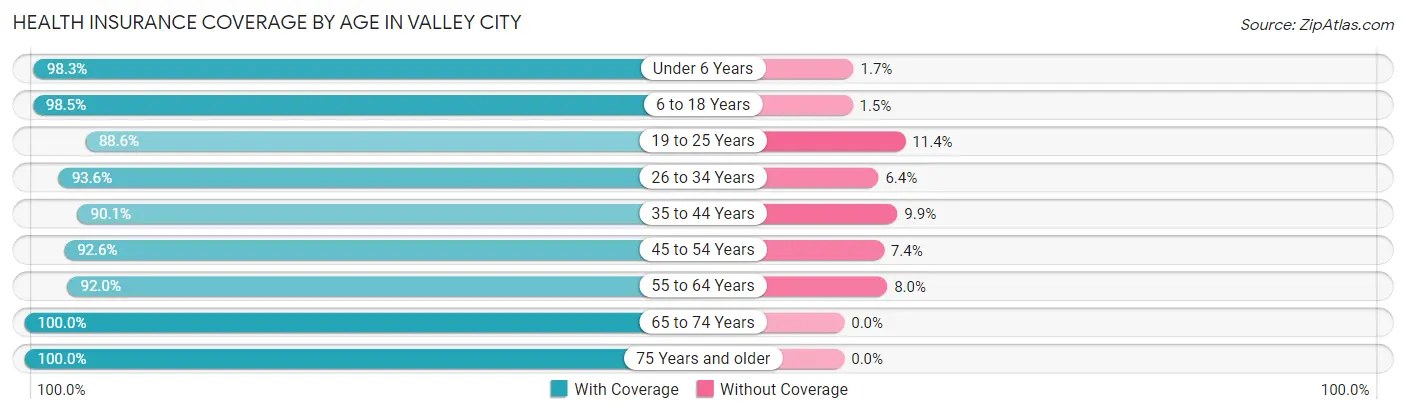
| Age Bracket | With Coverage | Without Coverage |
| Under 6 Years | 453 (98.3%) | 8 (1.7%) |
| 6 to 18 Years | 1,029 (98.5%) | 16 (1.5%) |
| 19 to 25 Years | 909 (88.6%) | 117 (11.4%) |
| 26 to 34 Years | 456 (93.6%) | 31 (6.4%) |
| 35 to 44 Years | 737 (90.1%) | 81 (9.9%) |
| 45 to 54 Years | 639 (92.6%) | 51 (7.4%) |
| 55 to 64 Years | 586 (92.0%) | 51 (8.0%) |
| 65 to 74 Years | 601 (100.0%) | 0 (0.0%) |
| 75 Years and older | 579 (100.0%) | 0 (0.0%) |
| Total | 5,989 (94.4%) | 355 (5.6%) |
Health Insurance Coverage by Citizenship Status in Valley City
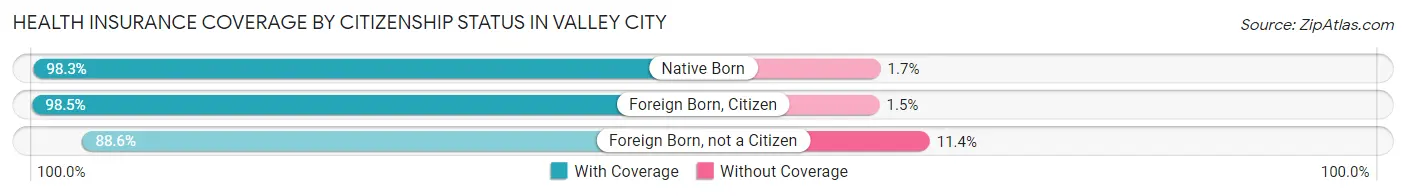
| Citizenship Status | With Coverage | Without Coverage |
| Native Born | 453 (98.3%) | 8 (1.7%) |
| Foreign Born, Citizen | 1,029 (98.5%) | 16 (1.5%) |
| Foreign Born, not a Citizen | 909 (88.6%) | 117 (11.4%) |
Health Insurance Coverage by Household Income in Valley City
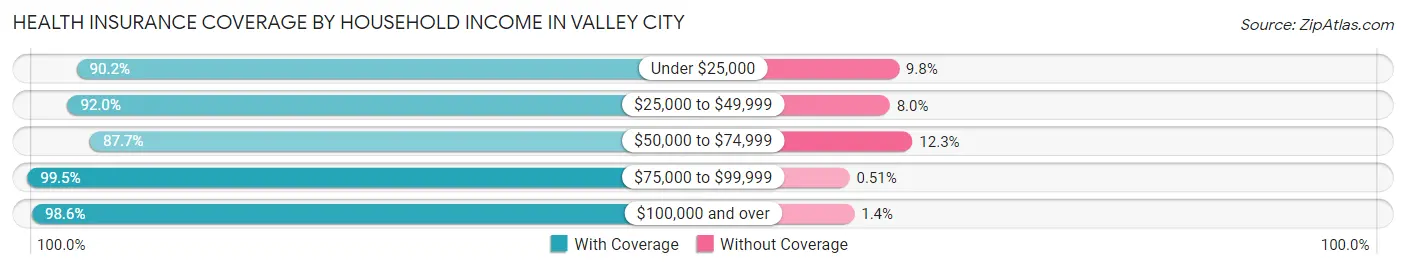
| Household Income | With Coverage | Without Coverage |
| Under $25,000 | 869 (90.2%) | 94 (9.8%) |
| $25,000 to $49,999 | 983 (92.0%) | 86 (8.0%) |
| $50,000 to $74,999 | 921 (87.7%) | 129 (12.3%) |
| $75,000 to $99,999 | 781 (99.5%) | 4 (0.5%) |
| $100,000 and over | 2,048 (98.6%) | 29 (1.4%) |
Public vs Private Health Insurance Coverage by Age in Valley City
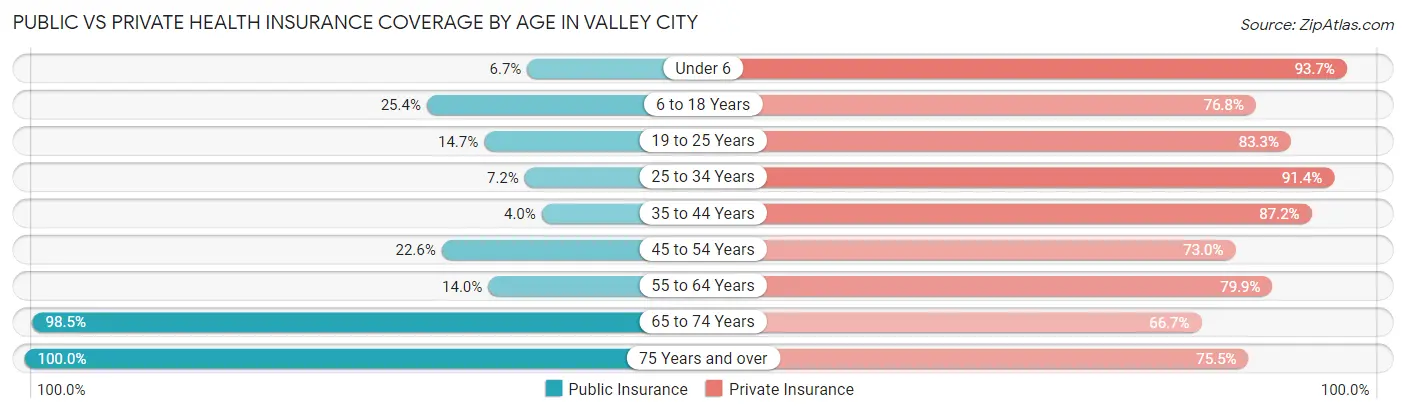
| Age Bracket | Public Insurance | Private Insurance |
| Under 6 | 31 (6.7%) | 432 (93.7%) |
| 6 to 18 Years | 265 (25.4%) | 803 (76.8%) |
| 19 to 25 Years | 151 (14.7%) | 855 (83.3%) |
| 25 to 34 Years | 35 (7.2%) | 445 (91.4%) |
| 35 to 44 Years | 33 (4.0%) | 713 (87.2%) |
| 45 to 54 Years | 156 (22.6%) | 504 (73.0%) |
| 55 to 64 Years | 89 (14.0%) | 509 (79.9%) |
| 65 to 74 Years | 592 (98.5%) | 401 (66.7%) |
| 75 Years and over | 579 (100.0%) | 437 (75.5%) |
| Total | 1,931 (30.4%) | 5,099 (80.4%) |
Disability Status by Sex by Age in Valley City
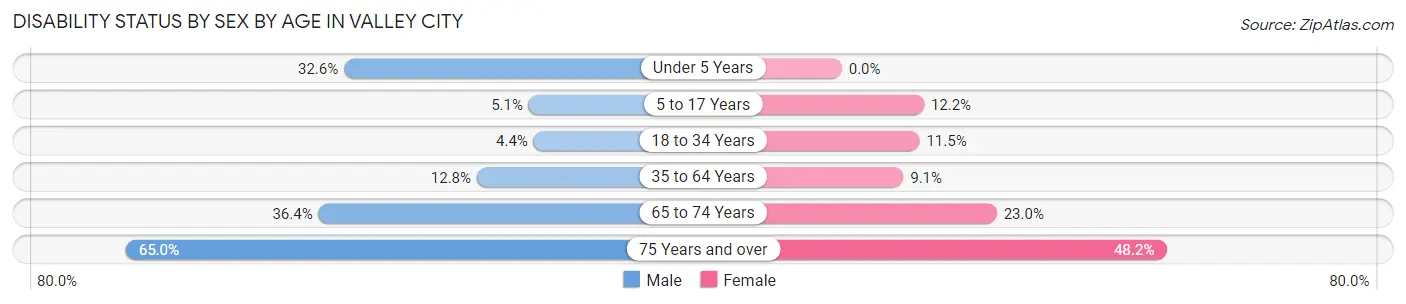
| Age Bracket | Male | Female |
| Under 5 Years | 42 (32.6%) | 0 (0.0%) |
| 5 to 17 Years | 29 (5.1%) | 60 (12.2%) |
| 18 to 34 Years | 40 (4.4%) | 83 (11.5%) |
| 35 to 64 Years | 146 (12.8%) | 92 (9.1%) |
| 65 to 74 Years | 100 (36.4%) | 75 (23.0%) |
| 75 Years and over | 128 (65.0%) | 184 (48.2%) |
Disability Class by Sex by Age in Valley City
Disability Class: Hearing Difficulty
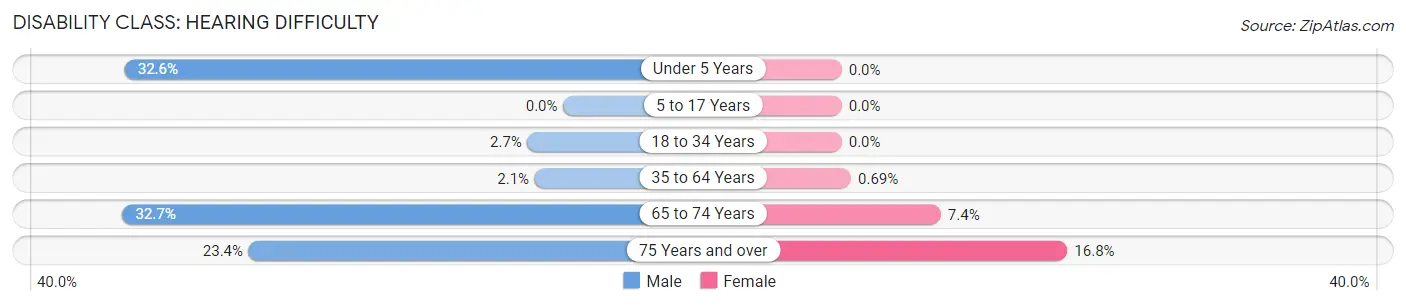
| Age Bracket | Male | Female |
| Under 5 Years | 42 (32.6%) | 0 (0.0%) |
| 5 to 17 Years | 0 (0.0%) | 0 (0.0%) |
| 18 to 34 Years | 24 (2.6%) | 0 (0.0%) |
| 35 to 64 Years | 24 (2.1%) | 7 (0.7%) |
| 65 to 74 Years | 90 (32.7%) | 24 (7.4%) |
| 75 Years and over | 46 (23.4%) | 64 (16.8%) |
Disability Class: Vision Difficulty
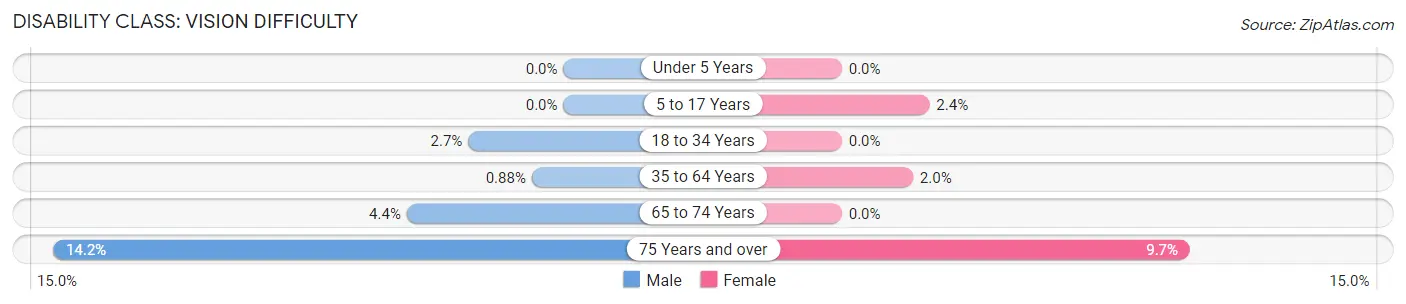
| Age Bracket | Male | Female |
| Under 5 Years | 0 (0.0%) | 0 (0.0%) |
| 5 to 17 Years | 0 (0.0%) | 12 (2.4%) |
| 18 to 34 Years | 24 (2.6%) | 0 (0.0%) |
| 35 to 64 Years | 10 (0.9%) | 20 (2.0%) |
| 65 to 74 Years | 12 (4.4%) | 0 (0.0%) |
| 75 Years and over | 28 (14.2%) | 37 (9.7%) |
Disability Class: Cognitive Difficulty
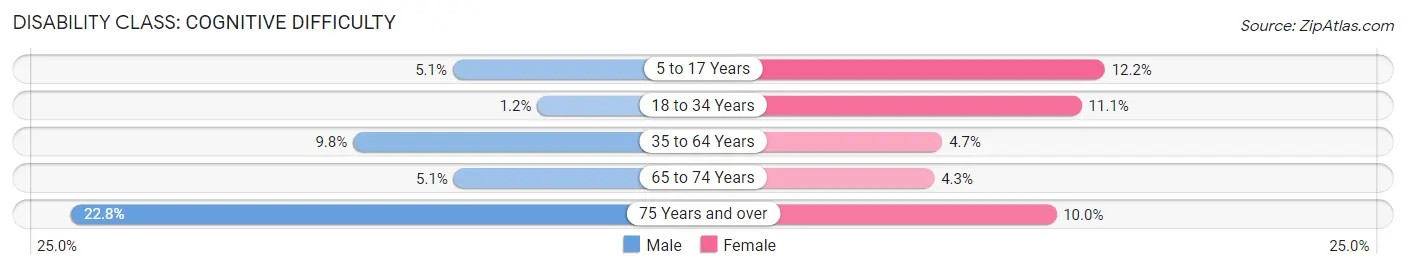
| Age Bracket | Male | Female |
| 5 to 17 Years | 29 (5.1%) | 60 (12.2%) |
| 18 to 34 Years | 11 (1.2%) | 80 (11.1%) |
| 35 to 64 Years | 111 (9.8%) | 47 (4.7%) |
| 65 to 74 Years | 14 (5.1%) | 14 (4.3%) |
| 75 Years and over | 45 (22.8%) | 38 (10.0%) |
Disability Class: Ambulatory Difficulty
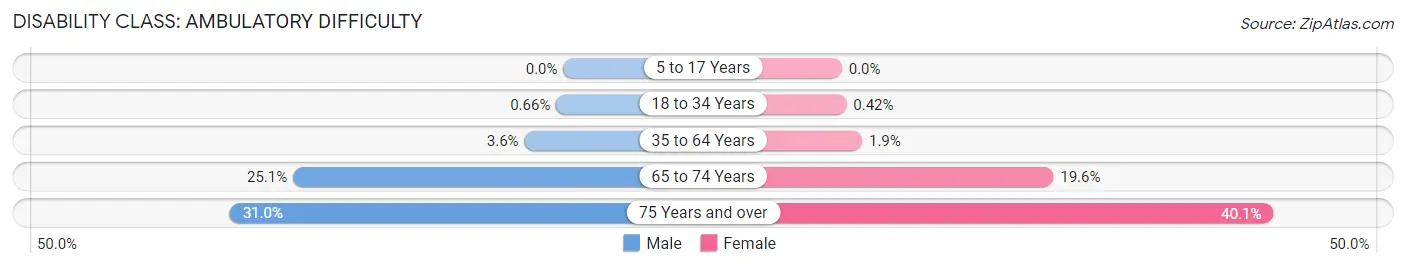
| Age Bracket | Male | Female |
| 5 to 17 Years | 0 (0.0%) | 0 (0.0%) |
| 18 to 34 Years | 6 (0.7%) | 3 (0.4%) |
| 35 to 64 Years | 41 (3.6%) | 19 (1.9%) |
| 65 to 74 Years | 69 (25.1%) | 64 (19.6%) |
| 75 Years and over | 61 (31.0%) | 153 (40.1%) |
Disability Class: Self-Care Difficulty
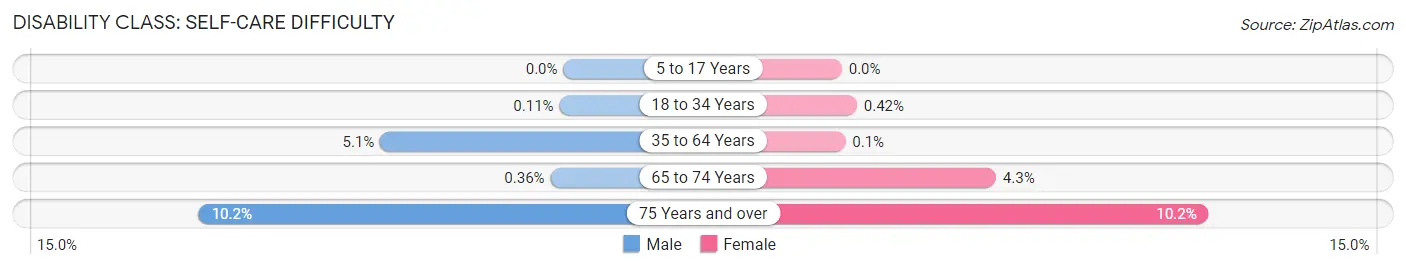
| Age Bracket | Male | Female |
| 5 to 17 Years | 0 (0.0%) | 0 (0.0%) |
| 18 to 34 Years | 1 (0.1%) | 3 (0.4%) |
| 35 to 64 Years | 58 (5.1%) | 1 (0.1%) |
| 65 to 74 Years | 1 (0.4%) | 14 (4.3%) |
| 75 Years and over | 20 (10.2%) | 39 (10.2%) |
Technology Access in Valley City
Computing Device Access in Valley City
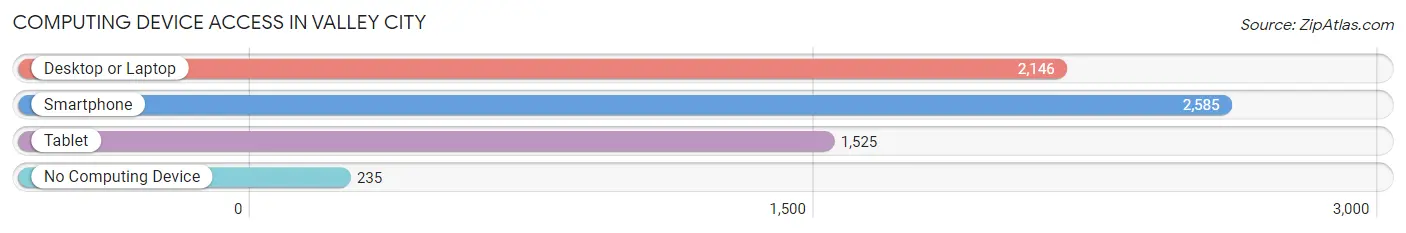
| Device Type | # Households | % Households |
| Desktop or Laptop | 2,146 | 70.6% |
| Smartphone | 2,585 | 85.1% |
| Tablet | 1,525 | 50.2% |
| No Computing Device | 235 | 7.7% |
| Total | 3,039 | 100.0% |
Internet Access in Valley City
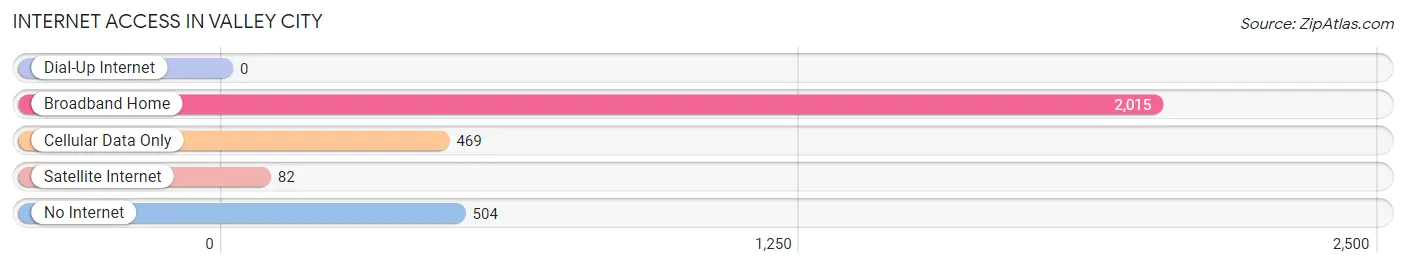
| Internet Type | # Households | % Households |
| Dial-Up Internet | 0 | 0.0% |
| Broadband Home | 2,015 | 66.3% |
| Cellular Data Only | 469 | 15.4% |
| Satellite Internet | 82 | 2.7% |
| No Internet | 504 | 16.6% |
| Total | 3,039 | 100.0% |
Valley City Summary
Valley City is a city in Barnes County, North Dakota, United States. The population was 6,585 at the 2010 census, making it the twelfth largest city in North Dakota. It is the county seat of Barnes County.
Geography
Valley City is located at the confluence of the Sheyenne River and the Maple River. It is situated in the Red River Valley, a flat and fertile region of the Great Plains. The city is located at the intersection of Interstate 94 and U.S. Highway 52.
History
Valley City was founded in 1874 by the Northern Pacific Railroad. The city was named after the nearby Valley City Township. The city was incorporated in 1883.
Valley City was the site of the first state-owned flour mill in the United States. The mill was built in 1885 and operated until the early 1900s.
Valley City was also the site of the first state-owned creamery in the United States. The creamery was built in 1887 and operated until the early 1900s.
Valley City was the site of the first state-owned cannery in the United States. The cannery was built in 1891 and operated until the early 1900s.
Valley City was the site of the first state-owned hatchery in the United States. The hatchery was built in 1895 and operated until the early 1900s.
Valley City was the site of the first state-owned grain elevator in the United States. The elevator was built in 1897 and operated until the early 1900s.
Valley City was the site of the first state-owned creamery in the United States. The creamery was built in 1899 and operated until the early 1900s.
Valley City was the site of the first state-owned dairy in the United States. The dairy was built in 1901 and operated until the early 1900s.
Economy
Valley City is the economic center of Barnes County. The city is home to several manufacturing companies, including Valley City Manufacturing, Valley City Plastics, and Valley City Steel. The city is also home to several retail stores, including Walmart, Target, and Kmart.
The city is home to several educational institutions, including Valley City State University, Valley City High School, and Valley City Middle School.
Demographics
As of the census of 2010, there were 6,585 people, 2,717 households, and 1,619 families residing in the city. The population density was 1,717.3 people per square mile (664.2/km2). There were 2,945 housing units at an average density of 762.3 per square mile (294.3/km2). The racial makeup of the city was 94.2% White, 0.7% African American, 0.7% Native American, 0.7% Asian, 0.1% Pacific Islander, 1.7% from other races, and 2.0% from two or more races. Hispanic or Latino of any race were 4.2% of the population.
There were 2,717 households, out of which 28.2% had children under the age of 18 living with them, 44.2% were married couples living together, 11.2% had a female householder with no husband present, and 40.2% were non-families. 34.2% of all households were made up of individuals, and 14.7% had someone living alone who was 65 years of age or older. The average household size was 2.30 and the average family size was 2.97.
In the city, the population was spread out, with 24.2% under the age of 18, 11.2% from 18 to 24, 25.2% from 25 to 44, 21.2% from 45 to 64, and 18.2% who were 65 years of age or older. The median age was 36 years. For every 100 females, there were 91.2 males. For every 100 females age 18 and over, there were 87.2 males.
The median income for a household in the city was $33,958, and the median income for a family was $45,938. Males had a median income of $31,944 versus $21,917 for females. The per capita income for the city was $18,945. About 8.2% of families and 11.2% of the population were below the poverty line, including 14.2% of those under age 18 and 8.2% of those age 65 or over.
Common Questions
What is the Total Population of Valley City?
Total Population of Valley City is 6,558.
What is the Total Male Population of Valley City?
Total Male Population of Valley City is 3,299.
What is the Total Female Population of Valley City?
Total Female Population of Valley City is 3,259.
What is the Ratio of Males per 100 Females in Valley City?
There are 101.23 Males per 100 Females in Valley City.
What is the Ratio of Females per 100 Males in Valley City?
There are 98.79 Females per 100 Males in Valley City.
What is the Median Population Age in Valley City?
Median Population Age in Valley City is 39.1 Years.
What is the Average Family Size in Valley City
Average Family Size in Valley City is 3.0 People.
What is the Average Household Size in Valley City
Average Household Size in Valley City is 2.0 People.
What is Per Capita Income in Valley City?
Per Capita income in Valley City is $33,714.
What is the Median Family Income in Valley City?
Median Family Income in Valley City is $87,931.
What is the Median Household income in Valley City?
Median Household Income in Valley City is $52,224.
What is Income or Wage Gap in Valley City?
Income or Wage Gap in Valley City is 36.8%.
Women in Valley City earn 63.2 cents for every dollar earned by a man.
What is Family Income Deficit in Valley City?
Family Income Deficit in Valley City is $7,227.
Families that are below poverty line in Valley City earn $7,227 less on average than the poverty threshold level.
What is Inequality or Gini Index in Valley City?
Inequality or Gini Index in Valley City is 0.46.
How Large is the Labor Force in Valley City?
There are 3,408 People in the Labor Forcein in Valley City.
What is the Percentage of People in the Labor Force in Valley City?
63.9% of People are in the Labor Force in Valley City.
What is the Unemployment Rate in Valley City?
Unemployment Rate in Valley City is 4.0%.