La Cygne, KS
La Cygne Map
La Cygne Overview
1,427
TOTAL POPULATION
715
MALE POPULATION
712
FEMALE POPULATION
100.42
MALES / 100 FEMALES
99.58
FEMALES / 100 MALES
36.7
MEDIAN AGE
3.2
AVG FAMILY SIZE
2.6
AVG HOUSEHOLD SIZE
$25,488
PER CAPITA INCOME
$74,792
AVG FAMILY INCOME
$56,907
AVG HOUSEHOLD INCOME
52.7%
WAGE / INCOME GAP [ % ]
47.3¢/ $1
WAGE / INCOME GAP [ $ ]
0.37
INEQUALITY / GINI INDEX
617
LABOR FORCE [ PEOPLE ]
54.4%
PERCENT IN LABOR FORCE
6.2%
UNEMPLOYMENT RATE
La Cygne Zip Codes
La Cygne Area Codes
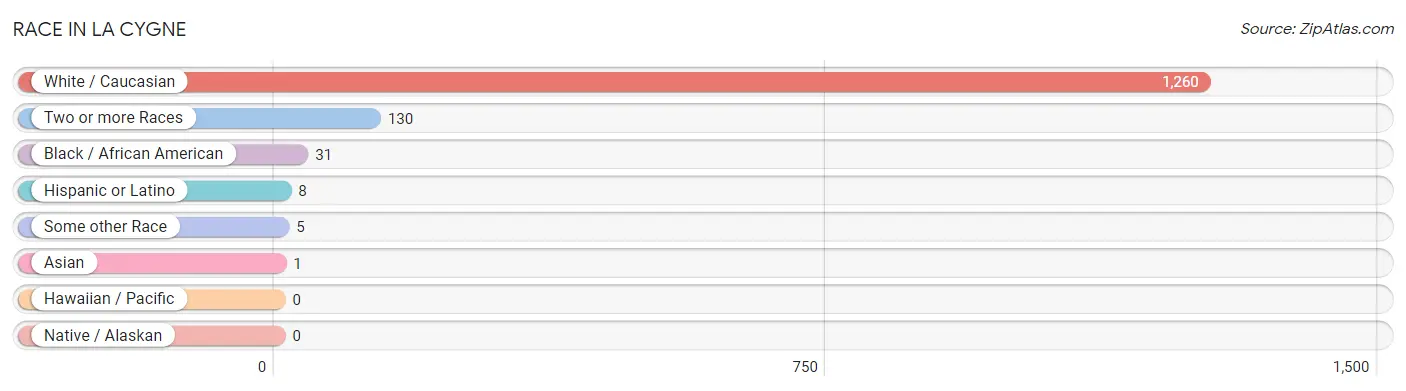
Race in La Cygne
The most populous races in La Cygne are White / Caucasian (1,260 | 88.3%), Two or more Races (130 | 9.1%), and Black / African American (31 | 2.2%).
| Race | # Population | % Population |
| Asian | 1 | 0.1% |
| Black / African American | 31 | 2.2% |
| Hawaiian / Pacific | 0 | 0.0% |
| Hispanic or Latino | 8 | 0.6% |
| Native / Alaskan | 0 | 0.0% |
| White / Caucasian | 1,260 | 88.3% |
| Two or more Races | 130 | 9.1% |
| Some other Race | 5 | 0.4% |
| Total | 1,427 | 100.0% |
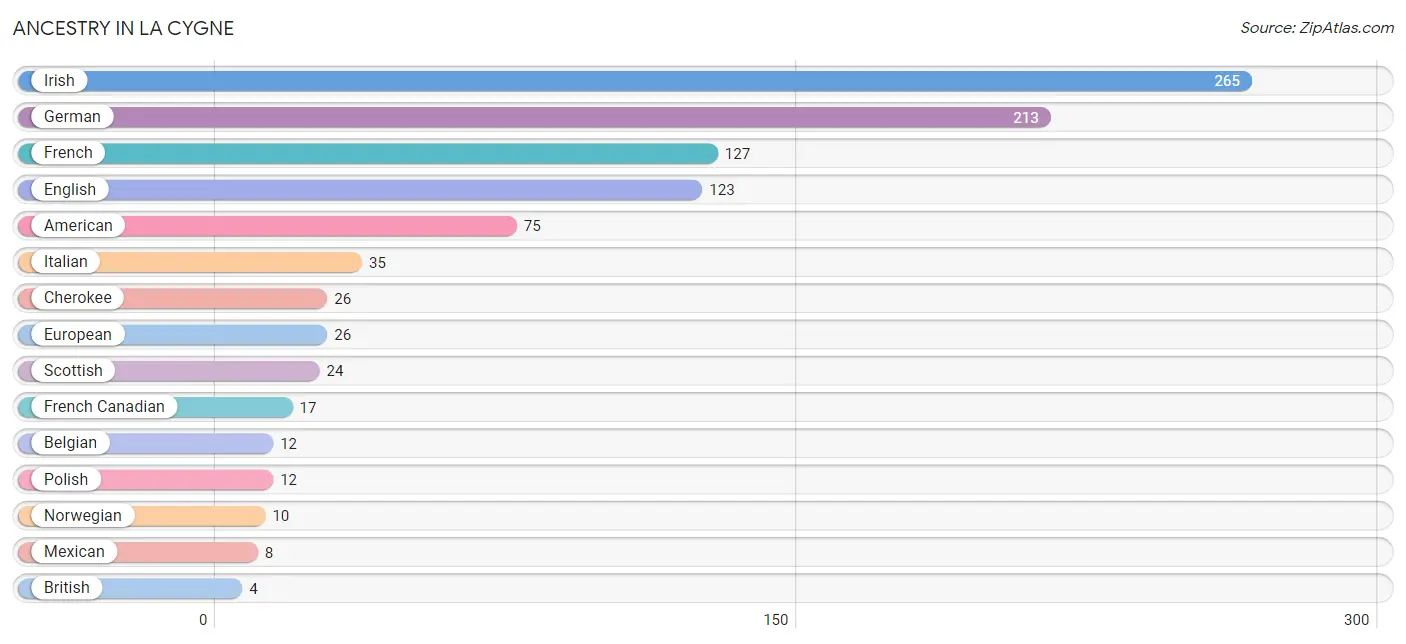
Ancestry in La Cygne
The most populous ancestries reported in La Cygne are Irish (265 | 18.6%), German (213 | 14.9%), French (127 | 8.9%), English (123 | 8.6%), and American (75 | 5.3%), together accounting for 56.3% of all La Cygne residents.
| Ancestry | # Population | % Population |
| American | 75 | 5.3% |
| Belgian | 12 | 0.8% |
| British | 4 | 0.3% |
| Cherokee | 26 | 1.8% |
| Dutch | 3 | 0.2% |
| English | 123 | 8.6% |
| European | 26 | 1.8% |
| French | 127 | 8.9% |
| French Canadian | 17 | 1.2% |
| German | 213 | 14.9% |
| Indian (Asian) | 1 | 0.1% |
| Irish | 265 | 18.6% |
| Italian | 35 | 2.5% |
| Mexican | 8 | 0.6% |
| Norwegian | 10 | 0.7% |
| Polish | 12 | 0.8% |
| Russian | 3 | 0.2% |
| Scotch-Irish | 3 | 0.2% |
| Scottish | 24 | 1.7% |
| Slovene | 4 | 0.3% | View All 20 Rows |
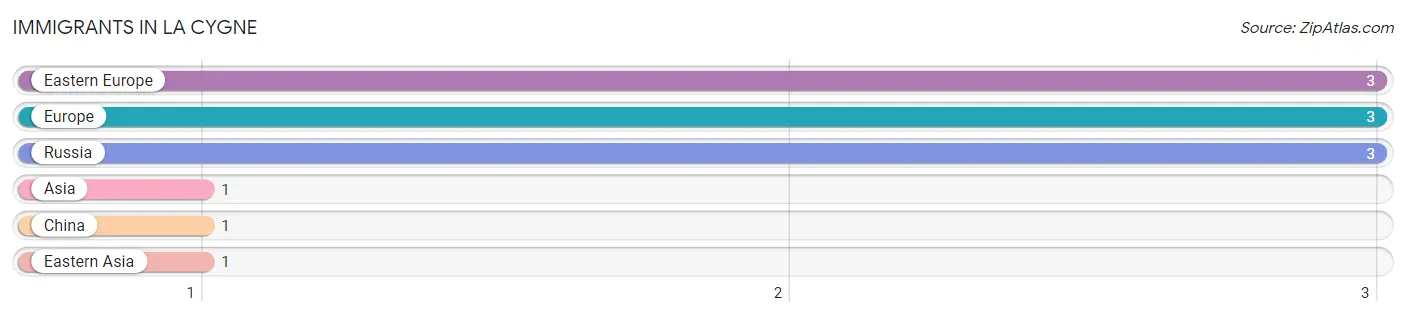
Immigrants in La Cygne
The most numerous immigrant groups reported in La Cygne came from Eastern Europe (3 | 0.2%), Europe (3 | 0.2%), Russia (3 | 0.2%), Asia (1 | 0.1%), and China (1 | 0.1%), together accounting for 0.8% of all La Cygne residents.
| Immigration Origin | # Population | % Population |
| Asia | 1 | 0.1% |
| China | 1 | 0.1% |
| Eastern Asia | 1 | 0.1% |
| Eastern Europe | 3 | 0.2% |
| Europe | 3 | 0.2% |
| Russia | 3 | 0.2% | View All 6 Rows |
Sex and Age in La Cygne
Sex and Age in La Cygne
The most populous age groups in La Cygne are 20 to 24 Years (112 | 15.7%) for men and 85 Years and over (85 | 11.9%) for women.
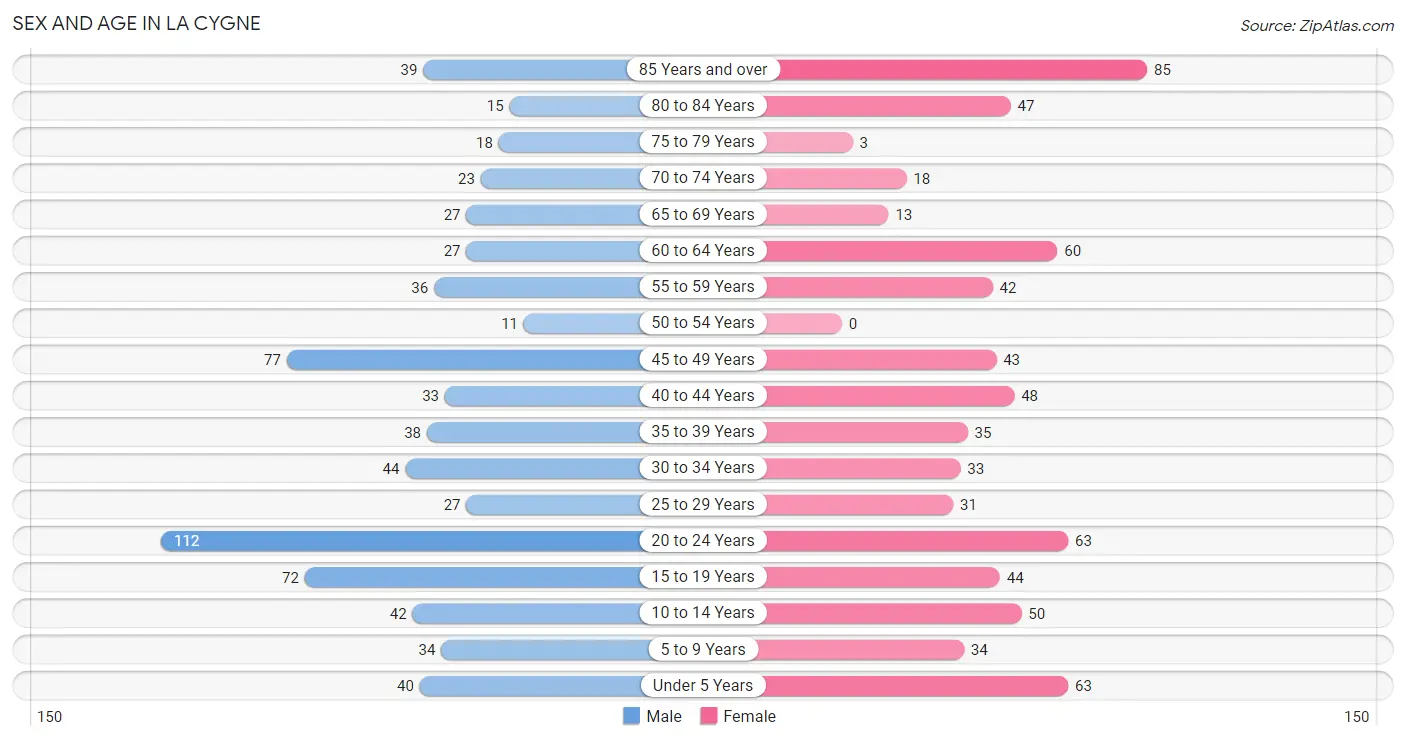
| Age Bracket | Male | Female |
| Under 5 Years | 40 (5.6%) | 63 (8.8%) |
| 5 to 9 Years | 34 (4.8%) | 34 (4.8%) |
| 10 to 14 Years | 42 (5.9%) | 50 (7.0%) |
| 15 to 19 Years | 72 (10.1%) | 44 (6.2%) |
| 20 to 24 Years | 112 (15.7%) | 63 (8.8%) |
| 25 to 29 Years | 27 (3.8%) | 31 (4.3%) |
| 30 to 34 Years | 44 (6.1%) | 33 (4.6%) |
| 35 to 39 Years | 38 (5.3%) | 35 (4.9%) |
| 40 to 44 Years | 33 (4.6%) | 48 (6.7%) |
| 45 to 49 Years | 77 (10.8%) | 43 (6.0%) |
| 50 to 54 Years | 11 (1.5%) | 0 (0.0%) |
| 55 to 59 Years | 36 (5.0%) | 42 (5.9%) |
| 60 to 64 Years | 27 (3.8%) | 60 (8.4%) |
| 65 to 69 Years | 27 (3.8%) | 13 (1.8%) |
| 70 to 74 Years | 23 (3.2%) | 18 (2.5%) |
| 75 to 79 Years | 18 (2.5%) | 3 (0.4%) |
| 80 to 84 Years | 15 (2.1%) | 47 (6.6%) |
| 85 Years and over | 39 (5.4%) | 85 (11.9%) |
| Total | 715 (100.0%) | 712 (100.0%) |
Families and Households in La Cygne
Median Family Size in La Cygne
The median family size in La Cygne is 3.25 persons per family, with married-couple families (226 | 66.7%) accounting for the largest median family size of 3.42 persons per family. On the other hand, single female/mother families (58 | 17.1%) represent the smallest median family size with 2.67 persons per family.
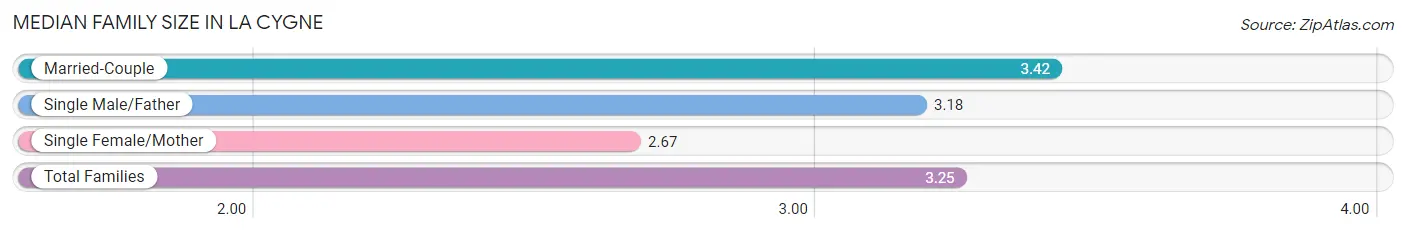
| Family Type | # Families | Family Size |
| Married-Couple | 226 (66.7%) | 3.42 |
| Single Male/Father | 55 (16.2%) | 3.18 |
| Single Female/Mother | 58 (17.1%) | 2.67 |
| Total Families | 339 (100.0%) | 3.25 |
Median Household Size in La Cygne
The median household size in La Cygne is 2.60 persons per household, with single male/father households (55 | 10.0%) accounting for the largest median household size of 3.76 persons per household. non-family households (209 | 38.1%) represent the smallest median household size with 1.11 persons per household.
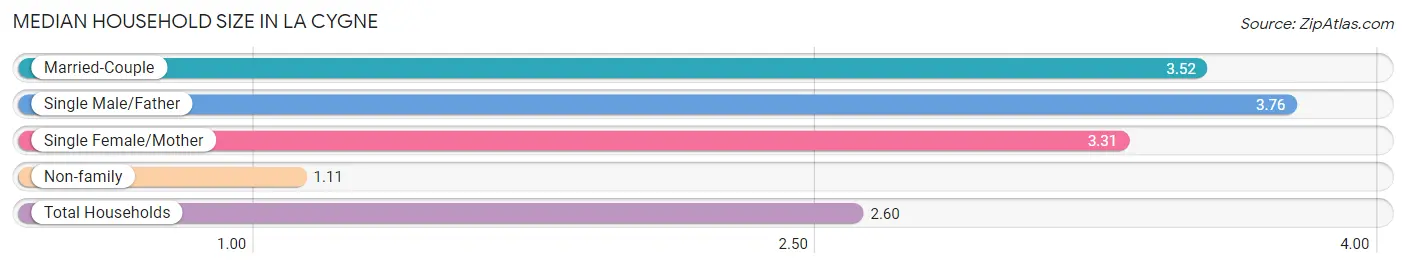
| Household Type | # Households | Household Size |
| Married-Couple | 226 (41.2%) | 3.52 |
| Single Male/Father | 55 (10.0%) | 3.76 |
| Single Female/Mother | 58 (10.6%) | 3.31 |
| Non-family | 209 (38.1%) | 1.11 |
| Total Households | 548 (100.0%) | 2.60 |
Household Size by Marriage Status in La Cygne
Out of a total of 548 households in La Cygne, 339 (61.9%) are family households, while 209 (38.1%) are nonfamily households. The most numerous type of family households are 2-person households, comprising 116, and the most common type of nonfamily households are 1-person households, comprising 194.
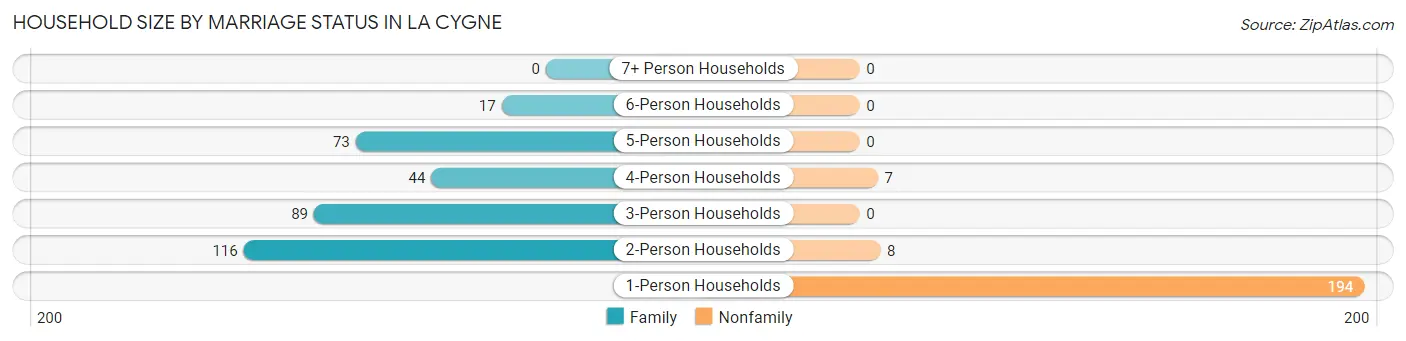
| Household Size | Family Households | Nonfamily Households |
| 1-Person Households | - | 194 (35.4%) |
| 2-Person Households | 116 (21.2%) | 8 (1.5%) |
| 3-Person Households | 89 (16.2%) | 0 (0.0%) |
| 4-Person Households | 44 (8.0%) | 7 (1.3%) |
| 5-Person Households | 73 (13.3%) | 0 (0.0%) |
| 6-Person Households | 17 (3.1%) | 0 (0.0%) |
| 7+ Person Households | 0 (0.0%) | 0 (0.0%) |
| Total | 339 (61.9%) | 209 (38.1%) |
Female Fertility in La Cygne
Fertility by Age in La Cygne
Average fertility rate in La Cygne is 54.0 births per 1,000 women. Women in the age bracket of 20 to 34 years have the highest fertility rate with 79.0 births per 1,000 women. Women in the age bracket of 20 to 34 years acount for 62.5% of all women with births.
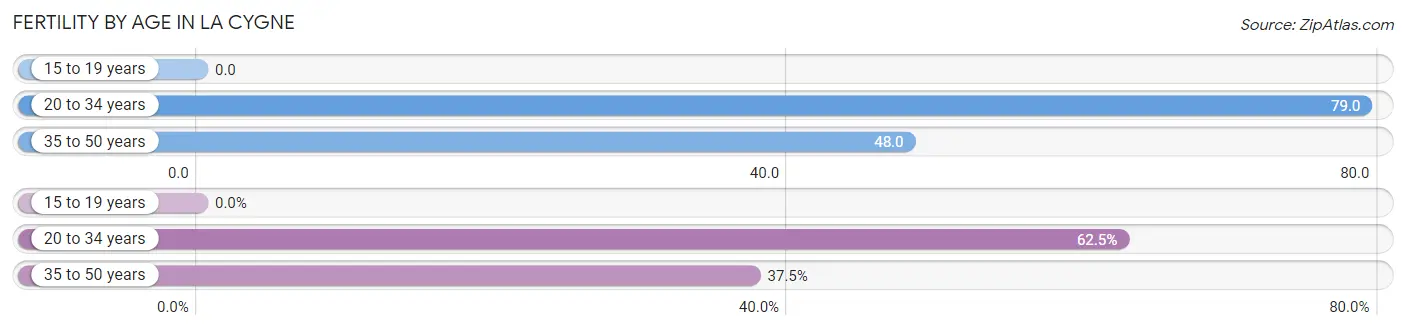
| Age Bracket | Women with Births | Births / 1,000 Women |
| 15 to 19 years | 0 (0.0%) | 0.0 |
| 20 to 34 years | 10 (62.5%) | 79.0 |
| 35 to 50 years | 6 (37.5%) | 48.0 |
| Total | 16 (100.0%) | 54.0 |
Fertility by Age by Marriage Status in La Cygne
37.5% of women with births (16) in La Cygne are married. The highest percentage of unmarried women with births falls into 20 to 34 years age bracket with 100.0% of them unmarried at the time of birth, while the lowest percentage of unmarried women with births belong to 35 to 50 years age bracket with 0.0% of them unmarried.
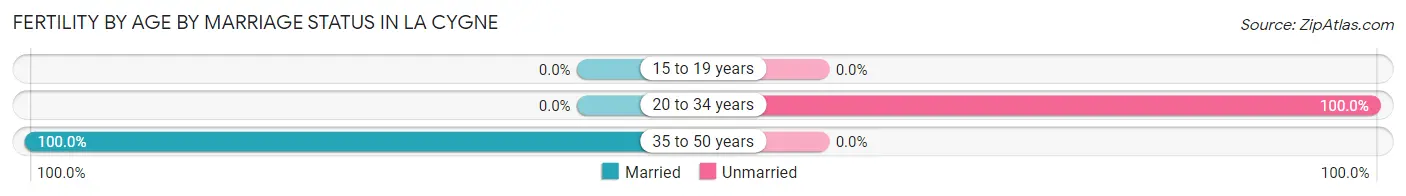
| Age Bracket | Married | Unmarried |
| 15 to 19 years | 0 (0.0%) | 0 (0.0%) |
| 20 to 34 years | 0 (0.0%) | 10 (100.0%) |
| 35 to 50 years | 6 (100.0%) | 0 (0.0%) |
| Total | 6 (37.5%) | 10 (62.5%) |
Fertility by Education in La Cygne
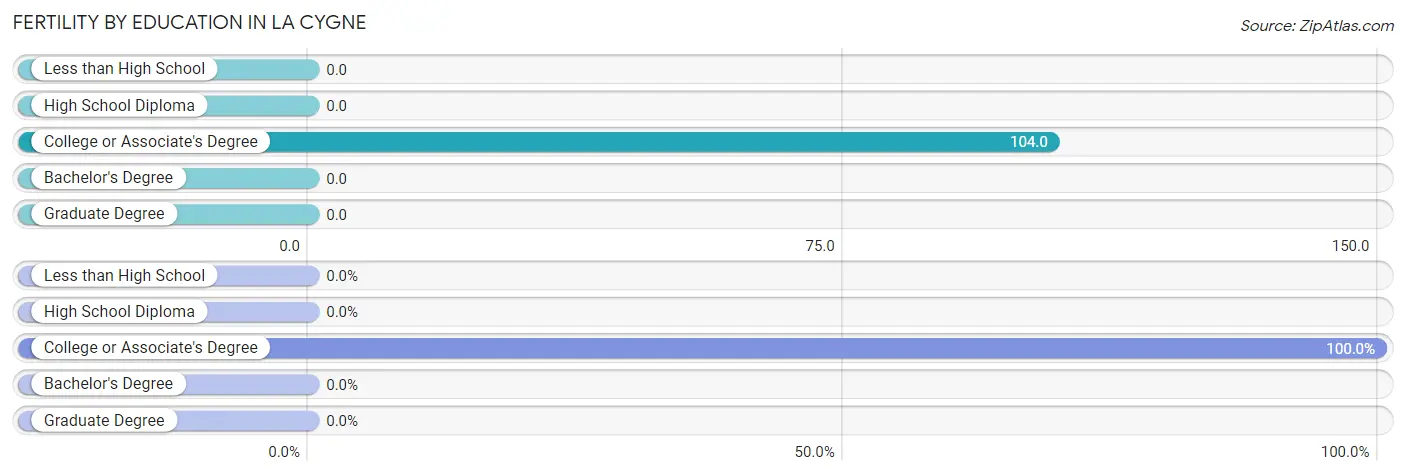
| Educational Attainment | Women with Births | Births / 1,000 Women |
| Less than High School | 0 (0.0%) | 0.0 |
| High School Diploma | 0 (0.0%) | 0.0 |
| College or Associate's Degree | 16 (100.0%) | 104.0 |
| Bachelor's Degree | 0 (0.0%) | 0.0 |
| Graduate Degree | 0 (0.0%) | 0.0 |
| Total | 16 (100.0%) | 54.0 |
Fertility by Education by Marriage Status in La Cygne
62.5% of women with births in La Cygne are unmarried. Women with the educational attainment of college or associate's degree are most likely to be married with 37.5% of them married at childbirth, while women with the educational attainment of college or associate's degree are least likely to be married with 62.5% of them unmarried at childbirth.
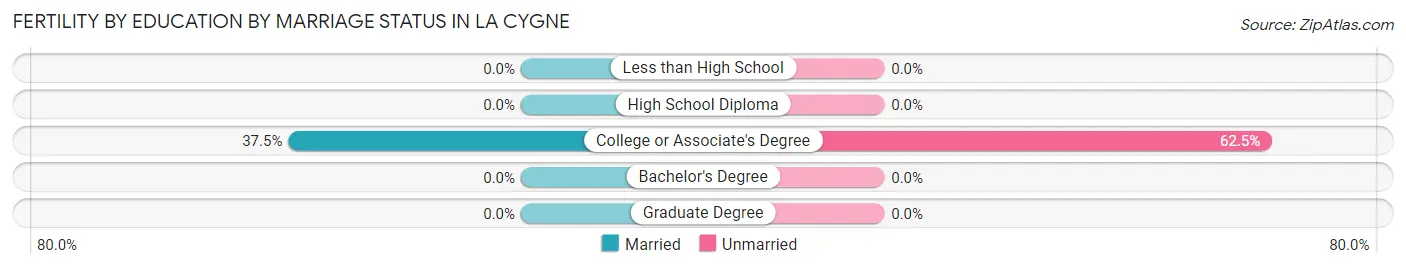
| Educational Attainment | Married | Unmarried |
| Less than High School | 0 (0.0%) | 0 (0.0%) |
| High School Diploma | 0 (0.0%) | 0 (0.0%) |
| College or Associate's Degree | 6 (37.5%) | 10 (62.5%) |
| Bachelor's Degree | 0 (0.0%) | 0 (0.0%) |
| Graduate Degree | 0 (0.0%) | 0 (0.0%) |
| Total | 6 (37.5%) | 10 (62.5%) |
Income in La Cygne
Income Overview in La Cygne
Per Capita Income in La Cygne is $25,488, while median incomes of families and households are $74,792 and $56,907 respectively.
| Characteristic | Number | Measure |
| Per Capita Income | 1,427 | $25,488 |
| Median Family Income | 339 | $74,792 |
| Mean Family Income | 339 | $69,922 |
| Median Household Income | 548 | $56,907 |
| Mean Household Income | 548 | $61,137 |
| Income Deficit | 339 | $0 |
| Wage / Income Gap (%) | 1,427 | 52.71% |
| Wage / Income Gap ($) | 1,427 | 47.29¢ per $1 |
| Gini / Inequality Index | 1,427 | 0.37 |
Earnings by Sex in La Cygne
Average Earnings in La Cygne are $36,284, $47,417 for men and $22,422 for women, a difference of 52.7%.
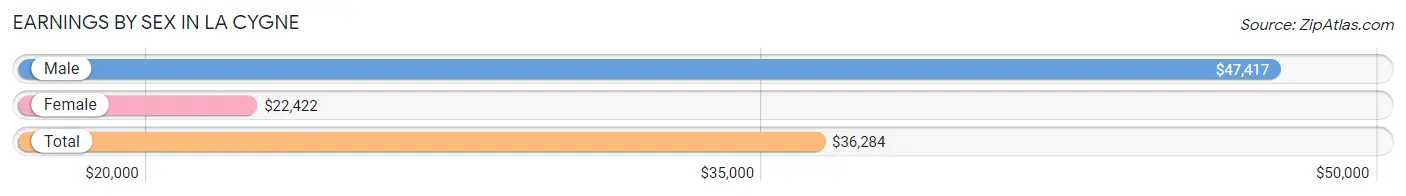
| Sex | Number | Average Earnings |
| Male | 341 (54.8%) | $47,417 |
| Female | 281 (45.2%) | $22,422 |
| Total | 622 (100.0%) | $36,284 |
Earnings by Sex by Income Bracket in La Cygne
The most common earnings brackets in La Cygne are $75,000 to $99,999 for men (65 | 19.1%) and $7,500 to $9,999 for women (35 | 12.5%).
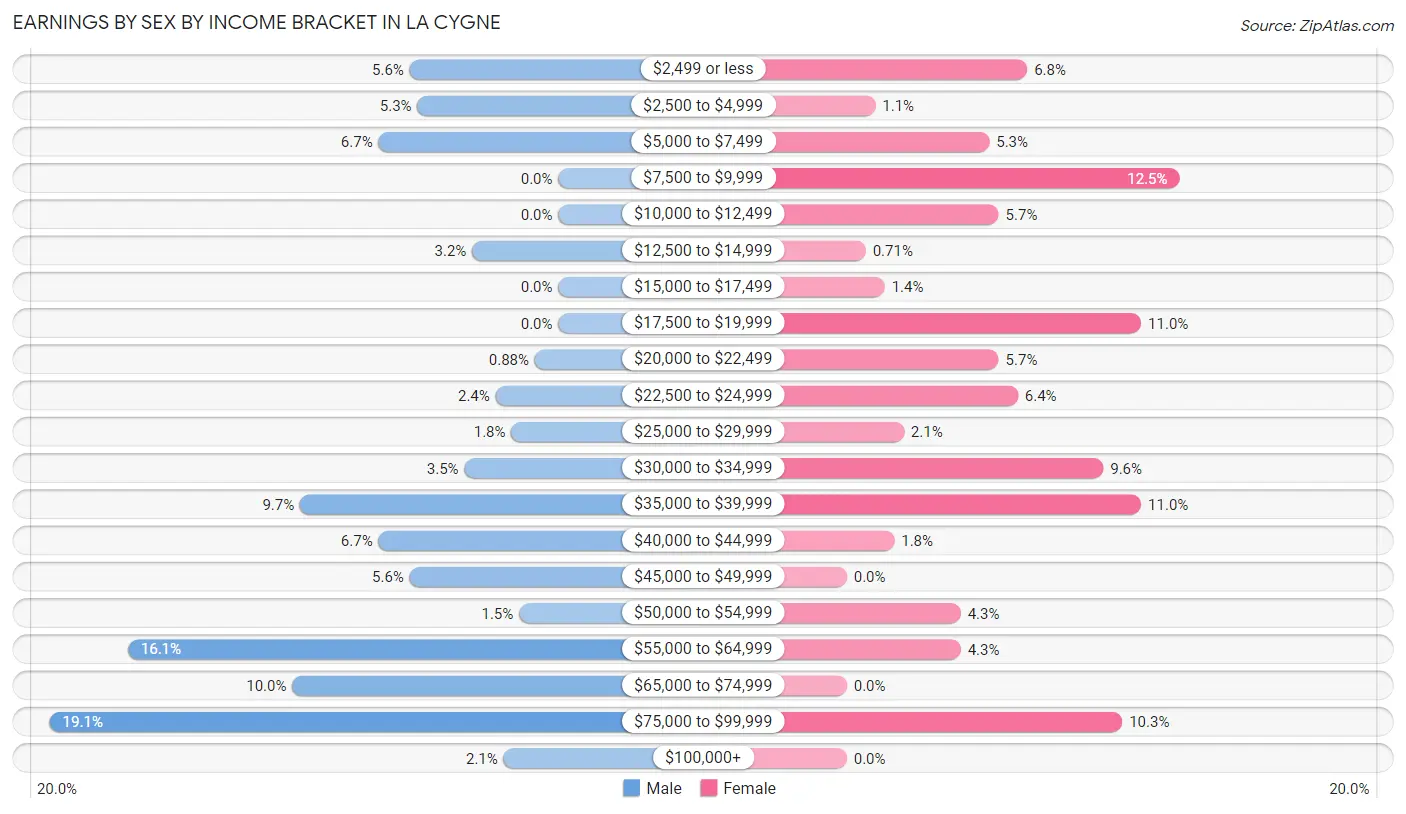
| Income | Male | Female |
| $2,499 or less | 19 (5.6%) | 19 (6.8%) |
| $2,500 to $4,999 | 18 (5.3%) | 3 (1.1%) |
| $5,000 to $7,499 | 23 (6.7%) | 15 (5.3%) |
| $7,500 to $9,999 | 0 (0.0%) | 35 (12.5%) |
| $10,000 to $12,499 | 0 (0.0%) | 16 (5.7%) |
| $12,500 to $14,999 | 11 (3.2%) | 2 (0.7%) |
| $15,000 to $17,499 | 0 (0.0%) | 4 (1.4%) |
| $17,500 to $19,999 | 0 (0.0%) | 31 (11.0%) |
| $20,000 to $22,499 | 3 (0.9%) | 16 (5.7%) |
| $22,500 to $24,999 | 8 (2.4%) | 18 (6.4%) |
| $25,000 to $29,999 | 6 (1.8%) | 6 (2.1%) |
| $30,000 to $34,999 | 12 (3.5%) | 27 (9.6%) |
| $35,000 to $39,999 | 33 (9.7%) | 31 (11.0%) |
| $40,000 to $44,999 | 23 (6.7%) | 5 (1.8%) |
| $45,000 to $49,999 | 19 (5.6%) | 0 (0.0%) |
| $50,000 to $54,999 | 5 (1.5%) | 12 (4.3%) |
| $55,000 to $64,999 | 55 (16.1%) | 12 (4.3%) |
| $65,000 to $74,999 | 34 (10.0%) | 0 (0.0%) |
| $75,000 to $99,999 | 65 (19.1%) | 29 (10.3%) |
| $100,000+ | 7 (2.1%) | 0 (0.0%) |
| Total | 341 (100.0%) | 281 (100.0%) |
Earnings by Sex by Educational Attainment in La Cygne
Average earnings in La Cygne are $61,875 for men and $31,250 for women, a difference of 49.5%. Men with an educational attainment of high school diploma enjoy the highest average annual earnings of $65,250, while those with college or associate's degree education earn the least with $49,688. Women with an educational attainment of high school diploma earn the most with the average annual earnings of $31,250, while those with college or associate's degree education have the smallest earnings of $27,083.
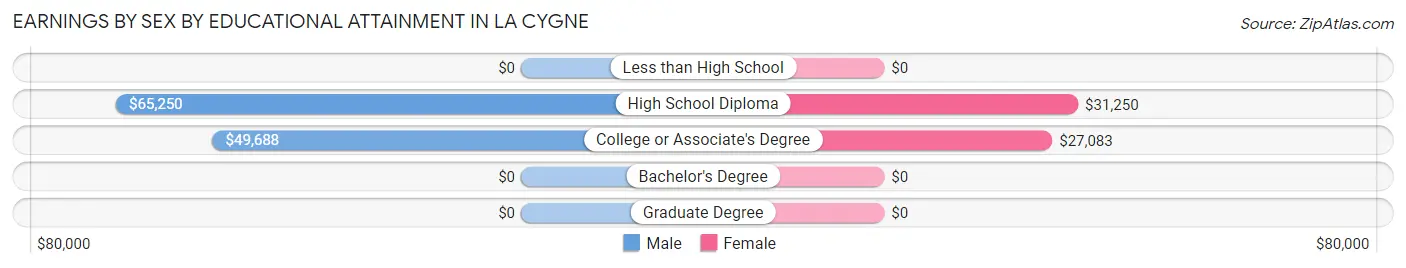
| Educational Attainment | Male Income | Female Income |
| Less than High School | - | - |
| High School Diploma | $65,250 | $31,250 |
| College or Associate's Degree | $49,688 | $27,083 |
| Bachelor's Degree | - | - |
| Graduate Degree | - | - |
| Total | $61,875 | $31,250 |
Family Income in La Cygne
Family Income Brackets in La Cygne
According to the La Cygne family income data, there are 111 families falling into the $75,000 to $99,999 income range, which is the most common income bracket and makes up 32.7% of all families.
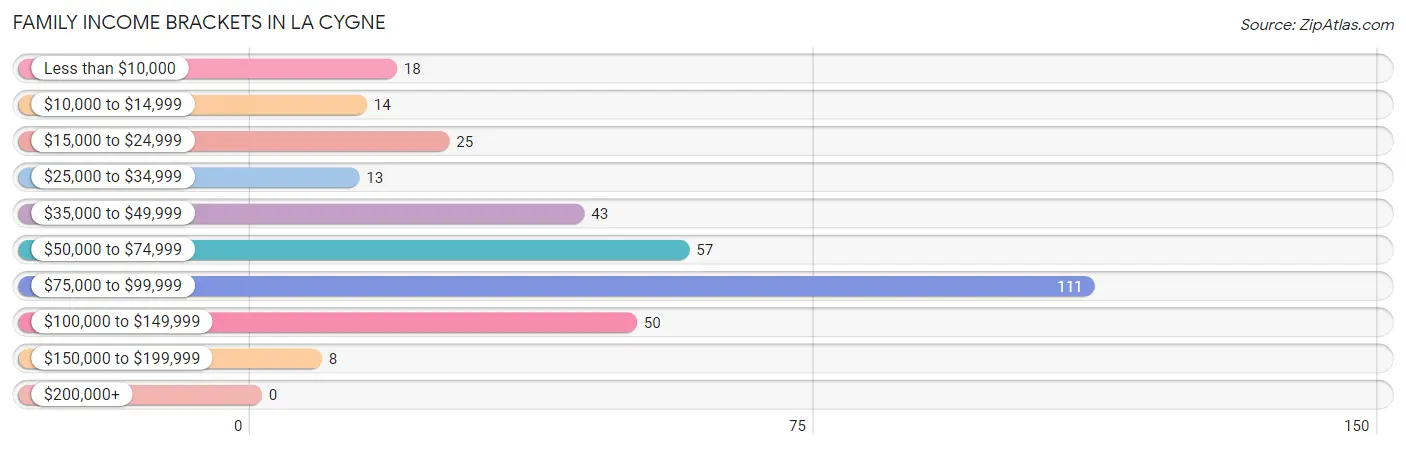
| Income Bracket | # Families | % Families |
| Less than $10,000 | 18 | 5.3% |
| $10,000 to $14,999 | 14 | 4.1% |
| $15,000 to $24,999 | 25 | 7.4% |
| $25,000 to $34,999 | 13 | 3.8% |
| $35,000 to $49,999 | 43 | 12.7% |
| $50,000 to $74,999 | 57 | 16.8% |
| $75,000 to $99,999 | 111 | 32.7% |
| $100,000 to $149,999 | 50 | 14.7% |
| $150,000 to $199,999 | 8 | 2.4% |
| $200,000+ | 0 | 0.0% |
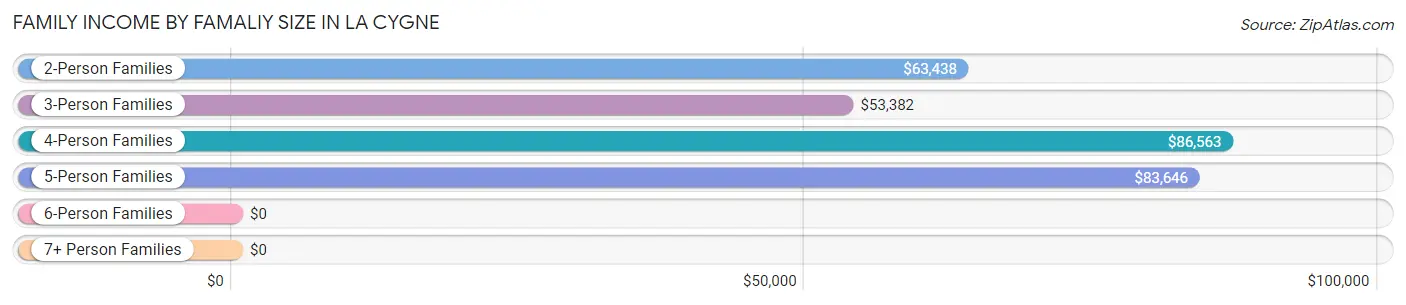
Family Income by Famaliy Size in La Cygne
4-person families (64 | 18.9%) account for the highest median family income in La Cygne with $86,563 per family, while 2-person families (141 | 41.6%) have the highest median income of $31,719 per family member.
| Income Bracket | # Families | Median Income |
| 2-Person Families | 141 (41.6%) | $63,438 |
| 3-Person Families | 68 (20.1%) | $53,382 |
| 4-Person Families | 64 (18.9%) | $86,563 |
| 5-Person Families | 61 (18.0%) | $83,646 |
| 6-Person Families | 5 (1.5%) | $0 |
| 7+ Person Families | 0 (0.0%) | $0 |
| Total | 339 (100.0%) | $74,792 |
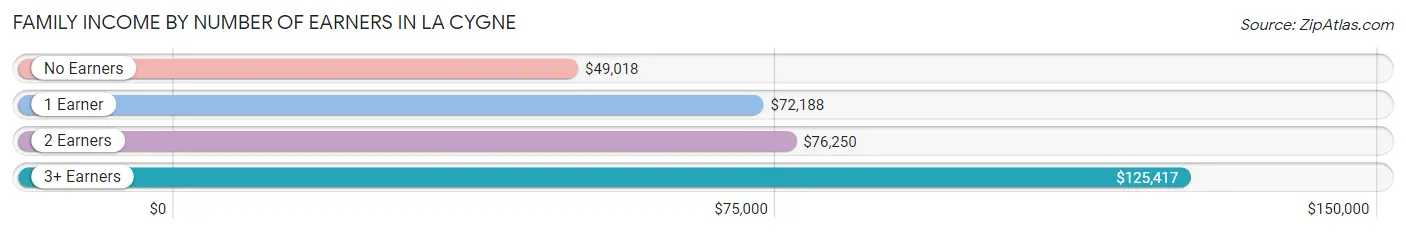
Family Income by Number of Earners in La Cygne
The median family income in La Cygne is $74,792, with families comprising 3+ earners (36) having the highest median family income of $125,417, while families with no earners (59) have the lowest median family income of $49,018, accounting for 10.6% and 17.4% of families, respectively.
| Number of Earners | # Families | Median Income |
| No Earners | 59 (17.4%) | $49,018 |
| 1 Earner | 144 (42.5%) | $72,188 |
| 2 Earners | 100 (29.5%) | $76,250 |
| 3+ Earners | 36 (10.6%) | $125,417 |
| Total | 339 (100.0%) | $74,792 |
Household Income in La Cygne
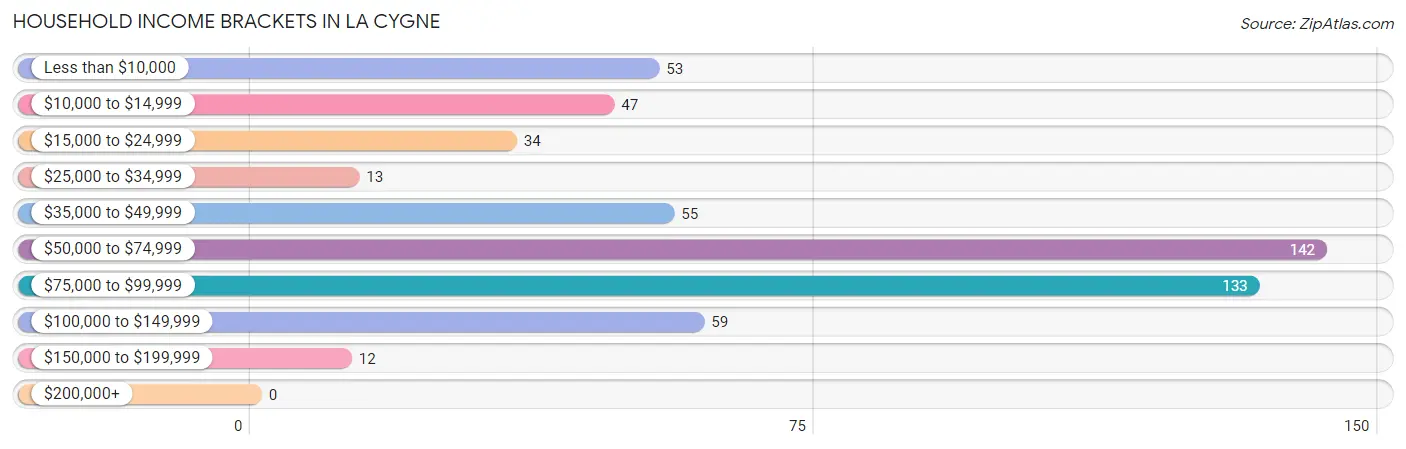
Household Income Brackets in La Cygne
With 142 households falling in the category, the $50,000 to $74,999 income range is the most frequent in La Cygne, accounting for 25.9% of all households.
| Income Bracket | # Households | % Households |
| Less than $10,000 | 53 | 9.7% |
| $10,000 to $14,999 | 47 | 8.6% |
| $15,000 to $24,999 | 34 | 6.2% |
| $25,000 to $34,999 | 13 | 2.4% |
| $35,000 to $49,999 | 55 | 10.0% |
| $50,000 to $74,999 | 142 | 25.9% |
| $75,000 to $99,999 | 133 | 24.3% |
| $100,000 to $149,999 | 59 | 10.8% |
| $150,000 to $199,999 | 12 | 2.2% |
| $200,000+ | 0 | 0.0% |
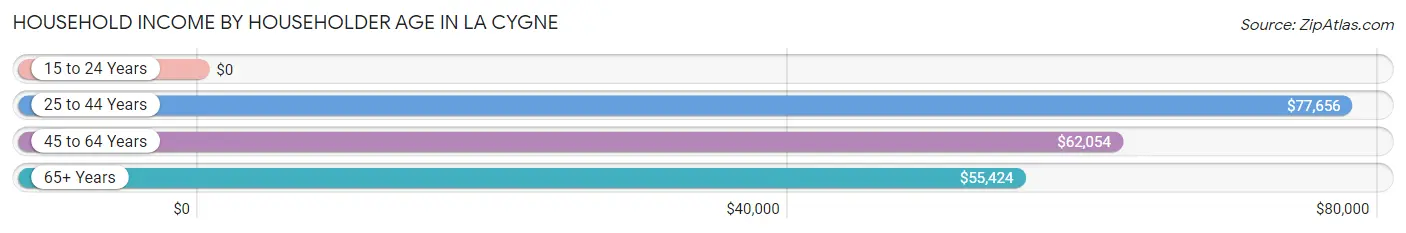
Household Income by Householder Age in La Cygne
The median household income in La Cygne is $56,907, with the highest median household income of $77,656 found in the 25 to 44 years age bracket for the primary householder. A total of 167 households (30.5%) fall into this category. Meanwhile, the 15 to 24 years age bracket for the primary householder has the lowest median household income of $0, with 18 households (3.3%) in this group.
| Income Bracket | # Households | Median Income |
| 15 to 24 Years | 18 (3.3%) | $0 |
| 25 to 44 Years | 167 (30.5%) | $77,656 |
| 45 to 64 Years | 157 (28.6%) | $62,054 |
| 65+ Years | 206 (37.6%) | $55,424 |
| Total | 548 (100.0%) | $56,907 |
Poverty in La Cygne
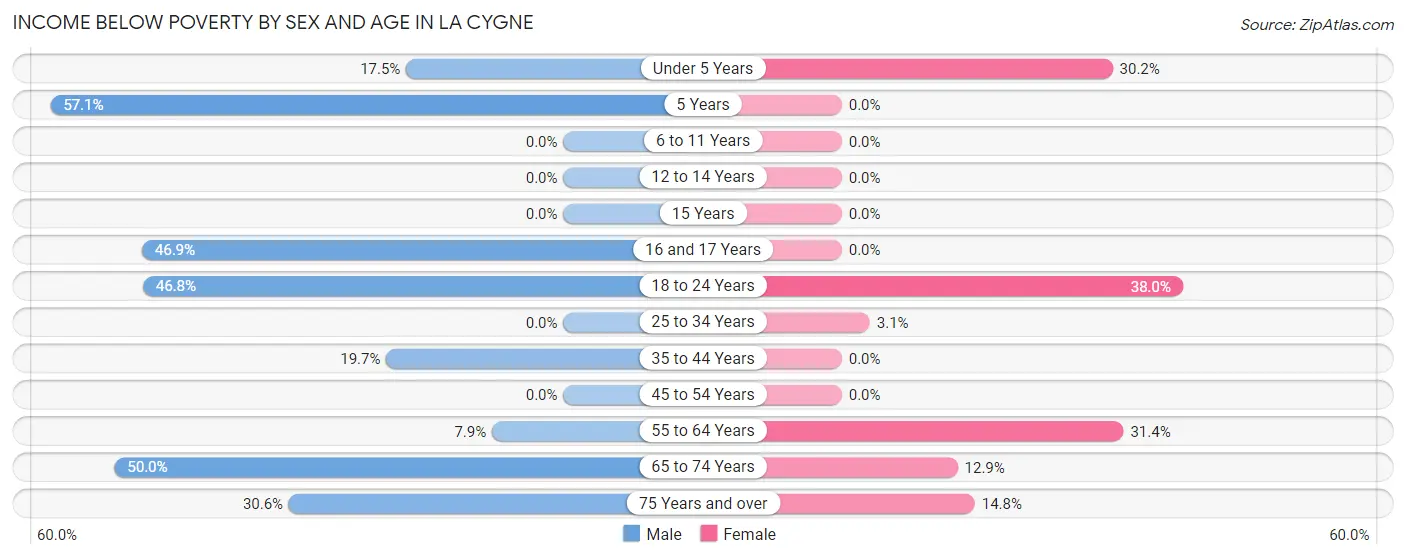
Income Below Poverty by Sex and Age in La Cygne
With 22.2% poverty level for males and 15.2% for females among the residents of La Cygne, 5 year old males and 18 to 24 year old females are the most vulnerable to poverty, with 4 males (57.1%) and 30 females (38.0%) in their respective age groups living below the poverty level.
| Age Bracket | Male | Female |
| Under 5 Years | 7 (17.5%) | 19 (30.2%) |
| 5 Years | 4 (57.1%) | 0 (0.0%) |
| 6 to 11 Years | 0 (0.0%) | 0 (0.0%) |
| 12 to 14 Years | 0 (0.0%) | 0 (0.0%) |
| 15 Years | 0 (0.0%) | 0 (0.0%) |
| 16 and 17 Years | 23 (46.9%) | 0 (0.0%) |
| 18 to 24 Years | 59 (46.8%) | 30 (38.0%) |
| 25 to 34 Years | 0 (0.0%) | 2 (3.1%) |
| 35 to 44 Years | 14 (19.7%) | 0 (0.0%) |
| 45 to 54 Years | 0 (0.0%) | 0 (0.0%) |
| 55 to 64 Years | 5 (7.9%) | 32 (31.4%) |
| 65 to 74 Years | 25 (50.0%) | 4 (12.9%) |
| 75 Years and over | 22 (30.6%) | 20 (14.8%) |
| Total | 159 (22.2%) | 107 (15.2%) |
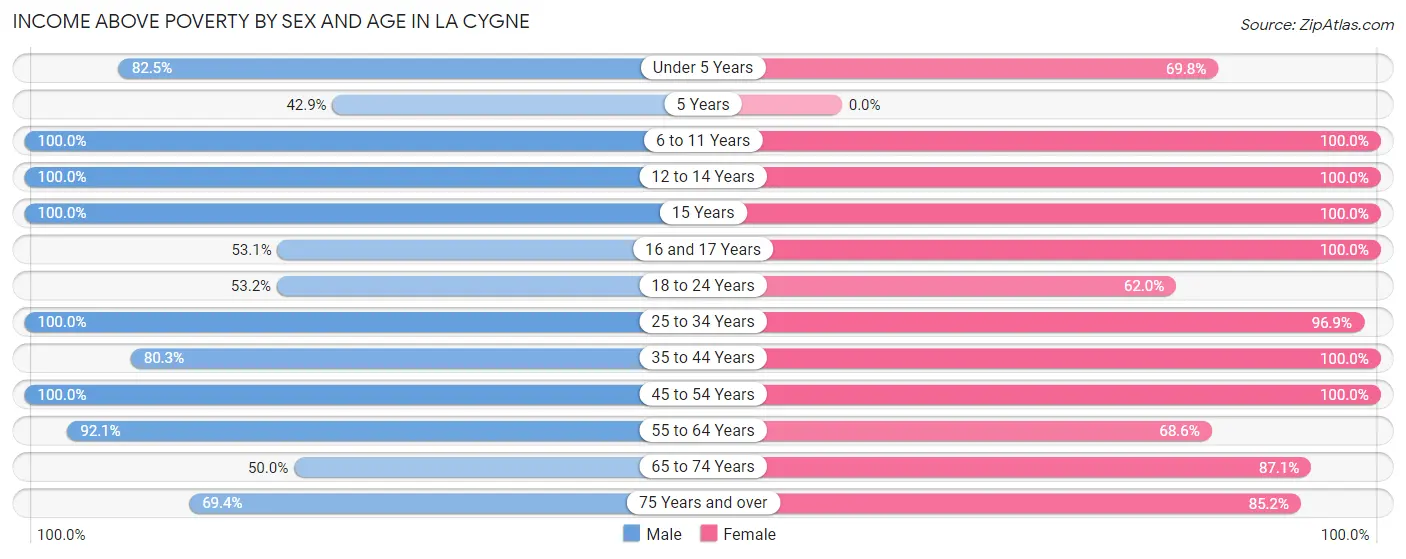
Income Above Poverty by Sex and Age in La Cygne
According to the poverty statistics in La Cygne, males aged 6 to 11 years and females aged 6 to 11 years are the age groups that are most secure financially, with 100.0% of males and 100.0% of females in these age groups living above the poverty line.
| Age Bracket | Male | Female |
| Under 5 Years | 33 (82.5%) | 44 (69.8%) |
| 5 Years | 3 (42.9%) | 0 (0.0%) |
| 6 to 11 Years | 30 (100.0%) | 66 (100.0%) |
| 12 to 14 Years | 39 (100.0%) | 10 (100.0%) |
| 15 Years | 9 (100.0%) | 21 (100.0%) |
| 16 and 17 Years | 26 (53.1%) | 7 (100.0%) |
| 18 to 24 Years | 67 (53.2%) | 49 (62.0%) |
| 25 to 34 Years | 71 (100.0%) | 62 (96.9%) |
| 35 to 44 Years | 57 (80.3%) | 83 (100.0%) |
| 45 to 54 Years | 88 (100.0%) | 43 (100.0%) |
| 55 to 64 Years | 58 (92.1%) | 70 (68.6%) |
| 65 to 74 Years | 25 (50.0%) | 27 (87.1%) |
| 75 Years and over | 50 (69.4%) | 115 (85.2%) |
| Total | 556 (77.8%) | 597 (84.8%) |
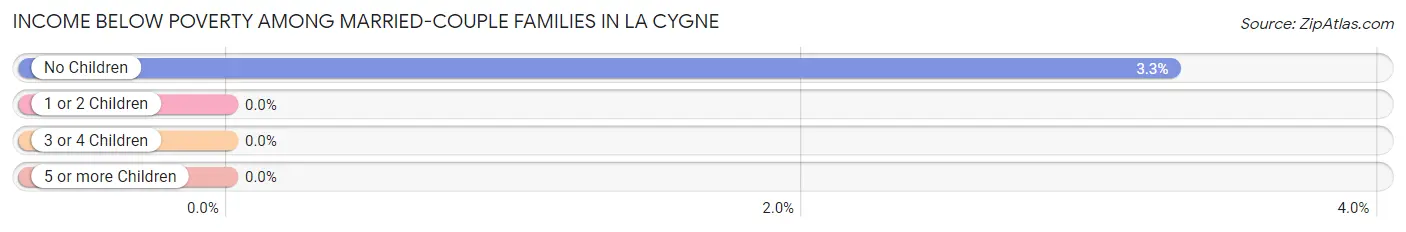
Income Below Poverty Among Married-Couple Families in La Cygne
The poverty statistics for married-couple families in La Cygne show that 1.8% or 4 of the total 226 families live below the poverty line. Families with no children have the highest poverty rate of 3.3%, comprising of 4 families. On the other hand, families with 1 or 2 children have the lowest poverty rate of 0.0%, which includes 0 families.
| Children | Above Poverty | Below Poverty |
| No Children | 118 (96.7%) | 4 (3.3%) |
| 1 or 2 Children | 68 (100.0%) | 0 (0.0%) |
| 3 or 4 Children | 36 (100.0%) | 0 (0.0%) |
| 5 or more Children | 0 (0.0%) | 0 (0.0%) |
| Total | 222 (98.2%) | 4 (1.8%) |
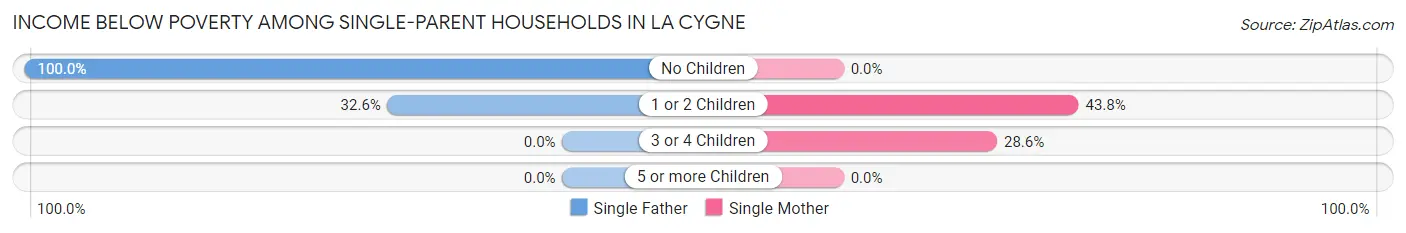
Income Below Poverty Among Single-Parent Households in La Cygne
According to the poverty data in La Cygne, 47.3% or 26 single-father households and 27.6% or 16 single-mother households are living below the poverty line. Among single-father households, those with no children have the highest poverty rate, with 12 households (100.0%) experiencing poverty. Likewise, among single-mother households, those with 1 or 2 children have the highest poverty rate, with 14 households (43.8%) falling below the poverty line.
| Children | Single Father | Single Mother |
| No Children | 12 (100.0%) | 0 (0.0%) |
| 1 or 2 Children | 14 (32.6%) | 14 (43.8%) |
| 3 or 4 Children | 0 (0.0%) | 2 (28.6%) |
| 5 or more Children | 0 (0.0%) | 0 (0.0%) |
| Total | 26 (47.3%) | 16 (27.6%) |
Income Below Poverty Among Married-Couple vs Single-Parent Households in La Cygne
The poverty data for La Cygne shows that 4 of the married-couple family households (1.8%) and 42 of the single-parent households (37.2%) are living below the poverty level. Within the married-couple family households, those with no children have the highest poverty rate, with 4 households (3.3%) falling below the poverty line. Among the single-parent households, those with no children have the highest poverty rate, with 12 household (38.7%) living below poverty.
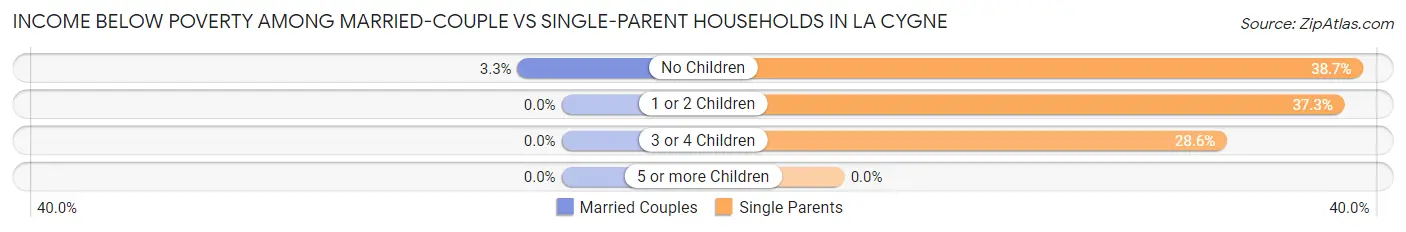
| Children | Married-Couple Families | Single-Parent Households |
| No Children | 4 (3.3%) | 12 (38.7%) |
| 1 or 2 Children | 0 (0.0%) | 28 (37.3%) |
| 3 or 4 Children | 0 (0.0%) | 2 (28.6%) |
| 5 or more Children | 0 (0.0%) | 0 (0.0%) |
| Total | 4 (1.8%) | 42 (37.2%) |
Employment Characteristics in La Cygne
Employment by Class of Employer in La Cygne
Among the 579 employed individuals in La Cygne, private company employees (392 | 67.7%), self-employed (not incorporated) (75 | 13.0%), and local government employees (50 | 8.6%) make up the most common classes of employment.
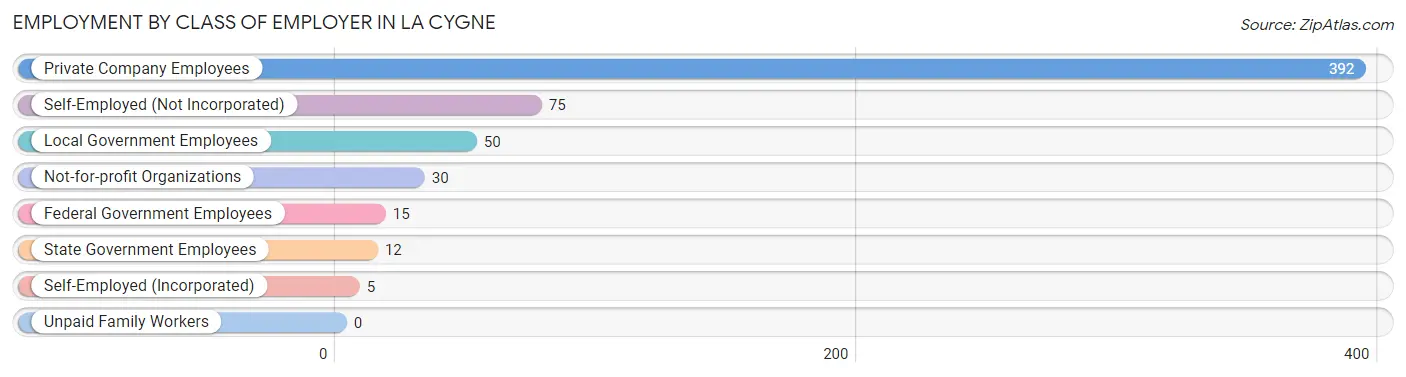
| Employer Class | # Employees | % Employees |
| Private Company Employees | 392 | 67.7% |
| Self-Employed (Incorporated) | 5 | 0.9% |
| Self-Employed (Not Incorporated) | 75 | 13.0% |
| Not-for-profit Organizations | 30 | 5.2% |
| Local Government Employees | 50 | 8.6% |
| State Government Employees | 12 | 2.1% |
| Federal Government Employees | 15 | 2.6% |
| Unpaid Family Workers | 0 | 0.0% |
| Total | 579 | 100.0% |
Employment Status by Age in La Cygne
According to the labor force statistics for La Cygne, out of the total population over 16 years of age (1,134), 54.4% or 617 individuals are in the labor force, with 6.2% or 38 of them unemployed. The age group with the highest labor force participation rate is 30 to 34 years, with 92.2% or 71 individuals in the labor force. Within the labor force, the 20 to 24 years age range has the highest percentage of unemployed individuals, with 16.0% or 23 of them being unemployed.
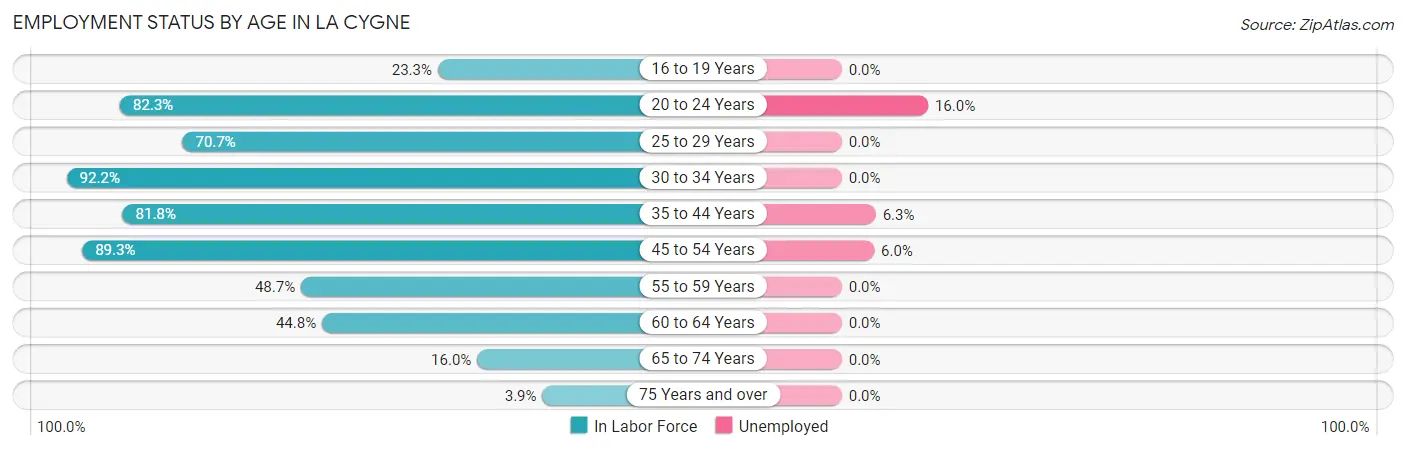
| Age Bracket | In Labor Force | Unemployed |
| 16 to 19 Years | 20 (23.3%) | 0 (0.0%) |
| 20 to 24 Years | 144 (82.3%) | 23 (16.0%) |
| 25 to 29 Years | 41 (70.7%) | 0 (0.0%) |
| 30 to 34 Years | 71 (92.2%) | 0 (0.0%) |
| 35 to 44 Years | 126 (81.8%) | 8 (6.3%) |
| 45 to 54 Years | 117 (89.3%) | 7 (6.0%) |
| 55 to 59 Years | 38 (48.7%) | 0 (0.0%) |
| 60 to 64 Years | 39 (44.8%) | 0 (0.0%) |
| 65 to 74 Years | 13 (16.0%) | 0 (0.0%) |
| 75 Years and over | 8 (3.9%) | 0 (0.0%) |
| Total | 617 (54.4%) | 38 (6.2%) |
Employment Status by Educational Attainment in La Cygne
According to labor force statistics for La Cygne, 73.8% of individuals (432) out of the total population between 25 and 64 years of age (585) are in the labor force, with 3.5% or 15 of them being unemployed. The group with the highest labor force participation rate are those with the educational attainment of high school diploma, with 91.7% or 155 individuals in the labor force. Within the labor force, individuals with bachelor's degree or higher education have the highest percentage of unemployment, with 17.1% or 6 of them being unemployed.
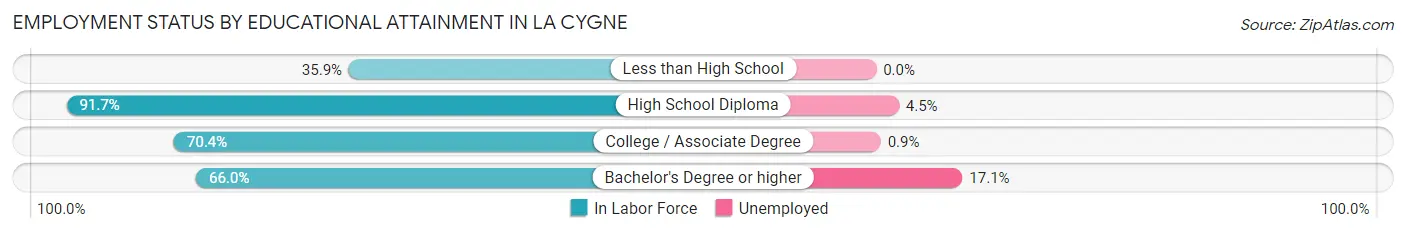
| Educational Attainment | In Labor Force | Unemployed |
| Less than High School | 14 (35.9%) | 0 (0.0%) |
| High School Diploma | 155 (91.7%) | 8 (4.5%) |
| College / Associate Degree | 228 (70.4%) | 3 (0.9%) |
| Bachelor's Degree or higher | 35 (66.0%) | 9 (17.1%) |
| Total | 432 (73.8%) | 20 (3.5%) |
Employment Occupations by Sex in La Cygne
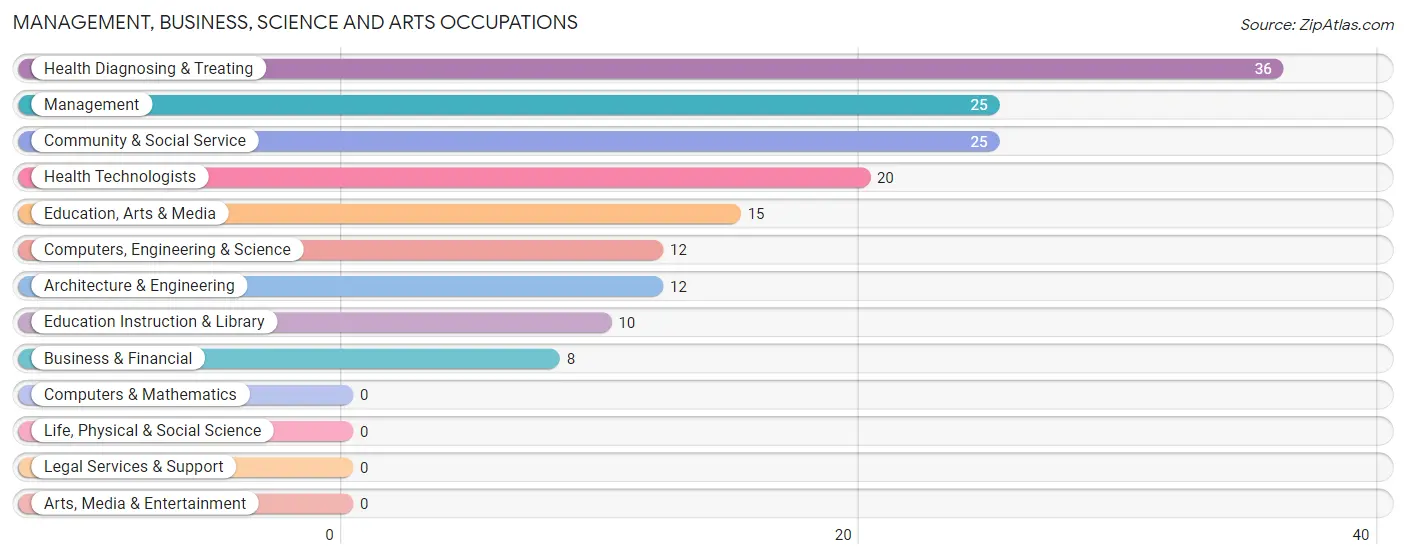
Management, Business, Science and Arts Occupations
The most common Management, Business, Science and Arts occupations in La Cygne are Health Diagnosing & Treating (36 | 6.2%), Management (25 | 4.3%), Community & Social Service (25 | 4.3%), Health Technologists (20 | 3.5%), and Education, Arts & Media (15 | 2.6%).
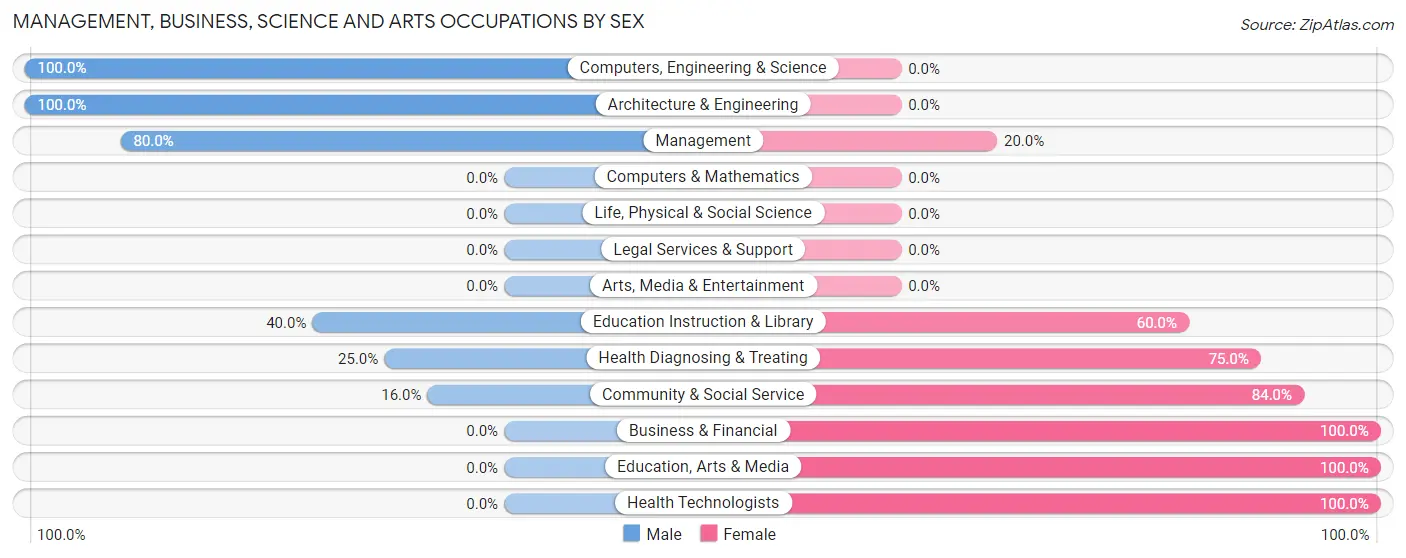
Management, Business, Science and Arts Occupations by Sex
Within the Management, Business, Science and Arts occupations in La Cygne, the most male-oriented occupations are Computers, Engineering & Science (100.0%), Architecture & Engineering (100.0%), and Management (80.0%), while the most female-oriented occupations are Business & Financial (100.0%), Education, Arts & Media (100.0%), and Health Technologists (100.0%).
| Occupation | Male | Female |
| Management | 20 (80.0%) | 5 (20.0%) |
| Business & Financial | 0 (0.0%) | 8 (100.0%) |
| Computers, Engineering & Science | 12 (100.0%) | 0 (0.0%) |
| Computers & Mathematics | 0 (0.0%) | 0 (0.0%) |
| Architecture & Engineering | 12 (100.0%) | 0 (0.0%) |
| Life, Physical & Social Science | 0 (0.0%) | 0 (0.0%) |
| Community & Social Service | 4 (16.0%) | 21 (84.0%) |
| Education, Arts & Media | 0 (0.0%) | 15 (100.0%) |
| Legal Services & Support | 0 (0.0%) | 0 (0.0%) |
| Education Instruction & Library | 4 (40.0%) | 6 (60.0%) |
| Arts, Media & Entertainment | 0 (0.0%) | 0 (0.0%) |
| Health Diagnosing & Treating | 9 (25.0%) | 27 (75.0%) |
| Health Technologists | 0 (0.0%) | 20 (100.0%) |
| Total (Category) | 45 (42.4%) | 61 (57.6%) |
| Total (Overall) | 320 (55.3%) | 259 (44.7%) |
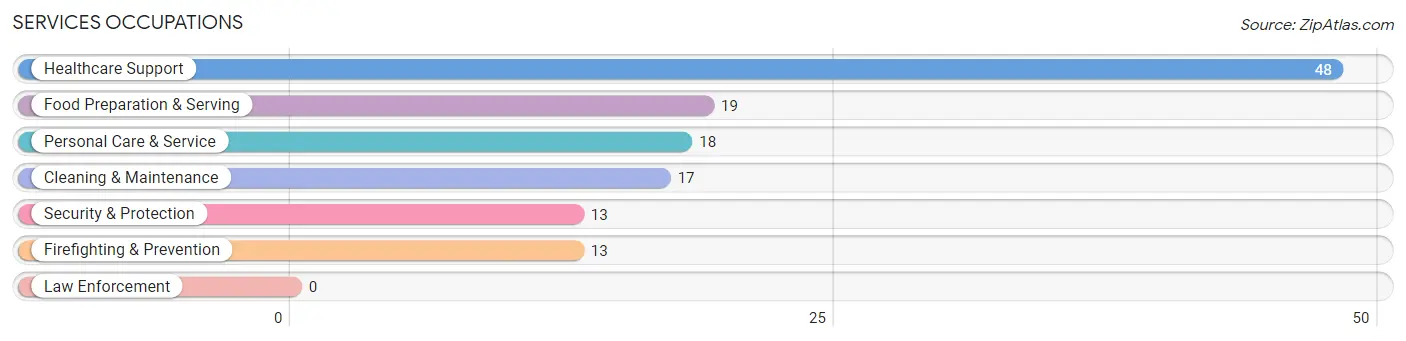
Services Occupations
The most common Services occupations in La Cygne are Healthcare Support (48 | 8.3%), Food Preparation & Serving (19 | 3.3%), Personal Care & Service (18 | 3.1%), Cleaning & Maintenance (17 | 2.9%), and Security & Protection (13 | 2.2%).
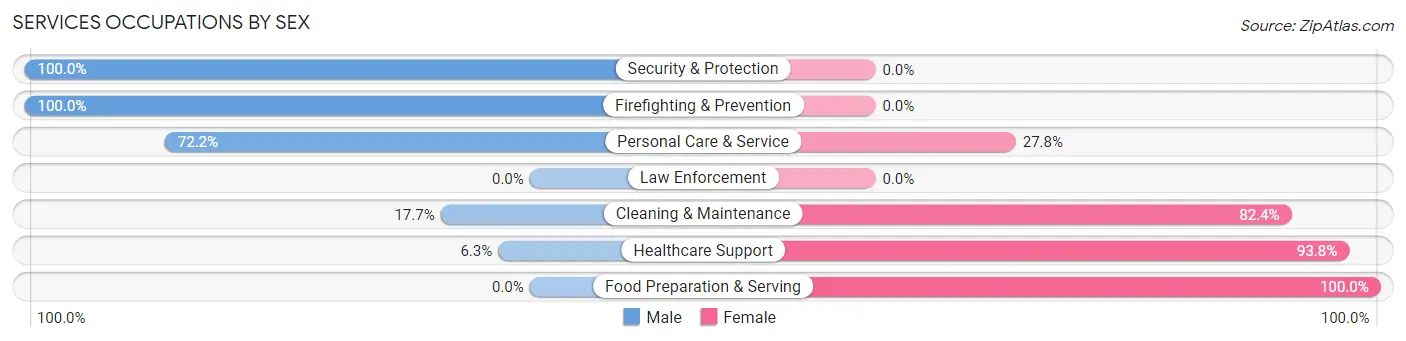
Services Occupations by Sex
Within the Services occupations in La Cygne, the most male-oriented occupations are Security & Protection (100.0%), Firefighting & Prevention (100.0%), and Personal Care & Service (72.2%), while the most female-oriented occupations are Food Preparation & Serving (100.0%), Healthcare Support (93.8%), and Cleaning & Maintenance (82.4%).
| Occupation | Male | Female |
| Healthcare Support | 3 (6.2%) | 45 (93.8%) |
| Security & Protection | 13 (100.0%) | 0 (0.0%) |
| Firefighting & Prevention | 13 (100.0%) | 0 (0.0%) |
| Law Enforcement | 0 (0.0%) | 0 (0.0%) |
| Food Preparation & Serving | 0 (0.0%) | 19 (100.0%) |
| Cleaning & Maintenance | 3 (17.6%) | 14 (82.4%) |
| Personal Care & Service | 13 (72.2%) | 5 (27.8%) |
| Total (Category) | 32 (27.8%) | 83 (72.2%) |
| Total (Overall) | 320 (55.3%) | 259 (44.7%) |
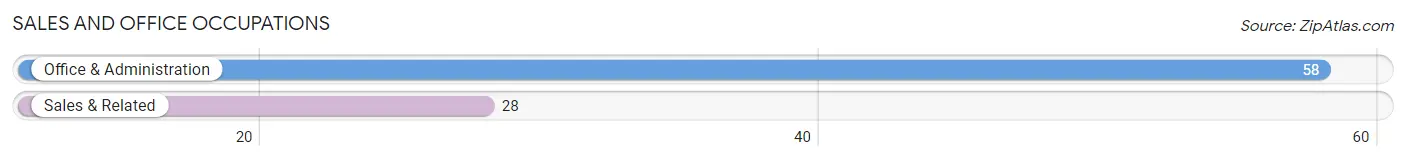
Sales and Office Occupations
The most common Sales and Office occupations in La Cygne are Office & Administration (58 | 10.0%), and Sales & Related (28 | 4.8%).
Sales and Office Occupations by Sex
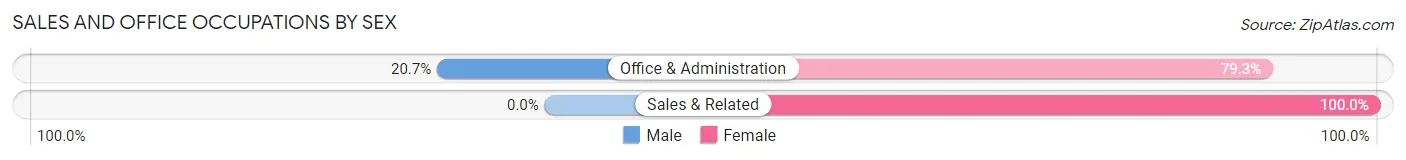
| Occupation | Male | Female |
| Sales & Related | 0 (0.0%) | 28 (100.0%) |
| Office & Administration | 12 (20.7%) | 46 (79.3%) |
| Total (Category) | 12 (14.0%) | 74 (86.1%) |
| Total (Overall) | 320 (55.3%) | 259 (44.7%) |
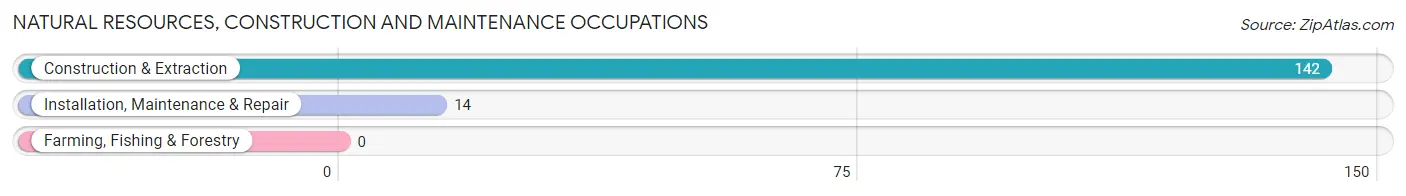
Natural Resources, Construction and Maintenance Occupations
The most common Natural Resources, Construction and Maintenance occupations in La Cygne are Construction & Extraction (142 | 24.5%), and Installation, Maintenance & Repair (14 | 2.4%).
Natural Resources, Construction and Maintenance Occupations by Sex
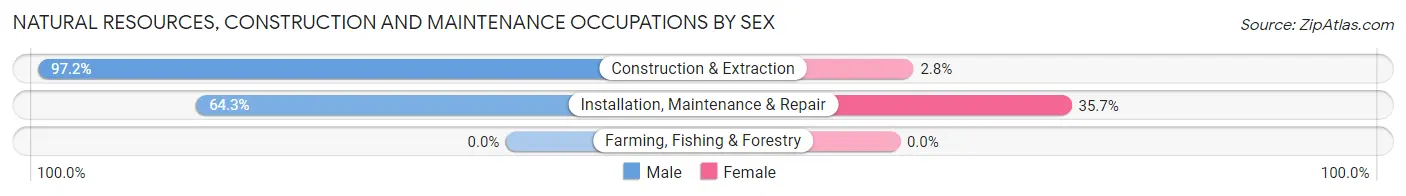
| Occupation | Male | Female |
| Farming, Fishing & Forestry | 0 (0.0%) | 0 (0.0%) |
| Construction & Extraction | 138 (97.2%) | 4 (2.8%) |
| Installation, Maintenance & Repair | 9 (64.3%) | 5 (35.7%) |
| Total (Category) | 147 (94.2%) | 9 (5.8%) |
| Total (Overall) | 320 (55.3%) | 259 (44.7%) |
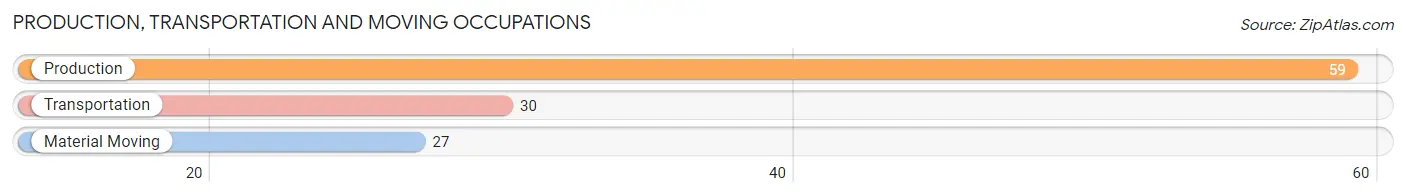
Production, Transportation and Moving Occupations
The most common Production, Transportation and Moving occupations in La Cygne are Production (59 | 10.2%), Transportation (30 | 5.2%), and Material Moving (27 | 4.7%).
Production, Transportation and Moving Occupations by Sex
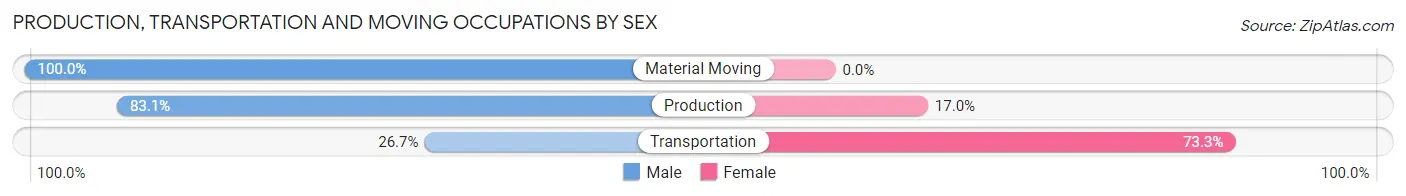
| Occupation | Male | Female |
| Production | 49 (83.1%) | 10 (17.0%) |
| Transportation | 8 (26.7%) | 22 (73.3%) |
| Material Moving | 27 (100.0%) | 0 (0.0%) |
| Total (Category) | 84 (72.4%) | 32 (27.6%) |
| Total (Overall) | 320 (55.3%) | 259 (44.7%) |
Employment Industries by Sex in La Cygne
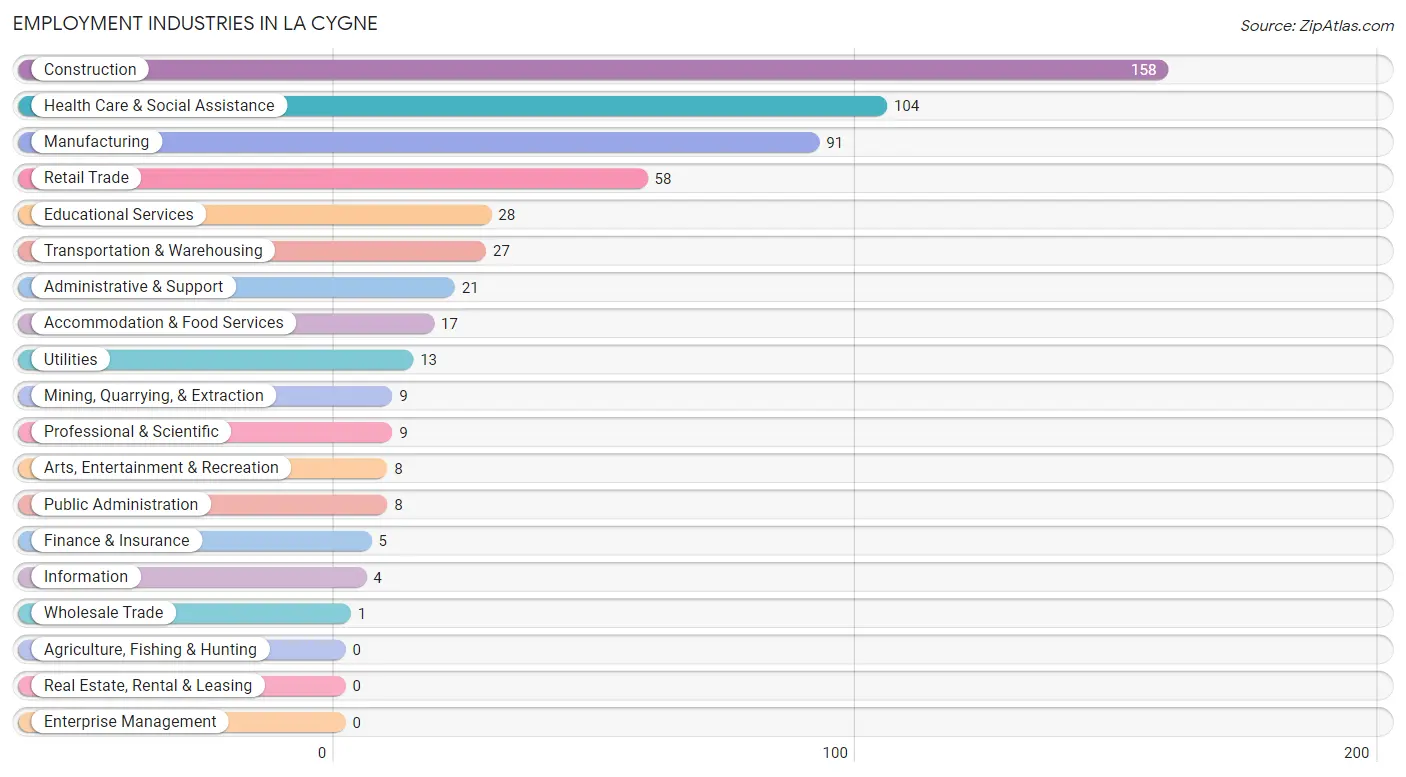
Employment Industries in La Cygne
The major employment industries in La Cygne include Construction (158 | 27.3%), Health Care & Social Assistance (104 | 18.0%), Manufacturing (91 | 15.7%), Retail Trade (58 | 10.0%), and Educational Services (28 | 4.8%).
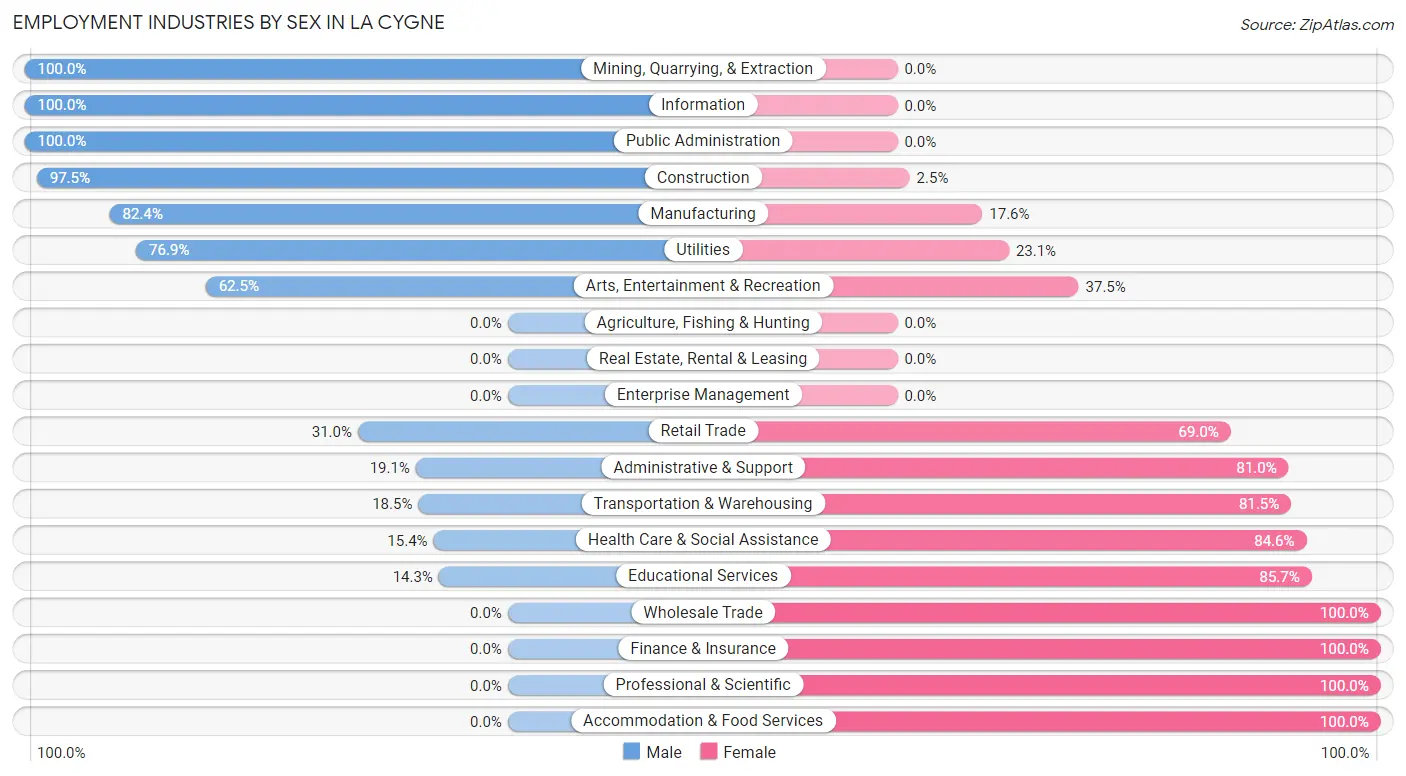
Employment Industries by Sex in La Cygne
The La Cygne industries that see more men than women are Mining, Quarrying, & Extraction (100.0%), Information (100.0%), and Public Administration (100.0%), whereas the industries that tend to have a higher number of women are Wholesale Trade (100.0%), Finance & Insurance (100.0%), and Professional & Scientific (100.0%).
| Industry | Male | Female |
| Agriculture, Fishing & Hunting | 0 (0.0%) | 0 (0.0%) |
| Mining, Quarrying, & Extraction | 9 (100.0%) | 0 (0.0%) |
| Construction | 154 (97.5%) | 4 (2.5%) |
| Manufacturing | 75 (82.4%) | 16 (17.6%) |
| Wholesale Trade | 0 (0.0%) | 1 (100.0%) |
| Retail Trade | 18 (31.0%) | 40 (69.0%) |
| Transportation & Warehousing | 5 (18.5%) | 22 (81.5%) |
| Utilities | 10 (76.9%) | 3 (23.1%) |
| Information | 4 (100.0%) | 0 (0.0%) |
| Finance & Insurance | 0 (0.0%) | 5 (100.0%) |
| Real Estate, Rental & Leasing | 0 (0.0%) | 0 (0.0%) |
| Professional & Scientific | 0 (0.0%) | 9 (100.0%) |
| Enterprise Management | 0 (0.0%) | 0 (0.0%) |
| Administrative & Support | 4 (19.1%) | 17 (80.9%) |
| Educational Services | 4 (14.3%) | 24 (85.7%) |
| Health Care & Social Assistance | 16 (15.4%) | 88 (84.6%) |
| Arts, Entertainment & Recreation | 5 (62.5%) | 3 (37.5%) |
| Accommodation & Food Services | 0 (0.0%) | 17 (100.0%) |
| Public Administration | 8 (100.0%) | 0 (0.0%) |
| Total | 320 (55.3%) | 259 (44.7%) |
Education in La Cygne
School Enrollment in La Cygne
The most common levels of schooling among the 335 students in La Cygne are high school (106 | 31.6%), middle school (77 | 23.0%), and elementary school (61 | 18.2%).
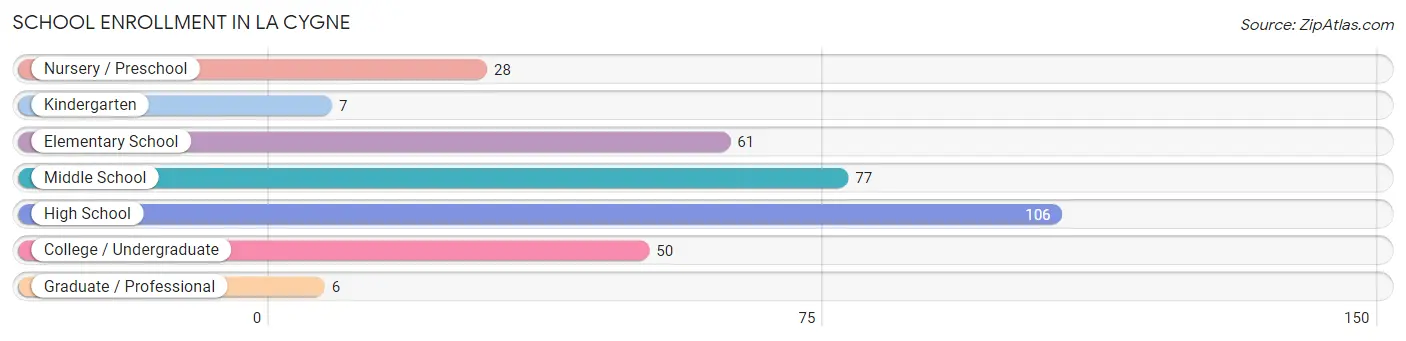
| School Level | # Students | % Students |
| Nursery / Preschool | 28 | 8.4% |
| Kindergarten | 7 | 2.1% |
| Elementary School | 61 | 18.2% |
| Middle School | 77 | 23.0% |
| High School | 106 | 31.6% |
| College / Undergraduate | 50 | 14.9% |
| Graduate / Professional | 6 | 1.8% |
| Total | 335 | 100.0% |
School Enrollment by Age by Funding Source in La Cygne
Out of a total of 335 students who are enrolled in schools in La Cygne, 5 (1.5%) attend a private institution, while the remaining 330 (98.5%) are enrolled in public schools. The age group of 10 to 14 year olds has the highest likelihood of being enrolled in private schools, with 4 (4.3% in the age bracket) enrolled. Conversely, the age group of 3 to 4 year olds has the lowest likelihood of being enrolled in a private school, with 28 (100.0% in the age bracket) attending a public institution.
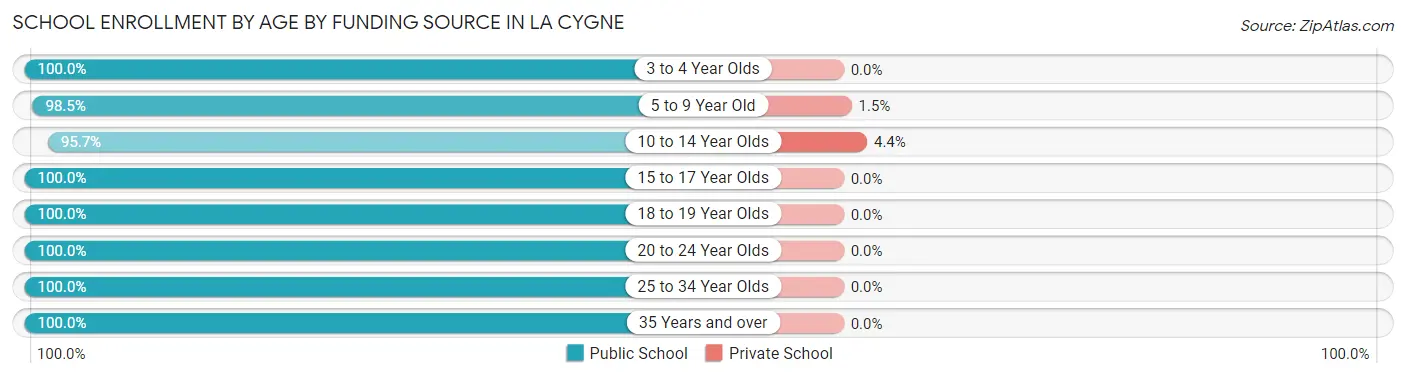
| Age Bracket | Public School | Private School |
| 3 to 4 Year Olds | 28 (100.0%) | 0 (0.0%) |
| 5 to 9 Year Old | 67 (98.5%) | 1 (1.5%) |
| 10 to 14 Year Olds | 88 (95.7%) | 4 (4.3%) |
| 15 to 17 Year Olds | 86 (100.0%) | 0 (0.0%) |
| 18 to 19 Year Olds | 12 (100.0%) | 0 (0.0%) |
| 20 to 24 Year Olds | 6 (100.0%) | 0 (0.0%) |
| 25 to 34 Year Olds | 31 (100.0%) | 0 (0.0%) |
| 35 Years and over | 12 (100.0%) | 0 (0.0%) |
| Total | 330 (98.5%) | 5 (1.5%) |
Educational Attainment by Field of Study in La Cygne
Education (25 | 42.4%), business (17 | 28.8%), science & technology (8 | 13.6%), bio, nature & agricultural (5 | 8.5%), and visual & performing arts (3 | 5.1%) are the most common fields of study among 59 individuals in La Cygne who have obtained a bachelor's degree or higher.
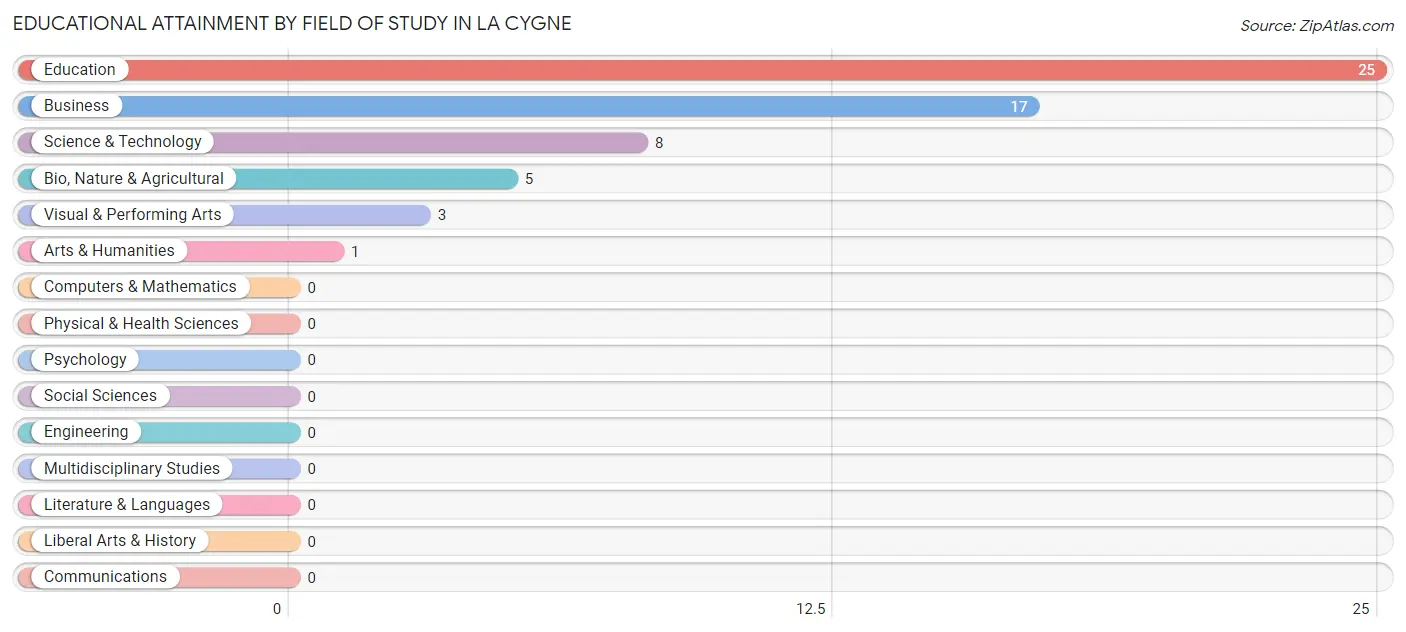
| Field of Study | # Graduates | % Graduates |
| Computers & Mathematics | 0 | 0.0% |
| Bio, Nature & Agricultural | 5 | 8.5% |
| Physical & Health Sciences | 0 | 0.0% |
| Psychology | 0 | 0.0% |
| Social Sciences | 0 | 0.0% |
| Engineering | 0 | 0.0% |
| Multidisciplinary Studies | 0 | 0.0% |
| Science & Technology | 8 | 13.6% |
| Business | 17 | 28.8% |
| Education | 25 | 42.4% |
| Literature & Languages | 0 | 0.0% |
| Liberal Arts & History | 0 | 0.0% |
| Visual & Performing Arts | 3 | 5.1% |
| Communications | 0 | 0.0% |
| Arts & Humanities | 1 | 1.7% |
| Total | 59 | 100.0% |
Transportation & Commute in La Cygne
Vehicle Availability by Sex in La Cygne
The most prevalent vehicle ownership categories in La Cygne are males with 2 vehicles (99, accounting for 30.9%) and females with 2 vehicles (100, making up 38.2%).
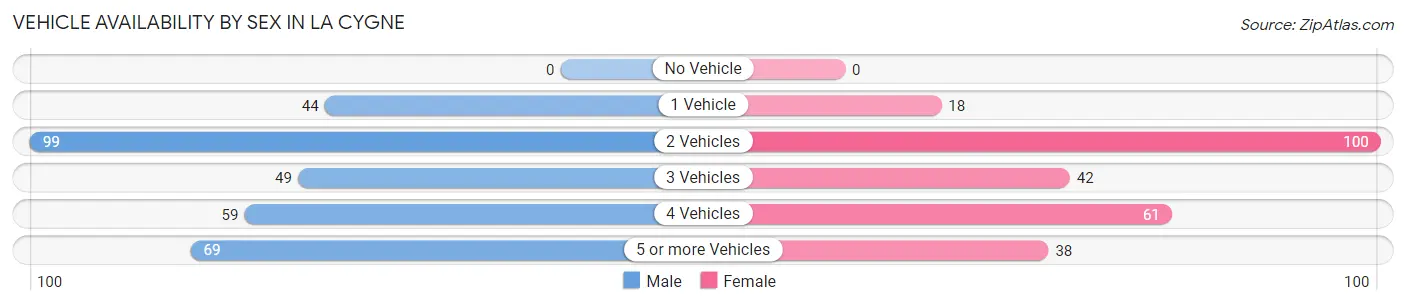
| Vehicles Available | Male | Female |
| No Vehicle | 0 (0.0%) | 0 (0.0%) |
| 1 Vehicle | 44 (13.8%) | 18 (7.0%) |
| 2 Vehicles | 99 (30.9%) | 100 (38.6%) |
| 3 Vehicles | 49 (15.3%) | 42 (16.2%) |
| 4 Vehicles | 59 (18.4%) | 61 (23.5%) |
| 5 or more Vehicles | 69 (21.6%) | 38 (14.7%) |
| Total | 320 (100.0%) | 259 (100.0%) |
Commute Time in La Cygne
The most frequently occuring commute durations in La Cygne are 45 to 59 minutes (79 commuters, 14.1%), 60 to 89 minutes (78 commuters, 13.9%), and 30 to 34 minutes (76 commuters, 13.6%).
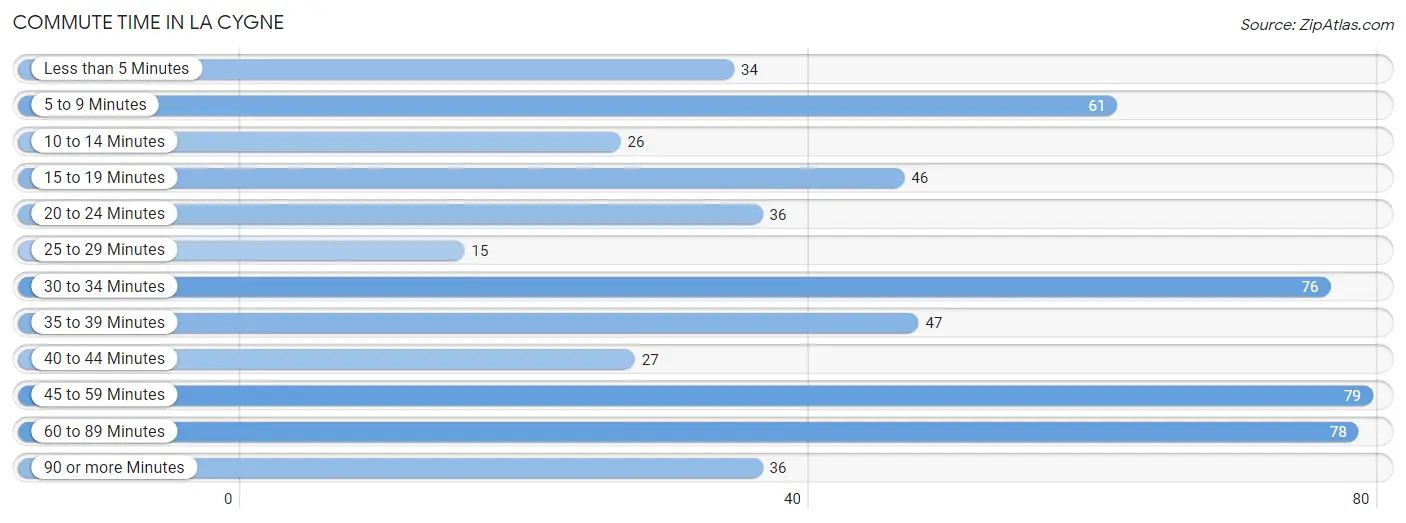
| Commute Time | # Commuters | % Commuters |
| Less than 5 Minutes | 34 | 6.1% |
| 5 to 9 Minutes | 61 | 10.9% |
| 10 to 14 Minutes | 26 | 4.6% |
| 15 to 19 Minutes | 46 | 8.2% |
| 20 to 24 Minutes | 36 | 6.4% |
| 25 to 29 Minutes | 15 | 2.7% |
| 30 to 34 Minutes | 76 | 13.6% |
| 35 to 39 Minutes | 47 | 8.4% |
| 40 to 44 Minutes | 27 | 4.8% |
| 45 to 59 Minutes | 79 | 14.1% |
| 60 to 89 Minutes | 78 | 13.9% |
| 90 or more Minutes | 36 | 6.4% |
Commute Time by Sex in La Cygne
The most common commute times in La Cygne are 45 to 59 minutes (47 commuters, 14.7%) for males and 30 to 34 minutes (35 commuters, 14.5%) for females.
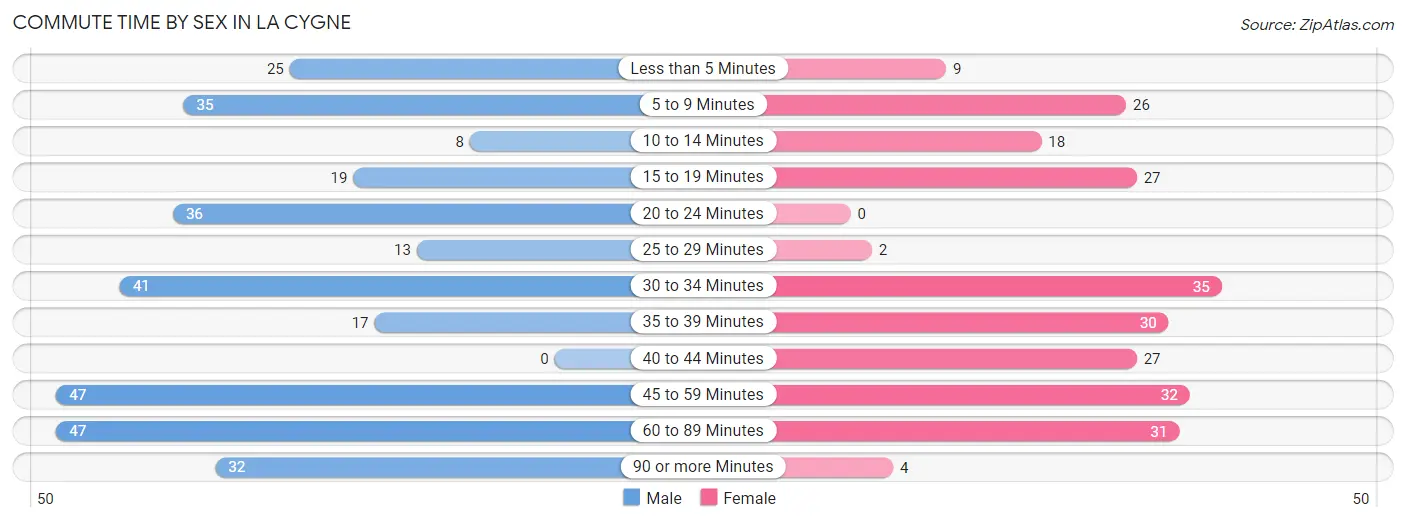
| Commute Time | Male | Female |
| Less than 5 Minutes | 25 (7.8%) | 9 (3.7%) |
| 5 to 9 Minutes | 35 (10.9%) | 26 (10.8%) |
| 10 to 14 Minutes | 8 (2.5%) | 18 (7.5%) |
| 15 to 19 Minutes | 19 (5.9%) | 27 (11.2%) |
| 20 to 24 Minutes | 36 (11.3%) | 0 (0.0%) |
| 25 to 29 Minutes | 13 (4.1%) | 2 (0.8%) |
| 30 to 34 Minutes | 41 (12.8%) | 35 (14.5%) |
| 35 to 39 Minutes | 17 (5.3%) | 30 (12.4%) |
| 40 to 44 Minutes | 0 (0.0%) | 27 (11.2%) |
| 45 to 59 Minutes | 47 (14.7%) | 32 (13.3%) |
| 60 to 89 Minutes | 47 (14.7%) | 31 (12.9%) |
| 90 or more Minutes | 32 (10.0%) | 4 (1.7%) |
Time of Departure to Work by Sex in La Cygne
The most frequent times of departure to work in La Cygne are 6:00 AM to 6:29 AM (71, 22.2%) for males and 6:30 AM to 6:59 AM (46, 19.1%) for females.
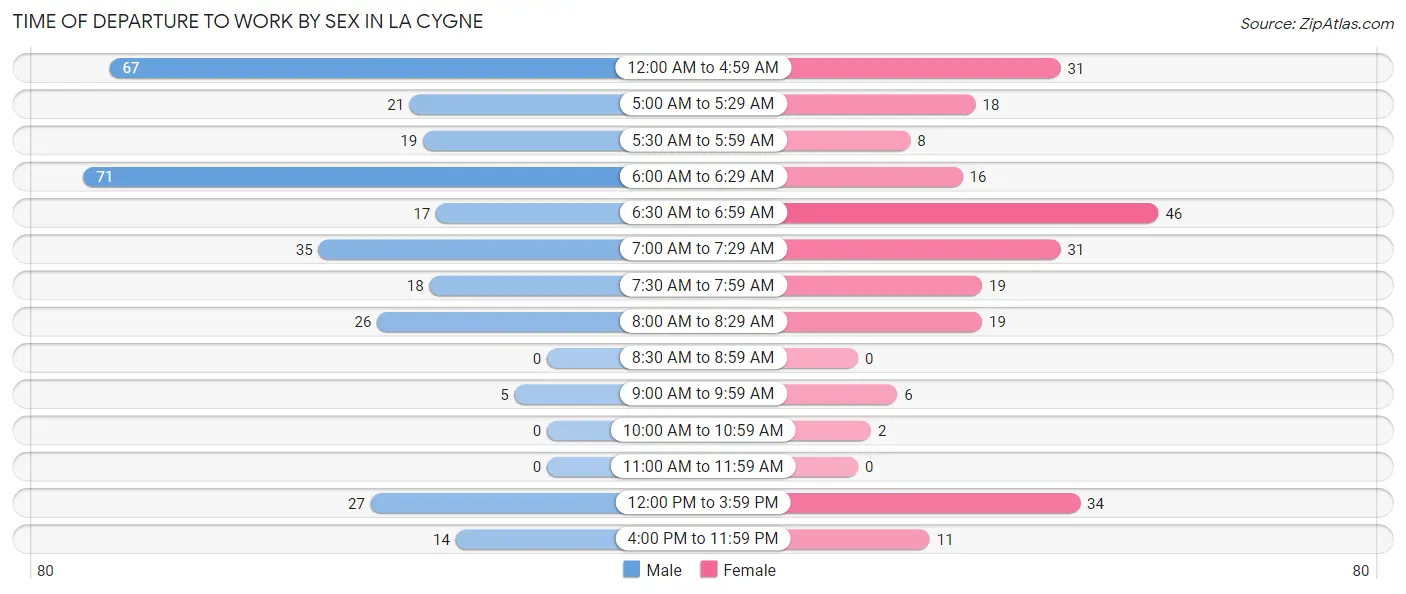
| Time of Departure | Male | Female |
| 12:00 AM to 4:59 AM | 67 (20.9%) | 31 (12.9%) |
| 5:00 AM to 5:29 AM | 21 (6.6%) | 18 (7.5%) |
| 5:30 AM to 5:59 AM | 19 (5.9%) | 8 (3.3%) |
| 6:00 AM to 6:29 AM | 71 (22.2%) | 16 (6.6%) |
| 6:30 AM to 6:59 AM | 17 (5.3%) | 46 (19.1%) |
| 7:00 AM to 7:29 AM | 35 (10.9%) | 31 (12.9%) |
| 7:30 AM to 7:59 AM | 18 (5.6%) | 19 (7.9%) |
| 8:00 AM to 8:29 AM | 26 (8.1%) | 19 (7.9%) |
| 8:30 AM to 8:59 AM | 0 (0.0%) | 0 (0.0%) |
| 9:00 AM to 9:59 AM | 5 (1.6%) | 6 (2.5%) |
| 10:00 AM to 10:59 AM | 0 (0.0%) | 2 (0.8%) |
| 11:00 AM to 11:59 AM | 0 (0.0%) | 0 (0.0%) |
| 12:00 PM to 3:59 PM | 27 (8.4%) | 34 (14.1%) |
| 4:00 PM to 11:59 PM | 14 (4.4%) | 11 (4.6%) |
| Total | 320 (100.0%) | 241 (100.0%) |
Housing Occupancy in La Cygne
Occupancy by Ownership in La Cygne
Of the total 548 dwellings in La Cygne, owner-occupied units account for 330 (60.2%), while renter-occupied units make up 218 (39.8%).
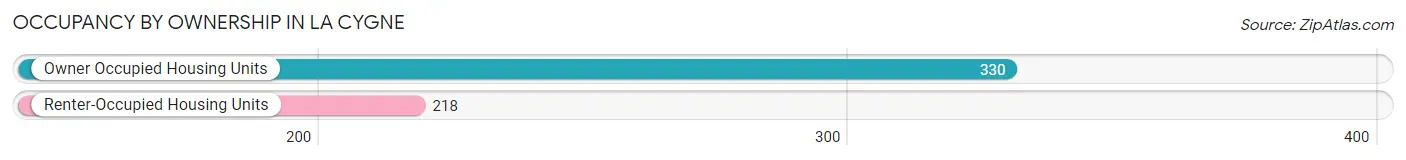
| Occupancy | # Housing Units | % Housing Units |
| Owner Occupied Housing Units | 330 | 60.2% |
| Renter-Occupied Housing Units | 218 | 39.8% |
| Total Occupied Housing Units | 548 | 100.0% |
Occupancy by Household Size in La Cygne
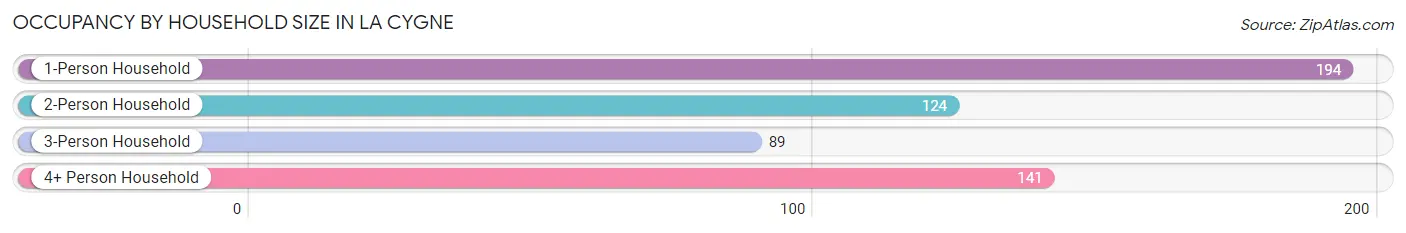
| Household Size | # Housing Units | % Housing Units |
| 1-Person Household | 194 | 35.4% |
| 2-Person Household | 124 | 22.6% |
| 3-Person Household | 89 | 16.2% |
| 4+ Person Household | 141 | 25.7% |
| Total Housing Units | 548 | 100.0% |
Occupancy by Ownership by Household Size in La Cygne
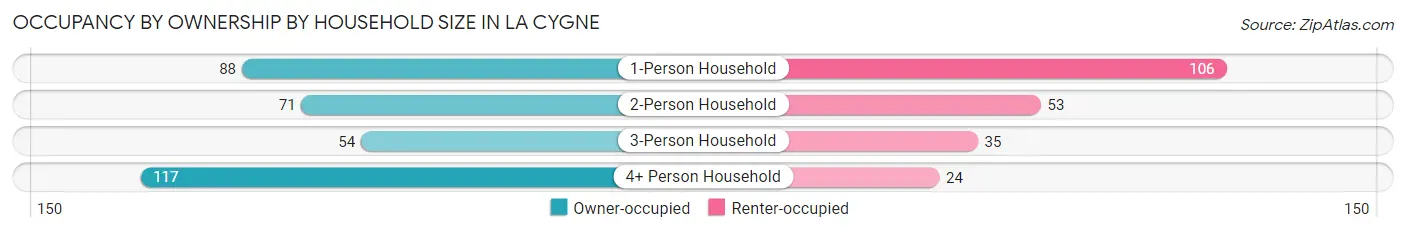
| Household Size | Owner-occupied | Renter-occupied |
| 1-Person Household | 88 (45.4%) | 106 (54.6%) |
| 2-Person Household | 71 (57.3%) | 53 (42.7%) |
| 3-Person Household | 54 (60.7%) | 35 (39.3%) |
| 4+ Person Household | 117 (83.0%) | 24 (17.0%) |
| Total Housing Units | 330 (60.2%) | 218 (39.8%) |
Occupancy by Educational Attainment in La Cygne
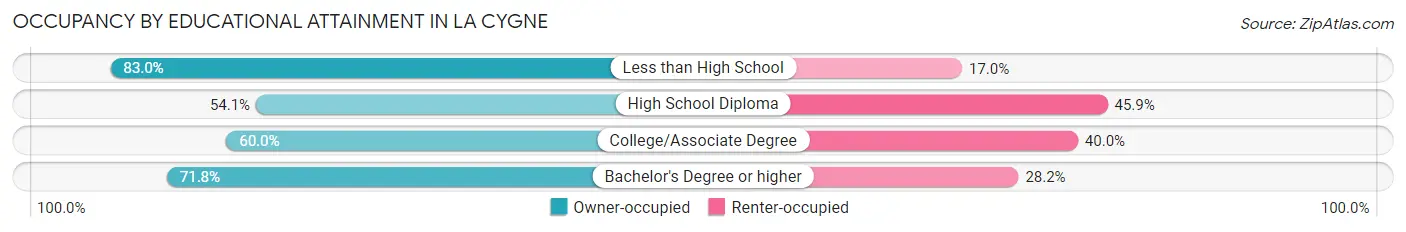
| Household Size | Owner-occupied | Renter-occupied |
| Less than High School | 39 (83.0%) | 8 (17.0%) |
| High School Diploma | 131 (54.1%) | 111 (45.9%) |
| College/Associate Degree | 132 (60.0%) | 88 (40.0%) |
| Bachelor's Degree or higher | 28 (71.8%) | 11 (28.2%) |
Occupancy by Age of Householder in La Cygne
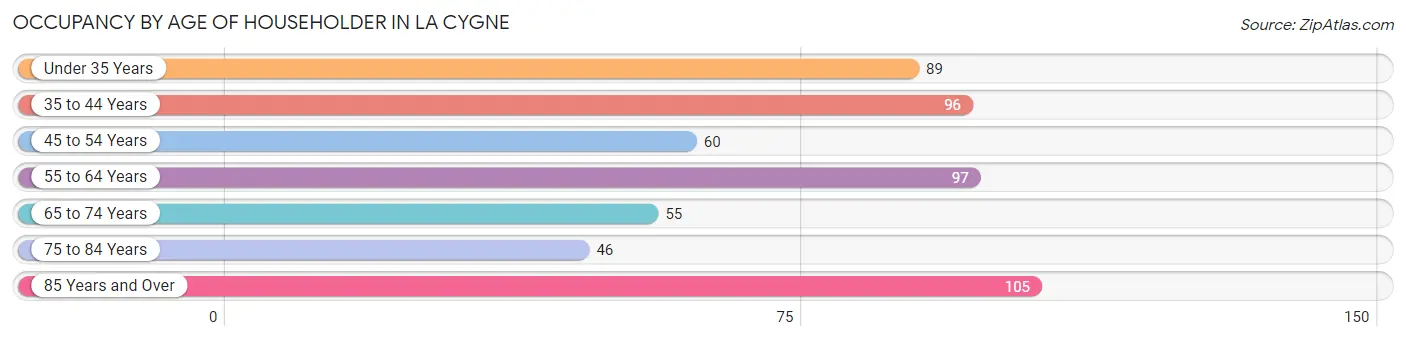
| Age Bracket | # Households | % Households |
| Under 35 Years | 89 | 16.2% |
| 35 to 44 Years | 96 | 17.5% |
| 45 to 54 Years | 60 | 11.0% |
| 55 to 64 Years | 97 | 17.7% |
| 65 to 74 Years | 55 | 10.0% |
| 75 to 84 Years | 46 | 8.4% |
| 85 Years and Over | 105 | 19.2% |
| Total | 548 | 100.0% |
Housing Finances in La Cygne
Median Income by Occupancy in La Cygne
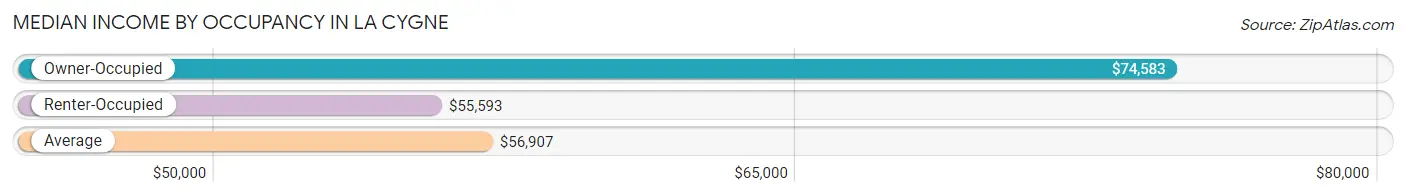
| Occupancy Type | # Households | Median Income |
| Owner-Occupied | 330 (60.2%) | $74,583 |
| Renter-Occupied | 218 (39.8%) | $55,593 |
| Average | 548 (100.0%) | $56,907 |
Occupancy by Householder Income Bracket in La Cygne
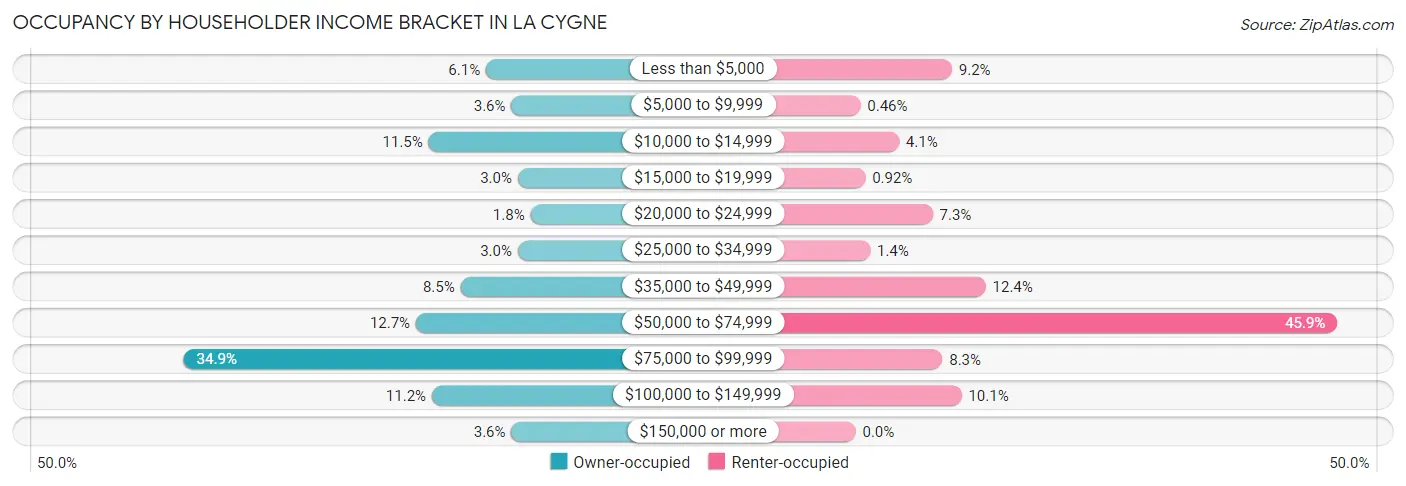
| Income Bracket | Owner-occupied | Renter-occupied |
| Less than $5,000 | 20 (6.1%) | 20 (9.2%) |
| $5,000 to $9,999 | 12 (3.6%) | 1 (0.5%) |
| $10,000 to $14,999 | 38 (11.5%) | 9 (4.1%) |
| $15,000 to $19,999 | 10 (3.0%) | 2 (0.9%) |
| $20,000 to $24,999 | 6 (1.8%) | 16 (7.3%) |
| $25,000 to $34,999 | 10 (3.0%) | 3 (1.4%) |
| $35,000 to $49,999 | 28 (8.5%) | 27 (12.4%) |
| $50,000 to $74,999 | 42 (12.7%) | 100 (45.9%) |
| $75,000 to $99,999 | 115 (34.8%) | 18 (8.3%) |
| $100,000 to $149,999 | 37 (11.2%) | 22 (10.1%) |
| $150,000 or more | 12 (3.6%) | 0 (0.0%) |
| Total | 330 (100.0%) | 218 (100.0%) |
Monthly Housing Cost Tiers in La Cygne
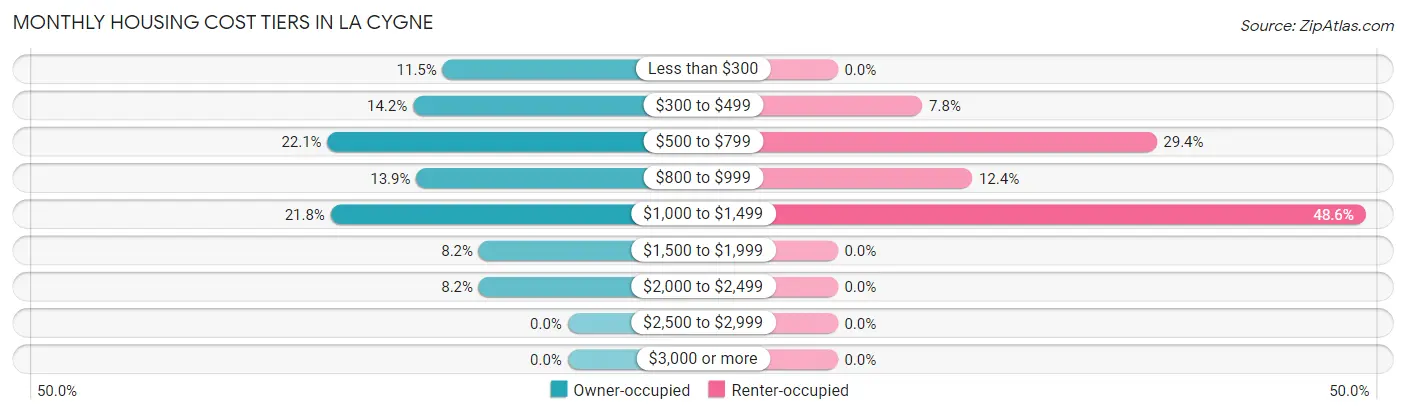
| Monthly Cost | Owner-occupied | Renter-occupied |
| Less than $300 | 38 (11.5%) | 0 (0.0%) |
| $300 to $499 | 47 (14.2%) | 17 (7.8%) |
| $500 to $799 | 73 (22.1%) | 64 (29.4%) |
| $800 to $999 | 46 (13.9%) | 27 (12.4%) |
| $1,000 to $1,499 | 72 (21.8%) | 106 (48.6%) |
| $1,500 to $1,999 | 27 (8.2%) | 0 (0.0%) |
| $2,000 to $2,499 | 27 (8.2%) | 0 (0.0%) |
| $2,500 to $2,999 | 0 (0.0%) | 0 (0.0%) |
| $3,000 or more | 0 (0.0%) | 0 (0.0%) |
| Total | 330 (100.0%) | 218 (100.0%) |
Physical Housing Characteristics in La Cygne
Housing Structures in La Cygne
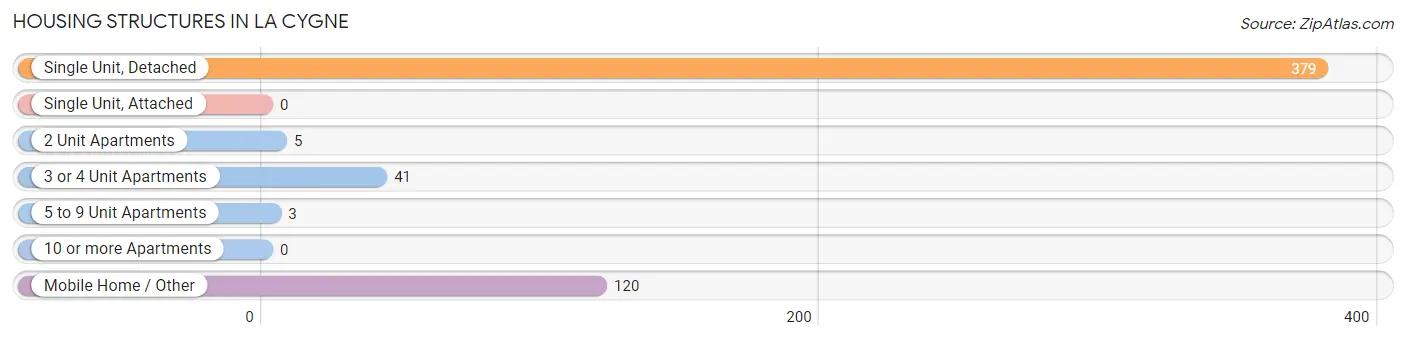
| Structure Type | # Housing Units | % Housing Units |
| Single Unit, Detached | 379 | 69.2% |
| Single Unit, Attached | 0 | 0.0% |
| 2 Unit Apartments | 5 | 0.9% |
| 3 or 4 Unit Apartments | 41 | 7.5% |
| 5 to 9 Unit Apartments | 3 | 0.5% |
| 10 or more Apartments | 0 | 0.0% |
| Mobile Home / Other | 120 | 21.9% |
| Total | 548 | 100.0% |
Housing Structures by Occupancy in La Cygne
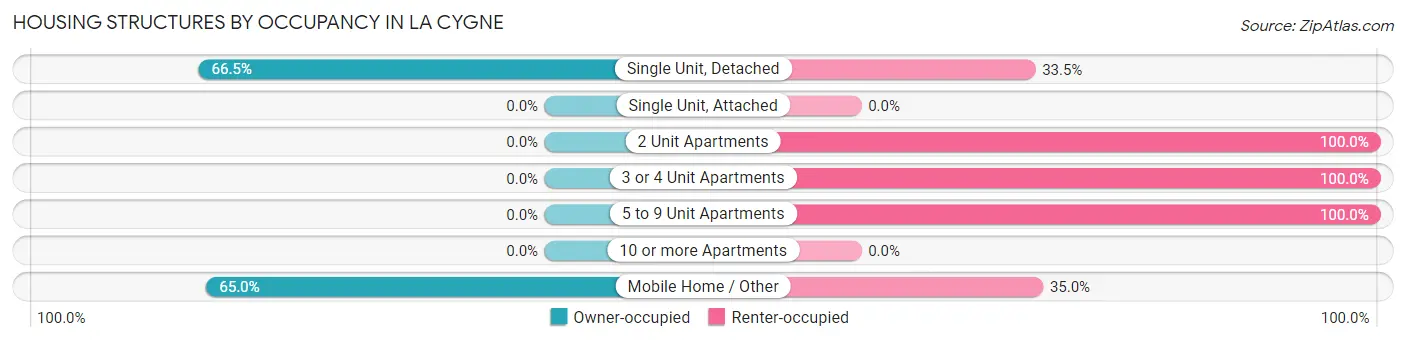
| Structure Type | Owner-occupied | Renter-occupied |
| Single Unit, Detached | 252 (66.5%) | 127 (33.5%) |
| Single Unit, Attached | 0 (0.0%) | 0 (0.0%) |
| 2 Unit Apartments | 0 (0.0%) | 5 (100.0%) |
| 3 or 4 Unit Apartments | 0 (0.0%) | 41 (100.0%) |
| 5 to 9 Unit Apartments | 0 (0.0%) | 3 (100.0%) |
| 10 or more Apartments | 0 (0.0%) | 0 (0.0%) |
| Mobile Home / Other | 78 (65.0%) | 42 (35.0%) |
| Total | 330 (60.2%) | 218 (39.8%) |
Housing Structures by Number of Rooms in La Cygne
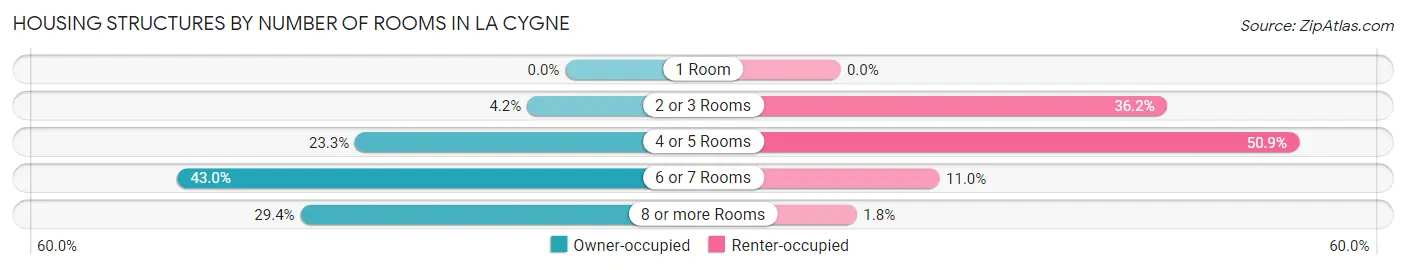
| Number of Rooms | Owner-occupied | Renter-occupied |
| 1 Room | 0 (0.0%) | 0 (0.0%) |
| 2 or 3 Rooms | 14 (4.2%) | 79 (36.2%) |
| 4 or 5 Rooms | 77 (23.3%) | 111 (50.9%) |
| 6 or 7 Rooms | 142 (43.0%) | 24 (11.0%) |
| 8 or more Rooms | 97 (29.4%) | 4 (1.8%) |
| Total | 330 (100.0%) | 218 (100.0%) |
Housing Structure by Heating Type in La Cygne
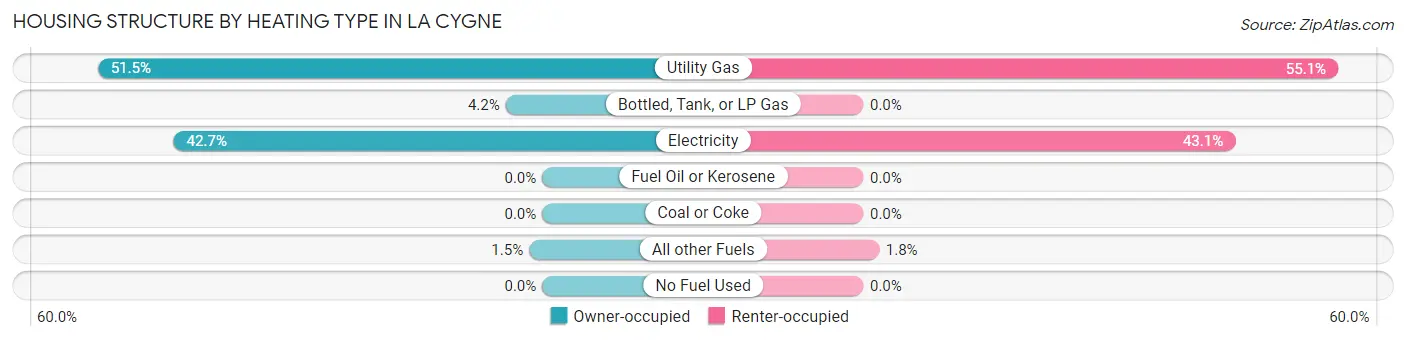
| Heating Type | Owner-occupied | Renter-occupied |
| Utility Gas | 170 (51.5%) | 120 (55.0%) |
| Bottled, Tank, or LP Gas | 14 (4.2%) | 0 (0.0%) |
| Electricity | 141 (42.7%) | 94 (43.1%) |
| Fuel Oil or Kerosene | 0 (0.0%) | 0 (0.0%) |
| Coal or Coke | 0 (0.0%) | 0 (0.0%) |
| All other Fuels | 5 (1.5%) | 4 (1.8%) |
| No Fuel Used | 0 (0.0%) | 0 (0.0%) |
| Total | 330 (100.0%) | 218 (100.0%) |
Household Vehicle Usage in La Cygne
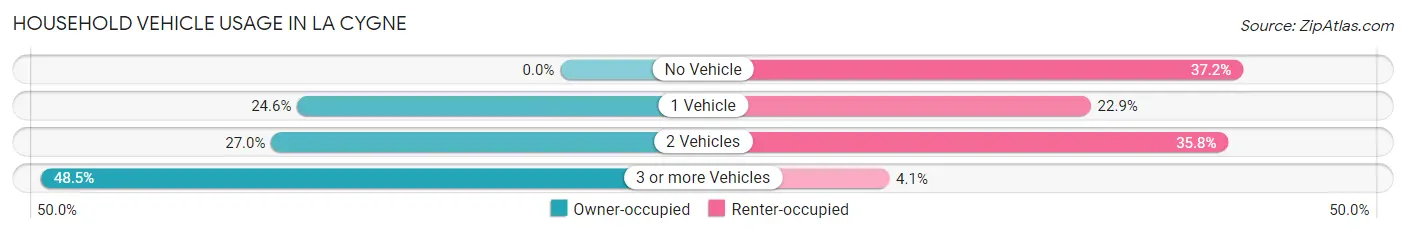
| Vehicles per Household | Owner-occupied | Renter-occupied |
| No Vehicle | 0 (0.0%) | 81 (37.2%) |
| 1 Vehicle | 81 (24.5%) | 50 (22.9%) |
| 2 Vehicles | 89 (27.0%) | 78 (35.8%) |
| 3 or more Vehicles | 160 (48.5%) | 9 (4.1%) |
| Total | 330 (100.0%) | 218 (100.0%) |
Real Estate & Mortgages in La Cygne
Real Estate and Mortgage Overview in La Cygne
| Characteristic | Without Mortgage | With Mortgage |
| Housing Units | 159 | 171 |
| Median Property Value | $96,100 | $127,100 |
| Median Household Income | $51,875 | $7 |
| Monthly Housing Costs | $475 | $0 |
| Real Estate Taxes | $1,142 | $26 |
Property Value by Mortgage Status in La Cygne
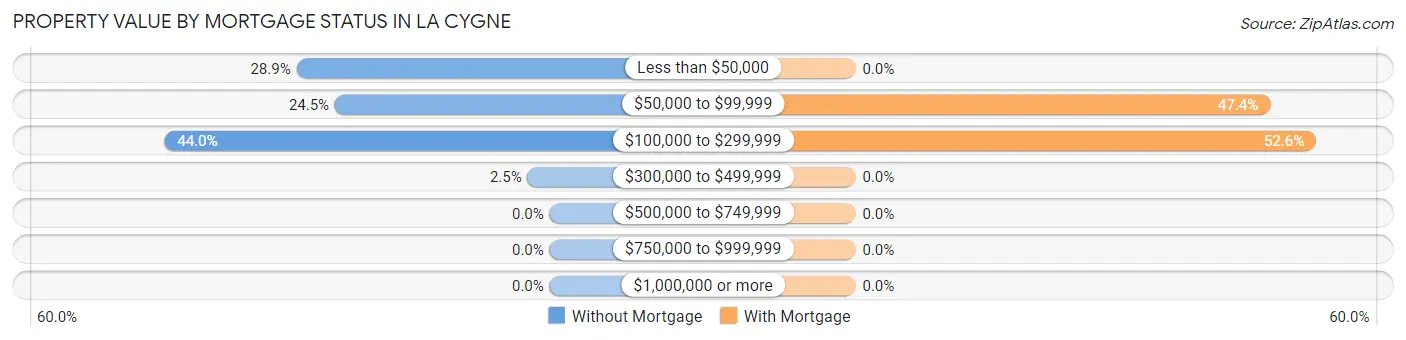
| Property Value | Without Mortgage | With Mortgage |
| Less than $50,000 | 46 (28.9%) | 0 (0.0%) |
| $50,000 to $99,999 | 39 (24.5%) | 81 (47.4%) |
| $100,000 to $299,999 | 70 (44.0%) | 90 (52.6%) |
| $300,000 to $499,999 | 4 (2.5%) | 0 (0.0%) |
| $500,000 to $749,999 | 0 (0.0%) | 0 (0.0%) |
| $750,000 to $999,999 | 0 (0.0%) | 0 (0.0%) |
| $1,000,000 or more | 0 (0.0%) | 0 (0.0%) |
| Total | 159 (100.0%) | 171 (100.0%) |
Household Income by Mortgage Status in La Cygne
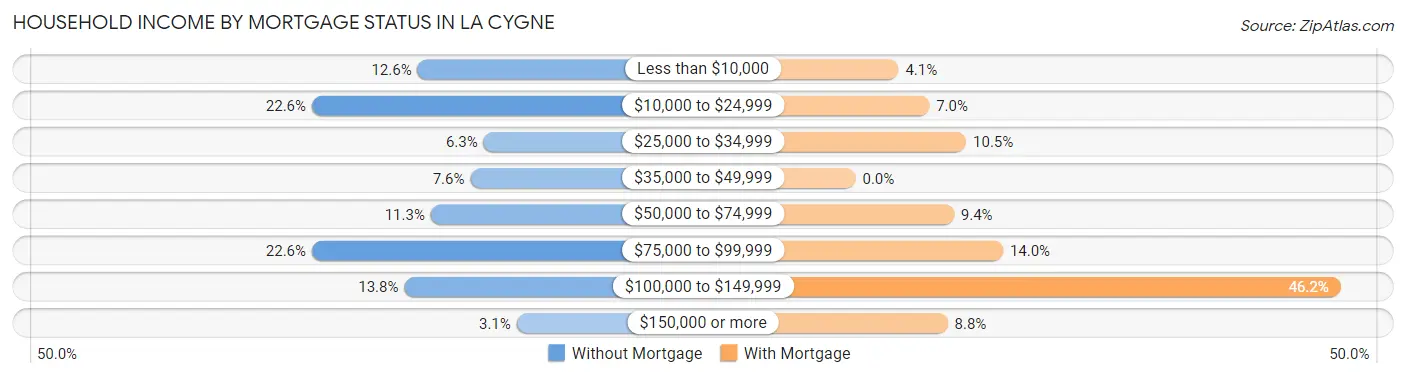
| Household Income | Without Mortgage | With Mortgage |
| Less than $10,000 | 20 (12.6%) | 7 (4.1%) |
| $10,000 to $24,999 | 36 (22.6%) | 12 (7.0%) |
| $25,000 to $34,999 | 10 (6.3%) | 18 (10.5%) |
| $35,000 to $49,999 | 12 (7.5%) | 0 (0.0%) |
| $50,000 to $74,999 | 18 (11.3%) | 16 (9.4%) |
| $75,000 to $99,999 | 36 (22.6%) | 24 (14.0%) |
| $100,000 to $149,999 | 22 (13.8%) | 79 (46.2%) |
| $150,000 or more | 5 (3.1%) | 15 (8.8%) |
| Total | 159 (100.0%) | 171 (100.0%) |
Property Value to Household Income Ratio in La Cygne
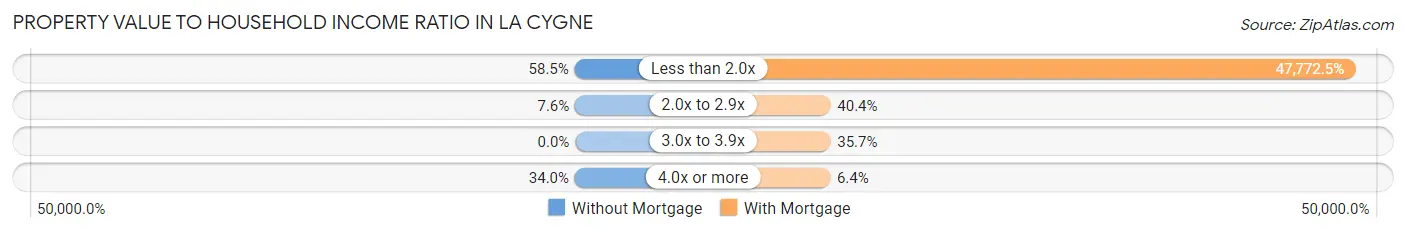
| Value-to-Income Ratio | Without Mortgage | With Mortgage |
| Less than 2.0x | 93 (58.5%) | 81,691 (47,772.5%) |
| 2.0x to 2.9x | 12 (7.5%) | 69 (40.4%) |
| 3.0x to 3.9x | 0 (0.0%) | 61 (35.7%) |
| 4.0x or more | 54 (34.0%) | 11 (6.4%) |
| Total | 159 (100.0%) | 171 (100.0%) |
Real Estate Taxes by Mortgage Status in La Cygne
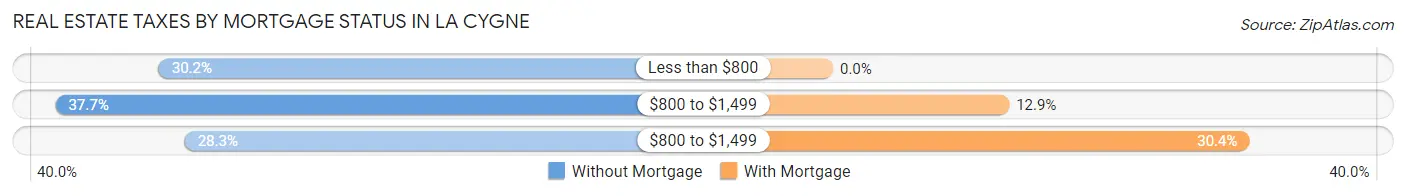
| Property Taxes | Without Mortgage | With Mortgage |
| Less than $800 | 48 (30.2%) | 0 (0.0%) |
| $800 to $1,499 | 60 (37.7%) | 22 (12.9%) |
| $800 to $1,499 | 45 (28.3%) | 52 (30.4%) |
| Total | 159 (100.0%) | 171 (100.0%) |
Health & Disability in La Cygne
Health Insurance Coverage by Age in La Cygne
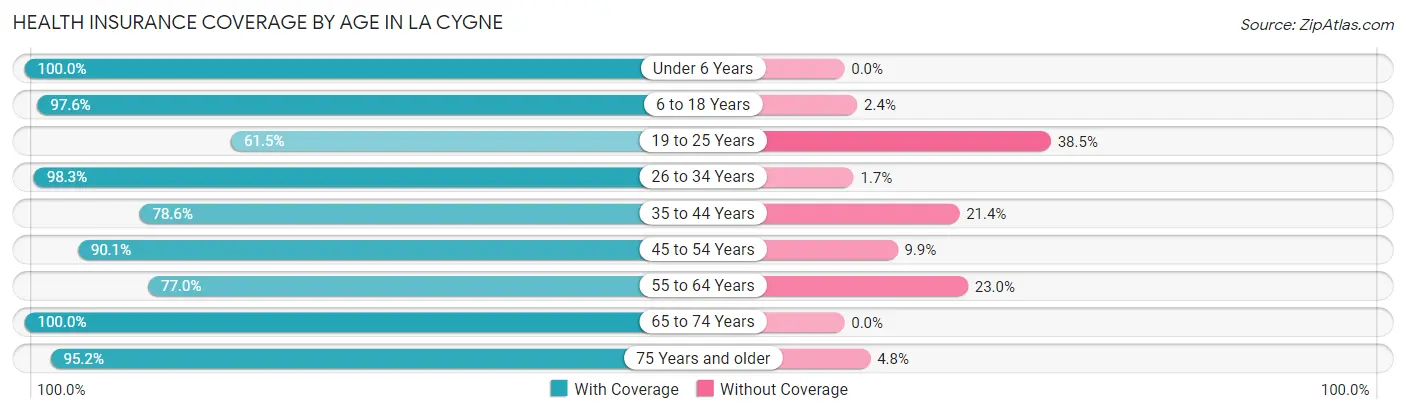
| Age Bracket | With Coverage | Without Coverage |
| Under 6 Years | 110 (100.0%) | 0 (0.0%) |
| 6 to 18 Years | 244 (97.6%) | 6 (2.4%) |
| 19 to 25 Years | 131 (61.5%) | 82 (38.5%) |
| 26 to 34 Years | 114 (98.3%) | 2 (1.7%) |
| 35 to 44 Years | 121 (78.6%) | 33 (21.4%) |
| 45 to 54 Years | 118 (90.1%) | 13 (9.9%) |
| 55 to 64 Years | 127 (77.0%) | 38 (23.0%) |
| 65 to 74 Years | 81 (100.0%) | 0 (0.0%) |
| 75 Years and older | 197 (95.2%) | 10 (4.8%) |
| Total | 1,243 (87.1%) | 184 (12.9%) |
Health Insurance Coverage by Citizenship Status in La Cygne
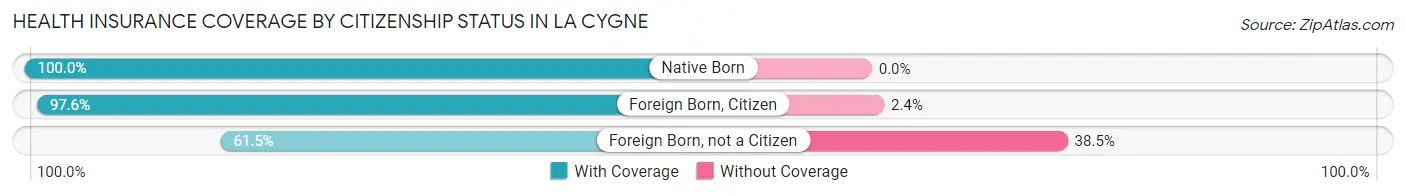
| Citizenship Status | With Coverage | Without Coverage |
| Native Born | 110 (100.0%) | 0 (0.0%) |
| Foreign Born, Citizen | 244 (97.6%) | 6 (2.4%) |
| Foreign Born, not a Citizen | 131 (61.5%) | 82 (38.5%) |
Health Insurance Coverage by Household Income in La Cygne
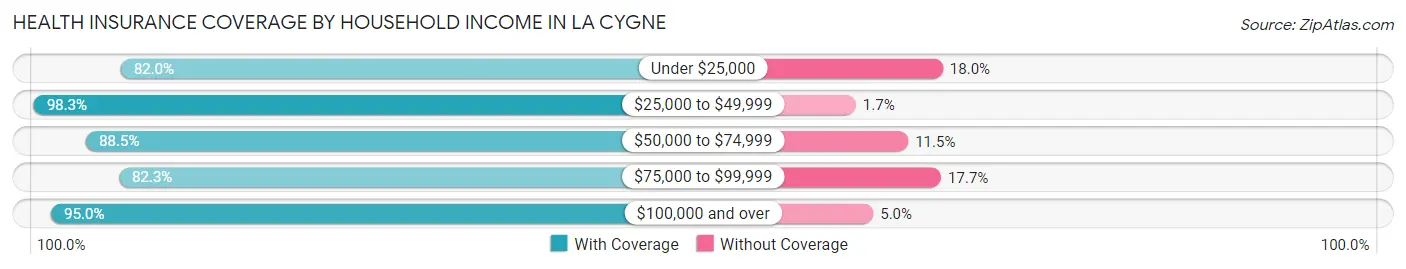
| Household Income | With Coverage | Without Coverage |
| Under $25,000 | 214 (82.0%) | 47 (18.0%) |
| $25,000 to $49,999 | 115 (98.3%) | 2 (1.7%) |
| $50,000 to $74,999 | 246 (88.5%) | 32 (11.5%) |
| $75,000 to $99,999 | 419 (82.3%) | 90 (17.7%) |
| $100,000 and over | 249 (95.0%) | 13 (5.0%) |
Public vs Private Health Insurance Coverage by Age in La Cygne
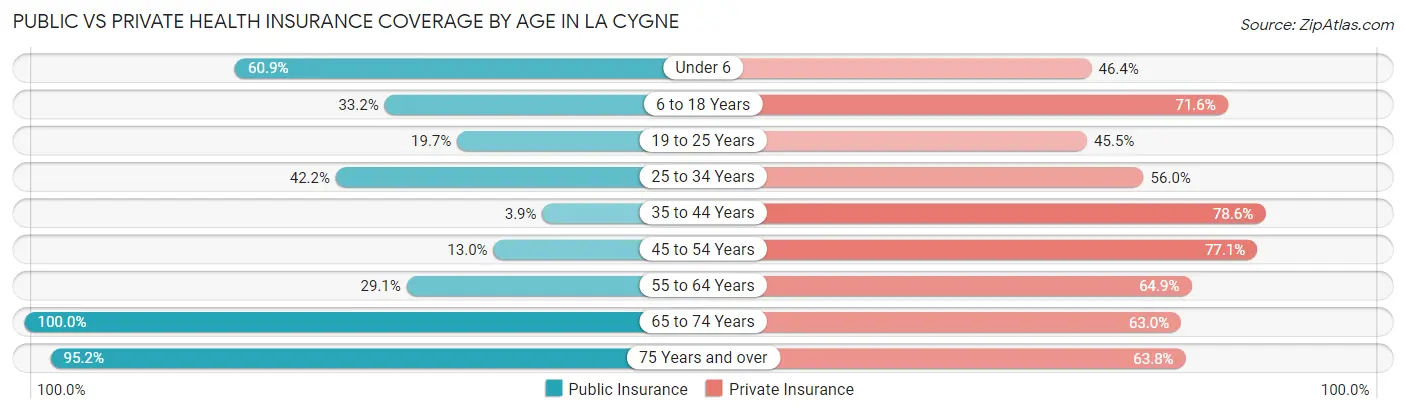
| Age Bracket | Public Insurance | Private Insurance |
| Under 6 | 67 (60.9%) | 51 (46.4%) |
| 6 to 18 Years | 83 (33.2%) | 179 (71.6%) |
| 19 to 25 Years | 42 (19.7%) | 97 (45.5%) |
| 25 to 34 Years | 49 (42.2%) | 65 (56.0%) |
| 35 to 44 Years | 6 (3.9%) | 121 (78.6%) |
| 45 to 54 Years | 17 (13.0%) | 101 (77.1%) |
| 55 to 64 Years | 48 (29.1%) | 107 (64.8%) |
| 65 to 74 Years | 81 (100.0%) | 51 (63.0%) |
| 75 Years and over | 197 (95.2%) | 132 (63.8%) |
| Total | 590 (41.3%) | 904 (63.3%) |
Disability Status by Sex by Age in La Cygne
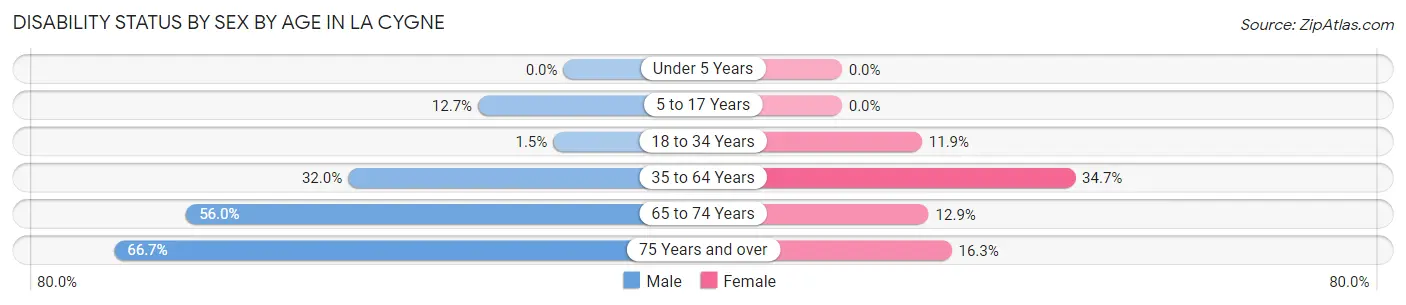
| Age Bracket | Male | Female |
| Under 5 Years | 0 (0.0%) | 0 (0.0%) |
| 5 to 17 Years | 17 (12.7%) | 0 (0.0%) |
| 18 to 34 Years | 3 (1.5%) | 17 (11.9%) |
| 35 to 64 Years | 71 (32.0%) | 79 (34.6%) |
| 65 to 74 Years | 28 (56.0%) | 4 (12.9%) |
| 75 Years and over | 48 (66.7%) | 22 (16.3%) |
Disability Class by Sex by Age in La Cygne
Disability Class: Hearing Difficulty
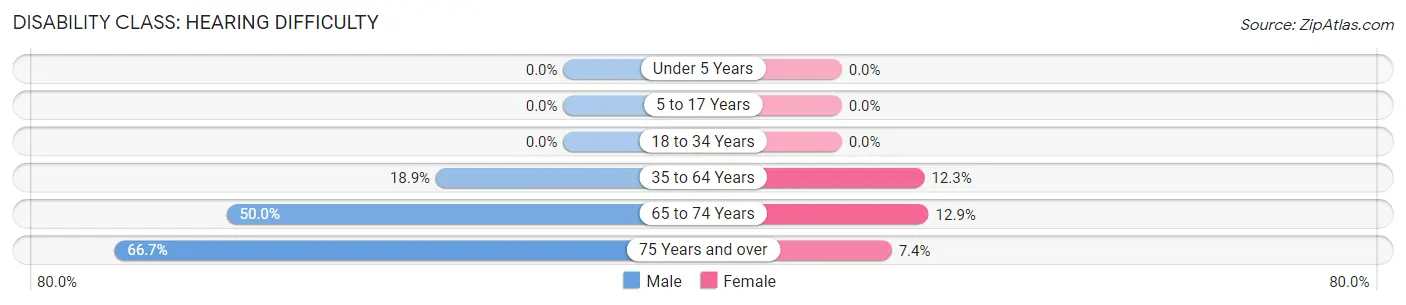
| Age Bracket | Male | Female |
| Under 5 Years | 0 (0.0%) | 0 (0.0%) |
| 5 to 17 Years | 0 (0.0%) | 0 (0.0%) |
| 18 to 34 Years | 0 (0.0%) | 0 (0.0%) |
| 35 to 64 Years | 42 (18.9%) | 28 (12.3%) |
| 65 to 74 Years | 25 (50.0%) | 4 (12.9%) |
| 75 Years and over | 48 (66.7%) | 10 (7.4%) |
Disability Class: Vision Difficulty
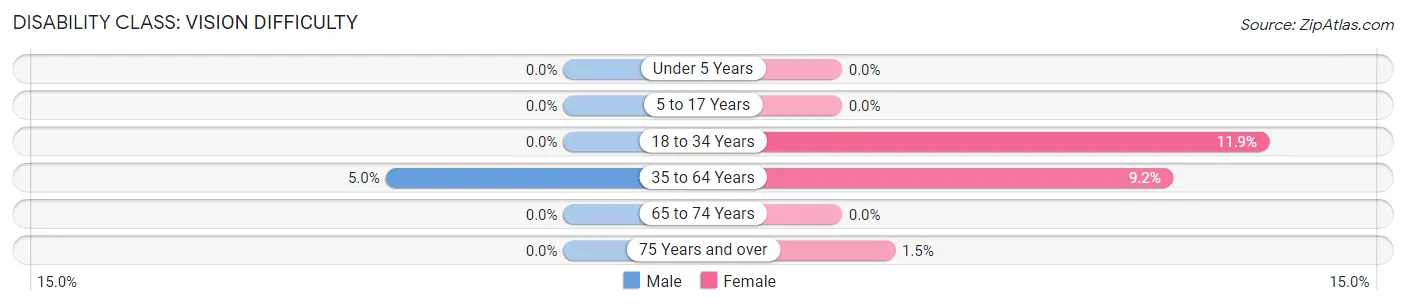
| Age Bracket | Male | Female |
| Under 5 Years | 0 (0.0%) | 0 (0.0%) |
| 5 to 17 Years | 0 (0.0%) | 0 (0.0%) |
| 18 to 34 Years | 0 (0.0%) | 17 (11.9%) |
| 35 to 64 Years | 11 (5.0%) | 21 (9.2%) |
| 65 to 74 Years | 0 (0.0%) | 0 (0.0%) |
| 75 Years and over | 0 (0.0%) | 2 (1.5%) |
Disability Class: Cognitive Difficulty
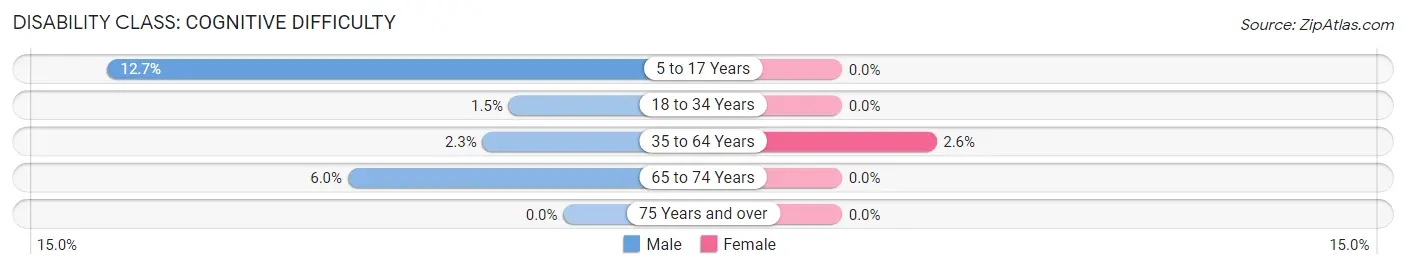
| Age Bracket | Male | Female |
| 5 to 17 Years | 17 (12.7%) | 0 (0.0%) |
| 18 to 34 Years | 3 (1.5%) | 0 (0.0%) |
| 35 to 64 Years | 5 (2.2%) | 6 (2.6%) |
| 65 to 74 Years | 3 (6.0%) | 0 (0.0%) |
| 75 Years and over | 0 (0.0%) | 0 (0.0%) |
Disability Class: Ambulatory Difficulty
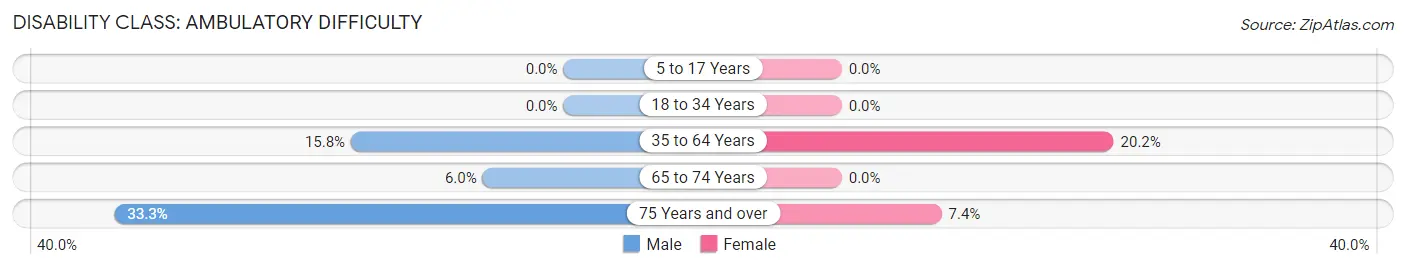
| Age Bracket | Male | Female |
| 5 to 17 Years | 0 (0.0%) | 0 (0.0%) |
| 18 to 34 Years | 0 (0.0%) | 0 (0.0%) |
| 35 to 64 Years | 35 (15.8%) | 46 (20.2%) |
| 65 to 74 Years | 3 (6.0%) | 0 (0.0%) |
| 75 Years and over | 24 (33.3%) | 10 (7.4%) |
Disability Class: Self-Care Difficulty
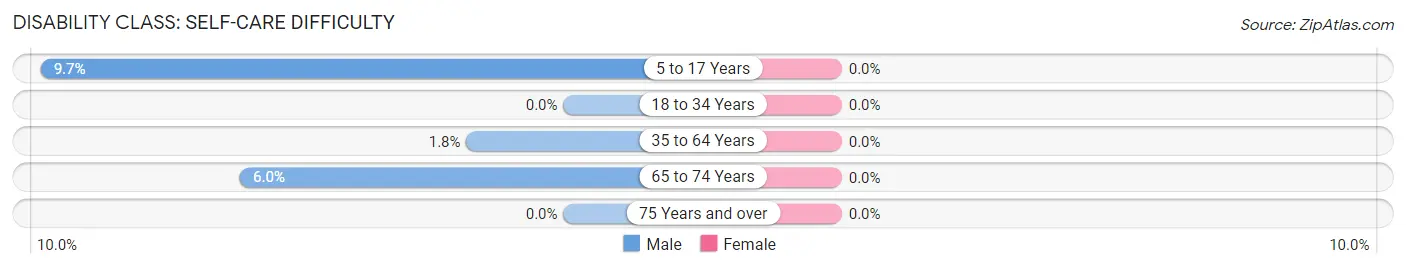
| Age Bracket | Male | Female |
| 5 to 17 Years | 13 (9.7%) | 0 (0.0%) |
| 18 to 34 Years | 0 (0.0%) | 0 (0.0%) |
| 35 to 64 Years | 4 (1.8%) | 0 (0.0%) |
| 65 to 74 Years | 3 (6.0%) | 0 (0.0%) |
| 75 Years and over | 0 (0.0%) | 0 (0.0%) |
Technology Access in La Cygne
Computing Device Access in La Cygne
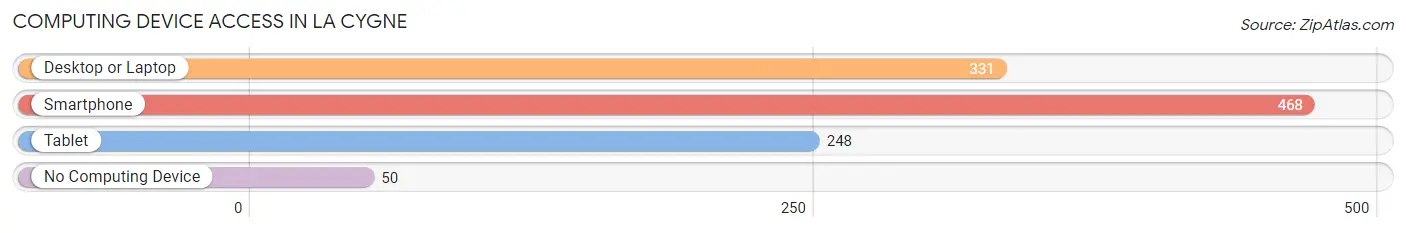
| Device Type | # Households | % Households |
| Desktop or Laptop | 331 | 60.4% |
| Smartphone | 468 | 85.4% |
| Tablet | 248 | 45.3% |
| No Computing Device | 50 | 9.1% |
| Total | 548 | 100.0% |
Internet Access in La Cygne
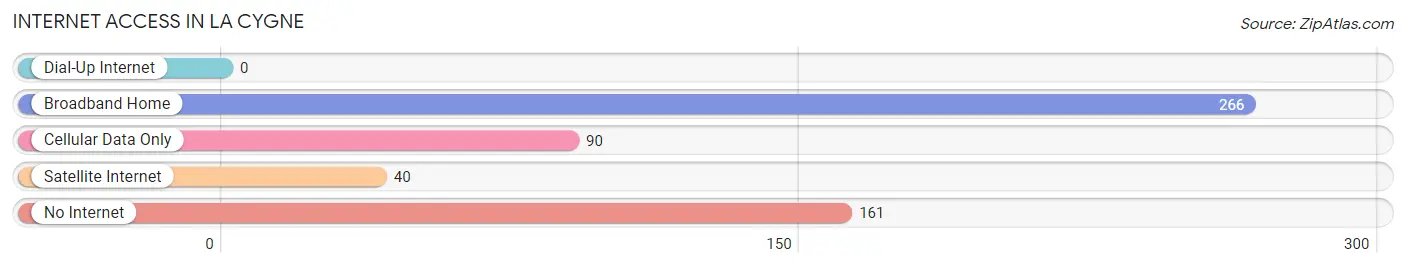
| Internet Type | # Households | % Households |
| Dial-Up Internet | 0 | 0.0% |
| Broadband Home | 266 | 48.5% |
| Cellular Data Only | 90 | 16.4% |
| Satellite Internet | 40 | 7.3% |
| No Internet | 161 | 29.4% |
| Total | 548 | 100.0% |
La Cygne Summary
Cygne, Kansas is a small town located in the northeast corner of Linn County, Kansas. It is situated on the banks of the Marais des Cygnes River, which is a tributary of the Missouri River. The town was founded in 1867 and was named after the French word for swan, which is a reference to the many swans that inhabit the river. The population of Cygne was estimated to be 545 in 2020.
Geography
Cygne is located in the northeast corner of Linn County, Kansas, at the intersection of U.S. Route 69 and Kansas State Highway 7. The town is situated on the banks of the Marais des Cygnes River, which is a tributary of the Missouri River. The town is located in the Osage Plains region of Kansas, which is characterized by rolling hills and open prairies. The climate in Cygne is humid continental, with hot summers and cold winters.
Economy
The economy of Cygne is largely based on agriculture. The town is home to several grain elevators, which are used to store and transport grain. The town also has a few small businesses, including a grocery store, a hardware store, and a few restaurants. The town is also home to a few manufacturing companies, including a furniture factory and a plastics factory.
Demographics
The population of Cygne was estimated to be 545 in 2020. The racial makeup of the town was 97.3% White, 0.7% African American, 0.2% Native American, 0.2% Asian, 0.2% from other races, and 1.6% from two or more races. Hispanic or Latino of any race were 1.1% of the population.
The median income for a household in Cygne was $37,500, and the median income for a family was $45,000. The per capita income for the town was $17,845. About 11.2% of families and 13.2% of the population were below the poverty line, including 16.7% of those under age 18 and 8.3% of those age 65 or over.
Conclusion
Cygne, Kansas is a small town located in the northeast corner of Linn County, Kansas. It is situated on the banks of the Marais des Cygnes River, which is a tributary of the Missouri River. The town was founded in 1867 and was named after the French word for swan, which is a reference to the many swans that inhabit the river. The population of Cygne was estimated to be 545 in 2020. The economy of Cygne is largely based on agriculture, and the town is home to several grain elevators, small businesses, and a few manufacturing companies. The racial makeup of the town was 97.3% White, 0.7% African American, 0.2% Native American, 0.2% Asian, 0.2% from other races, and 1.6% from two or more races. The median income for a household in Cygne was $37,500, and the median income for a family was $45,000. The per capita income for the town was $17,845. Cygne is a small town with a rich history and a strong agricultural economy.
Common Questions
What is the Total Population of La Cygne?
Total Population of La Cygne is 1,427.
What is the Total Male Population of La Cygne?
Total Male Population of La Cygne is 715.
What is the Total Female Population of La Cygne?
Total Female Population of La Cygne is 712.
What is the Ratio of Males per 100 Females in La Cygne?
There are 100.42 Males per 100 Females in La Cygne.
What is the Ratio of Females per 100 Males in La Cygne?
There are 99.58 Females per 100 Males in La Cygne.
What is the Median Population Age in La Cygne?
Median Population Age in La Cygne is 36.7 Years.
What is the Average Family Size in La Cygne
Average Family Size in La Cygne is 3.2 People.
What is the Average Household Size in La Cygne
Average Household Size in La Cygne is 2.6 People.
What is Per Capita Income in La Cygne?
Per Capita income in La Cygne is $25,488.
What is the Median Family Income in La Cygne?
Median Family Income in La Cygne is $74,792.
What is the Median Household income in La Cygne?
Median Household Income in La Cygne is $56,907.
What is Income or Wage Gap in La Cygne?
Income or Wage Gap in La Cygne is 52.7%.
Women in La Cygne earn 47.3 cents for every dollar earned by a man.
What is Inequality or Gini Index in La Cygne?
Inequality or Gini Index in La Cygne is 0.37.
How Large is the Labor Force in La Cygne?
There are 617 People in the Labor Forcein in La Cygne.
What is the Percentage of People in the Labor Force in La Cygne?
54.4% of People are in the Labor Force in La Cygne.
What is the Unemployment Rate in La Cygne?
Unemployment Rate in La Cygne is 6.2%.