The Highlands, KS
The Highlands Map
The Highlands Overview
516
TOTAL POPULATION
214
MALE POPULATION
302
FEMALE POPULATION
70.86
MALES / 100 FEMALES
141.12
FEMALES / 100 MALES
49.0
MEDIAN AGE
2.8
AVG FAMILY SIZE
2.3
AVG HOUSEHOLD SIZE
$64,964
PER CAPITA INCOME
$107,917
AVG FAMILY INCOME
$90,433
AVG HOUSEHOLD INCOME
37.2%
WAGE / INCOME GAP [ % ]
62.8¢/ $1
WAGE / INCOME GAP [ $ ]
0.51
INEQUALITY / GINI INDEX
266
LABOR FORCE [ PEOPLE ]
59.2%
PERCENT IN LABOR FORCE
8.6%
UNEMPLOYMENT RATE
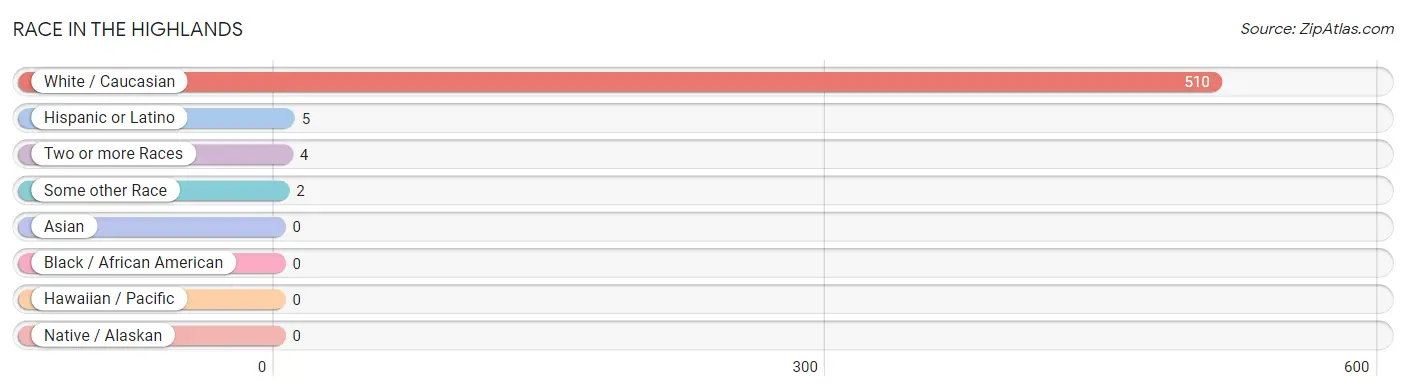
Race in The Highlands
The most populous races in The Highlands are White / Caucasian (510 | 98.8%), Hispanic or Latino (5 | 1.0%), and Two or more Races (4 | 0.8%).
| Race | # Population | % Population |
| Asian | 0 | 0.0% |
| Black / African American | 0 | 0.0% |
| Hawaiian / Pacific | 0 | 0.0% |
| Hispanic or Latino | 5 | 1.0% |
| Native / Alaskan | 0 | 0.0% |
| White / Caucasian | 510 | 98.8% |
| Two or more Races | 4 | 0.8% |
| Some other Race | 2 | 0.4% |
| Total | 516 | 100.0% |
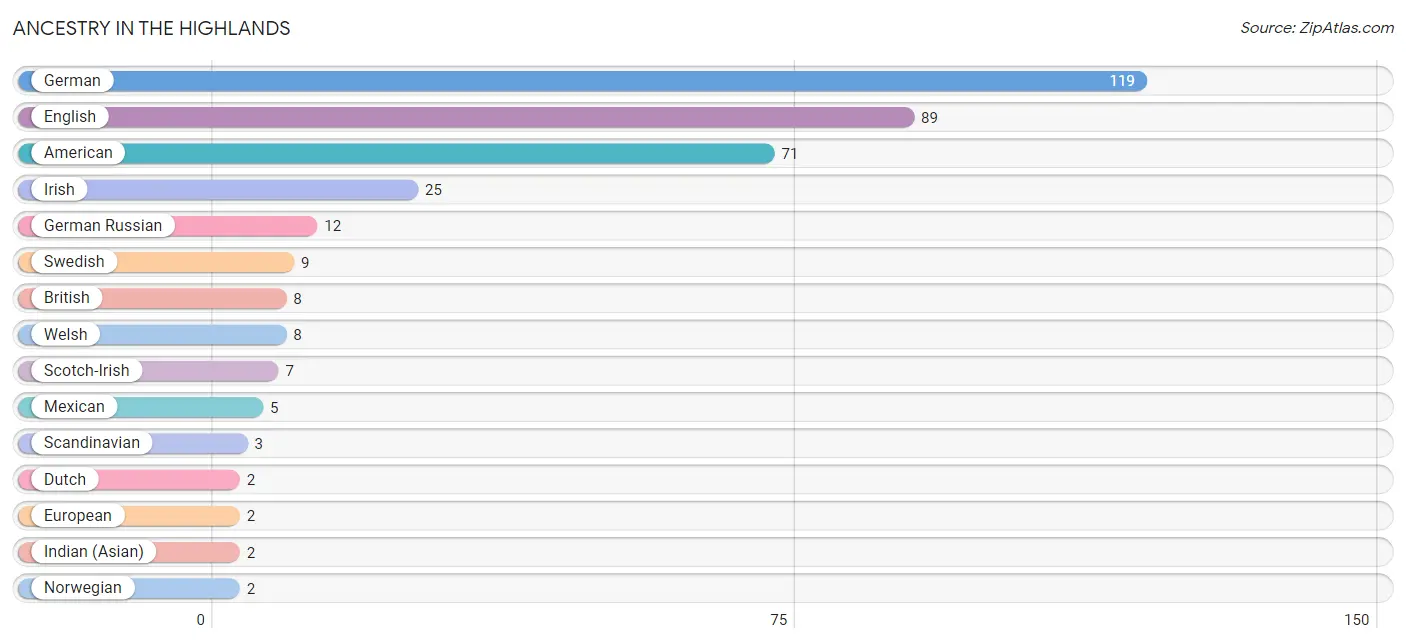
Ancestry in The Highlands
The most populous ancestries reported in The Highlands are German (119 | 23.1%), English (89 | 17.2%), American (71 | 13.8%), Irish (25 | 4.8%), and German Russian (12 | 2.3%), together accounting for 61.2% of all The Highlands residents.
| Ancestry | # Population | % Population |
| American | 71 | 13.8% |
| Belgian | 1 | 0.2% |
| British | 8 | 1.5% |
| Danish | 1 | 0.2% |
| Dutch | 2 | 0.4% |
| English | 89 | 17.2% |
| European | 2 | 0.4% |
| German | 119 | 23.1% |
| German Russian | 12 | 2.3% |
| Indian (Asian) | 2 | 0.4% |
| Irish | 25 | 4.8% |
| Mexican | 5 | 1.0% |
| Norwegian | 2 | 0.4% |
| Pennsylvania German | 1 | 0.2% |
| Scandinavian | 3 | 0.6% |
| Scotch-Irish | 7 | 1.4% |
| Scottish | 2 | 0.4% |
| Swedish | 9 | 1.7% |
| Welsh | 8 | 1.5% | View All 19 Rows |
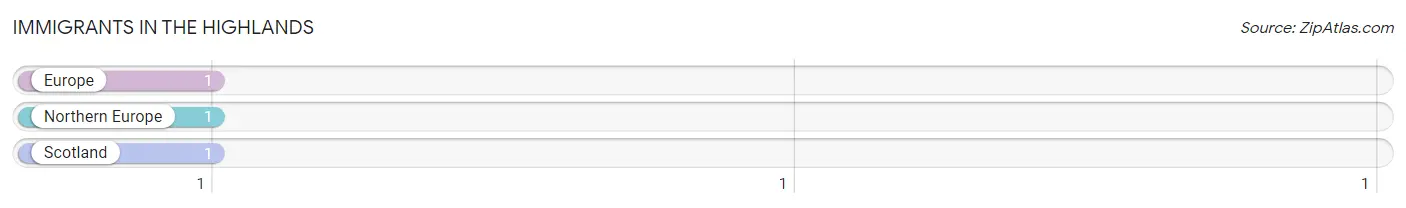
Immigrants in The Highlands
The most numerous immigrant groups reported in The Highlands came from Europe (1 | 0.2%), Northern Europe (1 | 0.2%), and Scotland (1 | 0.2%), together accounting for 0.6% of all The Highlands residents.
| Immigration Origin | # Population | % Population |
| Europe | 1 | 0.2% |
| Northern Europe | 1 | 0.2% |
| Scotland | 1 | 0.2% | View All 3 Rows |
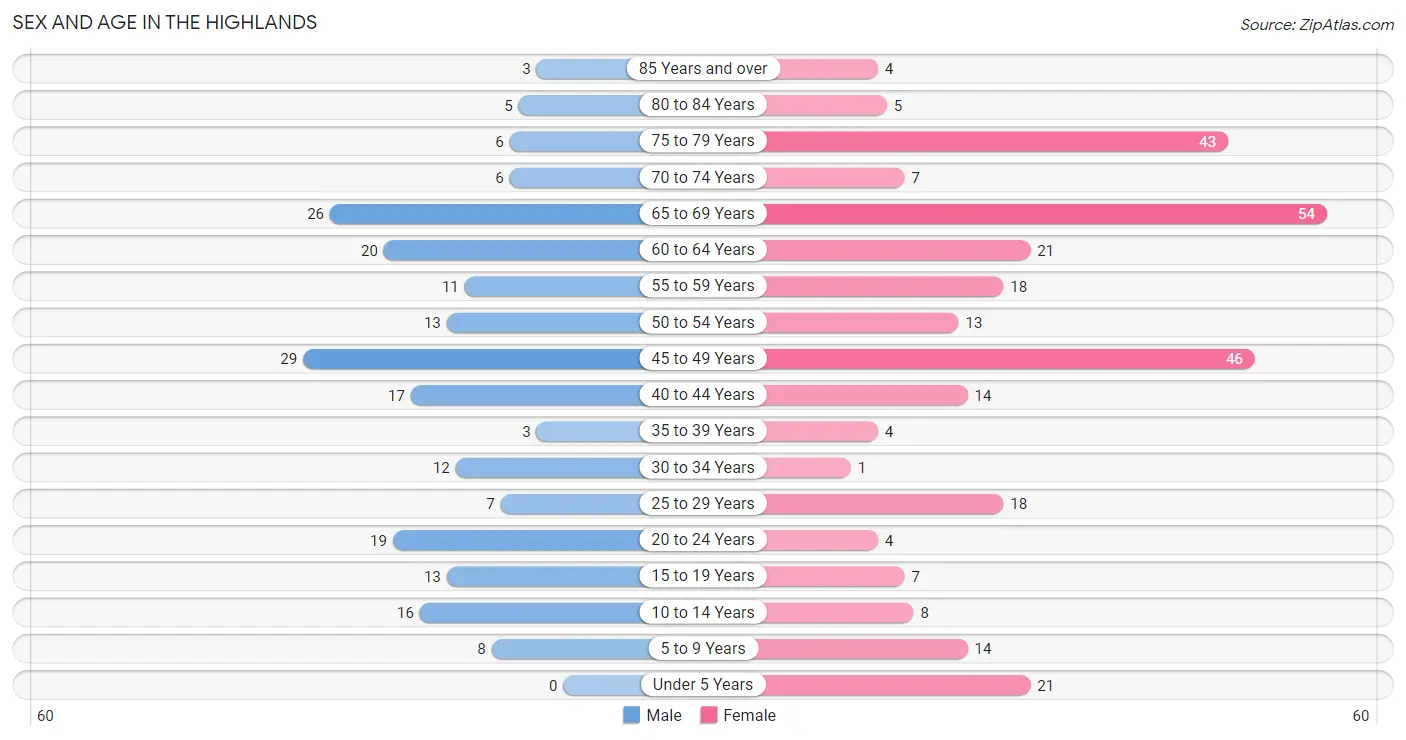
Sex and Age in The Highlands
Sex and Age in The Highlands
The most populous age groups in The Highlands are 45 to 49 Years (29 | 13.6%) for men and 65 to 69 Years (54 | 17.9%) for women.
| Age Bracket | Male | Female |
| Under 5 Years | 0 (0.0%) | 21 (7.0%) |
| 5 to 9 Years | 8 (3.7%) | 14 (4.6%) |
| 10 to 14 Years | 16 (7.5%) | 8 (2.6%) |
| 15 to 19 Years | 13 (6.1%) | 7 (2.3%) |
| 20 to 24 Years | 19 (8.9%) | 4 (1.3%) |
| 25 to 29 Years | 7 (3.3%) | 18 (6.0%) |
| 30 to 34 Years | 12 (5.6%) | 1 (0.3%) |
| 35 to 39 Years | 3 (1.4%) | 4 (1.3%) |
| 40 to 44 Years | 17 (7.9%) | 14 (4.6%) |
| 45 to 49 Years | 29 (13.6%) | 46 (15.2%) |
| 50 to 54 Years | 13 (6.1%) | 13 (4.3%) |
| 55 to 59 Years | 11 (5.1%) | 18 (6.0%) |
| 60 to 64 Years | 20 (9.3%) | 21 (7.0%) |
| 65 to 69 Years | 26 (12.1%) | 54 (17.9%) |
| 70 to 74 Years | 6 (2.8%) | 7 (2.3%) |
| 75 to 79 Years | 6 (2.8%) | 43 (14.2%) |
| 80 to 84 Years | 5 (2.3%) | 5 (1.7%) |
| 85 Years and over | 3 (1.4%) | 4 (1.3%) |
| Total | 214 (100.0%) | 302 (100.0%) |
Families and Households in The Highlands
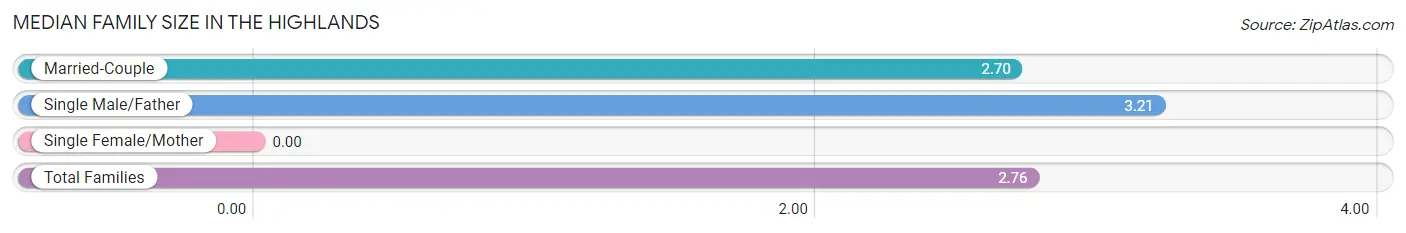
Median Family Size in The Highlands
| Family Type | # Families | Family Size |
| Married-Couple | 141 (88.1%) | 2.70 |
| Single Male/Father | 19 (11.9%) | 3.21 |
| Single Female/Mother | 0 (0.0%) | - |
| Total Families | 160 (100.0%) | 2.76 |
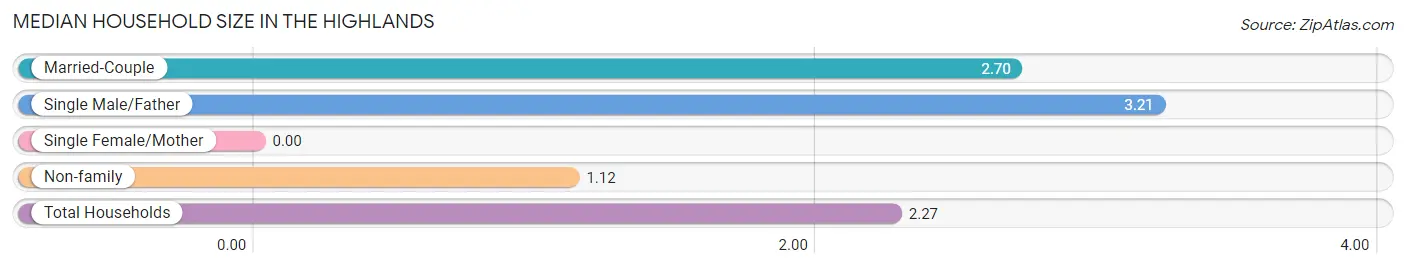
Median Household Size in The Highlands
| Household Type | # Households | Household Size |
| Married-Couple | 141 (62.1%) | 2.70 |
| Single Male/Father | 19 (8.4%) | 3.21 |
| Single Female/Mother | 0 (0.0%) | - |
| Non-family | 67 (29.5%) | 1.12 |
| Total Households | 227 (100.0%) | 2.27 |
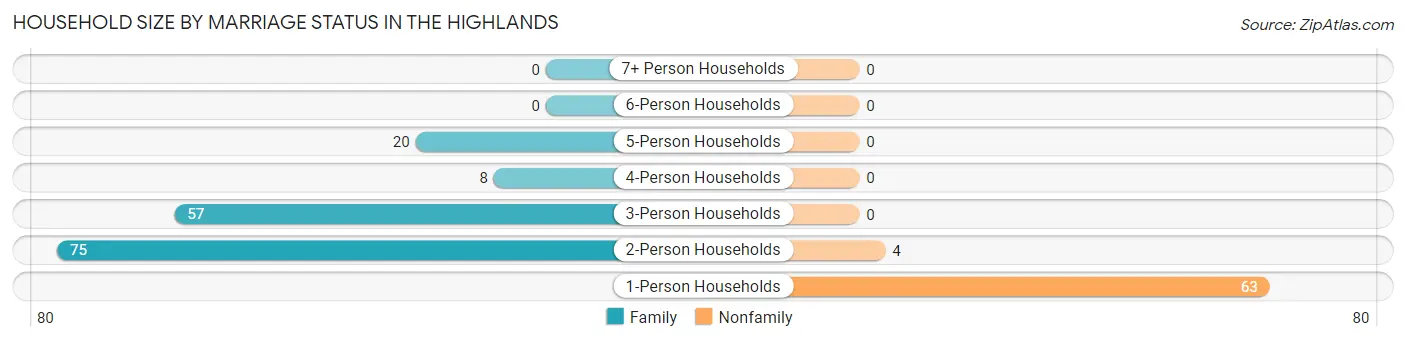
Household Size by Marriage Status in The Highlands
Out of a total of 227 households in The Highlands, 160 (70.5%) are family households, while 67 (29.5%) are nonfamily households. The most numerous type of family households are 2-person households, comprising 75, and the most common type of nonfamily households are 1-person households, comprising 63.
| Household Size | Family Households | Nonfamily Households |
| 1-Person Households | - | 63 (27.8%) |
| 2-Person Households | 75 (33.0%) | 4 (1.8%) |
| 3-Person Households | 57 (25.1%) | 0 (0.0%) |
| 4-Person Households | 8 (3.5%) | 0 (0.0%) |
| 5-Person Households | 20 (8.8%) | 0 (0.0%) |
| 6-Person Households | 0 (0.0%) | 0 (0.0%) |
| 7+ Person Households | 0 (0.0%) | 0 (0.0%) |
| Total | 160 (70.5%) | 67 (29.5%) |
Female Fertility in The Highlands
Fertility by Age in The Highlands
Average fertility rate in The Highlands is 149.0 births per 1,000 women. Women in the age bracket of 20 to 34 years have the highest fertility rate with 609.0 births per 1,000 women. Women in the age bracket of 20 to 34 years acount for 100.0% of all women with births.
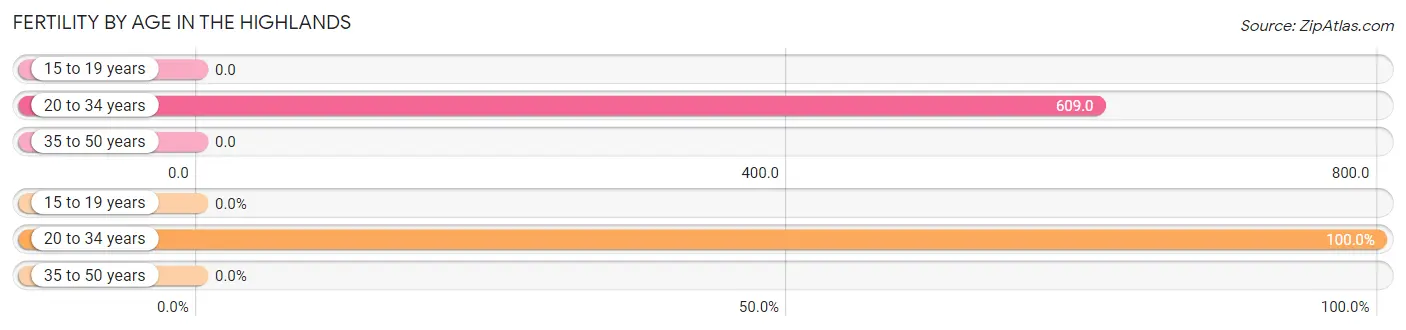
| Age Bracket | Women with Births | Births / 1,000 Women |
| 15 to 19 years | 0 (0.0%) | 0.0 |
| 20 to 34 years | 14 (100.0%) | 609.0 |
| 35 to 50 years | 0 (0.0%) | 0.0 |
| Total | 14 (100.0%) | 149.0 |
Fertility by Age by Marriage Status in The Highlands
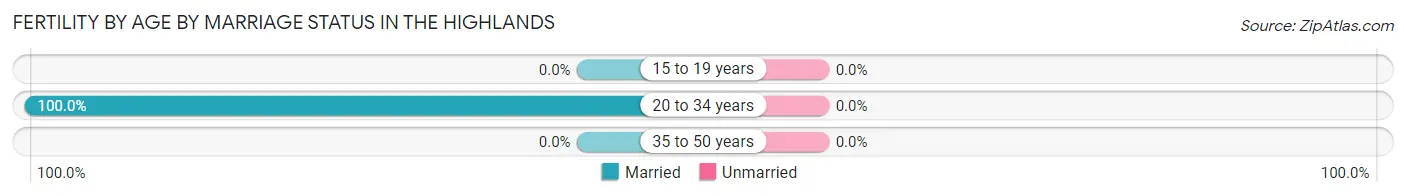
| Age Bracket | Married | Unmarried |
| 15 to 19 years | 0 (0.0%) | 0 (0.0%) |
| 20 to 34 years | 14 (100.0%) | 0 (0.0%) |
| 35 to 50 years | 0 (0.0%) | 0 (0.0%) |
| Total | 14 (100.0%) | 0 (0.0%) |
Fertility by Education in The Highlands
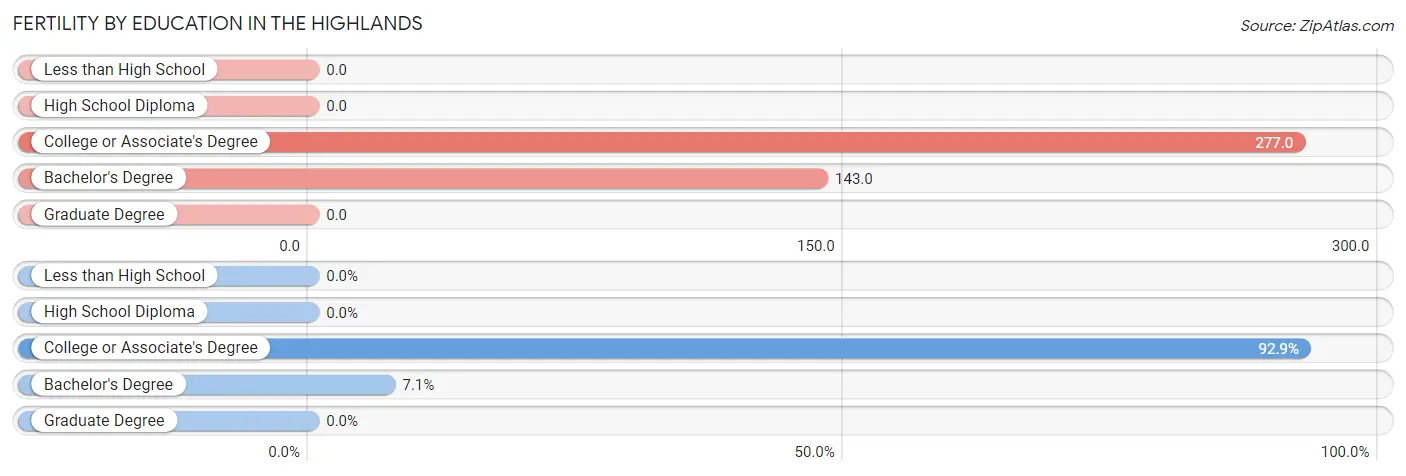
| Educational Attainment | Women with Births | Births / 1,000 Women |
| Less than High School | 0 (0.0%) | 0.0 |
| High School Diploma | 0 (0.0%) | 0.0 |
| College or Associate's Degree | 13 (92.9%) | 277.0 |
| Bachelor's Degree | 1 (7.1%) | 143.0 |
| Graduate Degree | 0 (0.0%) | 0.0 |
| Total | 14 (100.0%) | 149.0 |
Fertility by Education by Marriage Status in The Highlands
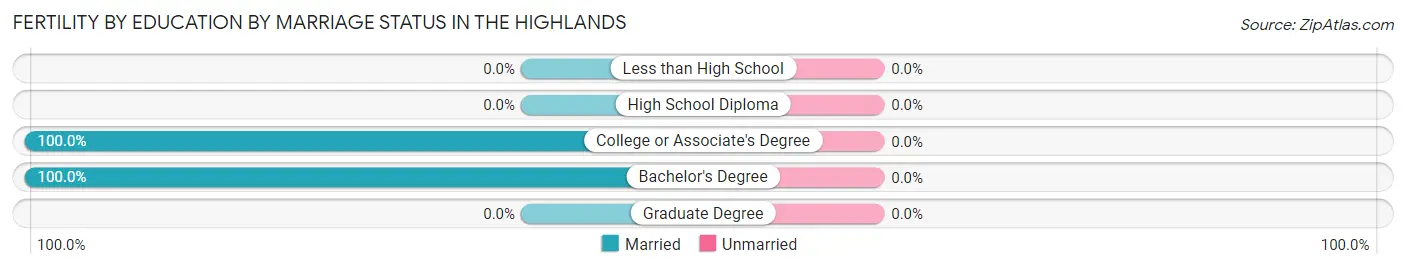
| Educational Attainment | Married | Unmarried |
| Less than High School | 0 (0.0%) | 0 (0.0%) |
| High School Diploma | 0 (0.0%) | 0 (0.0%) |
| College or Associate's Degree | 13 (100.0%) | 0 (0.0%) |
| Bachelor's Degree | 1 (100.0%) | 0 (0.0%) |
| Graduate Degree | 0 (0.0%) | 0 (0.0%) |
| Total | 14 (100.0%) | 0 (0.0%) |
Income in The Highlands
Income Overview in The Highlands
Per Capita Income in The Highlands is $64,964, while median incomes of families and households are $107,917 and $90,433 respectively.
| Characteristic | Number | Measure |
| Per Capita Income | 516 | $64,964 |
| Median Family Income | 160 | $107,917 |
| Mean Family Income | 160 | $187,625 |
| Median Household Income | 227 | $90,433 |
| Mean Household Income | 227 | $147,494 |
| Income Deficit | 160 | $0 |
| Wage / Income Gap (%) | 516 | 37.25% |
| Wage / Income Gap ($) | 516 | 62.75¢ per $1 |
| Gini / Inequality Index | 516 | 0.51 |
Earnings by Sex in The Highlands
Average Earnings in The Highlands are $47,000, $69,013 for men and $43,306 for women, a difference of 37.2%.
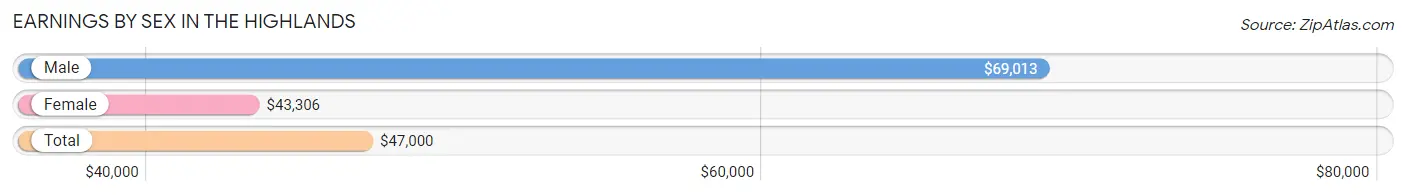
| Sex | Number | Average Earnings |
| Male | 145 (47.4%) | $69,013 |
| Female | 161 (52.6%) | $43,306 |
| Total | 306 (100.0%) | $47,000 |
Earnings by Sex by Income Bracket in The Highlands
The most common earnings brackets in The Highlands are $100,000+ for men (38 | 26.2%) and $40,000 to $44,999 for women (47 | 29.2%).
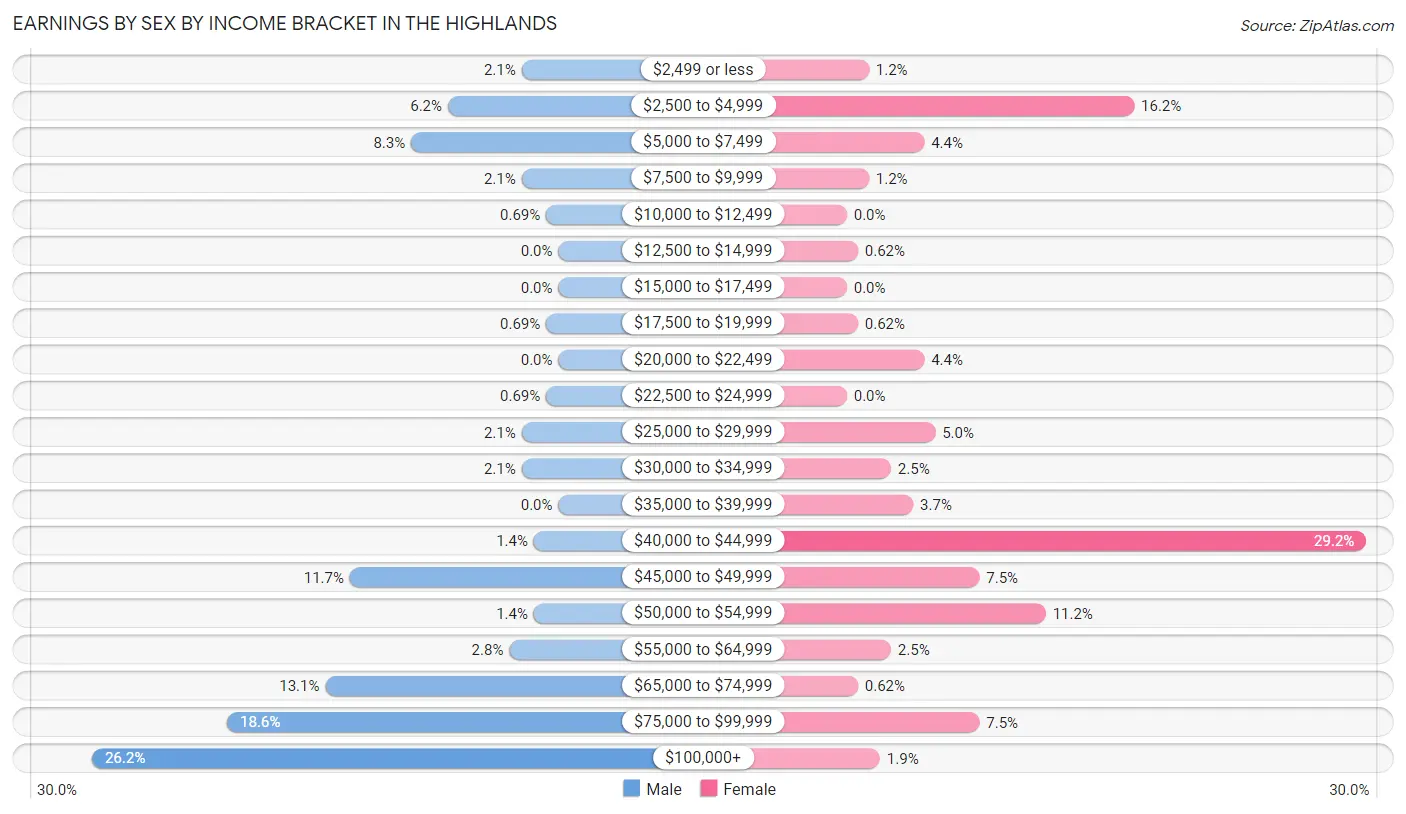
| Income | Male | Female |
| $2,499 or less | 3 (2.1%) | 2 (1.2%) |
| $2,500 to $4,999 | 9 (6.2%) | 26 (16.2%) |
| $5,000 to $7,499 | 12 (8.3%) | 7 (4.3%) |
| $7,500 to $9,999 | 3 (2.1%) | 2 (1.2%) |
| $10,000 to $12,499 | 1 (0.7%) | 0 (0.0%) |
| $12,500 to $14,999 | 0 (0.0%) | 1 (0.6%) |
| $15,000 to $17,499 | 0 (0.0%) | 0 (0.0%) |
| $17,500 to $19,999 | 1 (0.7%) | 1 (0.6%) |
| $20,000 to $22,499 | 0 (0.0%) | 7 (4.3%) |
| $22,500 to $24,999 | 1 (0.7%) | 0 (0.0%) |
| $25,000 to $29,999 | 3 (2.1%) | 8 (5.0%) |
| $30,000 to $34,999 | 3 (2.1%) | 4 (2.5%) |
| $35,000 to $39,999 | 0 (0.0%) | 6 (3.7%) |
| $40,000 to $44,999 | 2 (1.4%) | 47 (29.2%) |
| $45,000 to $49,999 | 17 (11.7%) | 12 (7.4%) |
| $50,000 to $54,999 | 2 (1.4%) | 18 (11.2%) |
| $55,000 to $64,999 | 4 (2.8%) | 4 (2.5%) |
| $65,000 to $74,999 | 19 (13.1%) | 1 (0.6%) |
| $75,000 to $99,999 | 27 (18.6%) | 12 (7.4%) |
| $100,000+ | 38 (26.2%) | 3 (1.9%) |
| Total | 145 (100.0%) | 161 (100.0%) |
Earnings by Sex by Educational Attainment in The Highlands
Average earnings in The Highlands are $93,125 for men and $43,500 for women, a difference of 53.3%. Men with an educational attainment of bachelor's degree enjoy the highest average annual earnings of $107,639, while those with college or associate's degree education earn the least with $68,636. Women with an educational attainment of high school diploma earn the most with the average annual earnings of $44,073, while those with bachelor's degree education have the smallest earnings of $34,167.
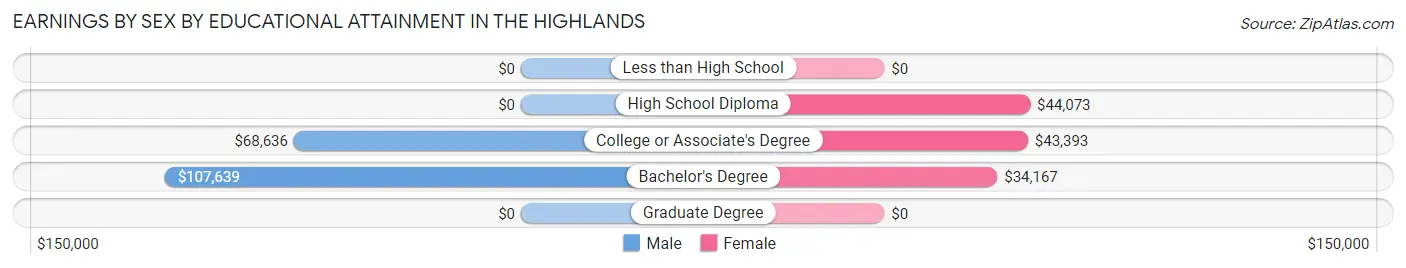
| Educational Attainment | Male Income | Female Income |
| Less than High School | - | - |
| High School Diploma | - | - |
| College or Associate's Degree | $68,636 | $43,393 |
| Bachelor's Degree | $107,639 | $34,167 |
| Graduate Degree | - | - |
| Total | $93,125 | $43,500 |
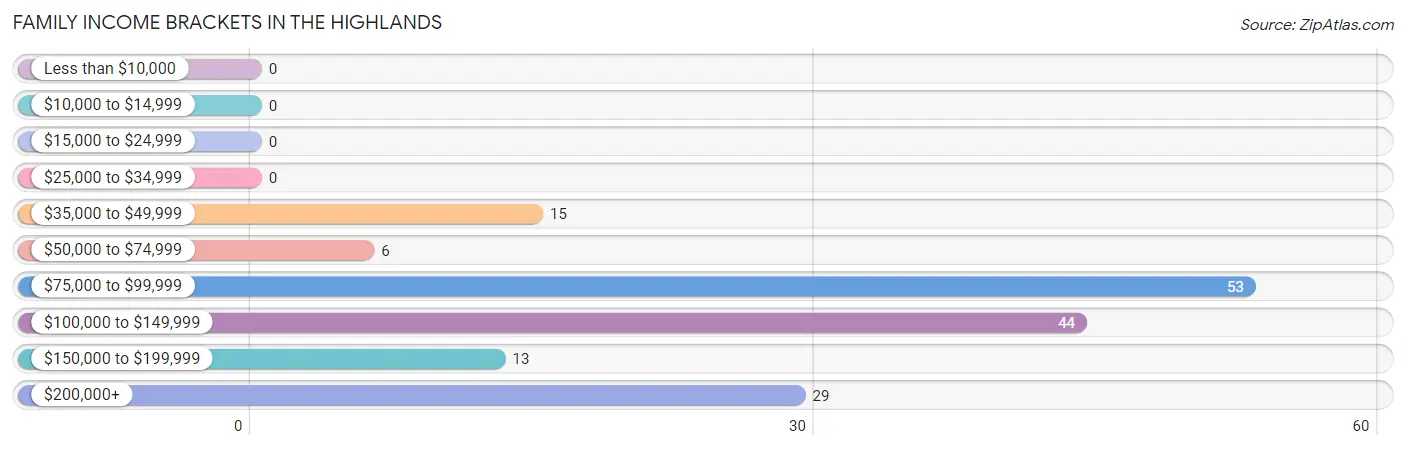
Family Income in The Highlands
Family Income Brackets in The Highlands
According to the The Highlands family income data, there are 53 families falling into the $75,000 to $99,999 income range, which is the most common income bracket and makes up 33.1% of all families.
| Income Bracket | # Families | % Families |
| Less than $10,000 | 0 | 0.0% |
| $10,000 to $14,999 | 0 | 0.0% |
| $15,000 to $24,999 | 0 | 0.0% |
| $25,000 to $34,999 | 0 | 0.0% |
| $35,000 to $49,999 | 15 | 9.4% |
| $50,000 to $74,999 | 6 | 3.8% |
| $75,000 to $99,999 | 53 | 33.1% |
| $100,000 to $149,999 | 44 | 27.5% |
| $150,000 to $199,999 | 13 | 8.1% |
| $200,000+ | 29 | 18.1% |
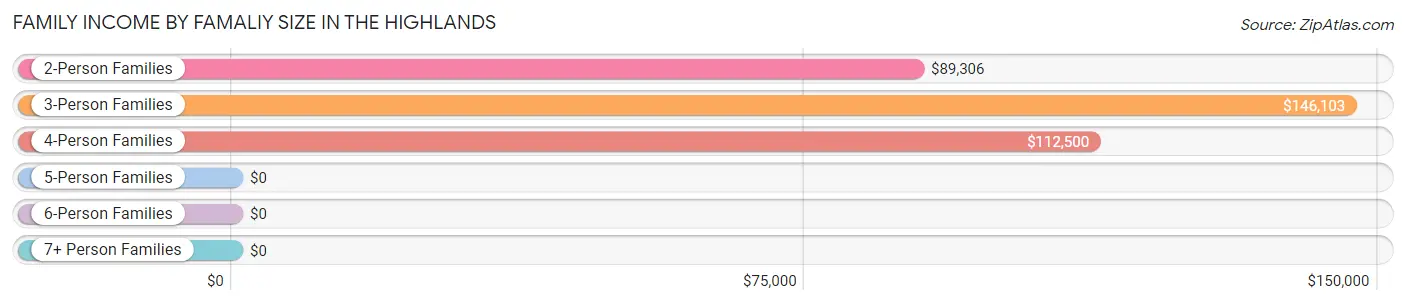
Family Income by Famaliy Size in The Highlands
3-person families (57 | 35.6%) account for the highest median family income in The Highlands with $146,103 per family, while 3-person families (57 | 35.6%) have the highest median income of $48,701 per family member.
| Income Bracket | # Families | Median Income |
| 2-Person Families | 75 (46.9%) | $89,306 |
| 3-Person Families | 57 (35.6%) | $146,103 |
| 4-Person Families | 8 (5.0%) | $112,500 |
| 5-Person Families | 20 (12.5%) | $0 |
| 6-Person Families | 0 (0.0%) | $0 |
| 7+ Person Families | 0 (0.0%) | $0 |
| Total | 160 (100.0%) | $107,917 |
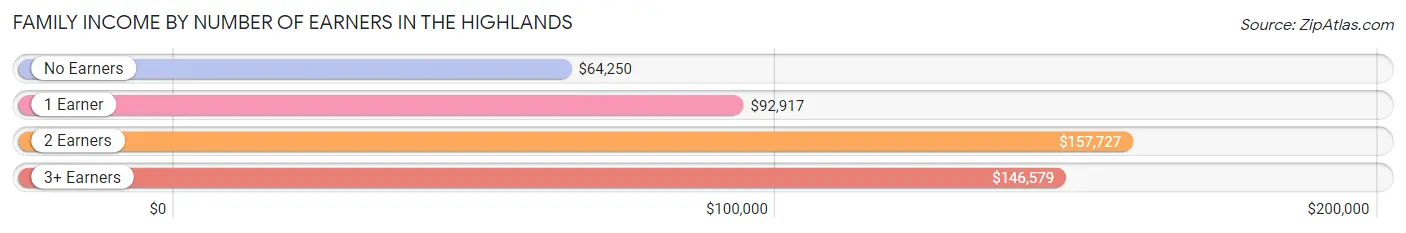
Family Income by Number of Earners in The Highlands
The median family income in The Highlands is $107,917, with families comprising 2 earners (62) having the highest median family income of $157,727, while families with no earners (29) have the lowest median family income of $64,250, accounting for 38.8% and 18.1% of families, respectively.
| Number of Earners | # Families | Median Income |
| No Earners | 29 (18.1%) | $64,250 |
| 1 Earner | 37 (23.1%) | $92,917 |
| 2 Earners | 62 (38.8%) | $157,727 |
| 3+ Earners | 32 (20.0%) | $146,579 |
| Total | 160 (100.0%) | $107,917 |
Household Income in The Highlands
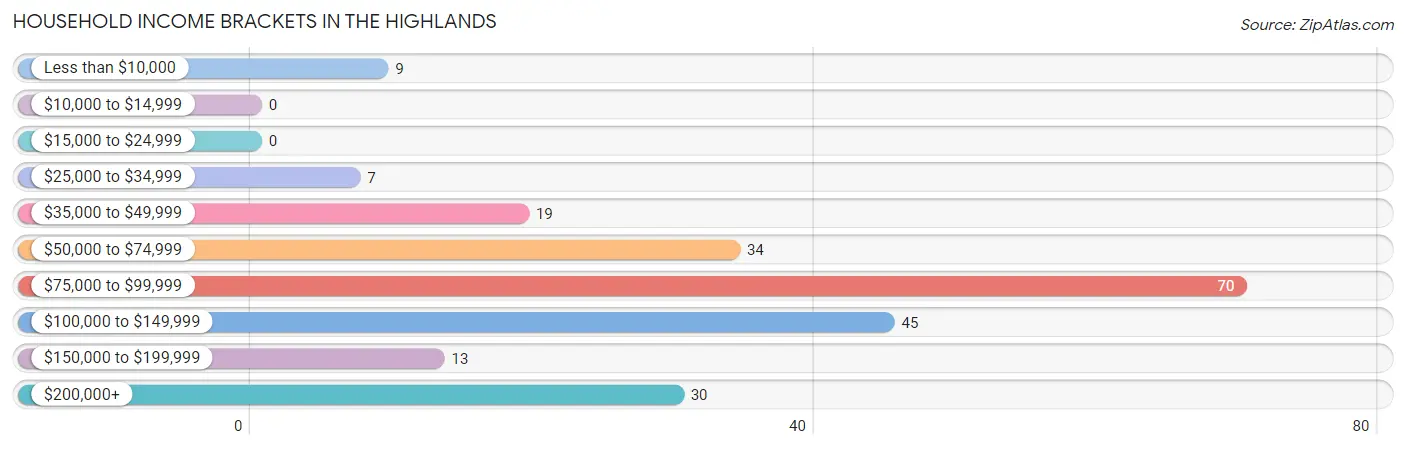
Household Income Brackets in The Highlands
With 70 households falling in the category, the $75,000 to $99,999 income range is the most frequent in The Highlands, accounting for 30.8% of all households.
| Income Bracket | # Households | % Households |
| Less than $10,000 | 9 | 4.0% |
| $10,000 to $14,999 | 0 | 0.0% |
| $15,000 to $24,999 | 0 | 0.0% |
| $25,000 to $34,999 | 7 | 3.1% |
| $35,000 to $49,999 | 19 | 8.4% |
| $50,000 to $74,999 | 34 | 15.0% |
| $75,000 to $99,999 | 70 | 30.8% |
| $100,000 to $149,999 | 45 | 19.8% |
| $150,000 to $199,999 | 13 | 5.7% |
| $200,000+ | 30 | 13.2% |
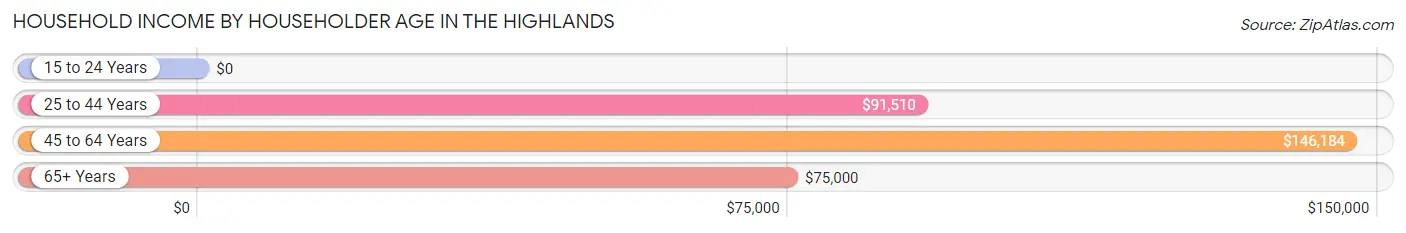
Household Income by Householder Age in The Highlands
The median household income in The Highlands is $90,433, with the highest median household income of $146,184 found in the 45 to 64 years age bracket for the primary householder. A total of 80 households (35.2%) fall into this category. Meanwhile, the 15 to 24 years age bracket for the primary householder has the lowest median household income of $0, with 4 households (1.8%) in this group.
| Income Bracket | # Households | Median Income |
| 15 to 24 Years | 4 (1.8%) | $0 |
| 25 to 44 Years | 39 (17.2%) | $91,510 |
| 45 to 64 Years | 80 (35.2%) | $146,184 |
| 65+ Years | 104 (45.8%) | $75,000 |
| Total | 227 (100.0%) | $90,433 |
Poverty in The Highlands
Income Below Poverty by Sex and Age in The Highlands
With 0.9% poverty level for males and 2.3% for females among the residents of The Highlands, 18 to 24 year old males and 55 to 64 year old females are the most vulnerable to poverty, with 2 males (6.2%) and 3 females (7.7%) in their respective age groups living below the poverty level.
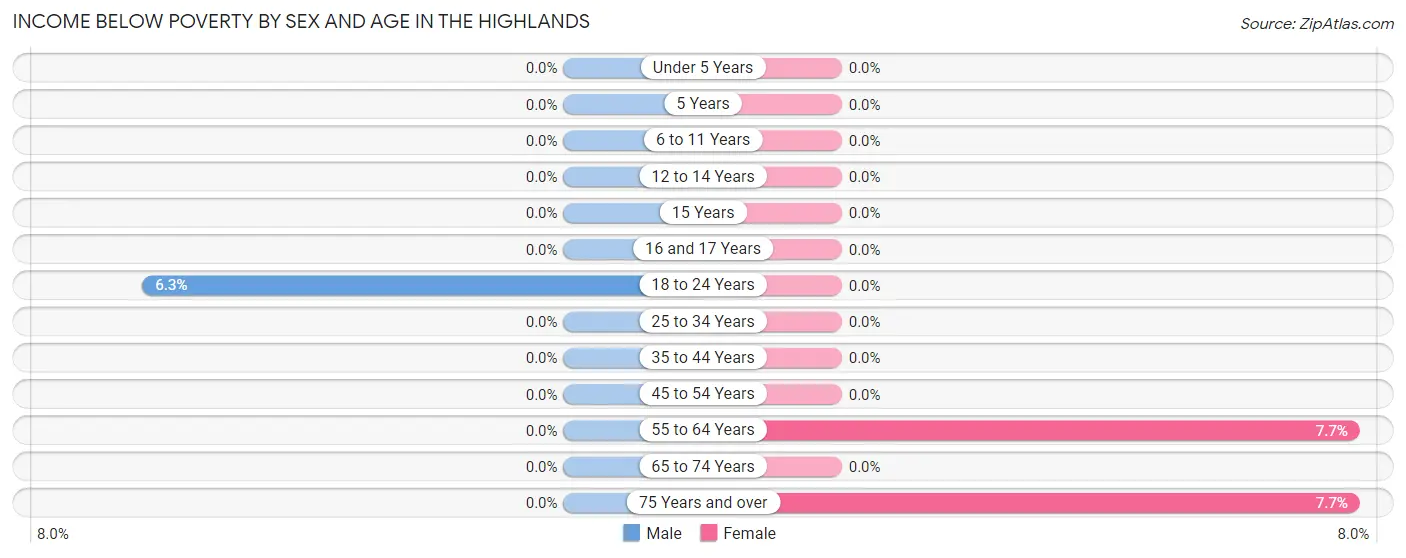
| Age Bracket | Male | Female |
| Under 5 Years | 0 (0.0%) | 0 (0.0%) |
| 5 Years | 0 (0.0%) | 0 (0.0%) |
| 6 to 11 Years | 0 (0.0%) | 0 (0.0%) |
| 12 to 14 Years | 0 (0.0%) | 0 (0.0%) |
| 15 Years | 0 (0.0%) | 0 (0.0%) |
| 16 and 17 Years | 0 (0.0%) | 0 (0.0%) |
| 18 to 24 Years | 2 (6.2%) | 0 (0.0%) |
| 25 to 34 Years | 0 (0.0%) | 0 (0.0%) |
| 35 to 44 Years | 0 (0.0%) | 0 (0.0%) |
| 45 to 54 Years | 0 (0.0%) | 0 (0.0%) |
| 55 to 64 Years | 0 (0.0%) | 3 (7.7%) |
| 65 to 74 Years | 0 (0.0%) | 0 (0.0%) |
| 75 Years and over | 0 (0.0%) | 4 (7.7%) |
| Total | 2 (0.9%) | 7 (2.3%) |
Income Above Poverty by Sex and Age in The Highlands
According to the poverty statistics in The Highlands, males aged 5 years and females aged under 5 years are the age groups that are most secure financially, with 100.0% of males and 100.0% of females in these age groups living above the poverty line.
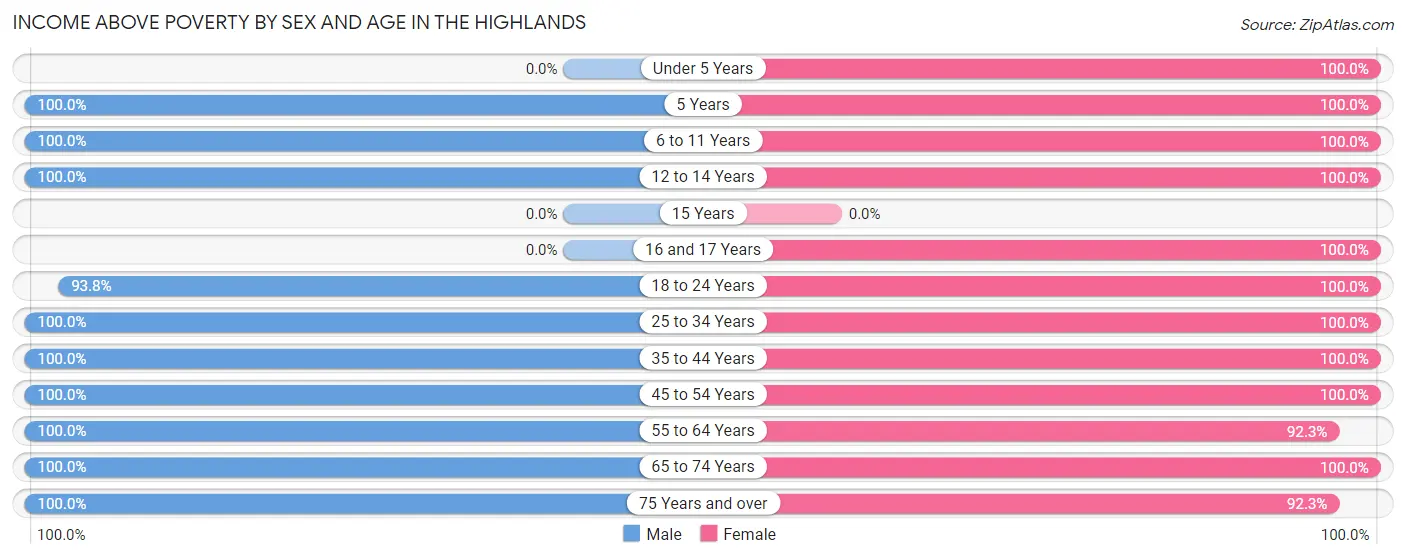
| Age Bracket | Male | Female |
| Under 5 Years | 0 (0.0%) | 21 (100.0%) |
| 5 Years | 6 (100.0%) | 11 (100.0%) |
| 6 to 11 Years | 2 (100.0%) | 6 (100.0%) |
| 12 to 14 Years | 16 (100.0%) | 5 (100.0%) |
| 15 Years | 0 (0.0%) | 0 (0.0%) |
| 16 and 17 Years | 0 (0.0%) | 2 (100.0%) |
| 18 to 24 Years | 30 (93.8%) | 9 (100.0%) |
| 25 to 34 Years | 19 (100.0%) | 19 (100.0%) |
| 35 to 44 Years | 20 (100.0%) | 18 (100.0%) |
| 45 to 54 Years | 42 (100.0%) | 59 (100.0%) |
| 55 to 64 Years | 31 (100.0%) | 36 (92.3%) |
| 65 to 74 Years | 32 (100.0%) | 61 (100.0%) |
| 75 Years and over | 14 (100.0%) | 48 (92.3%) |
| Total | 212 (99.1%) | 295 (97.7%) |
Income Below Poverty Among Married-Couple Families in The Highlands
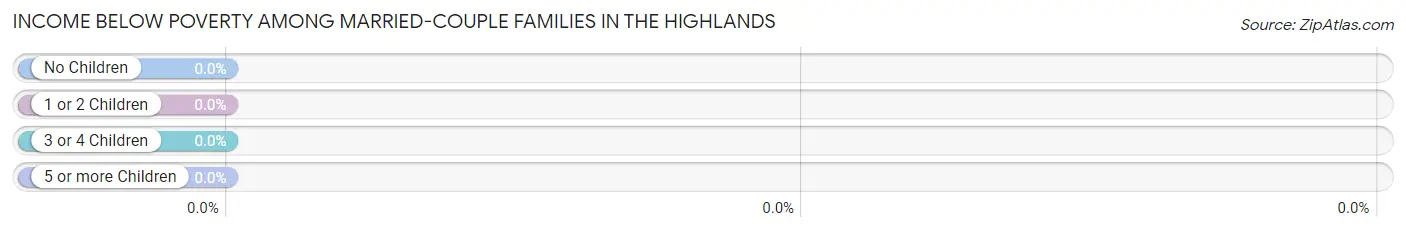
| Children | Above Poverty | Below Poverty |
| No Children | 101 (100.0%) | 0 (0.0%) |
| 1 or 2 Children | 29 (100.0%) | 0 (0.0%) |
| 3 or 4 Children | 11 (100.0%) | 0 (0.0%) |
| 5 or more Children | 0 (0.0%) | 0 (0.0%) |
| Total | 141 (100.0%) | 0 (0.0%) |
Income Below Poverty Among Single-Parent Households in The Highlands
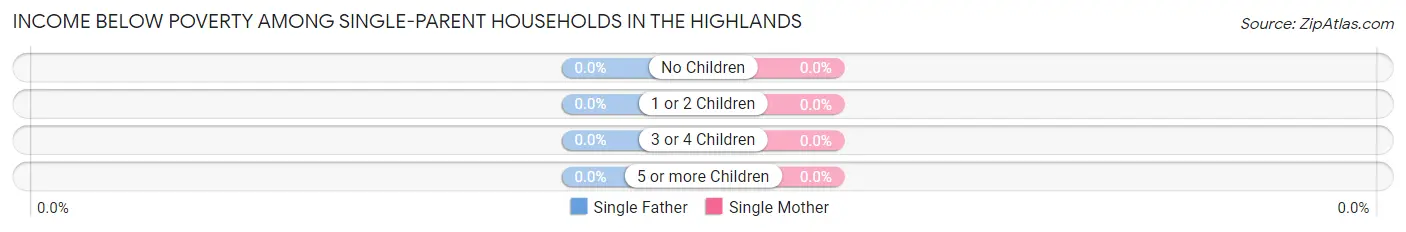
| Children | Single Father | Single Mother |
| No Children | 0 (0.0%) | 0 (0.0%) |
| 1 or 2 Children | 0 (0.0%) | 0 (0.0%) |
| 3 or 4 Children | 0 (0.0%) | 0 (0.0%) |
| 5 or more Children | 0 (0.0%) | 0 (0.0%) |
| Total | 0 (0.0%) | 0 (0.0%) |
Income Below Poverty Among Married-Couple vs Single-Parent Households in The Highlands
| Children | Married-Couple Families | Single-Parent Households |
| No Children | 0 (0.0%) | 0 (0.0%) |
| 1 or 2 Children | 0 (0.0%) | 0 (0.0%) |
| 3 or 4 Children | 0 (0.0%) | 0 (0.0%) |
| 5 or more Children | 0 (0.0%) | 0 (0.0%) |
| Total | 0 (0.0%) | 0 (0.0%) |
Employment Characteristics in The Highlands
Employment by Class of Employer in The Highlands
Among the 242 employed individuals in The Highlands, private company employees (159 | 65.7%), not-for-profit organizations (31 | 12.8%), and local government employees (16 | 6.6%) make up the most common classes of employment.
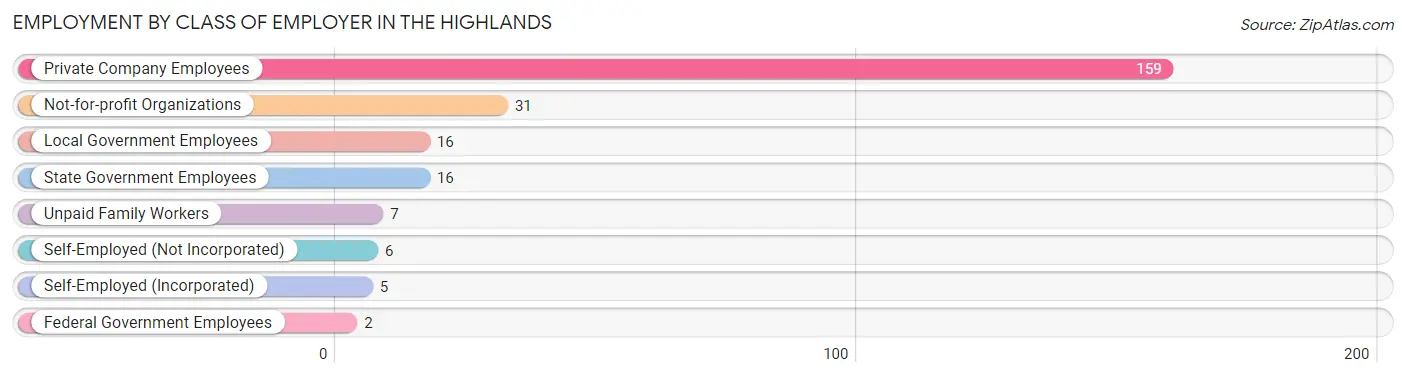
| Employer Class | # Employees | % Employees |
| Private Company Employees | 159 | 65.7% |
| Self-Employed (Incorporated) | 5 | 2.1% |
| Self-Employed (Not Incorporated) | 6 | 2.5% |
| Not-for-profit Organizations | 31 | 12.8% |
| Local Government Employees | 16 | 6.6% |
| State Government Employees | 16 | 6.6% |
| Federal Government Employees | 2 | 0.8% |
| Unpaid Family Workers | 7 | 2.9% |
| Total | 242 | 100.0% |
Employment Status by Age in The Highlands
According to the labor force statistics for The Highlands, out of the total population over 16 years of age (449), 59.2% or 266 individuals are in the labor force, with 8.6% or 23 of them unemployed. The age group with the highest labor force participation rate is 16 to 19 years, with 100.0% or 20 individuals in the labor force. Within the labor force, the 16 to 19 years age range has the highest percentage of unemployed individuals, with 65.0% or 13 of them being unemployed.
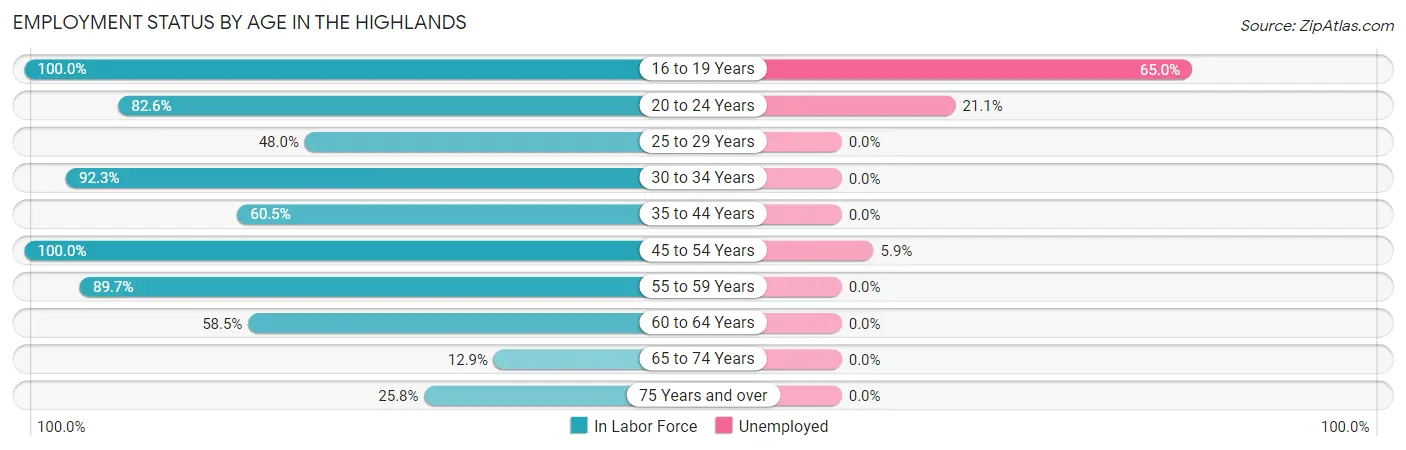
| Age Bracket | In Labor Force | Unemployed |
| 16 to 19 Years | 20 (100.0%) | 13 (65.0%) |
| 20 to 24 Years | 19 (82.6%) | 4 (21.1%) |
| 25 to 29 Years | 12 (48.0%) | 0 (0.0%) |
| 30 to 34 Years | 12 (92.3%) | 0 (0.0%) |
| 35 to 44 Years | 23 (60.5%) | 0 (0.0%) |
| 45 to 54 Years | 101 (100.0%) | 6 (5.9%) |
| 55 to 59 Years | 26 (89.7%) | 0 (0.0%) |
| 60 to 64 Years | 24 (58.5%) | 0 (0.0%) |
| 65 to 74 Years | 12 (12.9%) | 0 (0.0%) |
| 75 Years and over | 17 (25.8%) | 0 (0.0%) |
| Total | 266 (59.2%) | 23 (8.6%) |
Employment Status by Educational Attainment in The Highlands
According to labor force statistics for The Highlands, 80.2% of individuals (198) out of the total population between 25 and 64 years of age (247) are in the labor force, with 3.0% or 6 of them being unemployed. The group with the highest labor force participation rate are those with the educational attainment of bachelor's degree or higher, with 97.8% or 45 individuals in the labor force. Within the labor force, individuals with high school diploma education have the highest percentage of unemployment, with 11.3% or 6 of them being unemployed.
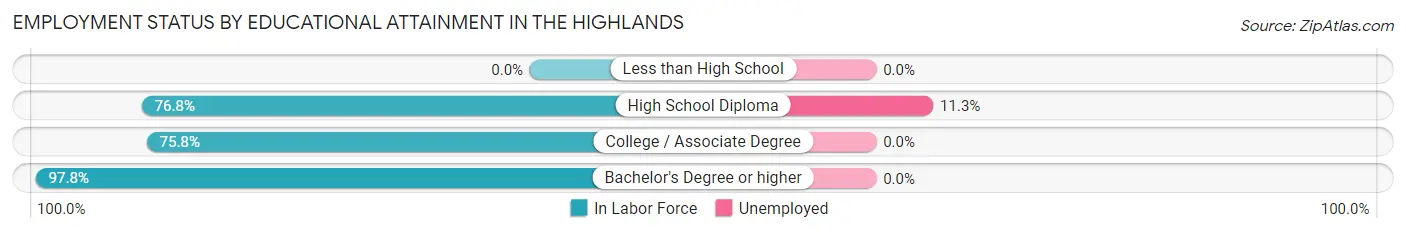
| Educational Attainment | In Labor Force | Unemployed |
| Less than High School | 0 (0.0%) | 0 (0.0%) |
| High School Diploma | 53 (76.8%) | 8 (11.3%) |
| College / Associate Degree | 100 (75.8%) | 0 (0.0%) |
| Bachelor's Degree or higher | 45 (97.8%) | 0 (0.0%) |
| Total | 198 (80.2%) | 7 (3.0%) |
Employment Occupations by Sex in The Highlands
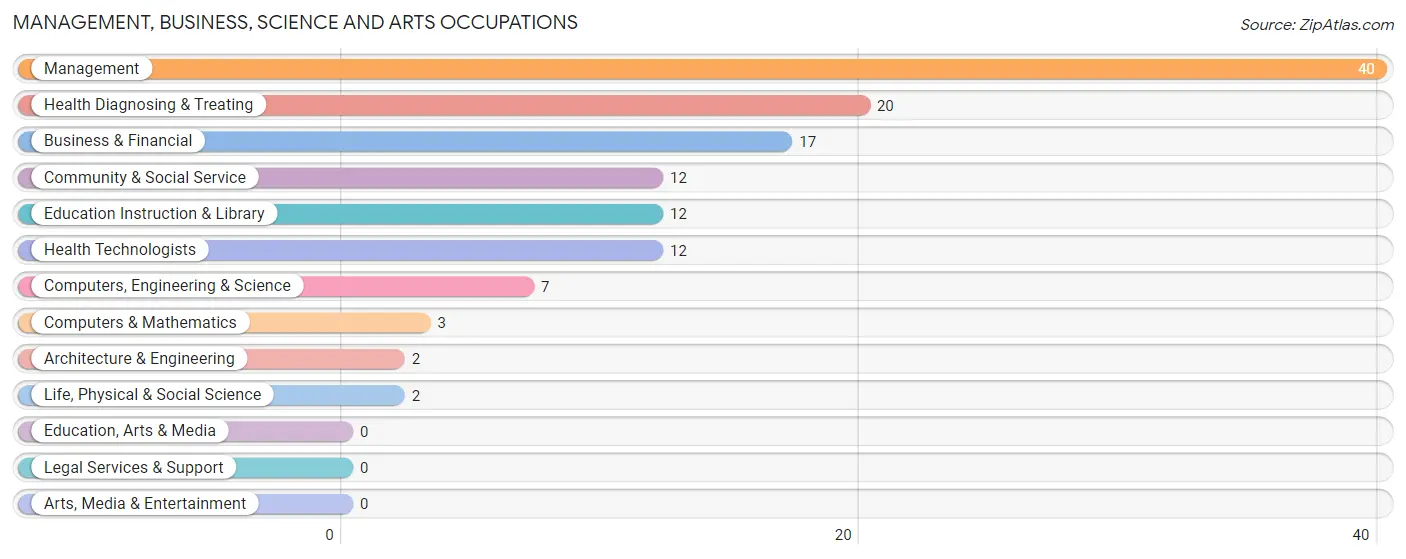
Management, Business, Science and Arts Occupations
The most common Management, Business, Science and Arts occupations in The Highlands are Management (40 | 16.5%), Health Diagnosing & Treating (20 | 8.2%), Business & Financial (17 | 7.0%), Community & Social Service (12 | 4.9%), and Education Instruction & Library (12 | 4.9%).
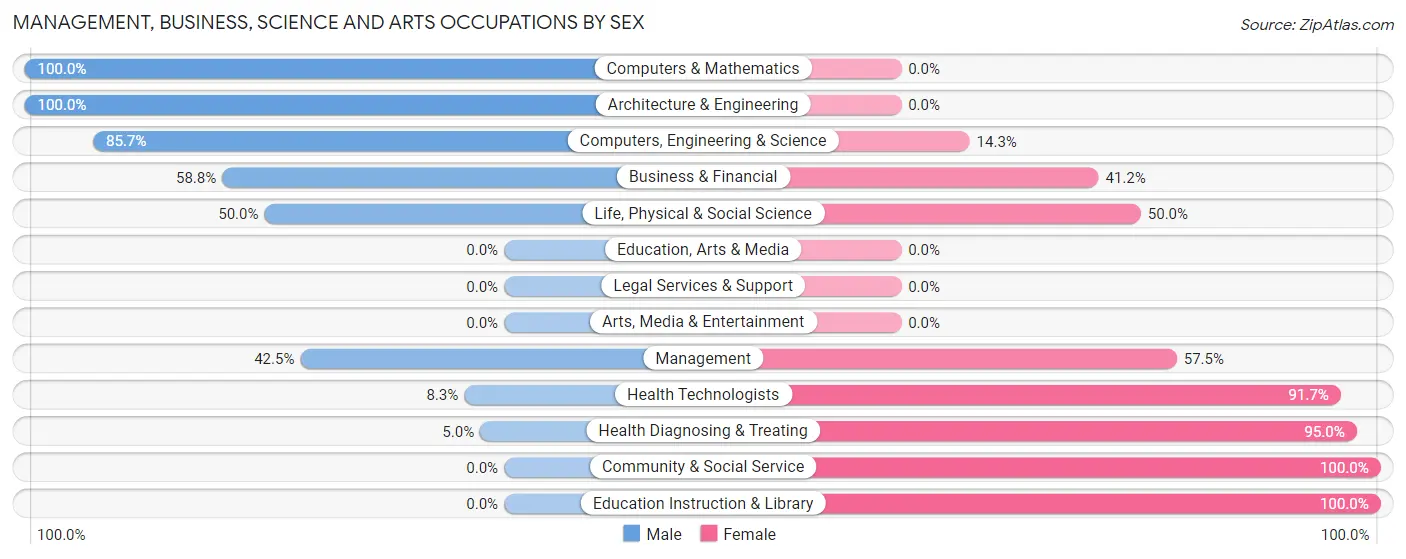
Management, Business, Science and Arts Occupations by Sex
Within the Management, Business, Science and Arts occupations in The Highlands, the most male-oriented occupations are Computers & Mathematics (100.0%), Architecture & Engineering (100.0%), and Computers, Engineering & Science (85.7%), while the most female-oriented occupations are Community & Social Service (100.0%), Education Instruction & Library (100.0%), and Health Diagnosing & Treating (95.0%).
| Occupation | Male | Female |
| Management | 17 (42.5%) | 23 (57.5%) |
| Business & Financial | 10 (58.8%) | 7 (41.2%) |
| Computers, Engineering & Science | 6 (85.7%) | 1 (14.3%) |
| Computers & Mathematics | 3 (100.0%) | 0 (0.0%) |
| Architecture & Engineering | 2 (100.0%) | 0 (0.0%) |
| Life, Physical & Social Science | 1 (50.0%) | 1 (50.0%) |
| Community & Social Service | 0 (0.0%) | 12 (100.0%) |
| Education, Arts & Media | 0 (0.0%) | 0 (0.0%) |
| Legal Services & Support | 0 (0.0%) | 0 (0.0%) |
| Education Instruction & Library | 0 (0.0%) | 12 (100.0%) |
| Arts, Media & Entertainment | 0 (0.0%) | 0 (0.0%) |
| Health Diagnosing & Treating | 1 (5.0%) | 19 (95.0%) |
| Health Technologists | 1 (8.3%) | 11 (91.7%) |
| Total (Category) | 34 (35.4%) | 62 (64.6%) |
| Total (Overall) | 101 (41.6%) | 142 (58.4%) |
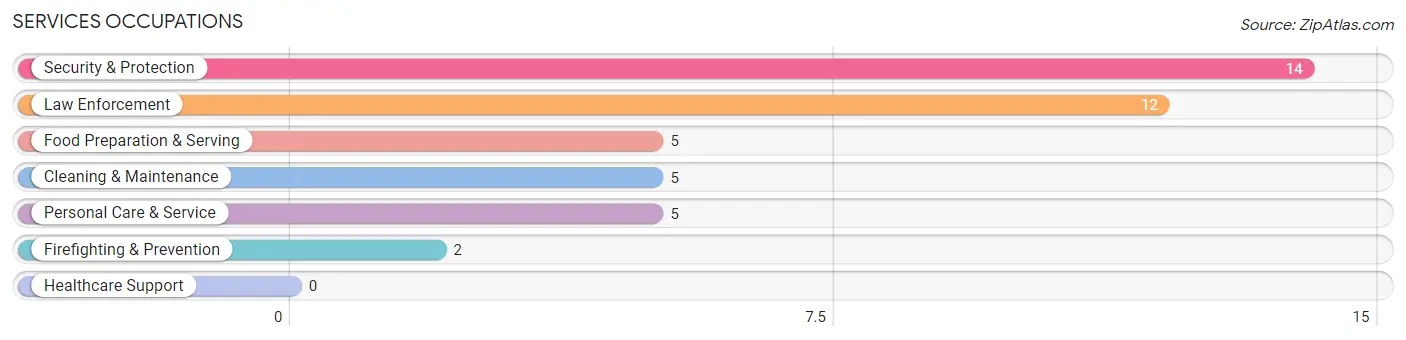
Services Occupations
The most common Services occupations in The Highlands are Security & Protection (14 | 5.8%), Law Enforcement (12 | 4.9%), Food Preparation & Serving (5 | 2.1%), Cleaning & Maintenance (5 | 2.1%), and Personal Care & Service (5 | 2.1%).
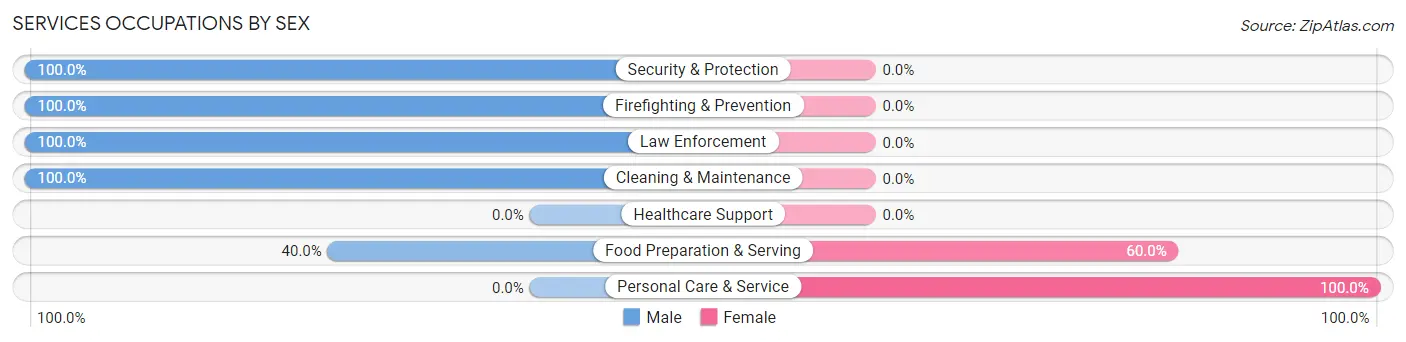
Services Occupations by Sex
Within the Services occupations in The Highlands, the most male-oriented occupations are Security & Protection (100.0%), Firefighting & Prevention (100.0%), and Law Enforcement (100.0%), while the most female-oriented occupations are Personal Care & Service (100.0%), and Food Preparation & Serving (60.0%).
| Occupation | Male | Female |
| Healthcare Support | 0 (0.0%) | 0 (0.0%) |
| Security & Protection | 14 (100.0%) | 0 (0.0%) |
| Firefighting & Prevention | 2 (100.0%) | 0 (0.0%) |
| Law Enforcement | 12 (100.0%) | 0 (0.0%) |
| Food Preparation & Serving | 2 (40.0%) | 3 (60.0%) |
| Cleaning & Maintenance | 5 (100.0%) | 0 (0.0%) |
| Personal Care & Service | 0 (0.0%) | 5 (100.0%) |
| Total (Category) | 21 (72.4%) | 8 (27.6%) |
| Total (Overall) | 101 (41.6%) | 142 (58.4%) |
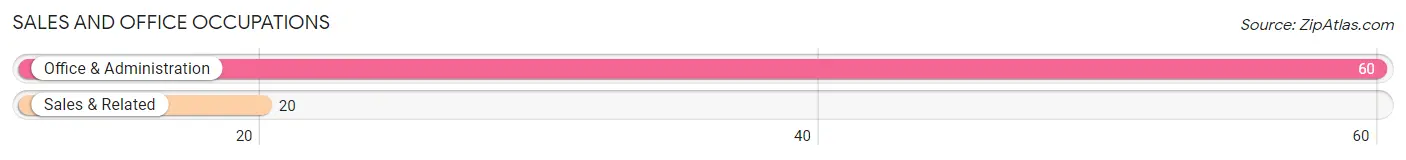
Sales and Office Occupations
The most common Sales and Office occupations in The Highlands are Office & Administration (60 | 24.7%), and Sales & Related (20 | 8.2%).
Sales and Office Occupations by Sex
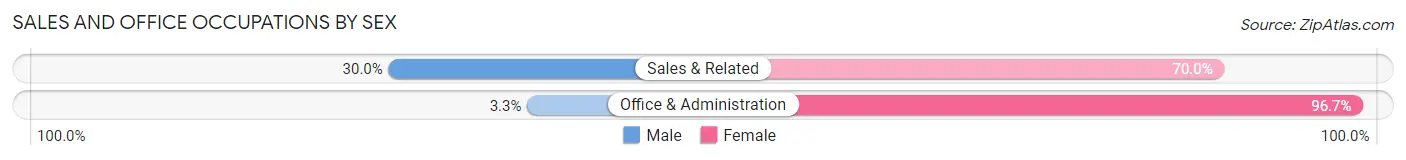
| Occupation | Male | Female |
| Sales & Related | 6 (30.0%) | 14 (70.0%) |
| Office & Administration | 2 (3.3%) | 58 (96.7%) |
| Total (Category) | 8 (10.0%) | 72 (90.0%) |
| Total (Overall) | 101 (41.6%) | 142 (58.4%) |
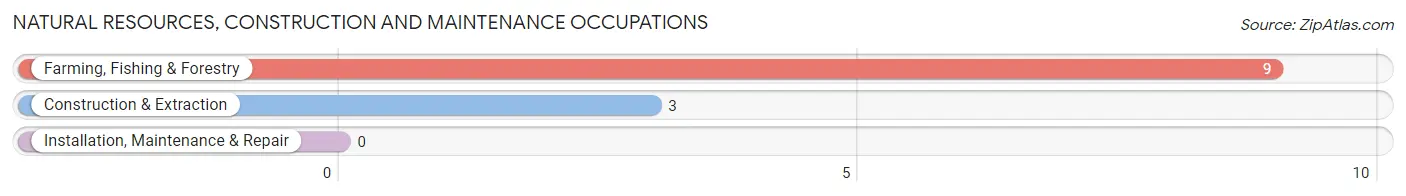
Natural Resources, Construction and Maintenance Occupations
The most common Natural Resources, Construction and Maintenance occupations in The Highlands are Farming, Fishing & Forestry (9 | 3.7%), and Construction & Extraction (3 | 1.2%).
Natural Resources, Construction and Maintenance Occupations by Sex
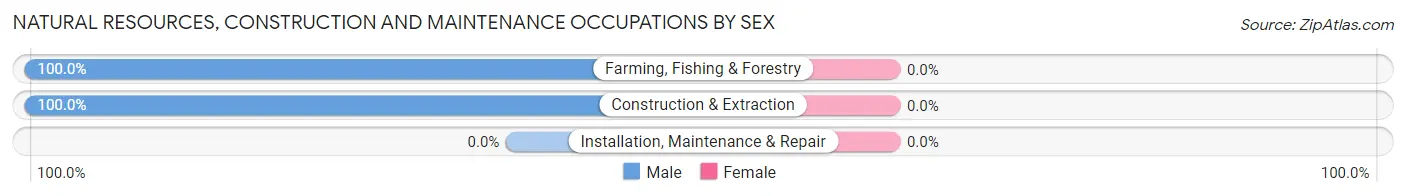
| Occupation | Male | Female |
| Farming, Fishing & Forestry | 9 (100.0%) | 0 (0.0%) |
| Construction & Extraction | 3 (100.0%) | 0 (0.0%) |
| Installation, Maintenance & Repair | 0 (0.0%) | 0 (0.0%) |
| Total (Category) | 12 (100.0%) | 0 (0.0%) |
| Total (Overall) | 101 (41.6%) | 142 (58.4%) |
Production, Transportation and Moving Occupations
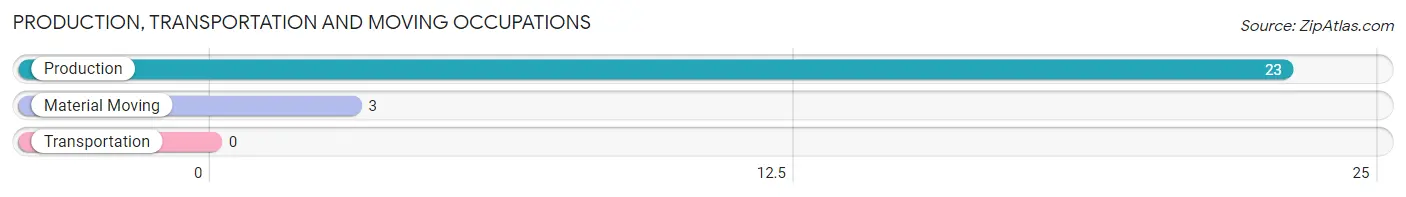
The most common Production, Transportation and Moving occupations in The Highlands are Production (23 | 9.5%), and Material Moving (3 | 1.2%).
Production, Transportation and Moving Occupations by Sex
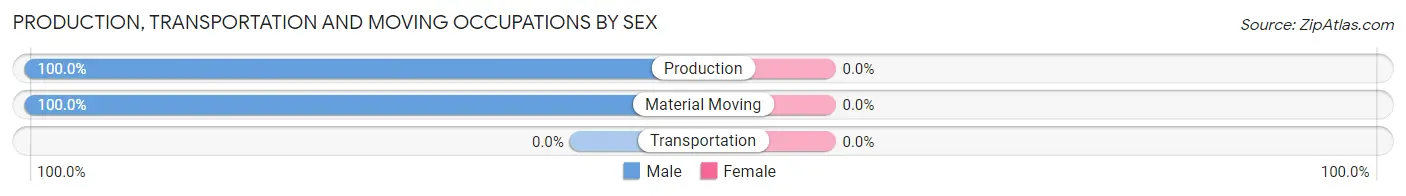
| Occupation | Male | Female |
| Production | 23 (100.0%) | 0 (0.0%) |
| Transportation | 0 (0.0%) | 0 (0.0%) |
| Material Moving | 3 (100.0%) | 0 (0.0%) |
| Total (Category) | 26 (100.0%) | 0 (0.0%) |
| Total (Overall) | 101 (41.6%) | 142 (58.4%) |
Employment Industries by Sex in The Highlands
Employment Industries in The Highlands
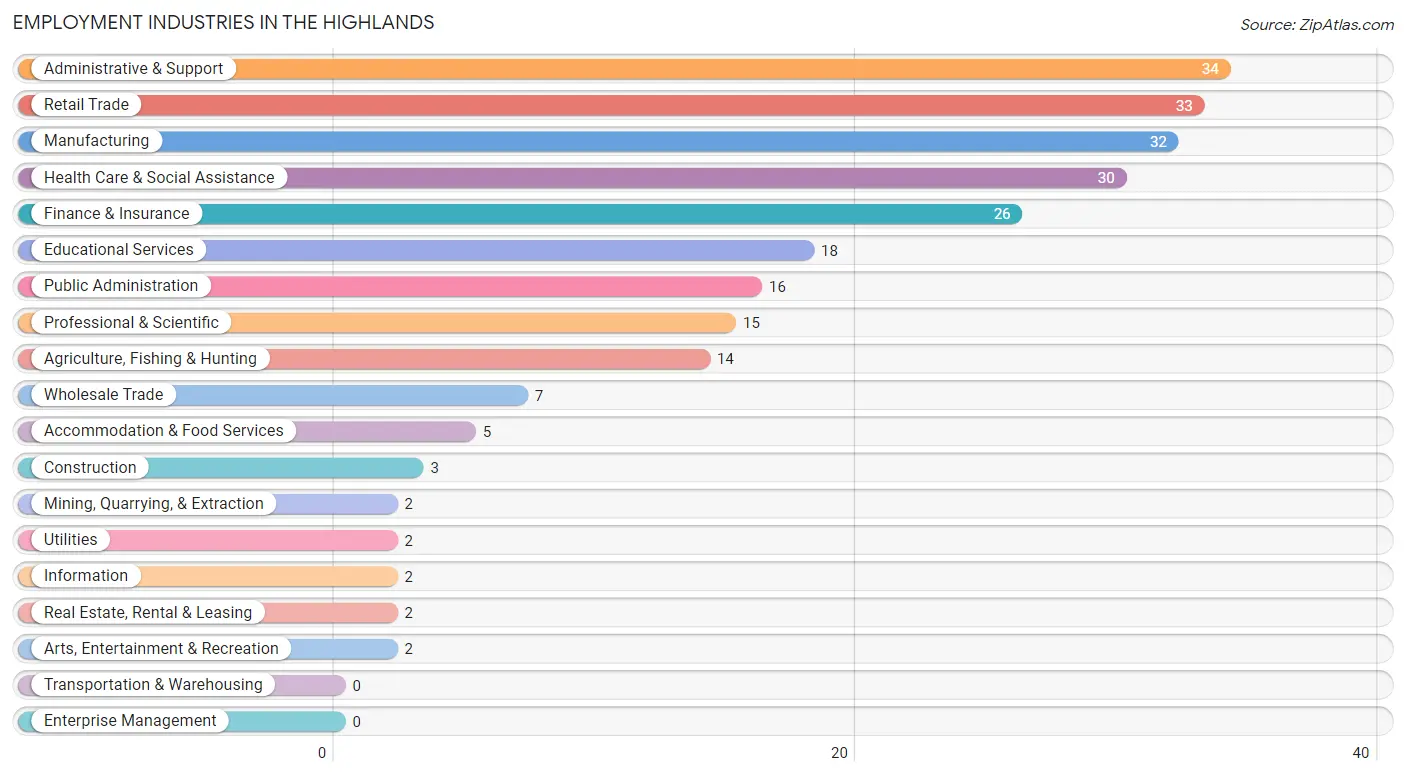
The major employment industries in The Highlands include Administrative & Support (34 | 14.0%), Retail Trade (33 | 13.6%), Manufacturing (32 | 13.2%), Health Care & Social Assistance (30 | 12.3%), and Finance & Insurance (26 | 10.7%).
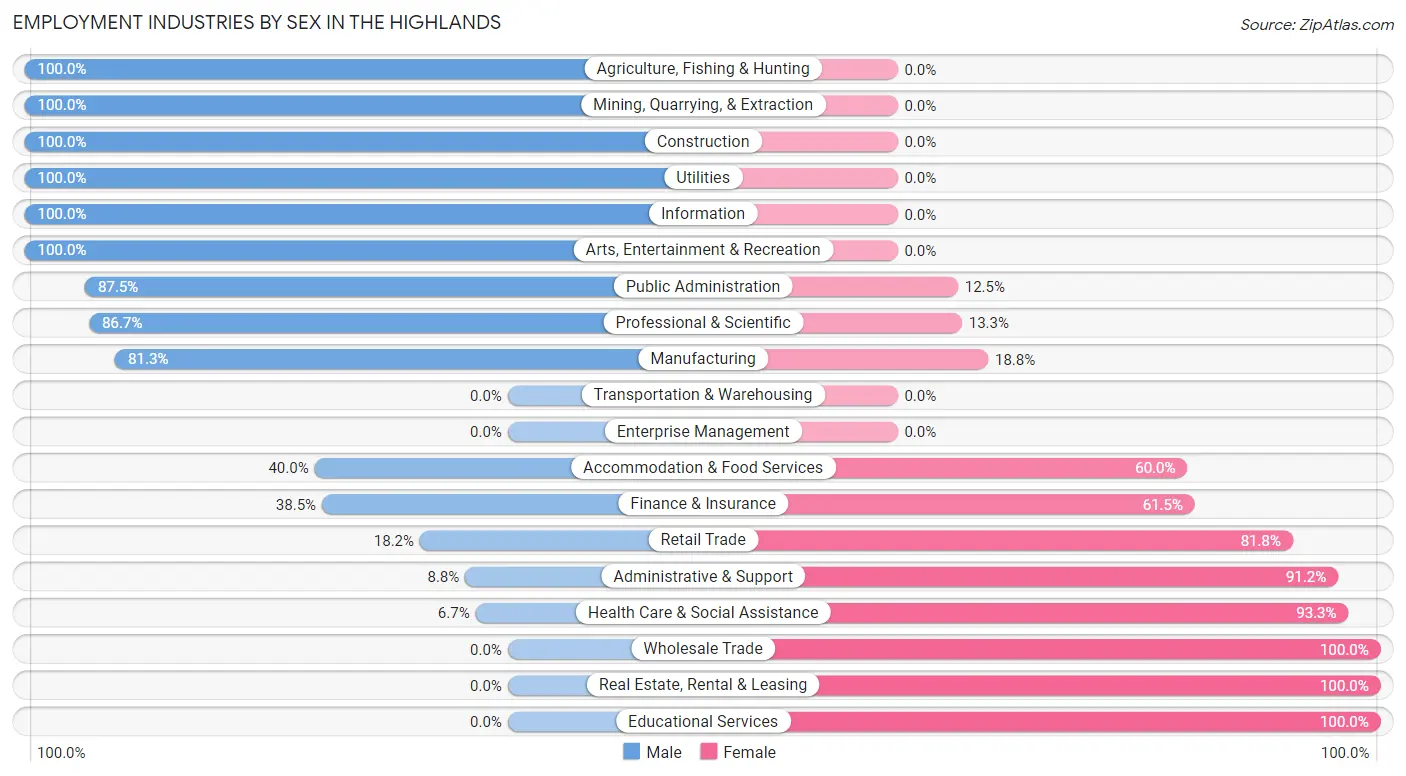
Employment Industries by Sex in The Highlands
The The Highlands industries that see more men than women are Agriculture, Fishing & Hunting (100.0%), Mining, Quarrying, & Extraction (100.0%), and Construction (100.0%), whereas the industries that tend to have a higher number of women are Wholesale Trade (100.0%), Real Estate, Rental & Leasing (100.0%), and Educational Services (100.0%).
| Industry | Male | Female |
| Agriculture, Fishing & Hunting | 14 (100.0%) | 0 (0.0%) |
| Mining, Quarrying, & Extraction | 2 (100.0%) | 0 (0.0%) |
| Construction | 3 (100.0%) | 0 (0.0%) |
| Manufacturing | 26 (81.2%) | 6 (18.8%) |
| Wholesale Trade | 0 (0.0%) | 7 (100.0%) |
| Retail Trade | 6 (18.2%) | 27 (81.8%) |
| Transportation & Warehousing | 0 (0.0%) | 0 (0.0%) |
| Utilities | 2 (100.0%) | 0 (0.0%) |
| Information | 2 (100.0%) | 0 (0.0%) |
| Finance & Insurance | 10 (38.5%) | 16 (61.5%) |
| Real Estate, Rental & Leasing | 0 (0.0%) | 2 (100.0%) |
| Professional & Scientific | 13 (86.7%) | 2 (13.3%) |
| Enterprise Management | 0 (0.0%) | 0 (0.0%) |
| Administrative & Support | 3 (8.8%) | 31 (91.2%) |
| Educational Services | 0 (0.0%) | 18 (100.0%) |
| Health Care & Social Assistance | 2 (6.7%) | 28 (93.3%) |
| Arts, Entertainment & Recreation | 2 (100.0%) | 0 (0.0%) |
| Accommodation & Food Services | 2 (40.0%) | 3 (60.0%) |
| Public Administration | 14 (87.5%) | 2 (12.5%) |
| Total | 101 (41.6%) | 142 (58.4%) |
Education in The Highlands
School Enrollment in The Highlands
The most common levels of schooling among the 72 students in The Highlands are middle school (20 | 27.8%), nursery / preschool (14 | 19.4%), and college / undergraduate (14 | 19.4%).
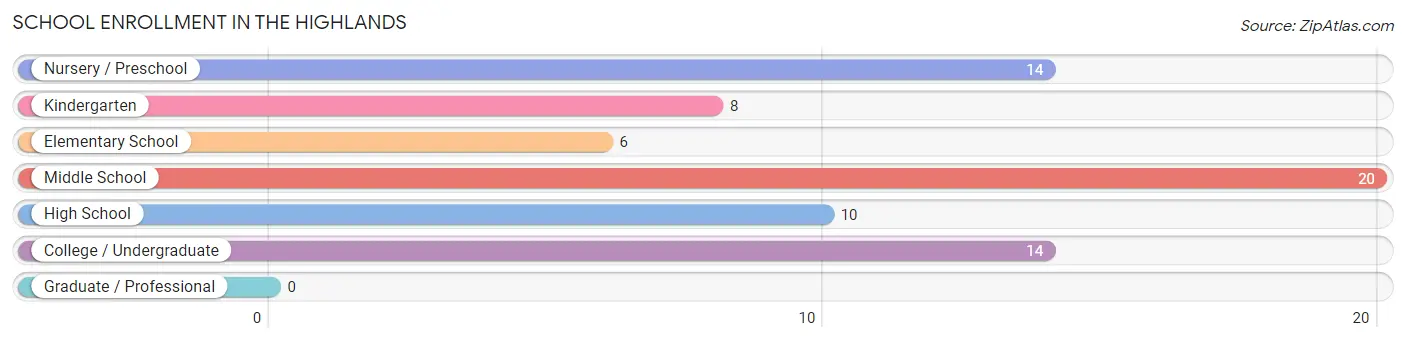
| School Level | # Students | % Students |
| Nursery / Preschool | 14 | 19.4% |
| Kindergarten | 8 | 11.1% |
| Elementary School | 6 | 8.3% |
| Middle School | 20 | 27.8% |
| High School | 10 | 13.9% |
| College / Undergraduate | 14 | 19.4% |
| Graduate / Professional | 0 | 0.0% |
| Total | 72 | 100.0% |
School Enrollment by Age by Funding Source in The Highlands
Out of a total of 72 students who are enrolled in schools in The Highlands, 14 (19.4%) attend a private institution, while the remaining 58 (80.6%) are enrolled in public schools. The age group of 3 to 4 year olds has the highest likelihood of being enrolled in private schools, with 3 (100.0% in the age bracket) enrolled. Conversely, the age group of 10 to 14 year olds has the lowest likelihood of being enrolled in a private school, with 24 (100.0% in the age bracket) attending a public institution.
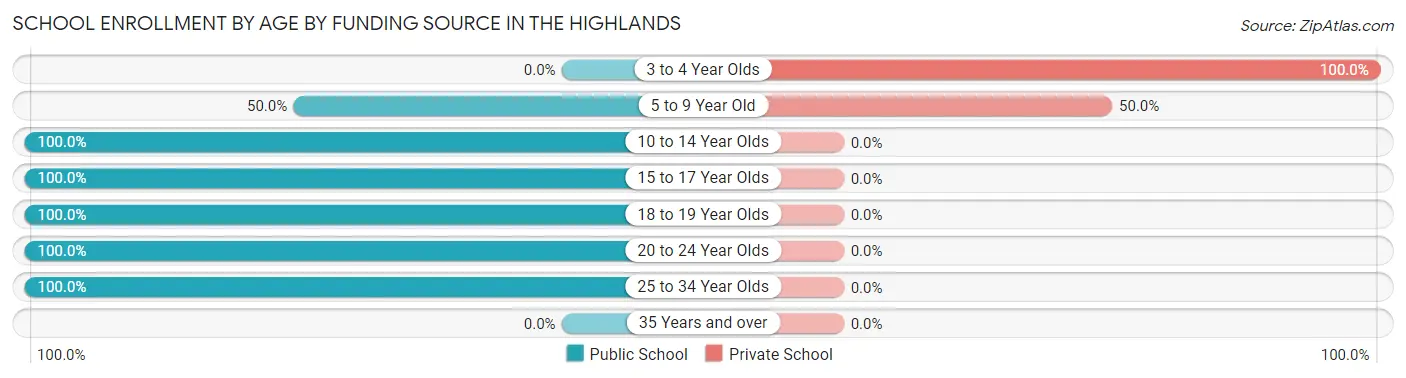
| Age Bracket | Public School | Private School |
| 3 to 4 Year Olds | 0 (0.0%) | 3 (100.0%) |
| 5 to 9 Year Old | 11 (50.0%) | 11 (50.0%) |
| 10 to 14 Year Olds | 24 (100.0%) | 0 (0.0%) |
| 15 to 17 Year Olds | 2 (100.0%) | 0 (0.0%) |
| 18 to 19 Year Olds | 3 (100.0%) | 0 (0.0%) |
| 20 to 24 Year Olds | 13 (100.0%) | 0 (0.0%) |
| 25 to 34 Year Olds | 5 (100.0%) | 0 (0.0%) |
| 35 Years and over | 0 (0.0%) | 0 (0.0%) |
| Total | 58 (80.6%) | 14 (19.4%) |
Educational Attainment by Field of Study in The Highlands
Business (40 | 27.2%), education (32 | 21.8%), science & technology (19 | 12.9%), visual & performing arts (17 | 11.6%), and psychology (11 | 7.5%) are the most common fields of study among 147 individuals in The Highlands who have obtained a bachelor's degree or higher.
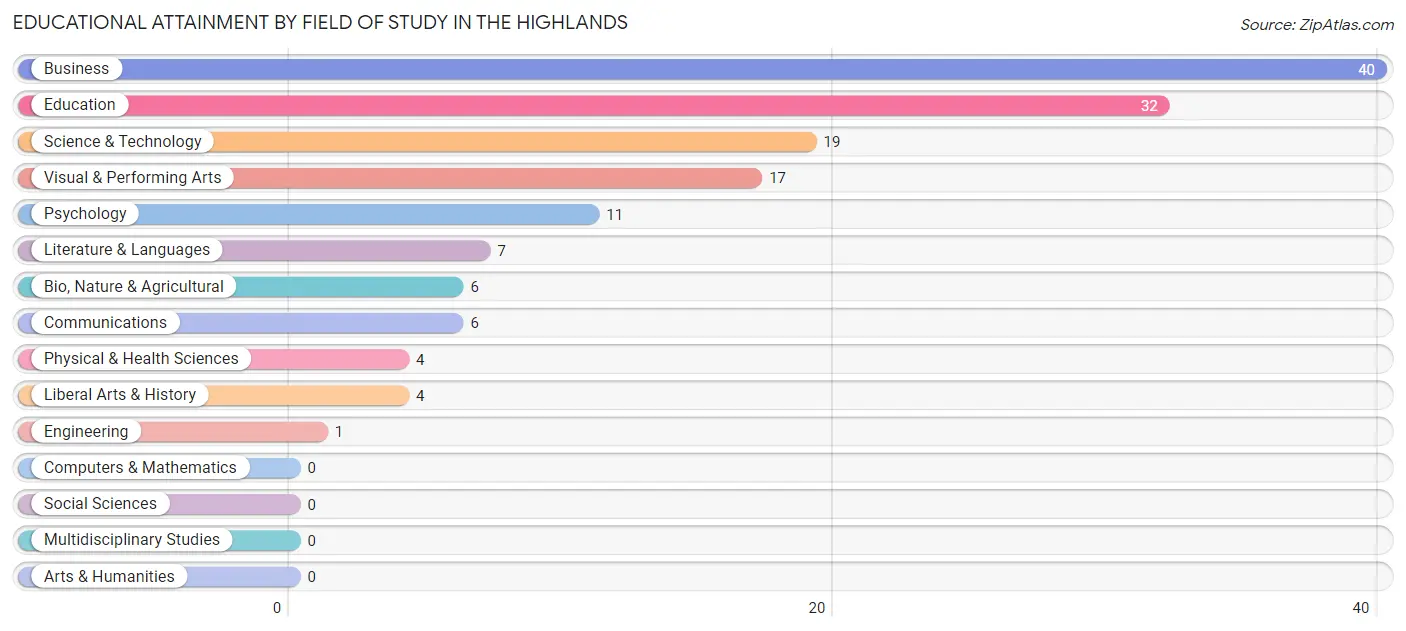
| Field of Study | # Graduates | % Graduates |
| Computers & Mathematics | 0 | 0.0% |
| Bio, Nature & Agricultural | 6 | 4.1% |
| Physical & Health Sciences | 4 | 2.7% |
| Psychology | 11 | 7.5% |
| Social Sciences | 0 | 0.0% |
| Engineering | 1 | 0.7% |
| Multidisciplinary Studies | 0 | 0.0% |
| Science & Technology | 19 | 12.9% |
| Business | 40 | 27.2% |
| Education | 32 | 21.8% |
| Literature & Languages | 7 | 4.8% |
| Liberal Arts & History | 4 | 2.7% |
| Visual & Performing Arts | 17 | 11.6% |
| Communications | 6 | 4.1% |
| Arts & Humanities | 0 | 0.0% |
| Total | 147 | 100.0% |
Transportation & Commute in The Highlands
Vehicle Availability by Sex in The Highlands
The most prevalent vehicle ownership categories in The Highlands are males with 2 vehicles (34, accounting for 34.0%) and females with 2 vehicles (41, making up 23.9%).
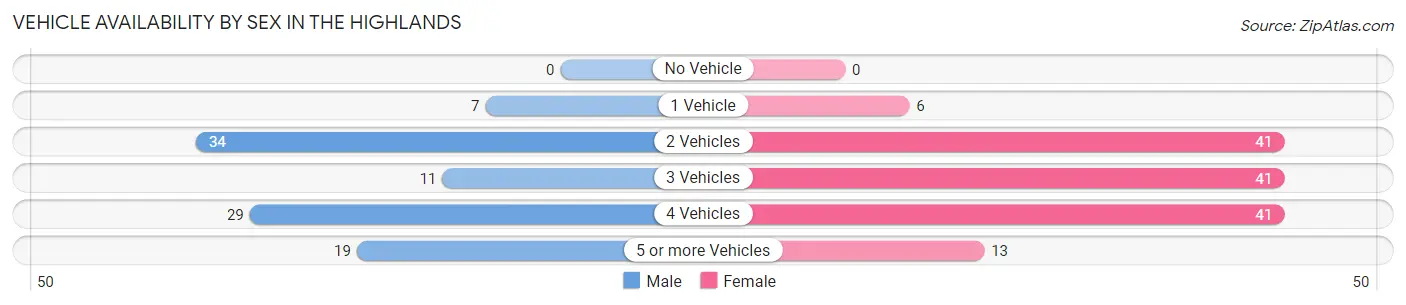
| Vehicles Available | Male | Female |
| No Vehicle | 0 (0.0%) | 0 (0.0%) |
| 1 Vehicle | 7 (7.0%) | 6 (4.2%) |
| 2 Vehicles | 34 (34.0%) | 41 (28.9%) |
| 3 Vehicles | 11 (11.0%) | 41 (28.9%) |
| 4 Vehicles | 29 (29.0%) | 41 (28.9%) |
| 5 or more Vehicles | 19 (19.0%) | 13 (9.1%) |
| Total | 100 (100.0%) | 142 (100.0%) |
Commute Time in The Highlands
The most frequently occuring commute durations in The Highlands are 15 to 19 minutes (111 commuters, 47.6%), 20 to 24 minutes (53 commuters, 22.8%), and 30 to 34 minutes (27 commuters, 11.6%).
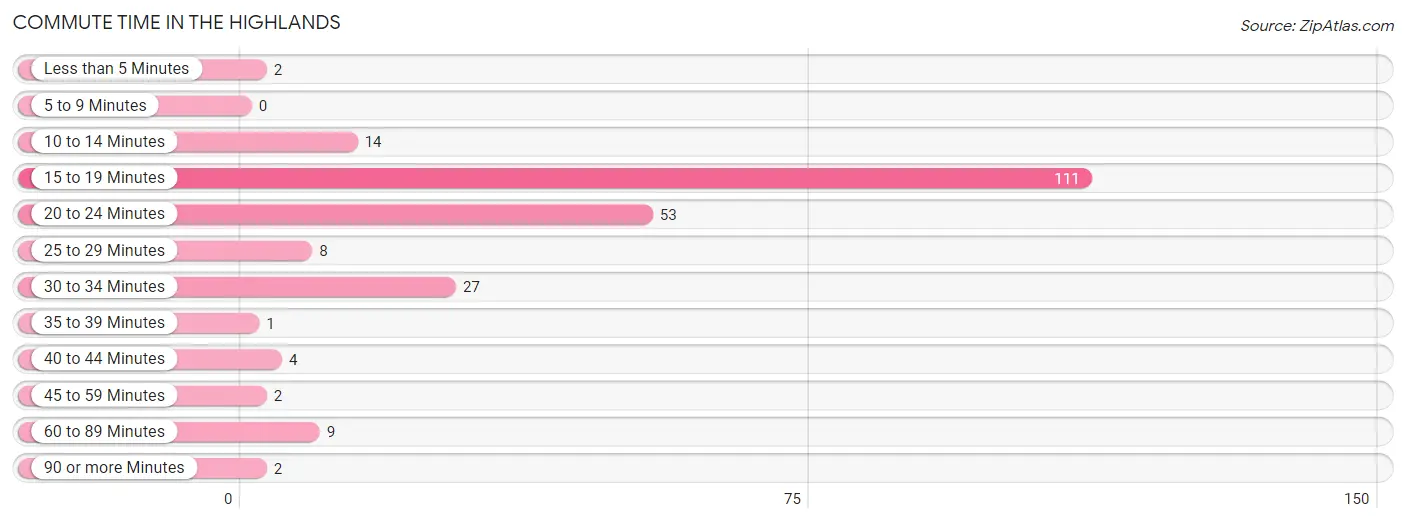
| Commute Time | # Commuters | % Commuters |
| Less than 5 Minutes | 2 | 0.9% |
| 5 to 9 Minutes | 0 | 0.0% |
| 10 to 14 Minutes | 14 | 6.0% |
| 15 to 19 Minutes | 111 | 47.6% |
| 20 to 24 Minutes | 53 | 22.8% |
| 25 to 29 Minutes | 8 | 3.4% |
| 30 to 34 Minutes | 27 | 11.6% |
| 35 to 39 Minutes | 1 | 0.4% |
| 40 to 44 Minutes | 4 | 1.7% |
| 45 to 59 Minutes | 2 | 0.9% |
| 60 to 89 Minutes | 9 | 3.9% |
| 90 or more Minutes | 2 | 0.9% |
Commute Time by Sex in The Highlands
The most common commute times in The Highlands are 15 to 19 minutes (46 commuters, 48.4%) for males and 15 to 19 minutes (65 commuters, 47.1%) for females.
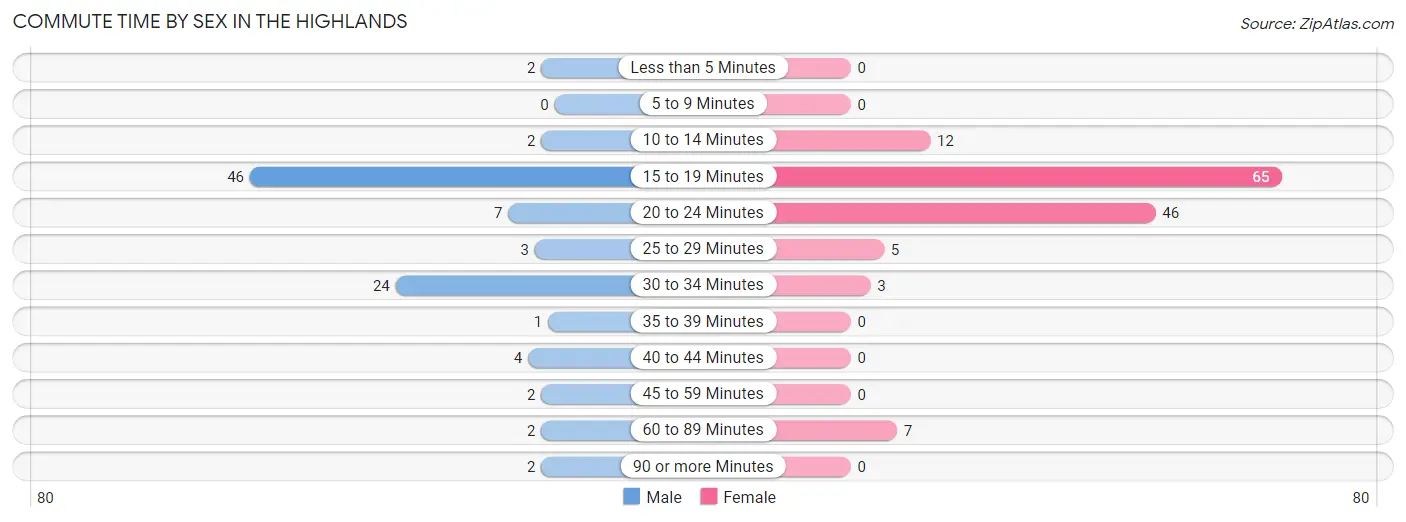
| Commute Time | Male | Female |
| Less than 5 Minutes | 2 (2.1%) | 0 (0.0%) |
| 5 to 9 Minutes | 0 (0.0%) | 0 (0.0%) |
| 10 to 14 Minutes | 2 (2.1%) | 12 (8.7%) |
| 15 to 19 Minutes | 46 (48.4%) | 65 (47.1%) |
| 20 to 24 Minutes | 7 (7.4%) | 46 (33.3%) |
| 25 to 29 Minutes | 3 (3.2%) | 5 (3.6%) |
| 30 to 34 Minutes | 24 (25.3%) | 3 (2.2%) |
| 35 to 39 Minutes | 1 (1.1%) | 0 (0.0%) |
| 40 to 44 Minutes | 4 (4.2%) | 0 (0.0%) |
| 45 to 59 Minutes | 2 (2.1%) | 0 (0.0%) |
| 60 to 89 Minutes | 2 (2.1%) | 7 (5.1%) |
| 90 or more Minutes | 2 (2.1%) | 0 (0.0%) |
Time of Departure to Work by Sex in The Highlands
The most frequent times of departure to work in The Highlands are 7:30 AM to 7:59 AM (25, 26.3%) for males and 7:30 AM to 7:59 AM (87, 63.0%) for females.
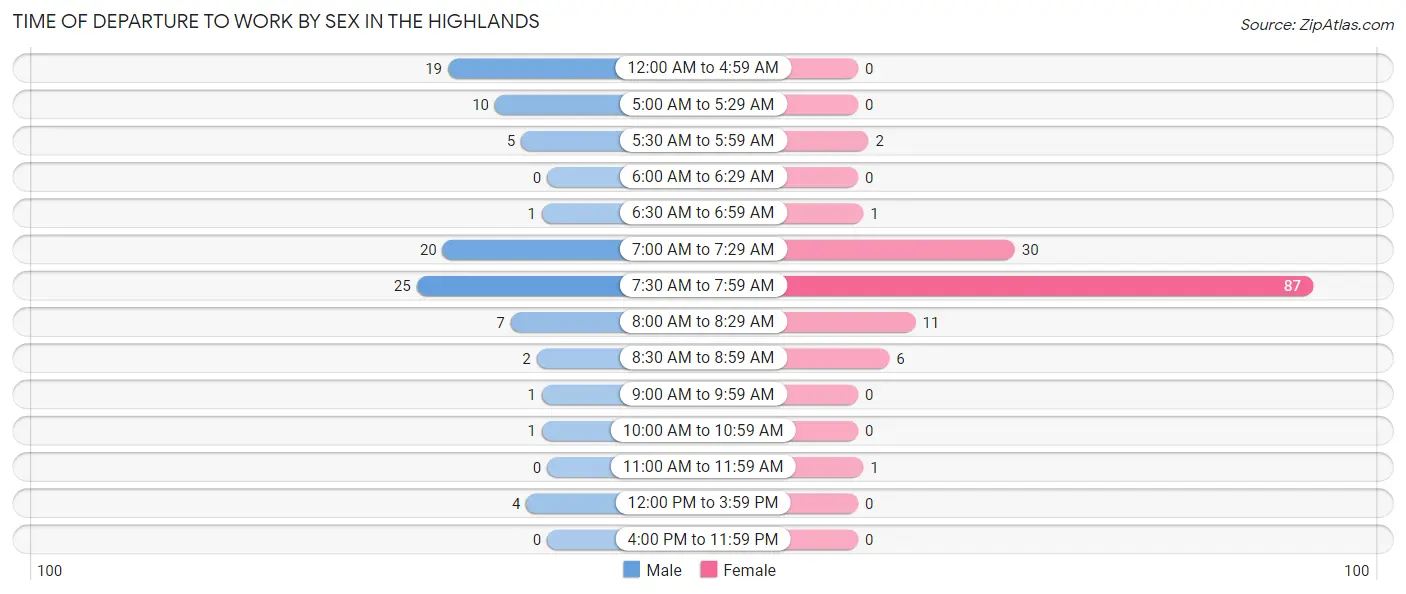
| Time of Departure | Male | Female |
| 12:00 AM to 4:59 AM | 19 (20.0%) | 0 (0.0%) |
| 5:00 AM to 5:29 AM | 10 (10.5%) | 0 (0.0%) |
| 5:30 AM to 5:59 AM | 5 (5.3%) | 2 (1.5%) |
| 6:00 AM to 6:29 AM | 0 (0.0%) | 0 (0.0%) |
| 6:30 AM to 6:59 AM | 1 (1.1%) | 1 (0.7%) |
| 7:00 AM to 7:29 AM | 20 (21.0%) | 30 (21.7%) |
| 7:30 AM to 7:59 AM | 25 (26.3%) | 87 (63.0%) |
| 8:00 AM to 8:29 AM | 7 (7.4%) | 11 (8.0%) |
| 8:30 AM to 8:59 AM | 2 (2.1%) | 6 (4.3%) |
| 9:00 AM to 9:59 AM | 1 (1.1%) | 0 (0.0%) |
| 10:00 AM to 10:59 AM | 1 (1.1%) | 0 (0.0%) |
| 11:00 AM to 11:59 AM | 0 (0.0%) | 1 (0.7%) |
| 12:00 PM to 3:59 PM | 4 (4.2%) | 0 (0.0%) |
| 4:00 PM to 11:59 PM | 0 (0.0%) | 0 (0.0%) |
| Total | 95 (100.0%) | 138 (100.0%) |
Housing Occupancy in The Highlands
Occupancy by Ownership in The Highlands
Of the total 227 dwellings in The Highlands, owner-occupied units account for 210 (92.5%), while renter-occupied units make up 17 (7.5%).
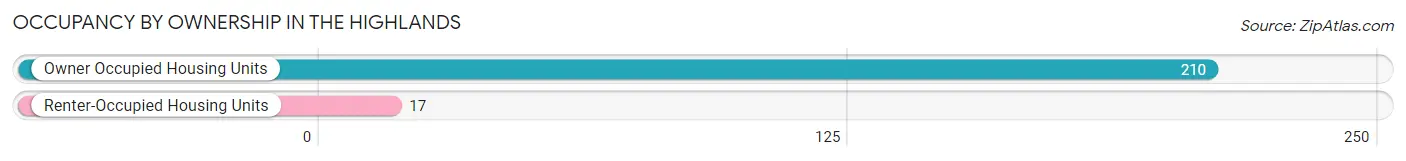
| Occupancy | # Housing Units | % Housing Units |
| Owner Occupied Housing Units | 210 | 92.5% |
| Renter-Occupied Housing Units | 17 | 7.5% |
| Total Occupied Housing Units | 227 | 100.0% |
Occupancy by Household Size in The Highlands
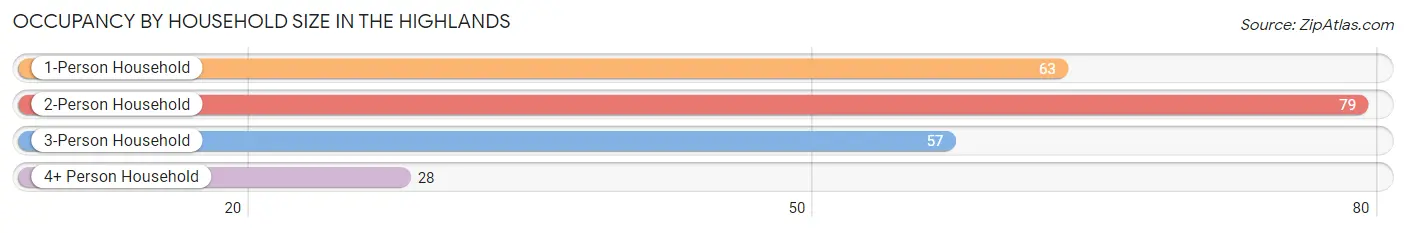
| Household Size | # Housing Units | % Housing Units |
| 1-Person Household | 63 | 27.8% |
| 2-Person Household | 79 | 34.8% |
| 3-Person Household | 57 | 25.1% |
| 4+ Person Household | 28 | 12.3% |
| Total Housing Units | 227 | 100.0% |
Occupancy by Ownership by Household Size in The Highlands
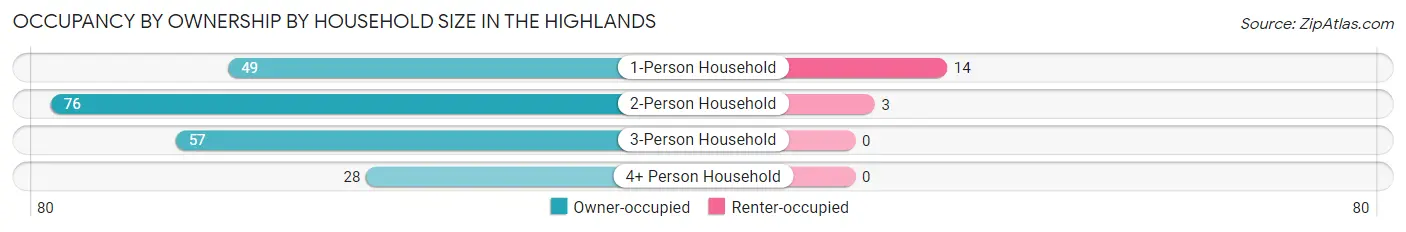
| Household Size | Owner-occupied | Renter-occupied |
| 1-Person Household | 49 (77.8%) | 14 (22.2%) |
| 2-Person Household | 76 (96.2%) | 3 (3.8%) |
| 3-Person Household | 57 (100.0%) | 0 (0.0%) |
| 4+ Person Household | 28 (100.0%) | 0 (0.0%) |
| Total Housing Units | 210 (92.5%) | 17 (7.5%) |
Occupancy by Educational Attainment in The Highlands
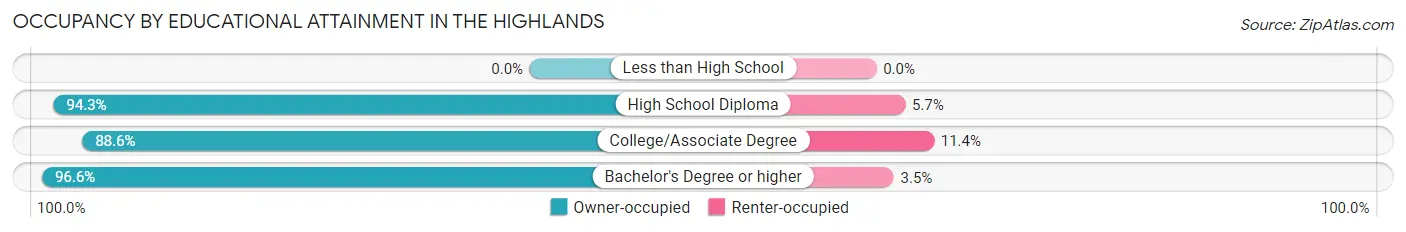
| Household Size | Owner-occupied | Renter-occupied |
| Less than High School | 0 (0.0%) | 0 (0.0%) |
| High School Diploma | 33 (94.3%) | 2 (5.7%) |
| College/Associate Degree | 93 (88.6%) | 12 (11.4%) |
| Bachelor's Degree or higher | 84 (96.6%) | 3 (3.5%) |
Occupancy by Age of Householder in The Highlands
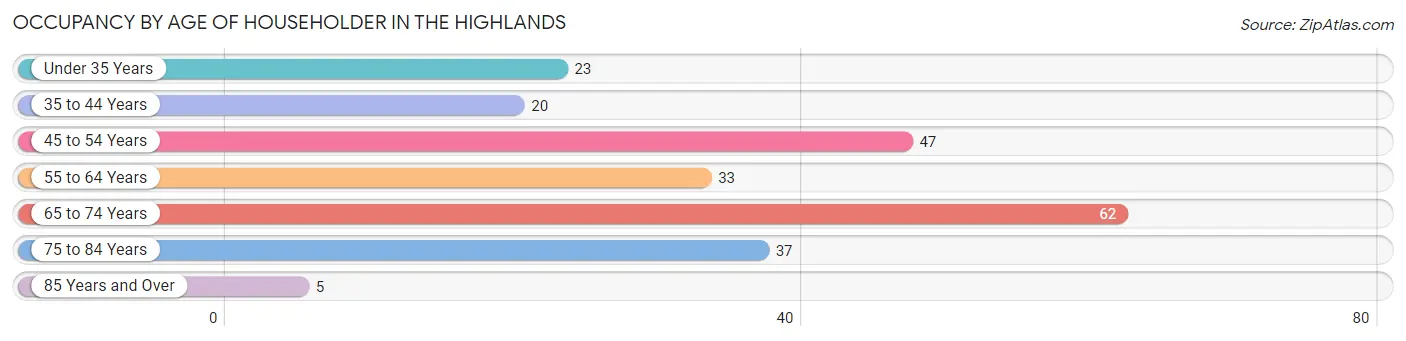
| Age Bracket | # Households | % Households |
| Under 35 Years | 23 | 10.1% |
| 35 to 44 Years | 20 | 8.8% |
| 45 to 54 Years | 47 | 20.7% |
| 55 to 64 Years | 33 | 14.5% |
| 65 to 74 Years | 62 | 27.3% |
| 75 to 84 Years | 37 | 16.3% |
| 85 Years and Over | 5 | 2.2% |
| Total | 227 | 100.0% |
Housing Finances in The Highlands
Median Income by Occupancy in The Highlands
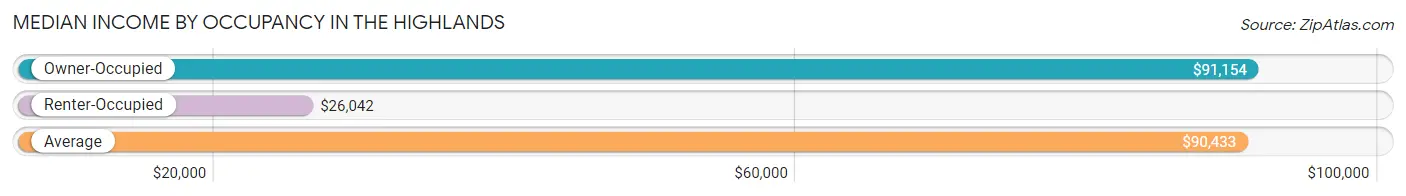
| Occupancy Type | # Households | Median Income |
| Owner-Occupied | 210 (92.5%) | $91,154 |
| Renter-Occupied | 17 (7.5%) | $26,042 |
| Average | 227 (100.0%) | $90,433 |
Occupancy by Householder Income Bracket in The Highlands
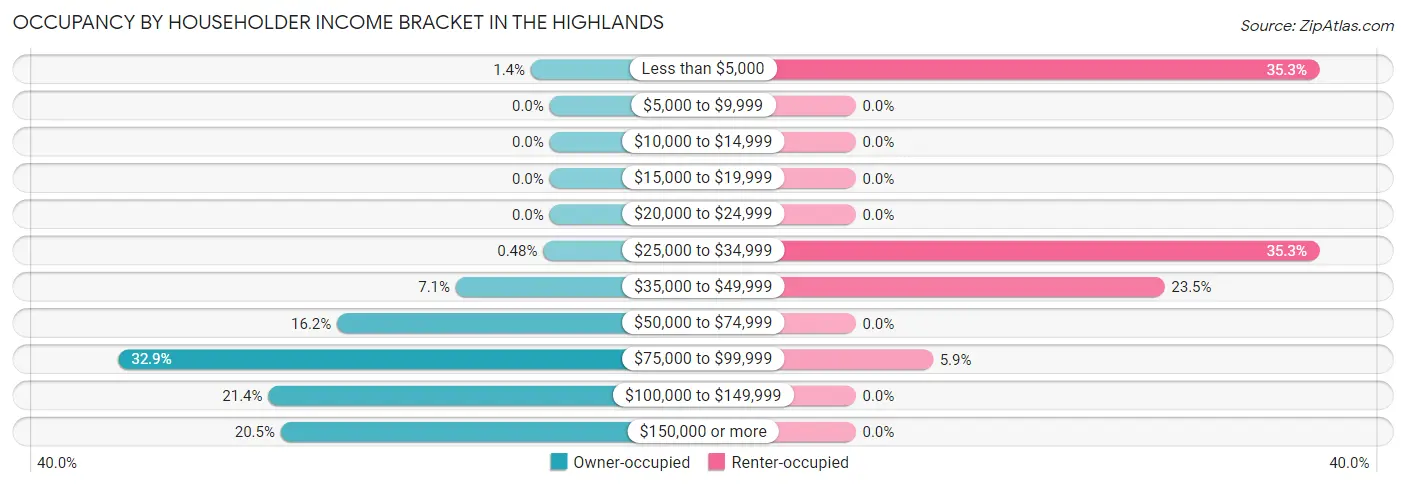
| Income Bracket | Owner-occupied | Renter-occupied |
| Less than $5,000 | 3 (1.4%) | 6 (35.3%) |
| $5,000 to $9,999 | 0 (0.0%) | 0 (0.0%) |
| $10,000 to $14,999 | 0 (0.0%) | 0 (0.0%) |
| $15,000 to $19,999 | 0 (0.0%) | 0 (0.0%) |
| $20,000 to $24,999 | 0 (0.0%) | 0 (0.0%) |
| $25,000 to $34,999 | 1 (0.5%) | 6 (35.3%) |
| $35,000 to $49,999 | 15 (7.1%) | 4 (23.5%) |
| $50,000 to $74,999 | 34 (16.2%) | 0 (0.0%) |
| $75,000 to $99,999 | 69 (32.9%) | 1 (5.9%) |
| $100,000 to $149,999 | 45 (21.4%) | 0 (0.0%) |
| $150,000 or more | 43 (20.5%) | 0 (0.0%) |
| Total | 210 (100.0%) | 17 (100.0%) |
Monthly Housing Cost Tiers in The Highlands
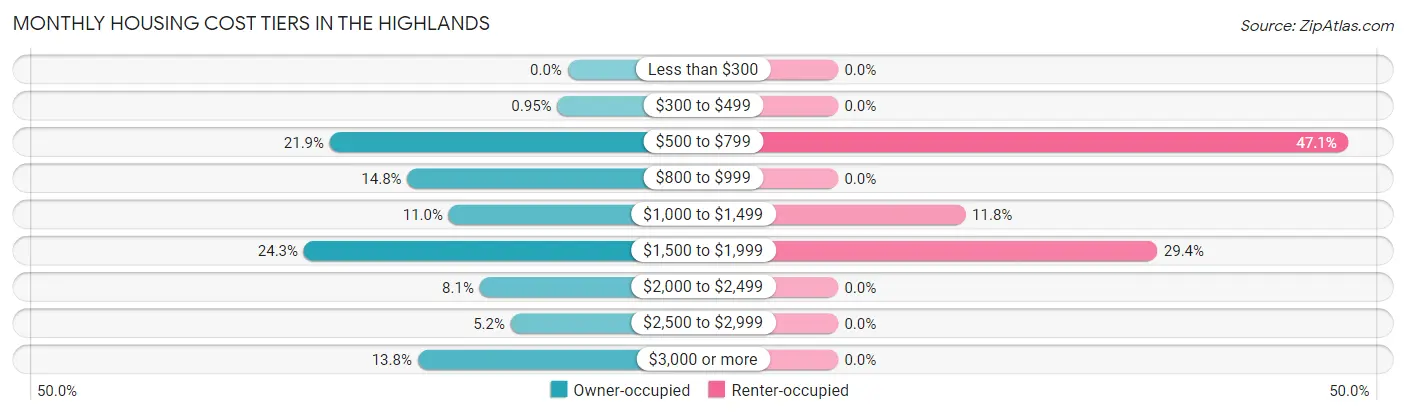
| Monthly Cost | Owner-occupied | Renter-occupied |
| Less than $300 | 0 (0.0%) | 0 (0.0%) |
| $300 to $499 | 2 (0.9%) | 0 (0.0%) |
| $500 to $799 | 46 (21.9%) | 8 (47.1%) |
| $800 to $999 | 31 (14.8%) | 0 (0.0%) |
| $1,000 to $1,499 | 23 (11.0%) | 2 (11.8%) |
| $1,500 to $1,999 | 51 (24.3%) | 5 (29.4%) |
| $2,000 to $2,499 | 17 (8.1%) | 0 (0.0%) |
| $2,500 to $2,999 | 11 (5.2%) | 0 (0.0%) |
| $3,000 or more | 29 (13.8%) | 0 (0.0%) |
| Total | 210 (100.0%) | 17 (100.0%) |
Physical Housing Characteristics in The Highlands
Housing Structures in The Highlands
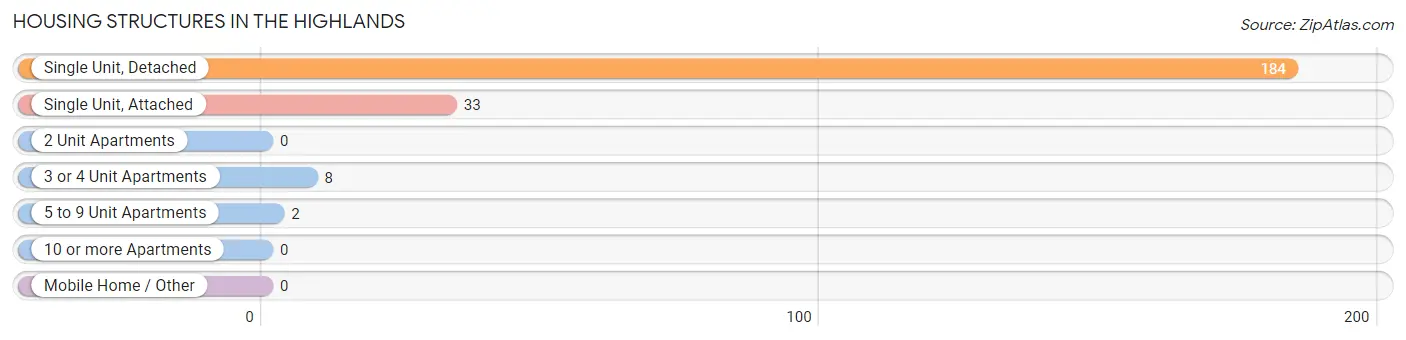
| Structure Type | # Housing Units | % Housing Units |
| Single Unit, Detached | 184 | 81.1% |
| Single Unit, Attached | 33 | 14.5% |
| 2 Unit Apartments | 0 | 0.0% |
| 3 or 4 Unit Apartments | 8 | 3.5% |
| 5 to 9 Unit Apartments | 2 | 0.9% |
| 10 or more Apartments | 0 | 0.0% |
| Mobile Home / Other | 0 | 0.0% |
| Total | 227 | 100.0% |
Housing Structures by Occupancy in The Highlands
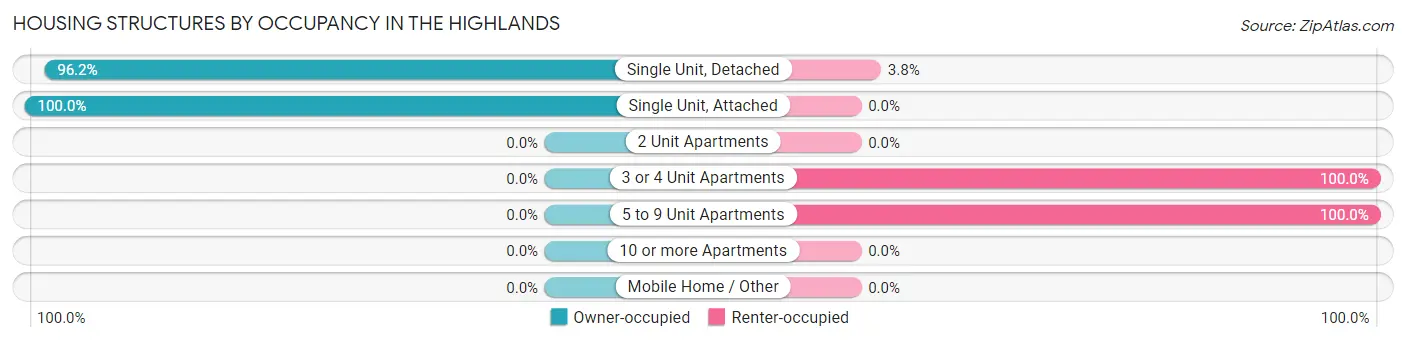
| Structure Type | Owner-occupied | Renter-occupied |
| Single Unit, Detached | 177 (96.2%) | 7 (3.8%) |
| Single Unit, Attached | 33 (100.0%) | 0 (0.0%) |
| 2 Unit Apartments | 0 (0.0%) | 0 (0.0%) |
| 3 or 4 Unit Apartments | 0 (0.0%) | 8 (100.0%) |
| 5 to 9 Unit Apartments | 0 (0.0%) | 2 (100.0%) |
| 10 or more Apartments | 0 (0.0%) | 0 (0.0%) |
| Mobile Home / Other | 0 (0.0%) | 0 (0.0%) |
| Total | 210 (92.5%) | 17 (7.5%) |
Housing Structures by Number of Rooms in The Highlands
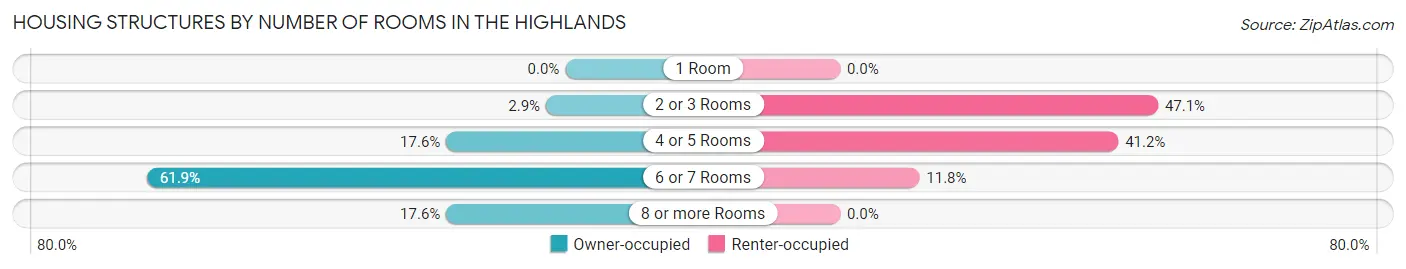
| Number of Rooms | Owner-occupied | Renter-occupied |
| 1 Room | 0 (0.0%) | 0 (0.0%) |
| 2 or 3 Rooms | 6 (2.9%) | 8 (47.1%) |
| 4 or 5 Rooms | 37 (17.6%) | 7 (41.2%) |
| 6 or 7 Rooms | 130 (61.9%) | 2 (11.8%) |
| 8 or more Rooms | 37 (17.6%) | 0 (0.0%) |
| Total | 210 (100.0%) | 17 (100.0%) |
Housing Structure by Heating Type in The Highlands
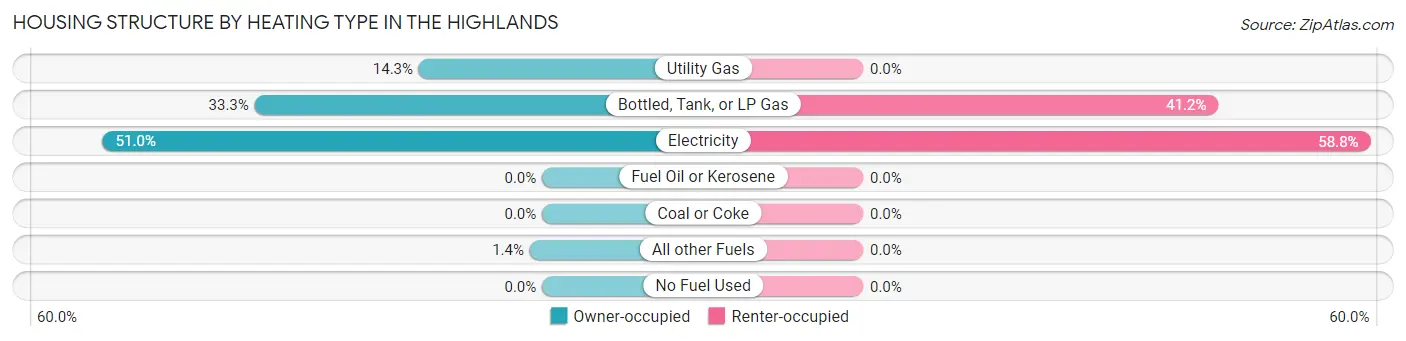
| Heating Type | Owner-occupied | Renter-occupied |
| Utility Gas | 30 (14.3%) | 0 (0.0%) |
| Bottled, Tank, or LP Gas | 70 (33.3%) | 7 (41.2%) |
| Electricity | 107 (50.9%) | 10 (58.8%) |
| Fuel Oil or Kerosene | 0 (0.0%) | 0 (0.0%) |
| Coal or Coke | 0 (0.0%) | 0 (0.0%) |
| All other Fuels | 3 (1.4%) | 0 (0.0%) |
| No Fuel Used | 0 (0.0%) | 0 (0.0%) |
| Total | 210 (100.0%) | 17 (100.0%) |
Household Vehicle Usage in The Highlands
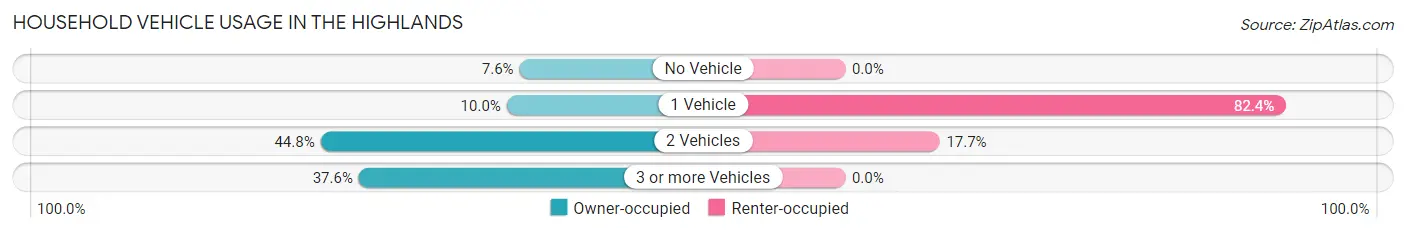
| Vehicles per Household | Owner-occupied | Renter-occupied |
| No Vehicle | 16 (7.6%) | 0 (0.0%) |
| 1 Vehicle | 21 (10.0%) | 14 (82.4%) |
| 2 Vehicles | 94 (44.8%) | 3 (17.6%) |
| 3 or more Vehicles | 79 (37.6%) | 0 (0.0%) |
| Total | 210 (100.0%) | 17 (100.0%) |
Real Estate & Mortgages in The Highlands
Real Estate and Mortgage Overview in The Highlands
| Characteristic | Without Mortgage | With Mortgage |
| Housing Units | 108 | 102 |
| Median Property Value | $264,900 | $236,100 |
| Median Household Income | $77,900 | $38 |
| Monthly Housing Costs | $832 | $29 |
| Real Estate Taxes | $3,545 | $0 |
Property Value by Mortgage Status in The Highlands
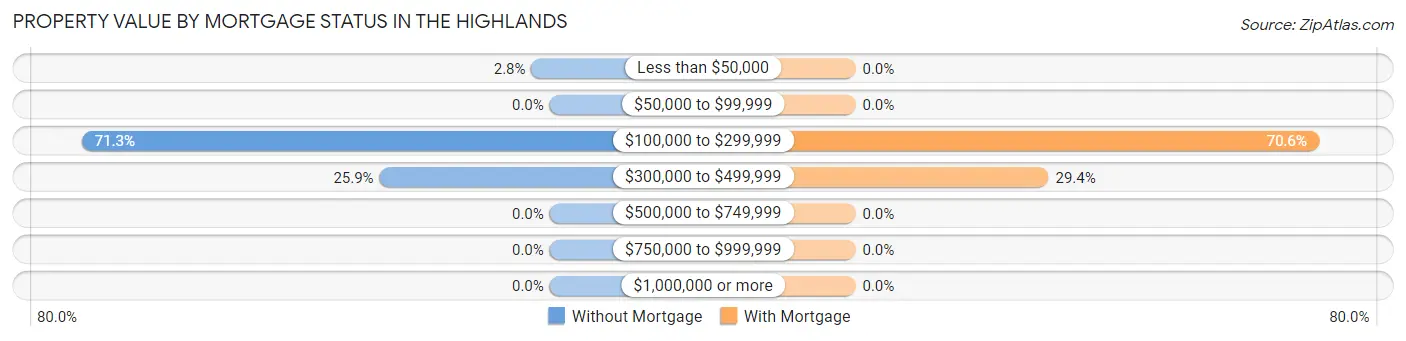
| Property Value | Without Mortgage | With Mortgage |
| Less than $50,000 | 3 (2.8%) | 0 (0.0%) |
| $50,000 to $99,999 | 0 (0.0%) | 0 (0.0%) |
| $100,000 to $299,999 | 77 (71.3%) | 72 (70.6%) |
| $300,000 to $499,999 | 28 (25.9%) | 30 (29.4%) |
| $500,000 to $749,999 | 0 (0.0%) | 0 (0.0%) |
| $750,000 to $999,999 | 0 (0.0%) | 0 (0.0%) |
| $1,000,000 or more | 0 (0.0%) | 0 (0.0%) |
| Total | 108 (100.0%) | 102 (100.0%) |
Household Income by Mortgage Status in The Highlands
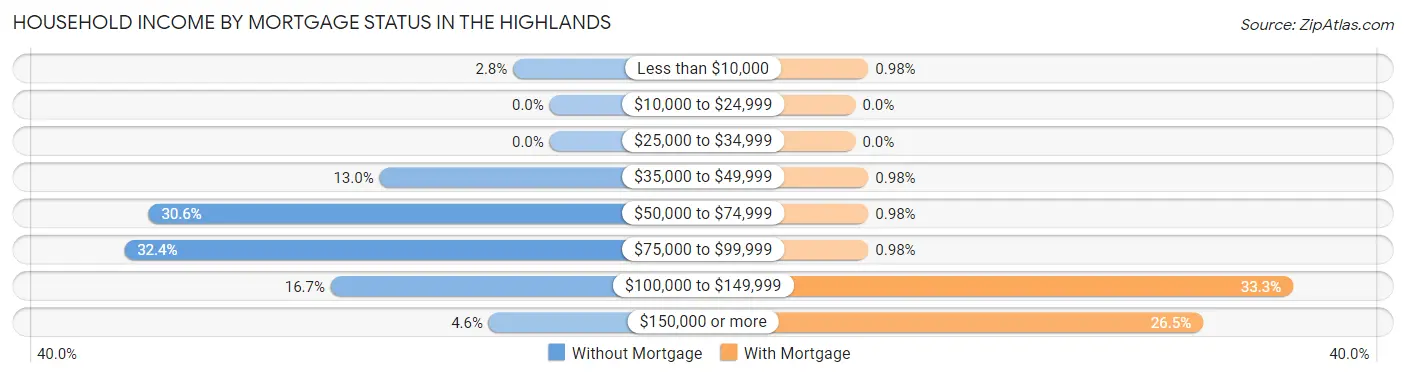
| Household Income | Without Mortgage | With Mortgage |
| Less than $10,000 | 3 (2.8%) | 1 (1.0%) |
| $10,000 to $24,999 | 0 (0.0%) | 0 (0.0%) |
| $25,000 to $34,999 | 0 (0.0%) | 0 (0.0%) |
| $35,000 to $49,999 | 14 (13.0%) | 1 (1.0%) |
| $50,000 to $74,999 | 33 (30.6%) | 1 (1.0%) |
| $75,000 to $99,999 | 35 (32.4%) | 1 (1.0%) |
| $100,000 to $149,999 | 18 (16.7%) | 34 (33.3%) |
| $150,000 or more | 5 (4.6%) | 27 (26.5%) |
| Total | 108 (100.0%) | 102 (100.0%) |
Property Value to Household Income Ratio in The Highlands
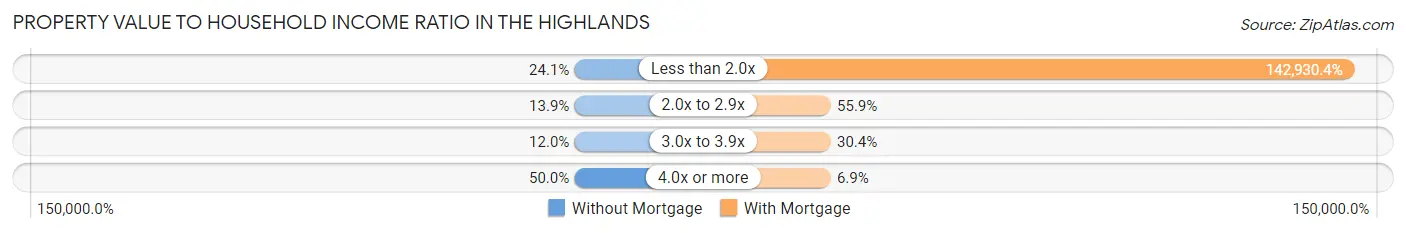
| Value-to-Income Ratio | Without Mortgage | With Mortgage |
| Less than 2.0x | 26 (24.1%) | 145,789 (142,930.4%) |
| 2.0x to 2.9x | 15 (13.9%) | 57 (55.9%) |
| 3.0x to 3.9x | 13 (12.0%) | 31 (30.4%) |
| 4.0x or more | 54 (50.0%) | 7 (6.9%) |
| Total | 108 (100.0%) | 102 (100.0%) |
Real Estate Taxes by Mortgage Status in The Highlands
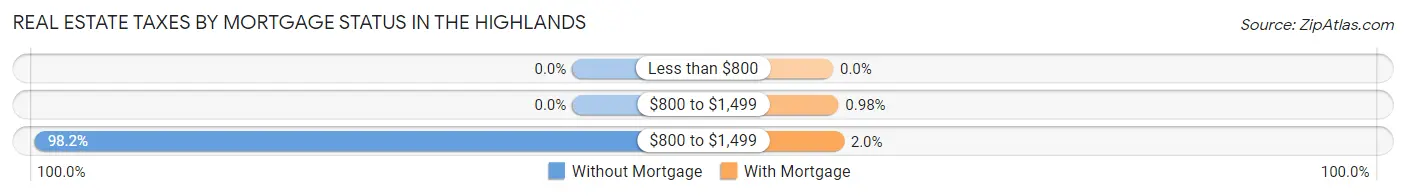
| Property Taxes | Without Mortgage | With Mortgage |
| Less than $800 | 0 (0.0%) | 0 (0.0%) |
| $800 to $1,499 | 0 (0.0%) | 1 (1.0%) |
| $800 to $1,499 | 106 (98.2%) | 2 (2.0%) |
| Total | 108 (100.0%) | 102 (100.0%) |
Health & Disability in The Highlands
Health Insurance Coverage by Age in The Highlands
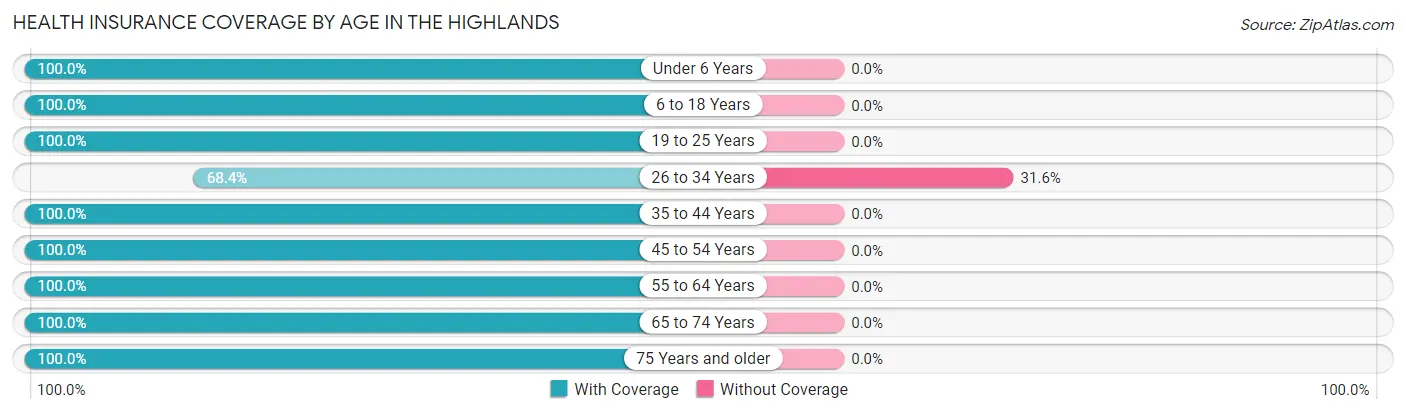
| Age Bracket | With Coverage | Without Coverage |
| Under 6 Years | 38 (100.0%) | 0 (0.0%) |
| 6 to 18 Years | 36 (100.0%) | 0 (0.0%) |
| 19 to 25 Years | 36 (100.0%) | 0 (0.0%) |
| 26 to 34 Years | 26 (68.4%) | 12 (31.6%) |
| 35 to 44 Years | 38 (100.0%) | 0 (0.0%) |
| 45 to 54 Years | 101 (100.0%) | 0 (0.0%) |
| 55 to 64 Years | 70 (100.0%) | 0 (0.0%) |
| 65 to 74 Years | 93 (100.0%) | 0 (0.0%) |
| 75 Years and older | 66 (100.0%) | 0 (0.0%) |
| Total | 504 (97.7%) | 12 (2.3%) |
Health Insurance Coverage by Citizenship Status in The Highlands
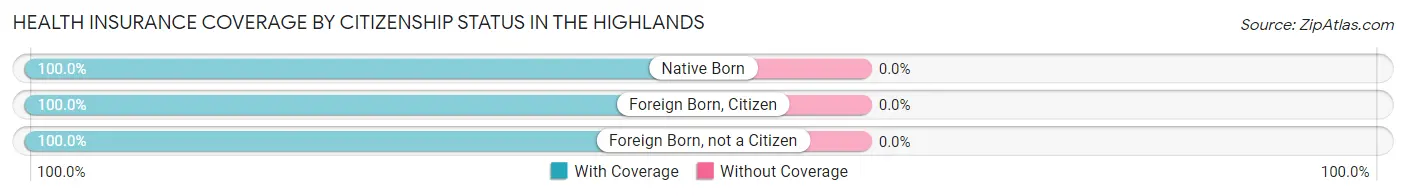
| Citizenship Status | With Coverage | Without Coverage |
| Native Born | 38 (100.0%) | 0 (0.0%) |
| Foreign Born, Citizen | 36 (100.0%) | 0 (0.0%) |
| Foreign Born, not a Citizen | 36 (100.0%) | 0 (0.0%) |
Health Insurance Coverage by Household Income in The Highlands
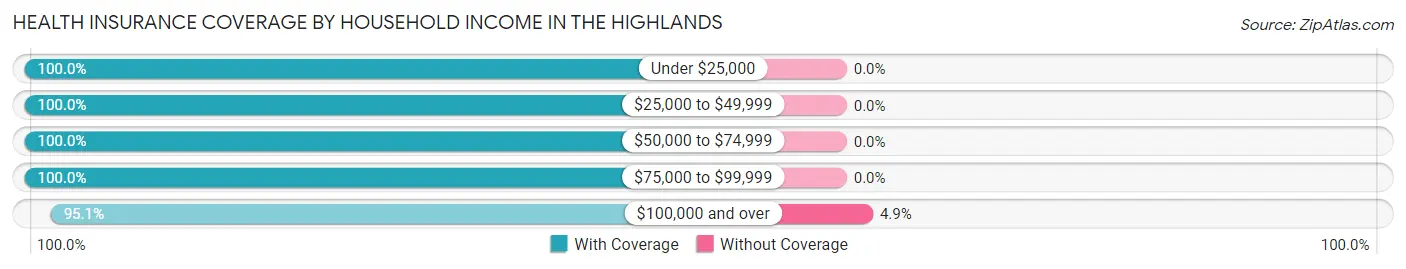
| Household Income | With Coverage | Without Coverage |
| Under $25,000 | 9 (100.0%) | 0 (0.0%) |
| $25,000 to $49,999 | 44 (100.0%) | 0 (0.0%) |
| $50,000 to $74,999 | 43 (100.0%) | 0 (0.0%) |
| $75,000 to $99,999 | 175 (100.0%) | 0 (0.0%) |
| $100,000 and over | 233 (95.1%) | 12 (4.9%) |
Public vs Private Health Insurance Coverage by Age in The Highlands
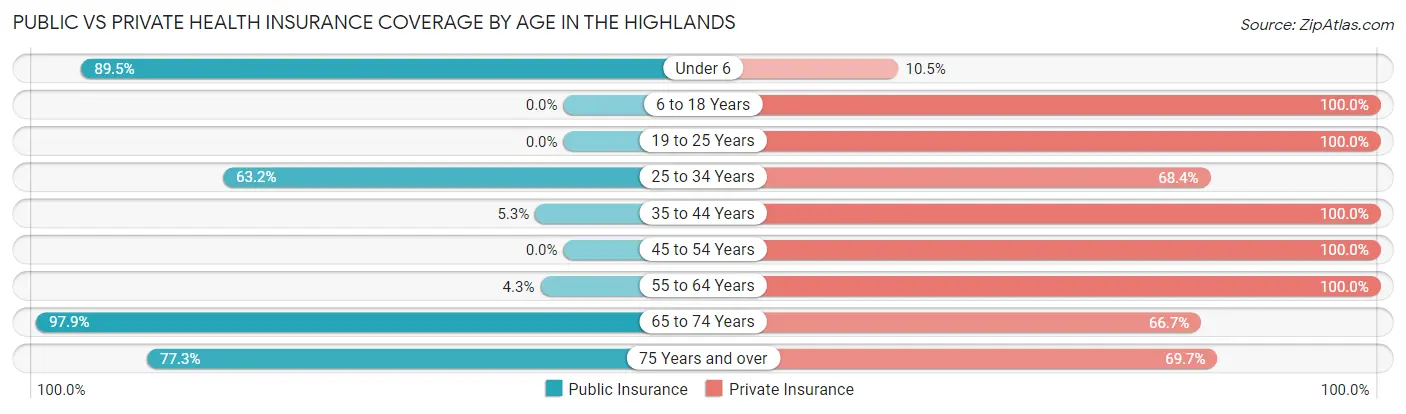
| Age Bracket | Public Insurance | Private Insurance |
| Under 6 | 34 (89.5%) | 4 (10.5%) |
| 6 to 18 Years | 0 (0.0%) | 36 (100.0%) |
| 19 to 25 Years | 0 (0.0%) | 36 (100.0%) |
| 25 to 34 Years | 24 (63.2%) | 26 (68.4%) |
| 35 to 44 Years | 2 (5.3%) | 38 (100.0%) |
| 45 to 54 Years | 0 (0.0%) | 101 (100.0%) |
| 55 to 64 Years | 3 (4.3%) | 70 (100.0%) |
| 65 to 74 Years | 91 (97.9%) | 62 (66.7%) |
| 75 Years and over | 51 (77.3%) | 46 (69.7%) |
| Total | 205 (39.7%) | 419 (81.2%) |
Disability Status by Sex by Age in The Highlands
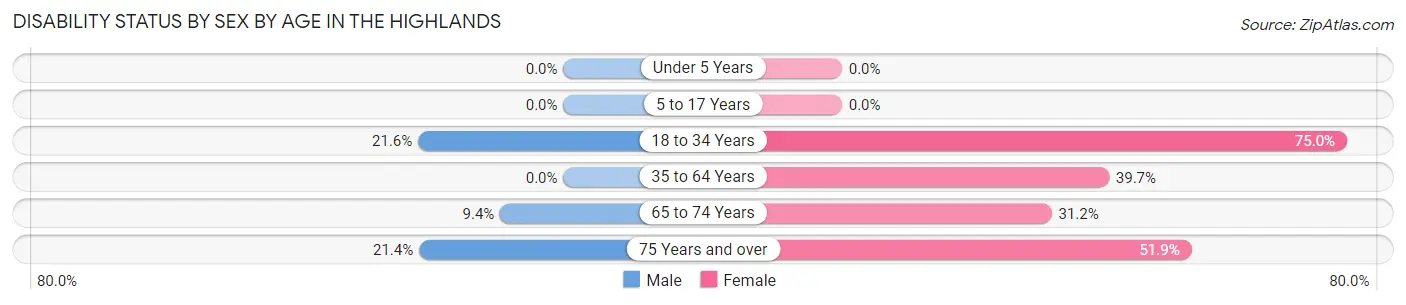
| Age Bracket | Male | Female |
| Under 5 Years | 0 (0.0%) | 0 (0.0%) |
| 5 to 17 Years | 0 (0.0%) | 0 (0.0%) |
| 18 to 34 Years | 11 (21.6%) | 21 (75.0%) |
| 35 to 64 Years | 0 (0.0%) | 46 (39.7%) |
| 65 to 74 Years | 3 (9.4%) | 19 (31.1%) |
| 75 Years and over | 3 (21.4%) | 27 (51.9%) |
Disability Class by Sex by Age in The Highlands
Disability Class: Hearing Difficulty
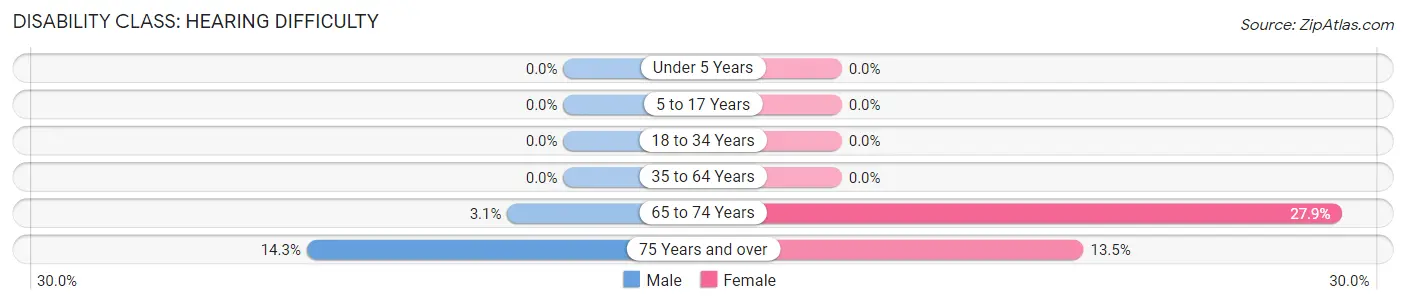
| Age Bracket | Male | Female |
| Under 5 Years | 0 (0.0%) | 0 (0.0%) |
| 5 to 17 Years | 0 (0.0%) | 0 (0.0%) |
| 18 to 34 Years | 0 (0.0%) | 0 (0.0%) |
| 35 to 64 Years | 0 (0.0%) | 0 (0.0%) |
| 65 to 74 Years | 1 (3.1%) | 17 (27.9%) |
| 75 Years and over | 2 (14.3%) | 7 (13.5%) |
Disability Class: Vision Difficulty
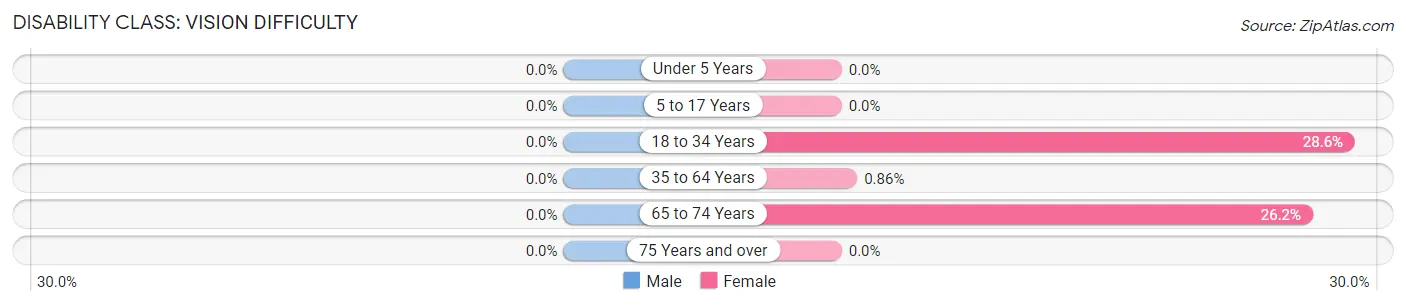
| Age Bracket | Male | Female |
| Under 5 Years | 0 (0.0%) | 0 (0.0%) |
| 5 to 17 Years | 0 (0.0%) | 0 (0.0%) |
| 18 to 34 Years | 0 (0.0%) | 8 (28.6%) |
| 35 to 64 Years | 0 (0.0%) | 1 (0.9%) |
| 65 to 74 Years | 0 (0.0%) | 16 (26.2%) |
| 75 Years and over | 0 (0.0%) | 0 (0.0%) |
Disability Class: Cognitive Difficulty
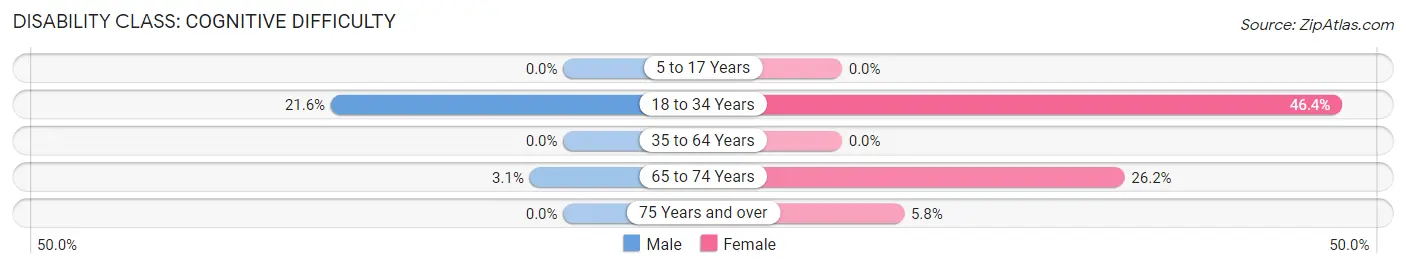
| Age Bracket | Male | Female |
| 5 to 17 Years | 0 (0.0%) | 0 (0.0%) |
| 18 to 34 Years | 11 (21.6%) | 13 (46.4%) |
| 35 to 64 Years | 0 (0.0%) | 0 (0.0%) |
| 65 to 74 Years | 1 (3.1%) | 16 (26.2%) |
| 75 Years and over | 0 (0.0%) | 3 (5.8%) |
Disability Class: Ambulatory Difficulty
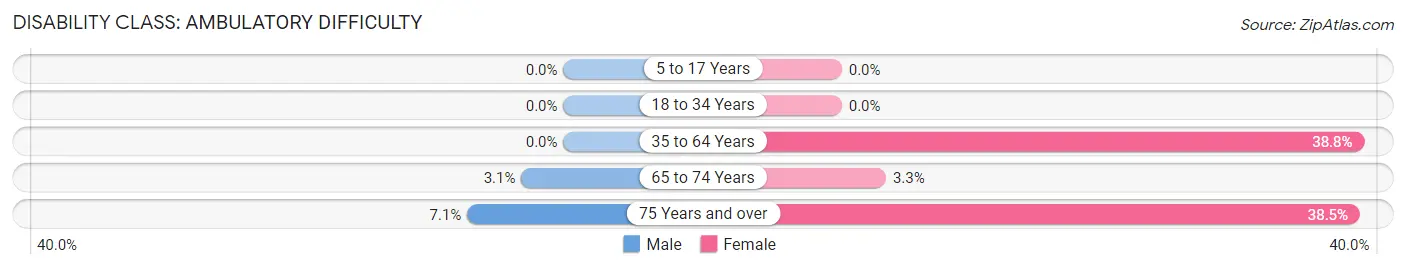
| Age Bracket | Male | Female |
| 5 to 17 Years | 0 (0.0%) | 0 (0.0%) |
| 18 to 34 Years | 0 (0.0%) | 0 (0.0%) |
| 35 to 64 Years | 0 (0.0%) | 45 (38.8%) |
| 65 to 74 Years | 1 (3.1%) | 2 (3.3%) |
| 75 Years and over | 1 (7.1%) | 20 (38.5%) |
Disability Class: Self-Care Difficulty
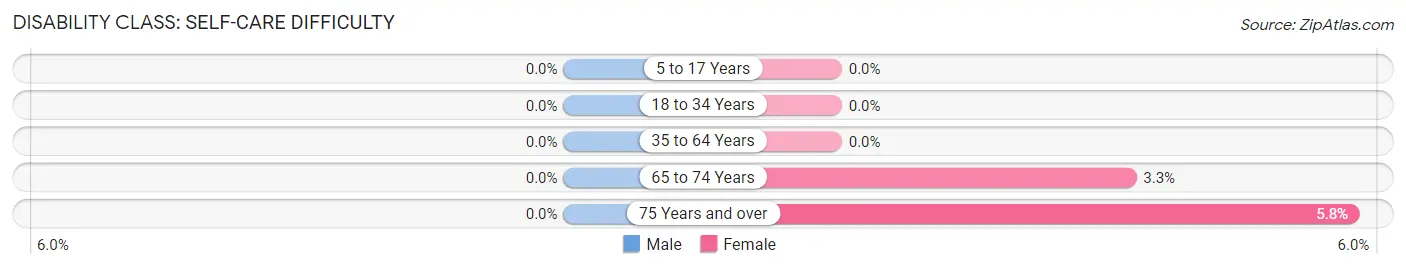
| Age Bracket | Male | Female |
| 5 to 17 Years | 0 (0.0%) | 0 (0.0%) |
| 18 to 34 Years | 0 (0.0%) | 0 (0.0%) |
| 35 to 64 Years | 0 (0.0%) | 0 (0.0%) |
| 65 to 74 Years | 0 (0.0%) | 2 (3.3%) |
| 75 Years and over | 0 (0.0%) | 3 (5.8%) |
Technology Access in The Highlands
Computing Device Access in The Highlands
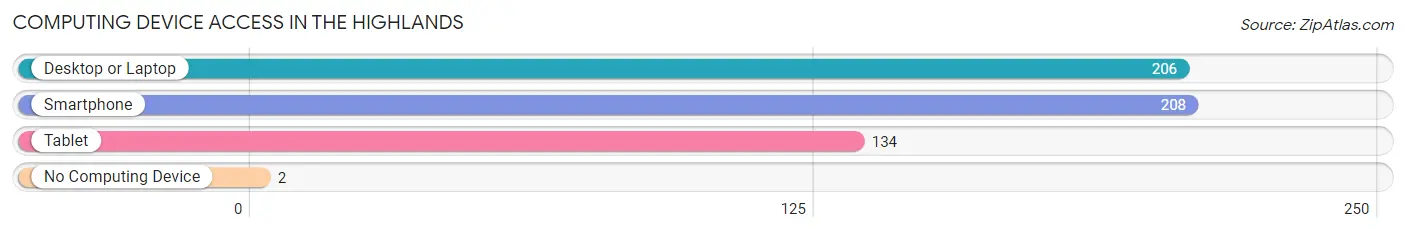
| Device Type | # Households | % Households |
| Desktop or Laptop | 206 | 90.7% |
| Smartphone | 208 | 91.6% |
| Tablet | 134 | 59.0% |
| No Computing Device | 2 | 0.9% |
| Total | 227 | 100.0% |
Internet Access in The Highlands
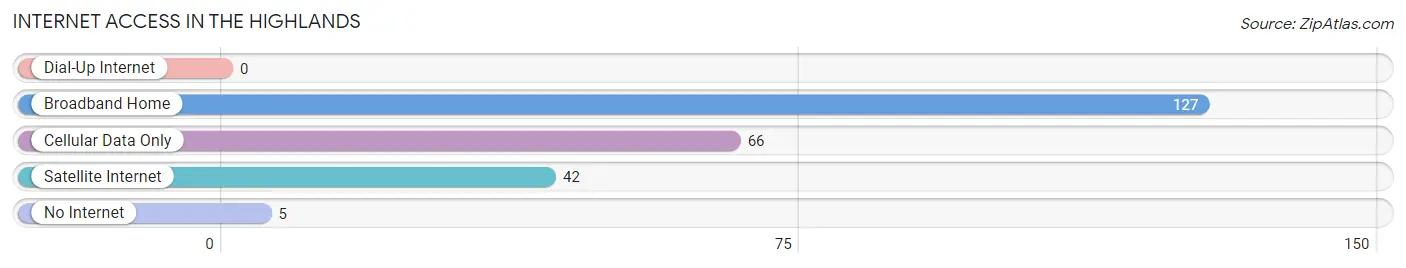
| Internet Type | # Households | % Households |
| Dial-Up Internet | 0 | 0.0% |
| Broadband Home | 127 | 55.9% |
| Cellular Data Only | 66 | 29.1% |
| Satellite Internet | 42 | 18.5% |
| No Internet | 5 | 2.2% |
| Total | 227 | 100.0% |
The Highlands Summary
The Highlands, Kansas is a small town located in the northeast corner of the state, just south of the Nebraska border. It is part of the Clay County area and is home to a population of just over 500 people. The town was founded in 1887 and has a rich history of farming and ranching.
Geography
The Highlands is located in the northeast corner of Kansas, just south of the Nebraska border. It is part of the Clay County area and is situated on the banks of the Republican River. The town is surrounded by rolling hills and grasslands, and is home to a variety of wildlife, including deer, wild turkeys, and coyotes. The town is located at an elevation of 1,845 feet above sea level.
Economy
The economy of The Highlands is largely based on agriculture and ranching. The town is home to several farms and ranches, which produce a variety of crops, including corn, wheat, and soybeans. The town also has a small manufacturing sector, which produces a variety of products, including furniture, clothing, and food products.
Demographics
As of the 2010 census, The Highlands had a population of 514 people. The racial makeup of the town was 97.3% White, 0.6% African American, 0.2% Native American, 0.2% Asian, 0.2% from other races, and 1.5% from two or more races. Hispanic or Latino of any race were 0.8% of the population.
The median income for a household in The Highlands was $41,250, and the median income for a family was $45,000. The per capita income for the town was $18,945. About 8.3% of families and 10.2% of the population were below the poverty line, including 11.3% of those under age 18 and 8.3% of those age 65 or over.
History
The Highlands was founded in 1887 by a group of settlers from Nebraska. The town was originally called “Highland Station”, and was a stop on the Union Pacific Railroad. The town was officially incorporated in 1891, and the name was changed to The Highlands.
The town grew rapidly in the early 1900s, and by 1910, the population had grown to over 500 people. The town was home to several businesses, including a bank, a hotel, a general store, and a blacksmith shop.
In the 1920s, The Highlands experienced a period of economic decline, as many of the businesses in town closed. The town was also hit hard by the Great Depression, and the population declined to just over 300 people by 1940.
The town experienced a resurgence in the 1950s, as new businesses opened and the population began to grow again. The town was also home to a number of tourist attractions, including a golf course, a swimming pool, and a movie theater.
Today, The Highlands is a small, rural town with a population of just over 500 people. The town is home to several businesses, including a grocery store, a hardware store, and a restaurant. The town is also home to a number of churches, and is a popular destination for outdoor recreation, including fishing, hunting, and camping.
Common Questions
What is the Total Population of The Highlands?
Total Population of The Highlands is 516.
What is the Total Male Population of The Highlands?
Total Male Population of The Highlands is 214.
What is the Total Female Population of The Highlands?
Total Female Population of The Highlands is 302.
What is the Ratio of Males per 100 Females in The Highlands?
There are 70.86 Males per 100 Females in The Highlands.
What is the Ratio of Females per 100 Males in The Highlands?
There are 141.12 Females per 100 Males in The Highlands.
What is the Median Population Age in The Highlands?
Median Population Age in The Highlands is 49.0 Years.
What is the Average Family Size in The Highlands
Average Family Size in The Highlands is 2.8 People.
What is the Average Household Size in The Highlands
Average Household Size in The Highlands is 2.3 People.
What is Per Capita Income in The Highlands?
Per Capita income in The Highlands is $64,964.
What is the Median Family Income in The Highlands?
Median Family Income in The Highlands is $107,917.
What is the Median Household income in The Highlands?
Median Household Income in The Highlands is $90,433.
What is Income or Wage Gap in The Highlands?
Income or Wage Gap in The Highlands is 37.2%.
Women in The Highlands earn 62.8 cents for every dollar earned by a man.
What is Inequality or Gini Index in The Highlands?
Inequality or Gini Index in The Highlands is 0.51.
How Large is the Labor Force in The Highlands?
There are 266 People in the Labor Forcein in The Highlands.
What is the Percentage of People in the Labor Force in The Highlands?
59.2% of People are in the Labor Force in The Highlands.
What is the Unemployment Rate in The Highlands?
Unemployment Rate in The Highlands is 8.6%.