Zip Codes with the Highest Percentage of Population with a Degree in Visual and Performing Arts in Topeka, KS
RELATED REPORTS & OPTIONS
Visual and Performing Arts
Topeka
Compare Zip Codes
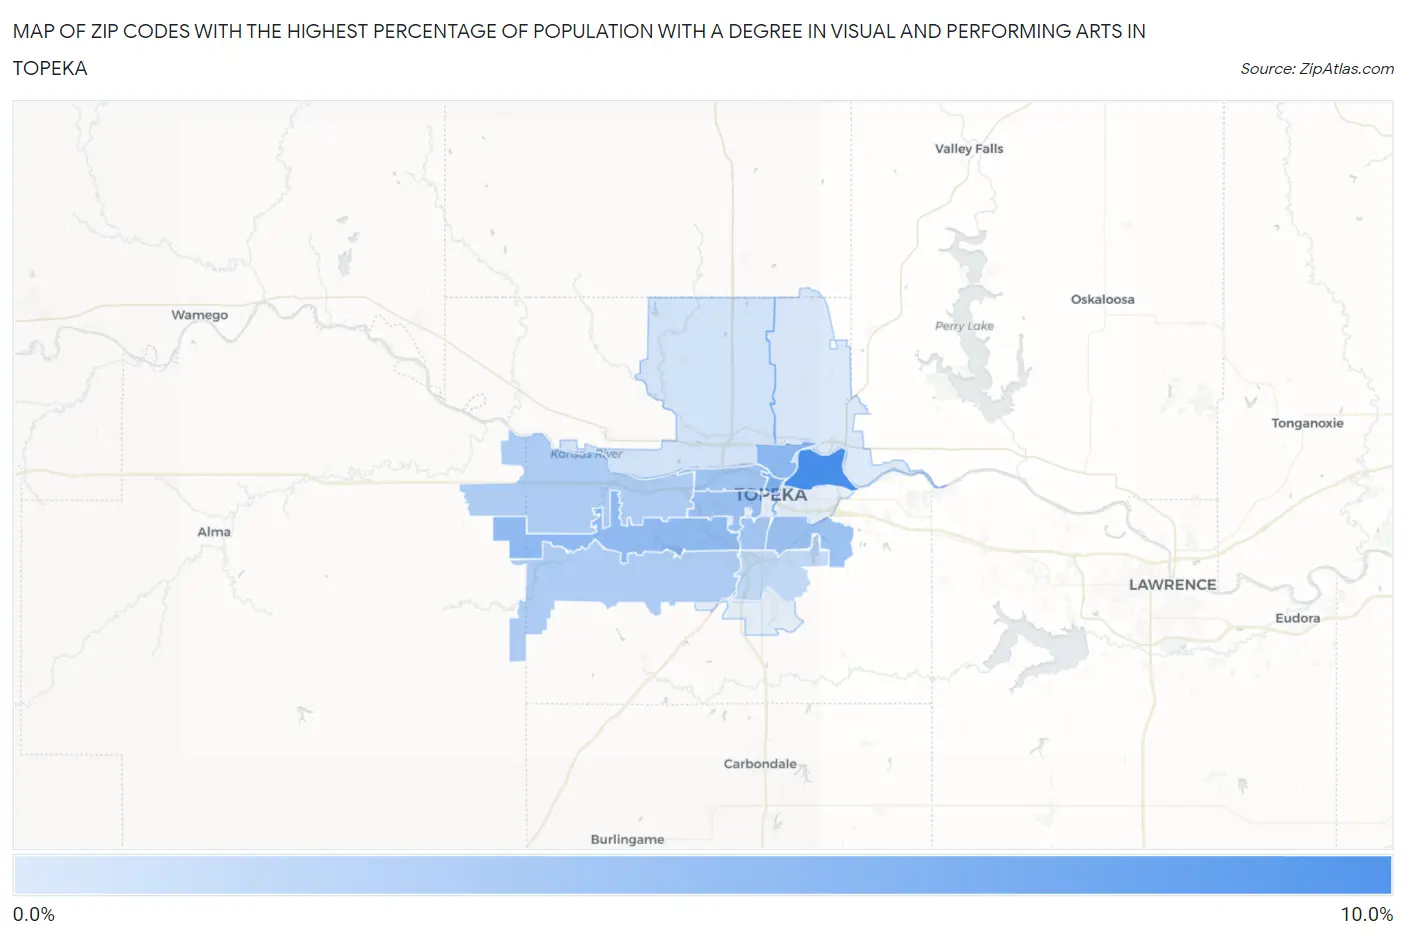
Map of Zip Codes with the Highest Percentage of Population with a Degree in Visual and Performing Arts in Topeka
0.0%
10.0%
Zip Codes with the Highest Percentage of Population with a Degree in Visual and Performing Arts in Topeka, KS
| Zip Code | % Graduates | vs State | vs National | |
| 1. | 66616 | 8.2% | 3.4%(+4.82)#38 | 4.3%(+3.98)#2,693 |
| 2. | 66603 | 5.1% | 3.4%(+1.67)#87 | 4.3%(+0.833)#6,446 |
| 3. | 66608 | 4.2% | 3.4%(+0.803)#114 | 4.3%(-0.035)#8,575 |
| 4. | 66614 | 4.2% | 3.4%(+0.779)#116 | 4.3%(-0.059)#8,648 |
| 5. | 66604 | 3.7% | 3.4%(+0.260)#148 | 4.3%(-0.579)#10,256 |
| 6. | 66605 | 3.4% | 3.4%(-0.000)#163 | 4.3%(-0.838)#11,200 |
| 7. | 66606 | 3.1% | 3.4%(-0.298)#171 | 4.3%(-1.14)#12,291 |
| 8. | 66611 | 3.1% | 3.4%(-0.340)#178 | 4.3%(-1.18)#12,437 |
| 9. | 66610 | 2.5% | 3.4%(-0.955)#222 | 4.3%(-1.79)#14,767 |
| 10. | 66615 | 2.5% | 3.4%(-0.963)#225 | 4.3%(-1.80)#14,791 |
| 11. | 66609 | 1.4% | 3.4%(-2.02)#294 | 4.3%(-2.86)#18,481 |
| 12. | 66618 | 0.49% | 3.4%(-2.92)#346 | 4.3%(-3.76)#20,792 |
| 13. | 66617 | 0.097% | 3.4%(-3.32)#360 | 4.3%(-4.16)#21,238 |
1
Common Questions
What are the Top 10 Zip Codes with the Highest Percentage of Population with a Degree in Visual and Performing Arts in Topeka, KS?
Top 10 Zip Codes with the Highest Percentage of Population with a Degree in Visual and Performing Arts in Topeka, KS are:
What zip code has the Highest Percentage of Population with a Degree in Visual and Performing Arts in Topeka, KS?
66616 has the Highest Percentage of Population with a Degree in Visual and Performing Arts in Topeka, KS with 8.2%.
What is the Percentage of Population with a Degree in Visual and Performing Arts in Topeka, KS?
Percentage of Population with a Degree in Visual and Performing Arts in Topeka is 3.6%.
What is the Percentage of Population with a Degree in Visual and Performing Arts in Kansas?
Percentage of Population with a Degree in Visual and Performing Arts in Kansas is 3.4%.
What is the Percentage of Population with a Degree in Visual and Performing Arts in the United States?
Percentage of Population with a Degree in Visual and Performing Arts in the United States is 4.3%.