Ottawa vs Immigrants from Sierra Leone Female Disability

COMPARE

Ottawa
Race
Ancestry
AfghanAfricanAlaska NativeAlaskan AthabascanAlbanianAleutAlsatianAmericanApacheArabArapahoArgentineanArmenianAssyrian/Chaldean/SyriacAustralianAustrianBahamianBangladeshiBarbadianBasqueBelgianBelizeanBermudanBhutaneseBlackfeetBolivianBrazilianBritishBritish West IndianBulgarianBurmeseCajunCambodianCanadianCape VerdeanCarpatho RusynCelticCentral AmericanCentral American IndianCherokeeCheyenneChickasawChileanChineseChippewaChoctawColombianColvilleComancheCosta RicanCreeCreekCroatianCrowCubanCypriotCzechCzechoslovakianDanishDelawareDominicanDutchDutch West IndianEastern EuropeanEcuadorianEgyptianEnglishEstonianEthiopianEuropeanFijianFilipinoFinnishFrenchFrench American IndianFrench CanadianGermanGerman RussianGhanaianGreekGuamanian/ChamorroGuatemalanGuyaneseHaitianHmongHonduranHopiHoumaHungarianIcelanderIndian (Asian)IndonesianInupiatIranianIraqiIrishIroquoisIsraeliItalianJamaicanJapaneseJordanianKenyanKiowaKoreanLaotianLatvianLebaneseLiberianLithuanianLumbeeLuxembourgerMacedonianMalaysianMalteseMarshalleseMenomineeMexicanMexican American IndianMongolianMoroccanNative HawaiianNavajoNepaleseNew ZealanderNicaraguanNigerianNorthern EuropeanNorwegianOkinawanOsageOttawaPaiutePakistaniPalestinianPanamanianParaguayanPennsylvania GermanPeruvianPimaPolishPortuguesePotawatomiPuebloPuerto RicanPuget Sound SalishRomanianRussianSalvadoranSamoanScandinavianScotch-IrishScottishSeminoleSenegaleseSerbianShoshoneSierra LeoneanSiouxSlavicSlovakSloveneSomaliSouth AfricanSouth AmericanSouth American IndianSoviet UnionSpaniardSpanishSpanish AmericanSpanish American IndianSri LankanSubsaharan AfricanSudaneseSwedishSwissSyrianTaiwaneseThaiTlingit-HaidaTohono O'OdhamTonganTrinidadian and TobagonianTsimshianTurkishU.S. Virgin IslanderUgandanUkrainianUruguayanUteVenezuelanVietnameseWelshWest IndianYakamaYaquiYugoslavianYumanYup'ikZimbabwean
Immigration
NonimmigrantsImmigrantsAfghanistanAfricaAlbaniaArgentinaArmeniaAsiaAustraliaAustriaBahamasBangladeshBarbadosBelarusBelgiumBelizeBoliviaBosnia and HerzegovinaBrazilBulgariaBurma/MyanmarCabo VerdeCambodiaCameroonCanadaCaribbeanCentral AmericaChileChinaColombiaCongoCosta RicaCroatiaCubaCzechoslovakiaDenmarkDominicaDominican RepublicEastern AfricaEastern AsiaEastern EuropeEcuadorEgyptEl SalvadorEnglandEritreaEthiopiaEuropeFijiFranceGermanyGhanaGreeceGrenadaGuatemalaGuyanaHaitiHondurasHong KongHungaryIndiaIndonesiaIranIraqIrelandIsraelItalyJamaicaJapanJordanKazakhstanKenyaKoreaKuwaitLaosLatin AmericaLatviaLebanonLiberiaLithuaniaMalaysiaMexicoMicronesiaMiddle AfricaMoldovaMoroccoNepalNetherlandsNicaraguaNigeriaNorth AmericaNorth MacedoniaNorthern AfricaNorthern EuropeNorwayOceaniaPakistanPanamaPeruPhilippinesPolandPortugalRomaniaRussiaSaudi ArabiaScotlandSenegalSerbiaSingaporeSomaliaSouth AfricaSouth AmericaSouth Central AsiaSouth Eastern AsiaSouthern EuropeSpainSri LankaSt. Vincent and the GrenadinesSudanSwedenSwitzerlandSyriaTaiwanThailandTrinidad and TobagoTurkeyUgandaUkraineUruguayUzbekistanVenezuelaVietnamWest IndiesWestern AfricaWestern AsiaWestern EuropeYemenZaireZimbabweAzores
Immigrants from Sierra Leone
Race
Ancestry
AfghanAfricanAlaska NativeAlaskan AthabascanAlbanianAleutAlsatianAmericanApacheArabArapahoArgentineanArmenianAssyrian/Chaldean/SyriacAustralianAustrianBahamianBangladeshiBarbadianBasqueBelgianBelizeanBermudanBhutaneseBlackfeetBolivianBrazilianBritishBritish West IndianBulgarianBurmeseCajunCambodianCanadianCape VerdeanCarpatho RusynCelticCentral AmericanCentral American IndianCherokeeCheyenneChickasawChileanChineseChippewaChoctawColombianColvilleComancheCosta RicanCreeCreekCroatianCrowCubanCypriotCzechCzechoslovakianDanishDelawareDominicanDutchDutch West IndianEastern EuropeanEcuadorianEgyptianEnglishEstonianEthiopianEuropeanFijianFilipinoFinnishFrenchFrench American IndianFrench CanadianGermanGerman RussianGhanaianGreekGuamanian/ChamorroGuatemalanGuyaneseHaitianHmongHonduranHopiHoumaHungarianIcelanderIndian (Asian)IndonesianInupiatIranianIraqiIrishIroquoisIsraeliItalianJamaicanJapaneseJordanianKenyanKiowaKoreanLaotianLatvianLebaneseLiberianLithuanianLumbeeLuxembourgerMacedonianMalaysianMalteseMarshalleseMenomineeMexicanMexican American IndianMongolianMoroccanNative HawaiianNavajoNepaleseNew ZealanderNicaraguanNigerianNorthern EuropeanNorwegianOkinawanOsagePaiutePakistaniPalestinianPanamanianParaguayanPennsylvania GermanPeruvianPimaPolishPortuguesePotawatomiPuebloPuerto RicanPuget Sound SalishRomanianRussianSalvadoranSamoanScandinavianScotch-IrishScottishSeminoleSenegaleseSerbianShoshoneSierra LeoneanSiouxSlavicSlovakSloveneSomaliSouth AfricanSouth AmericanSouth American IndianSoviet UnionSpaniardSpanishSpanish AmericanSpanish American IndianSri LankanSubsaharan AfricanSudaneseSwedishSwissSyrianTaiwaneseThaiTlingit-HaidaTohono O'OdhamTonganTrinidadian and TobagonianTsimshianTurkishU.S. Virgin IslanderUgandanUkrainianUruguayanUteVenezuelanVietnameseWelshWest IndianYakamaYaquiYugoslavianYumanYup'ikZimbabwean
Immigration
NonimmigrantsImmigrantsAfghanistanAfricaAlbaniaArgentinaArmeniaAsiaAustraliaAustriaBahamasBangladeshBarbadosBelarusBelgiumBelizeBoliviaBosnia and HerzegovinaBrazilBulgariaBurma/MyanmarCabo VerdeCambodiaCameroonCanadaCaribbeanCentral AmericaChileChinaColombiaCongoCosta RicaCroatiaCubaCzechoslovakiaDenmarkDominicaDominican RepublicEastern AfricaEastern AsiaEastern EuropeEcuadorEgyptEl SalvadorEnglandEritreaEthiopiaEuropeFijiFranceGermanyGhanaGreeceGrenadaGuatemalaGuyanaHaitiHondurasHong KongHungaryIndiaIndonesiaIranIraqIrelandIsraelItalyJamaicaJapanJordanKazakhstanKenyaKoreaKuwaitLaosLatin AmericaLatviaLebanonLiberiaLithuaniaMalaysiaMexicoMicronesiaMiddle AfricaMoldovaMoroccoNepalNetherlandsNicaraguaNigeriaNorth AmericaNorth MacedoniaNorthern AfricaNorthern EuropeNorwayOceaniaPakistanPanamaPeruPhilippinesPolandPortugalRomaniaRussiaSaudi ArabiaScotlandSenegalSerbiaSierra LeoneSingaporeSomaliaSouth AfricaSouth AmericaSouth Central AsiaSouth Eastern AsiaSouthern EuropeSpainSri LankaSt. Vincent and the GrenadinesSudanSwedenSwitzerlandSyriaTaiwanThailandTrinidad and TobagoTurkeyUgandaUkraineUruguayUzbekistanVenezuelaVietnamWest IndiesWestern AfricaWestern AsiaWestern EuropeYemenZaireZimbabweAzores
Female Disability
Income
Poverty
Unemployment
Labor Participation
Family Structure
Vehicle Availability
Education Level
Disability

Female Disability Comparison

Ottawa

Immigrants from Sierra Leone

Tragic
Exceptional
14.2%
FEMALE DISABILITY
0.0/ 100
METRIC RATING
327th/ 347
METRIC RANK
11.6%
FEMALE DISABILITY
99.4/ 100
METRIC RATING
93rd/ 347
METRIC RANK

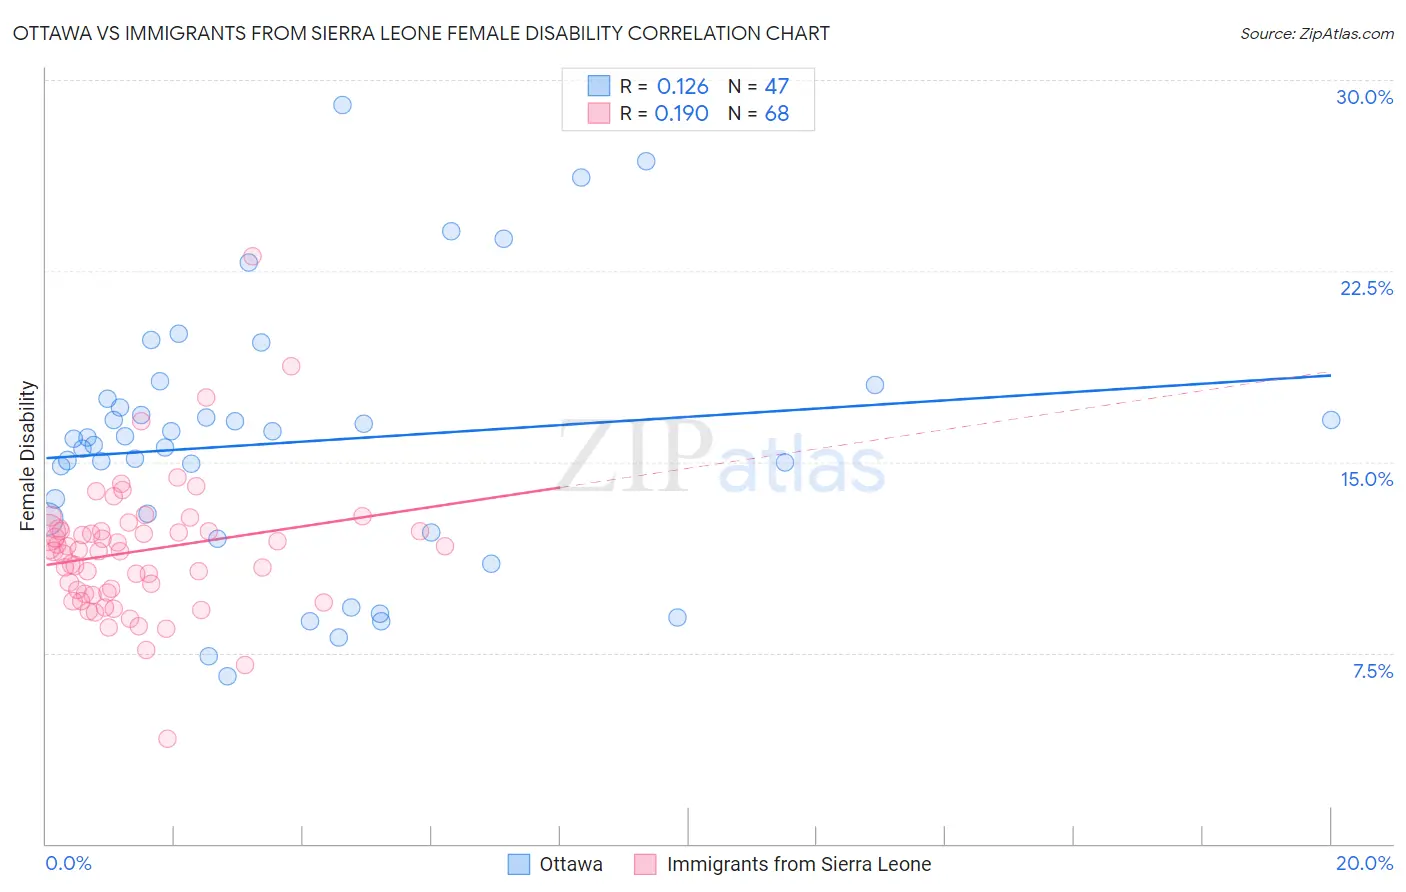
Ottawa vs Immigrants from Sierra Leone Female Disability Correlation Chart

The statistical analysis conducted on geographies consisting of 49,954,639 people shows a poor positive correlation between the proportion of Ottawa and percentage of females with a disability in the United States with a correlation coefficient (R) of 0.126 and weighted average of 14.2%. Similarly, the statistical analysis conducted on geographies consisting of 101,646,950 people shows a poor positive correlation between the proportion of Immigrants from Sierra Leone and percentage of females with a disability in the United States with a correlation coefficient (R) of 0.190 and weighted average of 11.6%, a difference of 22.7%.
Ottawa vs Immigrants from Sierra Leone Female Disability

Female Disability Correlation Summary

MeasurementOttawaImmigrants from Sierra Leone
Minimum6.6%4.1%
Maximum29.0%23.1%
Range22.4%18.9%
Mean15.8%11.5%
Median15.9%11.5%
Interquartile 25% (IQ1)12.8%9.8%
Interquartile 75% (IQ3)17.5%12.3%
Interquartile Range (IQR)4.7%2.5%
Standard Deviation (Sample)5.1%2.7%
Standard Deviation (Population)5.0%2.7%

Similar Demographics by Female Disability

Demographics Similar to Ottawa by Female Disability

In terms of female disability, the demographic groups most similar to Ottawa are Cape Verdean (14.2%, a difference of 0.0%), Osage (14.3%, a difference of 0.43%), Comanche (14.2%, a difference of 0.44%), Navajo (14.2%, a difference of 0.55%), and Native/Alaskan (14.1%, a difference of 0.69%).
DemographicsRating | RankFemale Disability
Americans
0.0
/100
|
#320
Tragic
14.1%
Potawatomi
0.0
/100
|
#321
Tragic
14.1%
Pueblo
0.0
/100
|
#322
Tragic
14.1%
Blacks/African Americans
0.0
/100
|
#323
Tragic
14.1%
Natives/Alaskans
0.0
/100
|
#324
Tragic
14.1%
Navajo
0.0
/100
|
#325
Tragic
14.2%
Comanche
0.0
/100
|
#326
Tragic
14.2%
Ottawa
0.0
/100
|
#327
Tragic
14.2%
Cape Verdeans
0.0
/100
|
#328
Tragic
14.2%
Osage
0.0
/100
|
#329
Tragic
14.3%
Yuman
0.0
/100
|
#330
Tragic
14.5%
Immigrants | Cabo Verde
0.0
/100
|
#331
Tragic
14.6%
Pima
0.0
/100
|
#332
Tragic
14.8%
Immigrants | Azores
0.0
/100
|
#333
Tragic
14.9%
Cherokee
0.0
/100
|
#334
Tragic
14.9%

Demographics Similar to Immigrants from Sierra Leone by Female Disability

In terms of female disability, the demographic groups most similar to Immigrants from Sierra Leone are Immigrants from Brazil (11.6%, a difference of 0.030%), Immigrants from Czechoslovakia (11.6%, a difference of 0.10%), Immigrants from Northern Europe (11.6%, a difference of 0.10%), Immigrants from Zimbabwe (11.6%, a difference of 0.11%), and Vietnamese (11.6%, a difference of 0.12%).
DemographicsRating | RankFemale Disability
Immigrants | Cameroon
99.6
/100
|
#86
Exceptional
11.6%
Immigrants | Denmark
99.5
/100
|
#87
Exceptional
11.6%
Yup'ik
99.5
/100
|
#88
Exceptional
11.6%
Vietnamese
99.5
/100
|
#89
Exceptional
11.6%
Immigrants | Romania
99.5
/100
|
#90
Exceptional
11.6%
Immigrants | Zimbabwe
99.5
/100
|
#91
Exceptional
11.6%
Immigrants | Czechoslovakia
99.5
/100
|
#92
Exceptional
11.6%
Immigrants | Sierra Leone
99.4
/100
|
#93
Exceptional
11.6%
Immigrants | Brazil
99.4
/100
|
#94
Exceptional
11.6%
Immigrants | Northern Europe
99.4
/100
|
#95
Exceptional
11.6%
Immigrants | Russia
99.0
/100
|
#96
Exceptional
11.7%
Koreans
99.0
/100
|
#97
Exceptional
11.7%
Uruguayans
98.8
/100
|
#98
Exceptional
11.7%
Immigrants | Philippines
98.6
/100
|
#99
Exceptional
11.7%
Immigrants | Uruguay
98.5
/100
|
#100
Exceptional
11.7%