Seligman, AZ
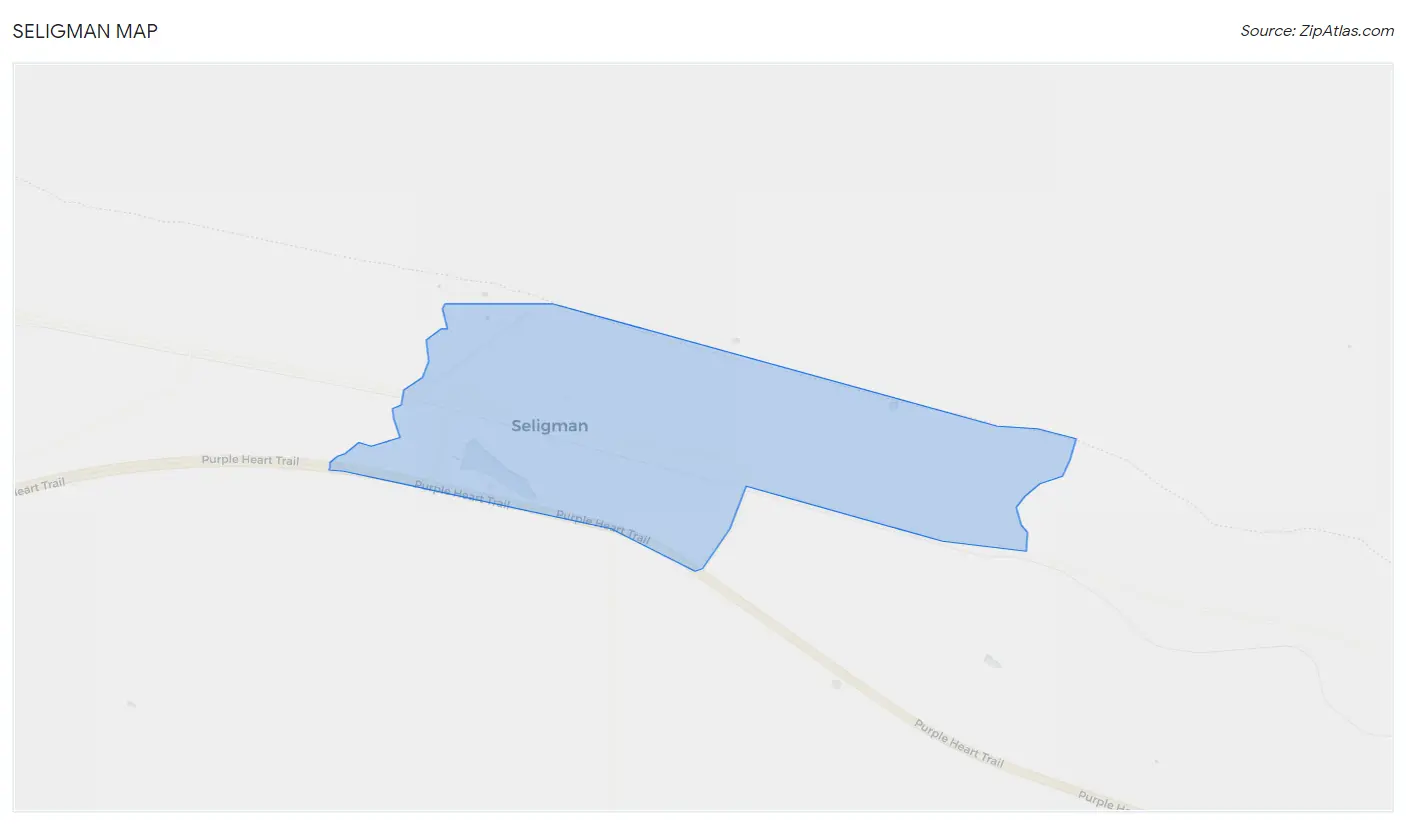
Seligman Map
Seligman Overview
770
TOTAL POPULATION
433
MALE POPULATION
337
FEMALE POPULATION
128.49
MALES / 100 FEMALES
77.83
FEMALES / 100 MALES
40.3
MEDIAN AGE
3.1
AVG FAMILY SIZE
2.6
AVG HOUSEHOLD SIZE
$27,022
PER CAPITA INCOME
$63,603
AVG FAMILY INCOME
$62,823
AVG HOUSEHOLD INCOME
28.5%
WAGE / INCOME GAP [ % ]
71.5¢/ $1
WAGE / INCOME GAP [ $ ]
0.43
INEQUALITY / GINI INDEX
350
LABOR FORCE [ PEOPLE ]
56.5%
PERCENT IN LABOR FORCE
Seligman Zip Codes
Seligman Area Codes
Race in Seligman
The most populous races in Seligman are White / Caucasian (561 | 72.9%), Hispanic or Latino (270 | 35.1%), and Two or more Races (92 | 11.9%).
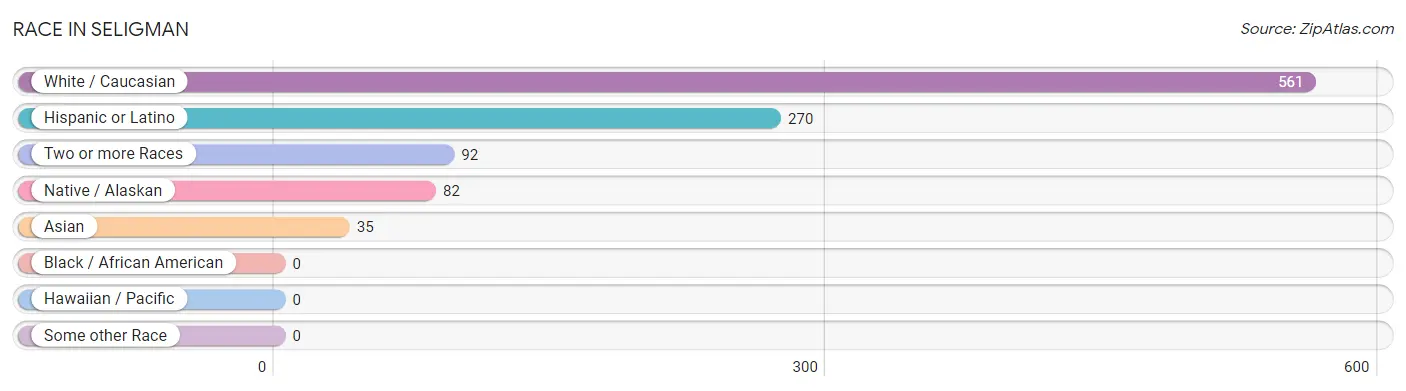
| Race | # Population | % Population |
| Asian | 35 | 4.5% |
| Black / African American | 0 | 0.0% |
| Hawaiian / Pacific | 0 | 0.0% |
| Hispanic or Latino | 270 | 35.1% |
| Native / Alaskan | 82 | 10.6% |
| White / Caucasian | 561 | 72.9% |
| Two or more Races | 92 | 11.9% |
| Some other Race | 0 | 0.0% |
| Total | 770 | 100.0% |
Ancestry in Seligman
The most populous ancestries reported in Seligman are Mexican (244 | 31.7%), German (211 | 27.4%), English (114 | 14.8%), Scottish (94 | 12.2%), and Navajo (82 | 10.6%), together accounting for 96.8% of all Seligman residents.
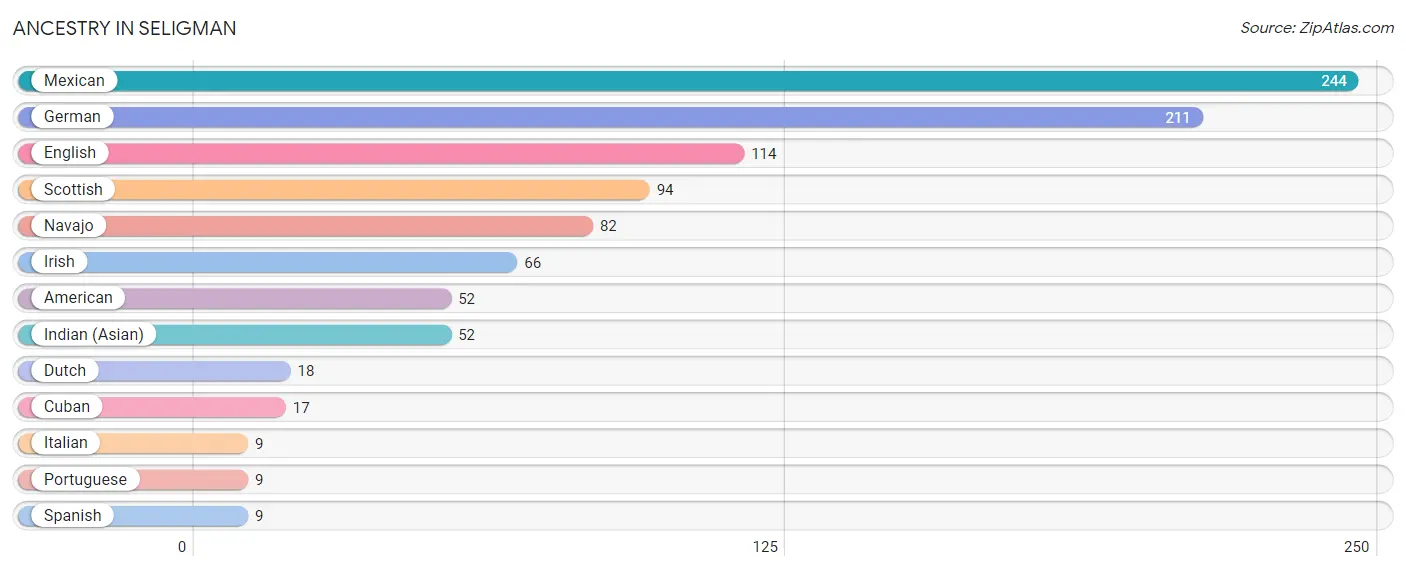
| Ancestry | # Population | % Population |
| American | 52 | 6.8% |
| Cuban | 17 | 2.2% |
| Dutch | 18 | 2.3% |
| English | 114 | 14.8% |
| German | 211 | 27.4% |
| Indian (Asian) | 52 | 6.8% |
| Irish | 66 | 8.6% |
| Italian | 9 | 1.2% |
| Mexican | 244 | 31.7% |
| Navajo | 82 | 10.6% |
| Portuguese | 9 | 1.2% |
| Scottish | 94 | 12.2% |
| Spanish | 9 | 1.2% | View All 13 Rows |
Immigrants in Seligman
The most numerous immigrant groups reported in Seligman came from Asia (27 | 3.5%), India (27 | 3.5%), South Central Asia (27 | 3.5%), Central America (9 | 1.2%), and Latin America (9 | 1.2%), together accounting for 12.9% of all Seligman residents.
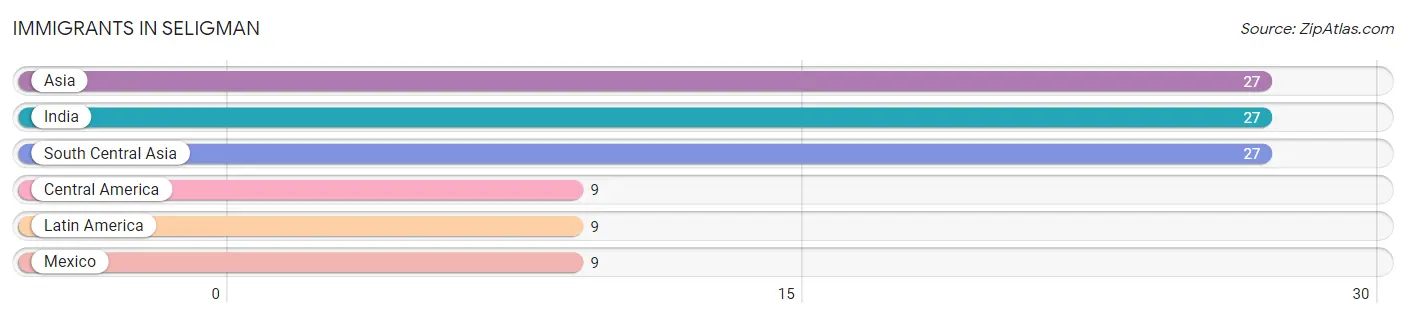
| Immigration Origin | # Population | % Population |
| Asia | 27 | 3.5% |
| Central America | 9 | 1.2% |
| India | 27 | 3.5% |
| Latin America | 9 | 1.2% |
| Mexico | 9 | 1.2% |
| South Central Asia | 27 | 3.5% | View All 6 Rows |
Sex and Age in Seligman
Sex and Age in Seligman
The most populous age groups in Seligman are 20 to 24 Years (67 | 15.5%) for men and 65 to 69 Years (58 | 17.2%) for women.
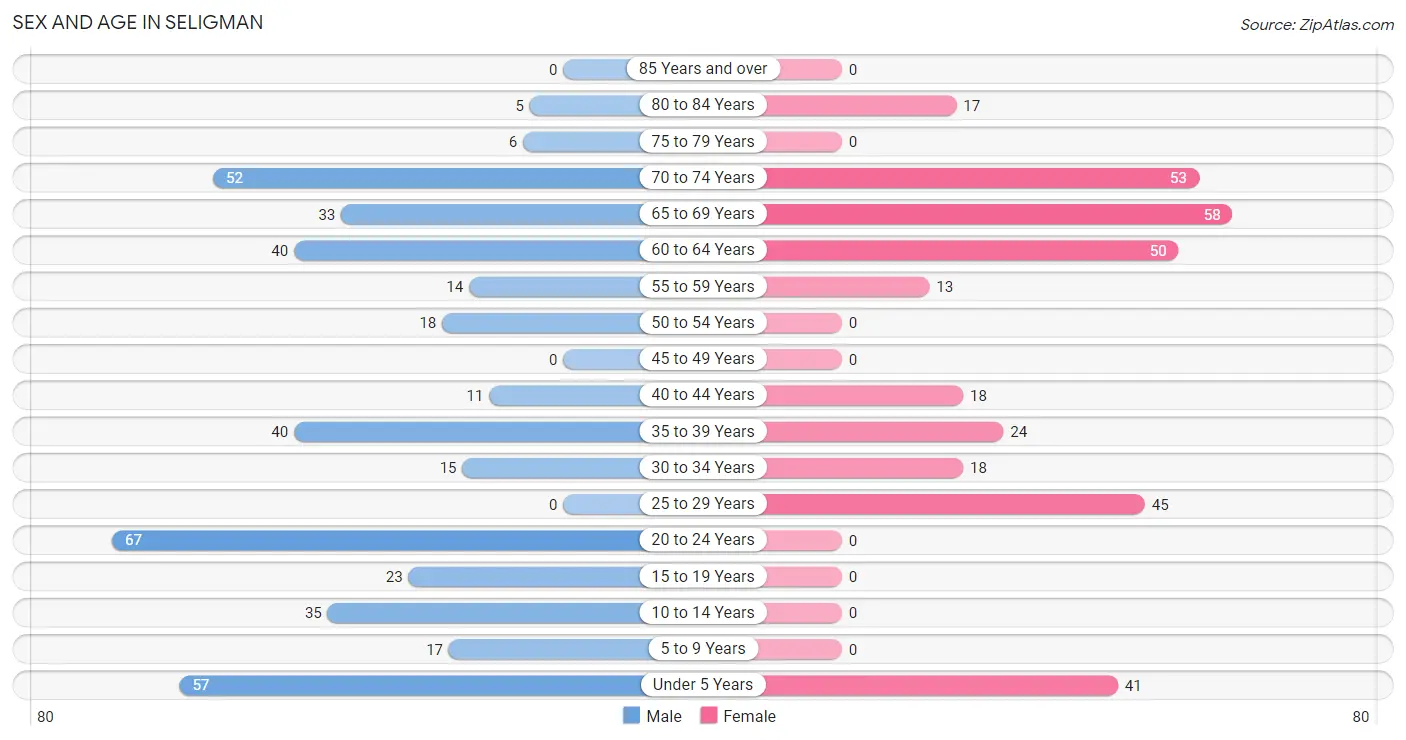
| Age Bracket | Male | Female |
| Under 5 Years | 57 (13.2%) | 41 (12.2%) |
| 5 to 9 Years | 17 (3.9%) | 0 (0.0%) |
| 10 to 14 Years | 35 (8.1%) | 0 (0.0%) |
| 15 to 19 Years | 23 (5.3%) | 0 (0.0%) |
| 20 to 24 Years | 67 (15.5%) | 0 (0.0%) |
| 25 to 29 Years | 0 (0.0%) | 45 (13.4%) |
| 30 to 34 Years | 15 (3.5%) | 18 (5.3%) |
| 35 to 39 Years | 40 (9.2%) | 24 (7.1%) |
| 40 to 44 Years | 11 (2.5%) | 18 (5.3%) |
| 45 to 49 Years | 0 (0.0%) | 0 (0.0%) |
| 50 to 54 Years | 18 (4.2%) | 0 (0.0%) |
| 55 to 59 Years | 14 (3.2%) | 13 (3.9%) |
| 60 to 64 Years | 40 (9.2%) | 50 (14.8%) |
| 65 to 69 Years | 33 (7.6%) | 58 (17.2%) |
| 70 to 74 Years | 52 (12.0%) | 53 (15.7%) |
| 75 to 79 Years | 6 (1.4%) | 0 (0.0%) |
| 80 to 84 Years | 5 (1.1%) | 17 (5.0%) |
| 85 Years and over | 0 (0.0%) | 0 (0.0%) |
| Total | 433 (100.0%) | 337 (100.0%) |
Families and Households in Seligman
Median Family Size in Seligman
The median family size in Seligman is 3.06 persons per family, with married-couple families (127 | 60.2%) accounting for the largest median family size of 4.1 persons per family. On the other hand, single male/father families (23 | 10.9%) represent the smallest median family size with 1.22 persons per family.
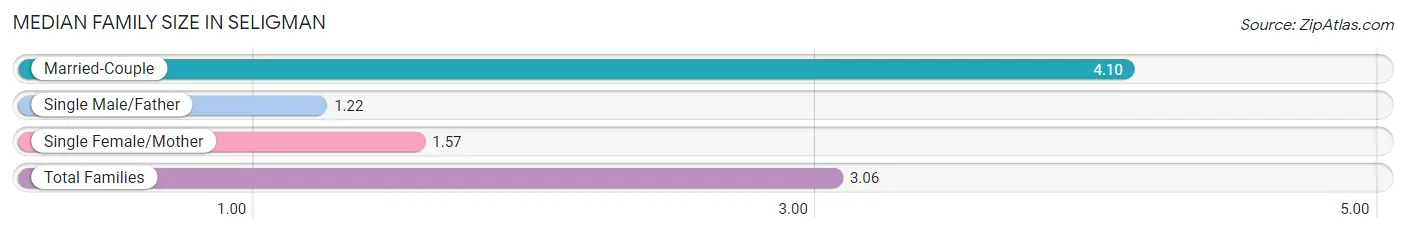
| Family Type | # Families | Family Size |
| Married-Couple | 127 (60.2%) | 4.10 |
| Single Male/Father | 23 (10.9%) | 1.22 |
| Single Female/Mother | 61 (28.9%) | 1.57 |
| Total Families | 211 (100.0%) | 3.06 |
Median Household Size in Seligman
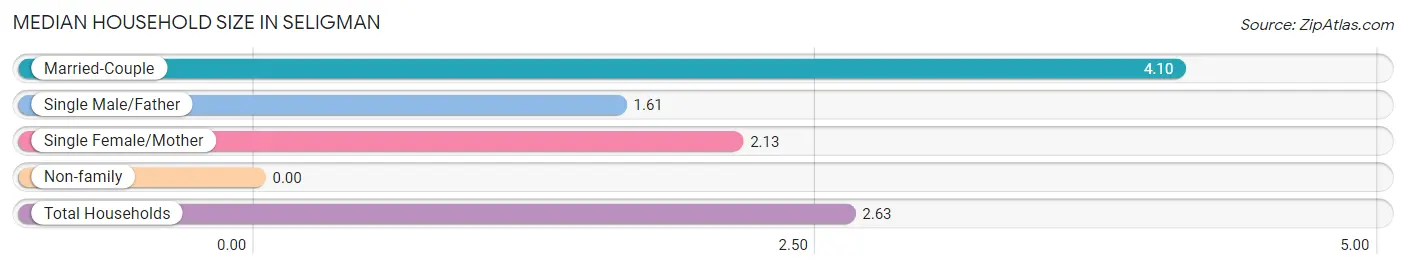
| Household Type | # Households | Household Size |
| Married-Couple | 127 (43.3%) | 4.10 |
| Single Male/Father | 23 (7.9%) | 1.61 |
| Single Female/Mother | 61 (20.8%) | 2.13 |
| Non-family | 82 (28.0%) | - |
| Total Households | 293 (100.0%) | 2.63 |
Household Size by Marriage Status in Seligman
Out of a total of 293 households in Seligman, 211 (72.0%) are family households, while 82 (28.0%) are nonfamily households. The most numerous type of family households are 3-person households, comprising 87, and the most common type of nonfamily households are 1-person households, comprising 82.
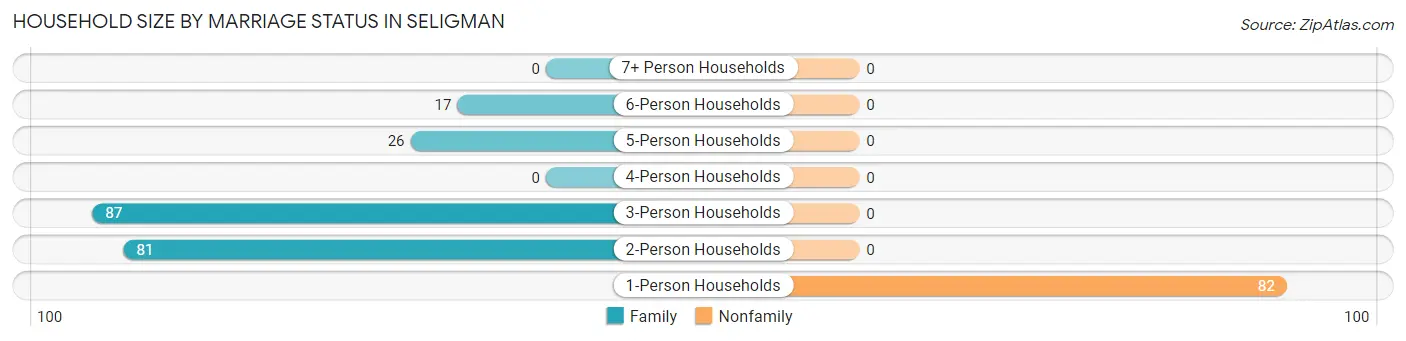
| Household Size | Family Households | Nonfamily Households |
| 1-Person Households | - | 82 (28.0%) |
| 2-Person Households | 81 (27.7%) | 0 (0.0%) |
| 3-Person Households | 87 (29.7%) | 0 (0.0%) |
| 4-Person Households | 0 (0.0%) | 0 (0.0%) |
| 5-Person Households | 26 (8.9%) | 0 (0.0%) |
| 6-Person Households | 17 (5.8%) | 0 (0.0%) |
| 7+ Person Households | 0 (0.0%) | 0 (0.0%) |
| Total | 211 (72.0%) | 82 (28.0%) |
Female Fertility in Seligman
Fertility by Age in Seligman
Average fertility rate in Seligman is 86.0 births per 1,000 women. Women in the age bracket of 35 to 50 years have the highest fertility rate with 214.0 births per 1,000 women. Women in the age bracket of 35 to 50 years acount for 100.0% of all women with births.
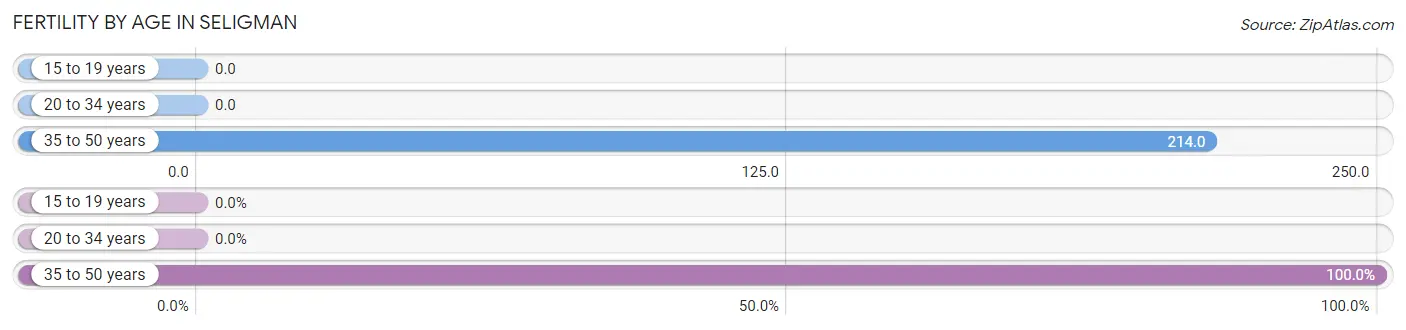
| Age Bracket | Women with Births | Births / 1,000 Women |
| 15 to 19 years | 0 (0.0%) | 0.0 |
| 20 to 34 years | 0 (0.0%) | 0.0 |
| 35 to 50 years | 9 (100.0%) | 214.0 |
| Total | 9 (100.0%) | 86.0 |
Fertility by Age by Marriage Status in Seligman
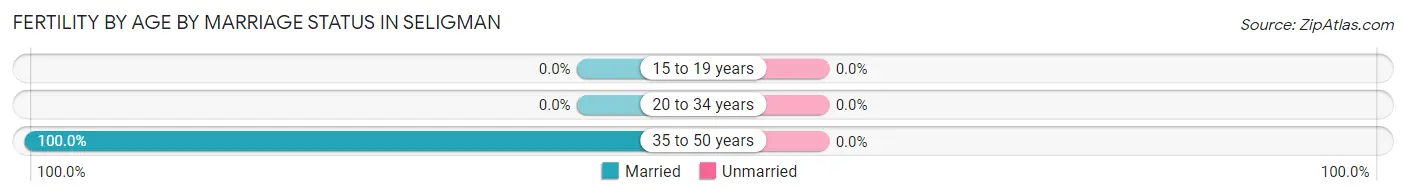
| Age Bracket | Married | Unmarried |
| 15 to 19 years | 0 (0.0%) | 0 (0.0%) |
| 20 to 34 years | 0 (0.0%) | 0 (0.0%) |
| 35 to 50 years | 9 (100.0%) | 0 (0.0%) |
| Total | 9 (100.0%) | 0 (0.0%) |
Fertility by Education in Seligman
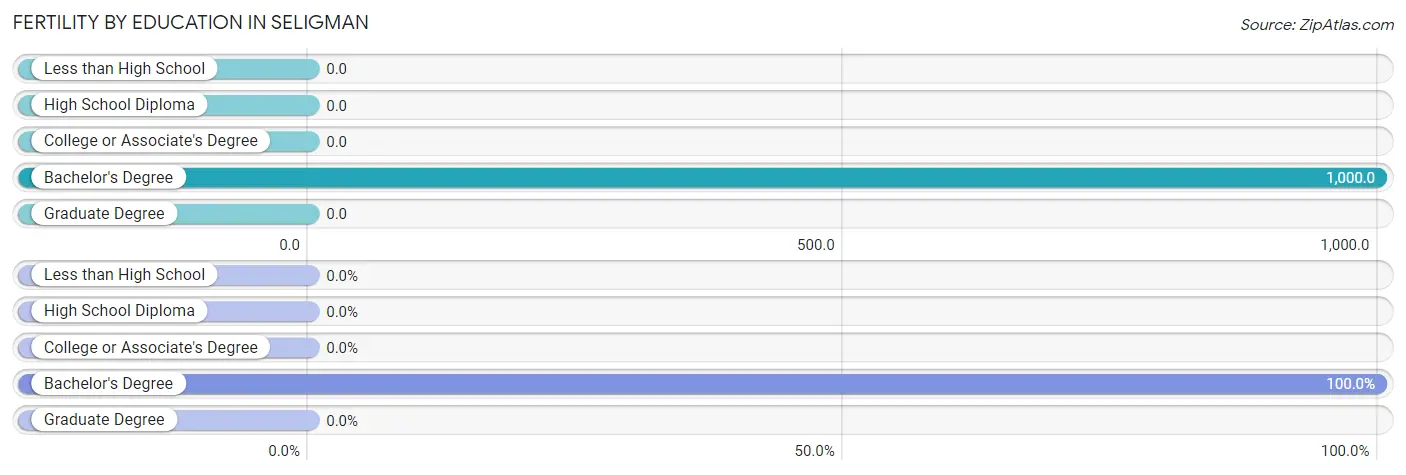
| Educational Attainment | Women with Births | Births / 1,000 Women |
| Less than High School | 0 (0.0%) | 0.0 |
| High School Diploma | 0 (0.0%) | 0.0 |
| College or Associate's Degree | 0 (0.0%) | 0.0 |
| Bachelor's Degree | 9 (100.0%) | 1,000.0 |
| Graduate Degree | 0 (0.0%) | 0.0 |
| Total | 9 (100.0%) | 86.0 |
Fertility by Education by Marriage Status in Seligman
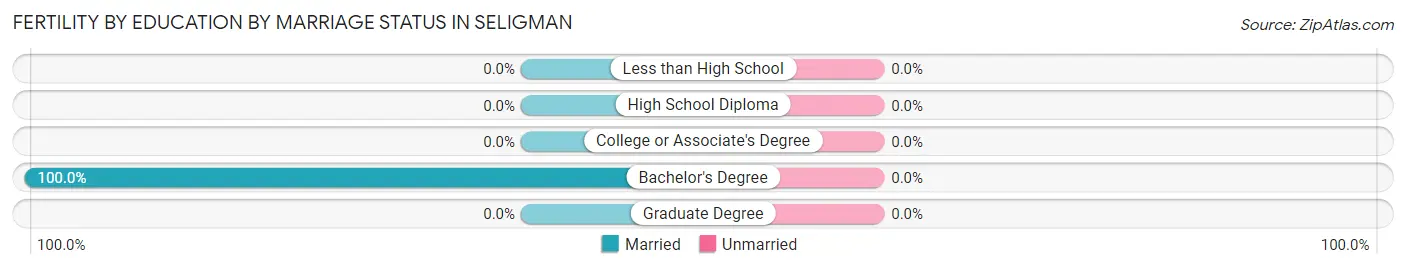
| Educational Attainment | Married | Unmarried |
| Less than High School | 0 (0.0%) | 0 (0.0%) |
| High School Diploma | 0 (0.0%) | 0 (0.0%) |
| College or Associate's Degree | 0 (0.0%) | 0 (0.0%) |
| Bachelor's Degree | 9 (100.0%) | 0 (0.0%) |
| Graduate Degree | 0 (0.0%) | 0 (0.0%) |
| Total | 9 (100.0%) | 0 (0.0%) |
Income in Seligman
Income Overview in Seligman
Per Capita Income in Seligman is $27,022, while median incomes of families and households are $63,603 and $62,823 respectively.
| Characteristic | Number | Measure |
| Per Capita Income | 770 | $27,022 |
| Median Family Income | 211 | $63,603 |
| Mean Family Income | 211 | $79,781 |
| Median Household Income | 293 | $62,823 |
| Mean Household Income | 293 | $67,287 |
| Income Deficit | 211 | $0 |
| Wage / Income Gap (%) | 770 | 28.53% |
| Wage / Income Gap ($) | 770 | 71.47¢ per $1 |
| Gini / Inequality Index | 770 | 0.43 |
Earnings by Sex in Seligman
Average Earnings in Seligman are $28,988, $35,951 for men and $25,694 for women, a difference of 28.5%.
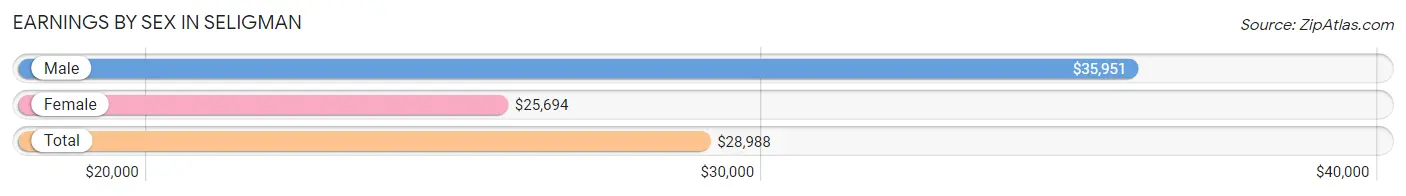
| Sex | Number | Average Earnings |
| Male | 215 (54.7%) | $35,951 |
| Female | 178 (45.3%) | $25,694 |
| Total | 393 (100.0%) | $28,988 |
Earnings by Sex by Income Bracket in Seligman
The most common earnings brackets in Seligman are $35,000 to $39,999 for men (67 | 31.2%) and $5,000 to $7,499 for women (41 | 23.0%).
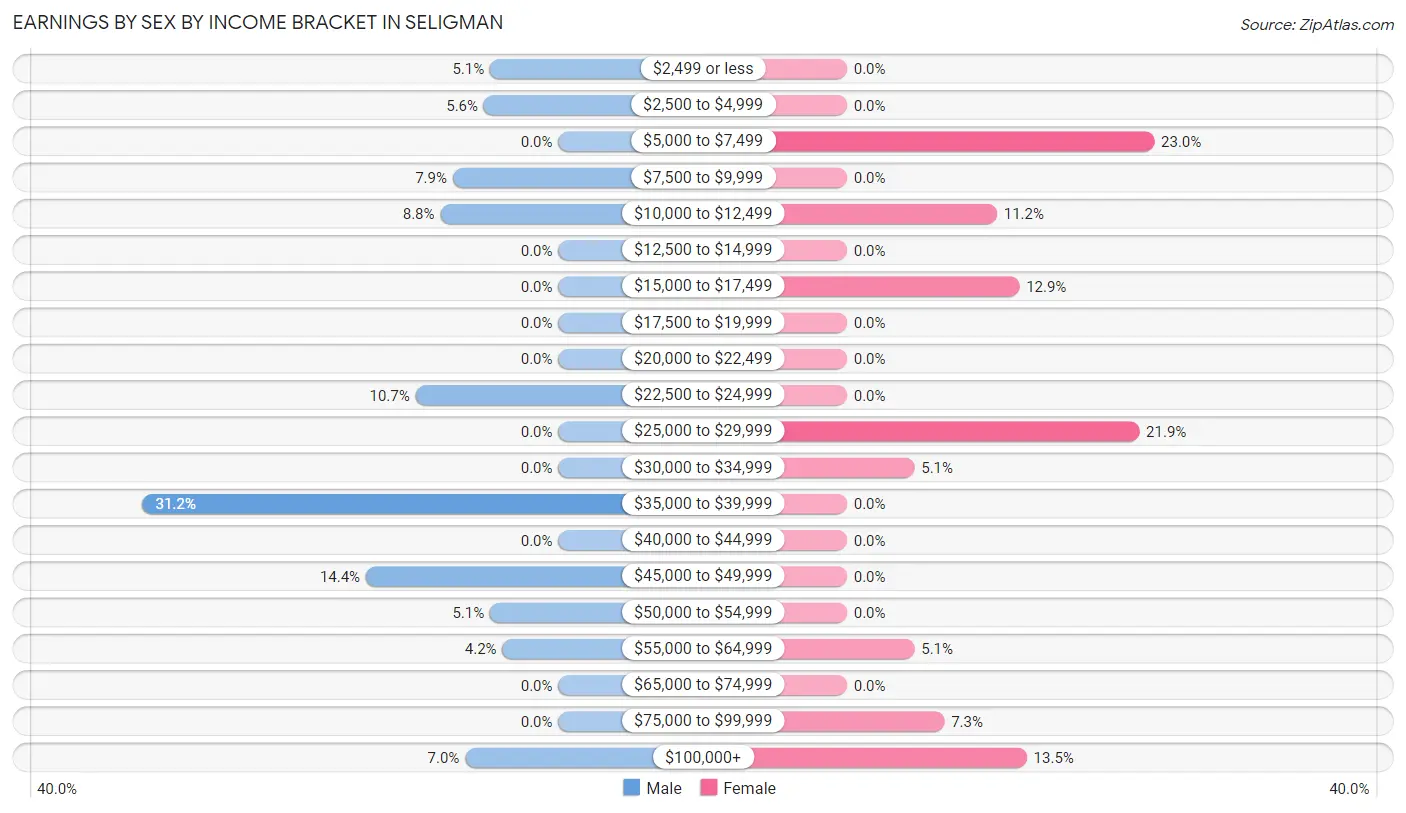
| Income | Male | Female |
| $2,499 or less | 11 (5.1%) | 0 (0.0%) |
| $2,500 to $4,999 | 12 (5.6%) | 0 (0.0%) |
| $5,000 to $7,499 | 0 (0.0%) | 41 (23.0%) |
| $7,500 to $9,999 | 17 (7.9%) | 0 (0.0%) |
| $10,000 to $12,499 | 19 (8.8%) | 20 (11.2%) |
| $12,500 to $14,999 | 0 (0.0%) | 0 (0.0%) |
| $15,000 to $17,499 | 0 (0.0%) | 23 (12.9%) |
| $17,500 to $19,999 | 0 (0.0%) | 0 (0.0%) |
| $20,000 to $22,499 | 0 (0.0%) | 0 (0.0%) |
| $22,500 to $24,999 | 23 (10.7%) | 0 (0.0%) |
| $25,000 to $29,999 | 0 (0.0%) | 39 (21.9%) |
| $30,000 to $34,999 | 0 (0.0%) | 9 (5.1%) |
| $35,000 to $39,999 | 67 (31.2%) | 0 (0.0%) |
| $40,000 to $44,999 | 0 (0.0%) | 0 (0.0%) |
| $45,000 to $49,999 | 31 (14.4%) | 0 (0.0%) |
| $50,000 to $54,999 | 11 (5.1%) | 0 (0.0%) |
| $55,000 to $64,999 | 9 (4.2%) | 9 (5.1%) |
| $65,000 to $74,999 | 0 (0.0%) | 0 (0.0%) |
| $75,000 to $99,999 | 0 (0.0%) | 13 (7.3%) |
| $100,000+ | 15 (7.0%) | 24 (13.5%) |
| Total | 215 (100.0%) | 178 (100.0%) |
Earnings by Sex by Educational Attainment in Seligman
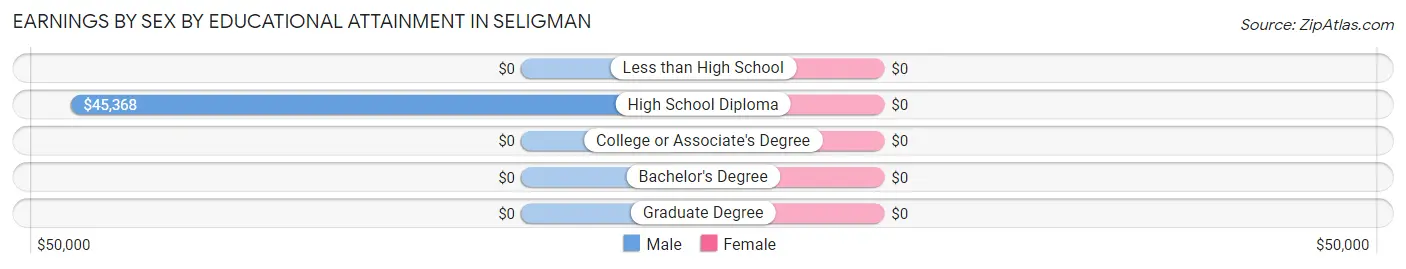
| Educational Attainment | Male Income | Female Income |
| Less than High School | - | - |
| High School Diploma | $45,368 | $0 |
| College or Associate's Degree | - | - |
| Bachelor's Degree | - | - |
| Graduate Degree | - | - |
| Total | $45,282 | $25,694 |
Family Income in Seligman
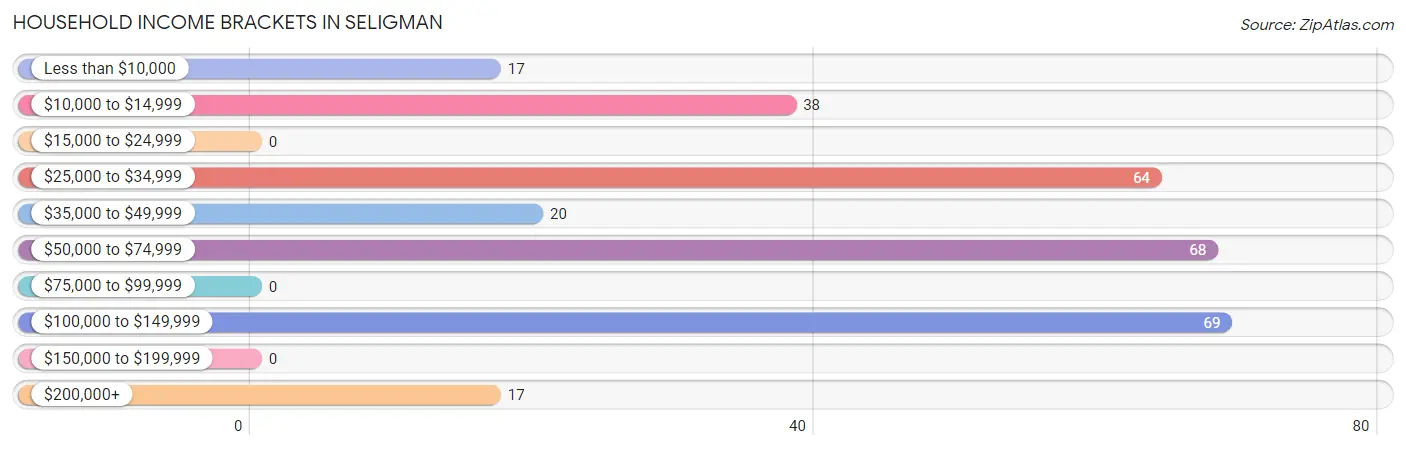
Family Income Brackets in Seligman
According to the Seligman family income data, there are 91 families falling into the $50,000 to $74,999 income range, which is the most common income bracket and makes up 43.1% of all families.
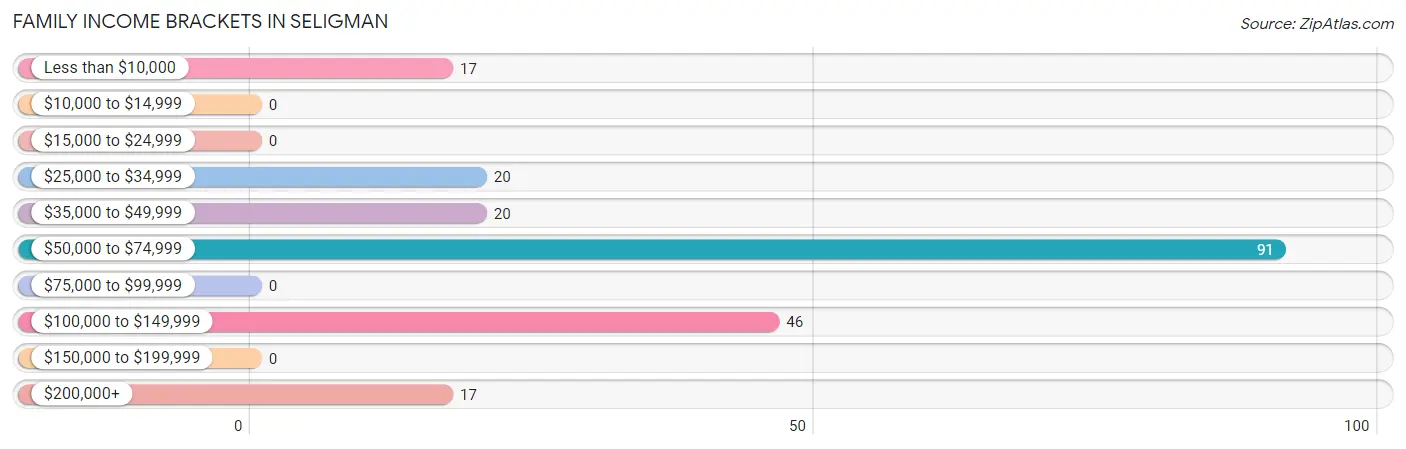
| Income Bracket | # Families | % Families |
| Less than $10,000 | 17 | 8.1% |
| $10,000 to $14,999 | 0 | 0.0% |
| $15,000 to $24,999 | 0 | 0.0% |
| $25,000 to $34,999 | 20 | 9.5% |
| $35,000 to $49,999 | 20 | 9.5% |
| $50,000 to $74,999 | 91 | 43.1% |
| $75,000 to $99,999 | 0 | 0.0% |
| $100,000 to $149,999 | 46 | 21.8% |
| $150,000 to $199,999 | 0 | 0.0% |
| $200,000+ | 17 | 8.1% |
Family Income by Famaliy Size in Seligman
2-person families (145 | 68.7%) account for the highest median family income in Seligman with $54,482 per family, while 2-person families (145 | 68.7%) have the highest median income of $27,241 per family member.
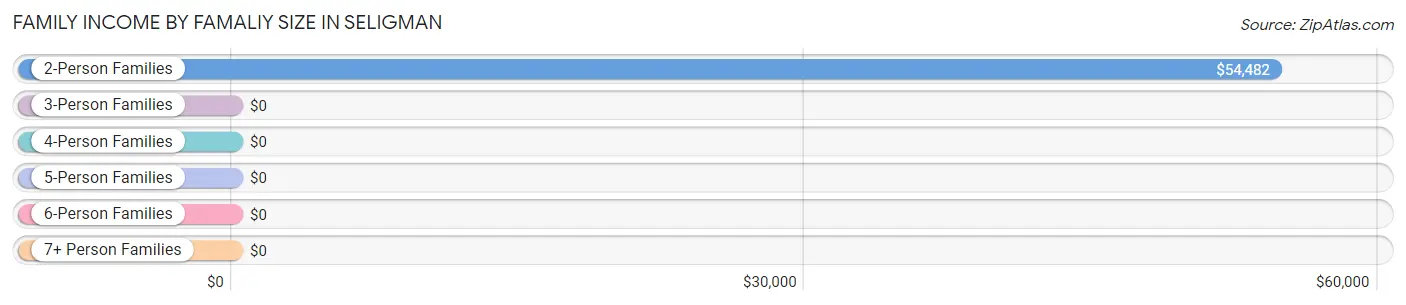
| Income Bracket | # Families | Median Income |
| 2-Person Families | 145 (68.7%) | $54,482 |
| 3-Person Families | 23 (10.9%) | $0 |
| 4-Person Families | 0 (0.0%) | $0 |
| 5-Person Families | 26 (12.3%) | $0 |
| 6-Person Families | 17 (8.1%) | $0 |
| 7+ Person Families | 0 (0.0%) | $0 |
| Total | 211 (100.0%) | $63,603 |
Family Income by Number of Earners in Seligman
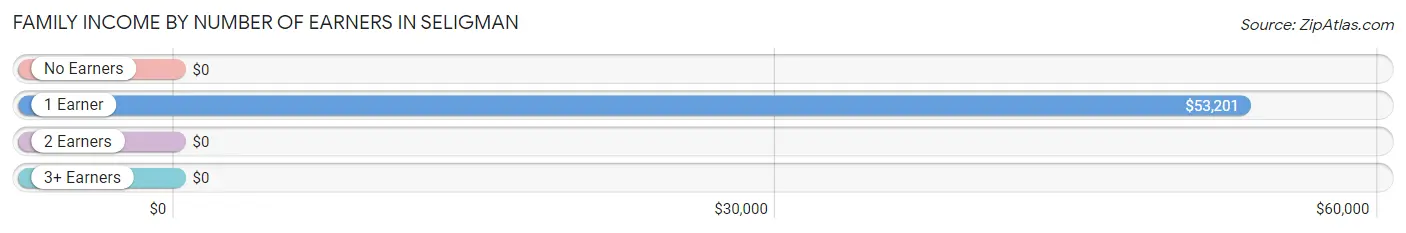
| Number of Earners | # Families | Median Income |
| No Earners | 17 (8.1%) | $0 |
| 1 Earner | 137 (64.9%) | $53,201 |
| 2 Earners | 29 (13.7%) | $0 |
| 3+ Earners | 28 (13.3%) | $0 |
| Total | 211 (100.0%) | $63,603 |
Household Income in Seligman
Household Income Brackets in Seligman
With 69 households falling in the category, the $100,000 to $149,999 income range is the most frequent in Seligman, accounting for 23.5% of all households.
| Income Bracket | # Households | % Households |
| Less than $10,000 | 17 | 5.8% |
| $10,000 to $14,999 | 38 | 13.0% |
| $15,000 to $24,999 | 0 | 0.0% |
| $25,000 to $34,999 | 64 | 21.8% |
| $35,000 to $49,999 | 20 | 6.8% |
| $50,000 to $74,999 | 68 | 23.2% |
| $75,000 to $99,999 | 0 | 0.0% |
| $100,000 to $149,999 | 69 | 23.5% |
| $150,000 to $199,999 | 0 | 0.0% |
| $200,000+ | 17 | 5.8% |
Household Income by Householder Age in Seligman
The median household income in Seligman is $62,823, with the highest median household income of $63,384 found in the 65+ years age bracket for the primary householder. A total of 87 households (29.7%) fall into this category.
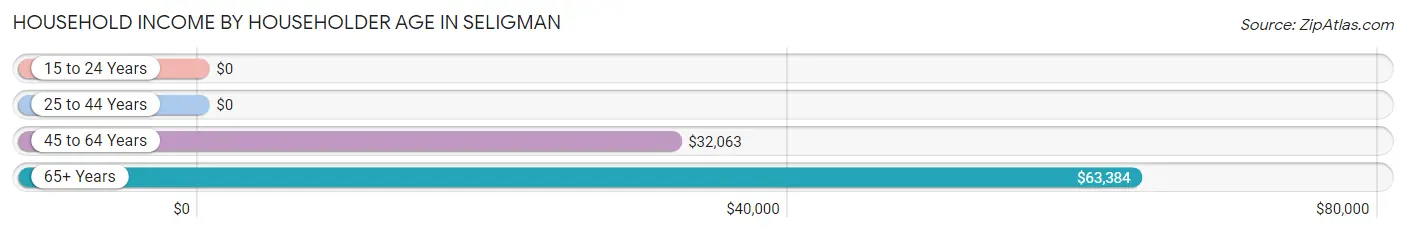
| Income Bracket | # Households | Median Income |
| 15 to 24 Years | 0 (0.0%) | $0 |
| 25 to 44 Years | 111 (37.9%) | $0 |
| 45 to 64 Years | 95 (32.4%) | $32,063 |
| 65+ Years | 87 (29.7%) | $63,384 |
| Total | 293 (100.0%) | $62,823 |
Poverty in Seligman
Income Below Poverty by Sex and Age in Seligman
With 23.1% poverty level for males and 12.2% for females among the residents of Seligman, 12 to 14 year old males and 35 to 44 year old females are the most vulnerable to poverty, with 35 males (100.0%) and 24 females (57.1%) in their respective age groups living below the poverty level.
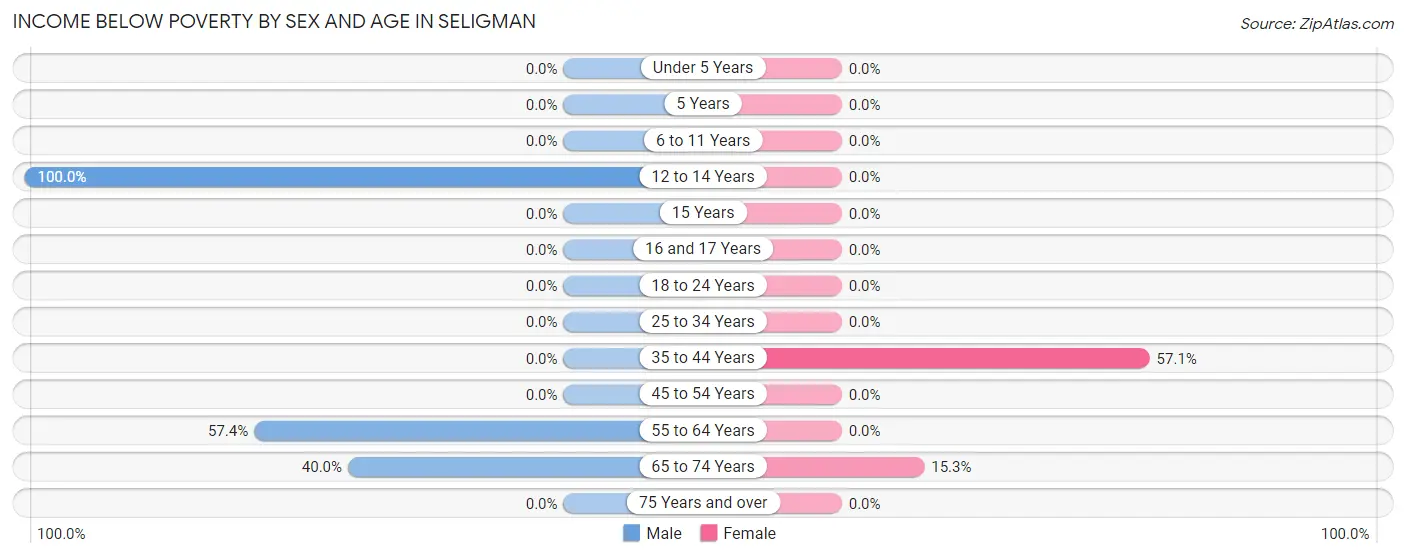
| Age Bracket | Male | Female |
| Under 5 Years | 0 (0.0%) | 0 (0.0%) |
| 5 Years | 0 (0.0%) | 0 (0.0%) |
| 6 to 11 Years | 0 (0.0%) | 0 (0.0%) |
| 12 to 14 Years | 35 (100.0%) | 0 (0.0%) |
| 15 Years | 0 (0.0%) | 0 (0.0%) |
| 16 and 17 Years | 0 (0.0%) | 0 (0.0%) |
| 18 to 24 Years | 0 (0.0%) | 0 (0.0%) |
| 25 to 34 Years | 0 (0.0%) | 0 (0.0%) |
| 35 to 44 Years | 0 (0.0%) | 24 (57.1%) |
| 45 to 54 Years | 0 (0.0%) | 0 (0.0%) |
| 55 to 64 Years | 31 (57.4%) | 0 (0.0%) |
| 65 to 74 Years | 34 (40.0%) | 17 (15.3%) |
| 75 Years and over | 0 (0.0%) | 0 (0.0%) |
| Total | 100 (23.1%) | 41 (12.2%) |
Income Above Poverty by Sex and Age in Seligman
According to the poverty statistics in Seligman, males aged under 5 years and females aged under 5 years are the age groups that are most secure financially, with 100.0% of males and 100.0% of females in these age groups living above the poverty line.
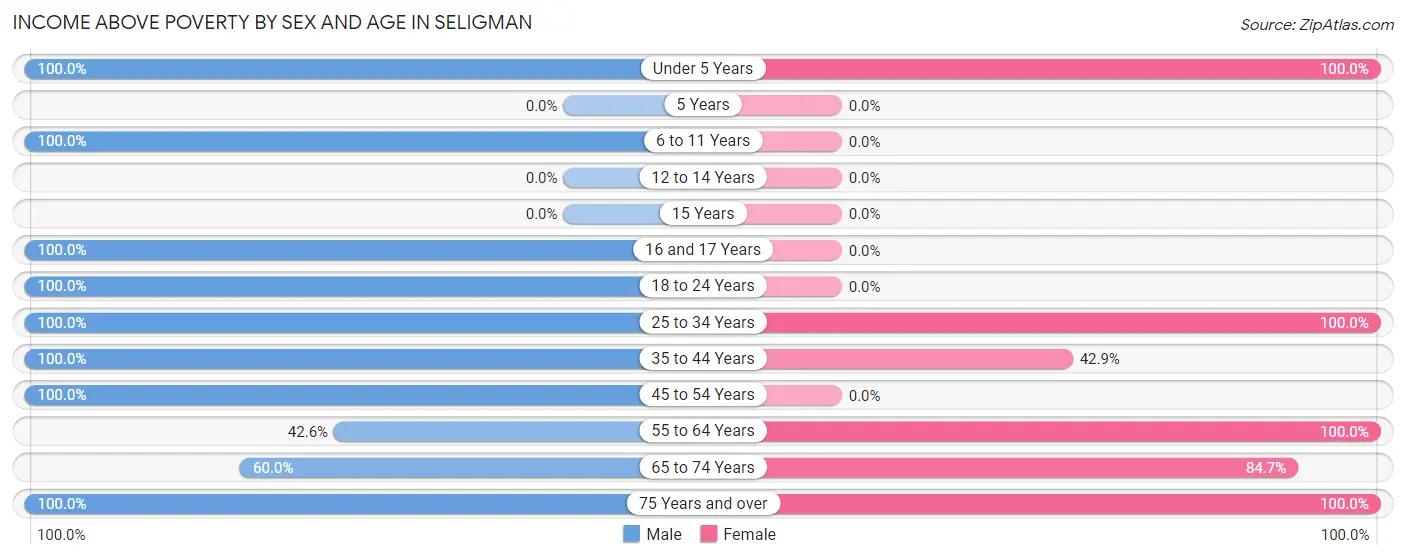
| Age Bracket | Male | Female |
| Under 5 Years | 57 (100.0%) | 41 (100.0%) |
| 5 Years | 0 (0.0%) | 0 (0.0%) |
| 6 to 11 Years | 17 (100.0%) | 0 (0.0%) |
| 12 to 14 Years | 0 (0.0%) | 0 (0.0%) |
| 15 Years | 0 (0.0%) | 0 (0.0%) |
| 16 and 17 Years | 23 (100.0%) | 0 (0.0%) |
| 18 to 24 Years | 67 (100.0%) | 0 (0.0%) |
| 25 to 34 Years | 15 (100.0%) | 63 (100.0%) |
| 35 to 44 Years | 51 (100.0%) | 18 (42.9%) |
| 45 to 54 Years | 18 (100.0%) | 0 (0.0%) |
| 55 to 64 Years | 23 (42.6%) | 63 (100.0%) |
| 65 to 74 Years | 51 (60.0%) | 94 (84.7%) |
| 75 Years and over | 11 (100.0%) | 17 (100.0%) |
| Total | 333 (76.9%) | 296 (87.8%) |
Income Below Poverty Among Married-Couple Families in Seligman
The poverty statistics for married-couple families in Seligman show that 13.4% or 17 of the total 127 families live below the poverty line. Families with 1 or 2 children have the highest poverty rate of 100.0%, comprising of 17 families. On the other hand, families with no children have the lowest poverty rate of 0.0%, which includes 0 families.
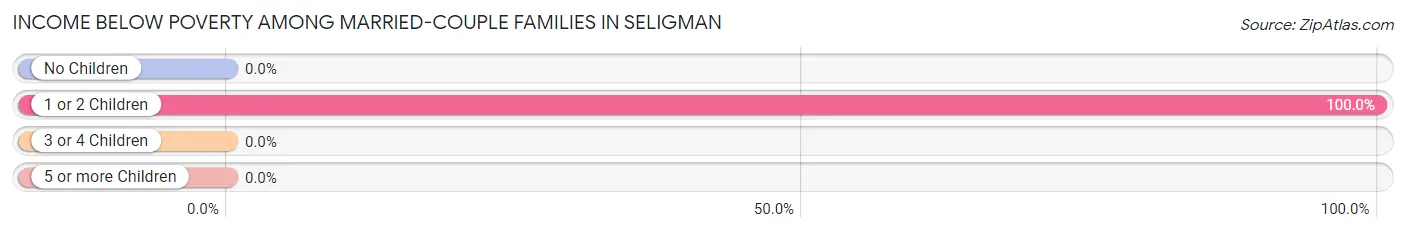
| Children | Above Poverty | Below Poverty |
| No Children | 67 (100.0%) | 0 (0.0%) |
| 1 or 2 Children | 0 (0.0%) | 17 (100.0%) |
| 3 or 4 Children | 43 (100.0%) | 0 (0.0%) |
| 5 or more Children | 0 (0.0%) | 0 (0.0%) |
| Total | 110 (86.6%) | 17 (13.4%) |
Income Below Poverty Among Single-Parent Households in Seligman
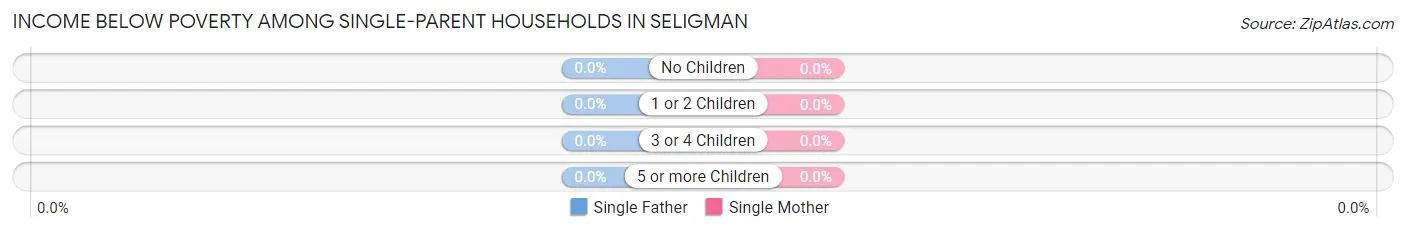
| Children | Single Father | Single Mother |
| No Children | 0 (0.0%) | 0 (0.0%) |
| 1 or 2 Children | 0 (0.0%) | 0 (0.0%) |
| 3 or 4 Children | 0 (0.0%) | 0 (0.0%) |
| 5 or more Children | 0 (0.0%) | 0 (0.0%) |
| Total | 0 (0.0%) | 0 (0.0%) |
Income Below Poverty Among Married-Couple vs Single-Parent Households in Seligman
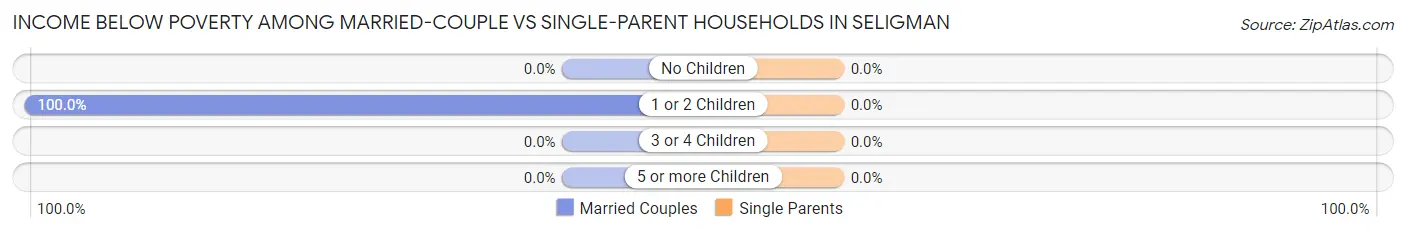
| Children | Married-Couple Families | Single-Parent Households |
| No Children | 0 (0.0%) | 0 (0.0%) |
| 1 or 2 Children | 17 (100.0%) | 0 (0.0%) |
| 3 or 4 Children | 0 (0.0%) | 0 (0.0%) |
| 5 or more Children | 0 (0.0%) | 0 (0.0%) |
| Total | 17 (13.4%) | 0 (0.0%) |
Employment Characteristics in Seligman
Employment by Class of Employer in Seligman
Among the 350 employed individuals in Seligman, private company employees (171 | 48.9%), federal government employees (67 | 19.1%), and state government employees (30 | 8.6%) make up the most common classes of employment.
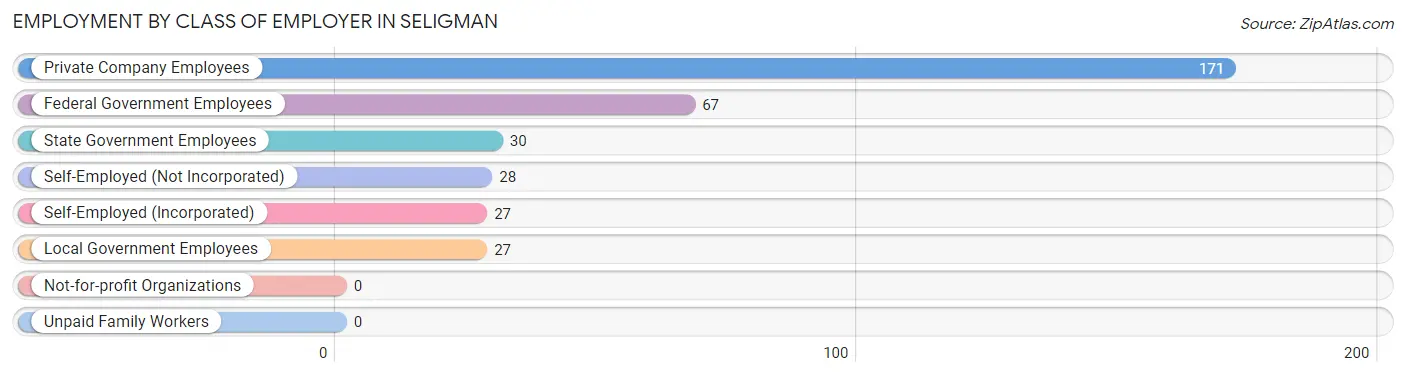
| Employer Class | # Employees | % Employees |
| Private Company Employees | 171 | 48.9% |
| Self-Employed (Incorporated) | 27 | 7.7% |
| Self-Employed (Not Incorporated) | 28 | 8.0% |
| Not-for-profit Organizations | 0 | 0.0% |
| Local Government Employees | 27 | 7.7% |
| State Government Employees | 30 | 8.6% |
| Federal Government Employees | 67 | 19.1% |
| Unpaid Family Workers | 0 | 0.0% |
| Total | 350 | 100.0% |
Employment Status by Age in Seligman
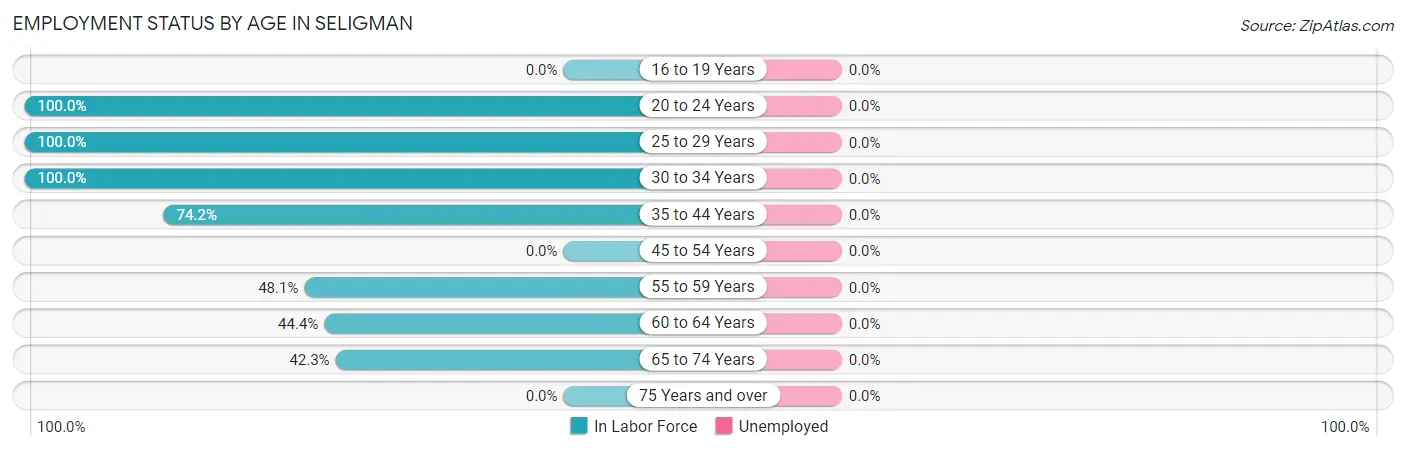
| Age Bracket | In Labor Force | Unemployed |
| 16 to 19 Years | 0 (0.0%) | 0 (0.0%) |
| 20 to 24 Years | 67 (100.0%) | 0 (0.0%) |
| 25 to 29 Years | 45 (100.0%) | 0 (0.0%) |
| 30 to 34 Years | 33 (100.0%) | 0 (0.0%) |
| 35 to 44 Years | 69 (74.2%) | 0 (0.0%) |
| 45 to 54 Years | 0 (0.0%) | 0 (0.0%) |
| 55 to 59 Years | 13 (48.1%) | 0 (0.0%) |
| 60 to 64 Years | 40 (44.4%) | 0 (0.0%) |
| 65 to 74 Years | 83 (42.3%) | 0 (0.0%) |
| 75 Years and over | 0 (0.0%) | 0 (0.0%) |
| Total | 350 (56.5%) | 0 (0.0%) |
Employment Status by Educational Attainment in Seligman
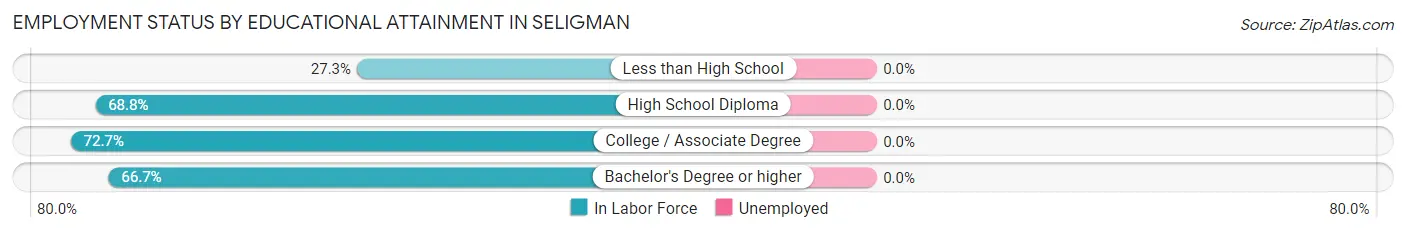
| Educational Attainment | In Labor Force | Unemployed |
| Less than High School | 9 (27.3%) | 0 (0.0%) |
| High School Diploma | 75 (68.8%) | 0 (0.0%) |
| College / Associate Degree | 80 (72.7%) | 0 (0.0%) |
| Bachelor's Degree or higher | 36 (66.7%) | 0 (0.0%) |
| Total | 200 (65.4%) | 0 (0.0%) |
Employment Occupations by Sex in Seligman
Management, Business, Science and Arts Occupations
The most common Management, Business, Science and Arts occupations in Seligman are Management (44 | 12.6%), Health Diagnosing & Treating (18 | 5.1%), Health Technologists (18 | 5.1%), Community & Social Service (9 | 2.6%), and Education Instruction & Library (9 | 2.6%).
Management, Business, Science and Arts Occupations by Sex
| Occupation | Male | Female |
| Management | 31 (70.5%) | 13 (29.5%) |
| Business & Financial | 0 (0.0%) | 0 (0.0%) |
| Computers, Engineering & Science | 0 (0.0%) | 0 (0.0%) |
| Computers & Mathematics | 0 (0.0%) | 0 (0.0%) |
| Architecture & Engineering | 0 (0.0%) | 0 (0.0%) |
| Life, Physical & Social Science | 0 (0.0%) | 0 (0.0%) |
| Community & Social Service | 0 (0.0%) | 9 (100.0%) |
| Education, Arts & Media | 0 (0.0%) | 0 (0.0%) |
| Legal Services & Support | 0 (0.0%) | 0 (0.0%) |
| Education Instruction & Library | 0 (0.0%) | 9 (100.0%) |
| Arts, Media & Entertainment | 0 (0.0%) | 0 (0.0%) |
| Health Diagnosing & Treating | 0 (0.0%) | 18 (100.0%) |
| Health Technologists | 0 (0.0%) | 18 (100.0%) |
| Total (Category) | 31 (43.7%) | 40 (56.3%) |
| Total (Overall) | 192 (54.9%) | 158 (45.1%) |
Services Occupations
The most common Services occupations in Seligman are Security & Protection (67 | 19.1%), Firefighting & Prevention (67 | 19.1%), Cleaning & Maintenance (40 | 11.4%), Food Preparation & Serving (24 | 6.9%), and Personal Care & Service (19 | 5.4%).
Services Occupations by Sex
Within the Services occupations in Seligman, the most male-oriented occupations are Security & Protection (100.0%), Firefighting & Prevention (100.0%), and Personal Care & Service (100.0%), while the most female-oriented occupations are Food Preparation & Serving (100.0%), and Cleaning & Maintenance (57.5%).
| Occupation | Male | Female |
| Healthcare Support | 0 (0.0%) | 0 (0.0%) |
| Security & Protection | 67 (100.0%) | 0 (0.0%) |
| Firefighting & Prevention | 67 (100.0%) | 0 (0.0%) |
| Law Enforcement | 0 (0.0%) | 0 (0.0%) |
| Food Preparation & Serving | 0 (0.0%) | 24 (100.0%) |
| Cleaning & Maintenance | 17 (42.5%) | 23 (57.5%) |
| Personal Care & Service | 19 (100.0%) | 0 (0.0%) |
| Total (Category) | 103 (68.7%) | 47 (31.3%) |
| Total (Overall) | 192 (54.9%) | 158 (45.1%) |
Sales and Office Occupations
The most common Sales and Office occupations in Seligman are , and Office & Administration (105 | 30.0%).
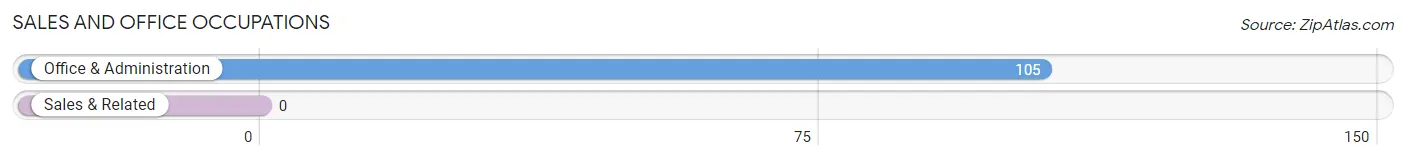
Sales and Office Occupations by Sex
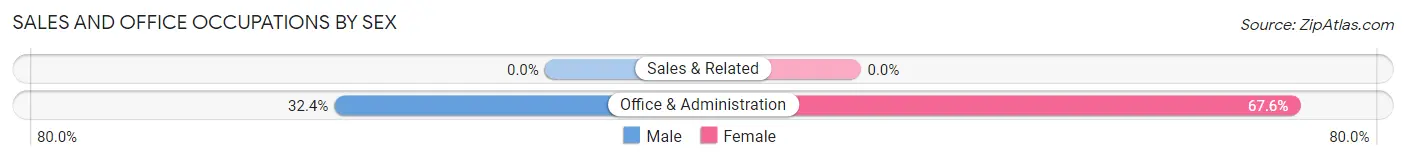
| Occupation | Male | Female |
| Sales & Related | 0 (0.0%) | 0 (0.0%) |
| Office & Administration | 34 (32.4%) | 71 (67.6%) |
| Total (Category) | 34 (32.4%) | 71 (67.6%) |
| Total (Overall) | 192 (54.9%) | 158 (45.1%) |
Natural Resources, Construction and Maintenance Occupations
The most common Natural Resources, Construction and Maintenance occupations in Seligman are Installation, Maintenance & Repair (15 | 4.3%), and Construction & Extraction (9 | 2.6%).
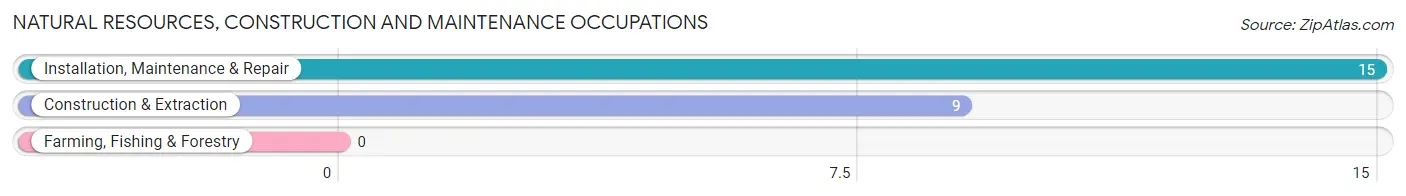
Natural Resources, Construction and Maintenance Occupations by Sex
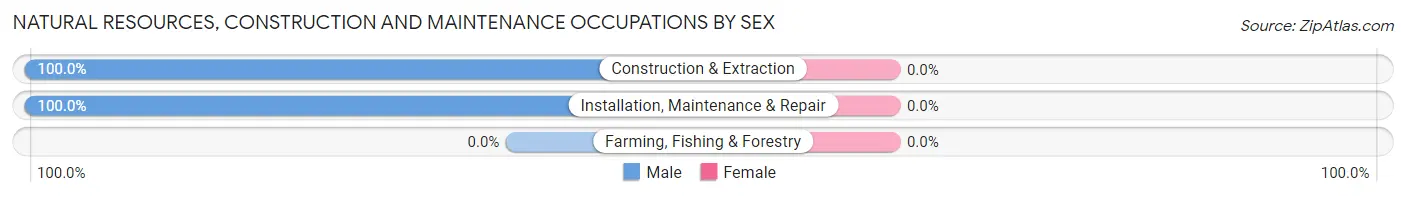
| Occupation | Male | Female |
| Farming, Fishing & Forestry | 0 (0.0%) | 0 (0.0%) |
| Construction & Extraction | 9 (100.0%) | 0 (0.0%) |
| Installation, Maintenance & Repair | 15 (100.0%) | 0 (0.0%) |
| Total (Category) | 24 (100.0%) | 0 (0.0%) |
| Total (Overall) | 192 (54.9%) | 158 (45.1%) |
Production, Transportation and Moving Occupations
Production, Transportation and Moving Occupations by Sex
| Occupation | Male | Female |
| Production | 0 (0.0%) | 0 (0.0%) |
| Transportation | 0 (0.0%) | 0 (0.0%) |
| Material Moving | 0 (0.0%) | 0 (0.0%) |
| Total (Category) | 0 (0.0%) | 0 (0.0%) |
| Total (Overall) | 192 (54.9%) | 158 (45.1%) |
Employment Industries by Sex in Seligman
Employment Industries in Seligman
The major employment industries in Seligman include Accommodation & Food Services (74 | 21.1%), Agriculture, Fishing & Hunting (67 | 19.1%), Arts, Entertainment & Recreation (60 | 17.1%), Transportation & Warehousing (32 | 9.1%), and Retail Trade (23 | 6.6%).
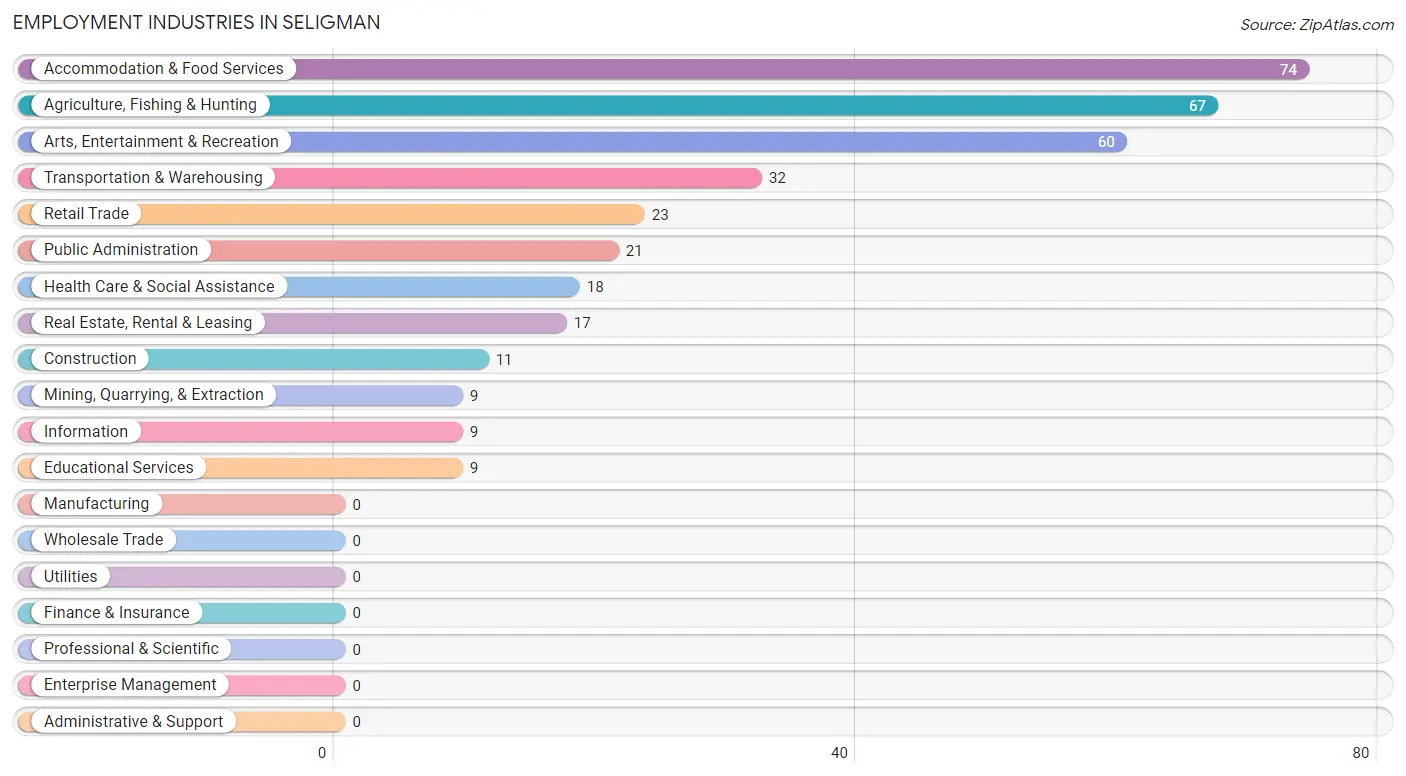
Employment Industries by Sex in Seligman
The Seligman industries that see more men than women are Agriculture, Fishing & Hunting (100.0%), Mining, Quarrying, & Extraction (100.0%), and Construction (100.0%), whereas the industries that tend to have a higher number of women are Information (100.0%), Educational Services (100.0%), and Health Care & Social Assistance (100.0%).
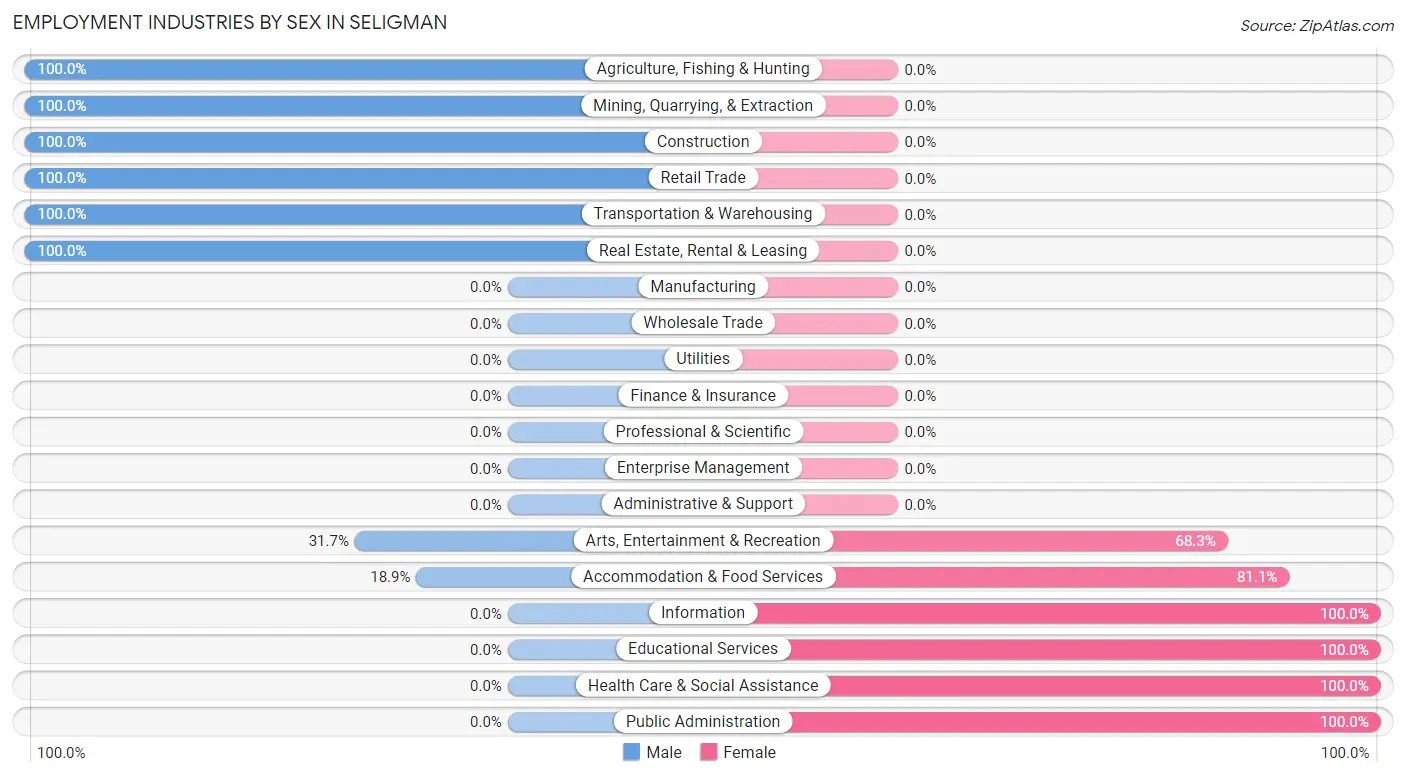
| Industry | Male | Female |
| Agriculture, Fishing & Hunting | 67 (100.0%) | 0 (0.0%) |
| Mining, Quarrying, & Extraction | 9 (100.0%) | 0 (0.0%) |
| Construction | 11 (100.0%) | 0 (0.0%) |
| Manufacturing | 0 (0.0%) | 0 (0.0%) |
| Wholesale Trade | 0 (0.0%) | 0 (0.0%) |
| Retail Trade | 23 (100.0%) | 0 (0.0%) |
| Transportation & Warehousing | 32 (100.0%) | 0 (0.0%) |
| Utilities | 0 (0.0%) | 0 (0.0%) |
| Information | 0 (0.0%) | 9 (100.0%) |
| Finance & Insurance | 0 (0.0%) | 0 (0.0%) |
| Real Estate, Rental & Leasing | 17 (100.0%) | 0 (0.0%) |
| Professional & Scientific | 0 (0.0%) | 0 (0.0%) |
| Enterprise Management | 0 (0.0%) | 0 (0.0%) |
| Administrative & Support | 0 (0.0%) | 0 (0.0%) |
| Educational Services | 0 (0.0%) | 9 (100.0%) |
| Health Care & Social Assistance | 0 (0.0%) | 18 (100.0%) |
| Arts, Entertainment & Recreation | 19 (31.7%) | 41 (68.3%) |
| Accommodation & Food Services | 14 (18.9%) | 60 (81.1%) |
| Public Administration | 0 (0.0%) | 21 (100.0%) |
| Total | 192 (54.9%) | 158 (45.1%) |
Education in Seligman
School Enrollment in Seligman
The most common levels of schooling among the 61 students in Seligman are high school (23 | 37.7%), college / undergraduate (21 | 34.4%), and elementary school (17 | 27.9%).
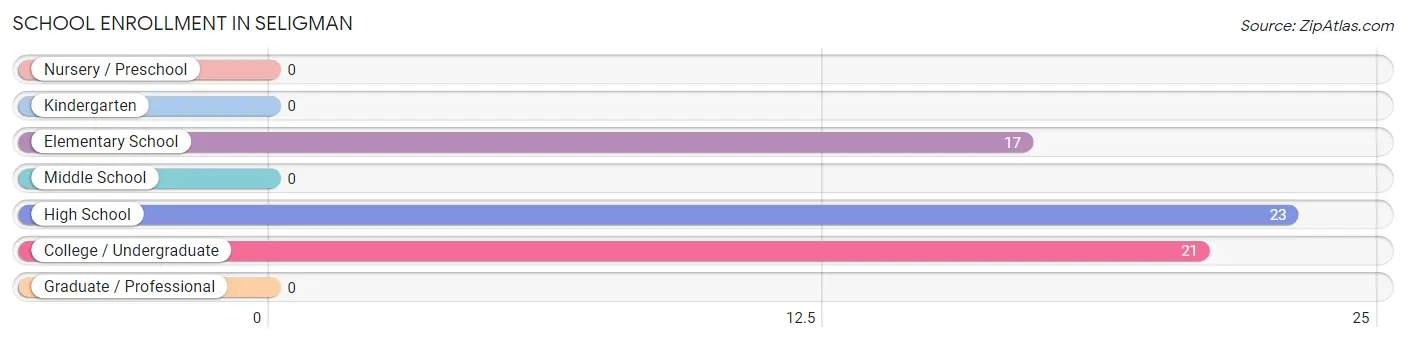
| School Level | # Students | % Students |
| Nursery / Preschool | 0 | 0.0% |
| Kindergarten | 0 | 0.0% |
| Elementary School | 17 | 27.9% |
| Middle School | 0 | 0.0% |
| High School | 23 | 37.7% |
| College / Undergraduate | 21 | 34.4% |
| Graduate / Professional | 0 | 0.0% |
| Total | 61 | 100.0% |
School Enrollment by Age by Funding Source in Seligman
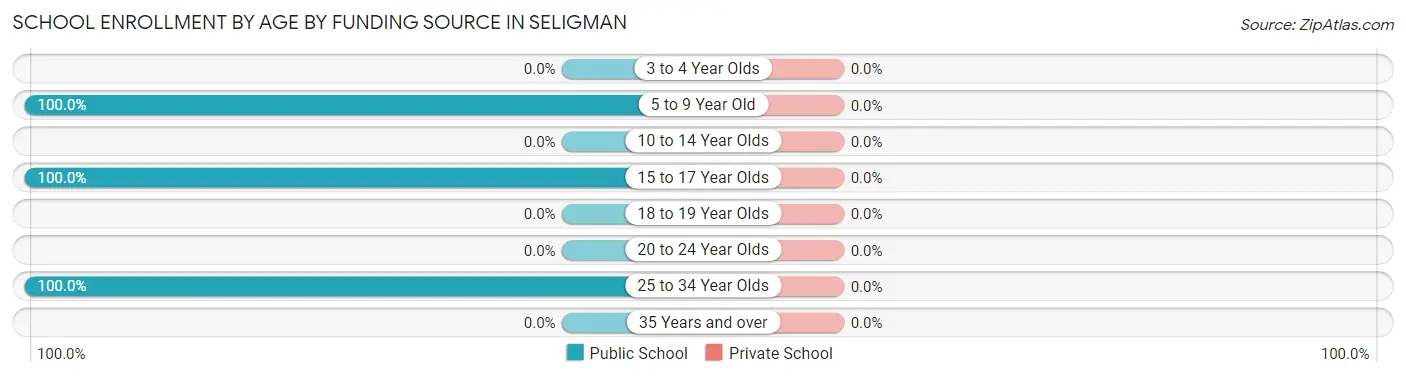
| Age Bracket | Public School | Private School |
| 3 to 4 Year Olds | 0 (0.0%) | 0 (0.0%) |
| 5 to 9 Year Old | 17 (100.0%) | 0 (0.0%) |
| 10 to 14 Year Olds | 0 (0.0%) | 0 (0.0%) |
| 15 to 17 Year Olds | 23 (100.0%) | 0 (0.0%) |
| 18 to 19 Year Olds | 0 (0.0%) | 0 (0.0%) |
| 20 to 24 Year Olds | 0 (0.0%) | 0 (0.0%) |
| 25 to 34 Year Olds | 21 (100.0%) | 0 (0.0%) |
| 35 Years and over | 0 (0.0%) | 0 (0.0%) |
| Total | 61 (100.0%) | 0 (0.0%) |
Educational Attainment by Field of Study in Seligman
Arts & humanities (27 | 37.5%), bio, nature & agricultural (18 | 25.0%), business (14 | 19.4%), and social sciences (13 | 18.1%) are the most common fields of study among 72 individuals in Seligman who have obtained a bachelor's degree or higher.
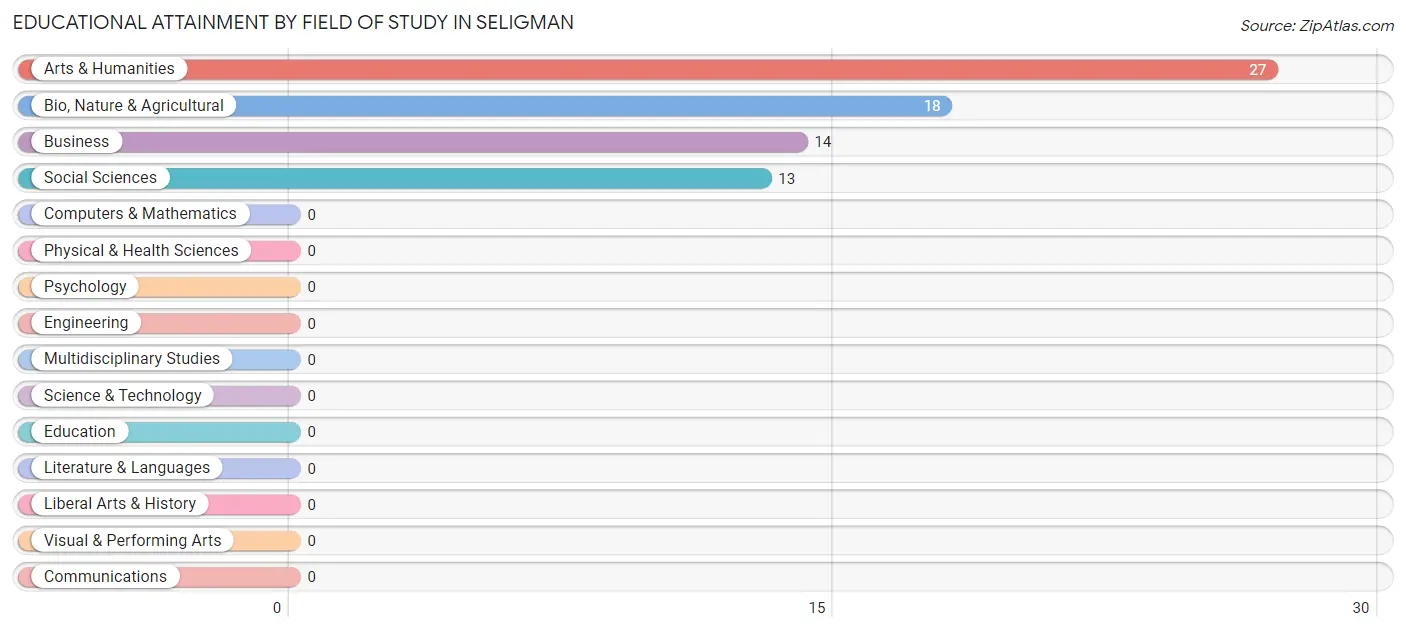
| Field of Study | # Graduates | % Graduates |
| Computers & Mathematics | 0 | 0.0% |
| Bio, Nature & Agricultural | 18 | 25.0% |
| Physical & Health Sciences | 0 | 0.0% |
| Psychology | 0 | 0.0% |
| Social Sciences | 13 | 18.1% |
| Engineering | 0 | 0.0% |
| Multidisciplinary Studies | 0 | 0.0% |
| Science & Technology | 0 | 0.0% |
| Business | 14 | 19.4% |
| Education | 0 | 0.0% |
| Literature & Languages | 0 | 0.0% |
| Liberal Arts & History | 0 | 0.0% |
| Visual & Performing Arts | 0 | 0.0% |
| Communications | 0 | 0.0% |
| Arts & Humanities | 27 | 37.5% |
| Total | 72 | 100.0% |
Transportation & Commute in Seligman
Vehicle Availability by Sex in Seligman
The most prevalent vehicle ownership categories in Seligman are males with 2 vehicles (75, accounting for 39.1%) and females with 2 vehicles (98, making up 47.5%).
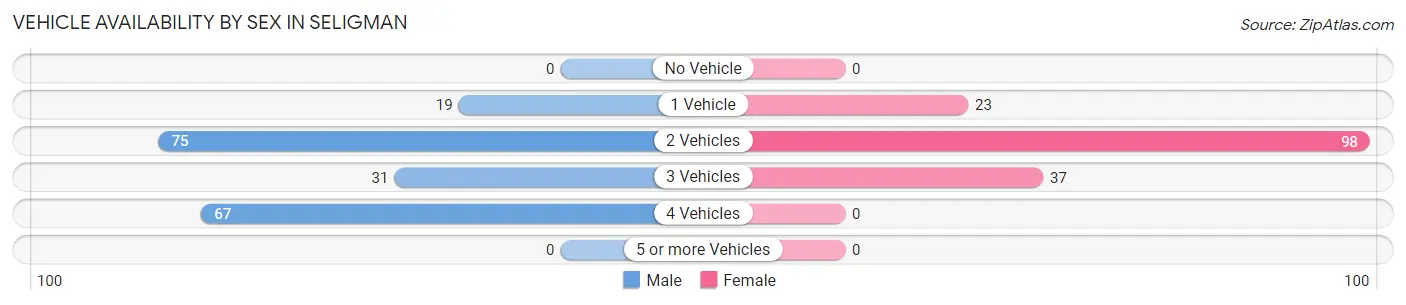
| Vehicles Available | Male | Female |
| No Vehicle | 0 (0.0%) | 0 (0.0%) |
| 1 Vehicle | 19 (9.9%) | 23 (14.6%) |
| 2 Vehicles | 75 (39.1%) | 98 (62.0%) |
| 3 Vehicles | 31 (16.2%) | 37 (23.4%) |
| 4 Vehicles | 67 (34.9%) | 0 (0.0%) |
| 5 or more Vehicles | 0 (0.0%) | 0 (0.0%) |
| Total | 192 (100.0%) | 158 (100.0%) |
Commute Time in Seligman
The most frequently occuring commute durations in Seligman are 10 to 14 minutes (97 commuters, 27.7%), 90 or more minutes (67 commuters, 19.1%), and less than 5 minutes (59 commuters, 16.9%).
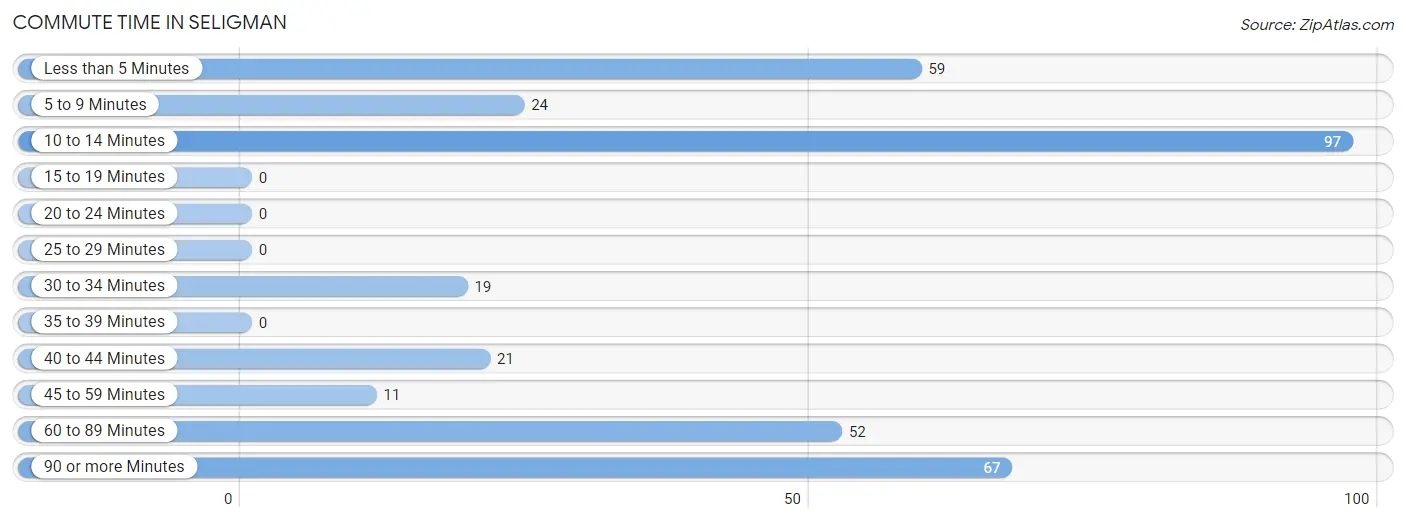
| Commute Time | # Commuters | % Commuters |
| Less than 5 Minutes | 59 | 16.9% |
| 5 to 9 Minutes | 24 | 6.9% |
| 10 to 14 Minutes | 97 | 27.7% |
| 15 to 19 Minutes | 0 | 0.0% |
| 20 to 24 Minutes | 0 | 0.0% |
| 25 to 29 Minutes | 0 | 0.0% |
| 30 to 34 Minutes | 19 | 5.4% |
| 35 to 39 Minutes | 0 | 0.0% |
| 40 to 44 Minutes | 21 | 6.0% |
| 45 to 59 Minutes | 11 | 3.1% |
| 60 to 89 Minutes | 52 | 14.9% |
| 90 or more Minutes | 67 | 19.1% |
Commute Time by Sex in Seligman
The most common commute times in Seligman are 90 or more minutes (67 commuters, 34.9%) for males and 10 to 14 minutes (88 commuters, 55.7%) for females.
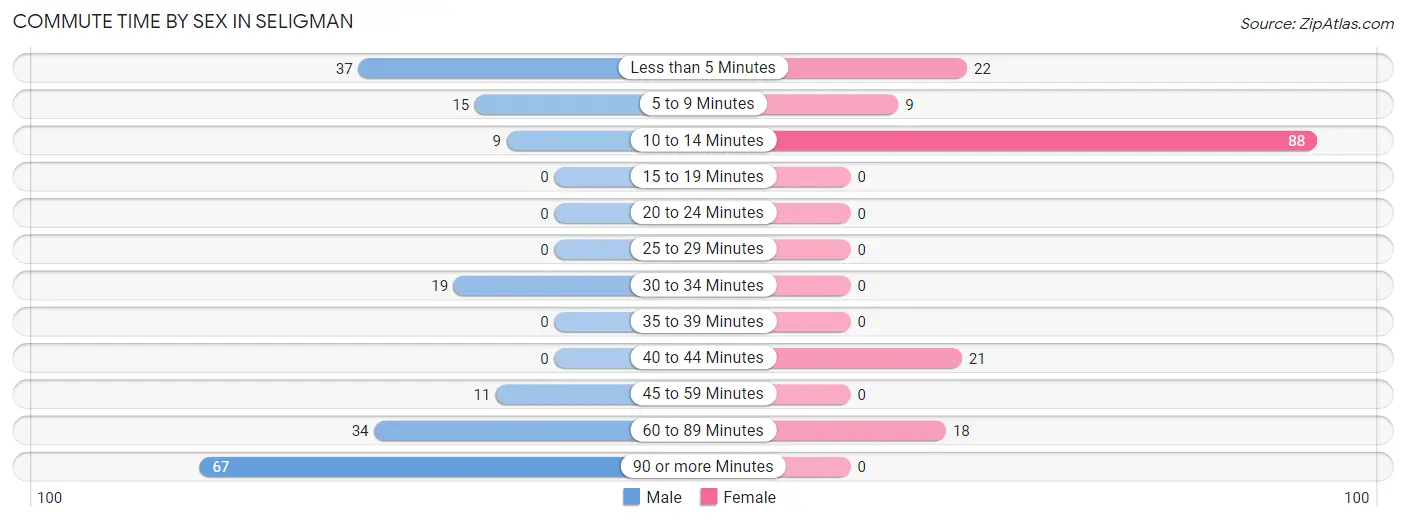
| Commute Time | Male | Female |
| Less than 5 Minutes | 37 (19.3%) | 22 (13.9%) |
| 5 to 9 Minutes | 15 (7.8%) | 9 (5.7%) |
| 10 to 14 Minutes | 9 (4.7%) | 88 (55.7%) |
| 15 to 19 Minutes | 0 (0.0%) | 0 (0.0%) |
| 20 to 24 Minutes | 0 (0.0%) | 0 (0.0%) |
| 25 to 29 Minutes | 0 (0.0%) | 0 (0.0%) |
| 30 to 34 Minutes | 19 (9.9%) | 0 (0.0%) |
| 35 to 39 Minutes | 0 (0.0%) | 0 (0.0%) |
| 40 to 44 Minutes | 0 (0.0%) | 21 (13.3%) |
| 45 to 59 Minutes | 11 (5.7%) | 0 (0.0%) |
| 60 to 89 Minutes | 34 (17.7%) | 18 (11.4%) |
| 90 or more Minutes | 67 (34.9%) | 0 (0.0%) |
Time of Departure to Work by Sex in Seligman
The most frequent times of departure to work in Seligman are 6:00 AM to 6:29 AM (95, 49.5%) for males and 7:30 AM to 7:59 AM (74, 46.8%) for females.
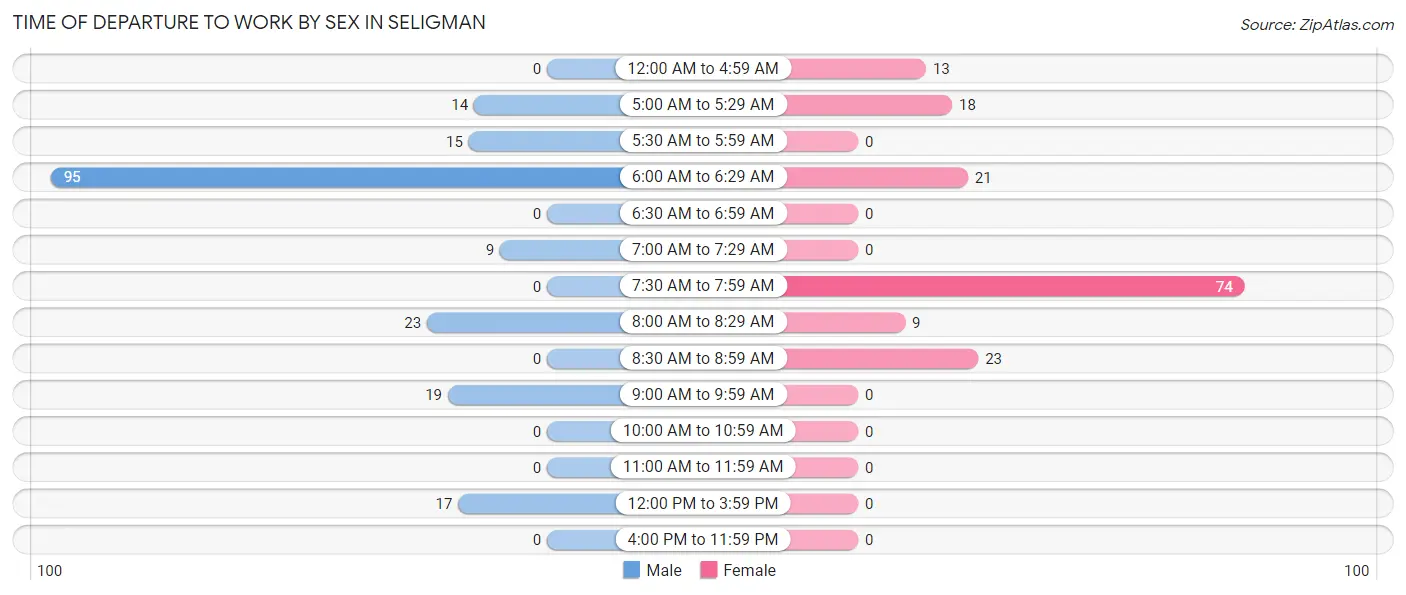
| Time of Departure | Male | Female |
| 12:00 AM to 4:59 AM | 0 (0.0%) | 13 (8.2%) |
| 5:00 AM to 5:29 AM | 14 (7.3%) | 18 (11.4%) |
| 5:30 AM to 5:59 AM | 15 (7.8%) | 0 (0.0%) |
| 6:00 AM to 6:29 AM | 95 (49.5%) | 21 (13.3%) |
| 6:30 AM to 6:59 AM | 0 (0.0%) | 0 (0.0%) |
| 7:00 AM to 7:29 AM | 9 (4.7%) | 0 (0.0%) |
| 7:30 AM to 7:59 AM | 0 (0.0%) | 74 (46.8%) |
| 8:00 AM to 8:29 AM | 23 (12.0%) | 9 (5.7%) |
| 8:30 AM to 8:59 AM | 0 (0.0%) | 23 (14.6%) |
| 9:00 AM to 9:59 AM | 19 (9.9%) | 0 (0.0%) |
| 10:00 AM to 10:59 AM | 0 (0.0%) | 0 (0.0%) |
| 11:00 AM to 11:59 AM | 0 (0.0%) | 0 (0.0%) |
| 12:00 PM to 3:59 PM | 17 (8.8%) | 0 (0.0%) |
| 4:00 PM to 11:59 PM | 0 (0.0%) | 0 (0.0%) |
| Total | 192 (100.0%) | 158 (100.0%) |
Housing Occupancy in Seligman
Occupancy by Ownership in Seligman
Of the total 293 dwellings in Seligman, owner-occupied units account for 156 (53.2%), while renter-occupied units make up 137 (46.8%).
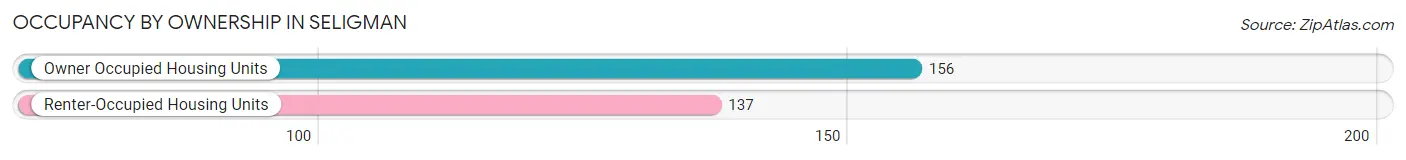
| Occupancy | # Housing Units | % Housing Units |
| Owner Occupied Housing Units | 156 | 53.2% |
| Renter-Occupied Housing Units | 137 | 46.8% |
| Total Occupied Housing Units | 293 | 100.0% |
Occupancy by Household Size in Seligman
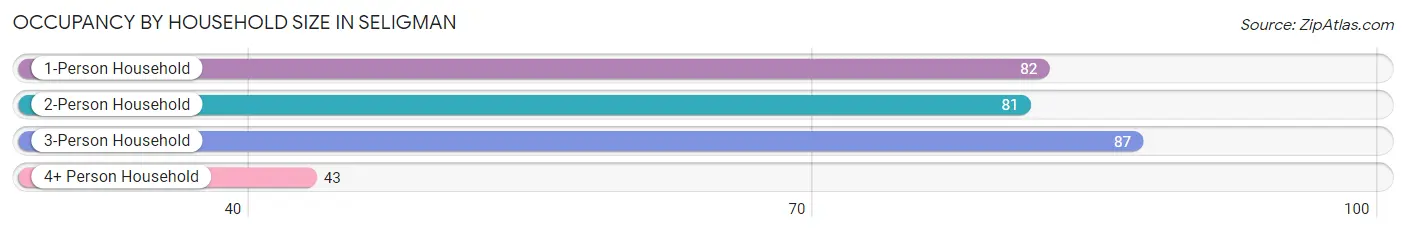
| Household Size | # Housing Units | % Housing Units |
| 1-Person Household | 82 | 28.0% |
| 2-Person Household | 81 | 27.7% |
| 3-Person Household | 87 | 29.7% |
| 4+ Person Household | 43 | 14.7% |
| Total Housing Units | 293 | 100.0% |
Occupancy by Ownership by Household Size in Seligman
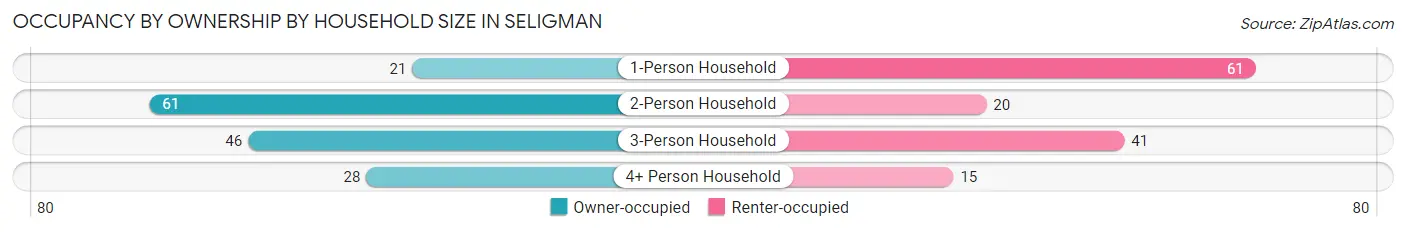
| Household Size | Owner-occupied | Renter-occupied |
| 1-Person Household | 21 (25.6%) | 61 (74.4%) |
| 2-Person Household | 61 (75.3%) | 20 (24.7%) |
| 3-Person Household | 46 (52.9%) | 41 (47.1%) |
| 4+ Person Household | 28 (65.1%) | 15 (34.9%) |
| Total Housing Units | 156 (53.2%) | 137 (46.8%) |
Occupancy by Educational Attainment in Seligman
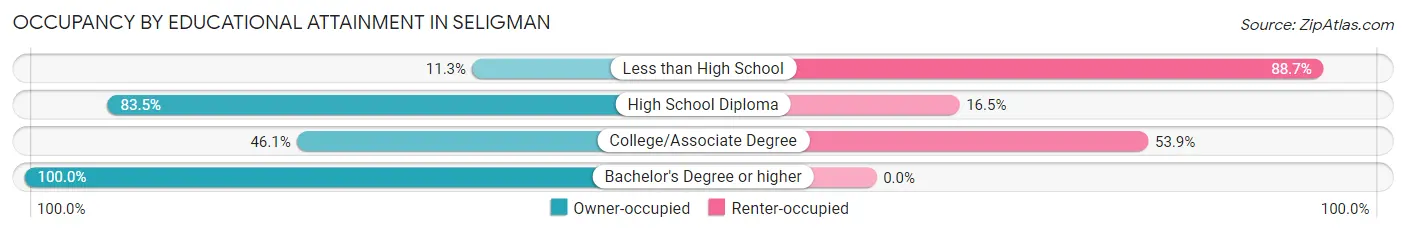
| Household Size | Owner-occupied | Renter-occupied |
| Less than High School | 6 (11.3%) | 47 (88.7%) |
| High School Diploma | 71 (83.5%) | 14 (16.5%) |
| College/Associate Degree | 65 (46.1%) | 76 (53.9%) |
| Bachelor's Degree or higher | 14 (100.0%) | 0 (0.0%) |
Occupancy by Age of Householder in Seligman
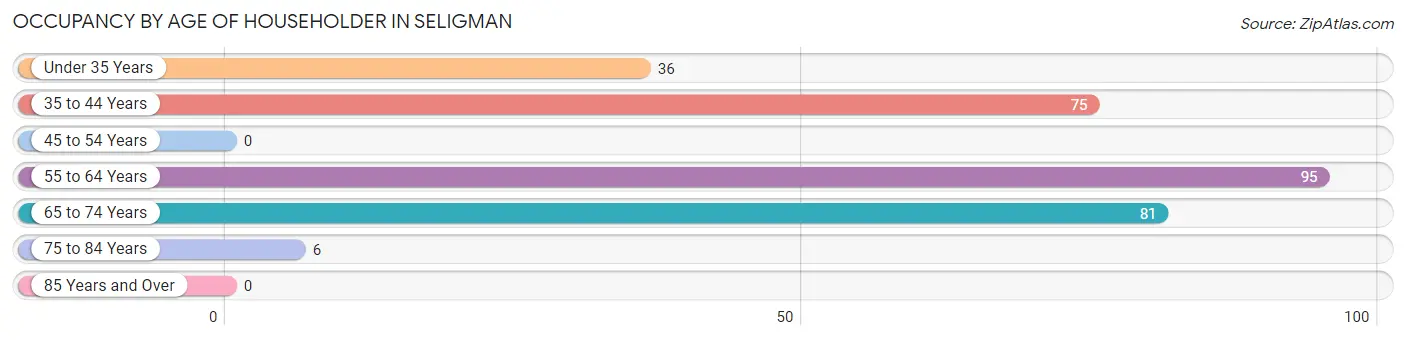
| Age Bracket | # Households | % Households |
| Under 35 Years | 36 | 12.3% |
| 35 to 44 Years | 75 | 25.6% |
| 45 to 54 Years | 0 | 0.0% |
| 55 to 64 Years | 95 | 32.4% |
| 65 to 74 Years | 81 | 27.7% |
| 75 to 84 Years | 6 | 2.1% |
| 85 Years and Over | 0 | 0.0% |
| Total | 293 | 100.0% |
Housing Finances in Seligman
Median Income by Occupancy in Seligman
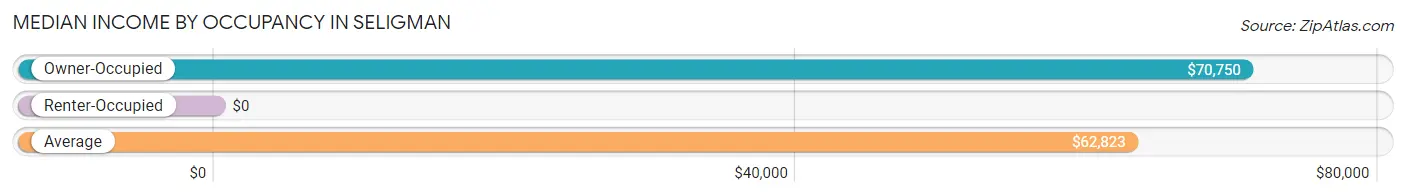
| Occupancy Type | # Households | Median Income |
| Owner-Occupied | 156 (53.2%) | $70,750 |
| Renter-Occupied | 137 (46.8%) | $0 |
| Average | 293 (100.0%) | $62,823 |
Occupancy by Householder Income Bracket in Seligman
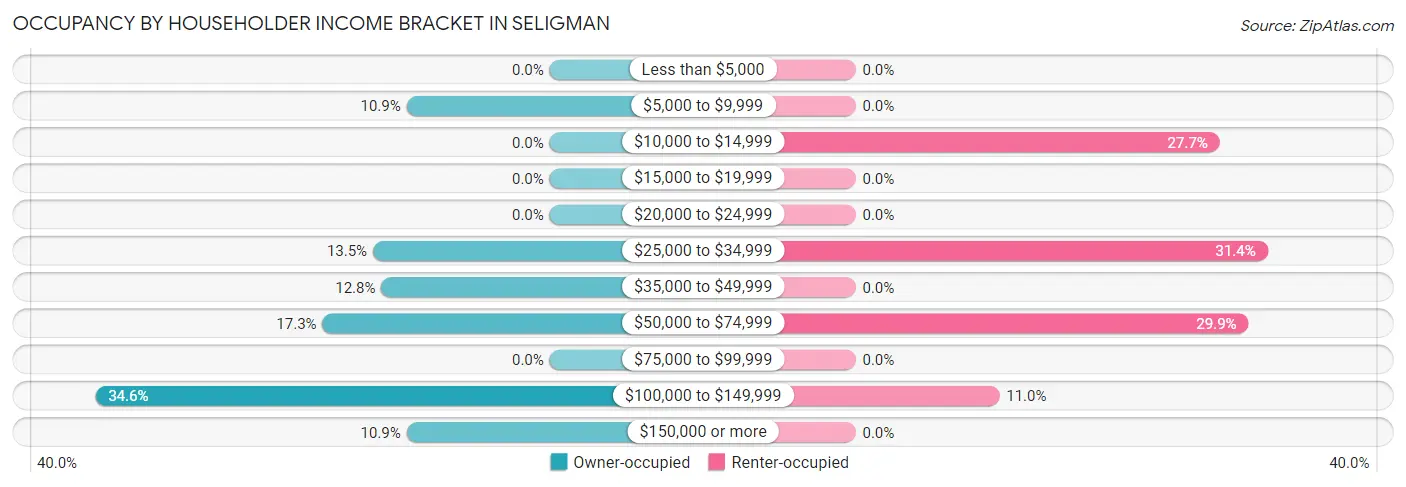
| Income Bracket | Owner-occupied | Renter-occupied |
| Less than $5,000 | 0 (0.0%) | 0 (0.0%) |
| $5,000 to $9,999 | 17 (10.9%) | 0 (0.0%) |
| $10,000 to $14,999 | 0 (0.0%) | 38 (27.7%) |
| $15,000 to $19,999 | 0 (0.0%) | 0 (0.0%) |
| $20,000 to $24,999 | 0 (0.0%) | 0 (0.0%) |
| $25,000 to $34,999 | 21 (13.5%) | 43 (31.4%) |
| $35,000 to $49,999 | 20 (12.8%) | 0 (0.0%) |
| $50,000 to $74,999 | 27 (17.3%) | 41 (29.9%) |
| $75,000 to $99,999 | 0 (0.0%) | 0 (0.0%) |
| $100,000 to $149,999 | 54 (34.6%) | 15 (11.0%) |
| $150,000 or more | 17 (10.9%) | 0 (0.0%) |
| Total | 156 (100.0%) | 137 (100.0%) |
Monthly Housing Cost Tiers in Seligman
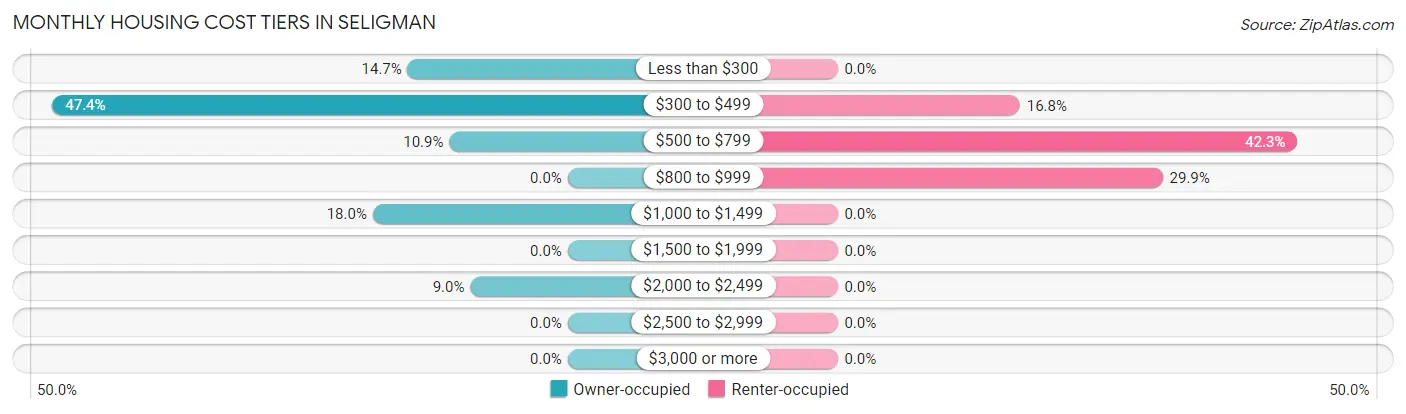
| Monthly Cost | Owner-occupied | Renter-occupied |
| Less than $300 | 23 (14.7%) | 0 (0.0%) |
| $300 to $499 | 74 (47.4%) | 23 (16.8%) |
| $500 to $799 | 17 (10.9%) | 58 (42.3%) |
| $800 to $999 | 0 (0.0%) | 41 (29.9%) |
| $1,000 to $1,499 | 28 (17.9%) | 0 (0.0%) |
| $1,500 to $1,999 | 0 (0.0%) | 0 (0.0%) |
| $2,000 to $2,499 | 14 (9.0%) | 0 (0.0%) |
| $2,500 to $2,999 | 0 (0.0%) | 0 (0.0%) |
| $3,000 or more | 0 (0.0%) | 0 (0.0%) |
| Total | 156 (100.0%) | 137 (100.0%) |
Physical Housing Characteristics in Seligman
Housing Structures in Seligman
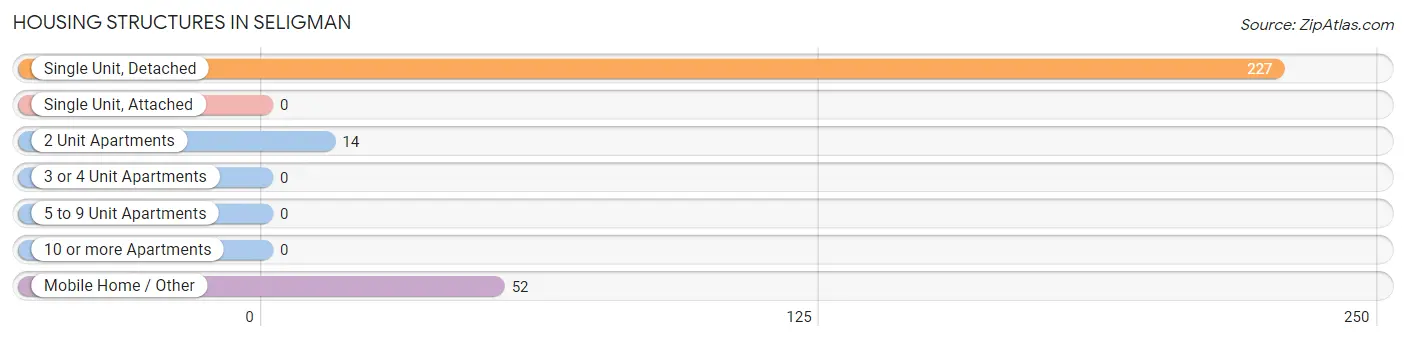
| Structure Type | # Housing Units | % Housing Units |
| Single Unit, Detached | 227 | 77.5% |
| Single Unit, Attached | 0 | 0.0% |
| 2 Unit Apartments | 14 | 4.8% |
| 3 or 4 Unit Apartments | 0 | 0.0% |
| 5 to 9 Unit Apartments | 0 | 0.0% |
| 10 or more Apartments | 0 | 0.0% |
| Mobile Home / Other | 52 | 17.7% |
| Total | 293 | 100.0% |
Housing Structures by Occupancy in Seligman
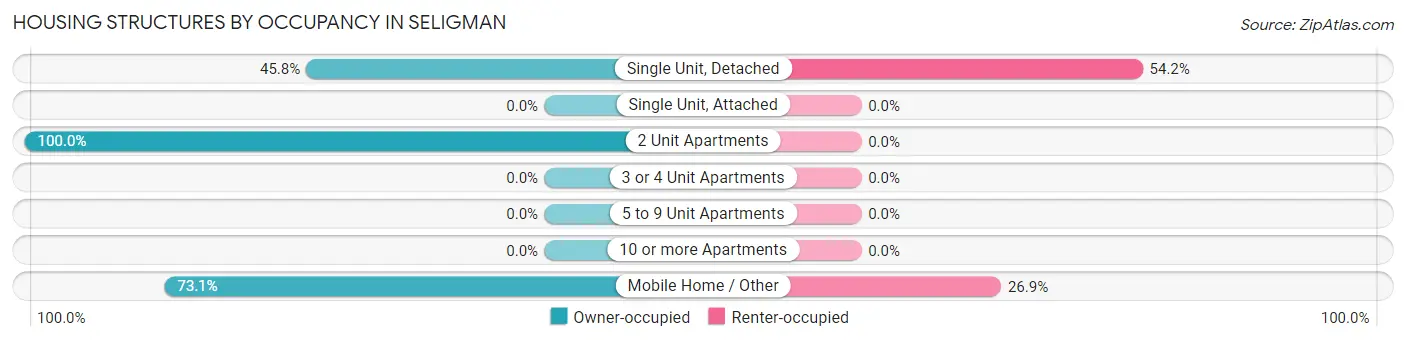
| Structure Type | Owner-occupied | Renter-occupied |
| Single Unit, Detached | 104 (45.8%) | 123 (54.2%) |
| Single Unit, Attached | 0 (0.0%) | 0 (0.0%) |
| 2 Unit Apartments | 14 (100.0%) | 0 (0.0%) |
| 3 or 4 Unit Apartments | 0 (0.0%) | 0 (0.0%) |
| 5 to 9 Unit Apartments | 0 (0.0%) | 0 (0.0%) |
| 10 or more Apartments | 0 (0.0%) | 0 (0.0%) |
| Mobile Home / Other | 38 (73.1%) | 14 (26.9%) |
| Total | 156 (53.2%) | 137 (46.8%) |
Housing Structures by Number of Rooms in Seligman
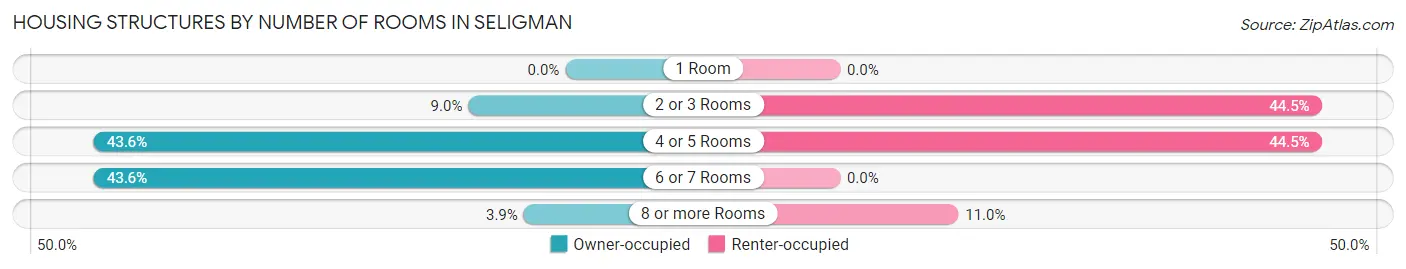
| Number of Rooms | Owner-occupied | Renter-occupied |
| 1 Room | 0 (0.0%) | 0 (0.0%) |
| 2 or 3 Rooms | 14 (9.0%) | 61 (44.5%) |
| 4 or 5 Rooms | 68 (43.6%) | 61 (44.5%) |
| 6 or 7 Rooms | 68 (43.6%) | 0 (0.0%) |
| 8 or more Rooms | 6 (3.8%) | 15 (11.0%) |
| Total | 156 (100.0%) | 137 (100.0%) |
Housing Structure by Heating Type in Seligman
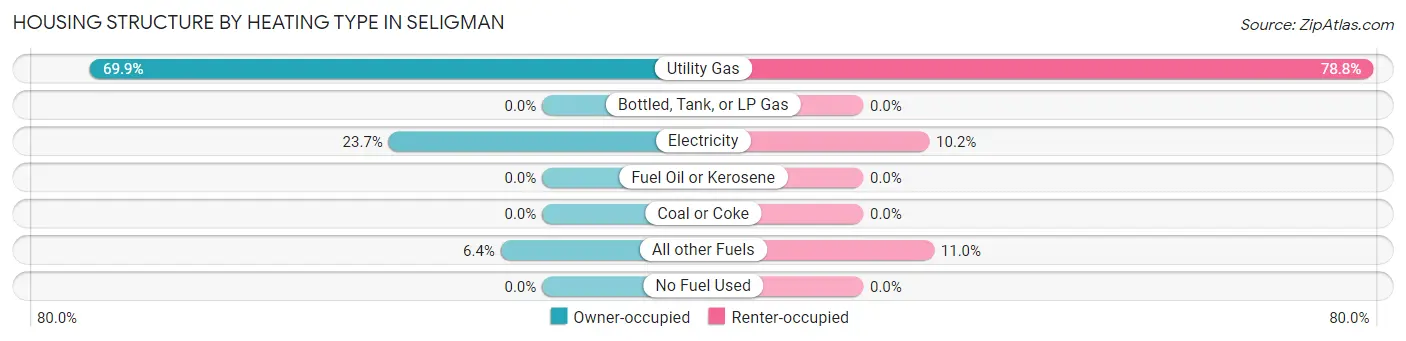
| Heating Type | Owner-occupied | Renter-occupied |
| Utility Gas | 109 (69.9%) | 108 (78.8%) |
| Bottled, Tank, or LP Gas | 0 (0.0%) | 0 (0.0%) |
| Electricity | 37 (23.7%) | 14 (10.2%) |
| Fuel Oil or Kerosene | 0 (0.0%) | 0 (0.0%) |
| Coal or Coke | 0 (0.0%) | 0 (0.0%) |
| All other Fuels | 10 (6.4%) | 15 (11.0%) |
| No Fuel Used | 0 (0.0%) | 0 (0.0%) |
| Total | 156 (100.0%) | 137 (100.0%) |
Household Vehicle Usage in Seligman
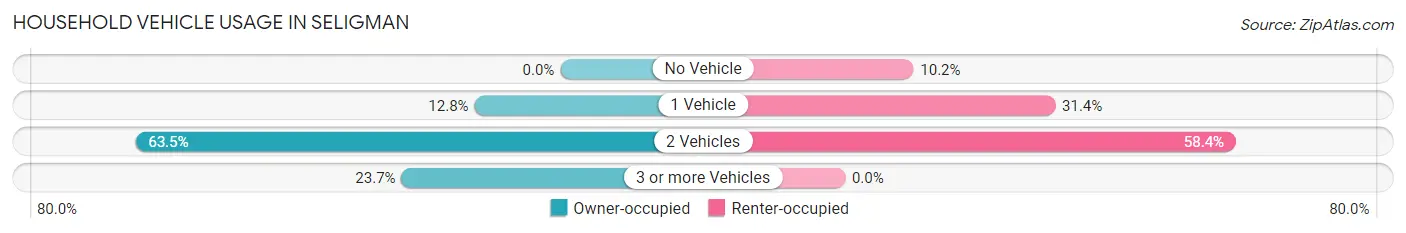
| Vehicles per Household | Owner-occupied | Renter-occupied |
| No Vehicle | 0 (0.0%) | 14 (10.2%) |
| 1 Vehicle | 20 (12.8%) | 43 (31.4%) |
| 2 Vehicles | 99 (63.5%) | 80 (58.4%) |
| 3 or more Vehicles | 37 (23.7%) | 0 (0.0%) |
| Total | 156 (100.0%) | 137 (100.0%) |
Real Estate & Mortgages in Seligman
Real Estate and Mortgage Overview in Seligman
| Characteristic | Without Mortgage | With Mortgage |
| Housing Units | 91 | 65 |
| Median Property Value | $96,000 | $204,400 |
| Median Household Income | $71,875 | $17 |
| Monthly Housing Costs | $405 | $0 |
| Real Estate Taxes | $902 | $17 |
Property Value by Mortgage Status in Seligman
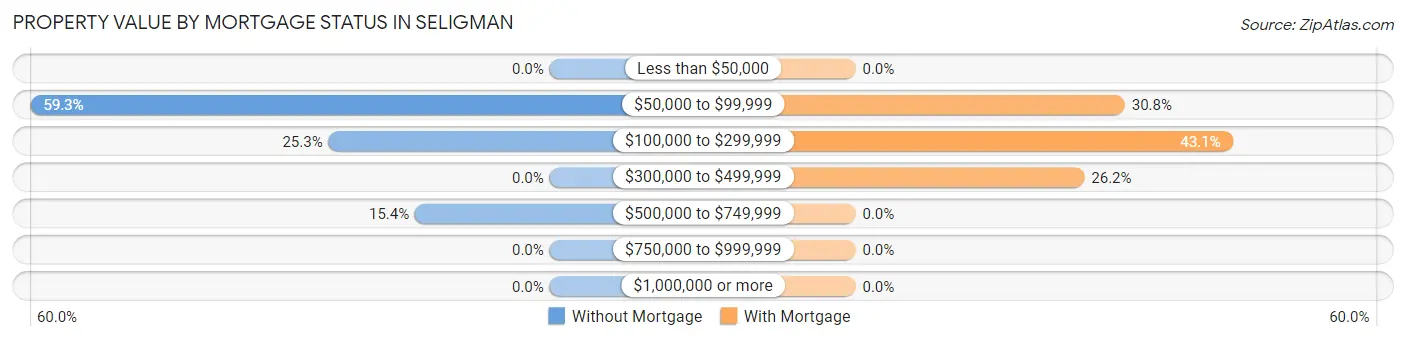
| Property Value | Without Mortgage | With Mortgage |
| Less than $50,000 | 0 (0.0%) | 0 (0.0%) |
| $50,000 to $99,999 | 54 (59.3%) | 20 (30.8%) |
| $100,000 to $299,999 | 23 (25.3%) | 28 (43.1%) |
| $300,000 to $499,999 | 0 (0.0%) | 17 (26.2%) |
| $500,000 to $749,999 | 14 (15.4%) | 0 (0.0%) |
| $750,000 to $999,999 | 0 (0.0%) | 0 (0.0%) |
| $1,000,000 or more | 0 (0.0%) | 0 (0.0%) |
| Total | 91 (100.0%) | 65 (100.0%) |
Household Income by Mortgage Status in Seligman
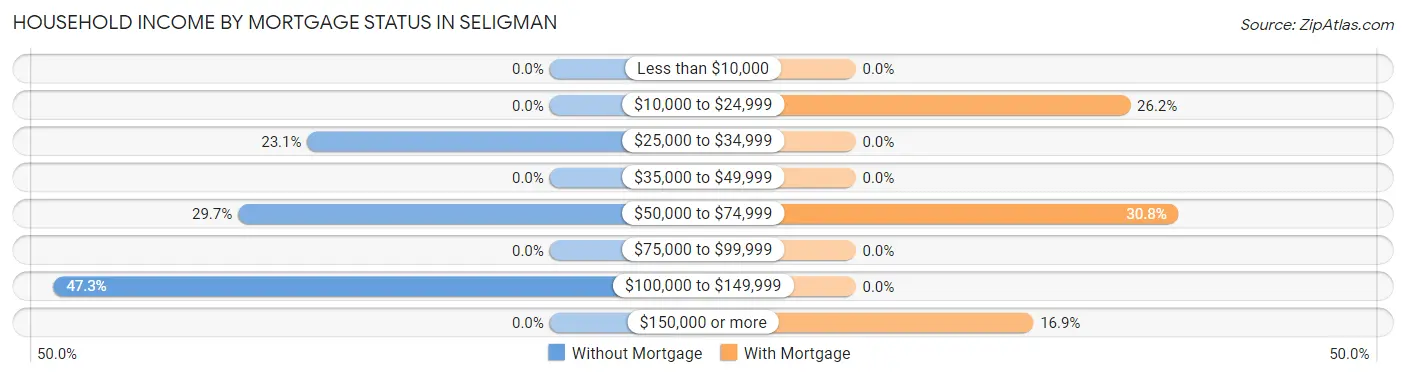
| Household Income | Without Mortgage | With Mortgage |
| Less than $10,000 | 0 (0.0%) | 0 (0.0%) |
| $10,000 to $24,999 | 0 (0.0%) | 17 (26.2%) |
| $25,000 to $34,999 | 21 (23.1%) | 0 (0.0%) |
| $35,000 to $49,999 | 0 (0.0%) | 0 (0.0%) |
| $50,000 to $74,999 | 27 (29.7%) | 20 (30.8%) |
| $75,000 to $99,999 | 0 (0.0%) | 0 (0.0%) |
| $100,000 to $149,999 | 43 (47.2%) | 0 (0.0%) |
| $150,000 or more | 0 (0.0%) | 11 (16.9%) |
| Total | 91 (100.0%) | 65 (100.0%) |
Property Value to Household Income Ratio in Seligman
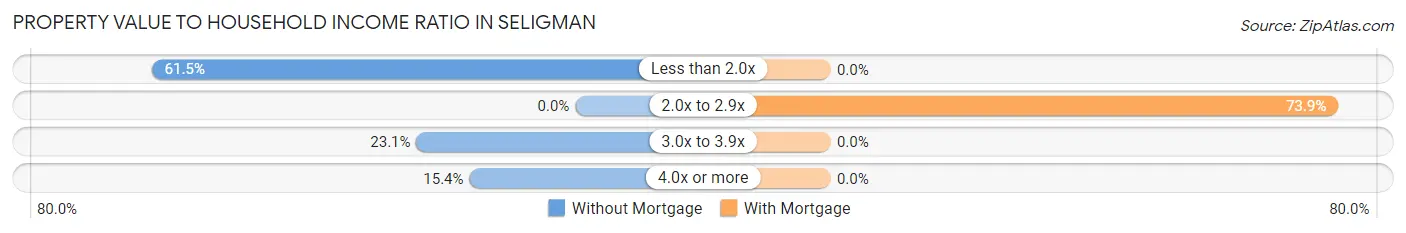
| Value-to-Income Ratio | Without Mortgage | With Mortgage |
| Less than 2.0x | 56 (61.5%) | 0 (0.0%) |
| 2.0x to 2.9x | 0 (0.0%) | 48 (73.9%) |
| 3.0x to 3.9x | 21 (23.1%) | 0 (0.0%) |
| 4.0x or more | 14 (15.4%) | 0 (0.0%) |
| Total | 91 (100.0%) | 65 (100.0%) |
Real Estate Taxes by Mortgage Status in Seligman
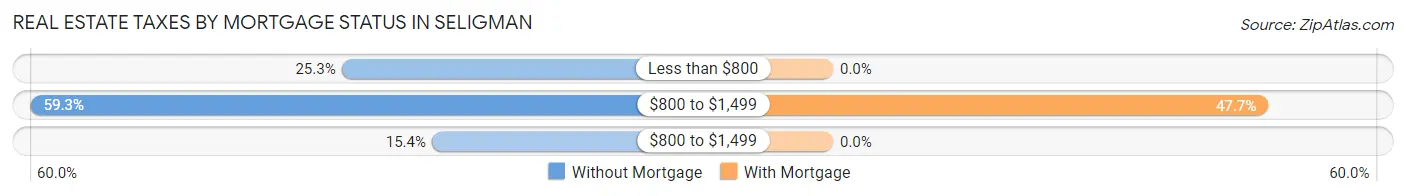
| Property Taxes | Without Mortgage | With Mortgage |
| Less than $800 | 23 (25.3%) | 0 (0.0%) |
| $800 to $1,499 | 54 (59.3%) | 31 (47.7%) |
| $800 to $1,499 | 14 (15.4%) | 0 (0.0%) |
| Total | 91 (100.0%) | 65 (100.0%) |
Health & Disability in Seligman
Health Insurance Coverage by Age in Seligman
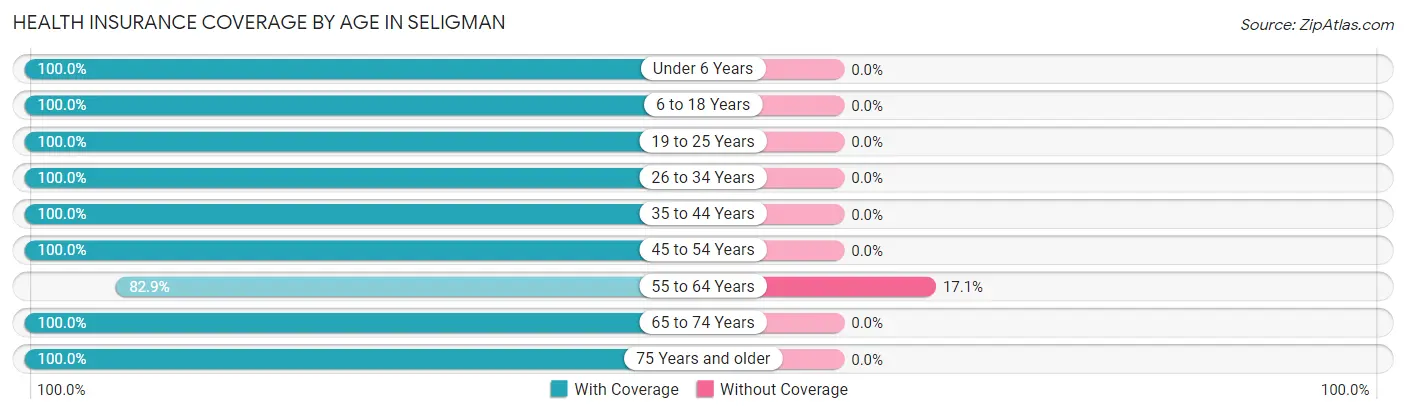
| Age Bracket | With Coverage | Without Coverage |
| Under 6 Years | 98 (100.0%) | 0 (0.0%) |
| 6 to 18 Years | 75 (100.0%) | 0 (0.0%) |
| 19 to 25 Years | 67 (100.0%) | 0 (0.0%) |
| 26 to 34 Years | 78 (100.0%) | 0 (0.0%) |
| 35 to 44 Years | 93 (100.0%) | 0 (0.0%) |
| 45 to 54 Years | 18 (100.0%) | 0 (0.0%) |
| 55 to 64 Years | 97 (82.9%) | 20 (17.1%) |
| 65 to 74 Years | 196 (100.0%) | 0 (0.0%) |
| 75 Years and older | 28 (100.0%) | 0 (0.0%) |
| Total | 750 (97.4%) | 20 (2.6%) |
Health Insurance Coverage by Citizenship Status in Seligman
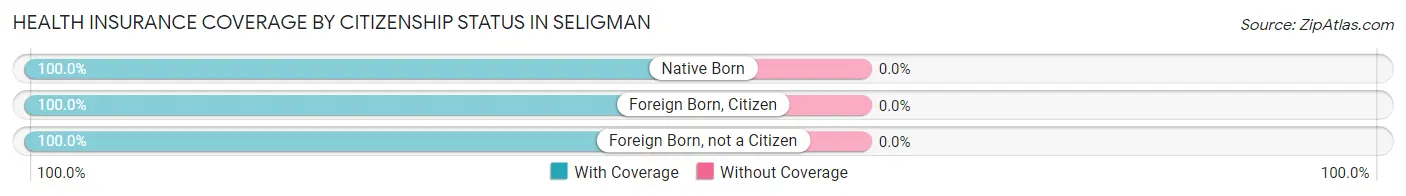
| Citizenship Status | With Coverage | Without Coverage |
| Native Born | 98 (100.0%) | 0 (0.0%) |
| Foreign Born, Citizen | 75 (100.0%) | 0 (0.0%) |
| Foreign Born, not a Citizen | 67 (100.0%) | 0 (0.0%) |
Health Insurance Coverage by Household Income in Seligman
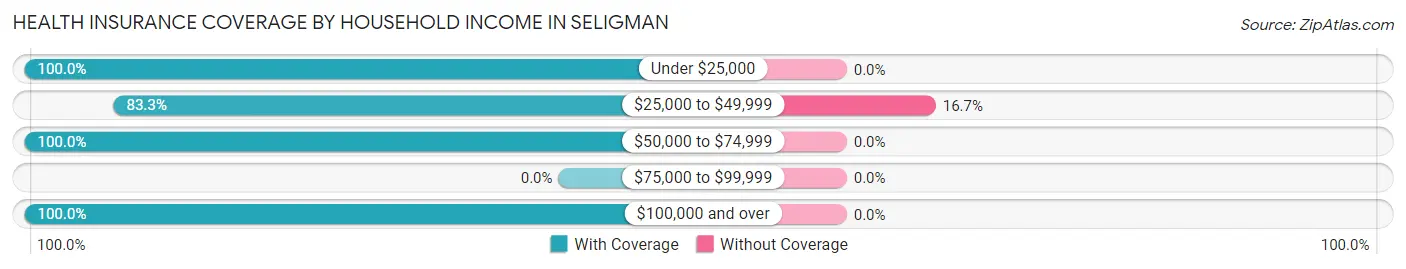
| Household Income | With Coverage | Without Coverage |
| Under $25,000 | 107 (100.0%) | 0 (0.0%) |
| $25,000 to $49,999 | 100 (83.3%) | 20 (16.7%) |
| $50,000 to $74,999 | 147 (100.0%) | 0 (0.0%) |
| $75,000 to $99,999 | 0 (0.0%) | 0 (0.0%) |
| $100,000 and over | 396 (100.0%) | 0 (0.0%) |
Public vs Private Health Insurance Coverage by Age in Seligman
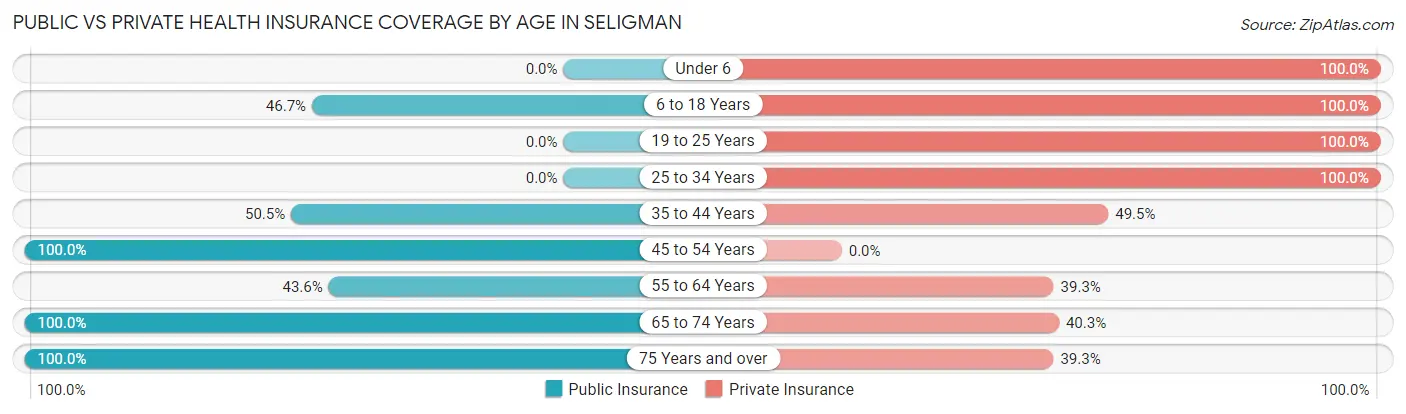
| Age Bracket | Public Insurance | Private Insurance |
| Under 6 | 0 (0.0%) | 98 (100.0%) |
| 6 to 18 Years | 35 (46.7%) | 75 (100.0%) |
| 19 to 25 Years | 0 (0.0%) | 67 (100.0%) |
| 25 to 34 Years | 0 (0.0%) | 78 (100.0%) |
| 35 to 44 Years | 47 (50.5%) | 46 (49.5%) |
| 45 to 54 Years | 18 (100.0%) | 0 (0.0%) |
| 55 to 64 Years | 51 (43.6%) | 46 (39.3%) |
| 65 to 74 Years | 196 (100.0%) | 79 (40.3%) |
| 75 Years and over | 28 (100.0%) | 11 (39.3%) |
| Total | 375 (48.7%) | 500 (64.9%) |
Disability Status by Sex by Age in Seligman
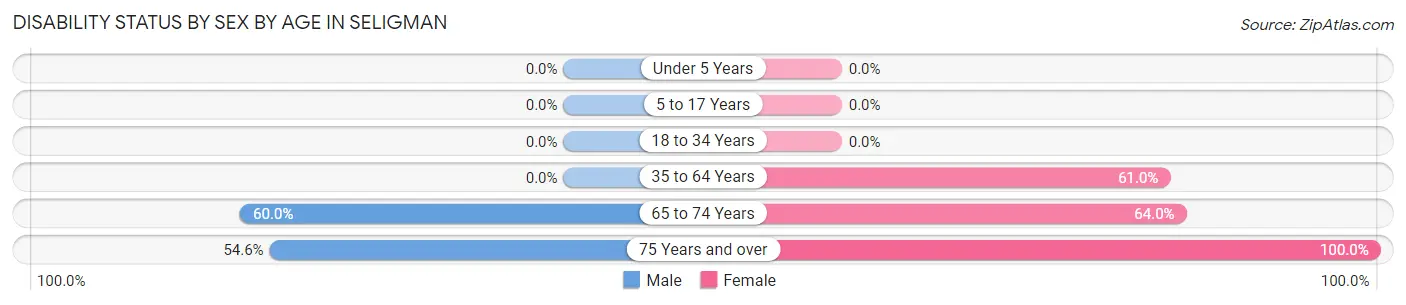
| Age Bracket | Male | Female |
| Under 5 Years | 0 (0.0%) | 0 (0.0%) |
| 5 to 17 Years | 0 (0.0%) | 0 (0.0%) |
| 18 to 34 Years | 0 (0.0%) | 0 (0.0%) |
| 35 to 64 Years | 0 (0.0%) | 64 (61.0%) |
| 65 to 74 Years | 51 (60.0%) | 71 (64.0%) |
| 75 Years and over | 6 (54.5%) | 17 (100.0%) |
Disability Class by Sex by Age in Seligman
Disability Class: Hearing Difficulty
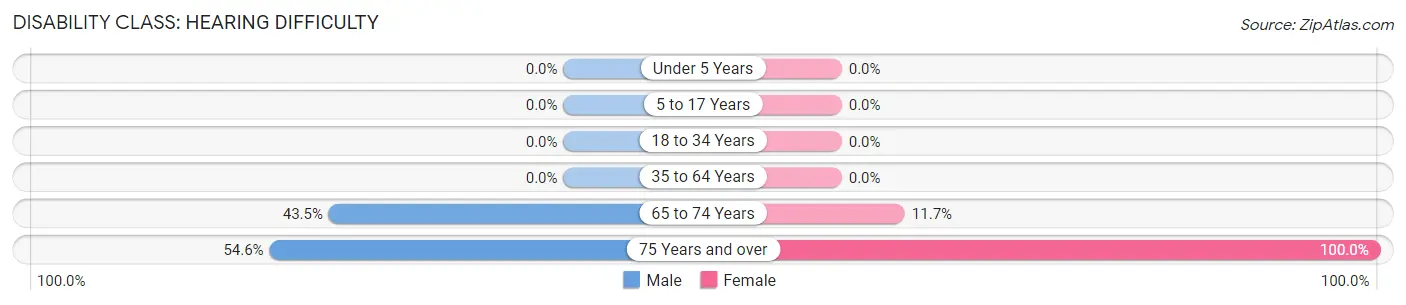
| Age Bracket | Male | Female |
| Under 5 Years | 0 (0.0%) | 0 (0.0%) |
| 5 to 17 Years | 0 (0.0%) | 0 (0.0%) |
| 18 to 34 Years | 0 (0.0%) | 0 (0.0%) |
| 35 to 64 Years | 0 (0.0%) | 0 (0.0%) |
| 65 to 74 Years | 37 (43.5%) | 13 (11.7%) |
| 75 Years and over | 6 (54.5%) | 17 (100.0%) |
Disability Class: Vision Difficulty
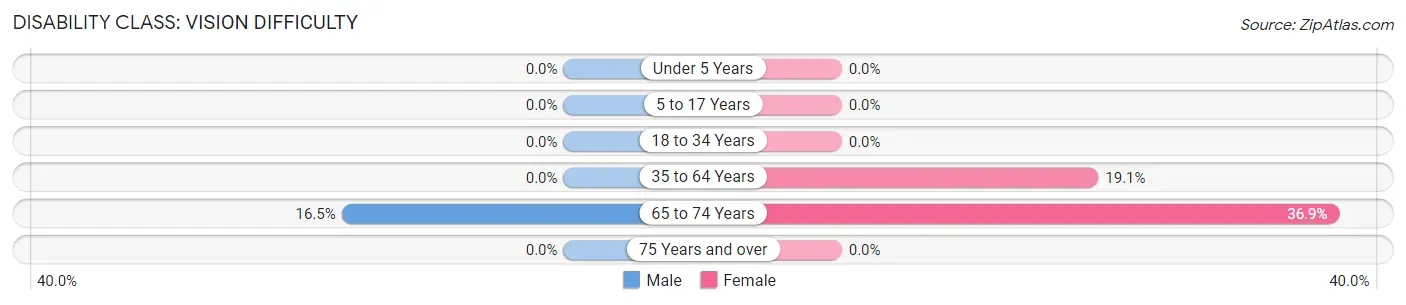
| Age Bracket | Male | Female |
| Under 5 Years | 0 (0.0%) | 0 (0.0%) |
| 5 to 17 Years | 0 (0.0%) | 0 (0.0%) |
| 18 to 34 Years | 0 (0.0%) | 0 (0.0%) |
| 35 to 64 Years | 0 (0.0%) | 20 (19.1%) |
| 65 to 74 Years | 14 (16.5%) | 41 (36.9%) |
| 75 Years and over | 0 (0.0%) | 0 (0.0%) |
Disability Class: Cognitive Difficulty
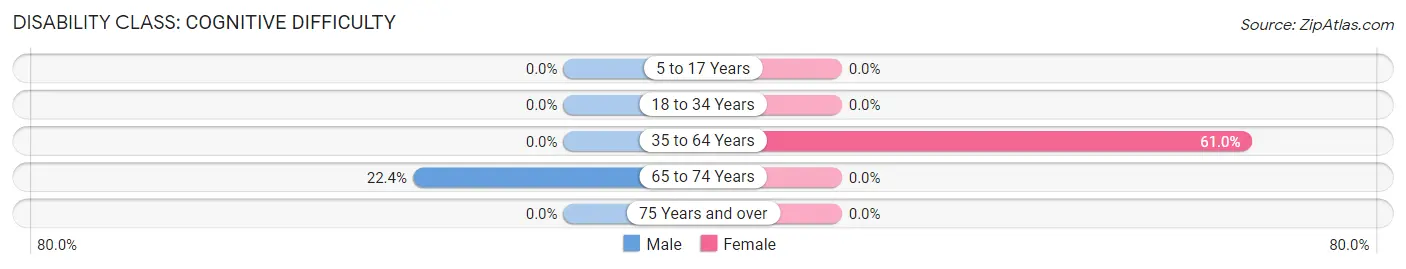
| Age Bracket | Male | Female |
| 5 to 17 Years | 0 (0.0%) | 0 (0.0%) |
| 18 to 34 Years | 0 (0.0%) | 0 (0.0%) |
| 35 to 64 Years | 0 (0.0%) | 64 (61.0%) |
| 65 to 74 Years | 19 (22.4%) | 0 (0.0%) |
| 75 Years and over | 0 (0.0%) | 0 (0.0%) |
Disability Class: Ambulatory Difficulty
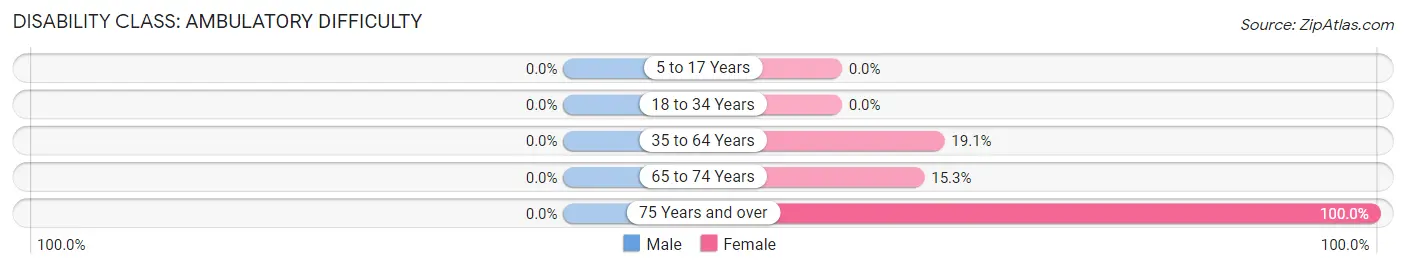
| Age Bracket | Male | Female |
| 5 to 17 Years | 0 (0.0%) | 0 (0.0%) |
| 18 to 34 Years | 0 (0.0%) | 0 (0.0%) |
| 35 to 64 Years | 0 (0.0%) | 20 (19.1%) |
| 65 to 74 Years | 0 (0.0%) | 17 (15.3%) |
| 75 Years and over | 0 (0.0%) | 17 (100.0%) |
Disability Class: Self-Care Difficulty
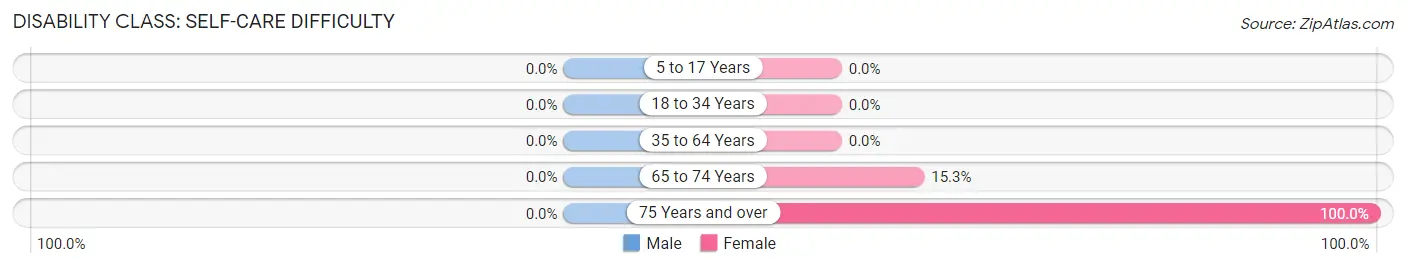
| Age Bracket | Male | Female |
| 5 to 17 Years | 0 (0.0%) | 0 (0.0%) |
| 18 to 34 Years | 0 (0.0%) | 0 (0.0%) |
| 35 to 64 Years | 0 (0.0%) | 0 (0.0%) |
| 65 to 74 Years | 0 (0.0%) | 17 (15.3%) |
| 75 Years and over | 0 (0.0%) | 17 (100.0%) |
Technology Access in Seligman
Computing Device Access in Seligman
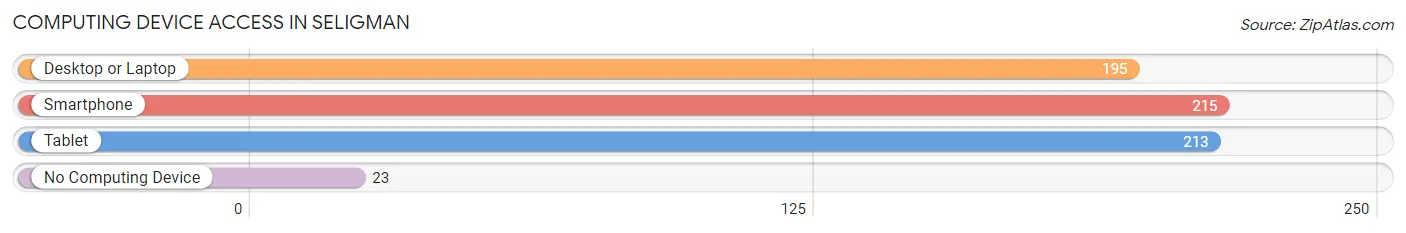
| Device Type | # Households | % Households |
| Desktop or Laptop | 195 | 66.5% |
| Smartphone | 215 | 73.4% |
| Tablet | 213 | 72.7% |
| No Computing Device | 23 | 7.9% |
| Total | 293 | 100.0% |
Internet Access in Seligman
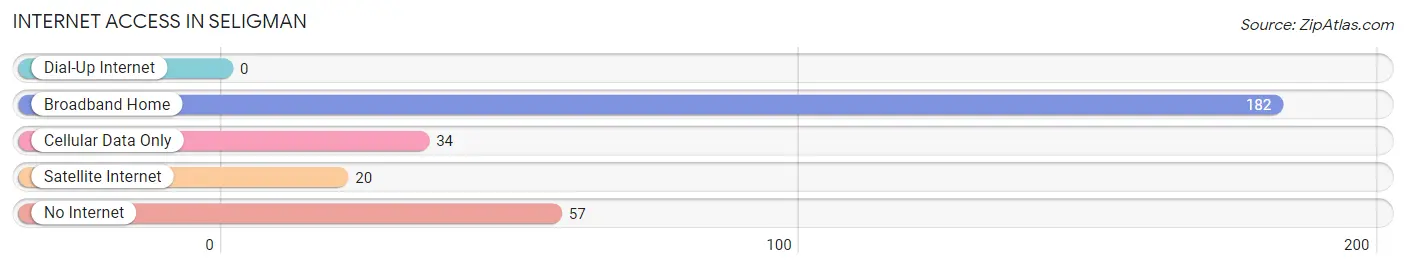
| Internet Type | # Households | % Households |
| Dial-Up Internet | 0 | 0.0% |
| Broadband Home | 182 | 62.1% |
| Cellular Data Only | 34 | 11.6% |
| Satellite Internet | 20 | 6.8% |
| No Internet | 57 | 19.5% |
| Total | 293 | 100.0% |
Seligman Summary
Seligman, Arizona is a small town located in the northwestern corner of the state, near the border of Utah and Nevada. It is situated in the heart of the historic Route 66, and is known for its unique and colorful history. The town was founded in 1886 by a group of settlers from Missouri, and was named after a prominent local rancher, Jacob Seligman.
Geography
Seligman is located in the northwestern corner of Arizona, near the border of Utah and Nevada. It is situated in the heart of the historic Route 66, and is known for its unique and colorful history. The town is located in the high desert of the Colorado Plateau, and is surrounded by the Kaibab National Forest. The elevation of the town is 5,400 feet, and the climate is semi-arid, with hot summers and cold winters.
Economy
Seligman’s economy is largely based on tourism, as it is a popular stop for travelers on the historic Route 66. The town is home to several restaurants, motels, and souvenir shops, as well as a few small businesses. The town is also home to a large number of ranchers and farmers, who raise cattle, sheep, and other livestock.
Demographics
As of the 2010 census, the population of Seligman was 1,841. The racial makeup of the town was 94.3% White, 0.3% African American, 0.9% Native American, 0.2% Asian, 0.1% Pacific Islander, 2.2% from other races, and 2.1% from two or more races. Hispanic or Latino of any race were 6.3% of the population.
The median income for a household in Seligman was $30,938, and the median income for a family was $35,625. The per capita income for the town was $14,945. About 16.2% of families and 19.2% of the population were below the poverty line, including 25.2% of those under age 18 and 10.2% of those age 65 or over.
Conclusion
Seligman, Arizona is a small town located in the northwestern corner of the state, near the border of Utah and Nevada. It is situated in the heart of the historic Route 66, and is known for its unique and colorful history. The town is home to a variety of businesses, including restaurants, motels, souvenir shops, and ranchers and farmers. The population of Seligman is 1,841, and the median income for a household is $30,938. Seligman is a popular stop for travelers on the historic Route 66, and is a great place to visit for its unique history and culture.
Common Questions
What is the Total Population of Seligman?
Total Population of Seligman is 770.
What is the Total Male Population of Seligman?
Total Male Population of Seligman is 433.
What is the Total Female Population of Seligman?
Total Female Population of Seligman is 337.
What is the Ratio of Males per 100 Females in Seligman?
There are 128.49 Males per 100 Females in Seligman.
What is the Ratio of Females per 100 Males in Seligman?
There are 77.83 Females per 100 Males in Seligman.
What is the Median Population Age in Seligman?
Median Population Age in Seligman is 40.3 Years.
What is the Average Family Size in Seligman
Average Family Size in Seligman is 3.1 People.
What is the Average Household Size in Seligman
Average Household Size in Seligman is 2.6 People.
What is Per Capita Income in Seligman?
Per Capita income in Seligman is $27,022.
What is the Median Family Income in Seligman?
Median Family Income in Seligman is $63,603.
What is the Median Household income in Seligman?
Median Household Income in Seligman is $62,823.
What is Income or Wage Gap in Seligman?
Income or Wage Gap in Seligman is 28.5%.
Women in Seligman earn 71.5 cents for every dollar earned by a man.
What is Inequality or Gini Index in Seligman?
Inequality or Gini Index in Seligman is 0.43.
How Large is the Labor Force in Seligman?
There are 350 People in the Labor Forcein in Seligman.
What is the Percentage of People in the Labor Force in Seligman?
56.5% of People are in the Labor Force in Seligman.