Bluewater, AZ
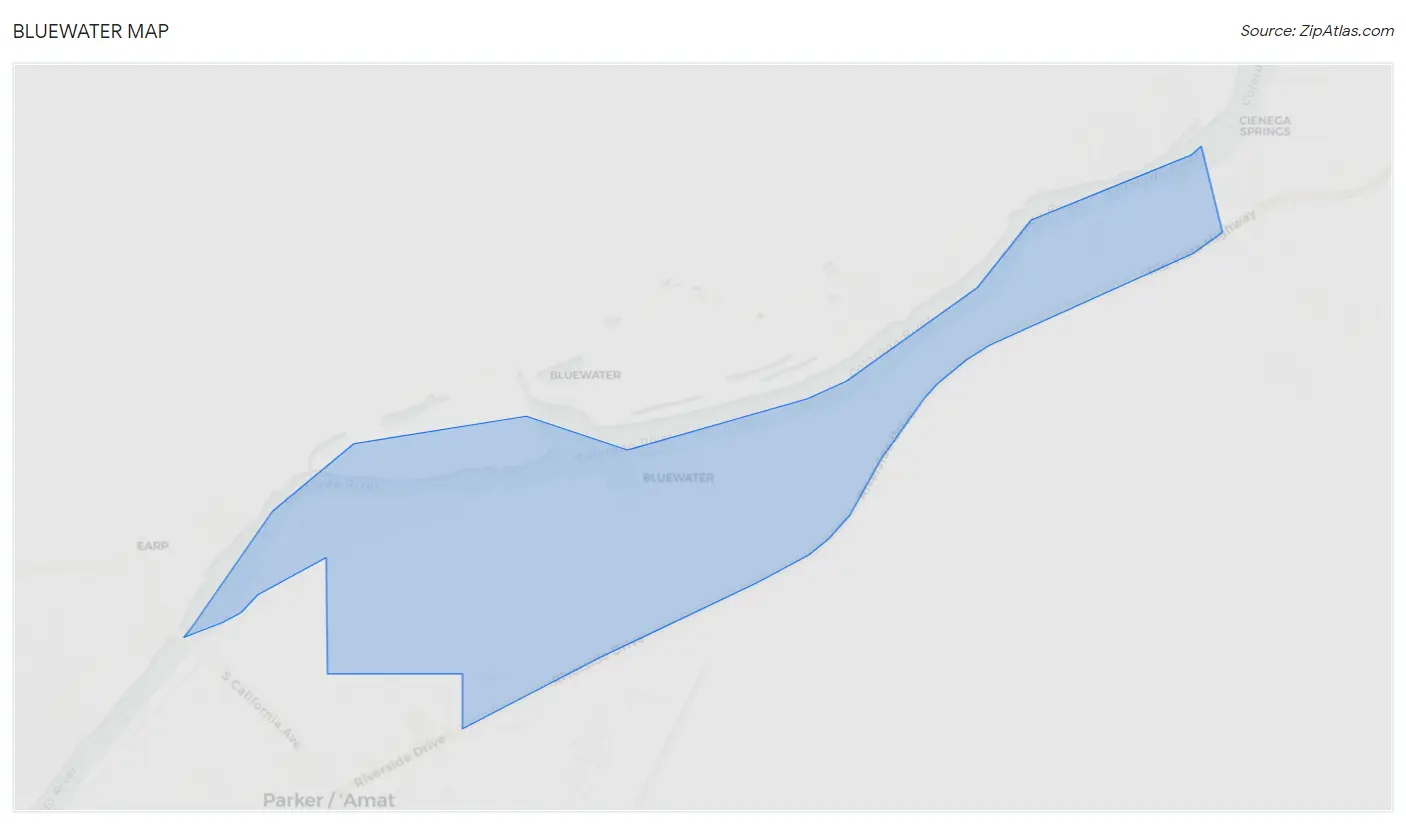
Bluewater Map
Bluewater Overview
791
TOTAL POPULATION
359
MALE POPULATION
432
FEMALE POPULATION
83.10
MALES / 100 FEMALES
120.33
FEMALES / 100 MALES
61.1
MEDIAN AGE
2.2
AVG FAMILY SIZE
1.9
AVG HOUSEHOLD SIZE
$31,751
PER CAPITA INCOME
$72,500
AVG FAMILY INCOME
$58,654
AVG HOUSEHOLD INCOME
22.7%
WAGE / INCOME GAP [ % ]
77.3¢/ $1
WAGE / INCOME GAP [ $ ]
0.41
INEQUALITY / GINI INDEX
325
LABOR FORCE [ PEOPLE ]
48.1%
PERCENT IN LABOR FORCE
2.2%
UNEMPLOYMENT RATE
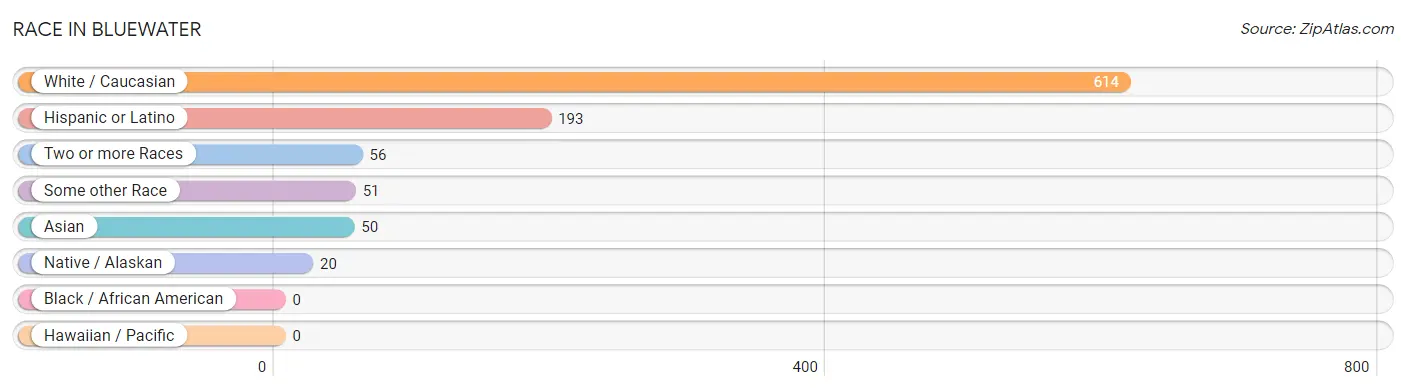
Race in Bluewater
The most populous races in Bluewater are White / Caucasian (614 | 77.6%), Hispanic or Latino (193 | 24.4%), and Two or more Races (56 | 7.1%).
| Race | # Population | % Population |
| Asian | 50 | 6.3% |
| Black / African American | 0 | 0.0% |
| Hawaiian / Pacific | 0 | 0.0% |
| Hispanic or Latino | 193 | 24.4% |
| Native / Alaskan | 20 | 2.5% |
| White / Caucasian | 614 | 77.6% |
| Two or more Races | 56 | 7.1% |
| Some other Race | 51 | 6.5% |
| Total | 791 | 100.0% |
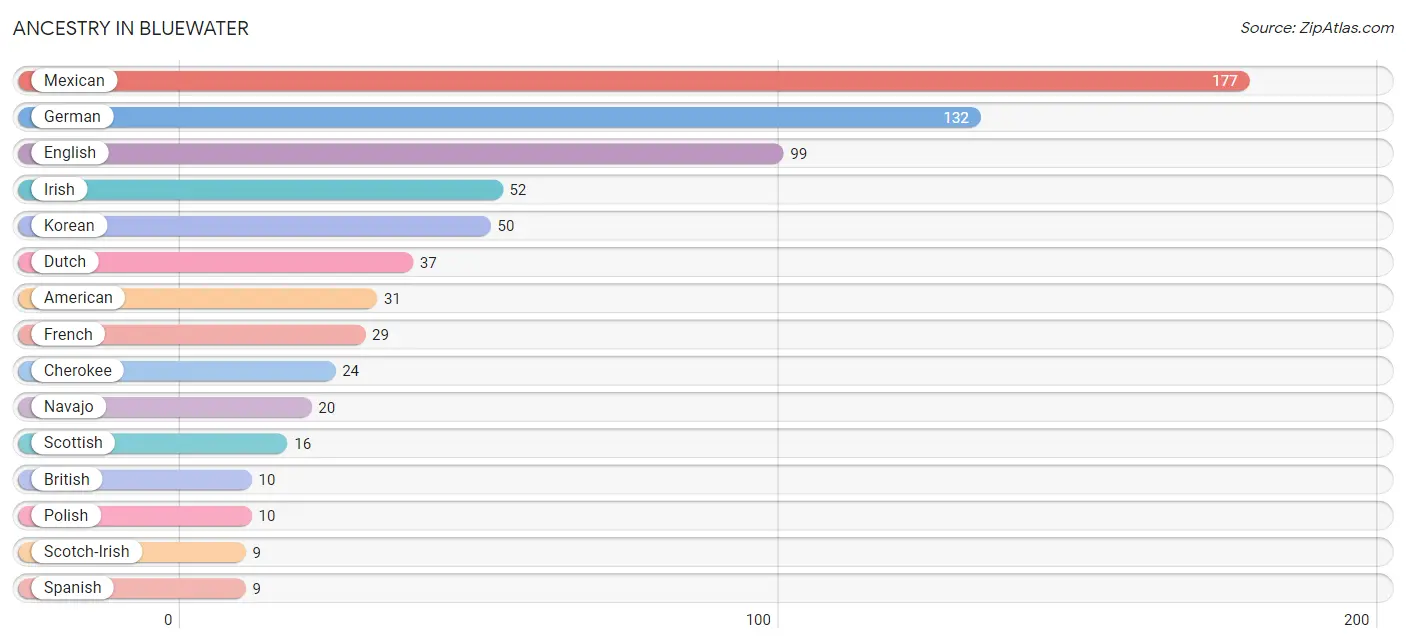
Ancestry in Bluewater
The most populous ancestries reported in Bluewater are Mexican (177 | 22.4%), German (132 | 16.7%), English (99 | 12.5%), Irish (52 | 6.6%), and Korean (50 | 6.3%), together accounting for 64.5% of all Bluewater residents.
| Ancestry | # Population | % Population |
| American | 31 | 3.9% |
| Arab | 8 | 1.0% |
| Armenian | 4 | 0.5% |
| British | 10 | 1.3% |
| Cherokee | 24 | 3.0% |
| Chilean | 7 | 0.9% |
| Danish | 4 | 0.5% |
| Dutch | 37 | 4.7% |
| English | 99 | 12.5% |
| European | 8 | 1.0% |
| French | 29 | 3.7% |
| German | 132 | 16.7% |
| Irish | 52 | 6.6% |
| Korean | 50 | 6.3% |
| Mexican | 177 | 22.4% |
| Navajo | 20 | 2.5% |
| Pima | 6 | 0.8% |
| Polish | 10 | 1.3% |
| Scotch-Irish | 9 | 1.1% |
| Scottish | 16 | 2.0% |
| South American | 7 | 0.9% |
| Spanish | 9 | 1.1% |
| Swedish | 7 | 0.9% |
| Syrian | 8 | 1.0% | View All 24 Rows |
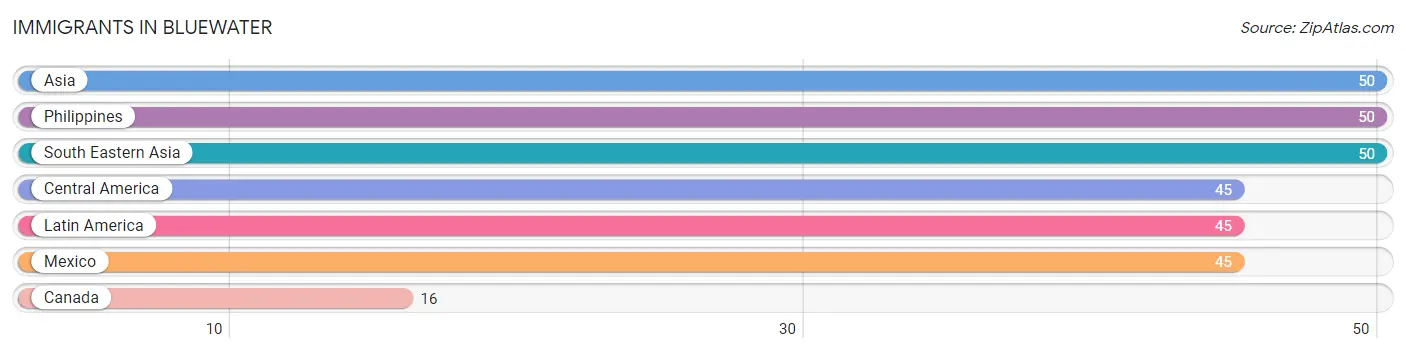
Immigrants in Bluewater
The most numerous immigrant groups reported in Bluewater came from Asia (50 | 6.3%), Philippines (50 | 6.3%), South Eastern Asia (50 | 6.3%), Central America (45 | 5.7%), and Latin America (45 | 5.7%), together accounting for 30.3% of all Bluewater residents.
| Immigration Origin | # Population | % Population |
| Asia | 50 | 6.3% |
| Canada | 16 | 2.0% |
| Central America | 45 | 5.7% |
| Latin America | 45 | 5.7% |
| Mexico | 45 | 5.7% |
| Philippines | 50 | 6.3% |
| South Eastern Asia | 50 | 6.3% | View All 7 Rows |
Sex and Age in Bluewater
Sex and Age in Bluewater
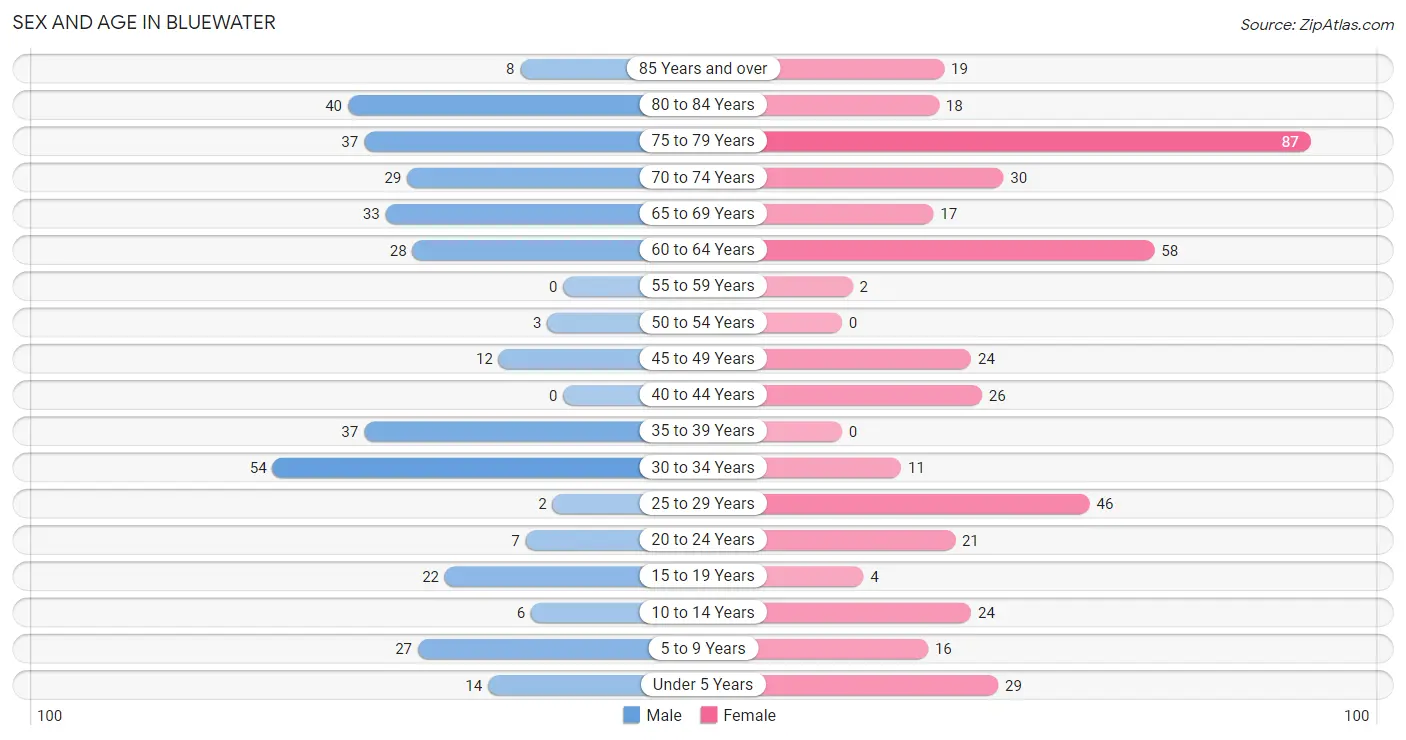
The most populous age groups in Bluewater are 30 to 34 Years (54 | 15.0%) for men and 75 to 79 Years (87 | 20.1%) for women.
| Age Bracket | Male | Female |
| Under 5 Years | 14 (3.9%) | 29 (6.7%) |
| 5 to 9 Years | 27 (7.5%) | 16 (3.7%) |
| 10 to 14 Years | 6 (1.7%) | 24 (5.6%) |
| 15 to 19 Years | 22 (6.1%) | 4 (0.9%) |
| 20 to 24 Years | 7 (1.9%) | 21 (4.9%) |
| 25 to 29 Years | 2 (0.6%) | 46 (10.6%) |
| 30 to 34 Years | 54 (15.0%) | 11 (2.5%) |
| 35 to 39 Years | 37 (10.3%) | 0 (0.0%) |
| 40 to 44 Years | 0 (0.0%) | 26 (6.0%) |
| 45 to 49 Years | 12 (3.3%) | 24 (5.6%) |
| 50 to 54 Years | 3 (0.8%) | 0 (0.0%) |
| 55 to 59 Years | 0 (0.0%) | 2 (0.5%) |
| 60 to 64 Years | 28 (7.8%) | 58 (13.4%) |
| 65 to 69 Years | 33 (9.2%) | 17 (3.9%) |
| 70 to 74 Years | 29 (8.1%) | 30 (6.9%) |
| 75 to 79 Years | 37 (10.3%) | 87 (20.1%) |
| 80 to 84 Years | 40 (11.1%) | 18 (4.2%) |
| 85 Years and over | 8 (2.2%) | 19 (4.4%) |
| Total | 359 (100.0%) | 432 (100.0%) |
Families and Households in Bluewater
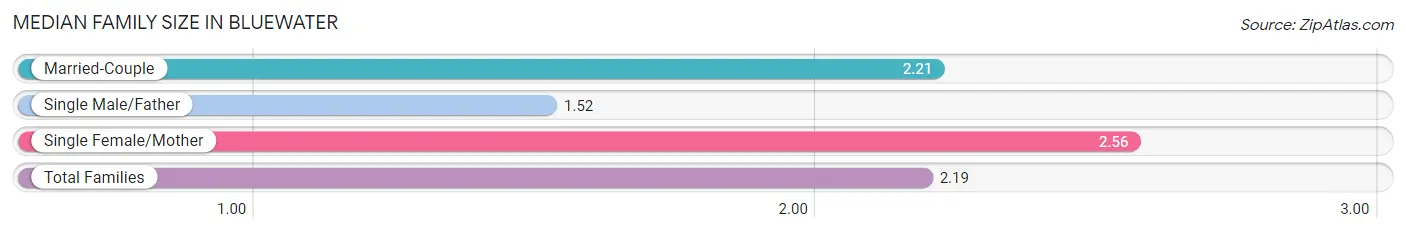
Median Family Size in Bluewater
The median family size in Bluewater is 2.19 persons per family, with single female/mother families (70 | 26.5%) accounting for the largest median family size of 2.56 persons per family. On the other hand, single male/father families (44 | 16.7%) represent the smallest median family size with 1.52 persons per family.
| Family Type | # Families | Family Size |
| Married-Couple | 150 (56.8%) | 2.21 |
| Single Male/Father | 44 (16.7%) | 1.52 |
| Single Female/Mother | 70 (26.5%) | 2.56 |
| Total Families | 264 (100.0%) | 2.19 |
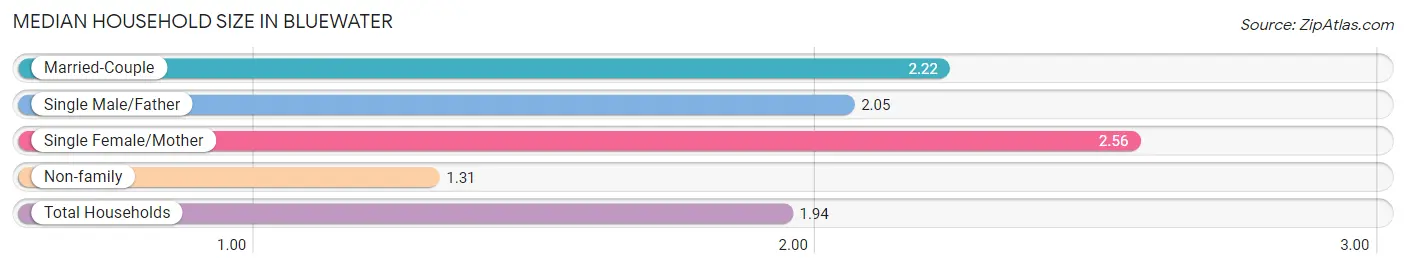
Median Household Size in Bluewater
The median household size in Bluewater is 1.94 persons per household, with single female/mother households (70 | 17.2%) accounting for the largest median household size of 2.56 persons per household. non-family households (144 | 35.3%) represent the smallest median household size with 1.31 persons per household.
| Household Type | # Households | Household Size |
| Married-Couple | 150 (36.8%) | 2.22 |
| Single Male/Father | 44 (10.8%) | 2.05 |
| Single Female/Mother | 70 (17.2%) | 2.56 |
| Non-family | 144 (35.3%) | 1.31 |
| Total Households | 408 (100.0%) | 1.94 |
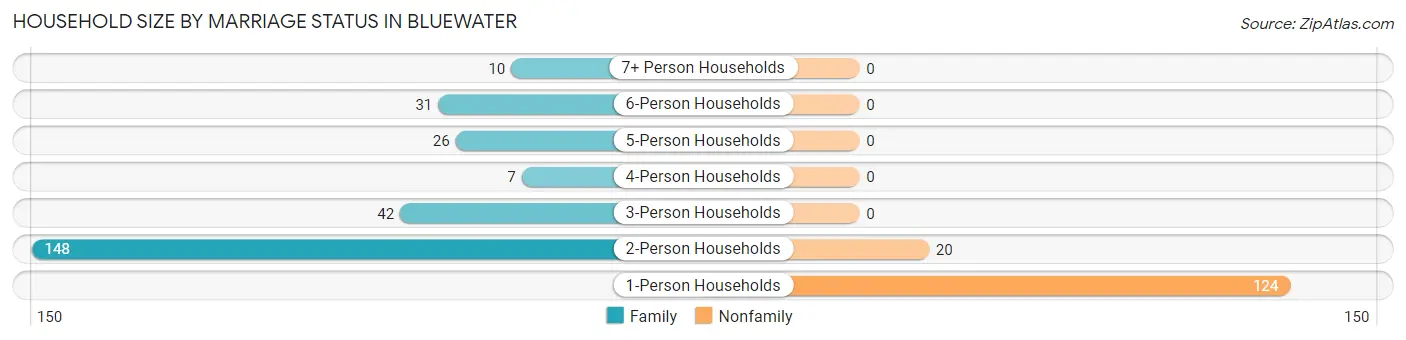
Household Size by Marriage Status in Bluewater
Out of a total of 408 households in Bluewater, 264 (64.7%) are family households, while 144 (35.3%) are nonfamily households. The most numerous type of family households are 2-person households, comprising 148, and the most common type of nonfamily households are 1-person households, comprising 124.
| Household Size | Family Households | Nonfamily Households |
| 1-Person Households | - | 124 (30.4%) |
| 2-Person Households | 148 (36.3%) | 20 (4.9%) |
| 3-Person Households | 42 (10.3%) | 0 (0.0%) |
| 4-Person Households | 7 (1.7%) | 0 (0.0%) |
| 5-Person Households | 26 (6.4%) | 0 (0.0%) |
| 6-Person Households | 31 (7.6%) | 0 (0.0%) |
| 7+ Person Households | 10 (2.5%) | 0 (0.0%) |
| Total | 264 (64.7%) | 144 (35.3%) |
Female Fertility in Bluewater
Fertility by Age in Bluewater
Average fertility rate in Bluewater is 159.0 births per 1,000 women. Women in the age bracket of 20 to 34 years have the highest fertility rate with 269.0 births per 1,000 women. Women in the age bracket of 20 to 34 years acount for 100.0% of all women with births.
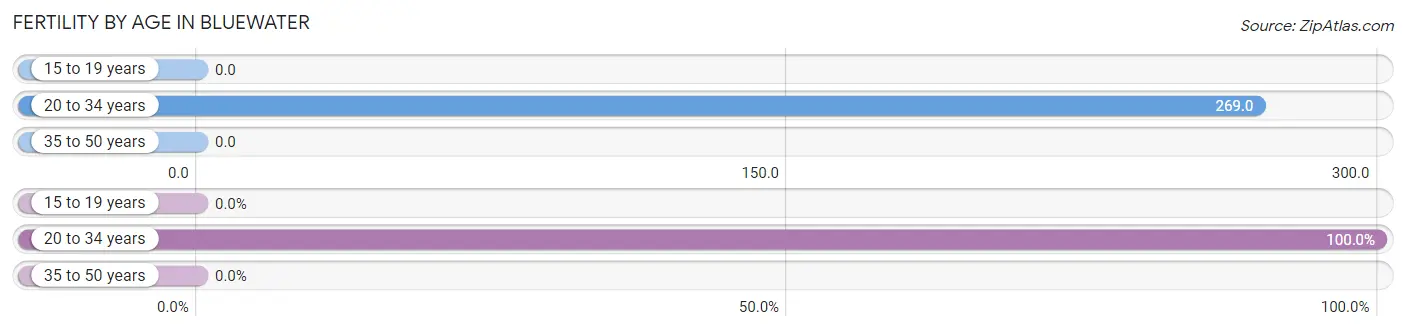
| Age Bracket | Women with Births | Births / 1,000 Women |
| 15 to 19 years | 0 (0.0%) | 0.0 |
| 20 to 34 years | 21 (100.0%) | 269.0 |
| 35 to 50 years | 0 (0.0%) | 0.0 |
| Total | 21 (100.0%) | 159.0 |
Fertility by Age by Marriage Status in Bluewater
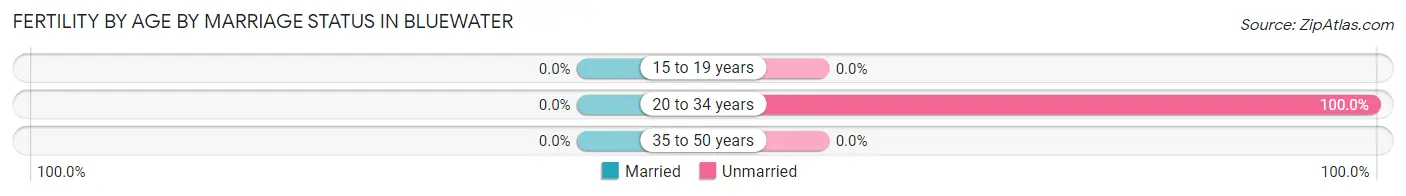
| Age Bracket | Married | Unmarried |
| 15 to 19 years | 0 (0.0%) | 0 (0.0%) |
| 20 to 34 years | 0 (0.0%) | 21 (100.0%) |
| 35 to 50 years | 0 (0.0%) | 0 (0.0%) |
| Total | 0 (0.0%) | 21 (100.0%) |
Fertility by Education in Bluewater
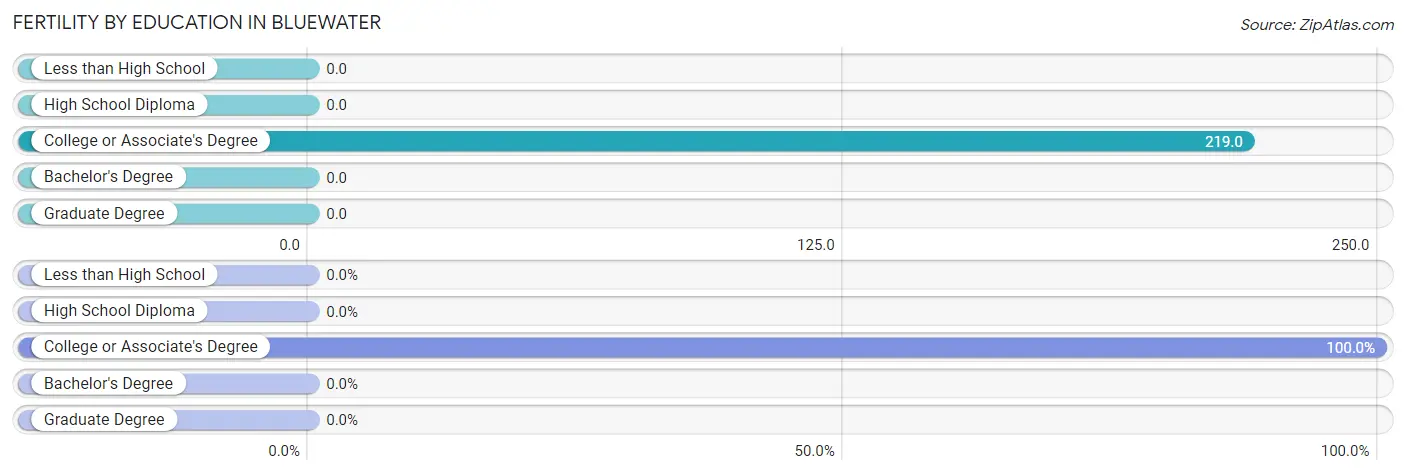
| Educational Attainment | Women with Births | Births / 1,000 Women |
| Less than High School | 0 (0.0%) | 0.0 |
| High School Diploma | 0 (0.0%) | 0.0 |
| College or Associate's Degree | 21 (100.0%) | 219.0 |
| Bachelor's Degree | 0 (0.0%) | 0.0 |
| Graduate Degree | 0 (0.0%) | 0.0 |
| Total | 21 (100.0%) | 159.0 |
Fertility by Education by Marriage Status in Bluewater
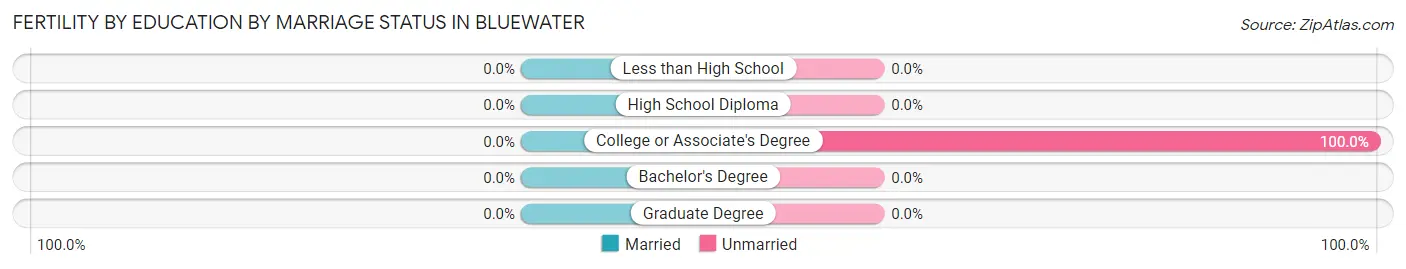
| Educational Attainment | Married | Unmarried |
| Less than High School | 0 (0.0%) | 0 (0.0%) |
| High School Diploma | 0 (0.0%) | 0 (0.0%) |
| College or Associate's Degree | 0 (0.0%) | 21 (100.0%) |
| Bachelor's Degree | 0 (0.0%) | 0 (0.0%) |
| Graduate Degree | 0 (0.0%) | 0 (0.0%) |
| Total | 0 (0.0%) | 21 (100.0%) |
Income in Bluewater
Income Overview in Bluewater
Per Capita Income in Bluewater is $31,751, while median incomes of families and households are $72,500 and $58,654 respectively.
| Characteristic | Number | Measure |
| Per Capita Income | 791 | $31,751 |
| Median Family Income | 264 | $72,500 |
| Mean Family Income | 264 | $83,819 |
| Median Household Income | 408 | $58,654 |
| Mean Household Income | 408 | $70,082 |
| Income Deficit | 264 | $0 |
| Wage / Income Gap (%) | 791 | 22.74% |
| Wage / Income Gap ($) | 791 | 77.26¢ per $1 |
| Gini / Inequality Index | 791 | 0.41 |
Earnings by Sex in Bluewater
Average Earnings in Bluewater are $39,392, $46,111 for men and $35,625 for women, a difference of 22.7%.
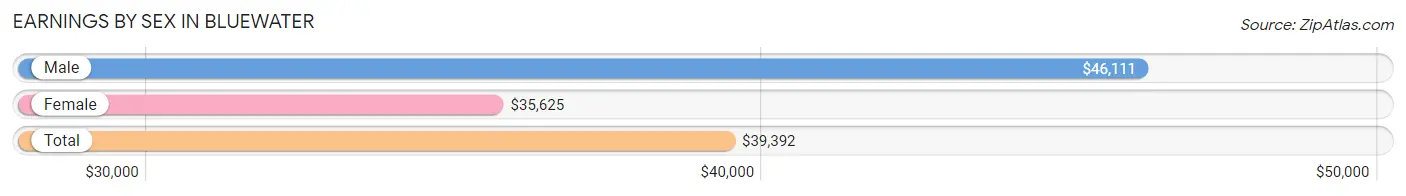
| Sex | Number | Average Earnings |
| Male | 138 (42.9%) | $46,111 |
| Female | 184 (57.1%) | $35,625 |
| Total | 322 (100.0%) | $39,392 |
Earnings by Sex by Income Bracket in Bluewater
The most common earnings brackets in Bluewater are $45,000 to $49,999 for men (45 | 32.6%) and $30,000 to $34,999 for women (34 | 18.5%).
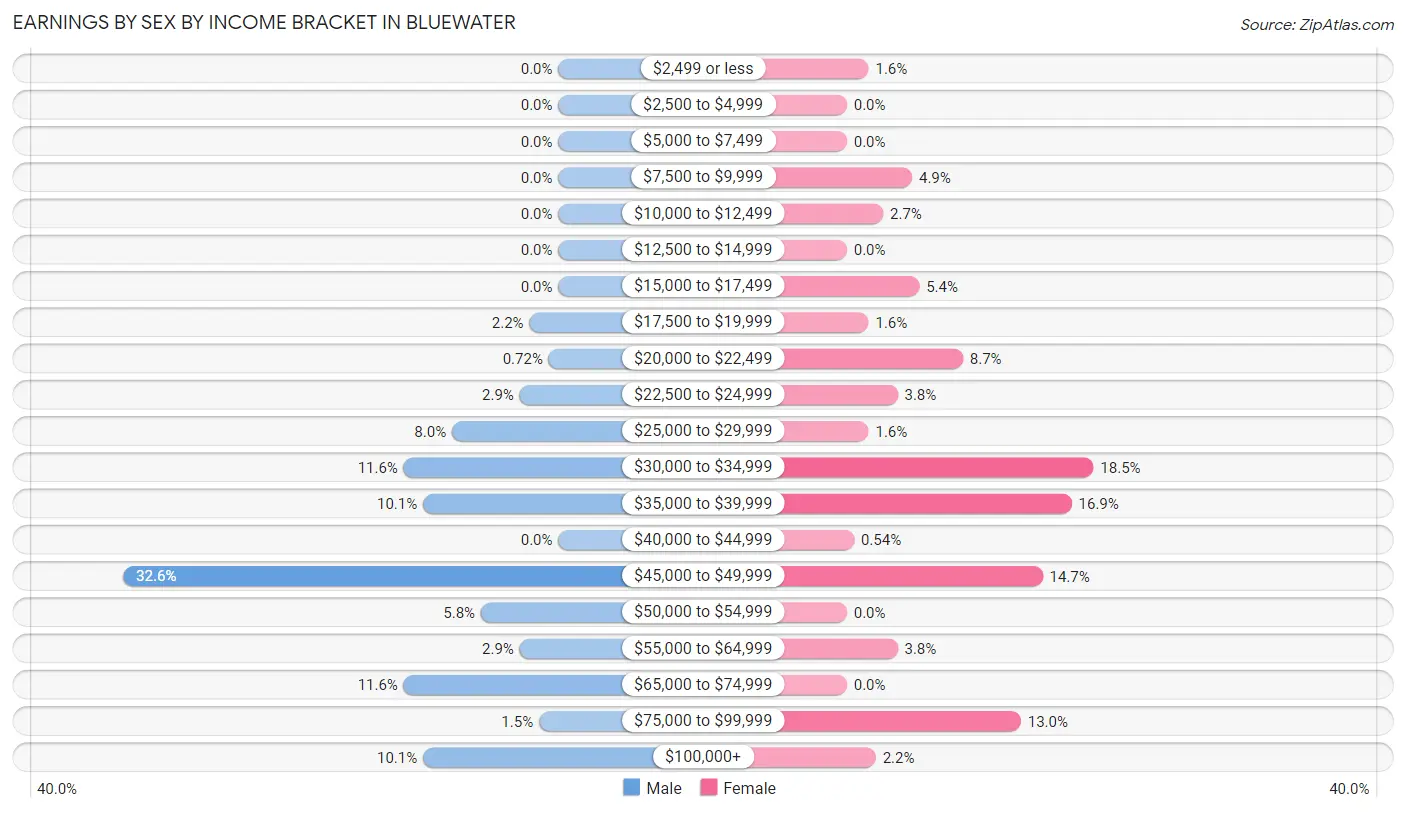
| Income | Male | Female |
| $2,499 or less | 0 (0.0%) | 3 (1.6%) |
| $2,500 to $4,999 | 0 (0.0%) | 0 (0.0%) |
| $5,000 to $7,499 | 0 (0.0%) | 0 (0.0%) |
| $7,500 to $9,999 | 0 (0.0%) | 9 (4.9%) |
| $10,000 to $12,499 | 0 (0.0%) | 5 (2.7%) |
| $12,500 to $14,999 | 0 (0.0%) | 0 (0.0%) |
| $15,000 to $17,499 | 0 (0.0%) | 10 (5.4%) |
| $17,500 to $19,999 | 3 (2.2%) | 3 (1.6%) |
| $20,000 to $22,499 | 1 (0.7%) | 16 (8.7%) |
| $22,500 to $24,999 | 4 (2.9%) | 7 (3.8%) |
| $25,000 to $29,999 | 11 (8.0%) | 3 (1.6%) |
| $30,000 to $34,999 | 16 (11.6%) | 34 (18.5%) |
| $35,000 to $39,999 | 14 (10.1%) | 31 (16.9%) |
| $40,000 to $44,999 | 0 (0.0%) | 1 (0.5%) |
| $45,000 to $49,999 | 45 (32.6%) | 27 (14.7%) |
| $50,000 to $54,999 | 8 (5.8%) | 0 (0.0%) |
| $55,000 to $64,999 | 4 (2.9%) | 7 (3.8%) |
| $65,000 to $74,999 | 16 (11.6%) | 0 (0.0%) |
| $75,000 to $99,999 | 2 (1.5%) | 24 (13.0%) |
| $100,000+ | 14 (10.1%) | 4 (2.2%) |
| Total | 138 (100.0%) | 184 (100.0%) |
Earnings by Sex by Educational Attainment in Bluewater
Average earnings in Bluewater are $46,333 for men and $35,781 for women, a difference of 22.8%. Men with an educational attainment of high school diploma enjoy the highest average annual earnings of $46,250, while those with high school diploma education earn the least with $46,250. Women with an educational attainment of high school diploma earn the most with the average annual earnings of $36,250, while those with college or associate's degree education have the smallest earnings of $31,691.
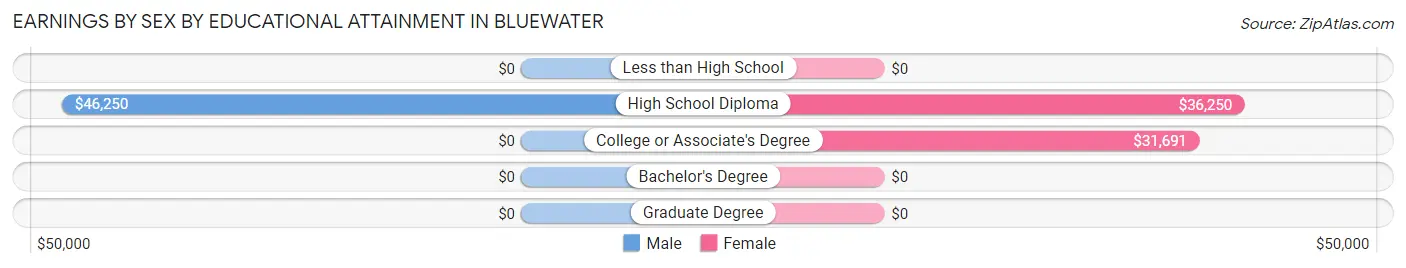
| Educational Attainment | Male Income | Female Income |
| Less than High School | - | - |
| High School Diploma | $46,250 | $36,250 |
| College or Associate's Degree | - | - |
| Bachelor's Degree | - | - |
| Graduate Degree | - | - |
| Total | $46,333 | $35,781 |
Family Income in Bluewater
Family Income Brackets in Bluewater
According to the Bluewater family income data, there are 67 families falling into the $50,000 to $74,999 income range, which is the most common income bracket and makes up 25.4% of all families.
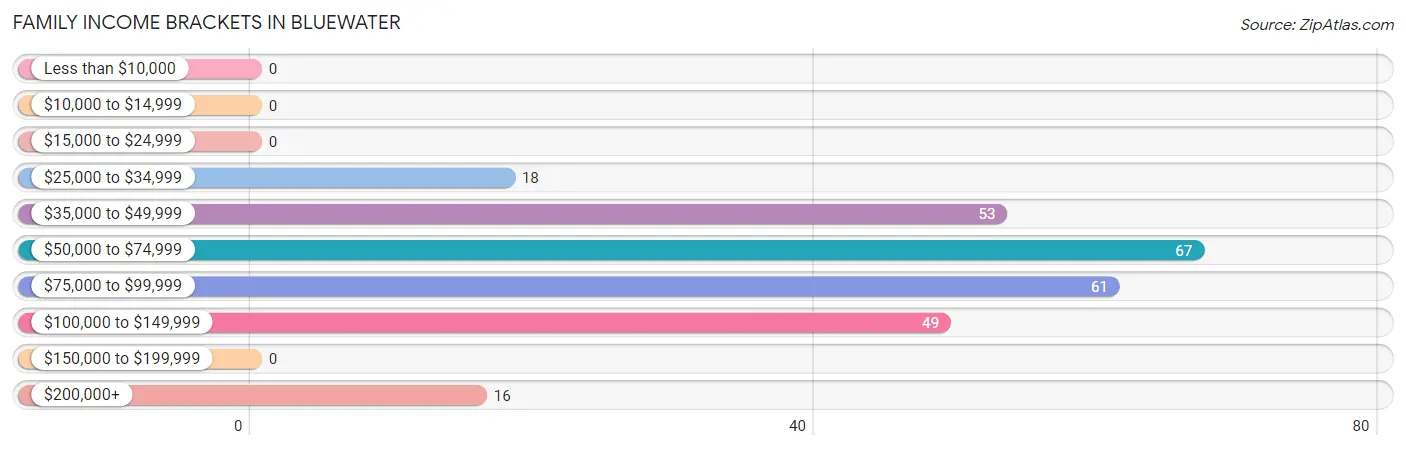
| Income Bracket | # Families | % Families |
| Less than $10,000 | 0 | 0.0% |
| $10,000 to $14,999 | 0 | 0.0% |
| $15,000 to $24,999 | 0 | 0.0% |
| $25,000 to $34,999 | 18 | 6.8% |
| $35,000 to $49,999 | 53 | 20.1% |
| $50,000 to $74,999 | 67 | 25.4% |
| $75,000 to $99,999 | 61 | 23.1% |
| $100,000 to $149,999 | 49 | 18.6% |
| $150,000 to $199,999 | 0 | 0.0% |
| $200,000+ | 16 | 6.1% |
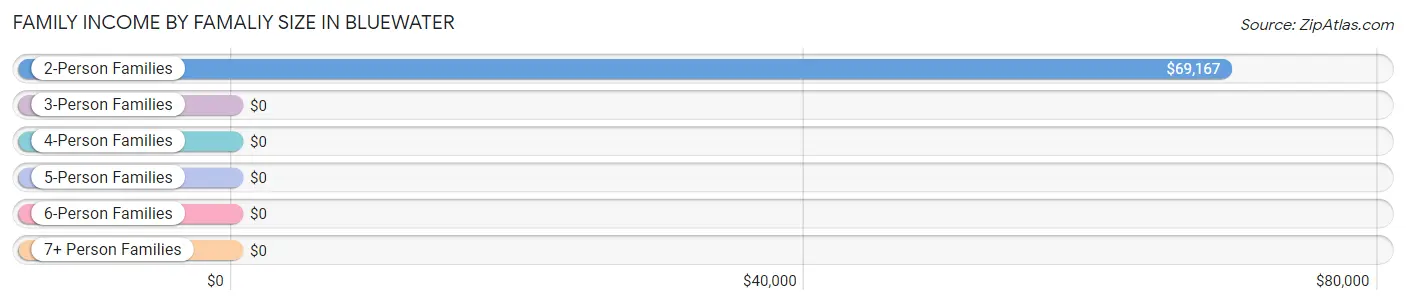
Family Income by Famaliy Size in Bluewater
2-person families (166 | 62.9%) account for the highest median family income in Bluewater with $69,167 per family, while 2-person families (166 | 62.9%) have the highest median income of $34,584 per family member.
| Income Bracket | # Families | Median Income |
| 2-Person Families | 166 (62.9%) | $69,167 |
| 3-Person Families | 31 (11.7%) | $0 |
| 4-Person Families | 0 (0.0%) | $0 |
| 5-Person Families | 26 (9.9%) | $0 |
| 6-Person Families | 31 (11.7%) | $0 |
| 7+ Person Families | 10 (3.8%) | $0 |
| Total | 264 (100.0%) | $72,500 |
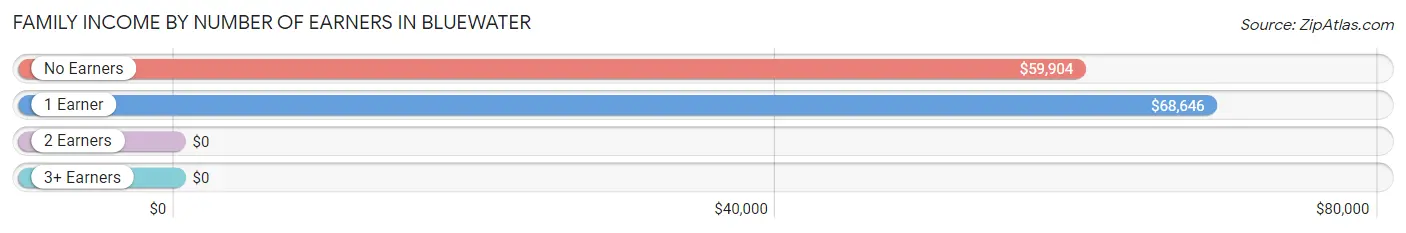
Family Income by Number of Earners in Bluewater
| Number of Earners | # Families | Median Income |
| No Earners | 73 (27.7%) | $59,904 |
| 1 Earner | 105 (39.8%) | $68,646 |
| 2 Earners | 55 (20.8%) | $0 |
| 3+ Earners | 31 (11.7%) | $0 |
| Total | 264 (100.0%) | $72,500 |
Household Income in Bluewater
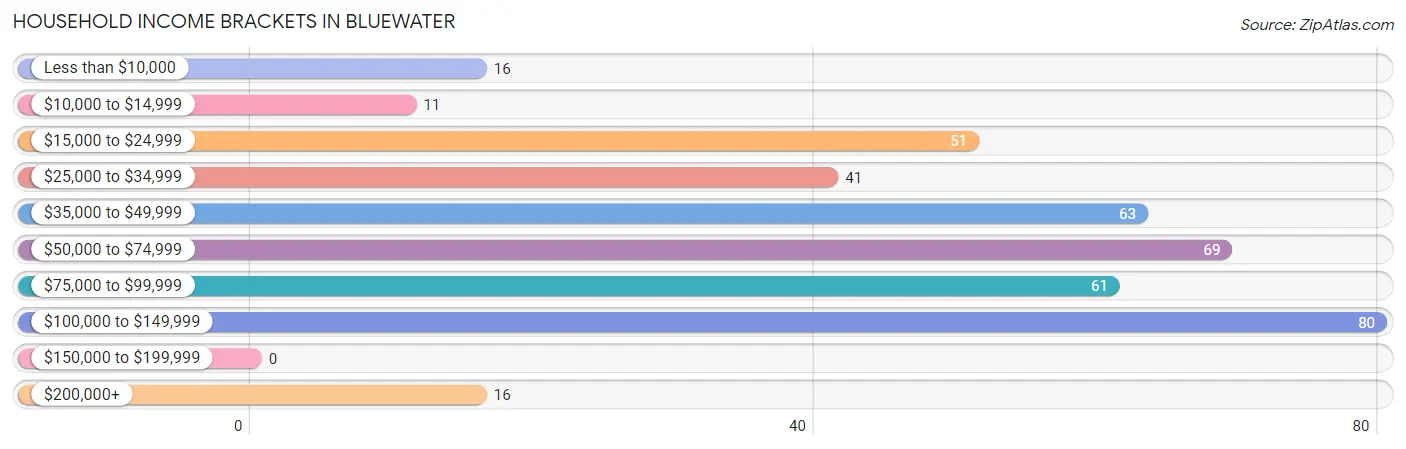
Household Income Brackets in Bluewater
With 80 households falling in the category, the $100,000 to $149,999 income range is the most frequent in Bluewater, accounting for 19.6% of all households.
| Income Bracket | # Households | % Households |
| Less than $10,000 | 16 | 3.9% |
| $10,000 to $14,999 | 11 | 2.7% |
| $15,000 to $24,999 | 51 | 12.5% |
| $25,000 to $34,999 | 41 | 10.0% |
| $35,000 to $49,999 | 63 | 15.4% |
| $50,000 to $74,999 | 69 | 16.9% |
| $75,000 to $99,999 | 61 | 15.0% |
| $100,000 to $149,999 | 80 | 19.6% |
| $150,000 to $199,999 | 0 | 0.0% |
| $200,000+ | 16 | 3.9% |
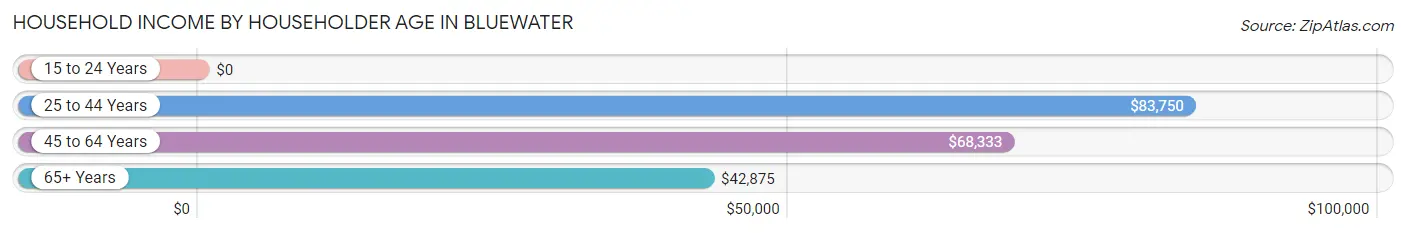
Household Income by Householder Age in Bluewater
The median household income in Bluewater is $58,654, with the highest median household income of $83,750 found in the 25 to 44 years age bracket for the primary householder. A total of 102 households (25.0%) fall into this category. Meanwhile, the 15 to 24 years age bracket for the primary householder has the lowest median household income of $0, with 7 households (1.7%) in this group.
| Income Bracket | # Households | Median Income |
| 15 to 24 Years | 7 (1.7%) | $0 |
| 25 to 44 Years | 102 (25.0%) | $83,750 |
| 45 to 64 Years | 86 (21.1%) | $68,333 |
| 65+ Years | 213 (52.2%) | $42,875 |
| Total | 408 (100.0%) | $58,654 |
Poverty in Bluewater
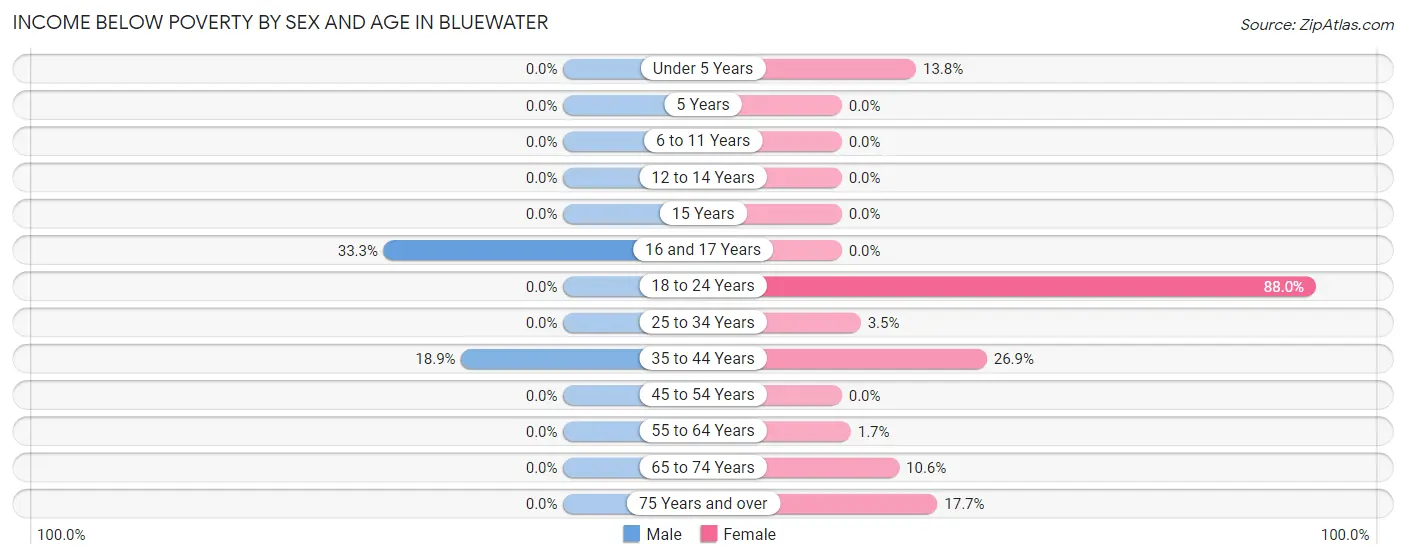
Income Below Poverty by Sex and Age in Bluewater
With 3.9% poverty level for males and 14.6% for females among the residents of Bluewater, 16 and 17 year old males and 18 to 24 year old females are the most vulnerable to poverty, with 7 males (33.3%) and 22 females (88.0%) in their respective age groups living below the poverty level.
| Age Bracket | Male | Female |
| Under 5 Years | 0 (0.0%) | 4 (13.8%) |
| 5 Years | 0 (0.0%) | 0 (0.0%) |
| 6 to 11 Years | 0 (0.0%) | 0 (0.0%) |
| 12 to 14 Years | 0 (0.0%) | 0 (0.0%) |
| 15 Years | 0 (0.0%) | 0 (0.0%) |
| 16 and 17 Years | 7 (33.3%) | 0 (0.0%) |
| 18 to 24 Years | 0 (0.0%) | 22 (88.0%) |
| 25 to 34 Years | 0 (0.0%) | 2 (3.5%) |
| 35 to 44 Years | 7 (18.9%) | 7 (26.9%) |
| 45 to 54 Years | 0 (0.0%) | 0 (0.0%) |
| 55 to 64 Years | 0 (0.0%) | 1 (1.7%) |
| 65 to 74 Years | 0 (0.0%) | 5 (10.6%) |
| 75 Years and over | 0 (0.0%) | 22 (17.7%) |
| Total | 14 (3.9%) | 63 (14.6%) |
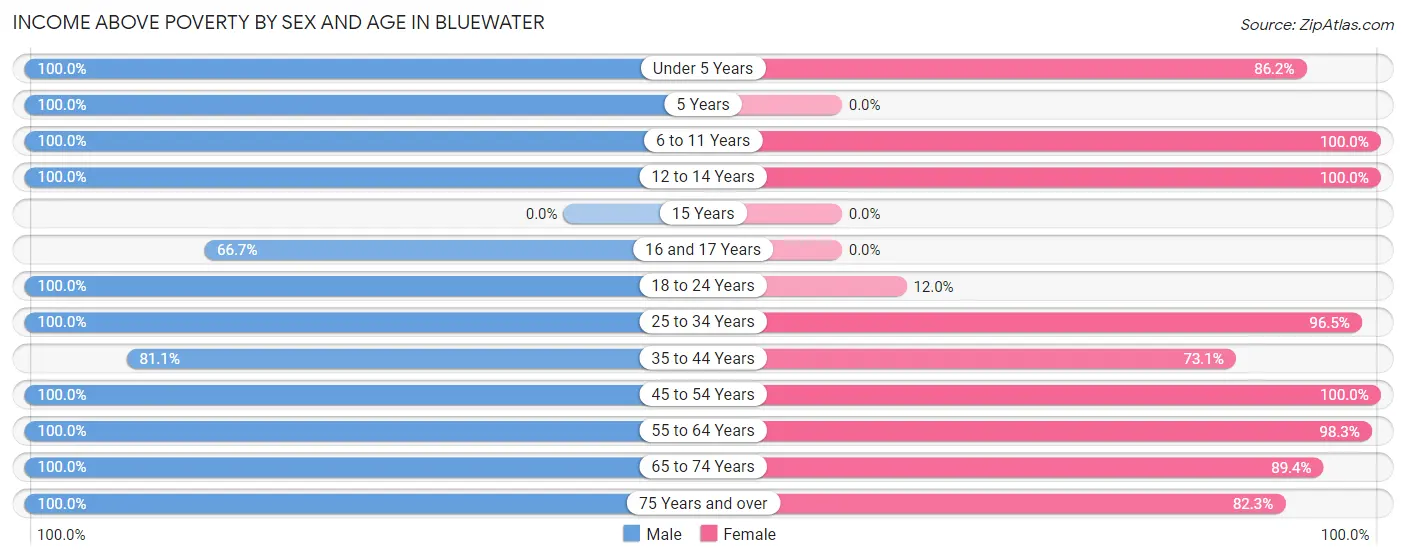
Income Above Poverty by Sex and Age in Bluewater
According to the poverty statistics in Bluewater, males aged under 5 years and females aged 6 to 11 years are the age groups that are most secure financially, with 100.0% of males and 100.0% of females in these age groups living above the poverty line.
| Age Bracket | Male | Female |
| Under 5 Years | 14 (100.0%) | 25 (86.2%) |
| 5 Years | 11 (100.0%) | 0 (0.0%) |
| 6 to 11 Years | 16 (100.0%) | 31 (100.0%) |
| 12 to 14 Years | 6 (100.0%) | 9 (100.0%) |
| 15 Years | 0 (0.0%) | 0 (0.0%) |
| 16 and 17 Years | 14 (66.7%) | 0 (0.0%) |
| 18 to 24 Years | 8 (100.0%) | 3 (12.0%) |
| 25 to 34 Years | 56 (100.0%) | 55 (96.5%) |
| 35 to 44 Years | 30 (81.1%) | 19 (73.1%) |
| 45 to 54 Years | 15 (100.0%) | 24 (100.0%) |
| 55 to 64 Years | 28 (100.0%) | 59 (98.3%) |
| 65 to 74 Years | 62 (100.0%) | 42 (89.4%) |
| 75 Years and over | 85 (100.0%) | 102 (82.3%) |
| Total | 345 (96.1%) | 369 (85.4%) |
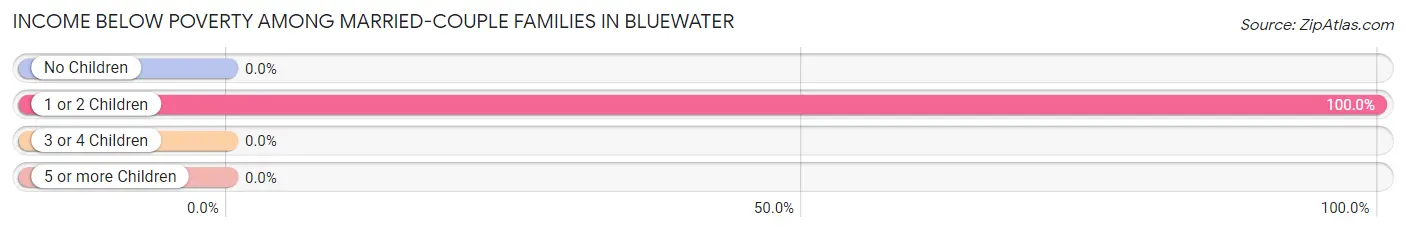
Income Below Poverty Among Married-Couple Families in Bluewater
The poverty statistics for married-couple families in Bluewater show that 4.7% or 7 of the total 150 families live below the poverty line. Families with 1 or 2 children have the highest poverty rate of 100.0%, comprising of 7 families. On the other hand, families with no children have the lowest poverty rate of 0.0%, which includes 0 families.
| Children | Above Poverty | Below Poverty |
| No Children | 129 (100.0%) | 0 (0.0%) |
| 1 or 2 Children | 0 (0.0%) | 7 (100.0%) |
| 3 or 4 Children | 14 (100.0%) | 0 (0.0%) |
| 5 or more Children | 0 (0.0%) | 0 (0.0%) |
| Total | 143 (95.3%) | 7 (4.7%) |
Income Below Poverty Among Single-Parent Households in Bluewater
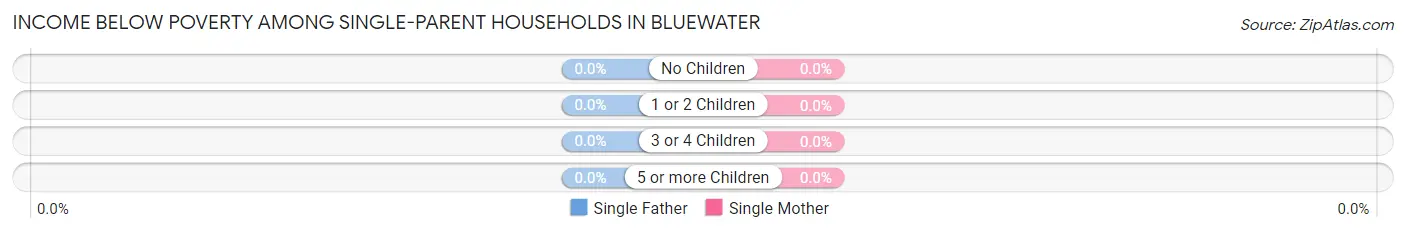
| Children | Single Father | Single Mother |
| No Children | 0 (0.0%) | 0 (0.0%) |
| 1 or 2 Children | 0 (0.0%) | 0 (0.0%) |
| 3 or 4 Children | 0 (0.0%) | 0 (0.0%) |
| 5 or more Children | 0 (0.0%) | 0 (0.0%) |
| Total | 0 (0.0%) | 0 (0.0%) |
Income Below Poverty Among Married-Couple vs Single-Parent Households in Bluewater
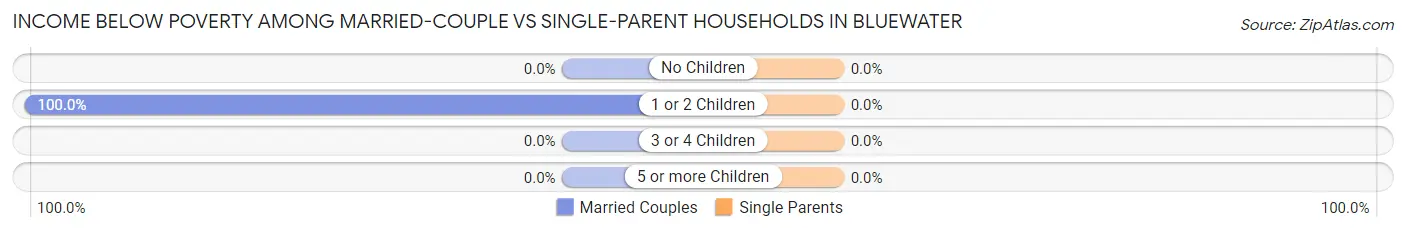
| Children | Married-Couple Families | Single-Parent Households |
| No Children | 0 (0.0%) | 0 (0.0%) |
| 1 or 2 Children | 7 (100.0%) | 0 (0.0%) |
| 3 or 4 Children | 0 (0.0%) | 0 (0.0%) |
| 5 or more Children | 0 (0.0%) | 0 (0.0%) |
| Total | 7 (4.7%) | 0 (0.0%) |
Employment Characteristics in Bluewater
Employment by Class of Employer in Bluewater
Among the 296 employed individuals in Bluewater, private company employees (149 | 50.3%), federal government employees (65 | 22.0%), and self-employed (not incorporated) (32 | 10.8%) make up the most common classes of employment.
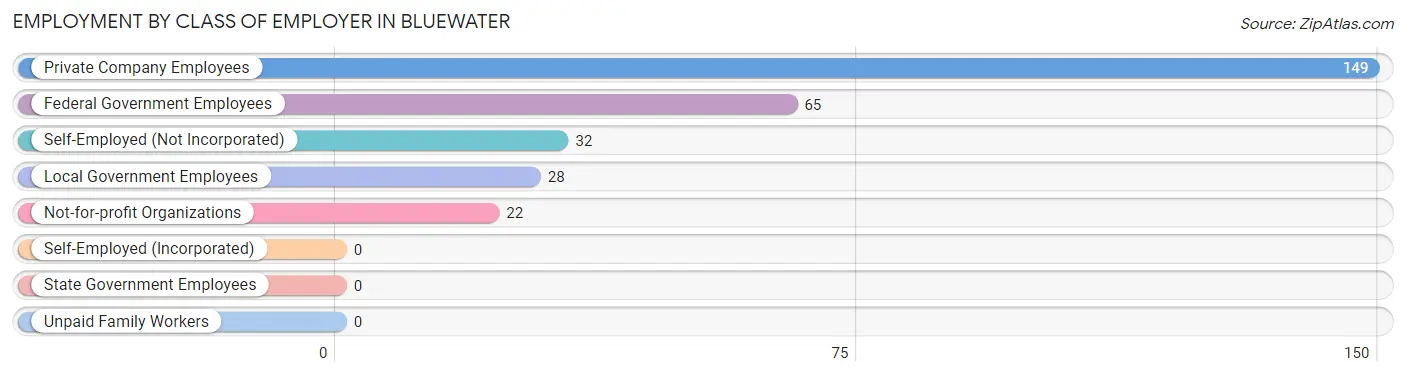
| Employer Class | # Employees | % Employees |
| Private Company Employees | 149 | 50.3% |
| Self-Employed (Incorporated) | 0 | 0.0% |
| Self-Employed (Not Incorporated) | 32 | 10.8% |
| Not-for-profit Organizations | 22 | 7.4% |
| Local Government Employees | 28 | 9.5% |
| State Government Employees | 0 | 0.0% |
| Federal Government Employees | 65 | 22.0% |
| Unpaid Family Workers | 0 | 0.0% |
| Total | 296 | 100.0% |
Employment Status by Age in Bluewater
According to the labor force statistics for Bluewater, out of the total population over 16 years of age (675), 48.1% or 325 individuals are in the labor force, with 2.2% or 7 of them unemployed. The age group with the highest labor force participation rate is 30 to 34 years, with 100.0% or 65 individuals in the labor force. Within the labor force, the 16 to 19 years age range has the highest percentage of unemployed individuals, with 87.5% or 7 of them being unemployed.
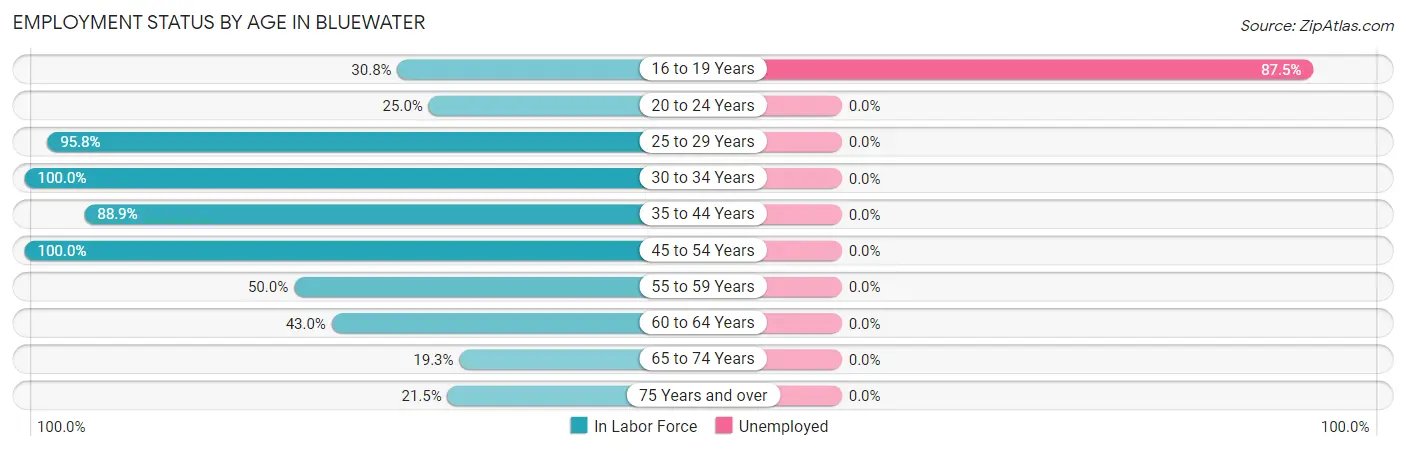
| Age Bracket | In Labor Force | Unemployed |
| 16 to 19 Years | 8 (30.8%) | 7 (87.5%) |
| 20 to 24 Years | 7 (25.0%) | 0 (0.0%) |
| 25 to 29 Years | 46 (95.8%) | 0 (0.0%) |
| 30 to 34 Years | 65 (100.0%) | 0 (0.0%) |
| 35 to 44 Years | 56 (88.9%) | 0 (0.0%) |
| 45 to 54 Years | 39 (100.0%) | 0 (0.0%) |
| 55 to 59 Years | 1 (50.0%) | 0 (0.0%) |
| 60 to 64 Years | 37 (43.0%) | 0 (0.0%) |
| 65 to 74 Years | 21 (19.3%) | 0 (0.0%) |
| 75 Years and over | 45 (21.5%) | 0 (0.0%) |
| Total | 325 (48.1%) | 7 (2.2%) |
Employment Status by Educational Attainment in Bluewater
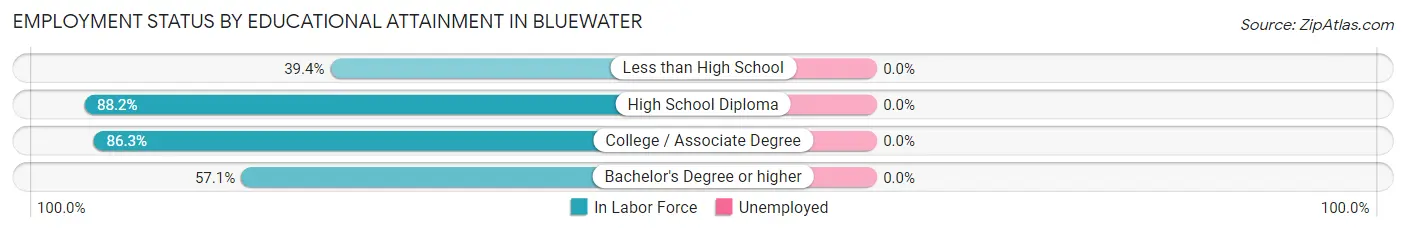
| Educational Attainment | In Labor Force | Unemployed |
| Less than High School | 13 (39.4%) | 0 (0.0%) |
| High School Diploma | 97 (88.2%) | 0 (0.0%) |
| College / Associate Degree | 126 (86.3%) | 0 (0.0%) |
| Bachelor's Degree or higher | 8 (57.1%) | 0 (0.0%) |
| Total | 244 (80.5%) | 0 (0.0%) |
Employment Occupations by Sex in Bluewater
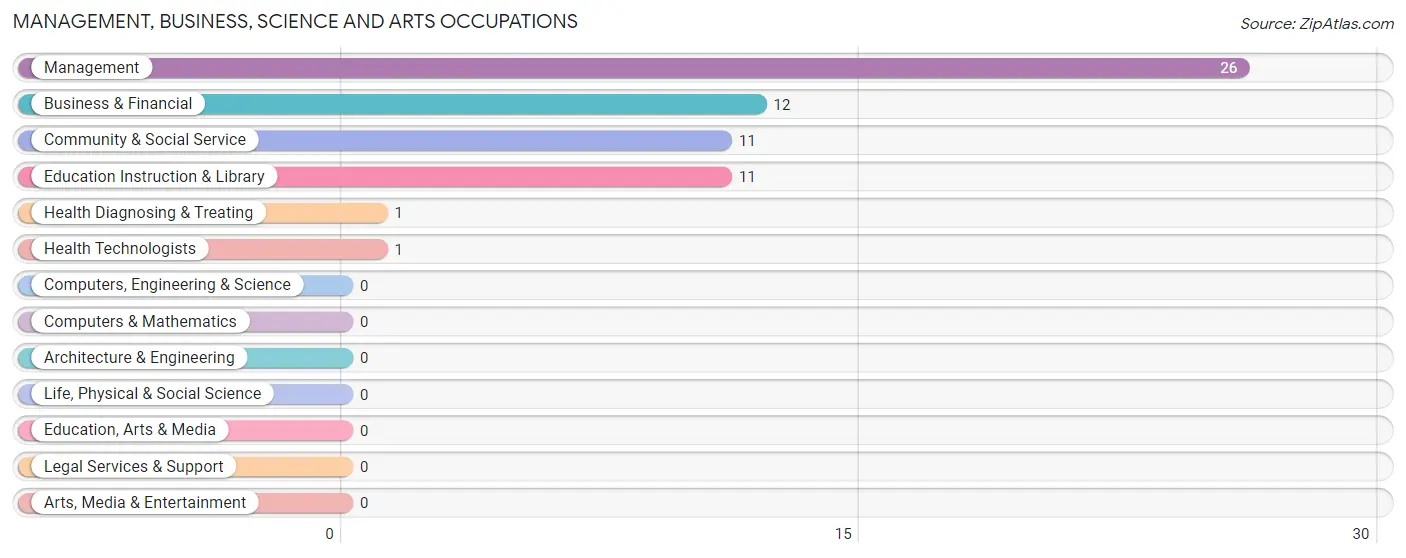
Management, Business, Science and Arts Occupations
The most common Management, Business, Science and Arts occupations in Bluewater are Management (26 | 8.2%), Business & Financial (12 | 3.8%), Community & Social Service (11 | 3.5%), Education Instruction & Library (11 | 3.5%), and Health Diagnosing & Treating (1 | 0.3%).
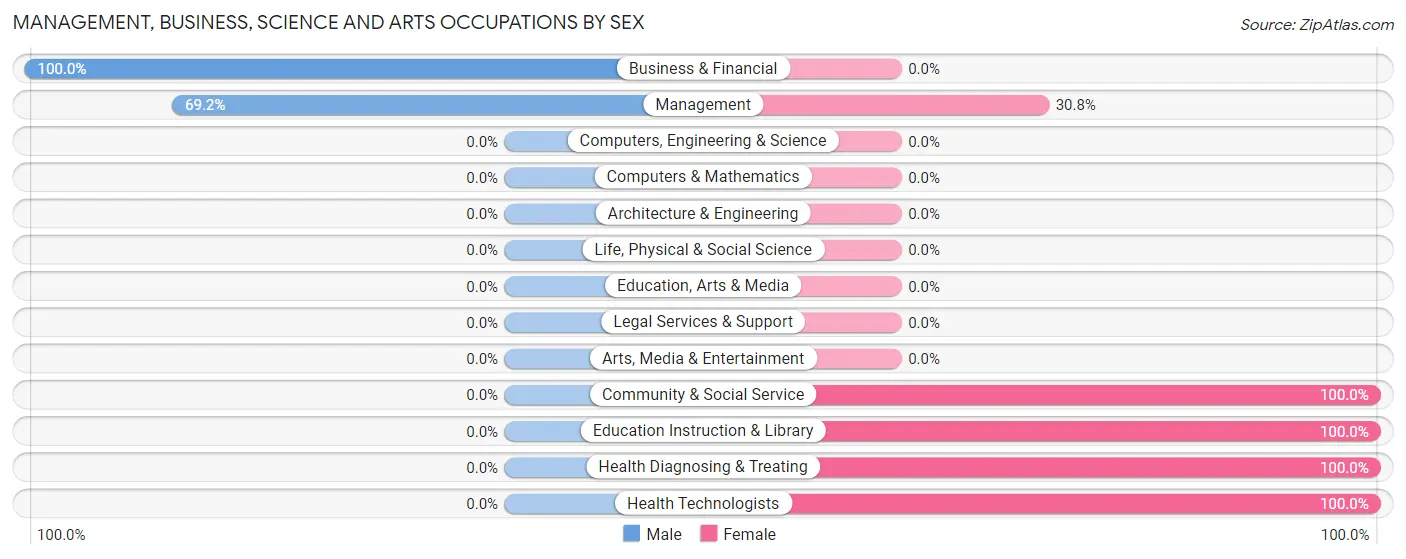
Management, Business, Science and Arts Occupations by Sex
Within the Management, Business, Science and Arts occupations in Bluewater, the most male-oriented occupations are Business & Financial (100.0%), and Management (69.2%), while the most female-oriented occupations are Community & Social Service (100.0%), Education Instruction & Library (100.0%), and Health Diagnosing & Treating (100.0%).
| Occupation | Male | Female |
| Management | 18 (69.2%) | 8 (30.8%) |
| Business & Financial | 12 (100.0%) | 0 (0.0%) |
| Computers, Engineering & Science | 0 (0.0%) | 0 (0.0%) |
| Computers & Mathematics | 0 (0.0%) | 0 (0.0%) |
| Architecture & Engineering | 0 (0.0%) | 0 (0.0%) |
| Life, Physical & Social Science | 0 (0.0%) | 0 (0.0%) |
| Community & Social Service | 0 (0.0%) | 11 (100.0%) |
| Education, Arts & Media | 0 (0.0%) | 0 (0.0%) |
| Legal Services & Support | 0 (0.0%) | 0 (0.0%) |
| Education Instruction & Library | 0 (0.0%) | 11 (100.0%) |
| Arts, Media & Entertainment | 0 (0.0%) | 0 (0.0%) |
| Health Diagnosing & Treating | 0 (0.0%) | 1 (100.0%) |
| Health Technologists | 0 (0.0%) | 1 (100.0%) |
| Total (Category) | 30 (60.0%) | 20 (40.0%) |
| Total (Overall) | 138 (43.4%) | 180 (56.6%) |
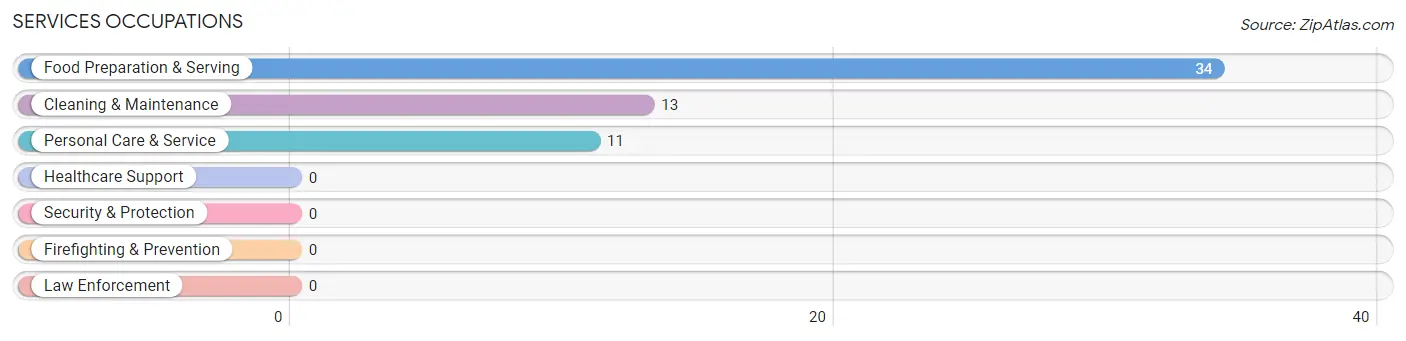
Services Occupations
The most common Services occupations in Bluewater are Food Preparation & Serving (34 | 10.7%), Cleaning & Maintenance (13 | 4.1%), and Personal Care & Service (11 | 3.5%).
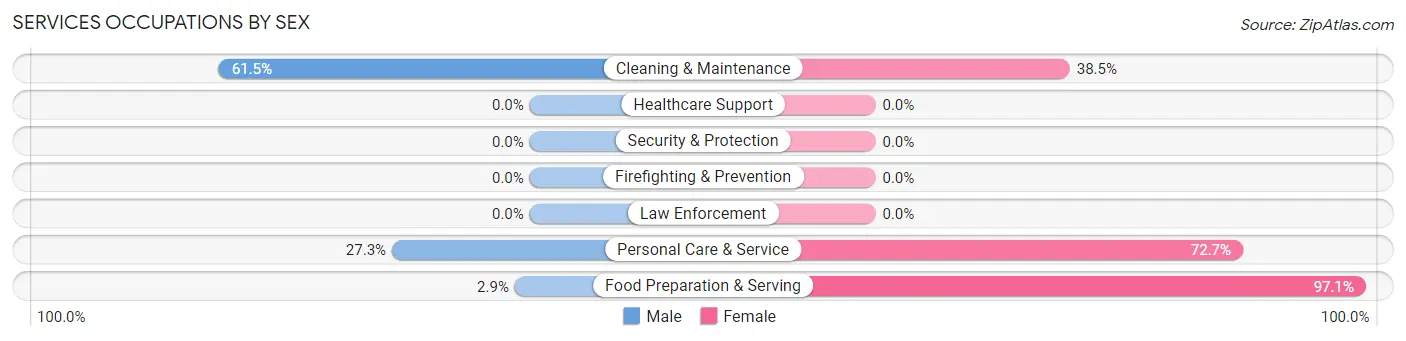
Services Occupations by Sex
Within the Services occupations in Bluewater, the most male-oriented occupations are Cleaning & Maintenance (61.5%), Personal Care & Service (27.3%), and Food Preparation & Serving (2.9%), while the most female-oriented occupations are Food Preparation & Serving (97.1%), Personal Care & Service (72.7%), and Cleaning & Maintenance (38.5%).
| Occupation | Male | Female |
| Healthcare Support | 0 (0.0%) | 0 (0.0%) |
| Security & Protection | 0 (0.0%) | 0 (0.0%) |
| Firefighting & Prevention | 0 (0.0%) | 0 (0.0%) |
| Law Enforcement | 0 (0.0%) | 0 (0.0%) |
| Food Preparation & Serving | 1 (2.9%) | 33 (97.1%) |
| Cleaning & Maintenance | 8 (61.5%) | 5 (38.5%) |
| Personal Care & Service | 3 (27.3%) | 8 (72.7%) |
| Total (Category) | 12 (20.7%) | 46 (79.3%) |
| Total (Overall) | 138 (43.4%) | 180 (56.6%) |
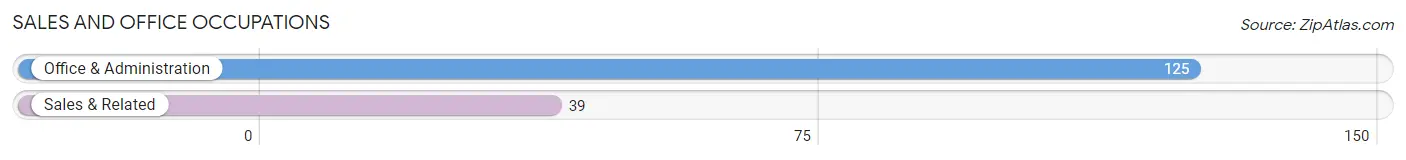
Sales and Office Occupations
The most common Sales and Office occupations in Bluewater are Office & Administration (125 | 39.3%), and Sales & Related (39 | 12.3%).
Sales and Office Occupations by Sex
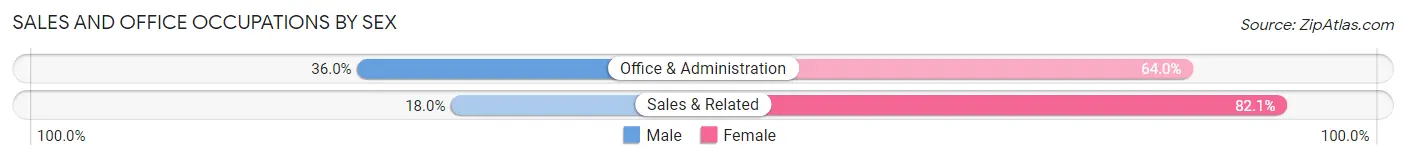
| Occupation | Male | Female |
| Sales & Related | 7 (17.9%) | 32 (82.1%) |
| Office & Administration | 45 (36.0%) | 80 (64.0%) |
| Total (Category) | 52 (31.7%) | 112 (68.3%) |
| Total (Overall) | 138 (43.4%) | 180 (56.6%) |
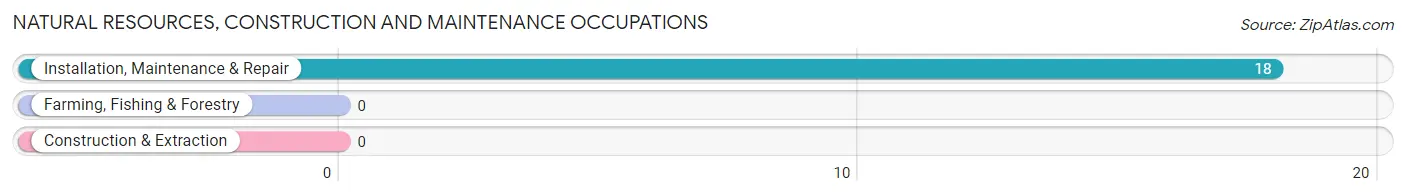
Natural Resources, Construction and Maintenance Occupations
The most common Natural Resources, Construction and Maintenance occupations in Bluewater are , and Installation, Maintenance & Repair (18 | 5.7%).
Natural Resources, Construction and Maintenance Occupations by Sex
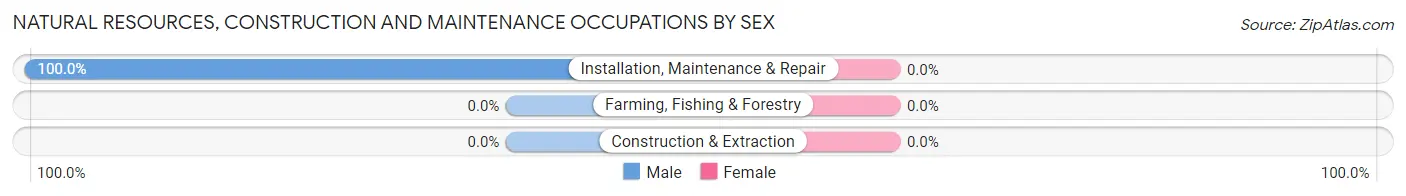
| Occupation | Male | Female |
| Farming, Fishing & Forestry | 0 (0.0%) | 0 (0.0%) |
| Construction & Extraction | 0 (0.0%) | 0 (0.0%) |
| Installation, Maintenance & Repair | 18 (100.0%) | 0 (0.0%) |
| Total (Category) | 18 (100.0%) | 0 (0.0%) |
| Total (Overall) | 138 (43.4%) | 180 (56.6%) |
Production, Transportation and Moving Occupations
The most common Production, Transportation and Moving occupations in Bluewater are Transportation (26 | 8.2%), and Material Moving (2 | 0.6%).
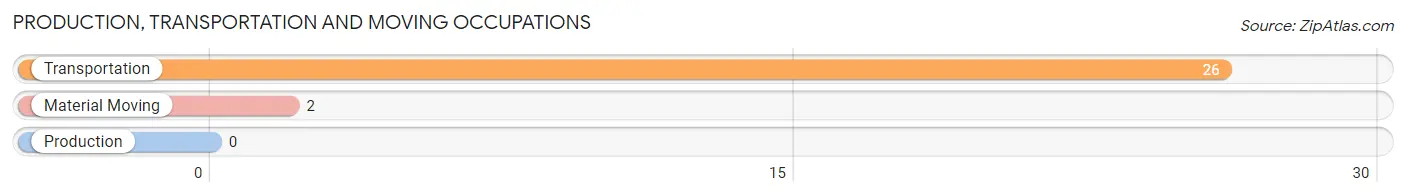
Production, Transportation and Moving Occupations by Sex
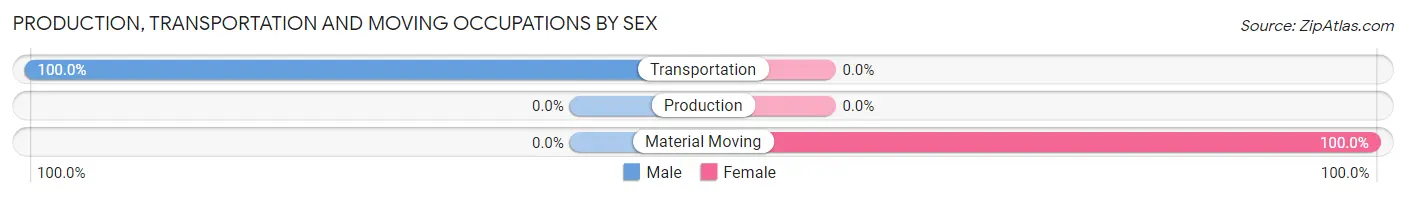
| Occupation | Male | Female |
| Production | 0 (0.0%) | 0 (0.0%) |
| Transportation | 26 (100.0%) | 0 (0.0%) |
| Material Moving | 0 (0.0%) | 2 (100.0%) |
| Total (Category) | 26 (92.9%) | 2 (7.1%) |
| Total (Overall) | 138 (43.4%) | 180 (56.6%) |
Employment Industries by Sex in Bluewater
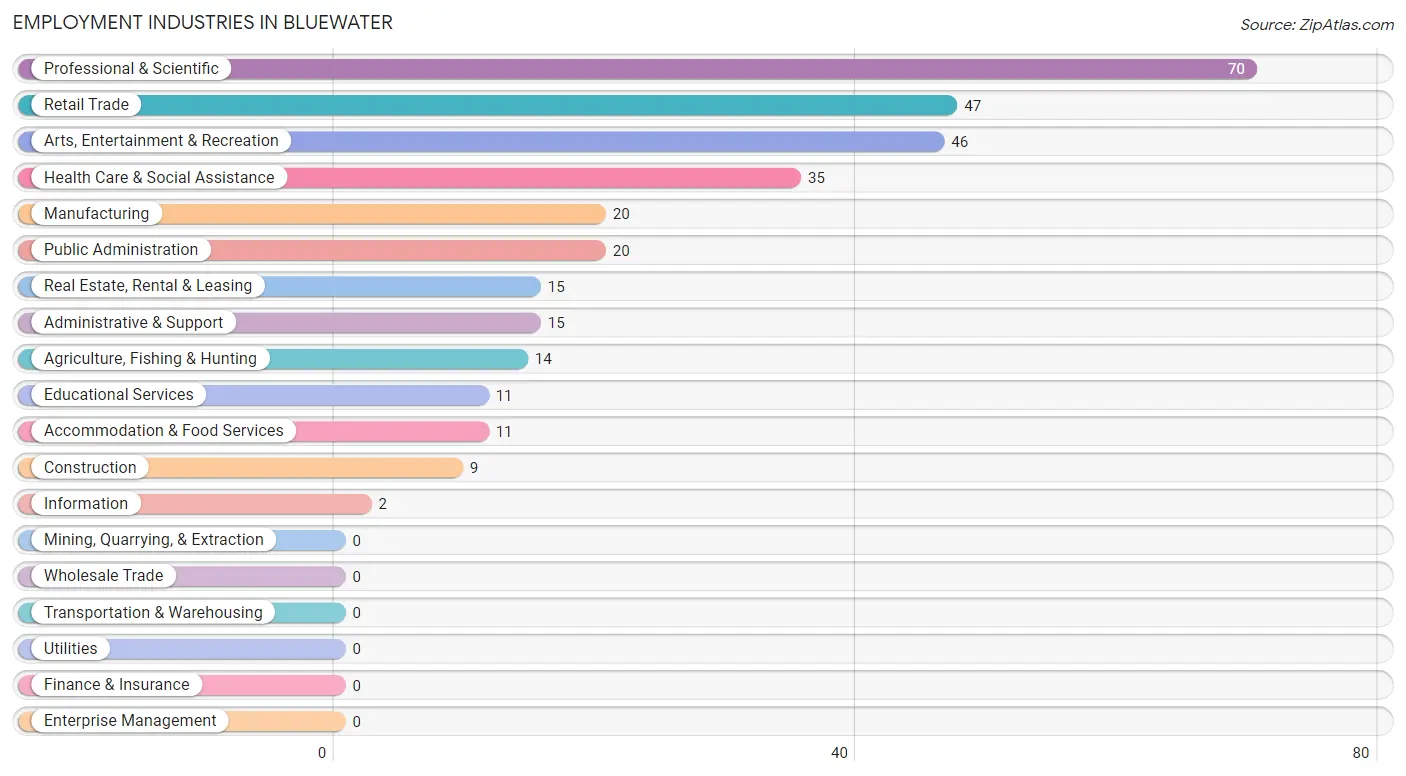
Employment Industries in Bluewater
The major employment industries in Bluewater include Professional & Scientific (70 | 22.0%), Retail Trade (47 | 14.8%), Arts, Entertainment & Recreation (46 | 14.5%), Health Care & Social Assistance (35 | 11.0%), and Manufacturing (20 | 6.3%).
Employment Industries by Sex in Bluewater
The Bluewater industries that see more men than women are Agriculture, Fishing & Hunting (100.0%), Construction (100.0%), and Information (100.0%), whereas the industries that tend to have a higher number of women are Educational Services (100.0%), Health Care & Social Assistance (100.0%), and Public Administration (100.0%).
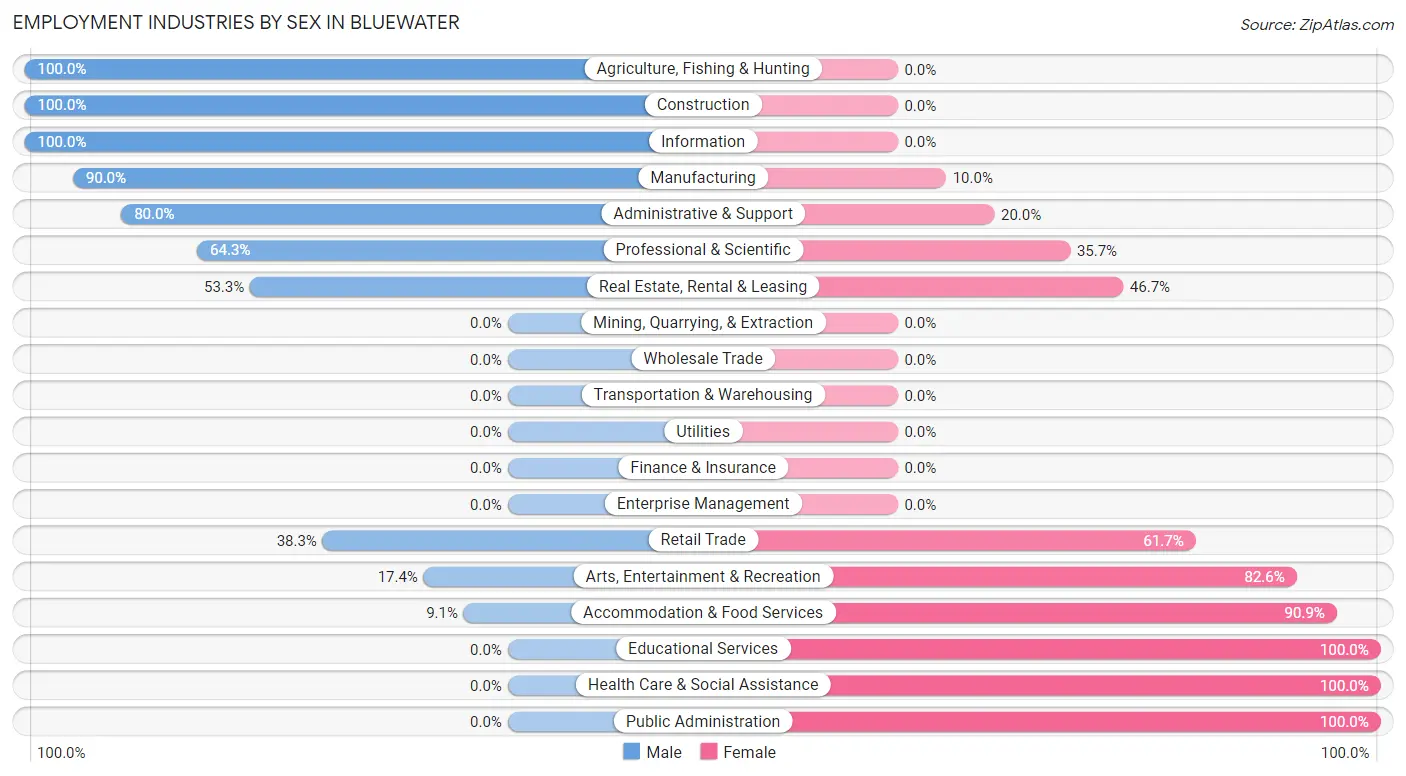
| Industry | Male | Female |
| Agriculture, Fishing & Hunting | 14 (100.0%) | 0 (0.0%) |
| Mining, Quarrying, & Extraction | 0 (0.0%) | 0 (0.0%) |
| Construction | 9 (100.0%) | 0 (0.0%) |
| Manufacturing | 18 (90.0%) | 2 (10.0%) |
| Wholesale Trade | 0 (0.0%) | 0 (0.0%) |
| Retail Trade | 18 (38.3%) | 29 (61.7%) |
| Transportation & Warehousing | 0 (0.0%) | 0 (0.0%) |
| Utilities | 0 (0.0%) | 0 (0.0%) |
| Information | 2 (100.0%) | 0 (0.0%) |
| Finance & Insurance | 0 (0.0%) | 0 (0.0%) |
| Real Estate, Rental & Leasing | 8 (53.3%) | 7 (46.7%) |
| Professional & Scientific | 45 (64.3%) | 25 (35.7%) |
| Enterprise Management | 0 (0.0%) | 0 (0.0%) |
| Administrative & Support | 12 (80.0%) | 3 (20.0%) |
| Educational Services | 0 (0.0%) | 11 (100.0%) |
| Health Care & Social Assistance | 0 (0.0%) | 35 (100.0%) |
| Arts, Entertainment & Recreation | 8 (17.4%) | 38 (82.6%) |
| Accommodation & Food Services | 1 (9.1%) | 10 (90.9%) |
| Public Administration | 0 (0.0%) | 20 (100.0%) |
| Total | 138 (43.4%) | 180 (56.6%) |
Education in Bluewater
School Enrollment in Bluewater
The most common levels of schooling among the 145 students in Bluewater are elementary school (32 | 22.1%), middle school (30 | 20.7%), and college / undergraduate (26 | 17.9%).
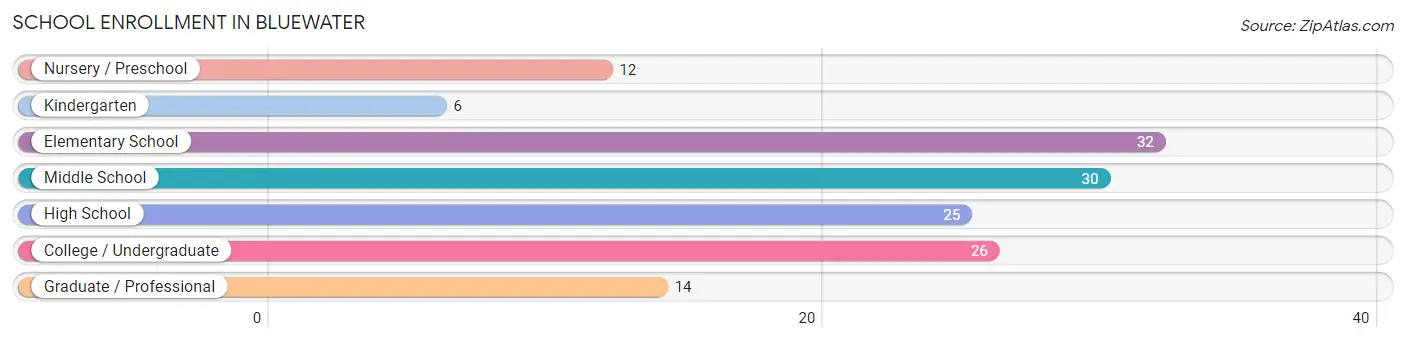
| School Level | # Students | % Students |
| Nursery / Preschool | 12 | 8.3% |
| Kindergarten | 6 | 4.1% |
| Elementary School | 32 | 22.1% |
| Middle School | 30 | 20.7% |
| High School | 25 | 17.2% |
| College / Undergraduate | 26 | 17.9% |
| Graduate / Professional | 14 | 9.7% |
| Total | 145 | 100.0% |
School Enrollment by Age by Funding Source in Bluewater
Out of a total of 145 students who are enrolled in schools in Bluewater, 30 (20.7%) attend a private institution, while the remaining 115 (79.3%) are enrolled in public schools. The age group of 35 years and over has the highest likelihood of being enrolled in private schools, with 15 (71.4% in the age bracket) enrolled. Conversely, the age group of 3 to 4 year olds has the lowest likelihood of being enrolled in a private school, with 7 (100.0% in the age bracket) attending a public institution.
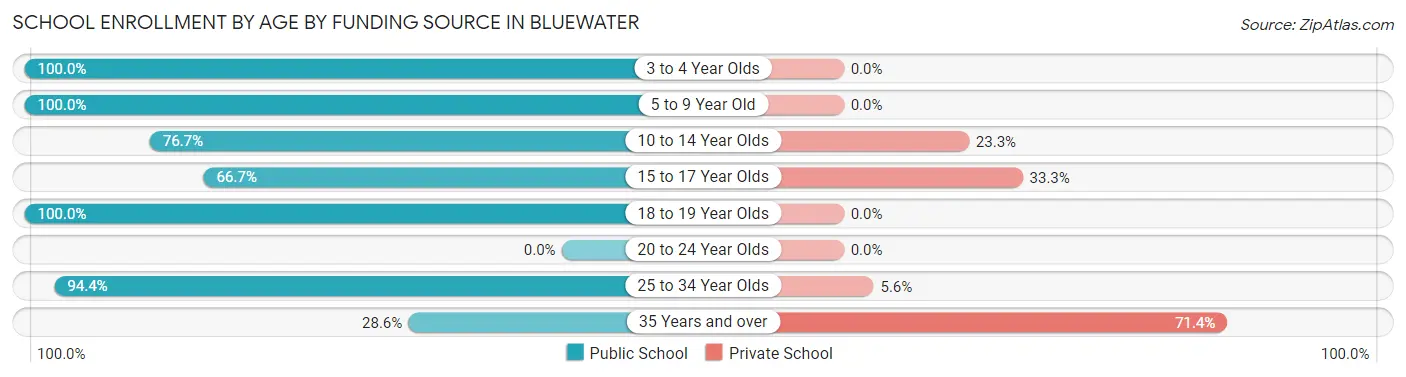
| Age Bracket | Public School | Private School |
| 3 to 4 Year Olds | 7 (100.0%) | 0 (0.0%) |
| 5 to 9 Year Old | 43 (100.0%) | 0 (0.0%) |
| 10 to 14 Year Olds | 23 (76.7%) | 7 (23.3%) |
| 15 to 17 Year Olds | 14 (66.7%) | 7 (33.3%) |
| 18 to 19 Year Olds | 5 (100.0%) | 0 (0.0%) |
| 20 to 24 Year Olds | 0 (0.0%) | 0 (0.0%) |
| 25 to 34 Year Olds | 17 (94.4%) | 1 (5.6%) |
| 35 Years and over | 6 (28.6%) | 15 (71.4%) |
| Total | 115 (79.3%) | 30 (20.7%) |
Educational Attainment by Field of Study in Bluewater
Physical & health sciences (21 | 41.2%), business (14 | 27.5%), social sciences (8 | 15.7%), and education (8 | 15.7%) are the most common fields of study among 51 individuals in Bluewater who have obtained a bachelor's degree or higher.
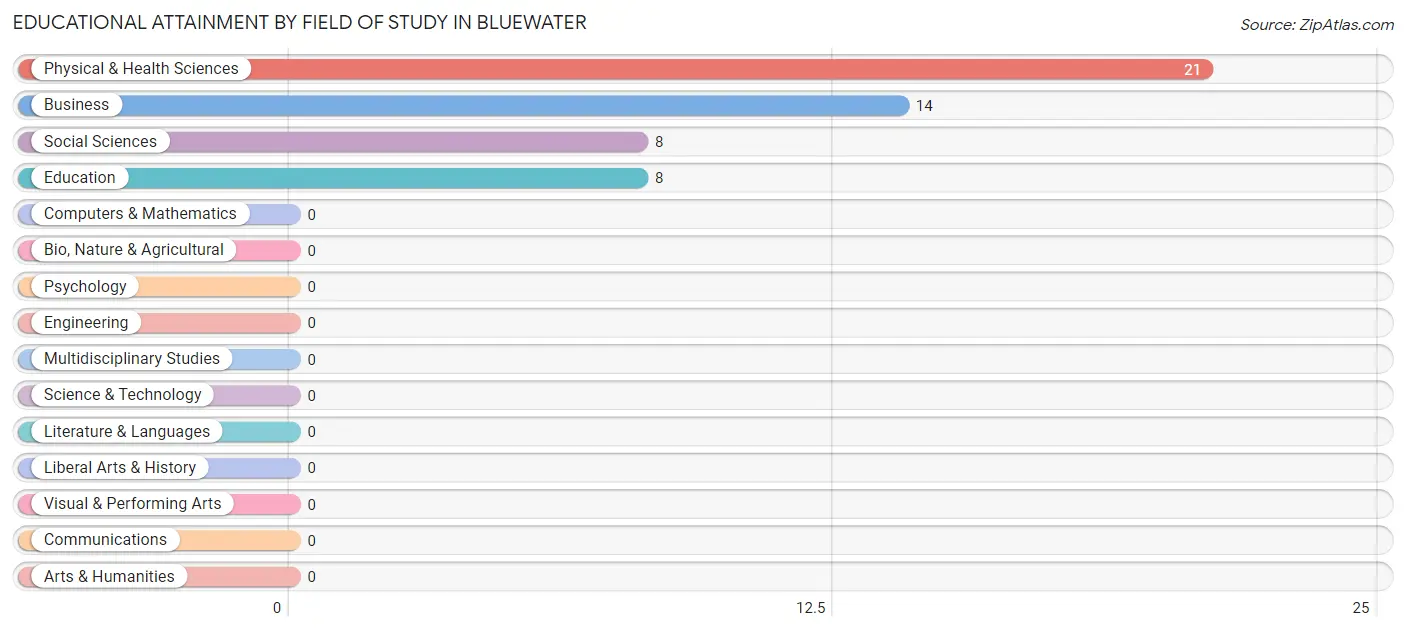
| Field of Study | # Graduates | % Graduates |
| Computers & Mathematics | 0 | 0.0% |
| Bio, Nature & Agricultural | 0 | 0.0% |
| Physical & Health Sciences | 21 | 41.2% |
| Psychology | 0 | 0.0% |
| Social Sciences | 8 | 15.7% |
| Engineering | 0 | 0.0% |
| Multidisciplinary Studies | 0 | 0.0% |
| Science & Technology | 0 | 0.0% |
| Business | 14 | 27.5% |
| Education | 8 | 15.7% |
| Literature & Languages | 0 | 0.0% |
| Liberal Arts & History | 0 | 0.0% |
| Visual & Performing Arts | 0 | 0.0% |
| Communications | 0 | 0.0% |
| Arts & Humanities | 0 | 0.0% |
| Total | 51 | 100.0% |
Transportation & Commute in Bluewater
Vehicle Availability by Sex in Bluewater
The most prevalent vehicle ownership categories in Bluewater are males with 3 vehicles (59, accounting for 42.7%) and females with 3 vehicles (55, making up 37.3%).
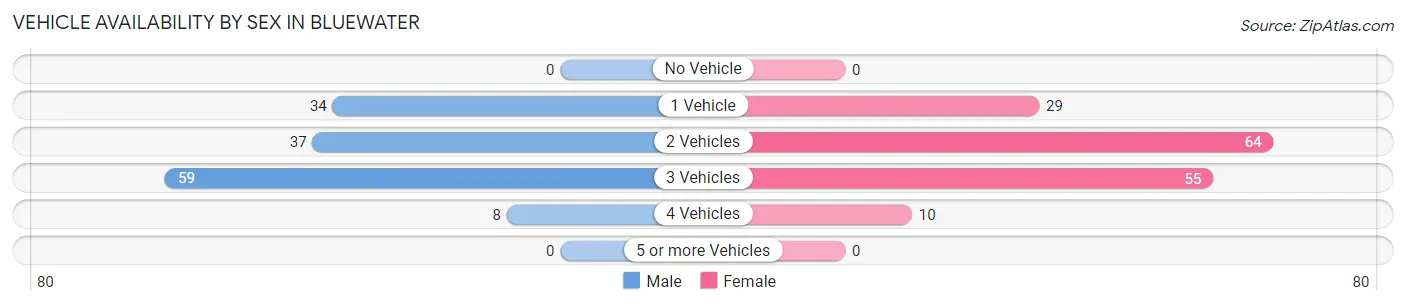
| Vehicles Available | Male | Female |
| No Vehicle | 0 (0.0%) | 0 (0.0%) |
| 1 Vehicle | 34 (24.6%) | 29 (18.3%) |
| 2 Vehicles | 37 (26.8%) | 64 (40.5%) |
| 3 Vehicles | 59 (42.7%) | 55 (34.8%) |
| 4 Vehicles | 8 (5.8%) | 10 (6.3%) |
| 5 or more Vehicles | 0 (0.0%) | 0 (0.0%) |
| Total | 138 (100.0%) | 158 (100.0%) |
Commute Time in Bluewater
The most frequently occuring commute durations in Bluewater are 5 to 9 minutes (112 commuters, 38.4%), 10 to 14 minutes (94 commuters, 32.2%), and less than 5 minutes (45 commuters, 15.4%).
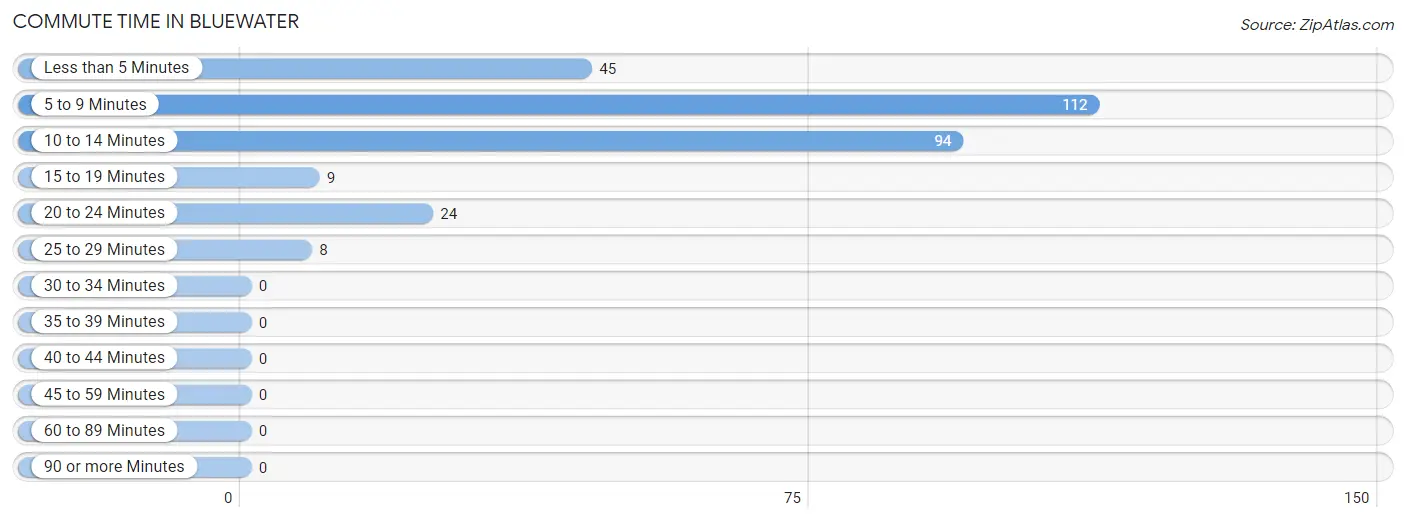
| Commute Time | # Commuters | % Commuters |
| Less than 5 Minutes | 45 | 15.4% |
| 5 to 9 Minutes | 112 | 38.4% |
| 10 to 14 Minutes | 94 | 32.2% |
| 15 to 19 Minutes | 9 | 3.1% |
| 20 to 24 Minutes | 24 | 8.2% |
| 25 to 29 Minutes | 8 | 2.7% |
| 30 to 34 Minutes | 0 | 0.0% |
| 35 to 39 Minutes | 0 | 0.0% |
| 40 to 44 Minutes | 0 | 0.0% |
| 45 to 59 Minutes | 0 | 0.0% |
| 60 to 89 Minutes | 0 | 0.0% |
| 90 or more Minutes | 0 | 0.0% |
Commute Time by Sex in Bluewater
The most common commute times in Bluewater are 10 to 14 minutes (82 commuters, 61.2%) for males and 5 to 9 minutes (102 commuters, 64.6%) for females.
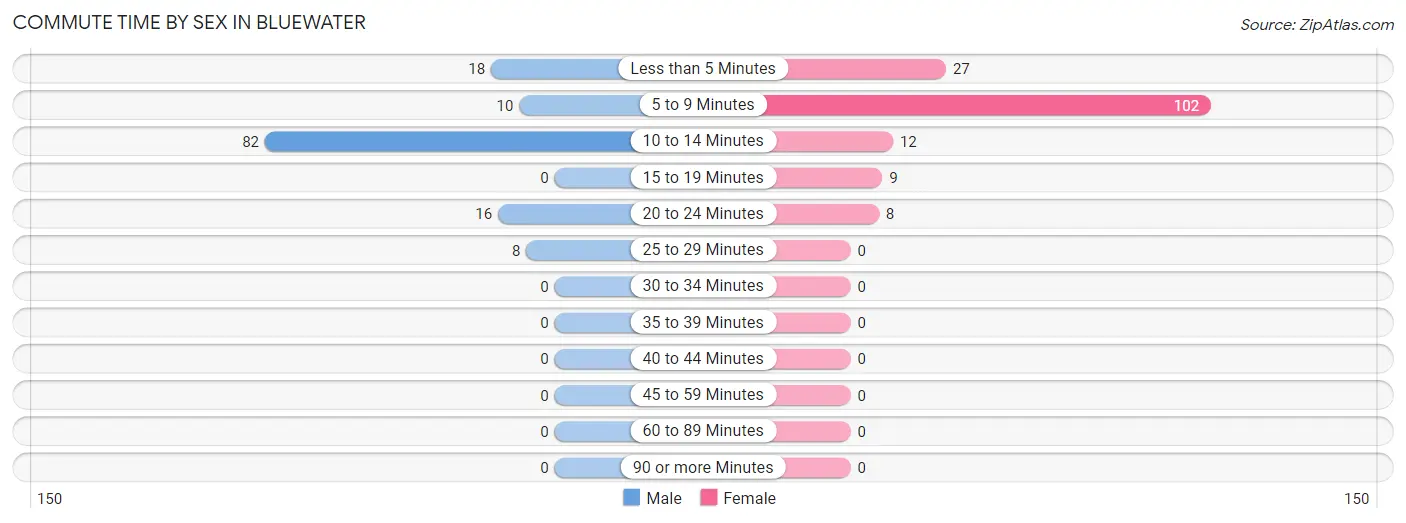
| Commute Time | Male | Female |
| Less than 5 Minutes | 18 (13.4%) | 27 (17.1%) |
| 5 to 9 Minutes | 10 (7.5%) | 102 (64.6%) |
| 10 to 14 Minutes | 82 (61.2%) | 12 (7.6%) |
| 15 to 19 Minutes | 0 (0.0%) | 9 (5.7%) |
| 20 to 24 Minutes | 16 (11.9%) | 8 (5.1%) |
| 25 to 29 Minutes | 8 (6.0%) | 0 (0.0%) |
| 30 to 34 Minutes | 0 (0.0%) | 0 (0.0%) |
| 35 to 39 Minutes | 0 (0.0%) | 0 (0.0%) |
| 40 to 44 Minutes | 0 (0.0%) | 0 (0.0%) |
| 45 to 59 Minutes | 0 (0.0%) | 0 (0.0%) |
| 60 to 89 Minutes | 0 (0.0%) | 0 (0.0%) |
| 90 or more Minutes | 0 (0.0%) | 0 (0.0%) |
Time of Departure to Work by Sex in Bluewater
The most frequent times of departure to work in Bluewater are 7:30 AM to 7:59 AM (83, 61.9%) for males and 7:30 AM to 7:59 AM (69, 43.7%) for females.
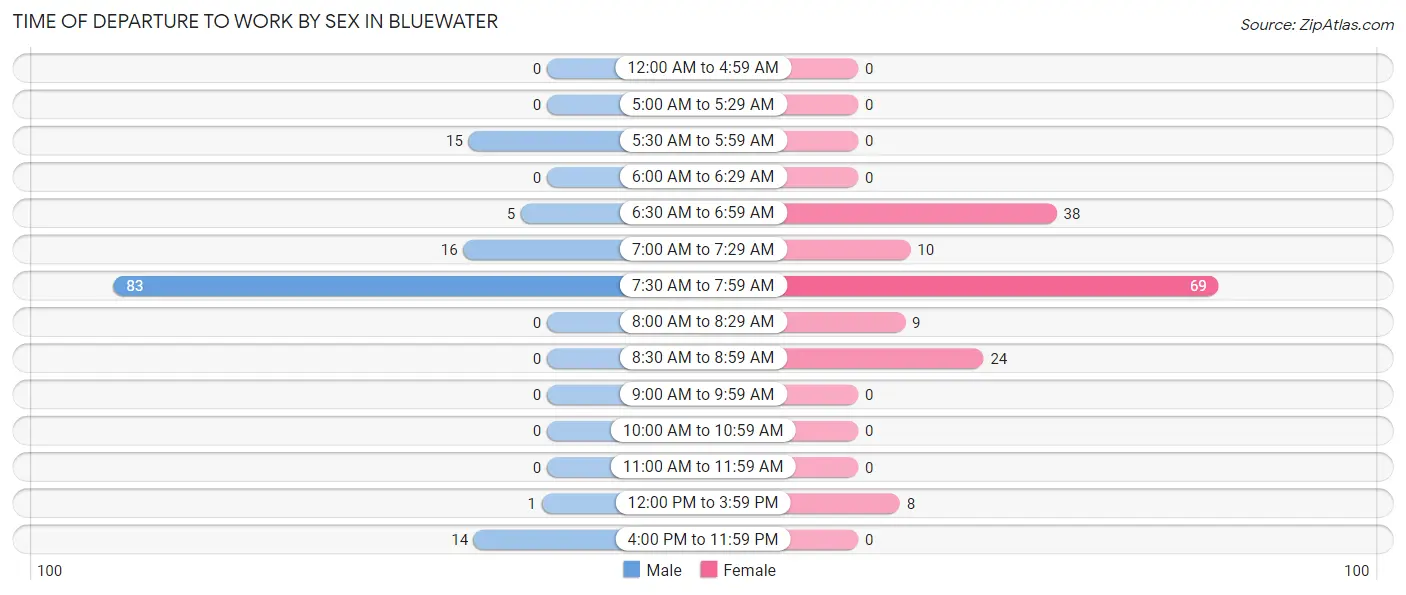
| Time of Departure | Male | Female |
| 12:00 AM to 4:59 AM | 0 (0.0%) | 0 (0.0%) |
| 5:00 AM to 5:29 AM | 0 (0.0%) | 0 (0.0%) |
| 5:30 AM to 5:59 AM | 15 (11.2%) | 0 (0.0%) |
| 6:00 AM to 6:29 AM | 0 (0.0%) | 0 (0.0%) |
| 6:30 AM to 6:59 AM | 5 (3.7%) | 38 (24.0%) |
| 7:00 AM to 7:29 AM | 16 (11.9%) | 10 (6.3%) |
| 7:30 AM to 7:59 AM | 83 (61.9%) | 69 (43.7%) |
| 8:00 AM to 8:29 AM | 0 (0.0%) | 9 (5.7%) |
| 8:30 AM to 8:59 AM | 0 (0.0%) | 24 (15.2%) |
| 9:00 AM to 9:59 AM | 0 (0.0%) | 0 (0.0%) |
| 10:00 AM to 10:59 AM | 0 (0.0%) | 0 (0.0%) |
| 11:00 AM to 11:59 AM | 0 (0.0%) | 0 (0.0%) |
| 12:00 PM to 3:59 PM | 1 (0.7%) | 8 (5.1%) |
| 4:00 PM to 11:59 PM | 14 (10.4%) | 0 (0.0%) |
| Total | 134 (100.0%) | 158 (100.0%) |
Housing Occupancy in Bluewater
Occupancy by Ownership in Bluewater
Of the total 408 dwellings in Bluewater, owner-occupied units account for 336 (82.4%), while renter-occupied units make up 72 (17.6%).
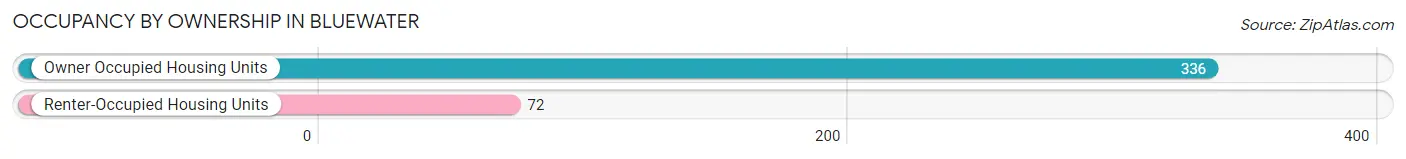
| Occupancy | # Housing Units | % Housing Units |
| Owner Occupied Housing Units | 336 | 82.4% |
| Renter-Occupied Housing Units | 72 | 17.6% |
| Total Occupied Housing Units | 408 | 100.0% |
Occupancy by Household Size in Bluewater
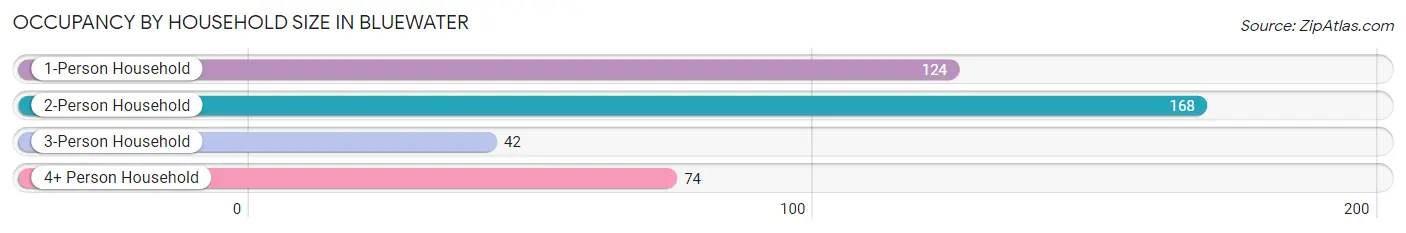
| Household Size | # Housing Units | % Housing Units |
| 1-Person Household | 124 | 30.4% |
| 2-Person Household | 168 | 41.2% |
| 3-Person Household | 42 | 10.3% |
| 4+ Person Household | 74 | 18.1% |
| Total Housing Units | 408 | 100.0% |
Occupancy by Ownership by Household Size in Bluewater
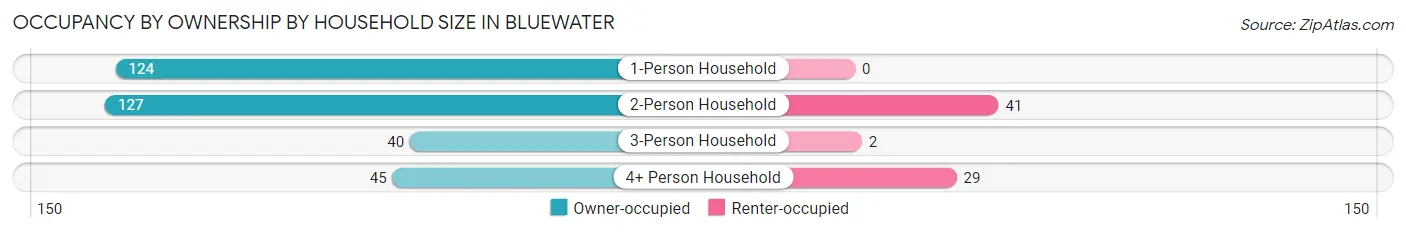
| Household Size | Owner-occupied | Renter-occupied |
| 1-Person Household | 124 (100.0%) | 0 (0.0%) |
| 2-Person Household | 127 (75.6%) | 41 (24.4%) |
| 3-Person Household | 40 (95.2%) | 2 (4.8%) |
| 4+ Person Household | 45 (60.8%) | 29 (39.2%) |
| Total Housing Units | 336 (82.4%) | 72 (17.6%) |
Occupancy by Educational Attainment in Bluewater
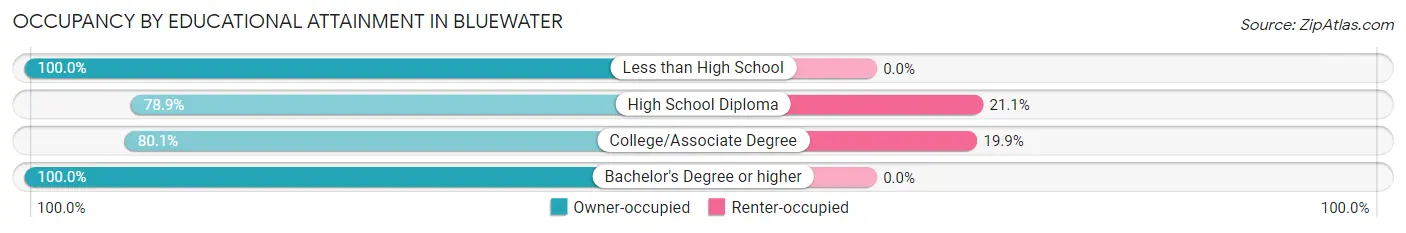
| Household Size | Owner-occupied | Renter-occupied |
| Less than High School | 28 (100.0%) | 0 (0.0%) |
| High School Diploma | 116 (78.9%) | 31 (21.1%) |
| College/Associate Degree | 165 (80.1%) | 41 (19.9%) |
| Bachelor's Degree or higher | 27 (100.0%) | 0 (0.0%) |
Occupancy by Age of Householder in Bluewater
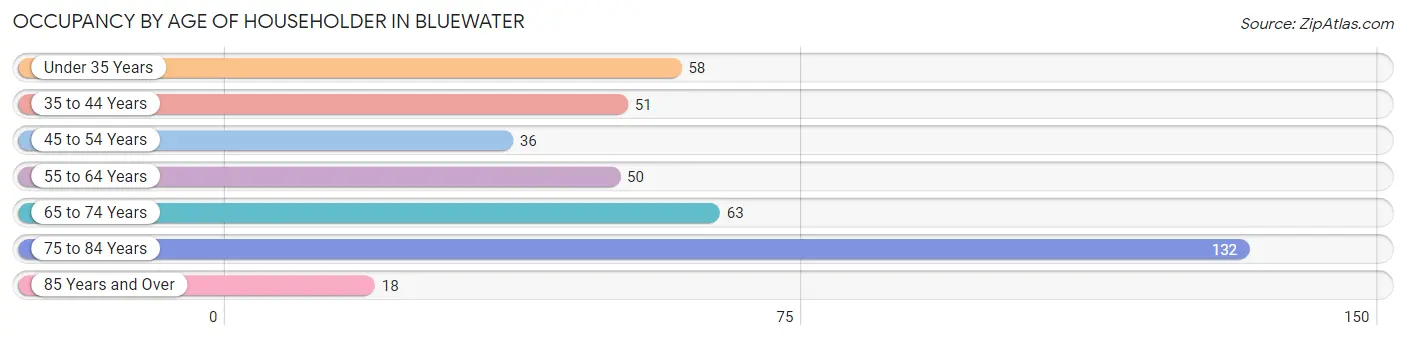
| Age Bracket | # Households | % Households |
| Under 35 Years | 58 | 14.2% |
| 35 to 44 Years | 51 | 12.5% |
| 45 to 54 Years | 36 | 8.8% |
| 55 to 64 Years | 50 | 12.2% |
| 65 to 74 Years | 63 | 15.4% |
| 75 to 84 Years | 132 | 32.4% |
| 85 Years and Over | 18 | 4.4% |
| Total | 408 | 100.0% |
Housing Finances in Bluewater
Median Income by Occupancy in Bluewater
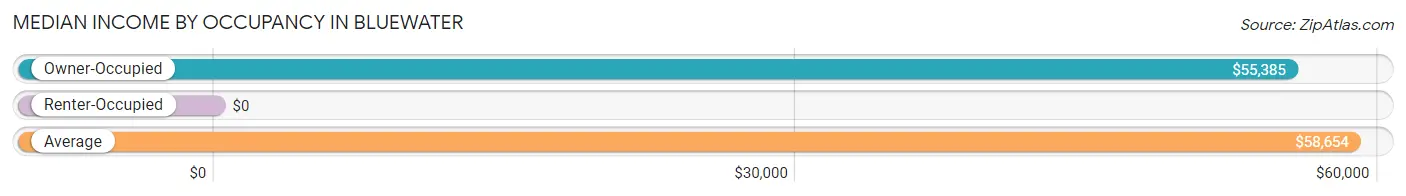
| Occupancy Type | # Households | Median Income |
| Owner-Occupied | 336 (82.4%) | $55,385 |
| Renter-Occupied | 72 (17.6%) | $0 |
| Average | 408 (100.0%) | $58,654 |
Occupancy by Householder Income Bracket in Bluewater
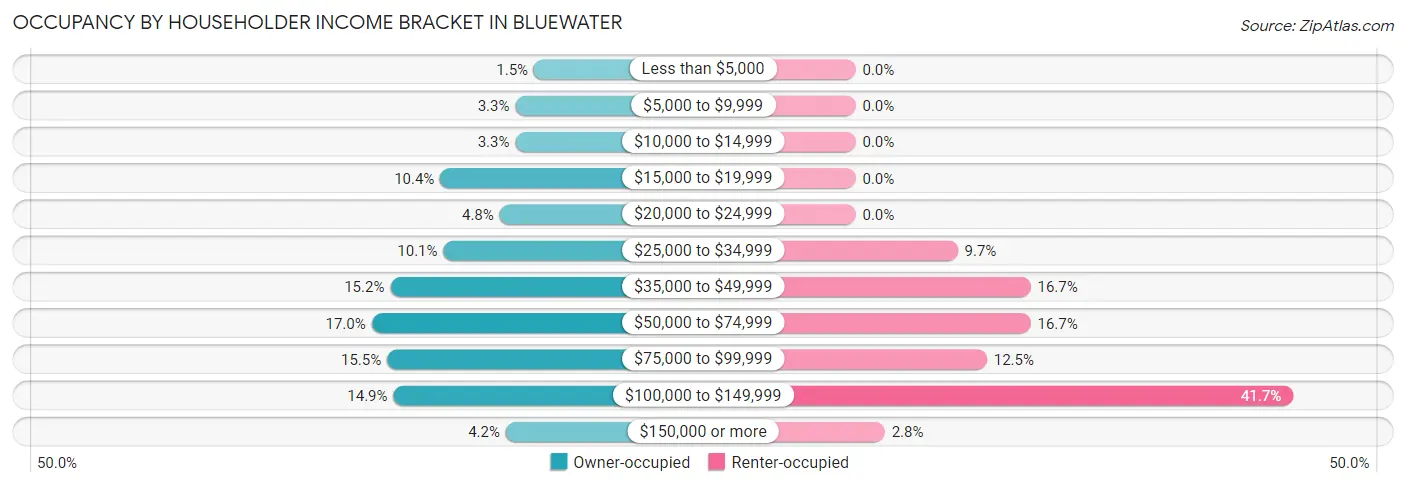
| Income Bracket | Owner-occupied | Renter-occupied |
| Less than $5,000 | 5 (1.5%) | 0 (0.0%) |
| $5,000 to $9,999 | 11 (3.3%) | 0 (0.0%) |
| $10,000 to $14,999 | 11 (3.3%) | 0 (0.0%) |
| $15,000 to $19,999 | 35 (10.4%) | 0 (0.0%) |
| $20,000 to $24,999 | 16 (4.8%) | 0 (0.0%) |
| $25,000 to $34,999 | 34 (10.1%) | 7 (9.7%) |
| $35,000 to $49,999 | 51 (15.2%) | 12 (16.7%) |
| $50,000 to $74,999 | 57 (17.0%) | 12 (16.7%) |
| $75,000 to $99,999 | 52 (15.5%) | 9 (12.5%) |
| $100,000 to $149,999 | 50 (14.9%) | 30 (41.7%) |
| $150,000 or more | 14 (4.2%) | 2 (2.8%) |
| Total | 336 (100.0%) | 72 (100.0%) |
Monthly Housing Cost Tiers in Bluewater
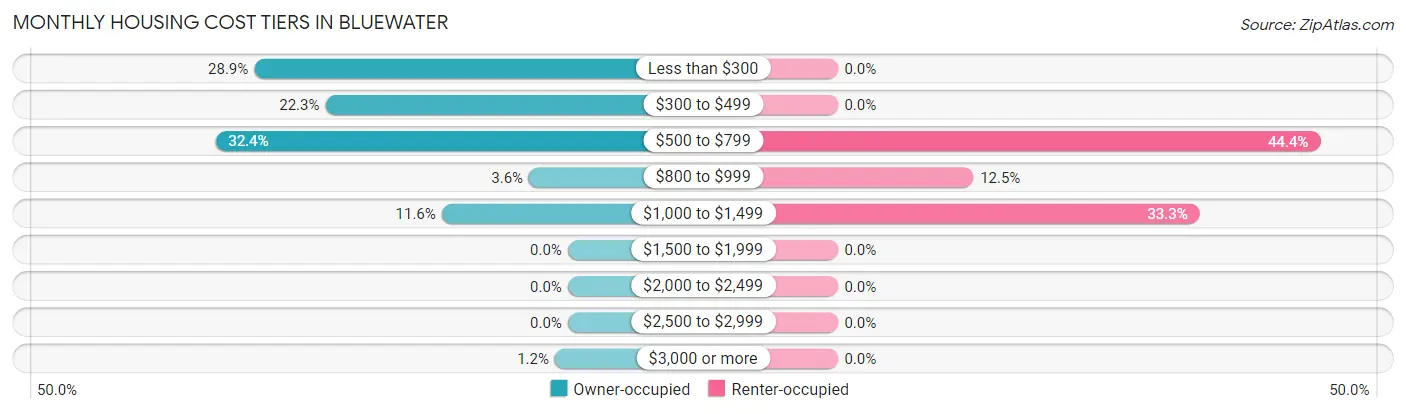
| Monthly Cost | Owner-occupied | Renter-occupied |
| Less than $300 | 97 (28.9%) | 0 (0.0%) |
| $300 to $499 | 75 (22.3%) | 0 (0.0%) |
| $500 to $799 | 109 (32.4%) | 32 (44.4%) |
| $800 to $999 | 12 (3.6%) | 9 (12.5%) |
| $1,000 to $1,499 | 39 (11.6%) | 24 (33.3%) |
| $1,500 to $1,999 | 0 (0.0%) | 0 (0.0%) |
| $2,000 to $2,499 | 0 (0.0%) | 0 (0.0%) |
| $2,500 to $2,999 | 0 (0.0%) | 0 (0.0%) |
| $3,000 or more | 4 (1.2%) | 0 (0.0%) |
| Total | 336 (100.0%) | 72 (100.0%) |
Physical Housing Characteristics in Bluewater
Housing Structures in Bluewater
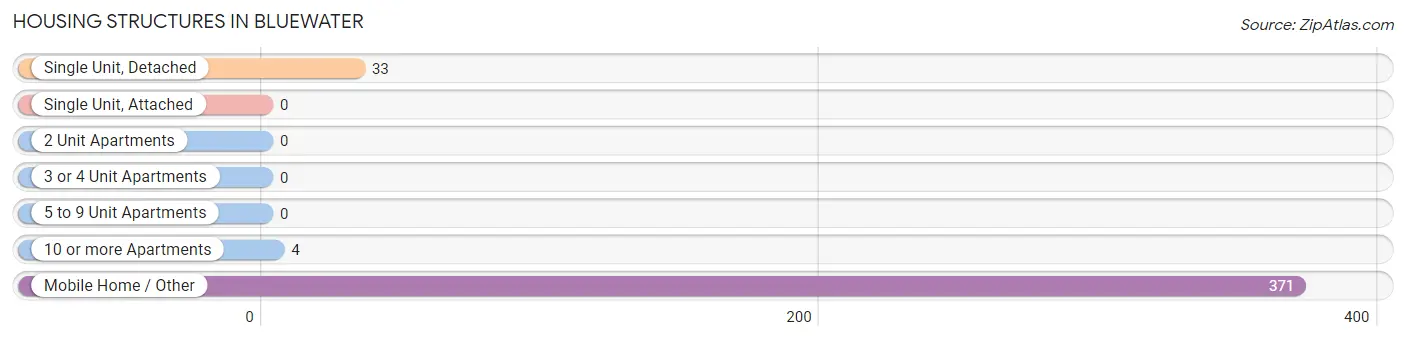
| Structure Type | # Housing Units | % Housing Units |
| Single Unit, Detached | 33 | 8.1% |
| Single Unit, Attached | 0 | 0.0% |
| 2 Unit Apartments | 0 | 0.0% |
| 3 or 4 Unit Apartments | 0 | 0.0% |
| 5 to 9 Unit Apartments | 0 | 0.0% |
| 10 or more Apartments | 4 | 1.0% |
| Mobile Home / Other | 371 | 90.9% |
| Total | 408 | 100.0% |
Housing Structures by Occupancy in Bluewater
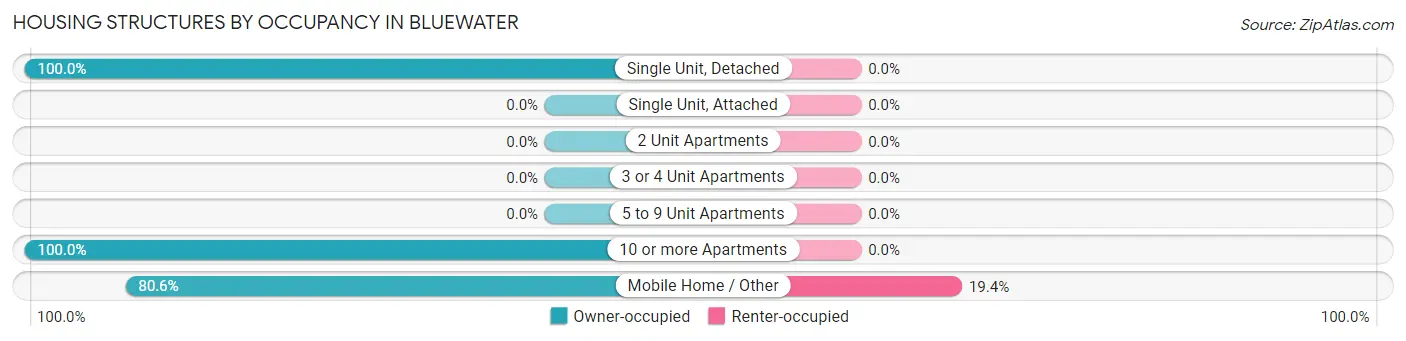
| Structure Type | Owner-occupied | Renter-occupied |
| Single Unit, Detached | 33 (100.0%) | 0 (0.0%) |
| Single Unit, Attached | 0 (0.0%) | 0 (0.0%) |
| 2 Unit Apartments | 0 (0.0%) | 0 (0.0%) |
| 3 or 4 Unit Apartments | 0 (0.0%) | 0 (0.0%) |
| 5 to 9 Unit Apartments | 0 (0.0%) | 0 (0.0%) |
| 10 or more Apartments | 4 (100.0%) | 0 (0.0%) |
| Mobile Home / Other | 299 (80.6%) | 72 (19.4%) |
| Total | 336 (82.4%) | 72 (17.6%) |
Housing Structures by Number of Rooms in Bluewater
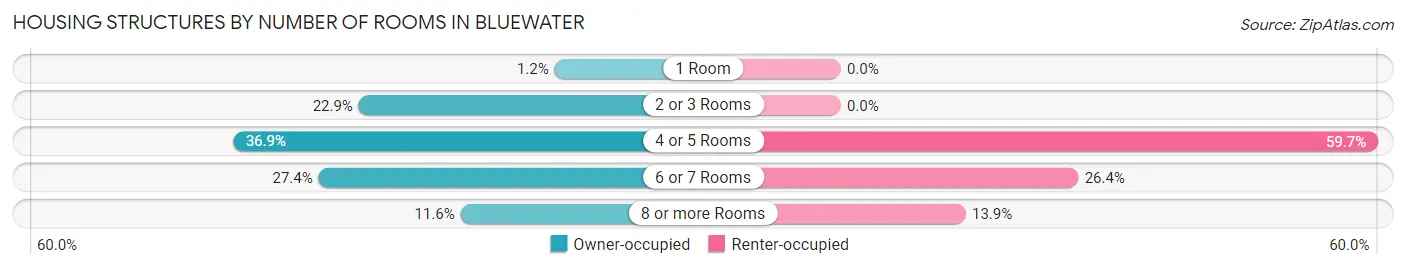
| Number of Rooms | Owner-occupied | Renter-occupied |
| 1 Room | 4 (1.2%) | 0 (0.0%) |
| 2 or 3 Rooms | 77 (22.9%) | 0 (0.0%) |
| 4 or 5 Rooms | 124 (36.9%) | 43 (59.7%) |
| 6 or 7 Rooms | 92 (27.4%) | 19 (26.4%) |
| 8 or more Rooms | 39 (11.6%) | 10 (13.9%) |
| Total | 336 (100.0%) | 72 (100.0%) |
Housing Structure by Heating Type in Bluewater
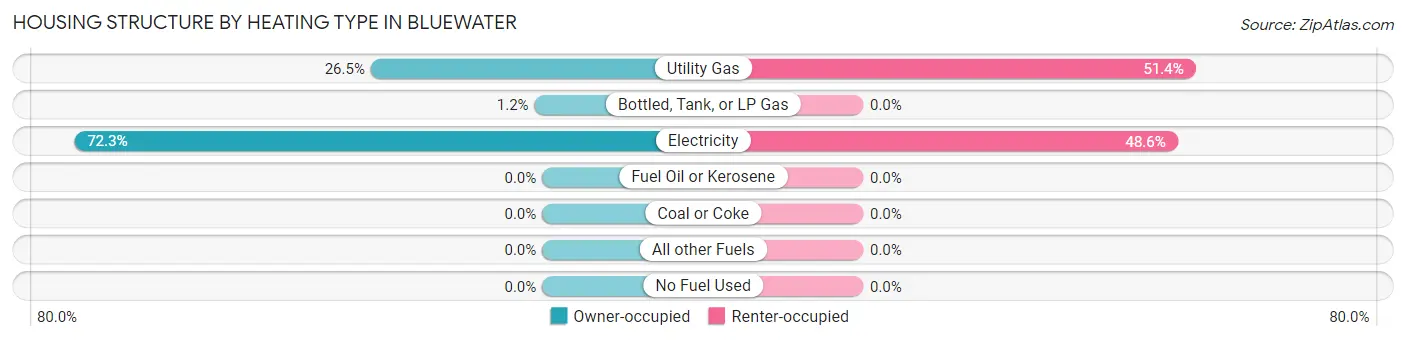
| Heating Type | Owner-occupied | Renter-occupied |
| Utility Gas | 89 (26.5%) | 37 (51.4%) |
| Bottled, Tank, or LP Gas | 4 (1.2%) | 0 (0.0%) |
| Electricity | 243 (72.3%) | 35 (48.6%) |
| Fuel Oil or Kerosene | 0 (0.0%) | 0 (0.0%) |
| Coal or Coke | 0 (0.0%) | 0 (0.0%) |
| All other Fuels | 0 (0.0%) | 0 (0.0%) |
| No Fuel Used | 0 (0.0%) | 0 (0.0%) |
| Total | 336 (100.0%) | 72 (100.0%) |
Household Vehicle Usage in Bluewater
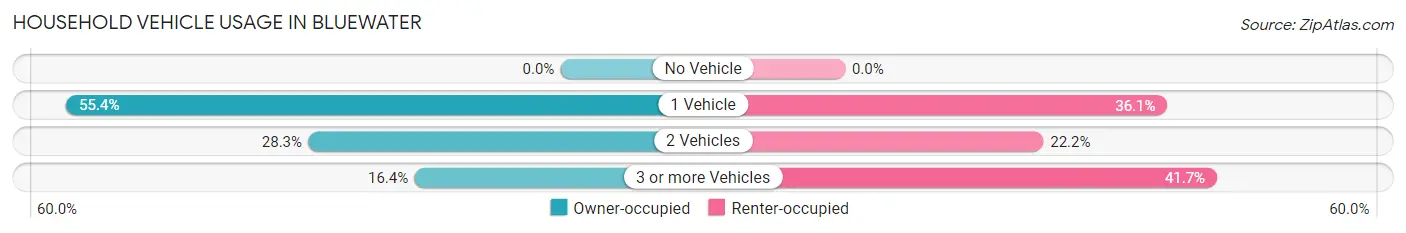
| Vehicles per Household | Owner-occupied | Renter-occupied |
| No Vehicle | 0 (0.0%) | 0 (0.0%) |
| 1 Vehicle | 186 (55.4%) | 26 (36.1%) |
| 2 Vehicles | 95 (28.3%) | 16 (22.2%) |
| 3 or more Vehicles | 55 (16.4%) | 30 (41.7%) |
| Total | 336 (100.0%) | 72 (100.0%) |
Real Estate & Mortgages in Bluewater
Real Estate and Mortgage Overview in Bluewater
| Characteristic | Without Mortgage | With Mortgage |
| Housing Units | 268 | 68 |
| Median Property Value | $90,300 | $0 |
| Median Household Income | $43,250 | $0 |
| Monthly Housing Costs | $374 | $0 |
| Real Estate Taxes | - | - |
Property Value by Mortgage Status in Bluewater
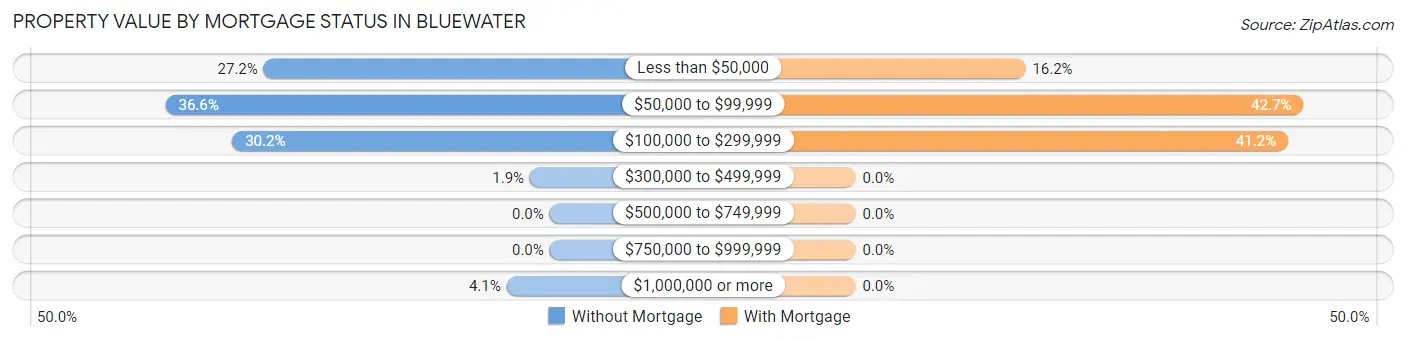
| Property Value | Without Mortgage | With Mortgage |
| Less than $50,000 | 73 (27.2%) | 11 (16.2%) |
| $50,000 to $99,999 | 98 (36.6%) | 29 (42.6%) |
| $100,000 to $299,999 | 81 (30.2%) | 28 (41.2%) |
| $300,000 to $499,999 | 5 (1.9%) | 0 (0.0%) |
| $500,000 to $749,999 | 0 (0.0%) | 0 (0.0%) |
| $750,000 to $999,999 | 0 (0.0%) | 0 (0.0%) |
| $1,000,000 or more | 11 (4.1%) | 0 (0.0%) |
| Total | 268 (100.0%) | 68 (100.0%) |
Household Income by Mortgage Status in Bluewater
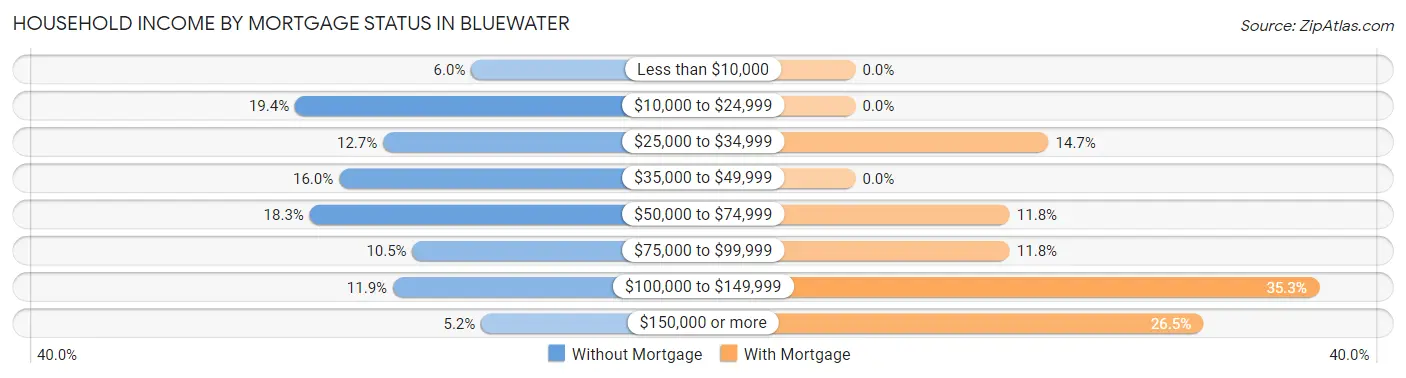
| Household Income | Without Mortgage | With Mortgage |
| Less than $10,000 | 16 (6.0%) | 0 (0.0%) |
| $10,000 to $24,999 | 52 (19.4%) | 0 (0.0%) |
| $25,000 to $34,999 | 34 (12.7%) | 10 (14.7%) |
| $35,000 to $49,999 | 43 (16.0%) | 0 (0.0%) |
| $50,000 to $74,999 | 49 (18.3%) | 8 (11.8%) |
| $75,000 to $99,999 | 28 (10.4%) | 8 (11.8%) |
| $100,000 to $149,999 | 32 (11.9%) | 24 (35.3%) |
| $150,000 or more | 14 (5.2%) | 18 (26.5%) |
| Total | 268 (100.0%) | 68 (100.0%) |
Property Value to Household Income Ratio in Bluewater
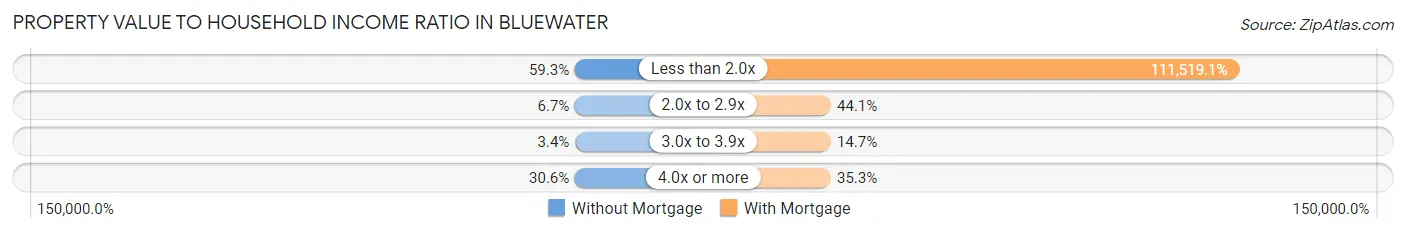
| Value-to-Income Ratio | Without Mortgage | With Mortgage |
| Less than 2.0x | 159 (59.3%) | 75,833 (111,519.1%) |
| 2.0x to 2.9x | 18 (6.7%) | 30 (44.1%) |
| 3.0x to 3.9x | 9 (3.4%) | 10 (14.7%) |
| 4.0x or more | 82 (30.6%) | 24 (35.3%) |
| Total | 268 (100.0%) | 68 (100.0%) |
Real Estate Taxes by Mortgage Status in Bluewater
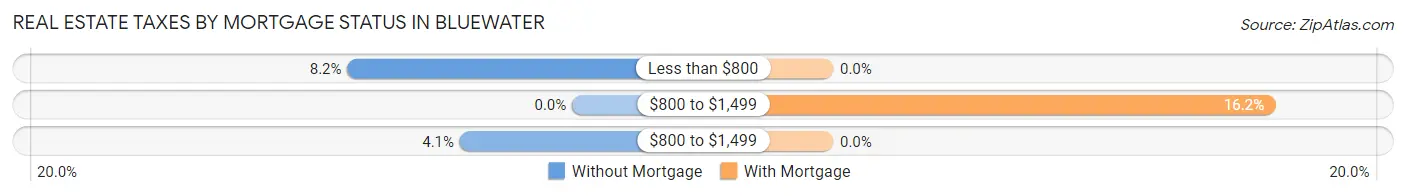
| Property Taxes | Without Mortgage | With Mortgage |
| Less than $800 | 22 (8.2%) | 0 (0.0%) |
| $800 to $1,499 | 0 (0.0%) | 11 (16.2%) |
| $800 to $1,499 | 11 (4.1%) | 0 (0.0%) |
| Total | 268 (100.0%) | 68 (100.0%) |
Health & Disability in Bluewater
Health Insurance Coverage by Age in Bluewater
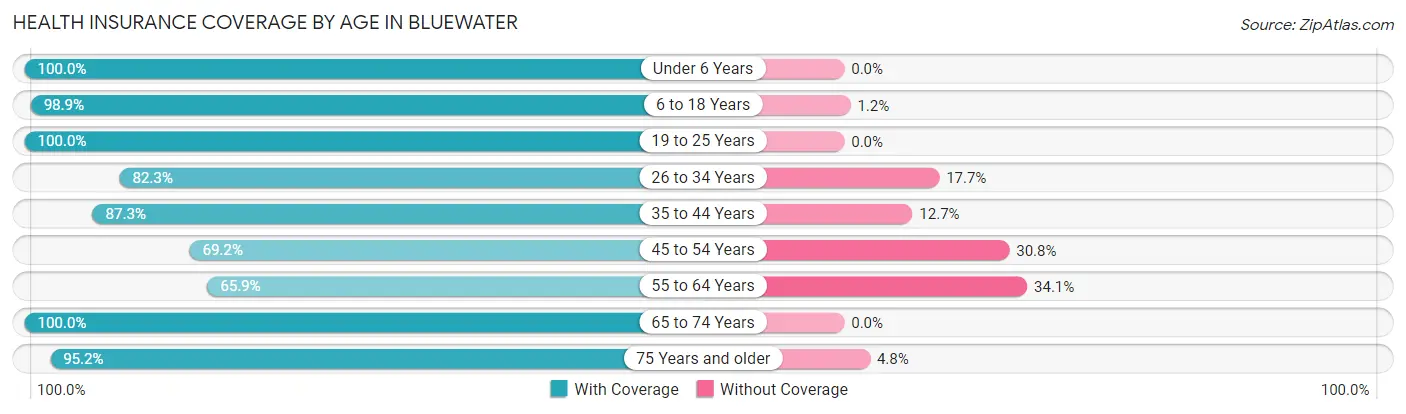
| Age Bracket | With Coverage | Without Coverage |
| Under 6 Years | 54 (100.0%) | 0 (0.0%) |
| 6 to 18 Years | 86 (98.9%) | 1 (1.1%) |
| 19 to 25 Years | 29 (100.0%) | 0 (0.0%) |
| 26 to 34 Years | 93 (82.3%) | 20 (17.7%) |
| 35 to 44 Years | 55 (87.3%) | 8 (12.7%) |
| 45 to 54 Years | 27 (69.2%) | 12 (30.8%) |
| 55 to 64 Years | 58 (65.9%) | 30 (34.1%) |
| 65 to 74 Years | 109 (100.0%) | 0 (0.0%) |
| 75 Years and older | 199 (95.2%) | 10 (4.8%) |
| Total | 710 (89.8%) | 81 (10.2%) |
Health Insurance Coverage by Citizenship Status in Bluewater
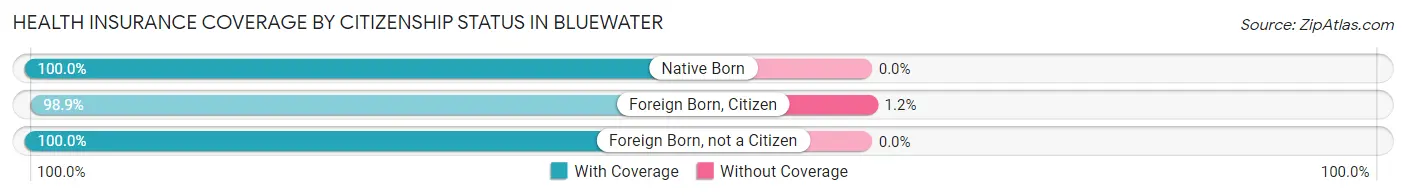
| Citizenship Status | With Coverage | Without Coverage |
| Native Born | 54 (100.0%) | 0 (0.0%) |
| Foreign Born, Citizen | 86 (98.9%) | 1 (1.1%) |
| Foreign Born, not a Citizen | 29 (100.0%) | 0 (0.0%) |
Health Insurance Coverage by Household Income in Bluewater
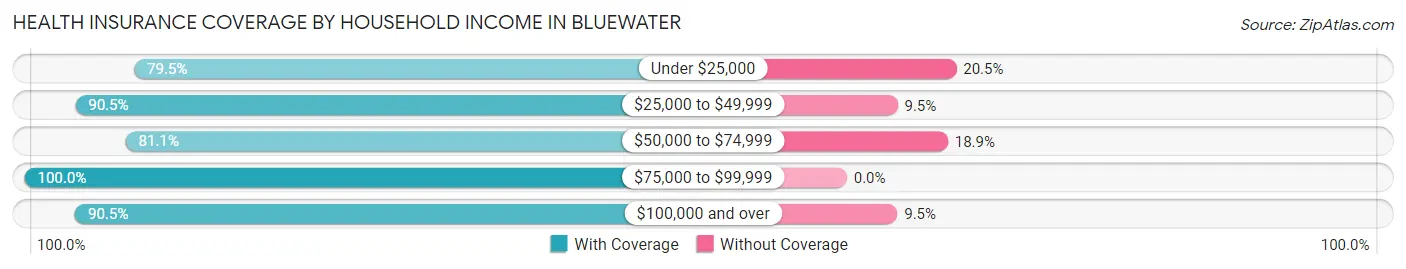
| Household Income | With Coverage | Without Coverage |
| Under $25,000 | 62 (79.5%) | 16 (20.5%) |
| $25,000 to $49,999 | 219 (90.5%) | 23 (9.5%) |
| $50,000 to $74,999 | 90 (81.1%) | 21 (18.9%) |
| $75,000 to $99,999 | 138 (100.0%) | 0 (0.0%) |
| $100,000 and over | 201 (90.5%) | 21 (9.5%) |
Public vs Private Health Insurance Coverage by Age in Bluewater
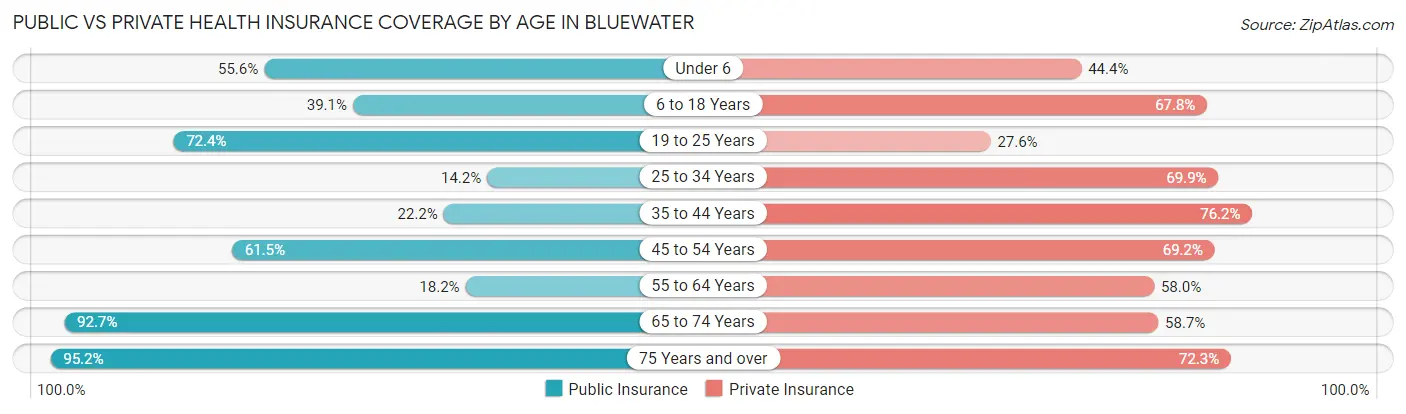
| Age Bracket | Public Insurance | Private Insurance |
| Under 6 | 30 (55.6%) | 24 (44.4%) |
| 6 to 18 Years | 34 (39.1%) | 59 (67.8%) |
| 19 to 25 Years | 21 (72.4%) | 8 (27.6%) |
| 25 to 34 Years | 16 (14.2%) | 79 (69.9%) |
| 35 to 44 Years | 14 (22.2%) | 48 (76.2%) |
| 45 to 54 Years | 24 (61.5%) | 27 (69.2%) |
| 55 to 64 Years | 16 (18.2%) | 51 (58.0%) |
| 65 to 74 Years | 101 (92.7%) | 64 (58.7%) |
| 75 Years and over | 199 (95.2%) | 151 (72.3%) |
| Total | 455 (57.5%) | 511 (64.6%) |
Disability Status by Sex by Age in Bluewater
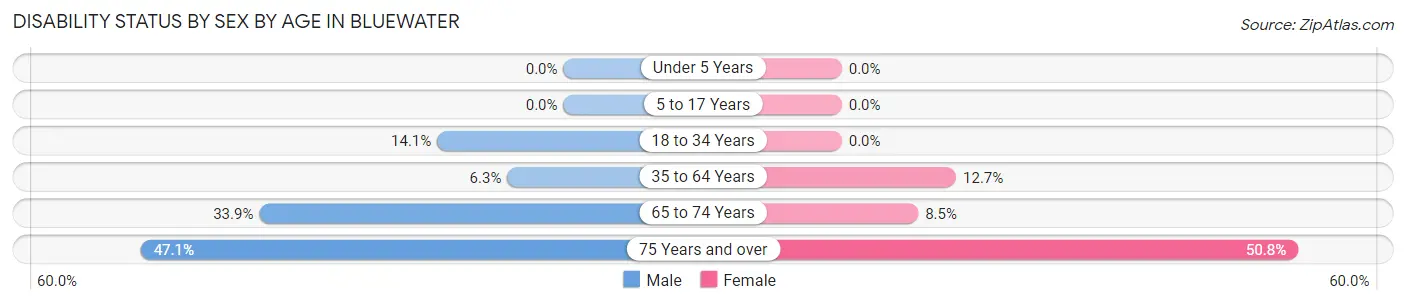
| Age Bracket | Male | Female |
| Under 5 Years | 0 (0.0%) | 0 (0.0%) |
| 5 to 17 Years | 0 (0.0%) | 0 (0.0%) |
| 18 to 34 Years | 9 (14.1%) | 0 (0.0%) |
| 35 to 64 Years | 5 (6.2%) | 14 (12.7%) |
| 65 to 74 Years | 21 (33.9%) | 4 (8.5%) |
| 75 Years and over | 40 (47.1%) | 63 (50.8%) |
Disability Class by Sex by Age in Bluewater
Disability Class: Hearing Difficulty
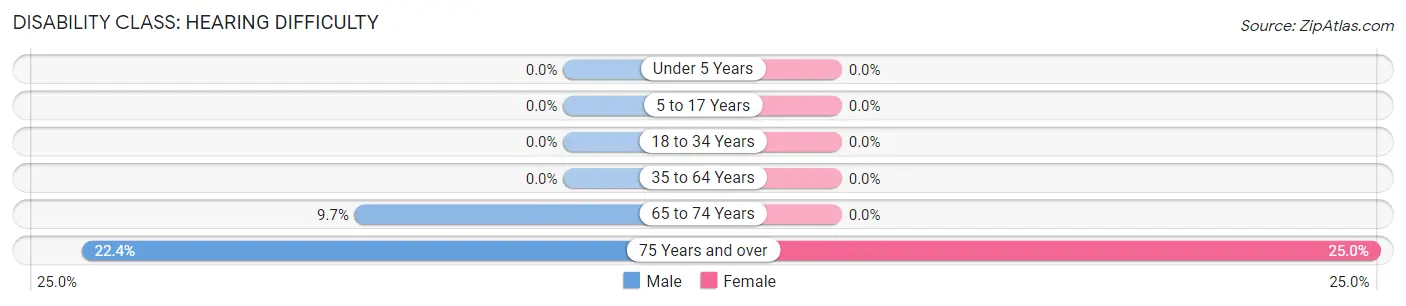
| Age Bracket | Male | Female |
| Under 5 Years | 0 (0.0%) | 0 (0.0%) |
| 5 to 17 Years | 0 (0.0%) | 0 (0.0%) |
| 18 to 34 Years | 0 (0.0%) | 0 (0.0%) |
| 35 to 64 Years | 0 (0.0%) | 0 (0.0%) |
| 65 to 74 Years | 6 (9.7%) | 0 (0.0%) |
| 75 Years and over | 19 (22.4%) | 31 (25.0%) |
Disability Class: Vision Difficulty
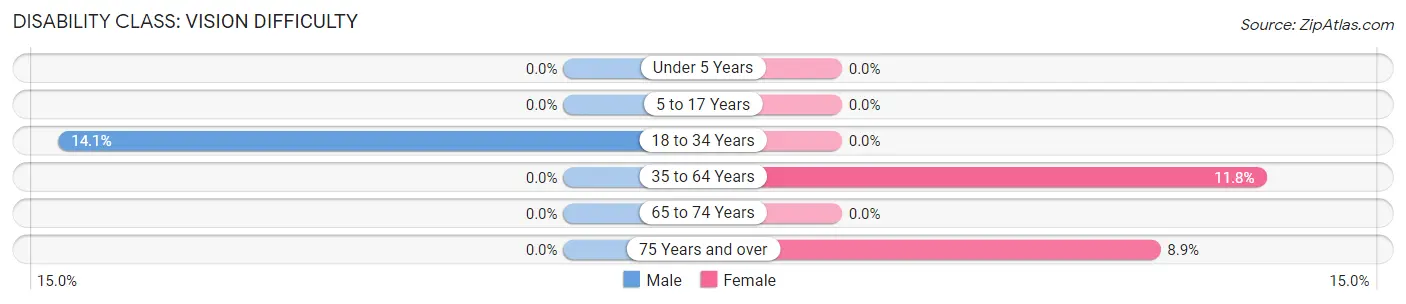
| Age Bracket | Male | Female |
| Under 5 Years | 0 (0.0%) | 0 (0.0%) |
| 5 to 17 Years | 0 (0.0%) | 0 (0.0%) |
| 18 to 34 Years | 9 (14.1%) | 0 (0.0%) |
| 35 to 64 Years | 0 (0.0%) | 13 (11.8%) |
| 65 to 74 Years | 0 (0.0%) | 0 (0.0%) |
| 75 Years and over | 0 (0.0%) | 11 (8.9%) |
Disability Class: Cognitive Difficulty
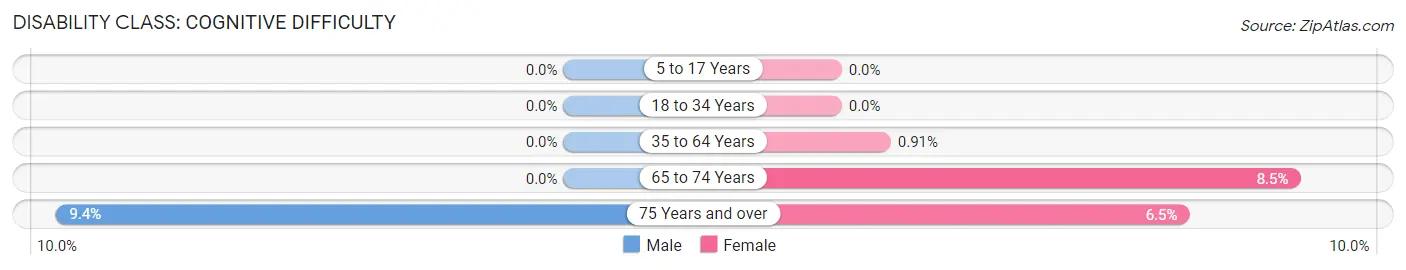
| Age Bracket | Male | Female |
| 5 to 17 Years | 0 (0.0%) | 0 (0.0%) |
| 18 to 34 Years | 0 (0.0%) | 0 (0.0%) |
| 35 to 64 Years | 0 (0.0%) | 1 (0.9%) |
| 65 to 74 Years | 0 (0.0%) | 4 (8.5%) |
| 75 Years and over | 8 (9.4%) | 8 (6.5%) |
Disability Class: Ambulatory Difficulty
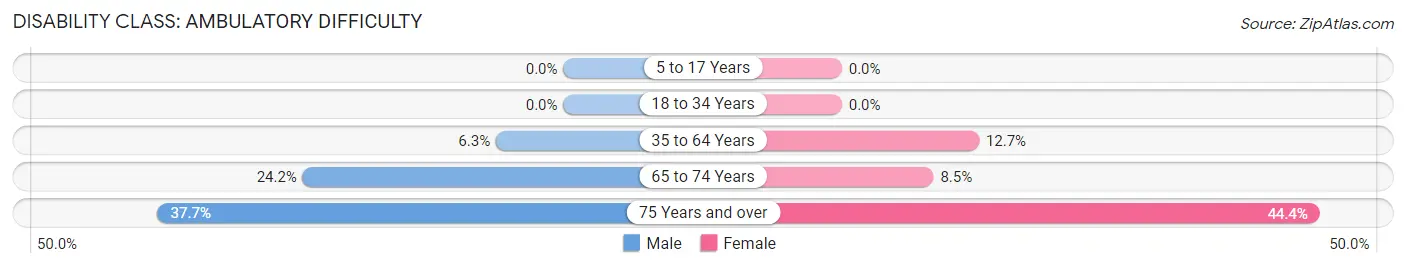
| Age Bracket | Male | Female |
| 5 to 17 Years | 0 (0.0%) | 0 (0.0%) |
| 18 to 34 Years | 0 (0.0%) | 0 (0.0%) |
| 35 to 64 Years | 5 (6.2%) | 14 (12.7%) |
| 65 to 74 Years | 15 (24.2%) | 4 (8.5%) |
| 75 Years and over | 32 (37.7%) | 55 (44.4%) |
Disability Class: Self-Care Difficulty
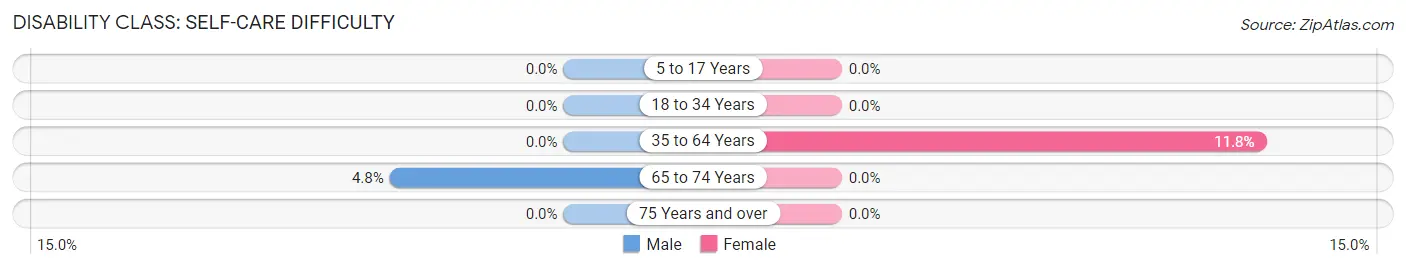
| Age Bracket | Male | Female |
| 5 to 17 Years | 0 (0.0%) | 0 (0.0%) |
| 18 to 34 Years | 0 (0.0%) | 0 (0.0%) |
| 35 to 64 Years | 0 (0.0%) | 13 (11.8%) |
| 65 to 74 Years | 3 (4.8%) | 0 (0.0%) |
| 75 Years and over | 0 (0.0%) | 0 (0.0%) |
Technology Access in Bluewater
Computing Device Access in Bluewater
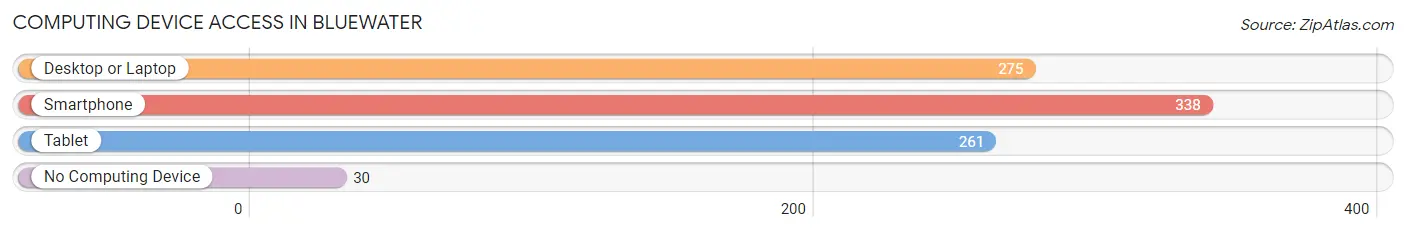
| Device Type | # Households | % Households |
| Desktop or Laptop | 275 | 67.4% |
| Smartphone | 338 | 82.8% |
| Tablet | 261 | 64.0% |
| No Computing Device | 30 | 7.3% |
| Total | 408 | 100.0% |
Internet Access in Bluewater
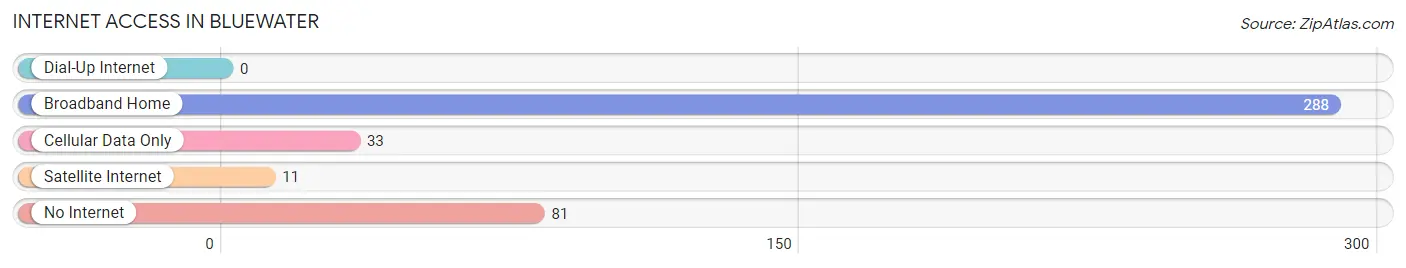
| Internet Type | # Households | % Households |
| Dial-Up Internet | 0 | 0.0% |
| Broadband Home | 288 | 70.6% |
| Cellular Data Only | 33 | 8.1% |
| Satellite Internet | 11 | 2.7% |
| No Internet | 81 | 19.9% |
| Total | 408 | 100.0% |
Bluewater Summary
Introduction
Bluewater is a small unincorporated community located in La Paz County, Arizona. It is situated along the Colorado River, approximately 25 miles south of Parker, Arizona. The town is home to a population of approximately 1,000 people and is known for its rural lifestyle and scenic views of the surrounding desert.
History
The area that is now Bluewater was first settled in the late 1800s by ranchers and farmers. The town was originally known as “Bluewater Crossing” and was a popular stop for travelers on the Colorado River. In the early 1900s, the town was renamed “Bluewater” and became a popular destination for tourists and fishermen.
In the 1950s, the town began to experience a population boom as more people moved to the area to take advantage of the area’s natural beauty and recreational opportunities. The town was incorporated in 1960 and has since become a popular destination for retirees and vacationers.
Geography
Bluewater is located in La Paz County, Arizona, approximately 25 miles south of Parker, Arizona. The town is situated along the Colorado River and is surrounded by the Sonoran Desert. The area is known for its scenic views of the surrounding desert and mountains.
The town is located at an elevation of 1,890 feet and has a total area of 0.7 square miles. The climate in Bluewater is arid and hot, with temperatures ranging from the mid-90s in the summer to the mid-50s in the winter.
Economy
The economy of Bluewater is largely based on tourism and agriculture. The town is home to several small businesses, including restaurants, shops, and lodging. The town is also home to a number of recreational activities, including fishing, boating, and camping.
The town is also home to a number of agricultural operations, including cattle ranches and farms. The town is also home to a number of mining operations, including copper and gold mines.
Demographics
As of the 2010 census, the population of Bluewater was 1,000. The town is predominantly white, with approximately 85% of the population identifying as white. The town is also home to a small Hispanic population, with approximately 10% of the population identifying as Hispanic.
Conclusion
Bluewater is a small unincorporated community located in La Paz County, Arizona. The town is known for its rural lifestyle and scenic views of the surrounding desert. The economy of Bluewater is largely based on tourism and agriculture, and the town is home to a population of approximately 1,000 people. The town is predominantly white, with a small Hispanic population. Bluewater is a popular destination for retirees and vacationers, and is known for its recreational activities and natural beauty.
Common Questions
What is the Total Population of Bluewater?
Total Population of Bluewater is 791.
What is the Total Male Population of Bluewater?
Total Male Population of Bluewater is 359.
What is the Total Female Population of Bluewater?
Total Female Population of Bluewater is 432.
What is the Ratio of Males per 100 Females in Bluewater?
There are 83.10 Males per 100 Females in Bluewater.
What is the Ratio of Females per 100 Males in Bluewater?
There are 120.33 Females per 100 Males in Bluewater.
What is the Median Population Age in Bluewater?
Median Population Age in Bluewater is 61.1 Years.
What is the Average Family Size in Bluewater
Average Family Size in Bluewater is 2.2 People.
What is the Average Household Size in Bluewater
Average Household Size in Bluewater is 1.9 People.
What is Per Capita Income in Bluewater?
Per Capita income in Bluewater is $31,751.
What is the Median Family Income in Bluewater?
Median Family Income in Bluewater is $72,500.
What is the Median Household income in Bluewater?
Median Household Income in Bluewater is $58,654.
What is Income or Wage Gap in Bluewater?
Income or Wage Gap in Bluewater is 22.7%.
Women in Bluewater earn 77.3 cents for every dollar earned by a man.
What is Inequality or Gini Index in Bluewater?
Inequality or Gini Index in Bluewater is 0.41.
How Large is the Labor Force in Bluewater?
There are 325 People in the Labor Forcein in Bluewater.
What is the Percentage of People in the Labor Force in Bluewater?
48.1% of People are in the Labor Force in Bluewater.
What is the Unemployment Rate in Bluewater?
Unemployment Rate in Bluewater is 2.2%.