Bullhead City, AZ
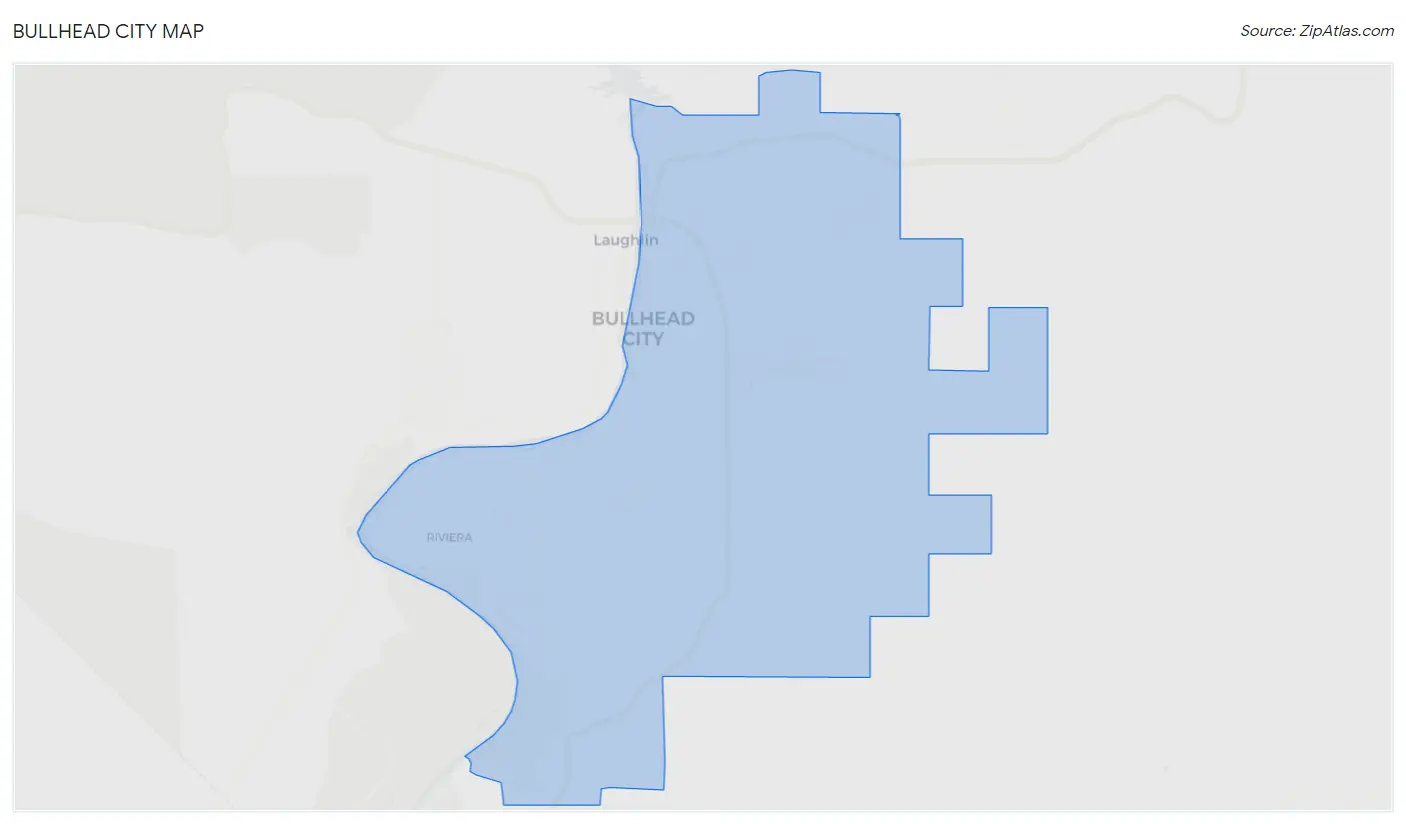
Bullhead City Map
Bullhead City Overview
41,593
TOTAL POPULATION
21,603
MALE POPULATION
19,990
FEMALE POPULATION
108.07
MALES / 100 FEMALES
92.53
FEMALES / 100 MALES
52.2
MEDIAN AGE
2.7
AVG FAMILY SIZE
2.2
AVG HOUSEHOLD SIZE
$31,654
PER CAPITA INCOME
$55,565
AVG FAMILY INCOME
$47,129
AVG HOUSEHOLD INCOME
0.1%
WAGE / INCOME GAP [ % ]
99.9¢/ $1
WAGE / INCOME GAP [ $ ]
$9,306
FAMILY INCOME DEFICIT
0.51
INEQUALITY / GINI INDEX
17,263
LABOR FORCE [ PEOPLE ]
48.4%
PERCENT IN LABOR FORCE
10.0%
UNEMPLOYMENT RATE
Bullhead City Area Codes
Race in Bullhead City
The most populous races in Bullhead City are White / Caucasian (33,131 | 79.7%), Hispanic or Latino (10,154 | 24.4%), and Two or more Races (3,928 | 9.4%).
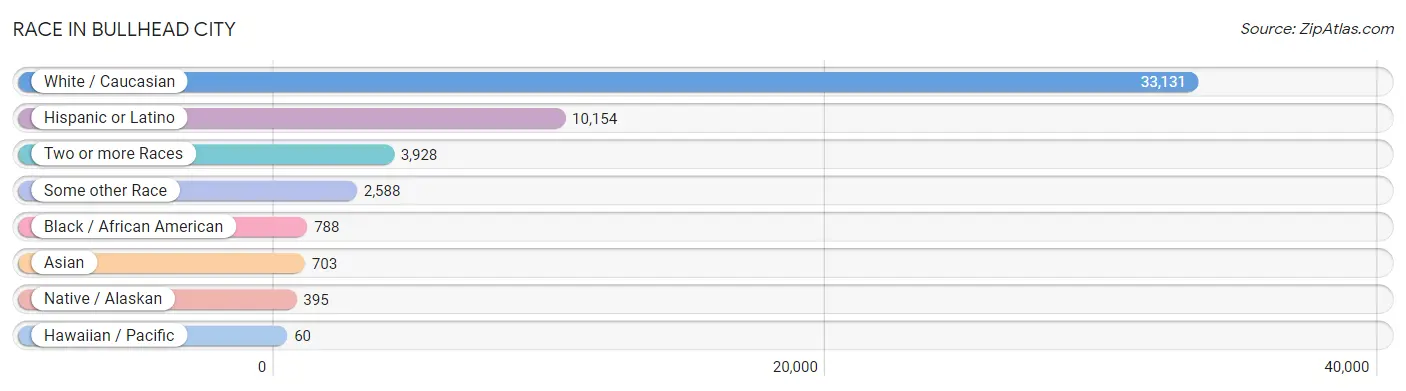
| Race | # Population | % Population |
| Asian | 703 | 1.7% |
| Black / African American | 788 | 1.9% |
| Hawaiian / Pacific | 60 | 0.1% |
| Hispanic or Latino | 10,154 | 24.4% |
| Native / Alaskan | 395 | 0.9% |
| White / Caucasian | 33,131 | 79.7% |
| Two or more Races | 3,928 | 9.4% |
| Some other Race | 2,588 | 6.2% |
| Total | 41,593 | 100.0% |
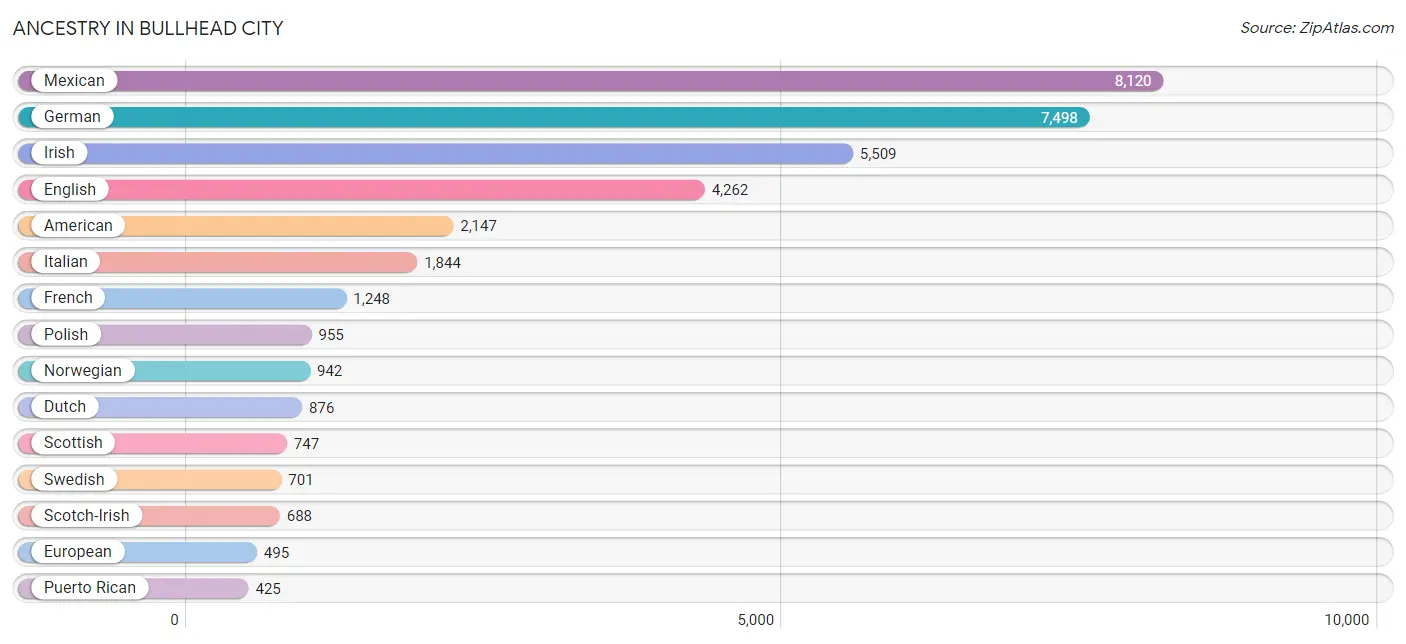
Ancestry in Bullhead City
The most populous ancestries reported in Bullhead City are Mexican (8,120 | 19.5%), German (7,498 | 18.0%), Irish (5,509 | 13.3%), English (4,262 | 10.2%), and American (2,147 | 5.2%), together accounting for 66.2% of all Bullhead City residents.
| Ancestry | # Population | % Population |
| African | 68 | 0.2% |
| American | 2,147 | 5.2% |
| Apache | 72 | 0.2% |
| Arab | 120 | 0.3% |
| Armenian | 10 | 0.0% |
| Australian | 13 | 0.0% |
| Austrian | 128 | 0.3% |
| Basque | 7 | 0.0% |
| Belgian | 32 | 0.1% |
| Bhutanese | 137 | 0.3% |
| Blackfeet | 35 | 0.1% |
| British | 96 | 0.2% |
| Burmese | 158 | 0.4% |
| Canadian | 50 | 0.1% |
| Central American | 388 | 0.9% |
| Central American Indian | 11 | 0.0% |
| Cherokee | 213 | 0.5% |
| Cheyenne | 46 | 0.1% |
| Chickasaw | 33 | 0.1% |
| Choctaw | 21 | 0.1% |
| Colombian | 16 | 0.0% |
| Creek | 48 | 0.1% |
| Croatian | 34 | 0.1% |
| Cuban | 351 | 0.8% |
| Czech | 114 | 0.3% |
| Czechoslovakian | 45 | 0.1% |
| Danish | 424 | 1.0% |
| Delaware | 6 | 0.0% |
| Dutch | 876 | 2.1% |
| Eastern European | 62 | 0.2% |
| Ecuadorian | 67 | 0.2% |
| English | 4,262 | 10.2% |
| Ethiopian | 39 | 0.1% |
| European | 495 | 1.2% |
| Finnish | 164 | 0.4% |
| French | 1,248 | 3.0% |
| French Canadian | 363 | 0.9% |
| German | 7,498 | 18.0% |
| Greek | 109 | 0.3% |
| Guamanian / Chamorro | 80 | 0.2% |
| Guatemalan | 146 | 0.4% |
| Honduran | 34 | 0.1% |
| Hungarian | 184 | 0.4% |
| Indian (Asian) | 32 | 0.1% |
| Inupiat | 6 | 0.0% |
| Iranian | 92 | 0.2% |
| Irish | 5,509 | 13.3% |
| Italian | 1,844 | 4.4% |
| Japanese | 72 | 0.2% |
| Korean | 423 | 1.0% |
| Laotian | 35 | 0.1% |
| Lebanese | 47 | 0.1% |
| Lithuanian | 88 | 0.2% |
| Lumbee | 23 | 0.1% |
| Malaysian | 13 | 0.0% |
| Mexican | 8,120 | 19.5% |
| Mexican American Indian | 27 | 0.1% |
| Native Hawaiian | 33 | 0.1% |
| Navajo | 230 | 0.5% |
| Nicaraguan | 31 | 0.1% |
| Nigerian | 20 | 0.1% |
| Northern European | 80 | 0.2% |
| Norwegian | 942 | 2.3% |
| Paiute | 42 | 0.1% |
| Pakistani | 67 | 0.2% |
| Pennsylvania German | 17 | 0.0% |
| Peruvian | 14 | 0.0% |
| Polish | 955 | 2.3% |
| Portuguese | 226 | 0.5% |
| Puerto Rican | 425 | 1.0% |
| Puget Sound Salish | 33 | 0.1% |
| Romanian | 18 | 0.0% |
| Russian | 330 | 0.8% |
| Salvadoran | 177 | 0.4% |
| Scandinavian | 161 | 0.4% |
| Scotch-Irish | 688 | 1.7% |
| Scottish | 747 | 1.8% |
| Serbian | 19 | 0.1% |
| Sioux | 15 | 0.0% |
| Slovak | 14 | 0.0% |
| Slovene | 7 | 0.0% |
| South American | 97 | 0.2% |
| Spaniard | 349 | 0.8% |
| Spanish | 120 | 0.3% |
| Sri Lankan | 69 | 0.2% |
| Subsaharan African | 174 | 0.4% |
| Swedish | 701 | 1.7% |
| Swiss | 104 | 0.3% |
| Syrian | 11 | 0.0% |
| Thai | 30 | 0.1% |
| Trinidadian and Tobagonian | 21 | 0.1% |
| Ugandan | 47 | 0.1% |
| Ukrainian | 43 | 0.1% |
| Welsh | 273 | 0.7% |
| West Indian | 5 | 0.0% |
| Yugoslavian | 14 | 0.0% |
| Yuman | 9 | 0.0% | View All 97 Rows |
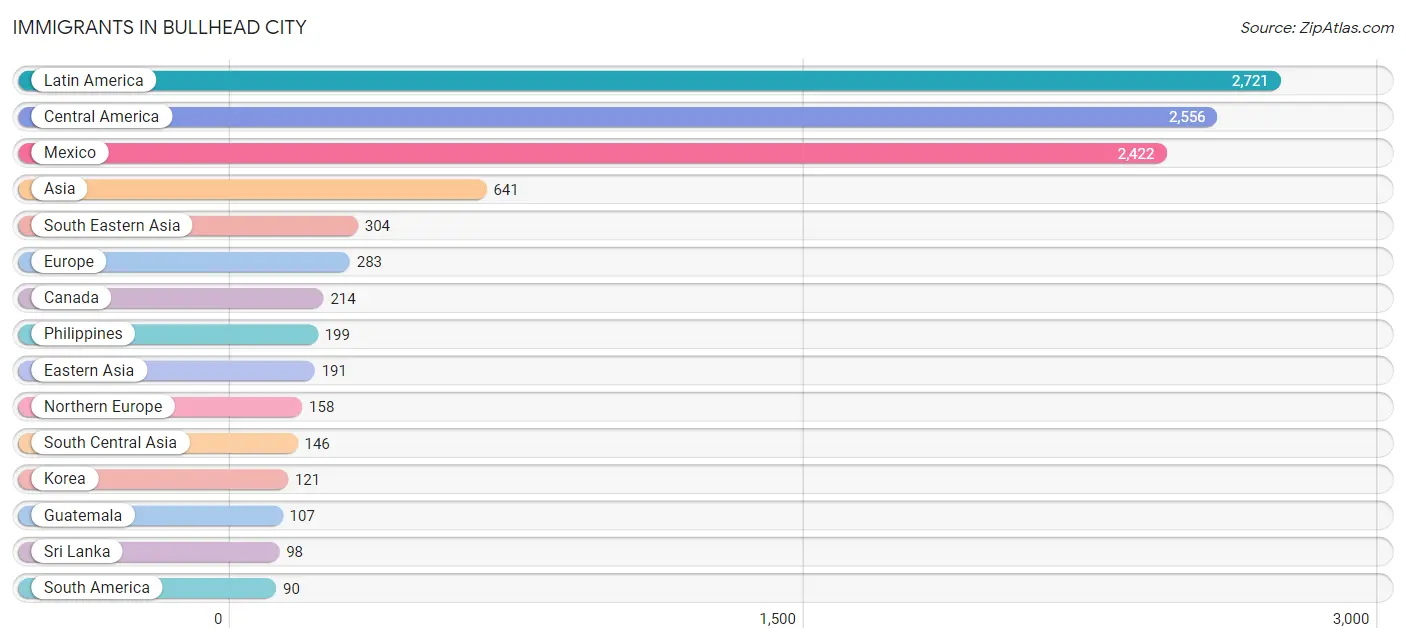
Immigrants in Bullhead City
The most numerous immigrant groups reported in Bullhead City came from Latin America (2,721 | 6.5%), Central America (2,556 | 6.1%), Mexico (2,422 | 5.8%), Asia (641 | 1.5%), and South Eastern Asia (304 | 0.7%), together accounting for 20.8% of all Bullhead City residents.
| Immigration Origin | # Population | % Population |
| Africa | 71 | 0.2% |
| Asia | 641 | 1.5% |
| Austria | 8 | 0.0% |
| Cambodia | 20 | 0.1% |
| Canada | 214 | 0.5% |
| Caribbean | 75 | 0.2% |
| Central America | 2,556 | 6.1% |
| China | 8 | 0.0% |
| Cuba | 64 | 0.2% |
| Denmark | 19 | 0.1% |
| Eastern Africa | 55 | 0.1% |
| Eastern Asia | 191 | 0.5% |
| Eastern Europe | 42 | 0.1% |
| Ecuador | 67 | 0.2% |
| England | 66 | 0.2% |
| Eritrea | 12 | 0.0% |
| Europe | 283 | 0.7% |
| Germany | 24 | 0.1% |
| Guatemala | 107 | 0.3% |
| Honduras | 14 | 0.0% |
| Hungary | 23 | 0.1% |
| Iran | 48 | 0.1% |
| Ireland | 7 | 0.0% |
| Italy | 9 | 0.0% |
| Jamaica | 11 | 0.0% |
| Japan | 62 | 0.2% |
| Korea | 121 | 0.3% |
| Latin America | 2,721 | 6.5% |
| Mexico | 2,422 | 5.8% |
| Netherlands | 30 | 0.1% |
| Nicaragua | 13 | 0.0% |
| Nigeria | 16 | 0.0% |
| Northern Europe | 158 | 0.4% |
| Peru | 23 | 0.1% |
| Philippines | 199 | 0.5% |
| Portugal | 12 | 0.0% |
| South America | 90 | 0.2% |
| South Central Asia | 146 | 0.4% |
| South Eastern Asia | 304 | 0.7% |
| Southern Europe | 21 | 0.1% |
| Sri Lanka | 98 | 0.2% |
| Sweden | 11 | 0.0% |
| Thailand | 54 | 0.1% |
| Uganda | 21 | 0.1% |
| Vietnam | 31 | 0.1% |
| Western Africa | 16 | 0.0% |
| Western Europe | 62 | 0.2% | View All 47 Rows |
Sex and Age in Bullhead City
Sex and Age in Bullhead City
The most populous age groups in Bullhead City are 65 to 69 Years (1,881 | 8.7%) for men and 55 to 59 Years (1,973 | 9.9%) for women.
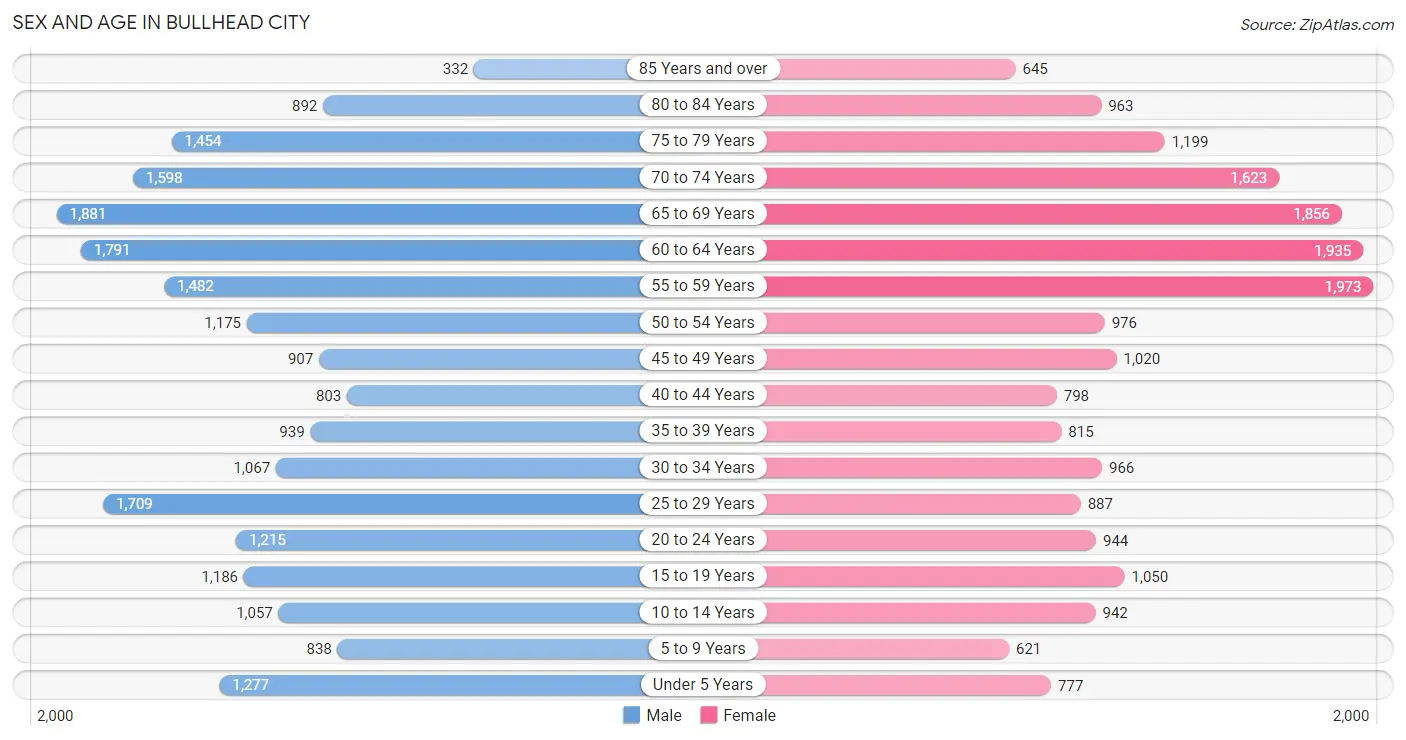
| Age Bracket | Male | Female |
| Under 5 Years | 1,277 (5.9%) | 777 (3.9%) |
| 5 to 9 Years | 838 (3.9%) | 621 (3.1%) |
| 10 to 14 Years | 1,057 (4.9%) | 942 (4.7%) |
| 15 to 19 Years | 1,186 (5.5%) | 1,050 (5.2%) |
| 20 to 24 Years | 1,215 (5.6%) | 944 (4.7%) |
| 25 to 29 Years | 1,709 (7.9%) | 887 (4.4%) |
| 30 to 34 Years | 1,067 (4.9%) | 966 (4.8%) |
| 35 to 39 Years | 939 (4.3%) | 815 (4.1%) |
| 40 to 44 Years | 803 (3.7%) | 798 (4.0%) |
| 45 to 49 Years | 907 (4.2%) | 1,020 (5.1%) |
| 50 to 54 Years | 1,175 (5.4%) | 976 (4.9%) |
| 55 to 59 Years | 1,482 (6.9%) | 1,973 (9.9%) |
| 60 to 64 Years | 1,791 (8.3%) | 1,935 (9.7%) |
| 65 to 69 Years | 1,881 (8.7%) | 1,856 (9.3%) |
| 70 to 74 Years | 1,598 (7.4%) | 1,623 (8.1%) |
| 75 to 79 Years | 1,454 (6.7%) | 1,199 (6.0%) |
| 80 to 84 Years | 892 (4.1%) | 963 (4.8%) |
| 85 Years and over | 332 (1.5%) | 645 (3.2%) |
| Total | 21,603 (100.0%) | 19,990 (100.0%) |
Families and Households in Bullhead City
Median Family Size in Bullhead City
The median family size in Bullhead City is 2.71 persons per family, with married-couple families (7,701 | 67.1%) accounting for the largest median family size of 2.74 persons per family. On the other hand, single male/father families (1,417 | 12.3%) represent the smallest median family size with 2.64 persons per family.
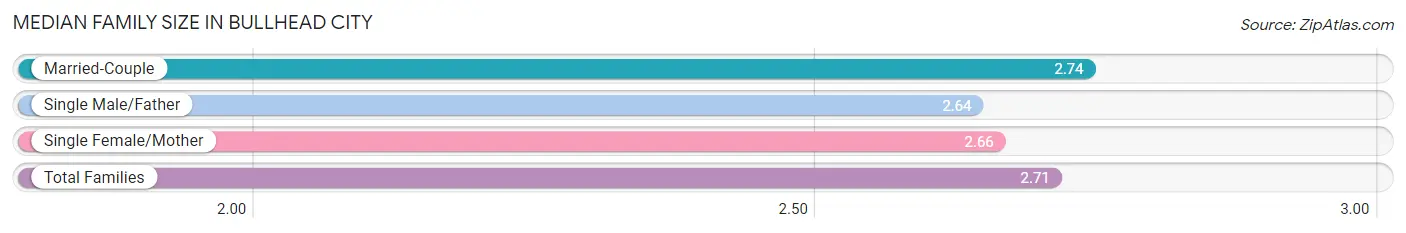
| Family Type | # Families | Family Size |
| Married-Couple | 7,701 (67.1%) | 2.74 |
| Single Male/Father | 1,417 (12.3%) | 2.64 |
| Single Female/Mother | 2,366 (20.6%) | 2.66 |
| Total Families | 11,484 (100.0%) | 2.71 |
Median Household Size in Bullhead City
The median household size in Bullhead City is 2.20 persons per household, with single female/mother households (2,366 | 12.6%) accounting for the largest median household size of 3.07 persons per household. non-family households (7,304 | 38.9%) represent the smallest median household size with 1.17 persons per household.
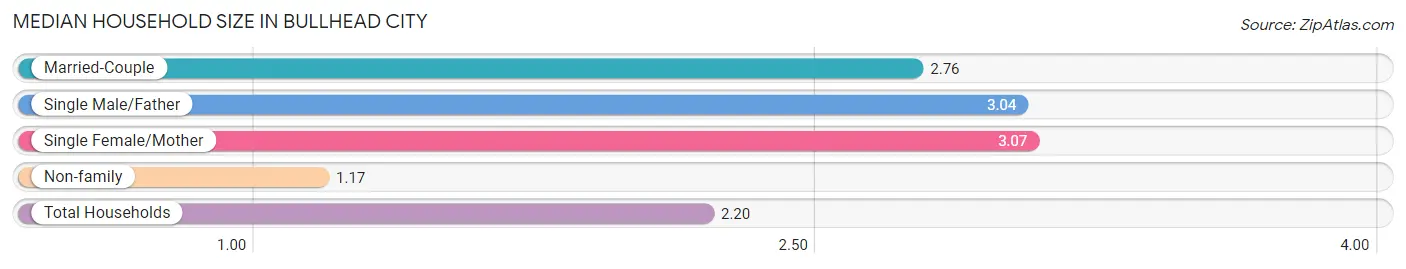
| Household Type | # Households | Household Size |
| Married-Couple | 7,701 (41.0%) | 2.76 |
| Single Male/Father | 1,417 (7.5%) | 3.04 |
| Single Female/Mother | 2,366 (12.6%) | 3.07 |
| Non-family | 7,304 (38.9%) | 1.17 |
| Total Households | 18,788 (100.0%) | 2.20 |
Household Size by Marriage Status in Bullhead City
Out of a total of 18,788 households in Bullhead City, 11,484 (61.1%) are family households, while 7,304 (38.9%) are nonfamily households. The most numerous type of family households are 2-person households, comprising 6,331, and the most common type of nonfamily households are 1-person households, comprising 6,282.
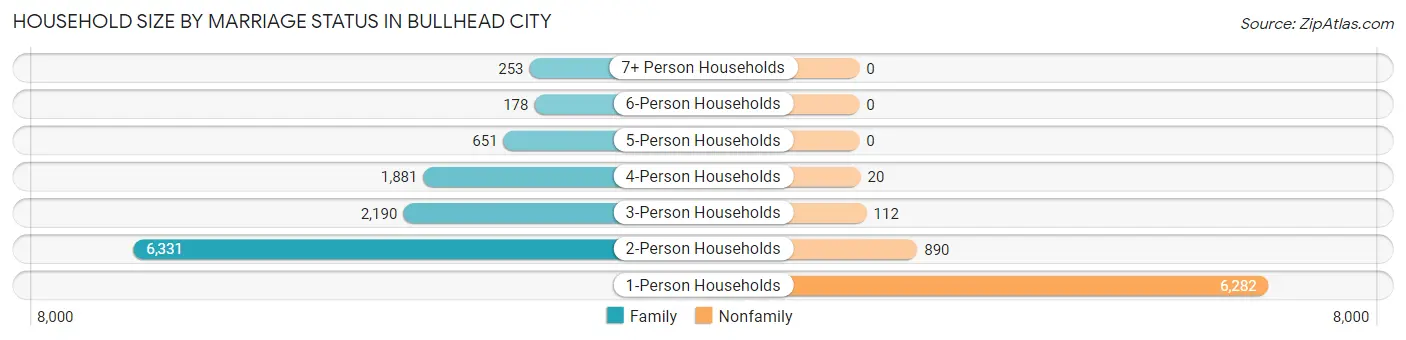
| Household Size | Family Households | Nonfamily Households |
| 1-Person Households | - | 6,282 (33.4%) |
| 2-Person Households | 6,331 (33.7%) | 890 (4.7%) |
| 3-Person Households | 2,190 (11.7%) | 112 (0.6%) |
| 4-Person Households | 1,881 (10.0%) | 20 (0.1%) |
| 5-Person Households | 651 (3.5%) | 0 (0.0%) |
| 6-Person Households | 178 (0.9%) | 0 (0.0%) |
| 7+ Person Households | 253 (1.3%) | 0 (0.0%) |
| Total | 11,484 (61.1%) | 7,304 (38.9%) |
Female Fertility in Bullhead City
Fertility by Age in Bullhead City
Average fertility rate in Bullhead City is 41.0 births per 1,000 women. Women in the age bracket of 20 to 34 years have the highest fertility rate with 89.0 births per 1,000 women. Women in the age bracket of 20 to 34 years acount for 90.2% of all women with births.
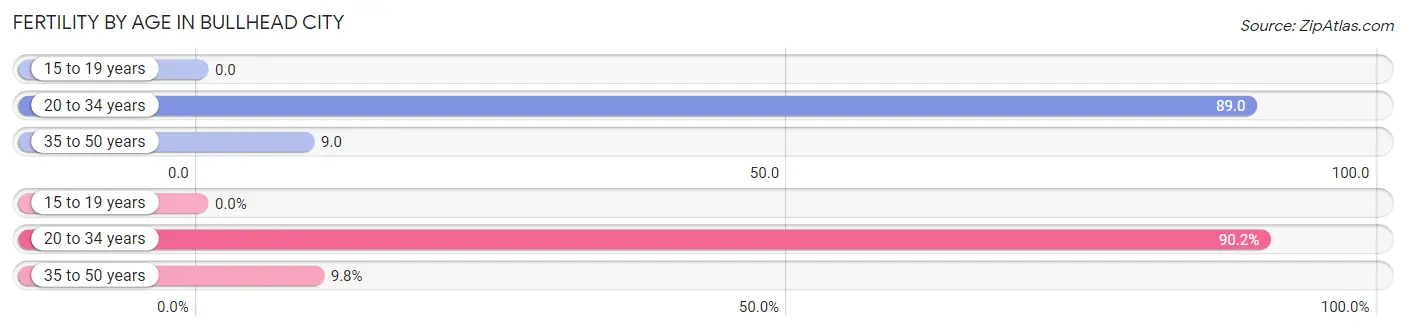
| Age Bracket | Women with Births | Births / 1,000 Women |
| 15 to 19 years | 0 (0.0%) | 0.0 |
| 20 to 34 years | 248 (90.2%) | 89.0 |
| 35 to 50 years | 27 (9.8%) | 9.0 |
| Total | 275 (100.0%) | 41.0 |
Fertility by Age by Marriage Status in Bullhead City
40.4% of women with births (275) in Bullhead City are married. The highest percentage of unmarried women with births falls into 20 to 34 years age bracket with 66.1% of them unmarried at the time of birth, while the lowest percentage of unmarried women with births belong to 35 to 50 years age bracket with 0.0% of them unmarried.
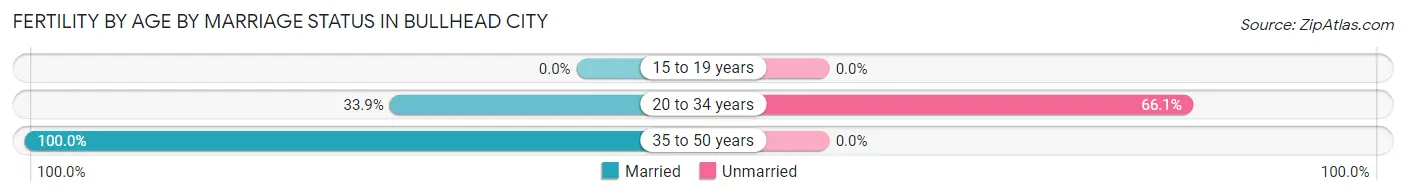
| Age Bracket | Married | Unmarried |
| 15 to 19 years | 0 (0.0%) | 0 (0.0%) |
| 20 to 34 years | 84 (33.9%) | 164 (66.1%) |
| 35 to 50 years | 27 (100.0%) | 0 (0.0%) |
| Total | 111 (40.4%) | 164 (59.6%) |
Fertility by Education in Bullhead City
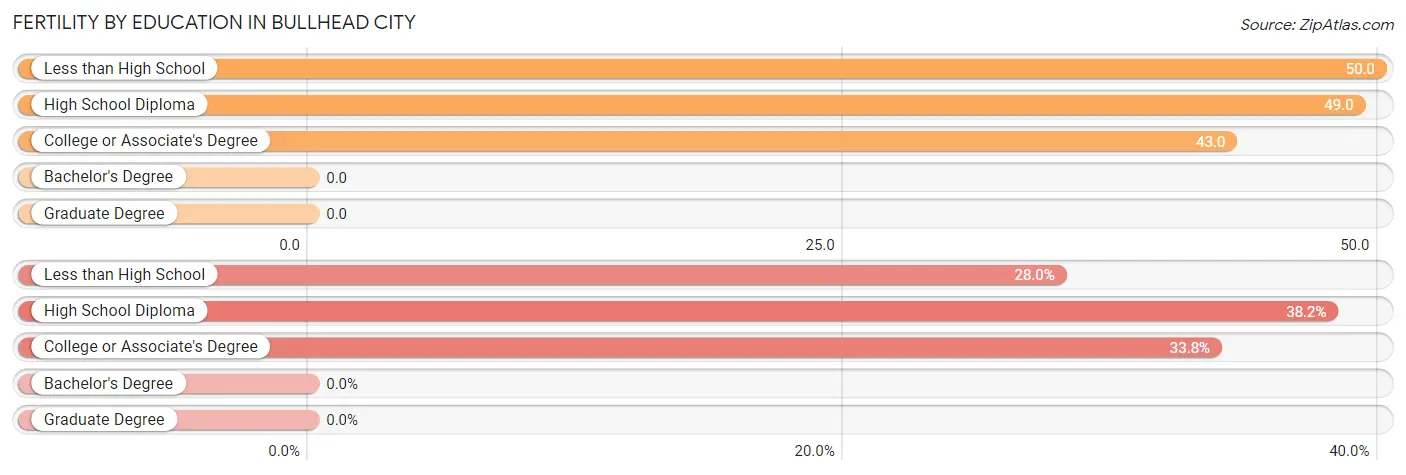
| Educational Attainment | Women with Births | Births / 1,000 Women |
| Less than High School | 77 (28.0%) | 50.0 |
| High School Diploma | 105 (38.2%) | 49.0 |
| College or Associate's Degree | 93 (33.8%) | 43.0 |
| Bachelor's Degree | 0 (0.0%) | 0.0 |
| Graduate Degree | 0 (0.0%) | 0.0 |
| Total | 275 (100.0%) | 41.0 |
Fertility by Education by Marriage Status in Bullhead City
59.6% of women with births in Bullhead City are unmarried. Women with the educational attainment of less than high school are most likely to be married with 87.0% of them married at childbirth, while women with the educational attainment of high school diploma are least likely to be married with 83.8% of them unmarried at childbirth.
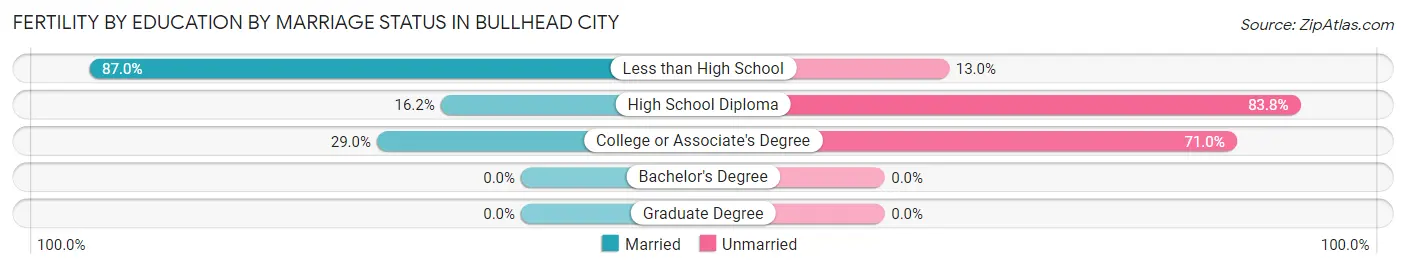
| Educational Attainment | Married | Unmarried |
| Less than High School | 67 (87.0%) | 10 (13.0%) |
| High School Diploma | 17 (16.2%) | 88 (83.8%) |
| College or Associate's Degree | 27 (29.0%) | 66 (71.0%) |
| Bachelor's Degree | 0 (0.0%) | 0 (0.0%) |
| Graduate Degree | 0 (0.0%) | 0 (0.0%) |
| Total | 111 (40.4%) | 164 (59.6%) |
Income in Bullhead City
Income Overview in Bullhead City
Per Capita Income in Bullhead City is $31,654, while median incomes of families and households are $55,565 and $47,129 respectively.
| Characteristic | Number | Measure |
| Per Capita Income | 41,593 | $31,654 |
| Median Family Income | 11,484 | $55,565 |
| Mean Family Income | 11,484 | $79,786 |
| Median Household Income | 18,788 | $47,129 |
| Mean Household Income | 18,788 | $69,878 |
| Income Deficit | 11,484 | $9,306 |
| Wage / Income Gap (%) | 41,593 | 0.06% |
| Wage / Income Gap ($) | 41,593 | 99.94¢ per $1 |
| Gini / Inequality Index | 41,593 | 0.51 |
Earnings by Sex in Bullhead City
Average Earnings in Bullhead City are $28,811, $28,816 for men and $28,798 for women, a difference of 0.1%.
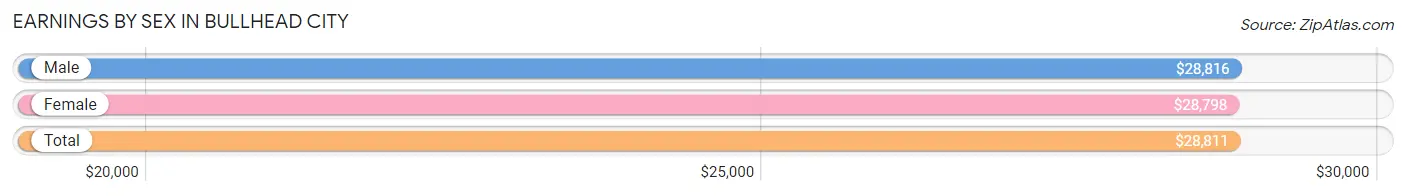
| Sex | Number | Average Earnings |
| Male | 9,661 (55.4%) | $28,816 |
| Female | 7,790 (44.6%) | $28,798 |
| Total | 17,451 (100.0%) | $28,811 |
Earnings by Sex by Income Bracket in Bullhead City
The most common earnings brackets in Bullhead City are $25,000 to $29,999 for men (992 | 10.3%) and $30,000 to $34,999 for women (767 | 9.9%).
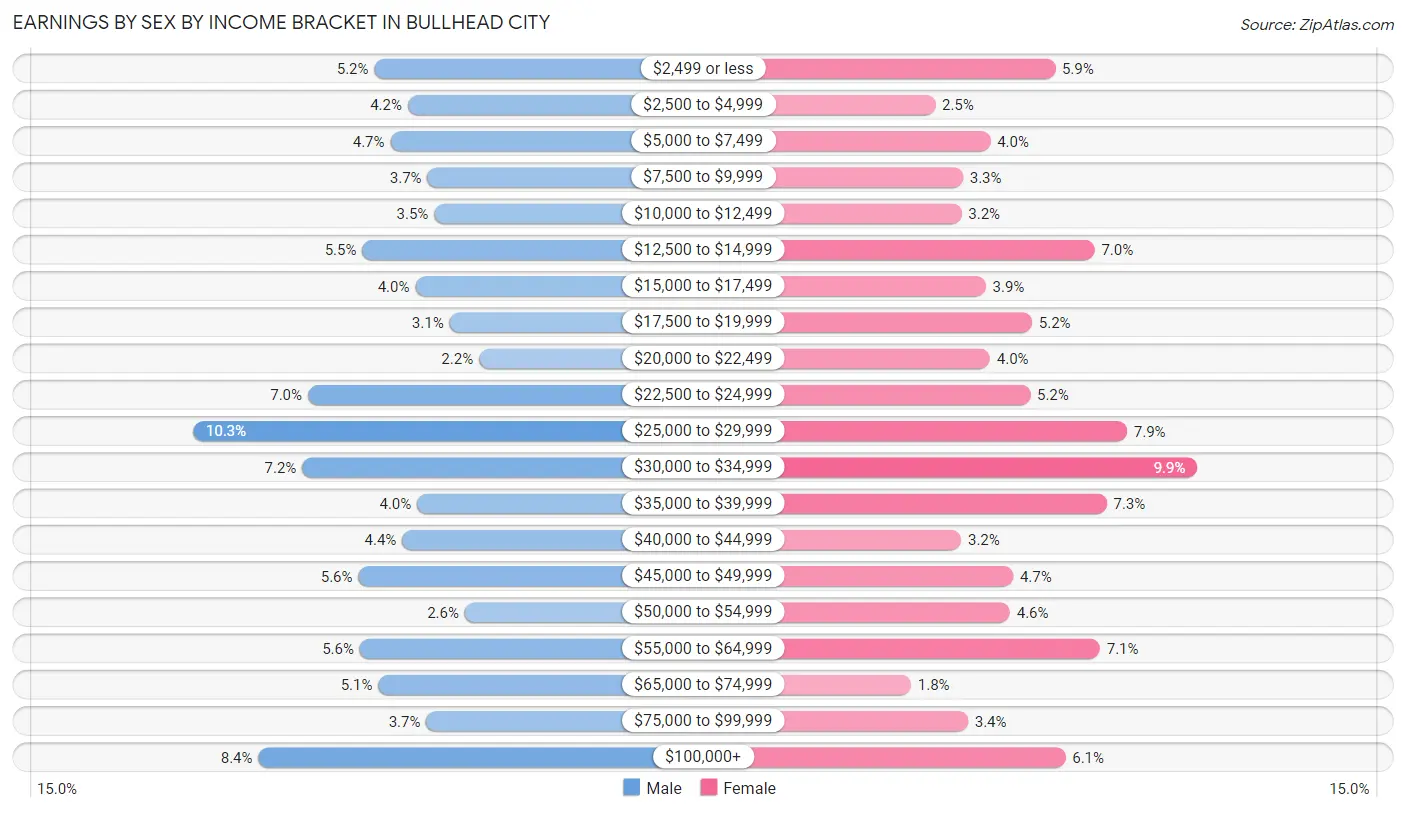
| Income | Male | Female |
| $2,499 or less | 499 (5.2%) | 456 (5.9%) |
| $2,500 to $4,999 | 409 (4.2%) | 193 (2.5%) |
| $5,000 to $7,499 | 456 (4.7%) | 314 (4.0%) |
| $7,500 to $9,999 | 356 (3.7%) | 254 (3.3%) |
| $10,000 to $12,499 | 337 (3.5%) | 251 (3.2%) |
| $12,500 to $14,999 | 532 (5.5%) | 542 (7.0%) |
| $15,000 to $17,499 | 388 (4.0%) | 304 (3.9%) |
| $17,500 to $19,999 | 296 (3.1%) | 405 (5.2%) |
| $20,000 to $22,499 | 215 (2.2%) | 313 (4.0%) |
| $22,500 to $24,999 | 680 (7.0%) | 401 (5.1%) |
| $25,000 to $29,999 | 992 (10.3%) | 613 (7.9%) |
| $30,000 to $34,999 | 696 (7.2%) | 767 (9.9%) |
| $35,000 to $39,999 | 384 (4.0%) | 569 (7.3%) |
| $40,000 to $44,999 | 424 (4.4%) | 250 (3.2%) |
| $45,000 to $49,999 | 543 (5.6%) | 364 (4.7%) |
| $50,000 to $54,999 | 254 (2.6%) | 357 (4.6%) |
| $55,000 to $64,999 | 539 (5.6%) | 554 (7.1%) |
| $65,000 to $74,999 | 489 (5.1%) | 140 (1.8%) |
| $75,000 to $99,999 | 358 (3.7%) | 265 (3.4%) |
| $100,000+ | 814 (8.4%) | 478 (6.1%) |
| Total | 9,661 (100.0%) | 7,790 (100.0%) |
Earnings by Sex by Educational Attainment in Bullhead City
Average earnings in Bullhead City are $30,705 for men and $31,813 for women, a difference of 3.5%. Men with an educational attainment of graduate degree enjoy the highest average annual earnings of $85,250, while those with less than high school education earn the least with $22,701. Women with an educational attainment of graduate degree earn the most with the average annual earnings of $65,040, while those with less than high school education have the smallest earnings of $24,052.
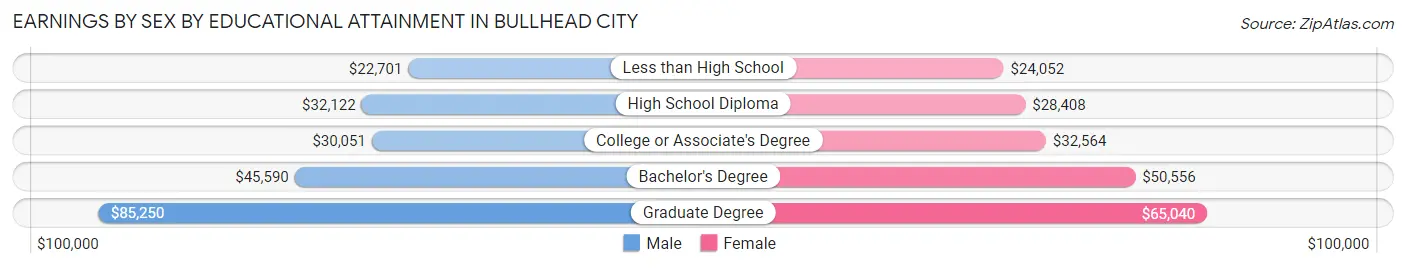
| Educational Attainment | Male Income | Female Income |
| Less than High School | $22,701 | $24,052 |
| High School Diploma | $32,122 | $28,408 |
| College or Associate's Degree | $30,051 | $32,564 |
| Bachelor's Degree | $45,590 | $50,556 |
| Graduate Degree | $85,250 | $65,040 |
| Total | $30,705 | $31,813 |
Family Income in Bullhead City
Family Income Brackets in Bullhead City
According to the Bullhead City family income data, there are 2,618 families falling into the $50,000 to $74,999 income range, which is the most common income bracket and makes up 22.8% of all families. Conversely, the less than $10,000 income bracket is the least frequent group with only 413 families (3.6%) belonging to this category.
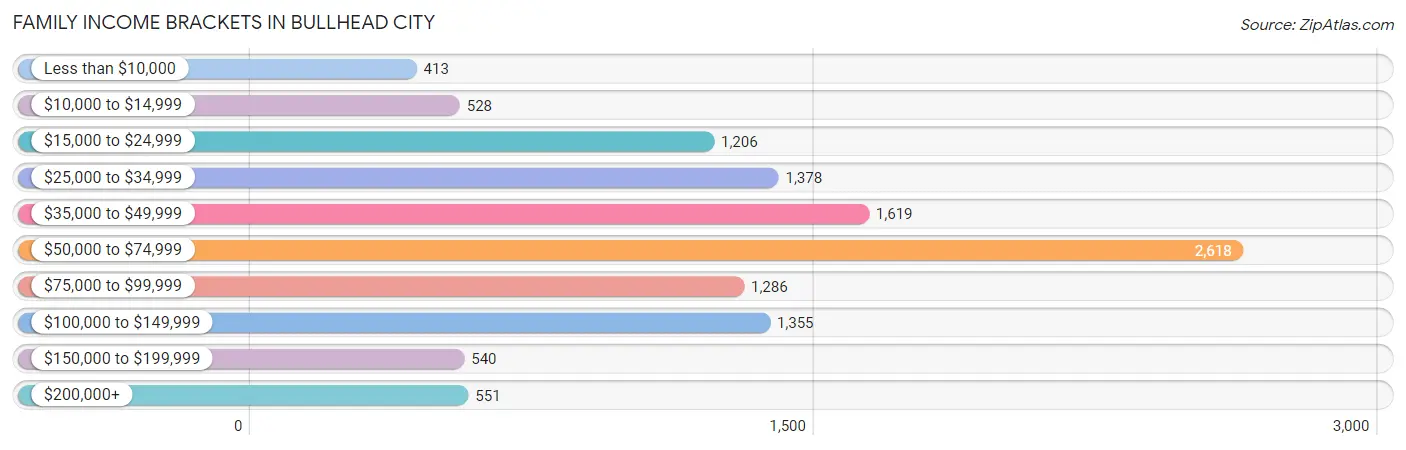
| Income Bracket | # Families | % Families |
| Less than $10,000 | 413 | 3.6% |
| $10,000 to $14,999 | 528 | 4.6% |
| $15,000 to $24,999 | 1,206 | 10.5% |
| $25,000 to $34,999 | 1,378 | 12.0% |
| $35,000 to $49,999 | 1,619 | 14.1% |
| $50,000 to $74,999 | 2,618 | 22.8% |
| $75,000 to $99,999 | 1,286 | 11.2% |
| $100,000 to $149,999 | 1,355 | 11.8% |
| $150,000 to $199,999 | 540 | 4.7% |
| $200,000+ | 551 | 4.8% |
Family Income by Famaliy Size in Bullhead City
4-person families (1,354 | 11.8%) account for the highest median family income in Bullhead City with $68,779 per family, while 2-person families (6,846 | 59.6%) have the highest median income of $25,186 per family member.
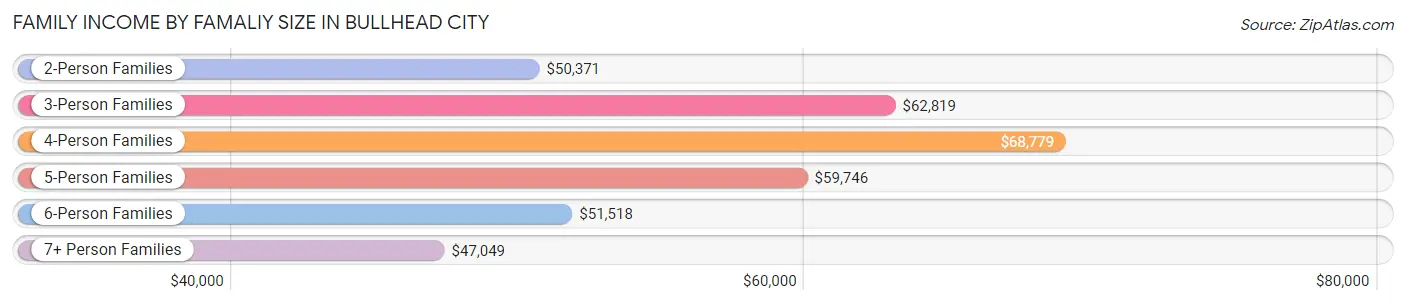
| Income Bracket | # Families | Median Income |
| 2-Person Families | 6,846 (59.6%) | $50,371 |
| 3-Person Families | 2,390 (20.8%) | $62,819 |
| 4-Person Families | 1,354 (11.8%) | $68,779 |
| 5-Person Families | 590 (5.1%) | $59,746 |
| 6-Person Families | 160 (1.4%) | $51,518 |
| 7+ Person Families | 144 (1.3%) | $47,049 |
| Total | 11,484 (100.0%) | $55,565 |
Family Income by Number of Earners in Bullhead City
The median family income in Bullhead City is $55,565, with families comprising 3+ earners (637) having the highest median family income of $107,634, while families with 1 earner (4,323) have the lowest median family income of $44,014, accounting for 5.6% and 37.6% of families, respectively.
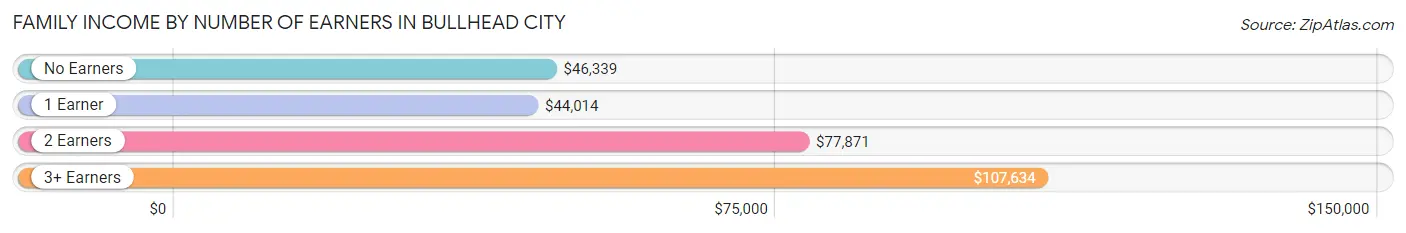
| Number of Earners | # Families | Median Income |
| No Earners | 3,424 (29.8%) | $46,339 |
| 1 Earner | 4,323 (37.6%) | $44,014 |
| 2 Earners | 3,100 (27.0%) | $77,871 |
| 3+ Earners | 637 (5.6%) | $107,634 |
| Total | 11,484 (100.0%) | $55,565 |
Household Income in Bullhead City
Household Income Brackets in Bullhead City
With 3,701 households falling in the category, the $50,000 to $74,999 income range is the most frequent in Bullhead City, accounting for 19.7% of all households. In contrast, only 639 households (3.4%) fall into the $150,000 to $199,999 income bracket, making it the least populous group.
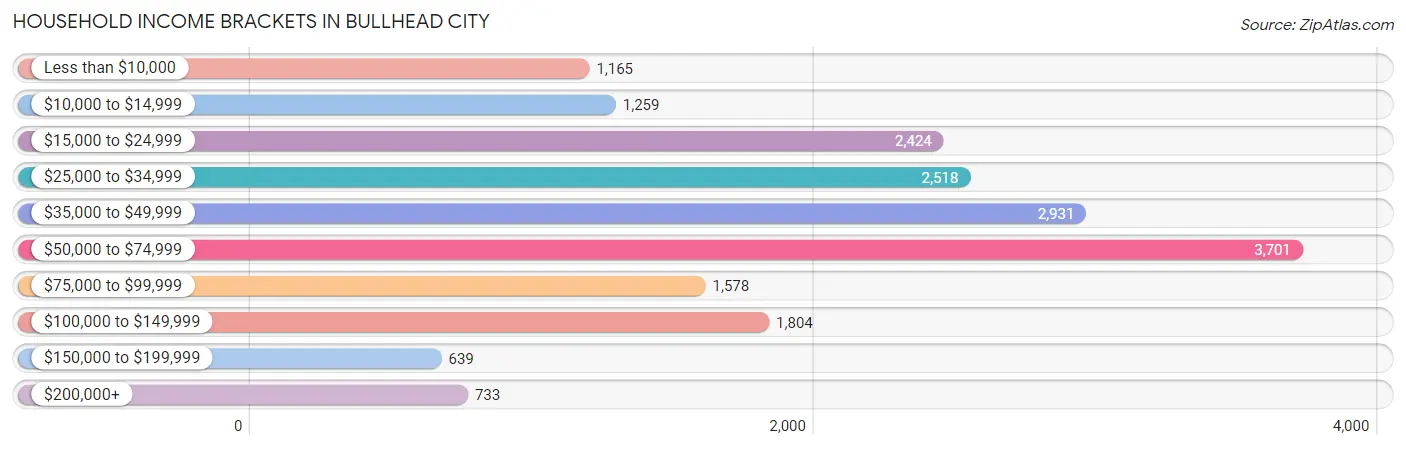
| Income Bracket | # Households | % Households |
| Less than $10,000 | 1,165 | 6.2% |
| $10,000 to $14,999 | 1,259 | 6.7% |
| $15,000 to $24,999 | 2,424 | 12.9% |
| $25,000 to $34,999 | 2,518 | 13.4% |
| $35,000 to $49,999 | 2,931 | 15.6% |
| $50,000 to $74,999 | 3,701 | 19.7% |
| $75,000 to $99,999 | 1,578 | 8.4% |
| $100,000 to $149,999 | 1,804 | 9.6% |
| $150,000 to $199,999 | 639 | 3.4% |
| $200,000+ | 733 | 3.9% |
Household Income by Householder Age in Bullhead City
The median household income in Bullhead City is $47,129, with the highest median household income of $55,242 found in the 25 to 44 years age bracket for the primary householder. A total of 3,745 households (19.9%) fall into this category. Meanwhile, the 65+ years age bracket for the primary householder has the lowest median household income of $43,883, with 8,238 households (43.9%) in this group.
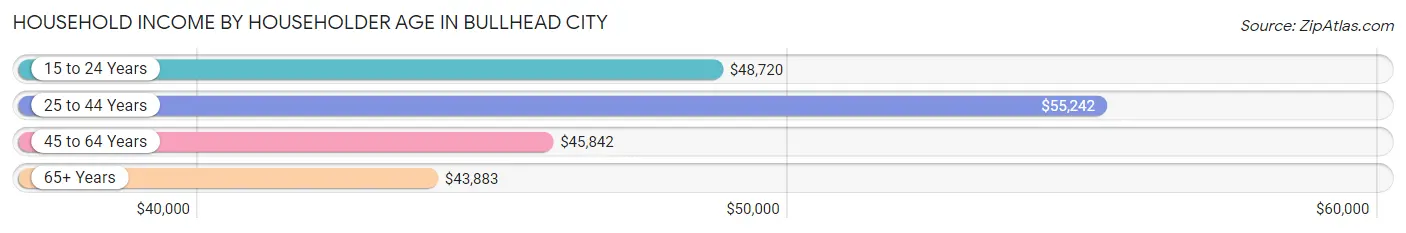
| Income Bracket | # Households | Median Income |
| 15 to 24 Years | 586 (3.1%) | $48,720 |
| 25 to 44 Years | 3,745 (19.9%) | $55,242 |
| 45 to 64 Years | 6,219 (33.1%) | $45,842 |
| 65+ Years | 8,238 (43.9%) | $43,883 |
| Total | 18,788 (100.0%) | $47,129 |
Poverty in Bullhead City
Income Below Poverty by Sex and Age in Bullhead City
With 18.1% poverty level for males and 19.8% for females among the residents of Bullhead City, 15 year old males and under 5 year old females are the most vulnerable to poverty, with 66 males (50.4%) and 303 females (39.0%) in their respective age groups living below the poverty level.
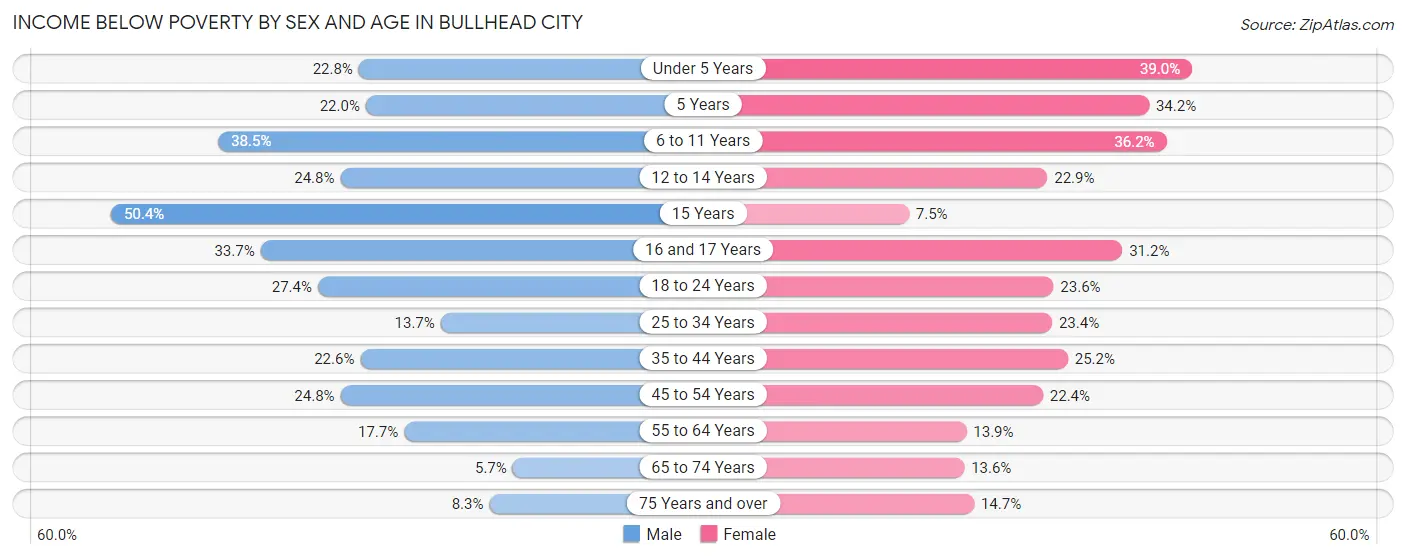
| Age Bracket | Male | Female |
| Under 5 Years | 291 (22.8%) | 303 (39.0%) |
| 5 Years | 46 (22.0%) | 26 (34.2%) |
| 6 to 11 Years | 438 (38.5%) | 295 (36.1%) |
| 12 to 14 Years | 119 (24.8%) | 149 (22.9%) |
| 15 Years | 66 (50.4%) | 21 (7.5%) |
| 16 and 17 Years | 141 (33.7%) | 119 (31.2%) |
| 18 to 24 Years | 506 (27.4%) | 314 (23.6%) |
| 25 to 34 Years | 379 (13.7%) | 431 (23.4%) |
| 35 to 44 Years | 394 (22.6%) | 406 (25.2%) |
| 45 to 54 Years | 514 (24.8%) | 447 (22.4%) |
| 55 to 64 Years | 580 (17.7%) | 542 (13.9%) |
| 65 to 74 Years | 195 (5.7%) | 471 (13.6%) |
| 75 Years and over | 219 (8.3%) | 402 (14.7%) |
| Total | 3,888 (18.1%) | 3,926 (19.8%) |
Income Above Poverty by Sex and Age in Bullhead City
According to the poverty statistics in Bullhead City, males aged 65 to 74 years and females aged 15 years are the age groups that are most secure financially, with 94.4% of males and 92.5% of females in these age groups living above the poverty line.
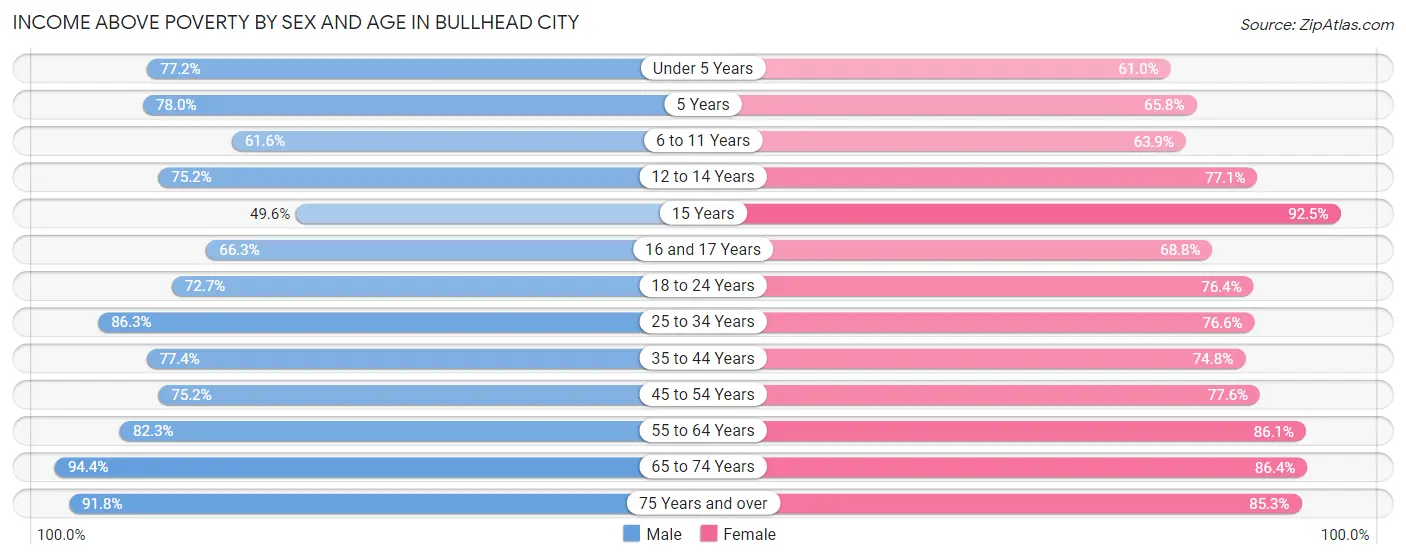
| Age Bracket | Male | Female |
| Under 5 Years | 986 (77.2%) | 474 (61.0%) |
| 5 Years | 163 (78.0%) | 50 (65.8%) |
| 6 to 11 Years | 701 (61.6%) | 521 (63.8%) |
| 12 to 14 Years | 360 (75.2%) | 502 (77.1%) |
| 15 Years | 65 (49.6%) | 260 (92.5%) |
| 16 and 17 Years | 277 (66.3%) | 262 (68.8%) |
| 18 to 24 Years | 1,344 (72.7%) | 1,018 (76.4%) |
| 25 to 34 Years | 2,394 (86.3%) | 1,410 (76.6%) |
| 35 to 44 Years | 1,348 (77.4%) | 1,207 (74.8%) |
| 45 to 54 Years | 1,556 (75.2%) | 1,549 (77.6%) |
| 55 to 64 Years | 2,690 (82.3%) | 3,366 (86.1%) |
| 65 to 74 Years | 3,258 (94.4%) | 2,984 (86.4%) |
| 75 Years and over | 2,436 (91.7%) | 2,329 (85.3%) |
| Total | 17,578 (81.9%) | 15,932 (80.2%) |
Income Below Poverty Among Married-Couple Families in Bullhead City
The poverty statistics for married-couple families in Bullhead City show that 9.1% or 699 of the total 7,701 families live below the poverty line. Families with 1 or 2 children have the highest poverty rate of 20.2%, comprising of 264 families. On the other hand, families with 5 or more children have the lowest poverty rate of 0.0%, which includes 0 families.
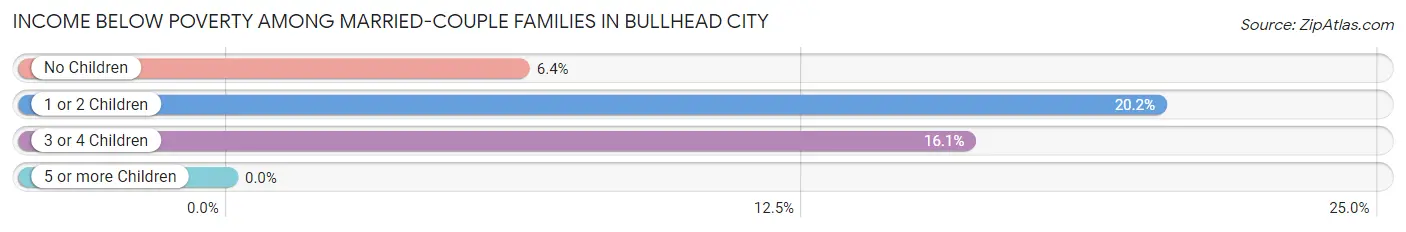
| Children | Above Poverty | Below Poverty |
| No Children | 5,576 (93.6%) | 378 (6.4%) |
| 1 or 2 Children | 1,042 (79.8%) | 264 (20.2%) |
| 3 or 4 Children | 298 (83.9%) | 57 (16.1%) |
| 5 or more Children | 86 (100.0%) | 0 (0.0%) |
| Total | 7,002 (90.9%) | 699 (9.1%) |
Income Below Poverty Among Single-Parent Households in Bullhead City
According to the poverty data in Bullhead City, 22.2% or 315 single-father households and 29.1% or 688 single-mother households are living below the poverty line. Among single-father households, those with 5 or more children have the highest poverty rate, with 13 households (100.0%) experiencing poverty. Likewise, among single-mother households, those with 1 or 2 children have the highest poverty rate, with 508 households (47.9%) falling below the poverty line.
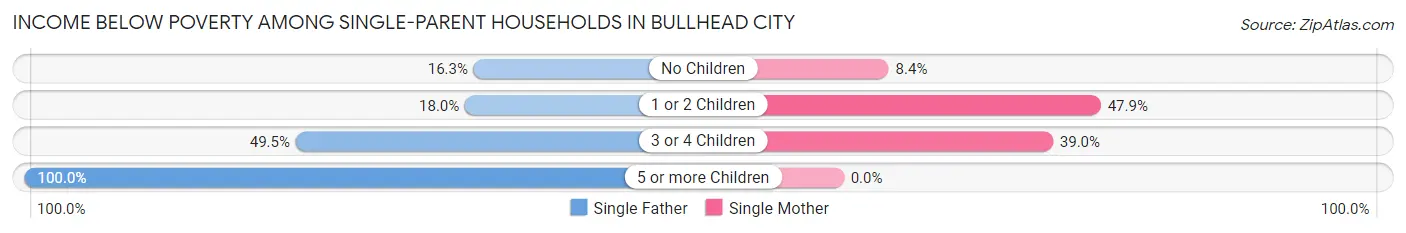
| Children | Single Father | Single Mother |
| No Children | 113 (16.3%) | 90 (8.4%) |
| 1 or 2 Children | 93 (17.9%) | 508 (47.9%) |
| 3 or 4 Children | 96 (49.5%) | 90 (39.0%) |
| 5 or more Children | 13 (100.0%) | 0 (0.0%) |
| Total | 315 (22.2%) | 688 (29.1%) |
Income Below Poverty Among Married-Couple vs Single-Parent Households in Bullhead City
The poverty data for Bullhead City shows that 699 of the married-couple family households (9.1%) and 1,003 of the single-parent households (26.5%) are living below the poverty level. Within the married-couple family households, those with 1 or 2 children have the highest poverty rate, with 264 households (20.2%) falling below the poverty line. Among the single-parent households, those with 5 or more children have the highest poverty rate, with 13 household (100.0%) living below poverty.
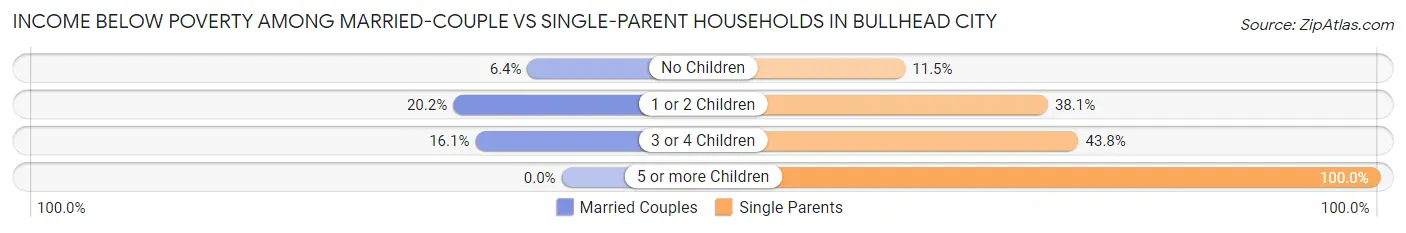
| Children | Married-Couple Families | Single-Parent Households |
| No Children | 378 (6.4%) | 203 (11.5%) |
| 1 or 2 Children | 264 (20.2%) | 601 (38.1%) |
| 3 or 4 Children | 57 (16.1%) | 186 (43.8%) |
| 5 or more Children | 0 (0.0%) | 13 (100.0%) |
| Total | 699 (9.1%) | 1,003 (26.5%) |
Employment Characteristics in Bullhead City
Employment by Class of Employer in Bullhead City
Among the 15,239 employed individuals in Bullhead City, private company employees (11,800 | 77.4%), local government employees (1,039 | 6.8%), and self-employed (not incorporated) (829 | 5.4%) make up the most common classes of employment.
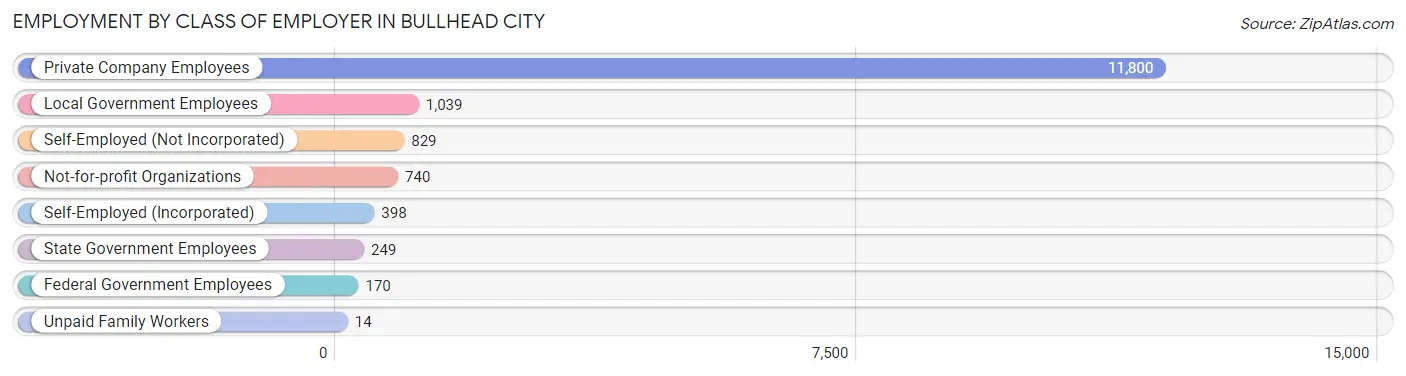
| Employer Class | # Employees | % Employees |
| Private Company Employees | 11,800 | 77.4% |
| Self-Employed (Incorporated) | 398 | 2.6% |
| Self-Employed (Not Incorporated) | 829 | 5.4% |
| Not-for-profit Organizations | 740 | 4.9% |
| Local Government Employees | 1,039 | 6.8% |
| State Government Employees | 249 | 1.6% |
| Federal Government Employees | 170 | 1.1% |
| Unpaid Family Workers | 14 | 0.1% |
| Total | 15,239 | 100.0% |
Employment Status by Age in Bullhead City
According to the labor force statistics for Bullhead City, out of the total population over 16 years of age (35,668), 48.4% or 17,263 individuals are in the labor force, with 10.0% or 1,726 of them unemployed. The age group with the highest labor force participation rate is 25 to 29 years, with 83.3% or 2,162 individuals in the labor force. Within the labor force, the 16 to 19 years age range has the highest percentage of unemployed individuals, with 38.1% or 381 of them being unemployed.
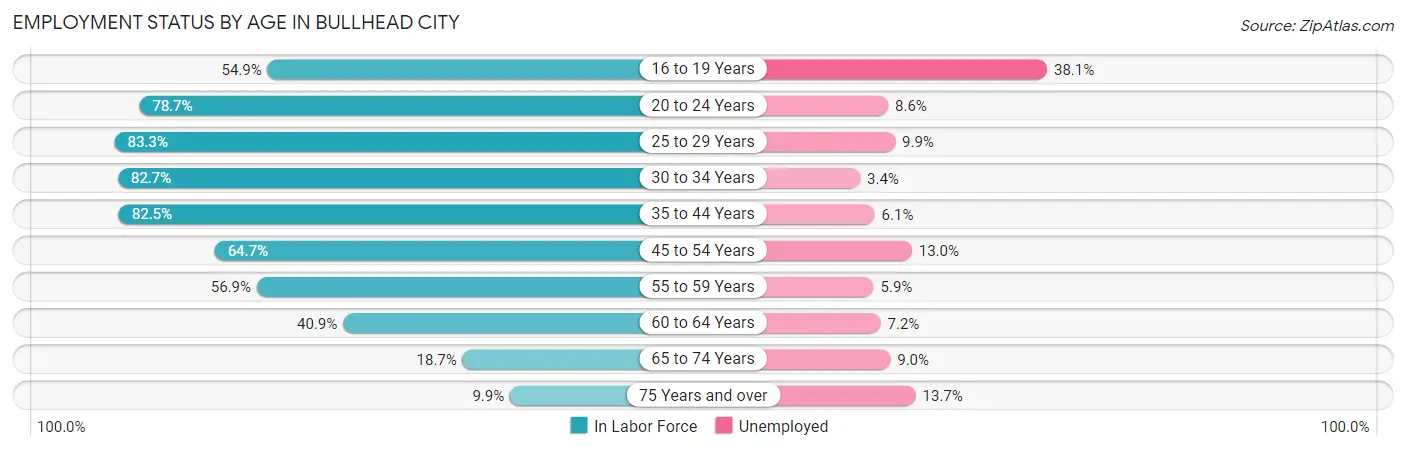
| Age Bracket | In Labor Force | Unemployed |
| 16 to 19 Years | 1,001 (54.9%) | 381 (38.1%) |
| 20 to 24 Years | 1,699 (78.7%) | 146 (8.6%) |
| 25 to 29 Years | 2,162 (83.3%) | 214 (9.9%) |
| 30 to 34 Years | 1,681 (82.7%) | 57 (3.4%) |
| 35 to 44 Years | 2,768 (82.5%) | 169 (6.1%) |
| 45 to 54 Years | 2,638 (64.7%) | 343 (13.0%) |
| 55 to 59 Years | 1,966 (56.9%) | 116 (5.9%) |
| 60 to 64 Years | 1,524 (40.9%) | 110 (7.2%) |
| 65 to 74 Years | 1,301 (18.7%) | 117 (9.0%) |
| 75 Years and over | 543 (9.9%) | 74 (13.7%) |
| Total | 17,263 (48.4%) | 1,726 (10.0%) |
Employment Status by Educational Attainment in Bullhead City
According to labor force statistics for Bullhead City, 66.2% of individuals (12,739) out of the total population between 25 and 64 years of age (19,243) are in the labor force, with 7.9% or 1,006 of them being unemployed. The group with the highest labor force participation rate are those with the educational attainment of bachelor's degree or higher, with 81.4% or 2,107 individuals in the labor force. Within the labor force, individuals with less than high school education have the highest percentage of unemployment, with 12.1% or 204 of them being unemployed.
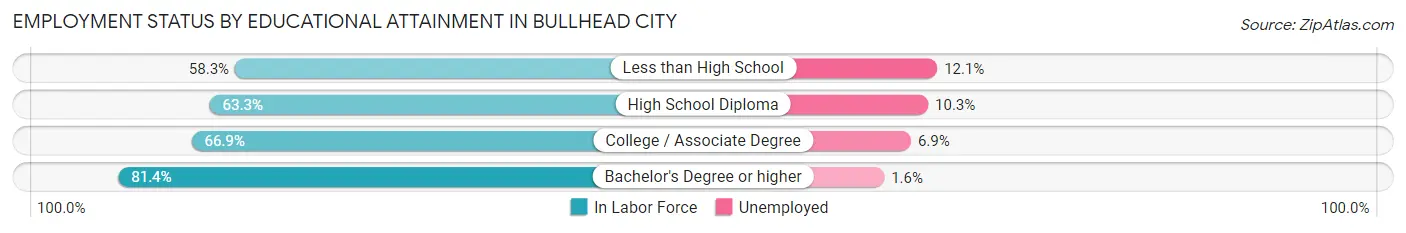
| Educational Attainment | In Labor Force | Unemployed |
| Less than High School | 1,683 (58.3%) | 349 (12.1%) |
| High School Diploma | 4,578 (63.3%) | 745 (10.3%) |
| College / Associate Degree | 4,372 (66.9%) | 451 (6.9%) |
| Bachelor's Degree or higher | 2,107 (81.4%) | 41 (1.6%) |
| Total | 12,739 (66.2%) | 1,520 (7.9%) |
Employment Occupations by Sex in Bullhead City
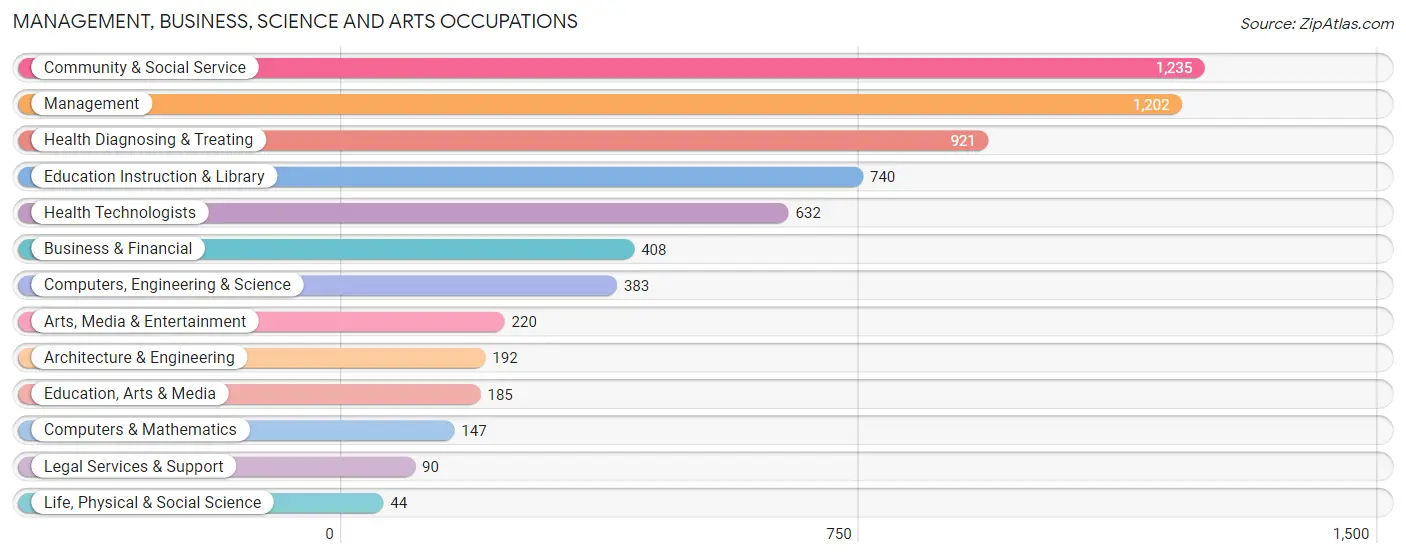
Management, Business, Science and Arts Occupations
The most common Management, Business, Science and Arts occupations in Bullhead City are Community & Social Service (1,235 | 8.0%), Management (1,202 | 7.7%), Health Diagnosing & Treating (921 | 5.9%), Education Instruction & Library (740 | 4.8%), and Health Technologists (632 | 4.1%).
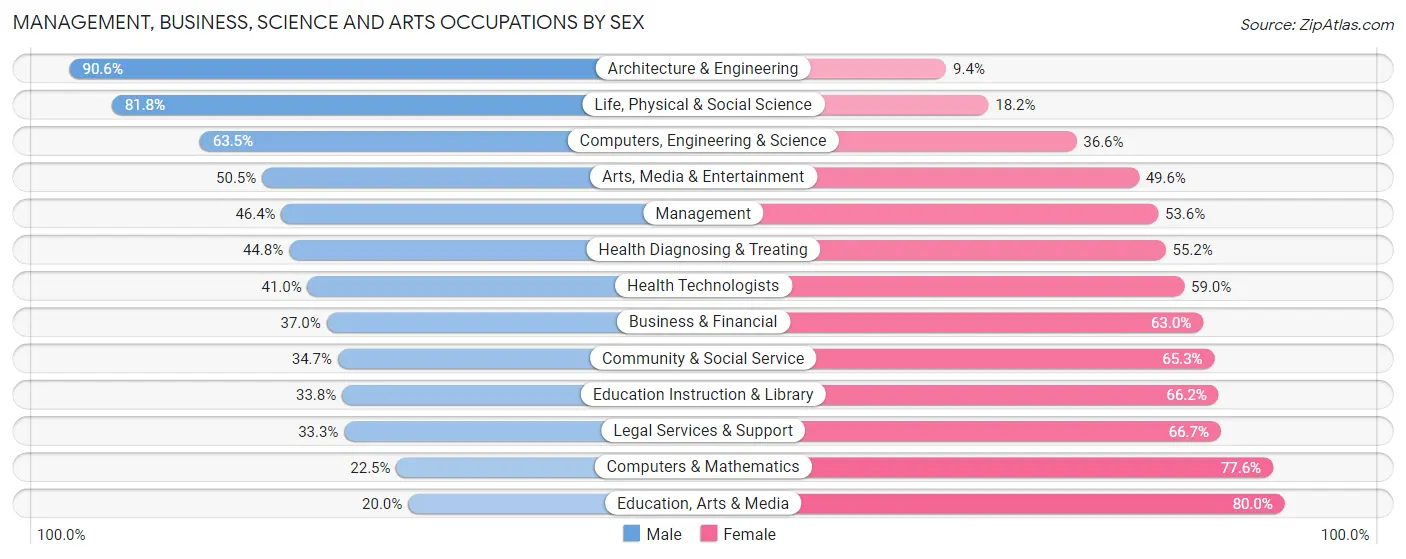
Management, Business, Science and Arts Occupations by Sex
Within the Management, Business, Science and Arts occupations in Bullhead City, the most male-oriented occupations are Architecture & Engineering (90.6%), Life, Physical & Social Science (81.8%), and Computers, Engineering & Science (63.4%), while the most female-oriented occupations are Education, Arts & Media (80.0%), Computers & Mathematics (77.5%), and Legal Services & Support (66.7%).
| Occupation | Male | Female |
| Management | 558 (46.4%) | 644 (53.6%) |
| Business & Financial | 151 (37.0%) | 257 (63.0%) |
| Computers, Engineering & Science | 243 (63.4%) | 140 (36.5%) |
| Computers & Mathematics | 33 (22.5%) | 114 (77.5%) |
| Architecture & Engineering | 174 (90.6%) | 18 (9.4%) |
| Life, Physical & Social Science | 36 (81.8%) | 8 (18.2%) |
| Community & Social Service | 428 (34.7%) | 807 (65.3%) |
| Education, Arts & Media | 37 (20.0%) | 148 (80.0%) |
| Legal Services & Support | 30 (33.3%) | 60 (66.7%) |
| Education Instruction & Library | 250 (33.8%) | 490 (66.2%) |
| Arts, Media & Entertainment | 111 (50.4%) | 109 (49.5%) |
| Health Diagnosing & Treating | 413 (44.8%) | 508 (55.2%) |
| Health Technologists | 259 (41.0%) | 373 (59.0%) |
| Total (Category) | 1,793 (43.2%) | 2,356 (56.8%) |
| Total (Overall) | 8,442 (54.3%) | 7,097 (45.7%) |
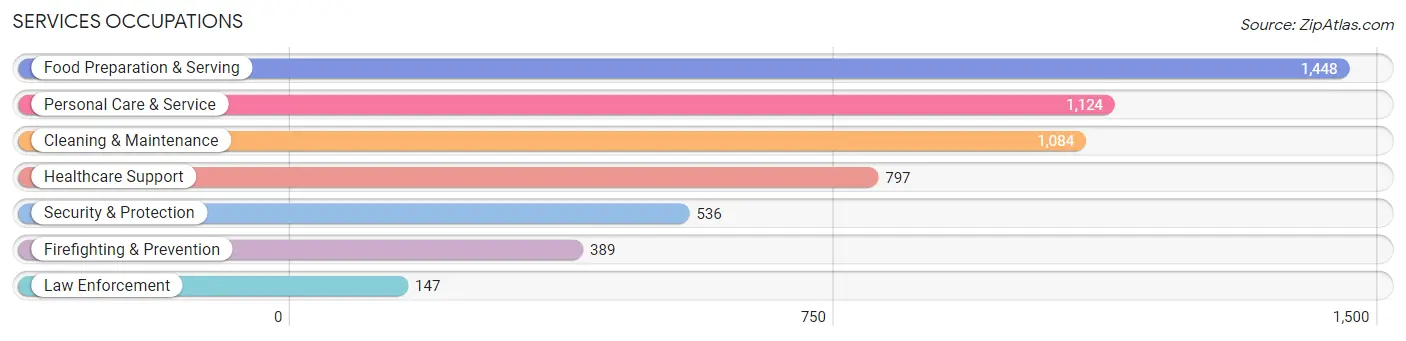
Services Occupations
The most common Services occupations in Bullhead City are Food Preparation & Serving (1,448 | 9.3%), Personal Care & Service (1,124 | 7.2%), Cleaning & Maintenance (1,084 | 7.0%), Healthcare Support (797 | 5.1%), and Security & Protection (536 | 3.5%).
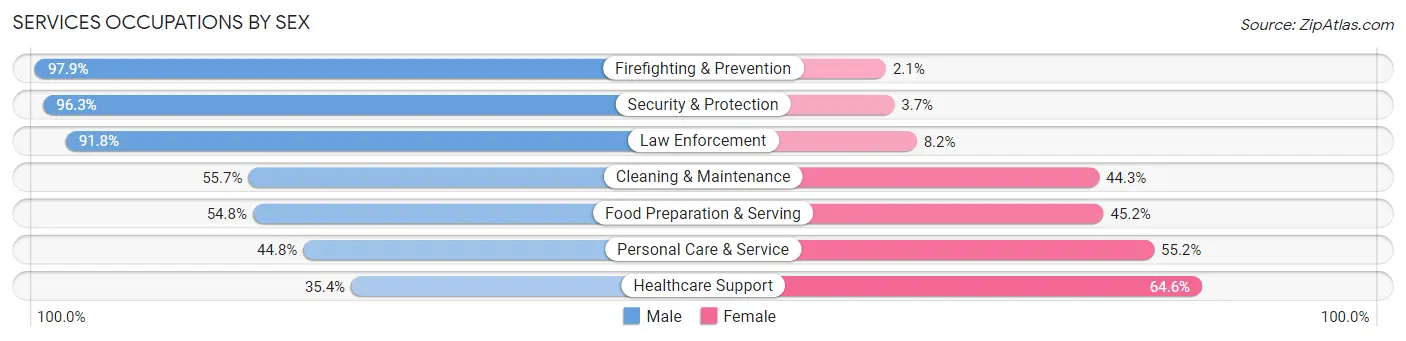
Services Occupations by Sex
Within the Services occupations in Bullhead City, the most male-oriented occupations are Firefighting & Prevention (97.9%), Security & Protection (96.3%), and Law Enforcement (91.8%), while the most female-oriented occupations are Healthcare Support (64.6%), Personal Care & Service (55.2%), and Food Preparation & Serving (45.2%).
| Occupation | Male | Female |
| Healthcare Support | 282 (35.4%) | 515 (64.6%) |
| Security & Protection | 516 (96.3%) | 20 (3.7%) |
| Firefighting & Prevention | 381 (97.9%) | 8 (2.1%) |
| Law Enforcement | 135 (91.8%) | 12 (8.2%) |
| Food Preparation & Serving | 794 (54.8%) | 654 (45.2%) |
| Cleaning & Maintenance | 604 (55.7%) | 480 (44.3%) |
| Personal Care & Service | 504 (44.8%) | 620 (55.2%) |
| Total (Category) | 2,700 (54.1%) | 2,289 (45.9%) |
| Total (Overall) | 8,442 (54.3%) | 7,097 (45.7%) |
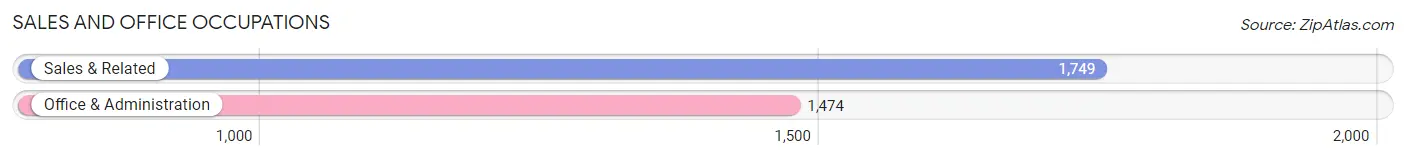
Sales and Office Occupations
The most common Sales and Office occupations in Bullhead City are Sales & Related (1,749 | 11.3%), and Office & Administration (1,474 | 9.5%).
Sales and Office Occupations by Sex
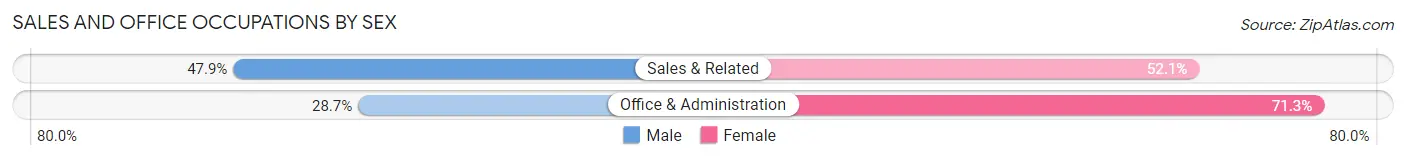
| Occupation | Male | Female |
| Sales & Related | 838 (47.9%) | 911 (52.1%) |
| Office & Administration | 423 (28.7%) | 1,051 (71.3%) |
| Total (Category) | 1,261 (39.1%) | 1,962 (60.9%) |
| Total (Overall) | 8,442 (54.3%) | 7,097 (45.7%) |
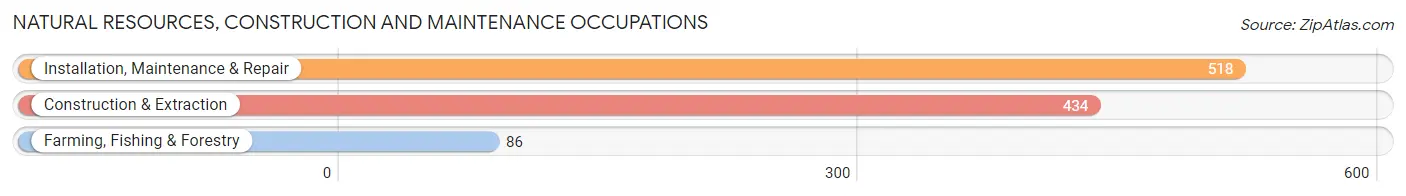
Natural Resources, Construction and Maintenance Occupations
The most common Natural Resources, Construction and Maintenance occupations in Bullhead City are Installation, Maintenance & Repair (518 | 3.3%), Construction & Extraction (434 | 2.8%), and Farming, Fishing & Forestry (86 | 0.5%).
Natural Resources, Construction and Maintenance Occupations by Sex
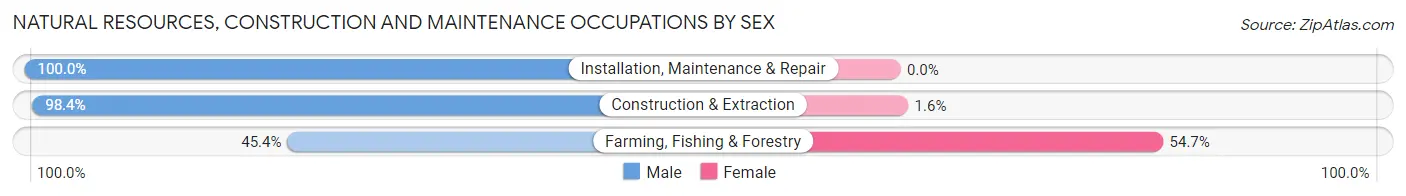
| Occupation | Male | Female |
| Farming, Fishing & Forestry | 39 (45.4%) | 47 (54.6%) |
| Construction & Extraction | 427 (98.4%) | 7 (1.6%) |
| Installation, Maintenance & Repair | 518 (100.0%) | 0 (0.0%) |
| Total (Category) | 984 (94.8%) | 54 (5.2%) |
| Total (Overall) | 8,442 (54.3%) | 7,097 (45.7%) |
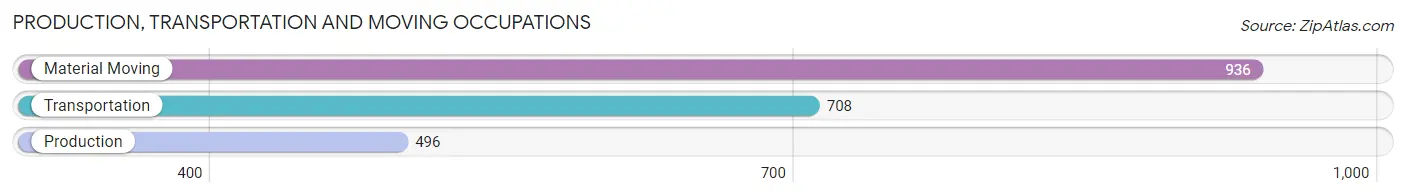
Production, Transportation and Moving Occupations
The most common Production, Transportation and Moving occupations in Bullhead City are Material Moving (936 | 6.0%), Transportation (708 | 4.6%), and Production (496 | 3.2%).
Production, Transportation and Moving Occupations by Sex
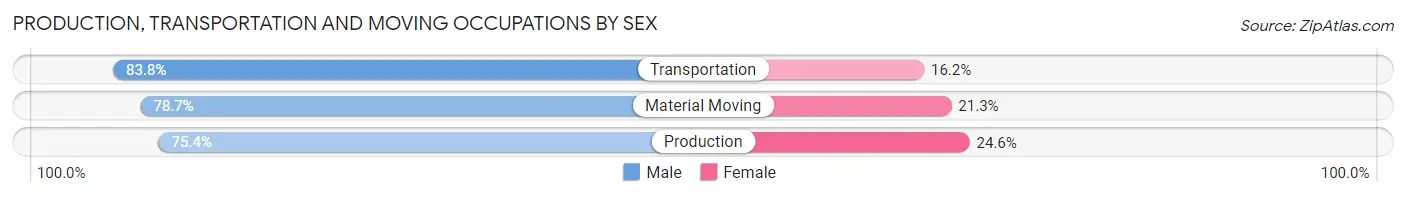
| Occupation | Male | Female |
| Production | 374 (75.4%) | 122 (24.6%) |
| Transportation | 593 (83.8%) | 115 (16.2%) |
| Material Moving | 737 (78.7%) | 199 (21.3%) |
| Total (Category) | 1,704 (79.6%) | 436 (20.4%) |
| Total (Overall) | 8,442 (54.3%) | 7,097 (45.7%) |
Employment Industries by Sex in Bullhead City
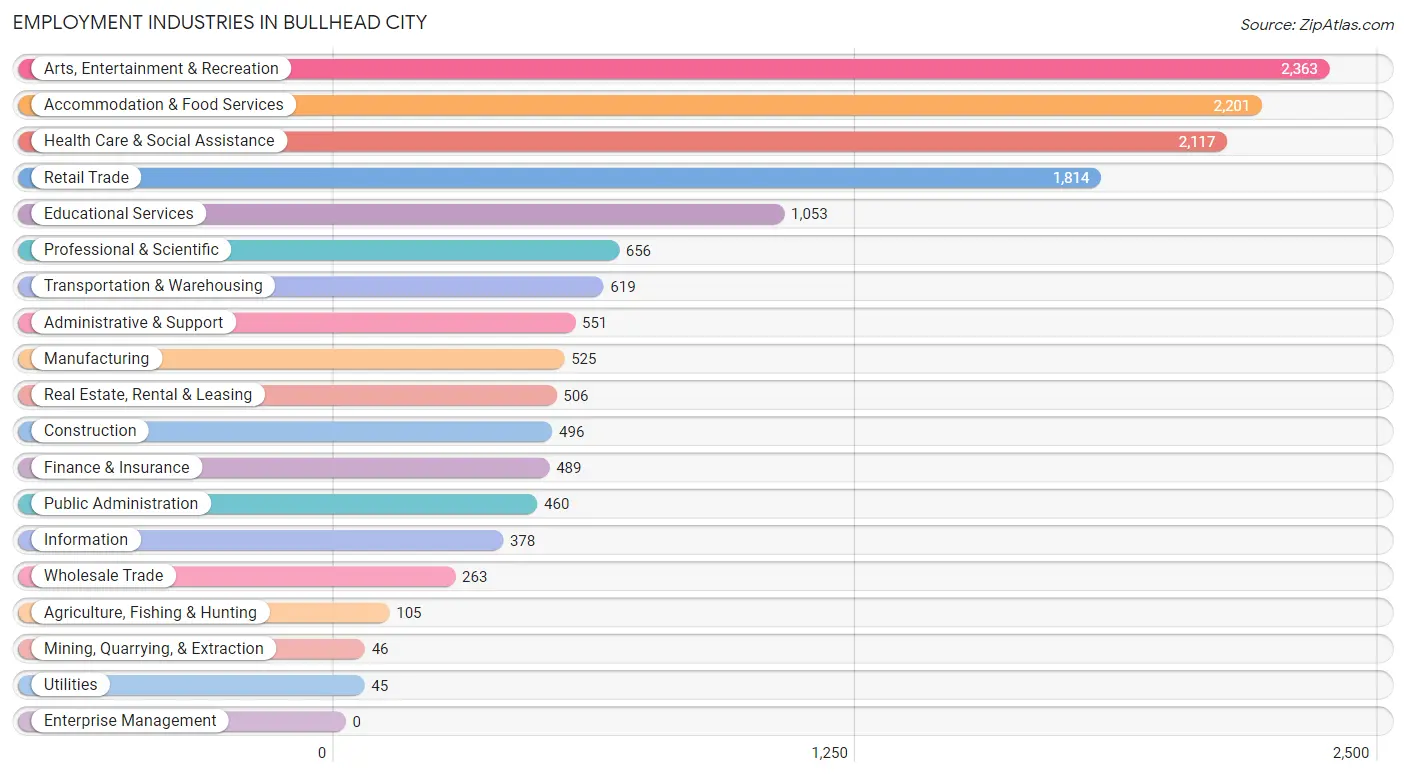
Employment Industries in Bullhead City
The major employment industries in Bullhead City include Arts, Entertainment & Recreation (2,363 | 15.2%), Accommodation & Food Services (2,201 | 14.2%), Health Care & Social Assistance (2,117 | 13.6%), Retail Trade (1,814 | 11.7%), and Educational Services (1,053 | 6.8%).
Employment Industries by Sex in Bullhead City
The Bullhead City industries that see more men than women are Mining, Quarrying, & Extraction (100.0%), Construction (98.6%), and Wholesale Trade (79.1%), whereas the industries that tend to have a higher number of women are Health Care & Social Assistance (62.9%), Accommodation & Food Services (60.6%), and Educational Services (58.2%).
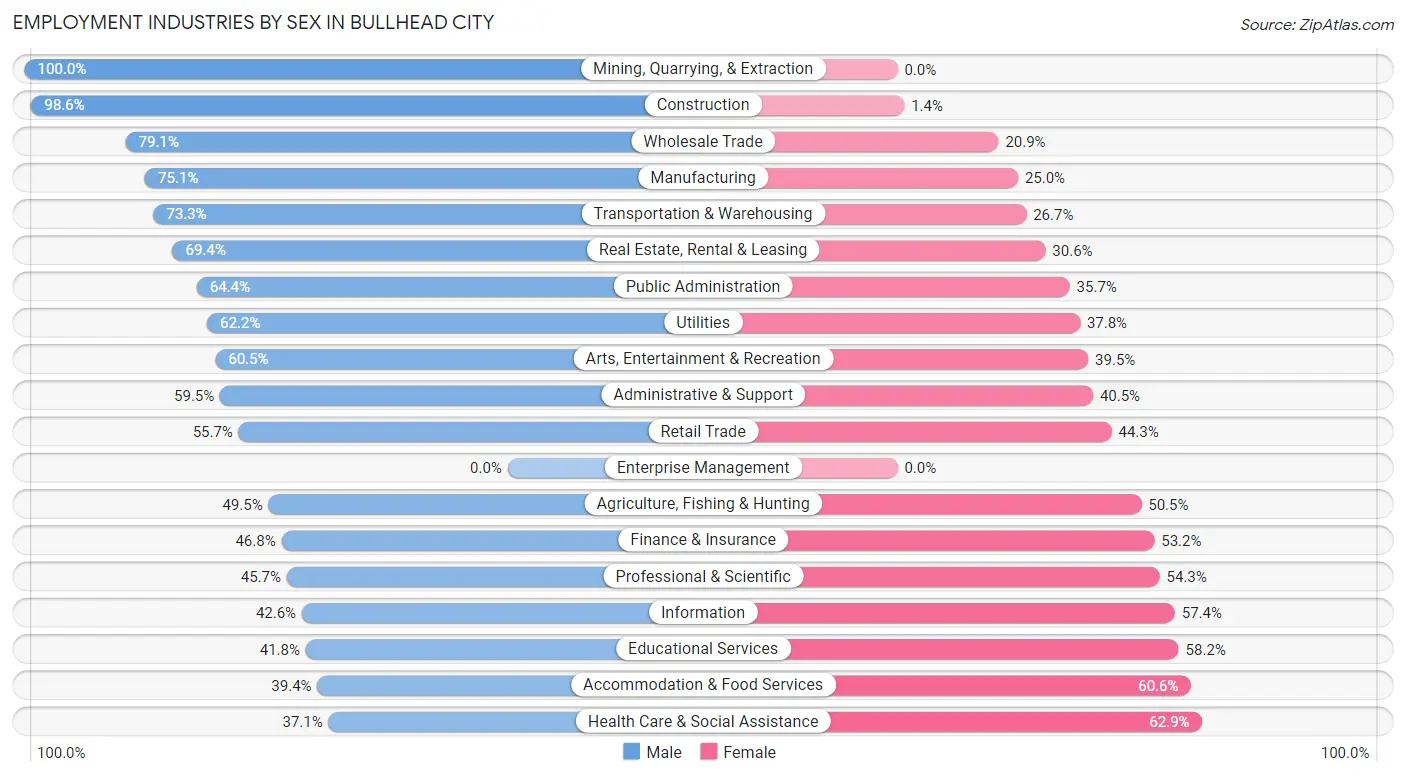
| Industry | Male | Female |
| Agriculture, Fishing & Hunting | 52 (49.5%) | 53 (50.5%) |
| Mining, Quarrying, & Extraction | 46 (100.0%) | 0 (0.0%) |
| Construction | 489 (98.6%) | 7 (1.4%) |
| Manufacturing | 394 (75.0%) | 131 (24.9%) |
| Wholesale Trade | 208 (79.1%) | 55 (20.9%) |
| Retail Trade | 1,010 (55.7%) | 804 (44.3%) |
| Transportation & Warehousing | 454 (73.3%) | 165 (26.7%) |
| Utilities | 28 (62.2%) | 17 (37.8%) |
| Information | 161 (42.6%) | 217 (57.4%) |
| Finance & Insurance | 229 (46.8%) | 260 (53.2%) |
| Real Estate, Rental & Leasing | 351 (69.4%) | 155 (30.6%) |
| Professional & Scientific | 300 (45.7%) | 356 (54.3%) |
| Enterprise Management | 0 (0.0%) | 0 (0.0%) |
| Administrative & Support | 328 (59.5%) | 223 (40.5%) |
| Educational Services | 440 (41.8%) | 613 (58.2%) |
| Health Care & Social Assistance | 785 (37.1%) | 1,332 (62.9%) |
| Arts, Entertainment & Recreation | 1,430 (60.5%) | 933 (39.5%) |
| Accommodation & Food Services | 867 (39.4%) | 1,334 (60.6%) |
| Public Administration | 296 (64.3%) | 164 (35.6%) |
| Total | 8,442 (54.3%) | 7,097 (45.7%) |
Education in Bullhead City
School Enrollment in Bullhead City
The most common levels of schooling among the 6,681 students in Bullhead City are middle school (1,612 | 24.1%), high school (1,486 | 22.2%), and elementary school (1,220 | 18.3%).
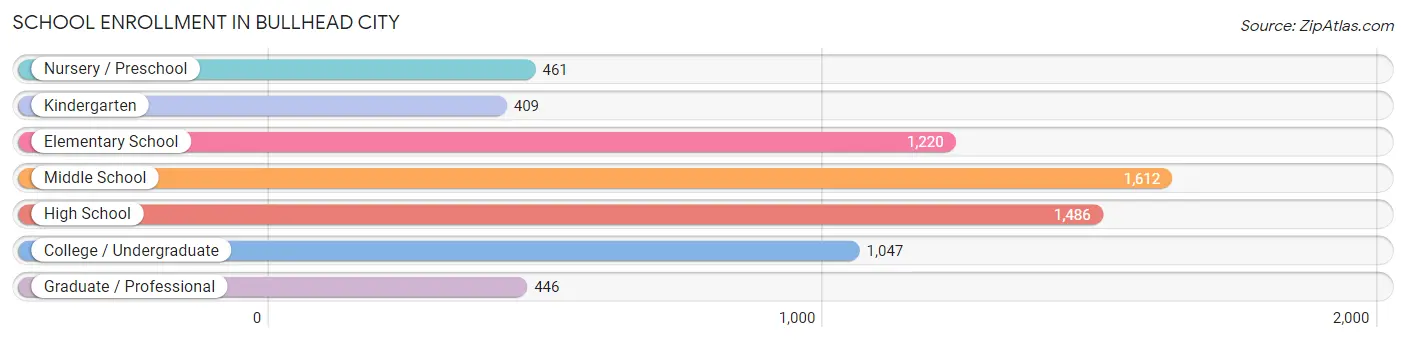
| School Level | # Students | % Students |
| Nursery / Preschool | 461 | 6.9% |
| Kindergarten | 409 | 6.1% |
| Elementary School | 1,220 | 18.3% |
| Middle School | 1,612 | 24.1% |
| High School | 1,486 | 22.2% |
| College / Undergraduate | 1,047 | 15.7% |
| Graduate / Professional | 446 | 6.7% |
| Total | 6,681 | 100.0% |
School Enrollment by Age by Funding Source in Bullhead City
Out of a total of 6,681 students who are enrolled in schools in Bullhead City, 822 (12.3%) attend a private institution, while the remaining 5,859 (87.7%) are enrolled in public schools. The age group of 35 years and over has the highest likelihood of being enrolled in private schools, with 149 (26.2% in the age bracket) enrolled. Conversely, the age group of 18 to 19 year olds has the lowest likelihood of being enrolled in a private school, with 362 (94.8% in the age bracket) attending a public institution.
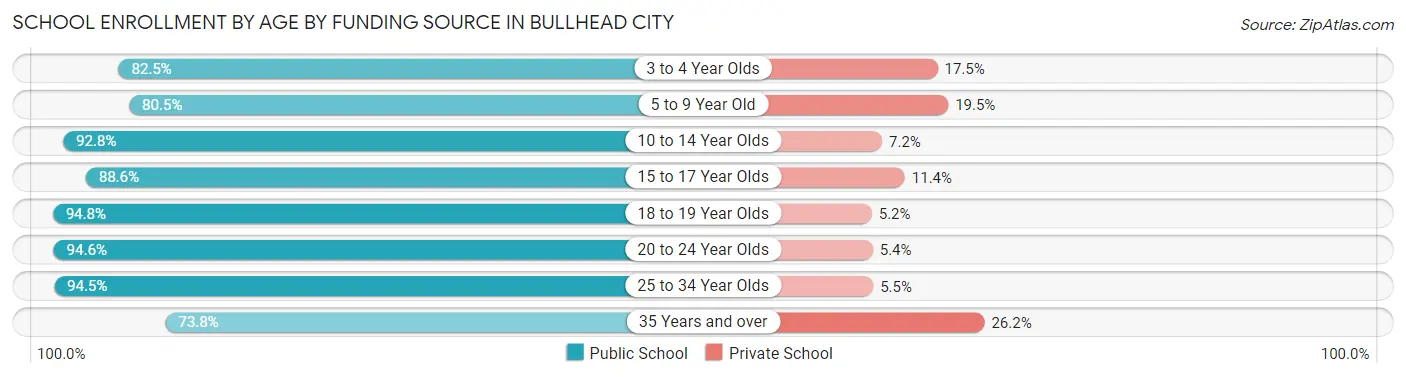
| Age Bracket | Public School | Private School |
| 3 to 4 Year Olds | 349 (82.5%) | 74 (17.5%) |
| 5 to 9 Year Old | 1,150 (80.5%) | 278 (19.5%) |
| 10 to 14 Year Olds | 1,814 (92.8%) | 140 (7.2%) |
| 15 to 17 Year Olds | 863 (88.6%) | 111 (11.4%) |
| 18 to 19 Year Olds | 362 (94.8%) | 20 (5.2%) |
| 20 to 24 Year Olds | 436 (94.6%) | 25 (5.4%) |
| 25 to 34 Year Olds | 464 (94.5%) | 27 (5.5%) |
| 35 Years and over | 419 (73.8%) | 149 (26.2%) |
| Total | 5,859 (87.7%) | 822 (12.3%) |
Educational Attainment by Field of Study in Bullhead City
Business (799 | 19.7%), education (765 | 18.8%), science & technology (428 | 10.5%), arts & humanities (323 | 8.0%), and social sciences (309 | 7.6%) are the most common fields of study among 4,065 individuals in Bullhead City who have obtained a bachelor's degree or higher.
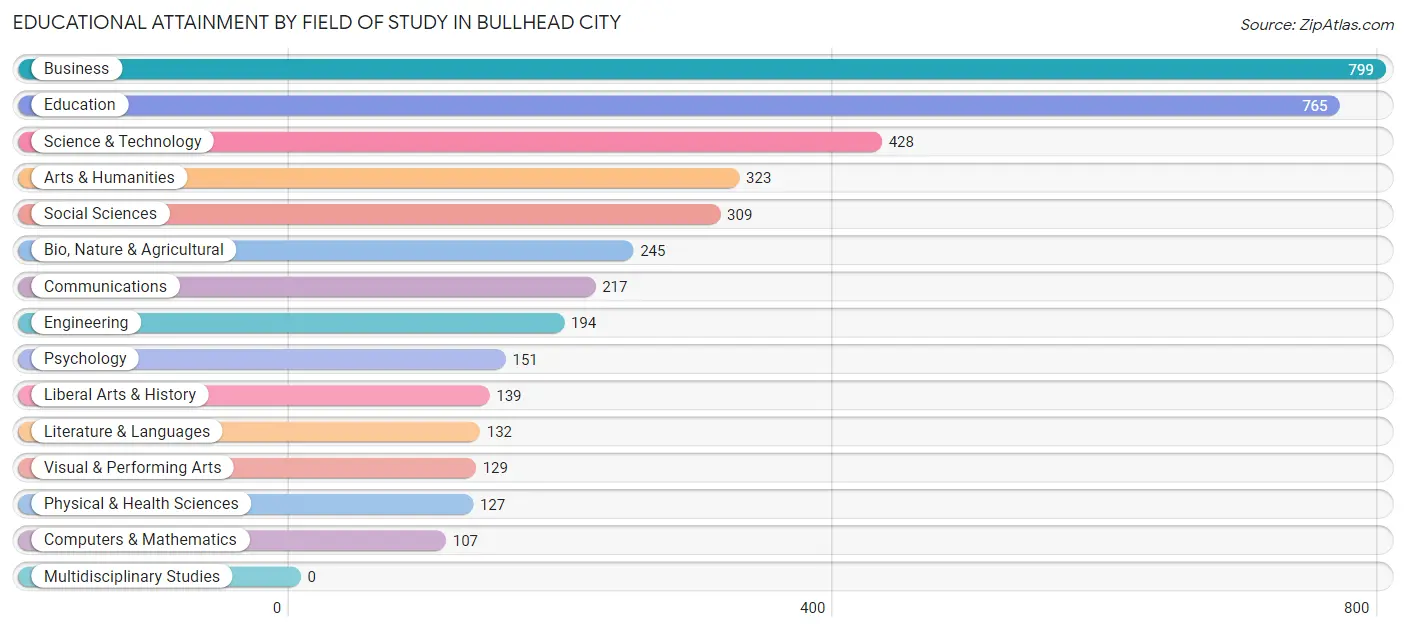
| Field of Study | # Graduates | % Graduates |
| Computers & Mathematics | 107 | 2.6% |
| Bio, Nature & Agricultural | 245 | 6.0% |
| Physical & Health Sciences | 127 | 3.1% |
| Psychology | 151 | 3.7% |
| Social Sciences | 309 | 7.6% |
| Engineering | 194 | 4.8% |
| Multidisciplinary Studies | 0 | 0.0% |
| Science & Technology | 428 | 10.5% |
| Business | 799 | 19.7% |
| Education | 765 | 18.8% |
| Literature & Languages | 132 | 3.3% |
| Liberal Arts & History | 139 | 3.4% |
| Visual & Performing Arts | 129 | 3.2% |
| Communications | 217 | 5.3% |
| Arts & Humanities | 323 | 8.0% |
| Total | 4,065 | 100.0% |
Transportation & Commute in Bullhead City
Vehicle Availability by Sex in Bullhead City
The most prevalent vehicle ownership categories in Bullhead City are males with 2 vehicles (3,554, accounting for 42.7%) and females with 2 vehicles (2,593, making up 51.5%).
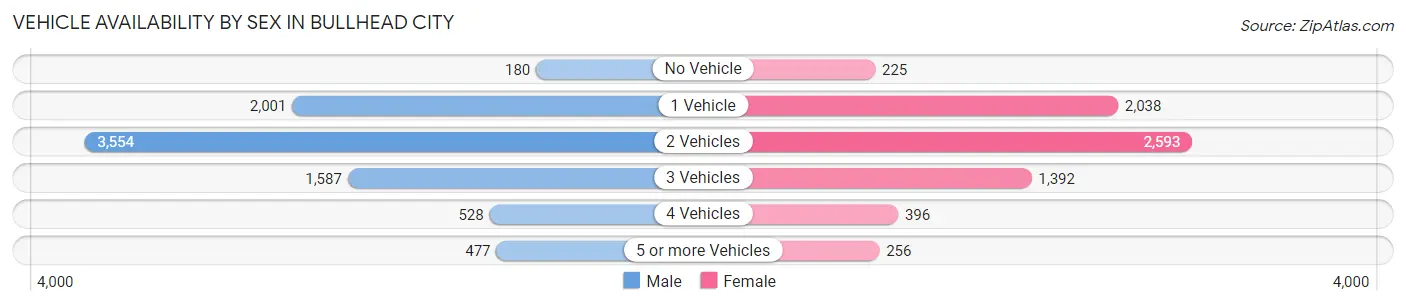
| Vehicles Available | Male | Female |
| No Vehicle | 180 (2.2%) | 225 (3.3%) |
| 1 Vehicle | 2,001 (24.0%) | 2,038 (29.5%) |
| 2 Vehicles | 3,554 (42.7%) | 2,593 (37.6%) |
| 3 Vehicles | 1,587 (19.1%) | 1,392 (20.2%) |
| 4 Vehicles | 528 (6.3%) | 396 (5.7%) |
| 5 or more Vehicles | 477 (5.7%) | 256 (3.7%) |
| Total | 8,327 (100.0%) | 6,900 (100.0%) |
Commute Time in Bullhead City
The most frequently occuring commute durations in Bullhead City are 10 to 14 minutes (3,013 commuters, 20.9%), 20 to 24 minutes (2,483 commuters, 17.2%), and 15 to 19 minutes (2,444 commuters, 17.0%).
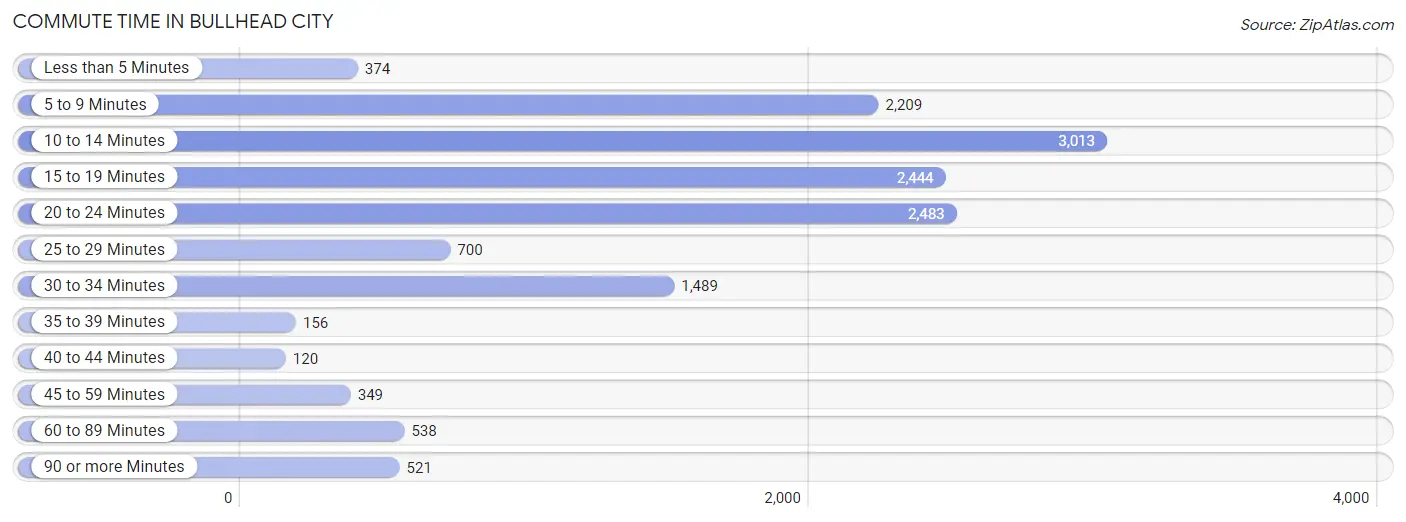
| Commute Time | # Commuters | % Commuters |
| Less than 5 Minutes | 374 | 2.6% |
| 5 to 9 Minutes | 2,209 | 15.3% |
| 10 to 14 Minutes | 3,013 | 20.9% |
| 15 to 19 Minutes | 2,444 | 17.0% |
| 20 to 24 Minutes | 2,483 | 17.2% |
| 25 to 29 Minutes | 700 | 4.9% |
| 30 to 34 Minutes | 1,489 | 10.3% |
| 35 to 39 Minutes | 156 | 1.1% |
| 40 to 44 Minutes | 120 | 0.8% |
| 45 to 59 Minutes | 349 | 2.4% |
| 60 to 89 Minutes | 538 | 3.7% |
| 90 or more Minutes | 521 | 3.6% |
Commute Time by Sex in Bullhead City
The most common commute times in Bullhead City are 10 to 14 minutes (1,929 commuters, 24.2%) for males and 15 to 19 minutes (1,349 commuters, 21.0%) for females.
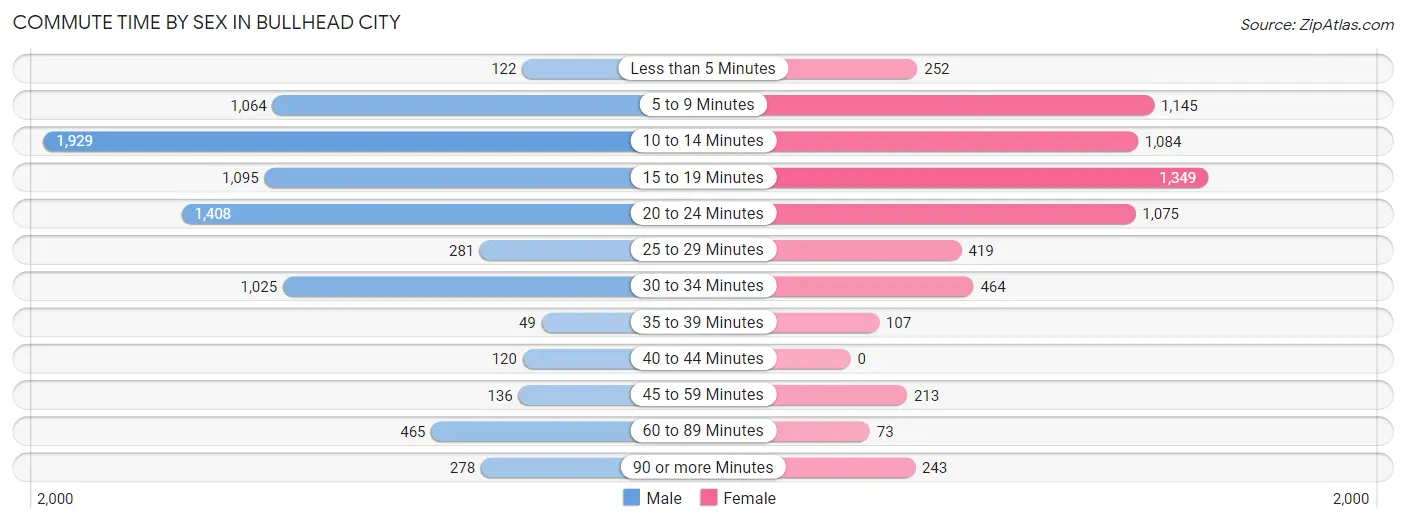
| Commute Time | Male | Female |
| Less than 5 Minutes | 122 (1.5%) | 252 (3.9%) |
| 5 to 9 Minutes | 1,064 (13.4%) | 1,145 (17.8%) |
| 10 to 14 Minutes | 1,929 (24.2%) | 1,084 (16.9%) |
| 15 to 19 Minutes | 1,095 (13.7%) | 1,349 (21.0%) |
| 20 to 24 Minutes | 1,408 (17.7%) | 1,075 (16.7%) |
| 25 to 29 Minutes | 281 (3.5%) | 419 (6.5%) |
| 30 to 34 Minutes | 1,025 (12.9%) | 464 (7.2%) |
| 35 to 39 Minutes | 49 (0.6%) | 107 (1.7%) |
| 40 to 44 Minutes | 120 (1.5%) | 0 (0.0%) |
| 45 to 59 Minutes | 136 (1.7%) | 213 (3.3%) |
| 60 to 89 Minutes | 465 (5.8%) | 73 (1.1%) |
| 90 or more Minutes | 278 (3.5%) | 243 (3.8%) |
Time of Departure to Work by Sex in Bullhead City
The most frequent times of departure to work in Bullhead City are 7:30 AM to 7:59 AM (1,158, 14.5%) for males and 12:00 PM to 3:59 PM (1,098, 17.1%) for females.
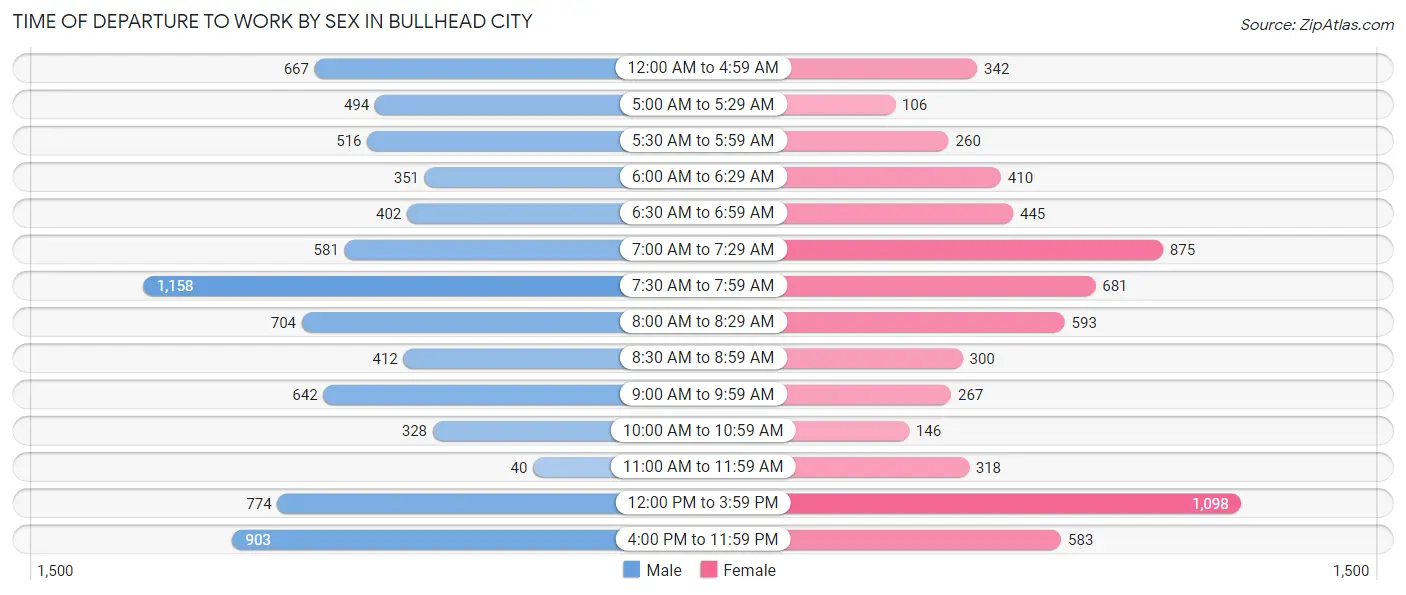
| Time of Departure | Male | Female |
| 12:00 AM to 4:59 AM | 667 (8.4%) | 342 (5.3%) |
| 5:00 AM to 5:29 AM | 494 (6.2%) | 106 (1.7%) |
| 5:30 AM to 5:59 AM | 516 (6.5%) | 260 (4.1%) |
| 6:00 AM to 6:29 AM | 351 (4.4%) | 410 (6.4%) |
| 6:30 AM to 6:59 AM | 402 (5.0%) | 445 (6.9%) |
| 7:00 AM to 7:29 AM | 581 (7.3%) | 875 (13.6%) |
| 7:30 AM to 7:59 AM | 1,158 (14.5%) | 681 (10.6%) |
| 8:00 AM to 8:29 AM | 704 (8.8%) | 593 (9.2%) |
| 8:30 AM to 8:59 AM | 412 (5.2%) | 300 (4.7%) |
| 9:00 AM to 9:59 AM | 642 (8.1%) | 267 (4.2%) |
| 10:00 AM to 10:59 AM | 328 (4.1%) | 146 (2.3%) |
| 11:00 AM to 11:59 AM | 40 (0.5%) | 318 (5.0%) |
| 12:00 PM to 3:59 PM | 774 (9.7%) | 1,098 (17.1%) |
| 4:00 PM to 11:59 PM | 903 (11.3%) | 583 (9.1%) |
| Total | 7,972 (100.0%) | 6,424 (100.0%) |
Housing Occupancy in Bullhead City
Occupancy by Ownership in Bullhead City
Of the total 18,788 dwellings in Bullhead City, owner-occupied units account for 12,229 (65.1%), while renter-occupied units make up 6,559 (34.9%).
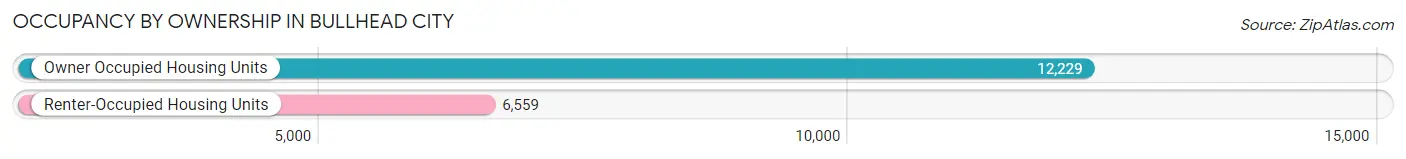
| Occupancy | # Housing Units | % Housing Units |
| Owner Occupied Housing Units | 12,229 | 65.1% |
| Renter-Occupied Housing Units | 6,559 | 34.9% |
| Total Occupied Housing Units | 18,788 | 100.0% |
Occupancy by Household Size in Bullhead City
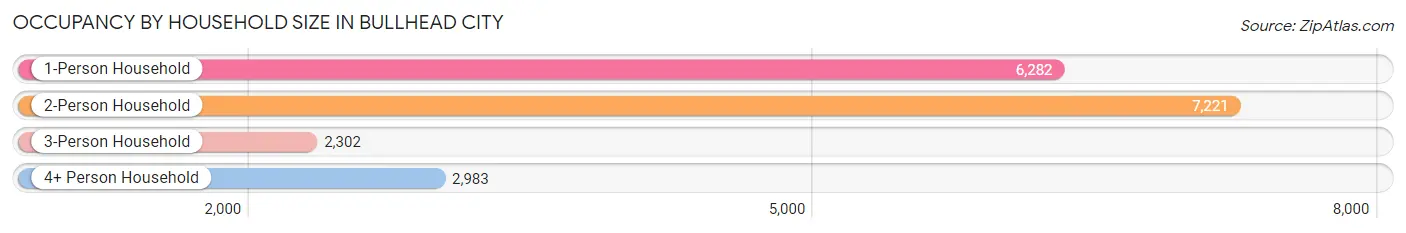
| Household Size | # Housing Units | % Housing Units |
| 1-Person Household | 6,282 | 33.4% |
| 2-Person Household | 7,221 | 38.4% |
| 3-Person Household | 2,302 | 12.2% |
| 4+ Person Household | 2,983 | 15.9% |
| Total Housing Units | 18,788 | 100.0% |
Occupancy by Ownership by Household Size in Bullhead City
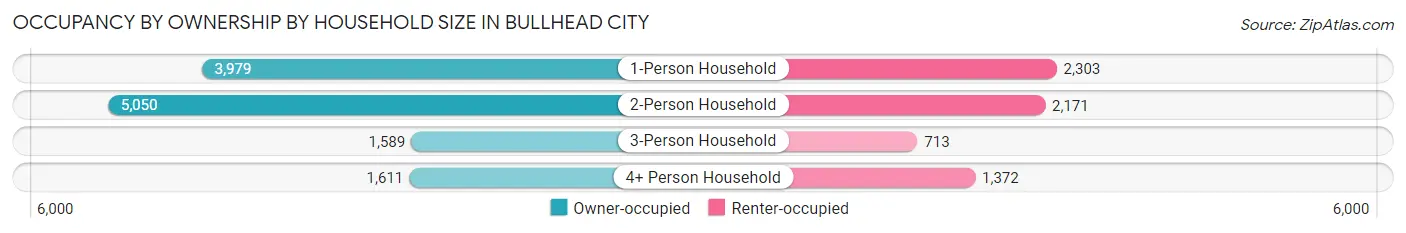
| Household Size | Owner-occupied | Renter-occupied |
| 1-Person Household | 3,979 (63.3%) | 2,303 (36.7%) |
| 2-Person Household | 5,050 (69.9%) | 2,171 (30.1%) |
| 3-Person Household | 1,589 (69.0%) | 713 (31.0%) |
| 4+ Person Household | 1,611 (54.0%) | 1,372 (46.0%) |
| Total Housing Units | 12,229 (65.1%) | 6,559 (34.9%) |
Occupancy by Educational Attainment in Bullhead City
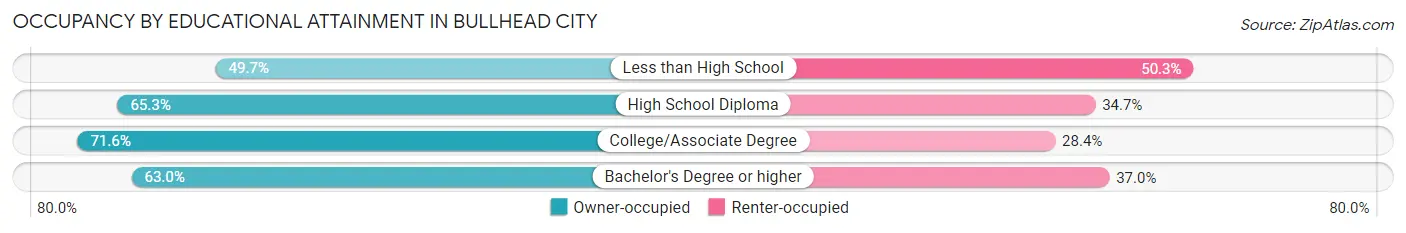
| Household Size | Owner-occupied | Renter-occupied |
| Less than High School | 1,324 (49.7%) | 1,340 (50.3%) |
| High School Diploma | 4,311 (65.3%) | 2,295 (34.7%) |
| College/Associate Degree | 4,966 (71.6%) | 1,969 (28.4%) |
| Bachelor's Degree or higher | 1,628 (63.0%) | 955 (37.0%) |
Occupancy by Age of Householder in Bullhead City
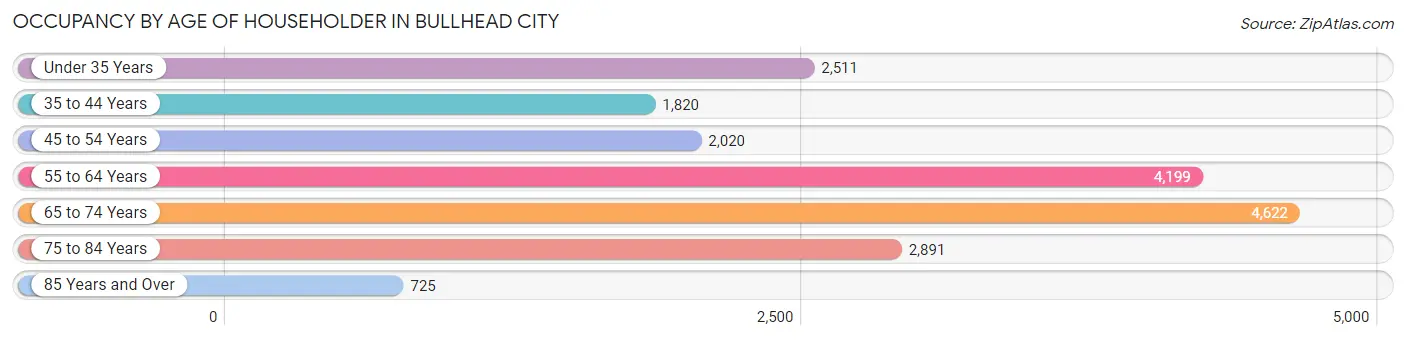
| Age Bracket | # Households | % Households |
| Under 35 Years | 2,511 | 13.4% |
| 35 to 44 Years | 1,820 | 9.7% |
| 45 to 54 Years | 2,020 | 10.7% |
| 55 to 64 Years | 4,199 | 22.4% |
| 65 to 74 Years | 4,622 | 24.6% |
| 75 to 84 Years | 2,891 | 15.4% |
| 85 Years and Over | 725 | 3.9% |
| Total | 18,788 | 100.0% |
Housing Finances in Bullhead City
Median Income by Occupancy in Bullhead City
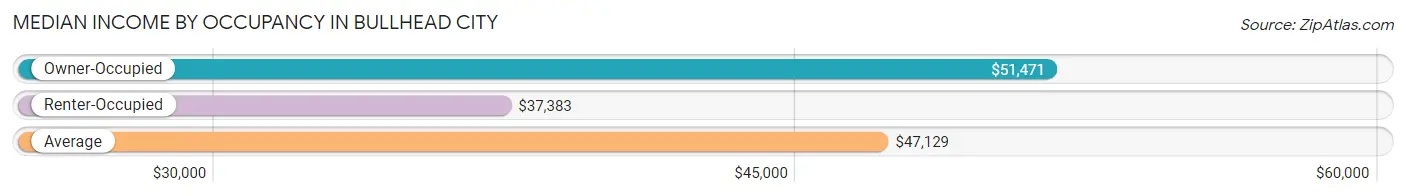
| Occupancy Type | # Households | Median Income |
| Owner-Occupied | 12,229 (65.1%) | $51,471 |
| Renter-Occupied | 6,559 (34.9%) | $37,383 |
| Average | 18,788 (100.0%) | $47,129 |
Occupancy by Householder Income Bracket in Bullhead City
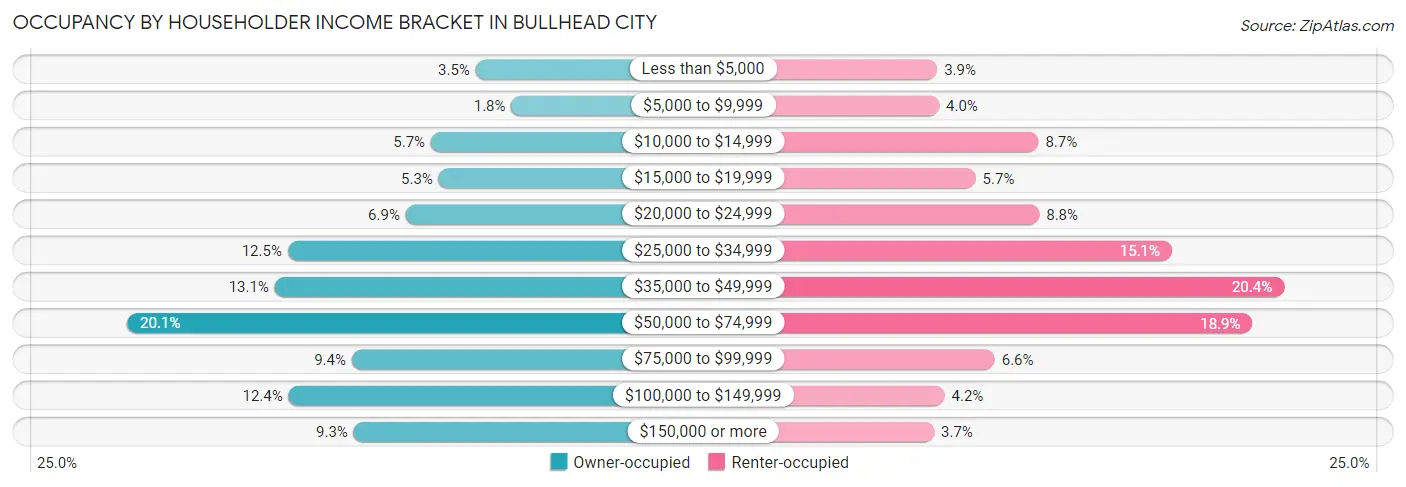
| Income Bracket | Owner-occupied | Renter-occupied |
| Less than $5,000 | 431 (3.5%) | 255 (3.9%) |
| $5,000 to $9,999 | 223 (1.8%) | 261 (4.0%) |
| $10,000 to $14,999 | 691 (5.7%) | 571 (8.7%) |
| $15,000 to $19,999 | 646 (5.3%) | 375 (5.7%) |
| $20,000 to $24,999 | 838 (6.9%) | 574 (8.7%) |
| $25,000 to $34,999 | 1,525 (12.5%) | 988 (15.1%) |
| $35,000 to $49,999 | 1,601 (13.1%) | 1,338 (20.4%) |
| $50,000 to $74,999 | 2,461 (20.1%) | 1,239 (18.9%) |
| $75,000 to $99,999 | 1,152 (9.4%) | 435 (6.6%) |
| $100,000 to $149,999 | 1,520 (12.4%) | 278 (4.2%) |
| $150,000 or more | 1,141 (9.3%) | 245 (3.7%) |
| Total | 12,229 (100.0%) | 6,559 (100.0%) |
Monthly Housing Cost Tiers in Bullhead City
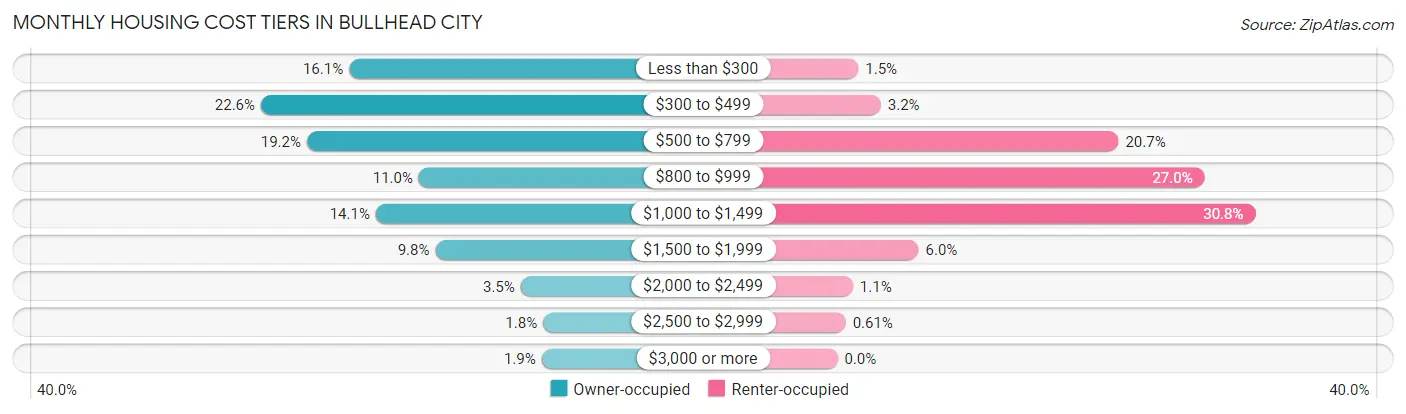
| Monthly Cost | Owner-occupied | Renter-occupied |
| Less than $300 | 1,970 (16.1%) | 101 (1.5%) |
| $300 to $499 | 2,764 (22.6%) | 210 (3.2%) |
| $500 to $799 | 2,350 (19.2%) | 1,358 (20.7%) |
| $800 to $999 | 1,342 (11.0%) | 1,773 (27.0%) |
| $1,000 to $1,499 | 1,729 (14.1%) | 2,018 (30.8%) |
| $1,500 to $1,999 | 1,192 (9.8%) | 392 (6.0%) |
| $2,000 to $2,499 | 424 (3.5%) | 75 (1.1%) |
| $2,500 to $2,999 | 222 (1.8%) | 40 (0.6%) |
| $3,000 or more | 236 (1.9%) | 0 (0.0%) |
| Total | 12,229 (100.0%) | 6,559 (100.0%) |
Physical Housing Characteristics in Bullhead City
Housing Structures in Bullhead City
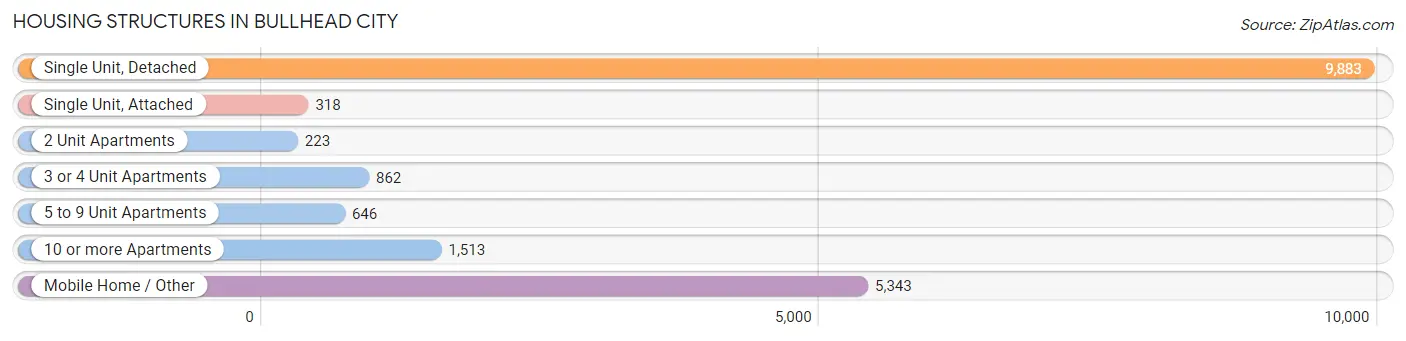
| Structure Type | # Housing Units | % Housing Units |
| Single Unit, Detached | 9,883 | 52.6% |
| Single Unit, Attached | 318 | 1.7% |
| 2 Unit Apartments | 223 | 1.2% |
| 3 or 4 Unit Apartments | 862 | 4.6% |
| 5 to 9 Unit Apartments | 646 | 3.4% |
| 10 or more Apartments | 1,513 | 8.1% |
| Mobile Home / Other | 5,343 | 28.4% |
| Total | 18,788 | 100.0% |
Housing Structures by Occupancy in Bullhead City
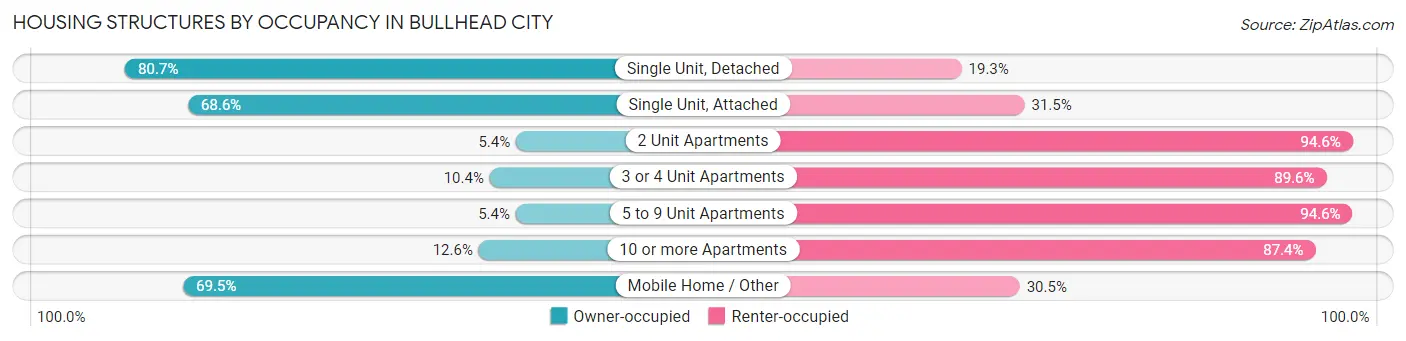
| Structure Type | Owner-occupied | Renter-occupied |
| Single Unit, Detached | 7,972 (80.7%) | 1,911 (19.3%) |
| Single Unit, Attached | 218 (68.5%) | 100 (31.5%) |
| 2 Unit Apartments | 12 (5.4%) | 211 (94.6%) |
| 3 or 4 Unit Apartments | 90 (10.4%) | 772 (89.6%) |
| 5 to 9 Unit Apartments | 35 (5.4%) | 611 (94.6%) |
| 10 or more Apartments | 190 (12.6%) | 1,323 (87.4%) |
| Mobile Home / Other | 3,712 (69.5%) | 1,631 (30.5%) |
| Total | 12,229 (65.1%) | 6,559 (34.9%) |
Housing Structures by Number of Rooms in Bullhead City
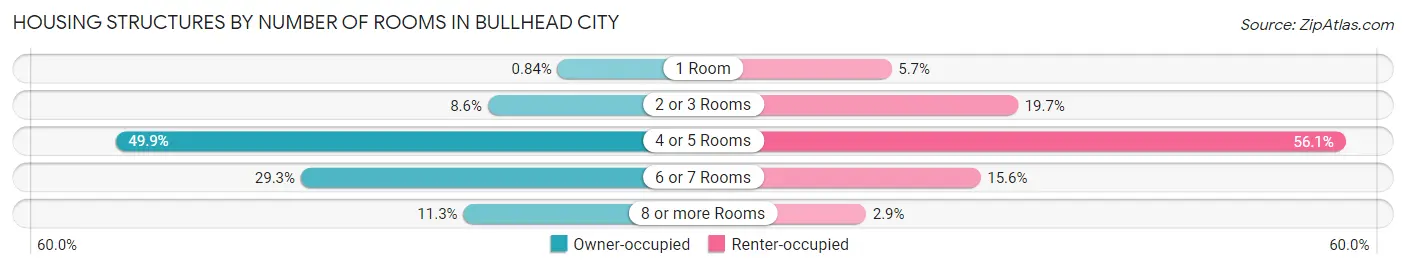
| Number of Rooms | Owner-occupied | Renter-occupied |
| 1 Room | 103 (0.8%) | 374 (5.7%) |
| 2 or 3 Rooms | 1,051 (8.6%) | 1,294 (19.7%) |
| 4 or 5 Rooms | 6,105 (49.9%) | 3,681 (56.1%) |
| 6 or 7 Rooms | 3,588 (29.3%) | 1,022 (15.6%) |
| 8 or more Rooms | 1,382 (11.3%) | 188 (2.9%) |
| Total | 12,229 (100.0%) | 6,559 (100.0%) |
Housing Structure by Heating Type in Bullhead City
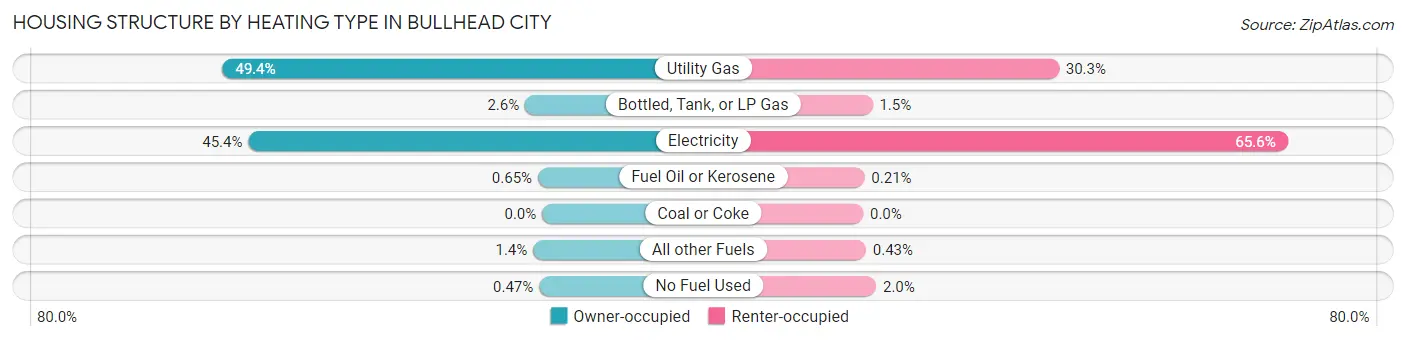
| Heating Type | Owner-occupied | Renter-occupied |
| Utility Gas | 6,045 (49.4%) | 1,985 (30.3%) |
| Bottled, Tank, or LP Gas | 323 (2.6%) | 96 (1.5%) |
| Electricity | 5,554 (45.4%) | 4,304 (65.6%) |
| Fuel Oil or Kerosene | 79 (0.6%) | 14 (0.2%) |
| Coal or Coke | 0 (0.0%) | 0 (0.0%) |
| All other Fuels | 170 (1.4%) | 28 (0.4%) |
| No Fuel Used | 58 (0.5%) | 132 (2.0%) |
| Total | 12,229 (100.0%) | 6,559 (100.0%) |
Household Vehicle Usage in Bullhead City
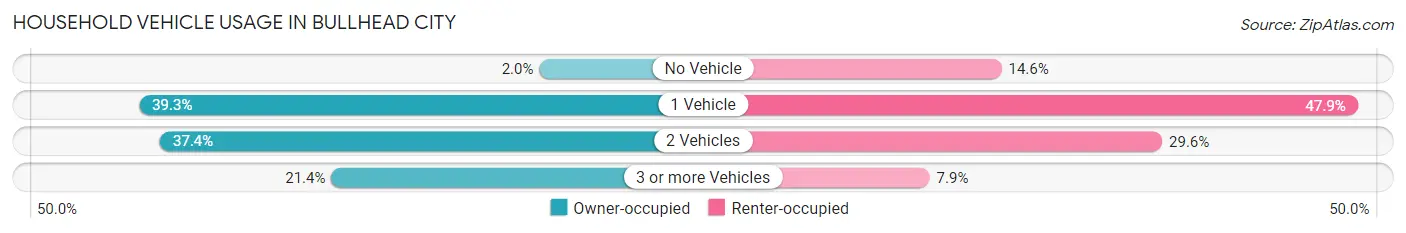
| Vehicles per Household | Owner-occupied | Renter-occupied |
| No Vehicle | 238 (1.9%) | 959 (14.6%) |
| 1 Vehicle | 4,808 (39.3%) | 3,139 (47.9%) |
| 2 Vehicles | 4,570 (37.4%) | 1,942 (29.6%) |
| 3 or more Vehicles | 2,613 (21.4%) | 519 (7.9%) |
| Total | 12,229 (100.0%) | 6,559 (100.0%) |
Real Estate & Mortgages in Bullhead City
Real Estate and Mortgage Overview in Bullhead City
| Characteristic | Without Mortgage | With Mortgage |
| Housing Units | 6,269 | 5,960 |
| Median Property Value | $165,000 | $211,300 |
| Median Household Income | $42,633 | $705 |
| Monthly Housing Costs | $368 | $216 |
| Real Estate Taxes | $791 | $148 |
Property Value by Mortgage Status in Bullhead City
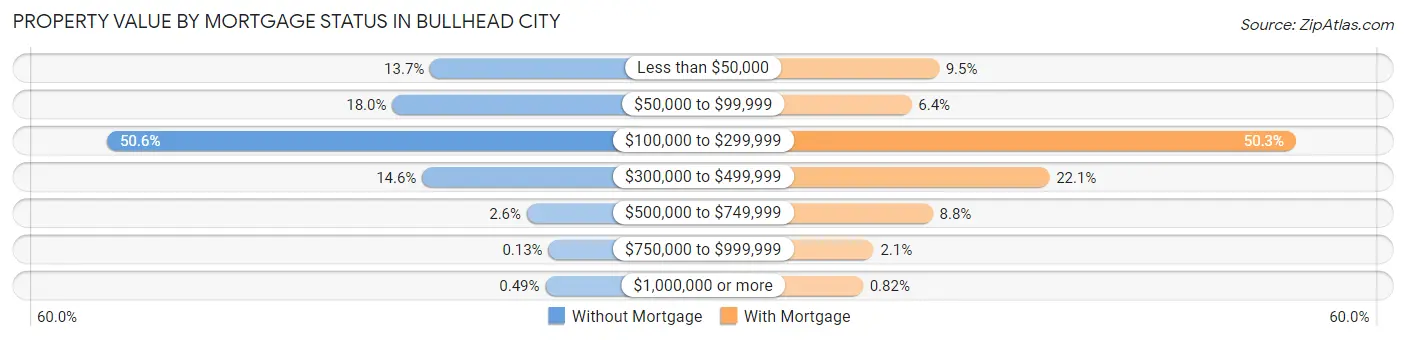
| Property Value | Without Mortgage | With Mortgage |
| Less than $50,000 | 856 (13.7%) | 566 (9.5%) |
| $50,000 to $99,999 | 1,127 (18.0%) | 380 (6.4%) |
| $100,000 to $299,999 | 3,171 (50.6%) | 2,999 (50.3%) |
| $300,000 to $499,999 | 913 (14.6%) | 1,319 (22.1%) |
| $500,000 to $749,999 | 163 (2.6%) | 525 (8.8%) |
| $750,000 to $999,999 | 8 (0.1%) | 122 (2.1%) |
| $1,000,000 or more | 31 (0.5%) | 49 (0.8%) |
| Total | 6,269 (100.0%) | 5,960 (100.0%) |
Household Income by Mortgage Status in Bullhead City
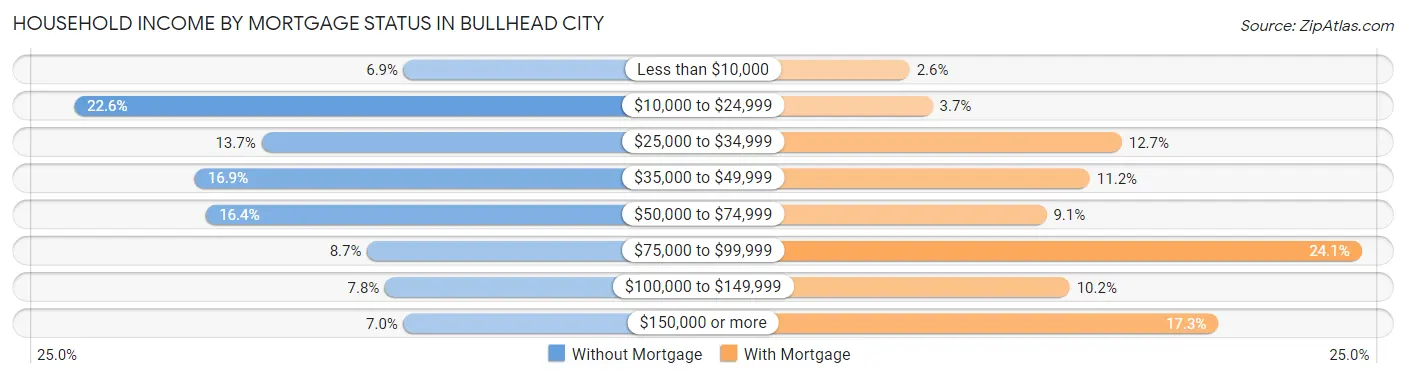
| Household Income | Without Mortgage | With Mortgage |
| Less than $10,000 | 435 (6.9%) | 154 (2.6%) |
| $10,000 to $24,999 | 1,419 (22.6%) | 219 (3.7%) |
| $25,000 to $34,999 | 860 (13.7%) | 756 (12.7%) |
| $35,000 to $49,999 | 1,059 (16.9%) | 665 (11.2%) |
| $50,000 to $74,999 | 1,025 (16.4%) | 542 (9.1%) |
| $75,000 to $99,999 | 544 (8.7%) | 1,436 (24.1%) |
| $100,000 to $149,999 | 491 (7.8%) | 608 (10.2%) |
| $150,000 or more | 436 (7.0%) | 1,029 (17.3%) |
| Total | 6,269 (100.0%) | 5,960 (100.0%) |
Property Value to Household Income Ratio in Bullhead City
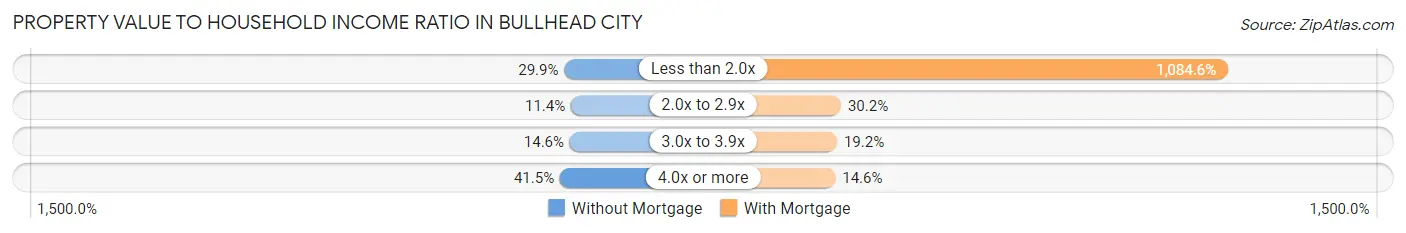
| Value-to-Income Ratio | Without Mortgage | With Mortgage |
| Less than 2.0x | 1,871 (29.8%) | 64,643 (1,084.6%) |
| 2.0x to 2.9x | 717 (11.4%) | 1,800 (30.2%) |
| 3.0x to 3.9x | 917 (14.6%) | 1,146 (19.2%) |
| 4.0x or more | 2,599 (41.5%) | 867 (14.5%) |
| Total | 6,269 (100.0%) | 5,960 (100.0%) |
Real Estate Taxes by Mortgage Status in Bullhead City
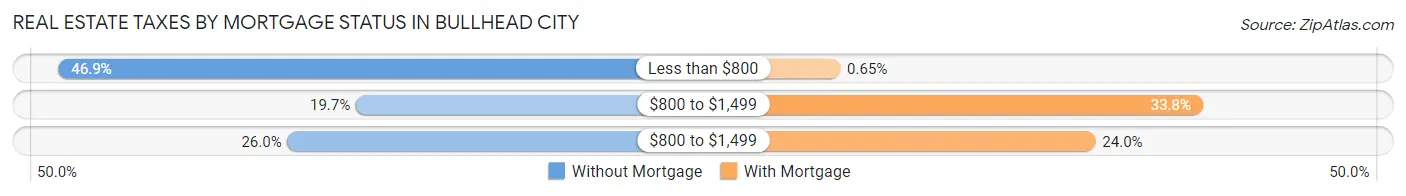
| Property Taxes | Without Mortgage | With Mortgage |
| Less than $800 | 2,941 (46.9%) | 39 (0.6%) |
| $800 to $1,499 | 1,237 (19.7%) | 2,012 (33.8%) |
| $800 to $1,499 | 1,629 (26.0%) | 1,428 (24.0%) |
| Total | 6,269 (100.0%) | 5,960 (100.0%) |
Health & Disability in Bullhead City
Health Insurance Coverage by Age in Bullhead City
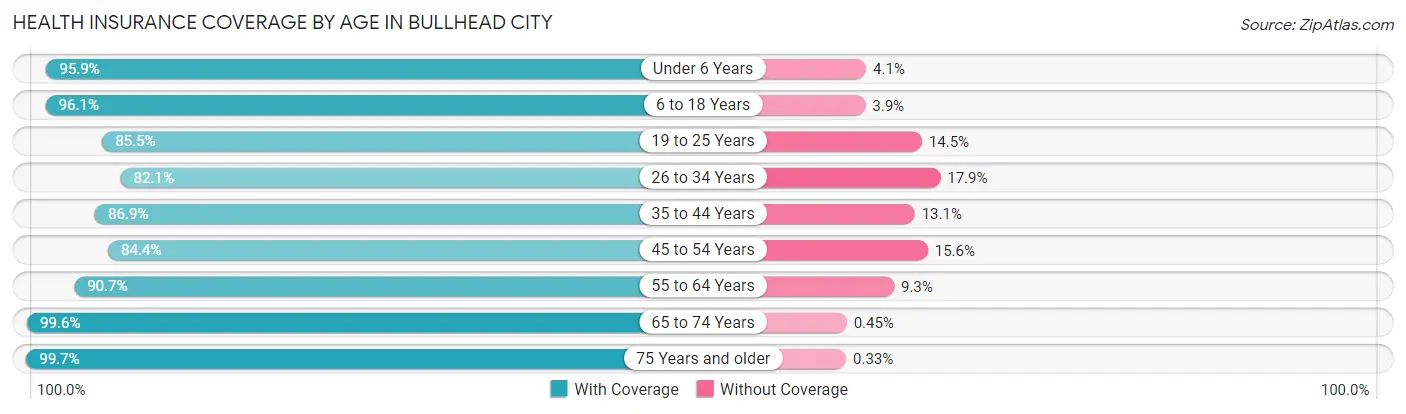
| Age Bracket | With Coverage | Without Coverage |
| Under 6 Years | 2,262 (95.9%) | 96 (4.1%) |
| 6 to 18 Years | 4,653 (96.1%) | 190 (3.9%) |
| 19 to 25 Years | 2,889 (85.5%) | 489 (14.5%) |
| 26 to 34 Years | 3,234 (82.1%) | 705 (17.9%) |
| 35 to 44 Years | 2,903 (86.9%) | 439 (13.1%) |
| 45 to 54 Years | 3,433 (84.4%) | 633 (15.6%) |
| 55 to 64 Years | 6,513 (90.7%) | 665 (9.3%) |
| 65 to 74 Years | 6,877 (99.6%) | 31 (0.4%) |
| 75 Years and older | 5,368 (99.7%) | 18 (0.3%) |
| Total | 38,132 (92.1%) | 3,266 (7.9%) |
Health Insurance Coverage by Citizenship Status in Bullhead City
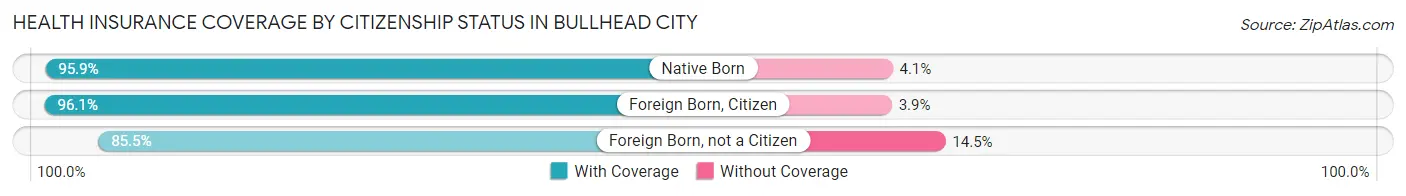
| Citizenship Status | With Coverage | Without Coverage |
| Native Born | 2,262 (95.9%) | 96 (4.1%) |
| Foreign Born, Citizen | 4,653 (96.1%) | 190 (3.9%) |
| Foreign Born, not a Citizen | 2,889 (85.5%) | 489 (14.5%) |
Health Insurance Coverage by Household Income in Bullhead City
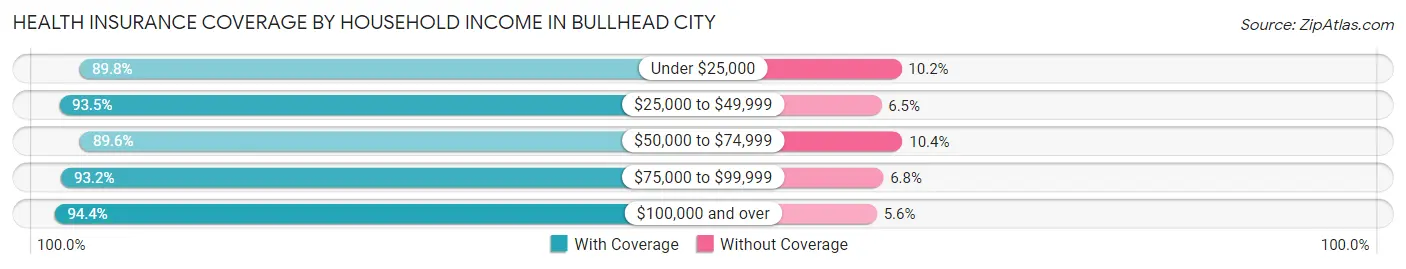
| Household Income | With Coverage | Without Coverage |
| Under $25,000 | 7,002 (89.8%) | 798 (10.2%) |
| $25,000 to $49,999 | 10,680 (93.5%) | 737 (6.5%) |
| $50,000 to $74,999 | 8,217 (89.6%) | 954 (10.4%) |
| $75,000 to $99,999 | 3,844 (93.2%) | 282 (6.8%) |
| $100,000 and over | 8,346 (94.4%) | 495 (5.6%) |
Public vs Private Health Insurance Coverage by Age in Bullhead City
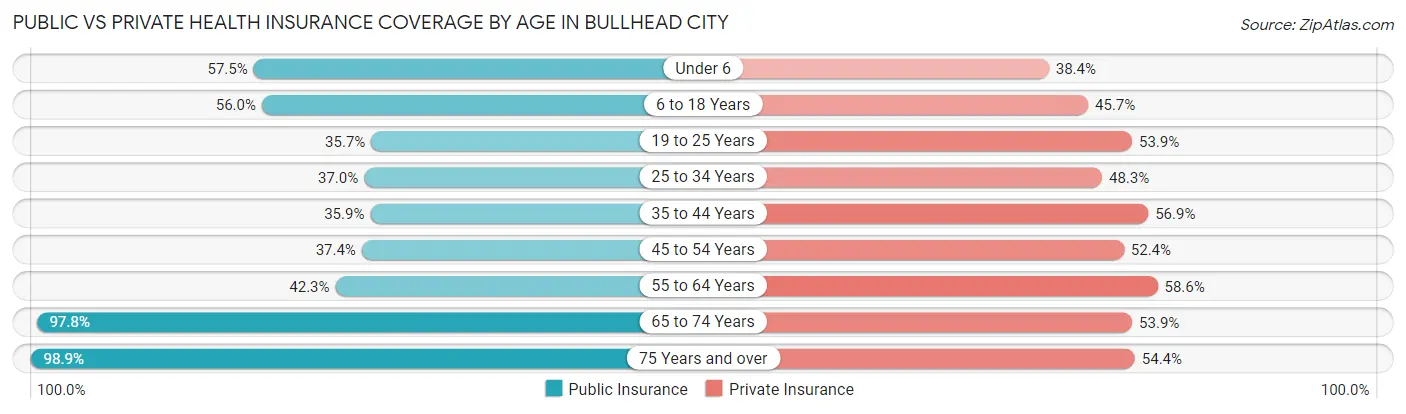
| Age Bracket | Public Insurance | Private Insurance |
| Under 6 | 1,356 (57.5%) | 906 (38.4%) |
| 6 to 18 Years | 2,711 (56.0%) | 2,214 (45.7%) |
| 19 to 25 Years | 1,205 (35.7%) | 1,820 (53.9%) |
| 25 to 34 Years | 1,457 (37.0%) | 1,903 (48.3%) |
| 35 to 44 Years | 1,198 (35.8%) | 1,901 (56.9%) |
| 45 to 54 Years | 1,522 (37.4%) | 2,129 (52.4%) |
| 55 to 64 Years | 3,038 (42.3%) | 4,206 (58.6%) |
| 65 to 74 Years | 6,755 (97.8%) | 3,723 (53.9%) |
| 75 Years and over | 5,325 (98.9%) | 2,930 (54.4%) |
| Total | 24,567 (59.3%) | 21,732 (52.5%) |
Disability Status by Sex by Age in Bullhead City
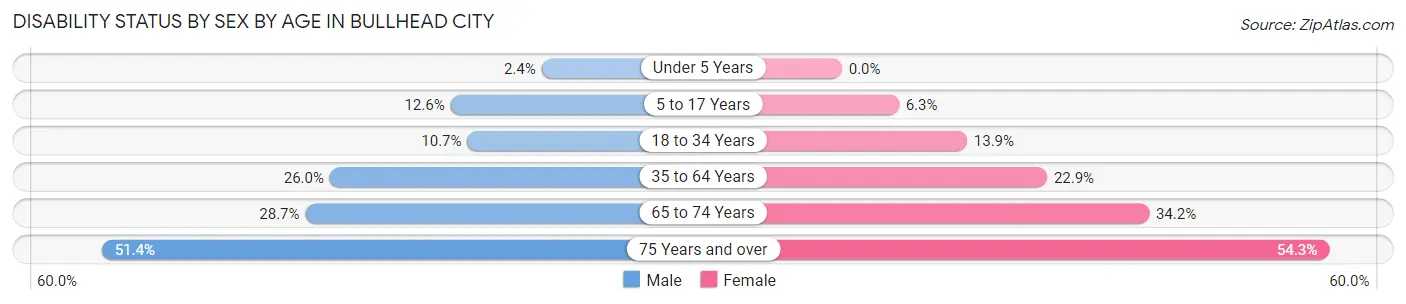
| Age Bracket | Male | Female |
| Under 5 Years | 31 (2.4%) | 0 (0.0%) |
| 5 to 17 Years | 307 (12.6%) | 141 (6.3%) |
| 18 to 34 Years | 494 (10.7%) | 442 (13.9%) |
| 35 to 64 Years | 1,839 (26.0%) | 1,718 (22.9%) |
| 65 to 74 Years | 992 (28.7%) | 1,182 (34.2%) |
| 75 Years and over | 1,365 (51.4%) | 1,482 (54.3%) |
Disability Class by Sex by Age in Bullhead City
Disability Class: Hearing Difficulty
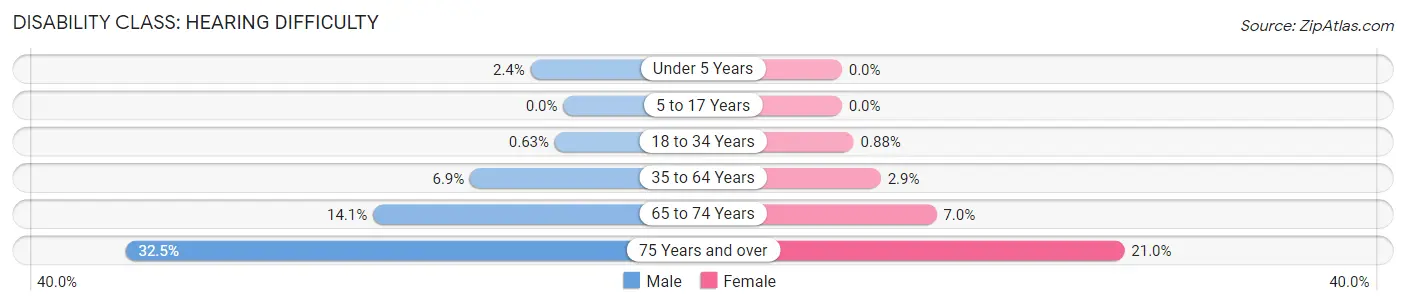
| Age Bracket | Male | Female |
| Under 5 Years | 31 (2.4%) | 0 (0.0%) |
| 5 to 17 Years | 0 (0.0%) | 0 (0.0%) |
| 18 to 34 Years | 29 (0.6%) | 28 (0.9%) |
| 35 to 64 Years | 489 (6.9%) | 217 (2.9%) |
| 65 to 74 Years | 488 (14.1%) | 243 (7.0%) |
| 75 Years and over | 863 (32.5%) | 573 (21.0%) |
Disability Class: Vision Difficulty
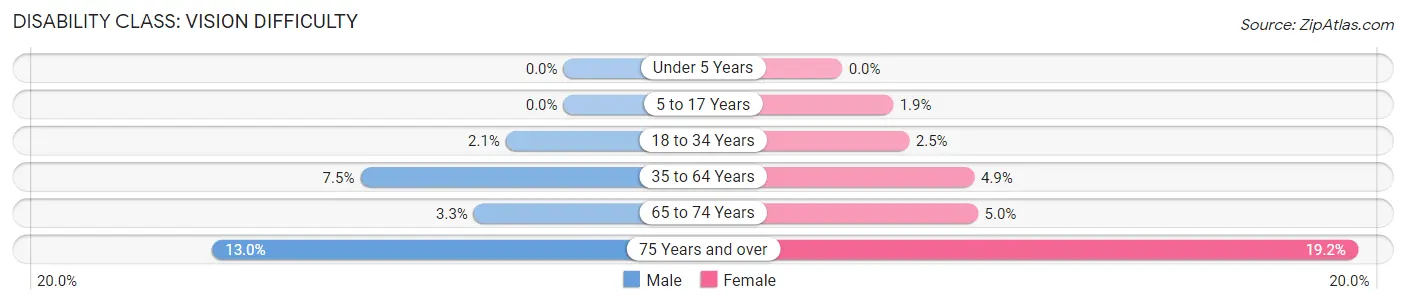
| Age Bracket | Male | Female |
| Under 5 Years | 0 (0.0%) | 0 (0.0%) |
| 5 to 17 Years | 0 (0.0%) | 42 (1.9%) |
| 18 to 34 Years | 99 (2.1%) | 79 (2.5%) |
| 35 to 64 Years | 533 (7.5%) | 369 (4.9%) |
| 65 to 74 Years | 115 (3.3%) | 174 (5.0%) |
| 75 Years and over | 346 (13.0%) | 523 (19.2%) |
Disability Class: Cognitive Difficulty
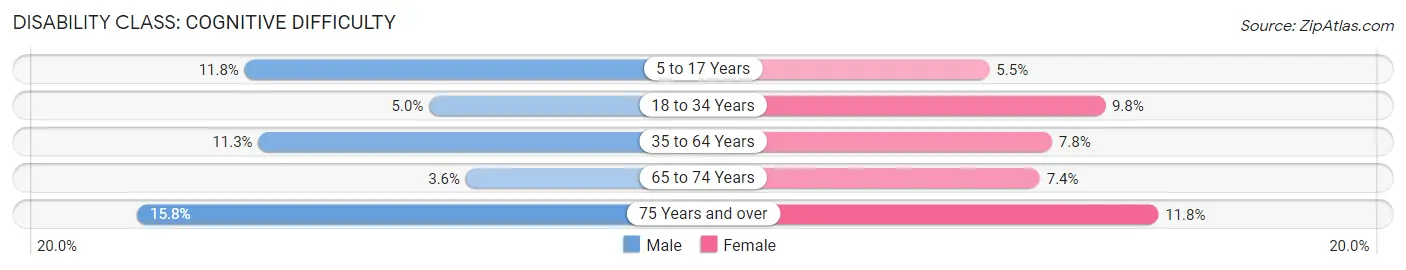
| Age Bracket | Male | Female |
| 5 to 17 Years | 289 (11.8%) | 122 (5.5%) |
| 18 to 34 Years | 230 (5.0%) | 310 (9.8%) |
| 35 to 64 Years | 800 (11.3%) | 586 (7.8%) |
| 65 to 74 Years | 125 (3.6%) | 254 (7.3%) |
| 75 Years and over | 420 (15.8%) | 321 (11.7%) |
Disability Class: Ambulatory Difficulty
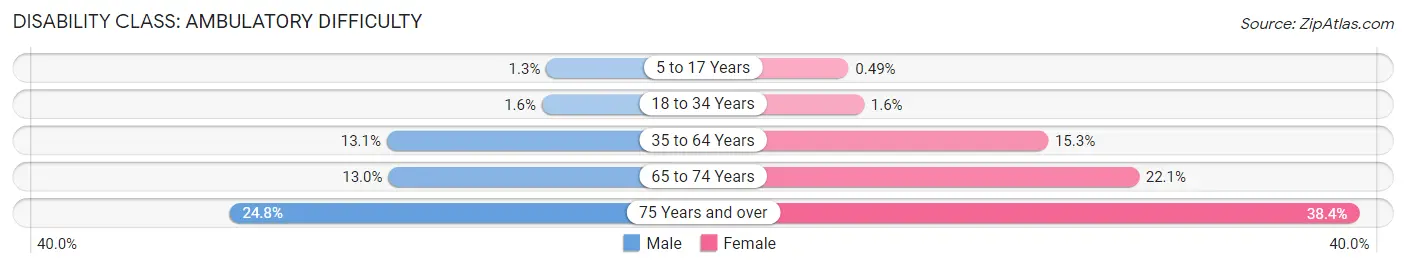
| Age Bracket | Male | Female |
| 5 to 17 Years | 31 (1.3%) | 11 (0.5%) |
| 18 to 34 Years | 74 (1.6%) | 52 (1.6%) |
| 35 to 64 Years | 927 (13.1%) | 1,151 (15.3%) |
| 65 to 74 Years | 449 (13.0%) | 762 (22.1%) |
| 75 Years and over | 658 (24.8%) | 1,049 (38.4%) |
Disability Class: Self-Care Difficulty
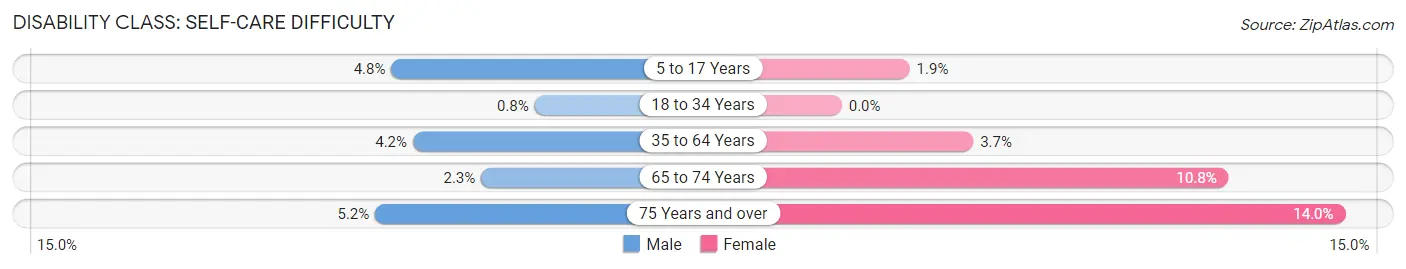
| Age Bracket | Male | Female |
| 5 to 17 Years | 117 (4.8%) | 42 (1.9%) |
| 18 to 34 Years | 37 (0.8%) | 0 (0.0%) |
| 35 to 64 Years | 296 (4.2%) | 275 (3.7%) |
| 65 to 74 Years | 79 (2.3%) | 372 (10.8%) |
| 75 Years and over | 139 (5.2%) | 383 (14.0%) |
Technology Access in Bullhead City
Computing Device Access in Bullhead City
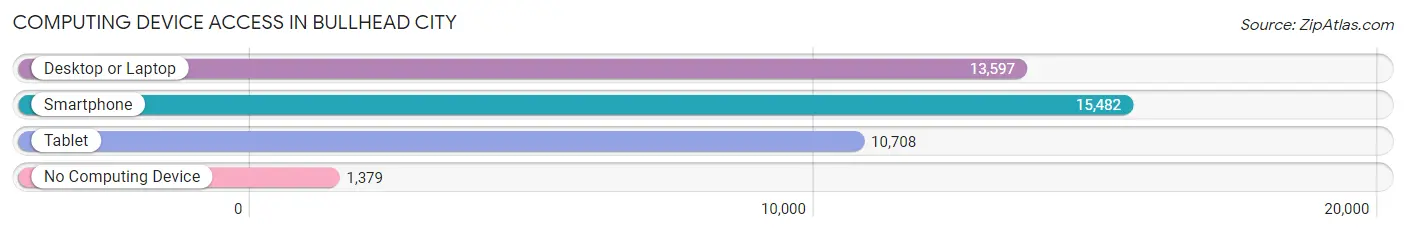
| Device Type | # Households | % Households |
| Desktop or Laptop | 13,597 | 72.4% |
| Smartphone | 15,482 | 82.4% |
| Tablet | 10,708 | 57.0% |
| No Computing Device | 1,379 | 7.3% |
| Total | 18,788 | 100.0% |
Internet Access in Bullhead City
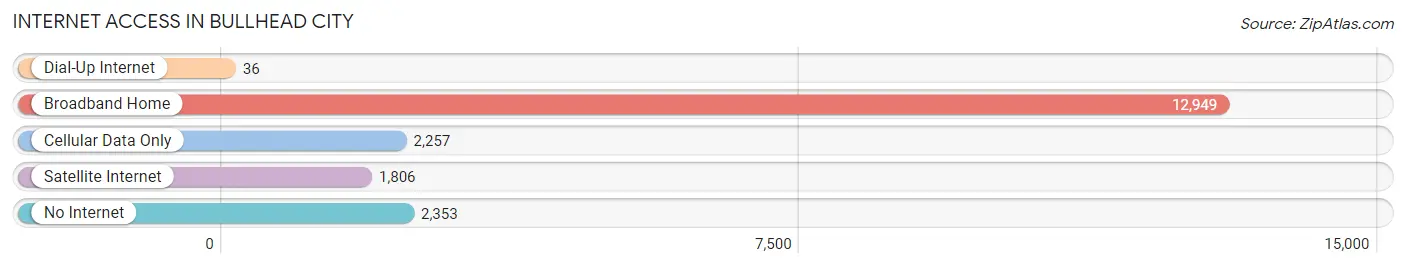
| Internet Type | # Households | % Households |
| Dial-Up Internet | 36 | 0.2% |
| Broadband Home | 12,949 | 68.9% |
| Cellular Data Only | 2,257 | 12.0% |
| Satellite Internet | 1,806 | 9.6% |
| No Internet | 2,353 | 12.5% |
| Total | 18,788 | 100.0% |
Bullhead City Summary
Headed by the Colorado River, Bullhead City is a city located in Mohave County, Arizona. It is situated on the Arizona-Nevada border, across the river from Laughlin, Nevada. The city is located in the lower Colorado River Valley, and is the largest city in the tri-state area of Arizona, Nevada, and California.
History
Bullhead City was founded in 1984, when the Bullhead Dam was built on the Colorado River. The dam was built to provide irrigation water to the surrounding area, and the city was named after the dam. The city was incorporated in 1984, and the population has grown steadily since then.
Geography
Bullhead City is located in the lower Colorado River Valley, and is situated on the Arizona-Nevada border. The city is located on the south bank of the Colorado River, and is bordered by the Black Mountains to the north and the Cerbat Mountains to the south. The city is located in the Mojave Desert, and has a semi-arid climate with hot summers and mild winters.
Economy
Bullhead City’s economy is largely based on tourism, with the city being a popular destination for visitors from both Arizona and Nevada. The city is home to several casinos, as well as a variety of restaurants, shops, and other attractions. The city is also home to a number of manufacturing and industrial businesses, as well as a number of agricultural operations.
Demographics
As of the 2010 census, the population of Bullhead City was 39,540. The racial makeup of the city was 79.2% White, 1.3% African American, 1.2% Native American, 0.7% Asian, 0.1% Pacific Islander, 15.2% from other races, and 2.4% from two or more races. Hispanic or Latino of any race were 28.2% of the population.
Bullhead City is home to a diverse population, with a variety of cultures and backgrounds represented. The city is home to a large number of retirees, as well as a growing number of young professionals. The city is also home to a large number of military personnel, as the city is located near several military bases.
Common Questions
What is the Total Population of Bullhead City?
Total Population of Bullhead City is 41,593.
What is the Total Male Population of Bullhead City?
Total Male Population of Bullhead City is 21,603.
What is the Total Female Population of Bullhead City?
Total Female Population of Bullhead City is 19,990.
What is the Ratio of Males per 100 Females in Bullhead City?
There are 108.07 Males per 100 Females in Bullhead City.
What is the Ratio of Females per 100 Males in Bullhead City?
There are 92.53 Females per 100 Males in Bullhead City.
What is the Median Population Age in Bullhead City?
Median Population Age in Bullhead City is 52.2 Years.
What is the Average Family Size in Bullhead City
Average Family Size in Bullhead City is 2.7 People.
What is the Average Household Size in Bullhead City
Average Household Size in Bullhead City is 2.2 People.
What is Per Capita Income in Bullhead City?
Per Capita income in Bullhead City is $31,654.
What is the Median Family Income in Bullhead City?
Median Family Income in Bullhead City is $55,565.
What is the Median Household income in Bullhead City?
Median Household Income in Bullhead City is $47,129.
What is Income or Wage Gap in Bullhead City?
Income or Wage Gap in Bullhead City is 0.1%.
Women in Bullhead City earn 99.9 cents for every dollar earned by a man.
What is Family Income Deficit in Bullhead City?
Family Income Deficit in Bullhead City is $9,306.
Families that are below poverty line in Bullhead City earn $9,306 less on average than the poverty threshold level.
What is Inequality or Gini Index in Bullhead City?
Inequality or Gini Index in Bullhead City is 0.51.
How Large is the Labor Force in Bullhead City?
There are 17,263 People in the Labor Forcein in Bullhead City.
What is the Percentage of People in the Labor Force in Bullhead City?
48.4% of People are in the Labor Force in Bullhead City.
What is the Unemployment Rate in Bullhead City?
Unemployment Rate in Bullhead City is 10.0%.